


Abstract
Wetlands in semi-arid regions are critical for ecological resilience but are increasingly degraded. Ecological water consumption (EWC), reflecting wetland water demand, is essential for understanding wetland sustainability. This study investigated the spatiotemporal dynamics of marsh wetland EWC in the Bashang Plateau, China, from 1986 to 2021, and identified its main driving forces. A Random Forest model was used to downscale GLASS evapotranspiration (ET) product from 0.05° to a 250 m monthly resolution, showing good agreement with flux measurements (RMSE = 21.94 mm, R2 = 0.83). Marsh wetland EWC was estimated using the downscaled ET and land cover data, and Granger causality analysis was applied to explore driving mechanisms. Results indicate that the marsh wetland area declined by 74% (from 552.81 to 143.69 km2) while forestland expanded by 217%. Correspondingly, marsh wetland EWC decreased by 67.2%, from 125 to 41 million m3. Precipitation and surface water area were identified as direct drivers of marsh wetland EWC decline, whereas groundwater table, forest EWC, and cropland EWC acted as indirect drivers. While cropland water use has been widely reported as an important factor, results suggest that increased forest EWC associated with large-scale afforestation contributed considerably to groundwater table decline, thereby influencing marsh wetland EWC.
1. Introduction
Wetland ecosystems provide critical ecological functions, including carbon sequestration, climate regulation, flood control, biodiversity conservation, and water purification, which confer substantial ecosystem service value [1,2]. Their importance is particularly pronounced in arid and semi-arid regions, where wetlands help mitigate desertification and enhance regional ecosystem resilience [3]. However, wetlands worldwide have undergone severe degradation in recent decades [4]. In China, the total wetland area decreased by 60.9 × 10³ km2 between 1980 and 2015, equivalent to approximately 12% of the 1980 extent, although partial recovery has been observed since 2015 [5]. A major driver of wetland loss is the reduction in water recharge, caused by climate change and intensified human activities [6]. This issue is especially acute in arid and semi-arid regions, where wetland ecosystems are intrinsically fragile and highly vulnerable. Insufficient water supply not only accelerates degradation but also complicates restoration efforts compared to wetlands in humid regions.
Monitoring ecological water consumption (EWC) provides a direct measure of wetland water demand and ecosystem functioning. Understanding its spatiotemporal dynamics helps to assess ecological water requirements, evaluate wetland vulnerability under climate and human pressures, and guide sustainable water allocation. In arid and semi-arid regions, evapotranspiration (ET) accounts for more than 90% of wetland EWC, making ET estimation the primary approach for quantifying water consumption [7].
Remote sensing has become the dominant method for regional ET estimation because it provides consistent observations across large areas and long time spans [8]. Several global and regional ET data products are now available, including GLEAM (0.25°, daily, 1980–2023) [9], MOD16 (500 m, 8-day, 2000–present) [10], GLASS (0.05°, 8-day, 1981–2022), and ET-Monitor (1 km, daily/monthly, 2000–2019) [11]. Among these, the GLASS global ET dataset, which integrates remote sensing observations with meteorological reanalysis data using energy balance methods and semi-empirical models, provides relatively high temporal resolution (5 km/1 km, 8-day) and reliable accuracy [12]. Therefore, it has been widely used in ecosystem change studies. However, marsh wetlands in arid and semi-arid regions are often fragmented and interspersed with other land types. The spatial resolution of the GLASS ET dataset is insufficient to capture the heterogeneity, limiting its suitability for dynamic wetland monitoring. Downscaling is thus required to generate ET data that can better represent wetland spatial patterns and support accurate ecological water consumption estimation.
Recent studies have advanced ET downscaling by combining coarse-resolution ET datasets with high-resolution remote sensing indicators through statistical or machine-learning models. For example, Long and Cui (2022) applied a deep neural network (DNN) to downscale GLEAM ET data to 0.01° resolution in the Heihe River Basin, China [13]. Ke et al. (2016) employed random forest regression with Landsat-derived predictors to downscale MOD16 ET data to 30 m, achieving close agreement with ground observations [14]. Similarly, Tan et al. (2019) used the Jarvis model to refine ET from 1 km to 30 m resolution, yielding high accuracy (R2 = 0.80–0.91) [15]. These approaches demonstrate the feasibility of downscaling to improve ET applicability in heterogeneous landscapes such as marsh wetlands.
Bashang Plateau in Hebei Province lies in the semi-arid agro-pastoral transition zone of North China, serving as a critical ecological buffer and water conservation region for Beijing, China’s capital. Historically, the area had extensive inland lakes and marsh wetlands with high ecological values. However, the region is water-scarce, with per capita water resources well below national averages. In recent decades, Bashang Plateau has experienced major ecological changes, including forest expansion due to the implementation of large-scale afforestation projects [16], and wetland shrinkage and degradation [17]. Previous studies have attributed wetland degradation to accelerated groundwater table decline, which was claimed to be caused by groundwater exploitation for cropland irrigation [18,19]. Although groundwater exploitation control measures have been implemented by reduction and withdrawal of irrigated cropland since 2016, the degradation of wetlands persists [20]. In such arid and semi-arid regions, wetlands often struggle to compete with other land uses for limited water resources, further increasing their vulnerability [21].
This study takes the Bashang Plateau as the study area and investigates the spatiotemporal dynamics of ecological water consumption in marsh wetlands and other land cover types from 1986 to 2021. The objectives are threefold: (1) to clarify the EWC patterns of marsh wetlands and other cover types, (2) to identify the main factors driving changes in marsh wetland EWC, and (3) to provide insights into the degradation mechanisms of Bashang marshes. To achieve this, we first downscaled the GLASS ET dataset to generate high-resolution (monthly, 1986–2021) ET data. Next, we combined the downscaled ET with land cover classification results to estimate EWC for marsh wetlands and other land types and analyzed their spatiotemporal evolution. Finally, we applied Granger causality analysis to identify the drivers of marsh wetland EWC change in the Bashang region.
2. Materials and Methods
2.1. Study Area
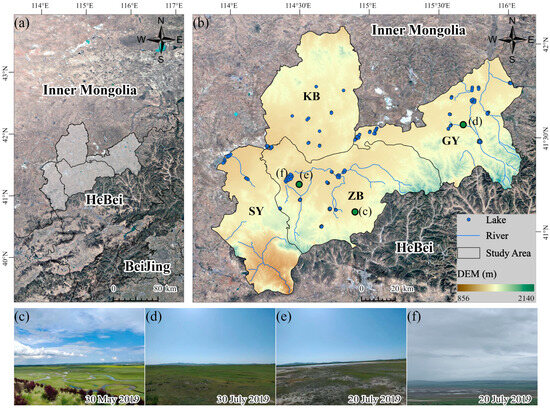
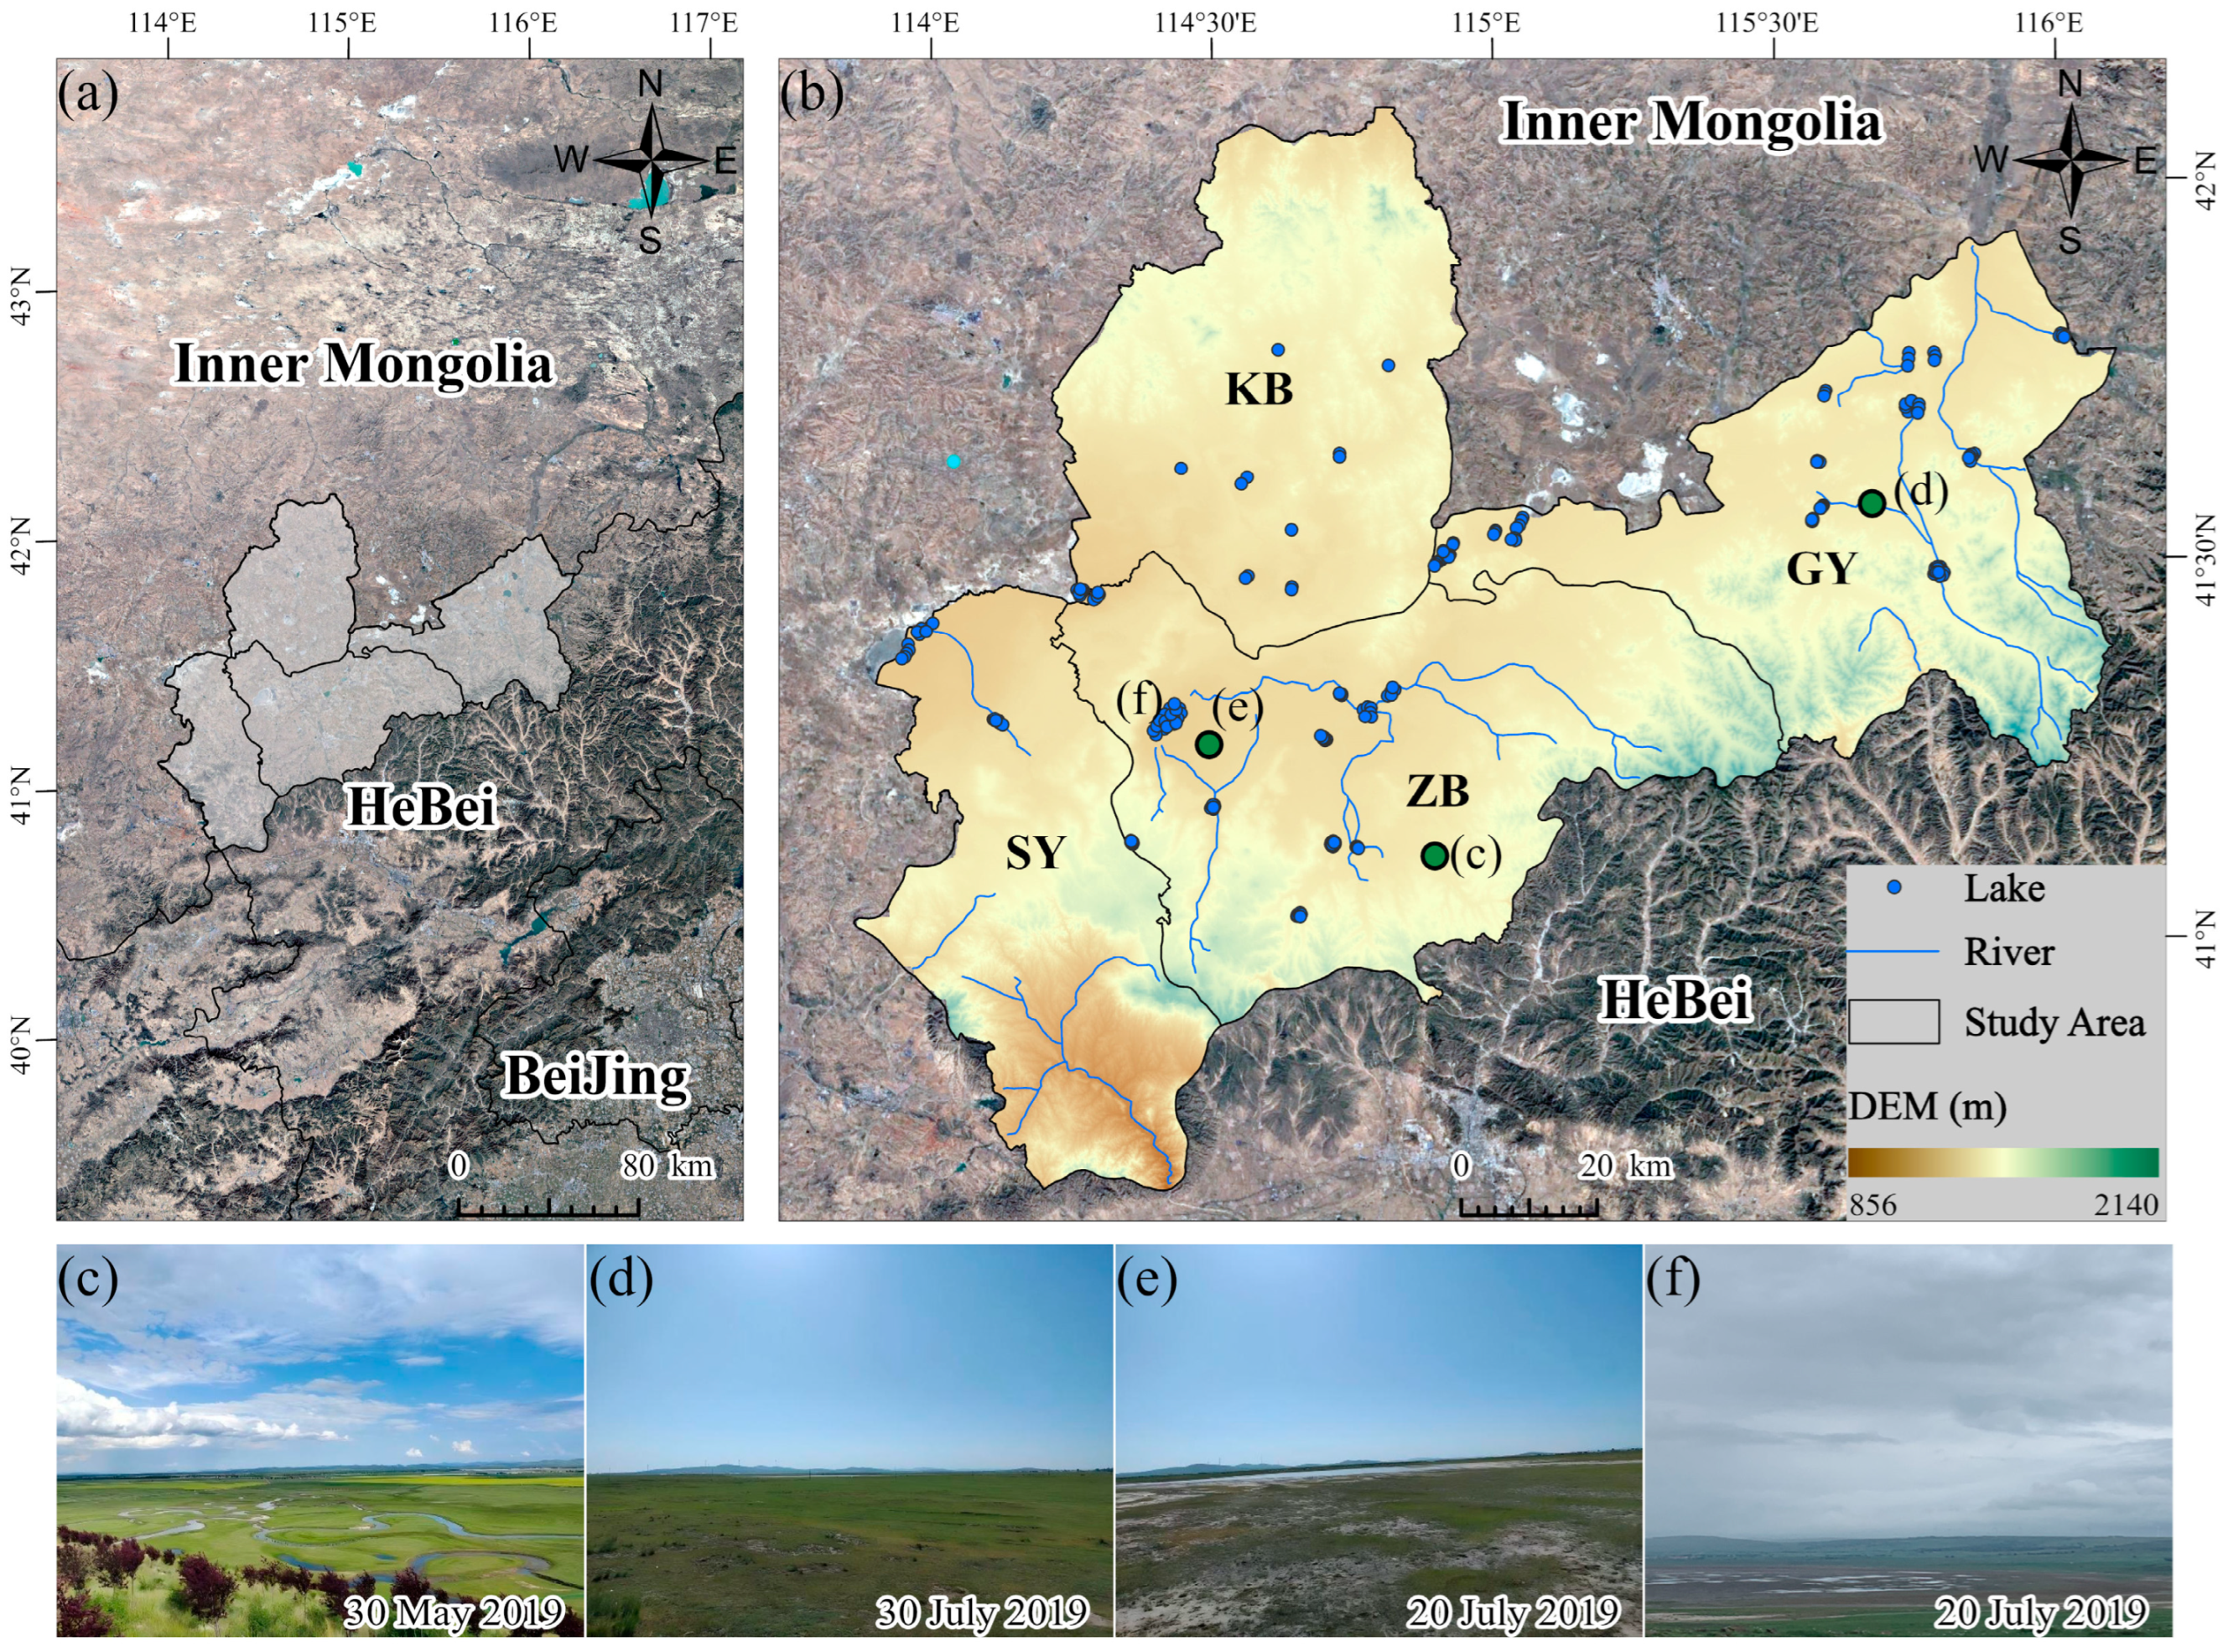
The Bashang Plateau includes Zhangbei County, Kangbao County, Guyuan County, and Shangyi County in Hebei Province (40°43′ N–42°13′ N; 113°47′ E–116°5′ E). As shown in Figure 1, it covers a total area of 13,800 km2, with elevations ranging from 850 m to 2200 m. It experiences a cold-temperate, semi-arid continental monsoon climate. The annual average temperature is around 5 °C, and the annual precipitation is between 340 and 450 mm, with most precipitation occurring in summer. The landscape is diverse, dominated by grasslands and forests interspersed with small wetlands. Owing to its geographical location, the Bashang Plateau plays a vital role in safeguarding the water supply and ecological environment of Beijing [17].
Figure 1.
Location of the study area. (a) The province where the research area is located; (b) The DEM of the study area (ZB: Zhangbei County; KB: Kangbao County; GY: Guyuan County; SY: Shangyi County); (c) Photo of the marsh wetland in the Bashang area; (d) Example showing marsh wetland has degraded into grassland; (e) Example showing marsh wetland has degraded into saline and alkaline land; (f) Photo of the degraded Anguli Lake.
The wetlands in this region are part of a typical plateau wetland system, consisting of river wetlands, lake wetlands, marsh wetlands, and artificial wetlands [22]. Among these, marsh wetlands dominate, accounting for 68.73% of the total wetland area. They provide essential stopover and breeding habitats for endangered waterfowl and serve as important wintering grounds for various avian species. However, over recent decades, these wetlands have undergone severe degradation, leading to significant biodiversity loss [17].
From 1978 to 2000, the “Three-North Shelterbelt System Construction Project” was implemented in the Bashang Plateau, with Populus Simonii and Larix gmelinii as the primary species planted. In parallel, China launched the “Grain for Green Project” in different phases, aiming to convert sloping farmland—characterized by poor soils and severe erosion—into semi-natural habitats dominated by artificial forests [23]. Since 2000, pilot programs of the “Grain for Green Project” have been carried out in Bashang Plateau, resulting in a steady expansion of forestland. Most afforestation activities were conducted on sloping farmland, and the stands were largely monocultures of Populus Simonii. These planted forests exhibit high transpiration rates [24,25], and may consume substantial water resources and potentially alter the regional ecological water cycle. Agriculture and animal husbandry remain the backbone of the regional economy. Since the mid-1990s, vegetable cultivation has rapidly expanded, with celery, Chinese cabbage, cabbage, and potatoes as the dominant crops. Most vegetables are grown on irrigated farmland, heavily reliant on groundwater.
2.2. Datasets and Preprocessing
The evapotranspiration (ET) data used in this study were obtained from the Global Land Surface Satellite (GLASS) Product Download and Service Center (https://glass-product.bnu.edu.cn/). The GLASS ET data product provides ET values (unit: W/m2) at a spatial resolution of 0.05° and 1 km with an 8-day temporal interval, covering the period from 1982 to 2022. It is generated by integrating five conventional latent heat flux algorithms using a Bayesian averaging method, and its accuracy has been validated against global in situ measurements, achieving an R2 of 0.84 and an RMSE of 13.98 W/m2 [26,27]. The dataset has been widely applied in agricultural, hydrological, atmospheric, and climate studies. In this study, we adopted the GLASS ET data from 1986 to 2021 and converted its unit to millimeters (mm). Subsequently, the 8-day resolution ET data from 1986 to 2021 were batch aggregated into monthly ET using Arcpy.
Numerous publicly available land use/land cover (LULC) datasets exist. However, for the Bashang region, inconsistencies in the classification systems among these datasets often result in inaccuracies, which hinder reasonable estimation of EWC. To overcome this limitation, we integrated multiple remote sensing-based LULC datasets, including the China National Land Use and Cover Change Dataset (CNLUCC, the year of 1980, 1990, 1995 and 2000) (http://www.resdc.cn) with overall accuracy (OA) of 91.2% [28], the China Annual Crop Dataset (CACD, annually from 1986–2021) with OA of 94% [29], the China Land Cover Dataset (CLCD, annually from 1986–2020) [30], and a regional dataset specifically developed for the Bashang region (2000–2020) by Zhuo et al. (2022) (OA = 84.29%) using Landsat imagery [16]. Detailed information on the data sources, resolutions, and corresponding references is provided in Table 1.
Table 1.
Data Source and Application.
Constructing a long-term and high-precision LULC dataset is a critical prerequisite for estimating EWC. The CNULCC dataset spanning from 1980 to 2000 was considered as our baseline dataset because it has been widely used and its accuracy in many areas has been proven. Considering that land cover change in the study area was small during 1980–1985, this study adopted the 1980 CNULCC data as the land use/land cover data for 1985. The LULC datasets for 2000 and beyond were derived from the research results of Zhuo et al. (2022) because it was specifically developed for the Bashang region, which provides more accurate wetland distribution than other datasets [16]. After careful examination, we found that CNULCC strongly overestimated the cropland area when compared to the statistical yearbook of each county. In contrast, the CACD provides more accurate cropland distribution and area data, which was more consistent with the local statistical yearbook. The CLCD dataset was thus used to revise the cropland pixels of these two LULC datasets, with the missing pixels after revision filled by the CACD. Therefore, we utilized CACD cropland to replace the original CNLUCC cropland dataset and Zhuo’s data, and the spatial gaps after replacement were then filled with the CLCD dataset. The resultant maps achieved overall accuracies of over 90% with visual interpretation as references [16,28,29,30].
In this study, we adopted the method by Long and Cui (2022) to downscale GLASS ET, which incorporates temperature, surface temperature, soil moisture, wind speed, atmospheric pressure, dew point temperature, and surface net radiation as independent variables for ET downscaling [13]. These variables were obtained from the ERA5-LAND dataset (accessible via Google Earth Engine, GEE) and aggregated to a monthly average scale. Additionally, Normalized Difference Vegetation Index (NDVI) data and surface elevation data were integrated as independent variables in the ET downscaling process. The NDVI dataset adopted in this study comes from the 250 m spatial resolution NDVI data for the period 1986–2021, generated by Ma et al. (2022) through fusing the fine spatial details of Moderate-resolution Imaging Spectroradiometer (MODIS) data and the long-term temporal continuity of Advanced Very High Resolution Radiometer (AVHRR) data [31]. Digital Elevation Model (DEM) data was acquired from Shuttle Radar Topography Mission (SRTM) data at a 30 m spatial resolution [32]. Slope and aspect were derived from the DEM using ArcGIS 10.8 software. In addition, we collected in situ ET measurements at the Duolun site (42.0467° N, 116.2836° E) from the FLUXNET 2015 dataset [33] in order to validate the GLASS ET and the downscaled ET. The FLUXNET 2015 dataset is a comprehensive, standardized, and quality-controlled collection of eddy covariance flux measurements from over 200 sites around the world. At Duolun site, the latent heat flux (ET) measurements were provided every 15 min spanning from 2006 to 2015.
To identify the factors influencing marsh wetland EWC, data of yearly mean temperature, yearly precipitation, surface water area, and groundwater depth were collected. The yearly mean temperature and precipitation data were sourced from the ERA5-LAND dataset. The surface water area data were obtained from the JRC Global Surface Water (GSW) Interannual History Dataset, which maps the monthly surface water from 1984 to 2021 at a 30 m spatial resolution. Groundwater depth data were extracted from Zhao et al. (2020) on the Bashang area, covering the period 1986–2021 [34].
2.3. Methods
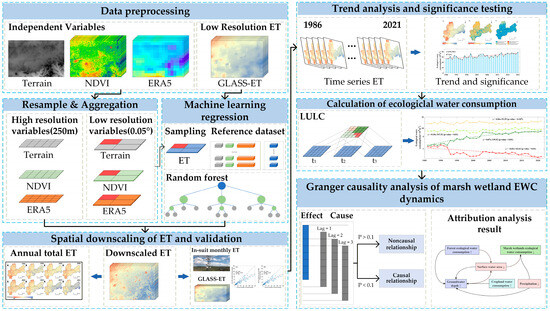
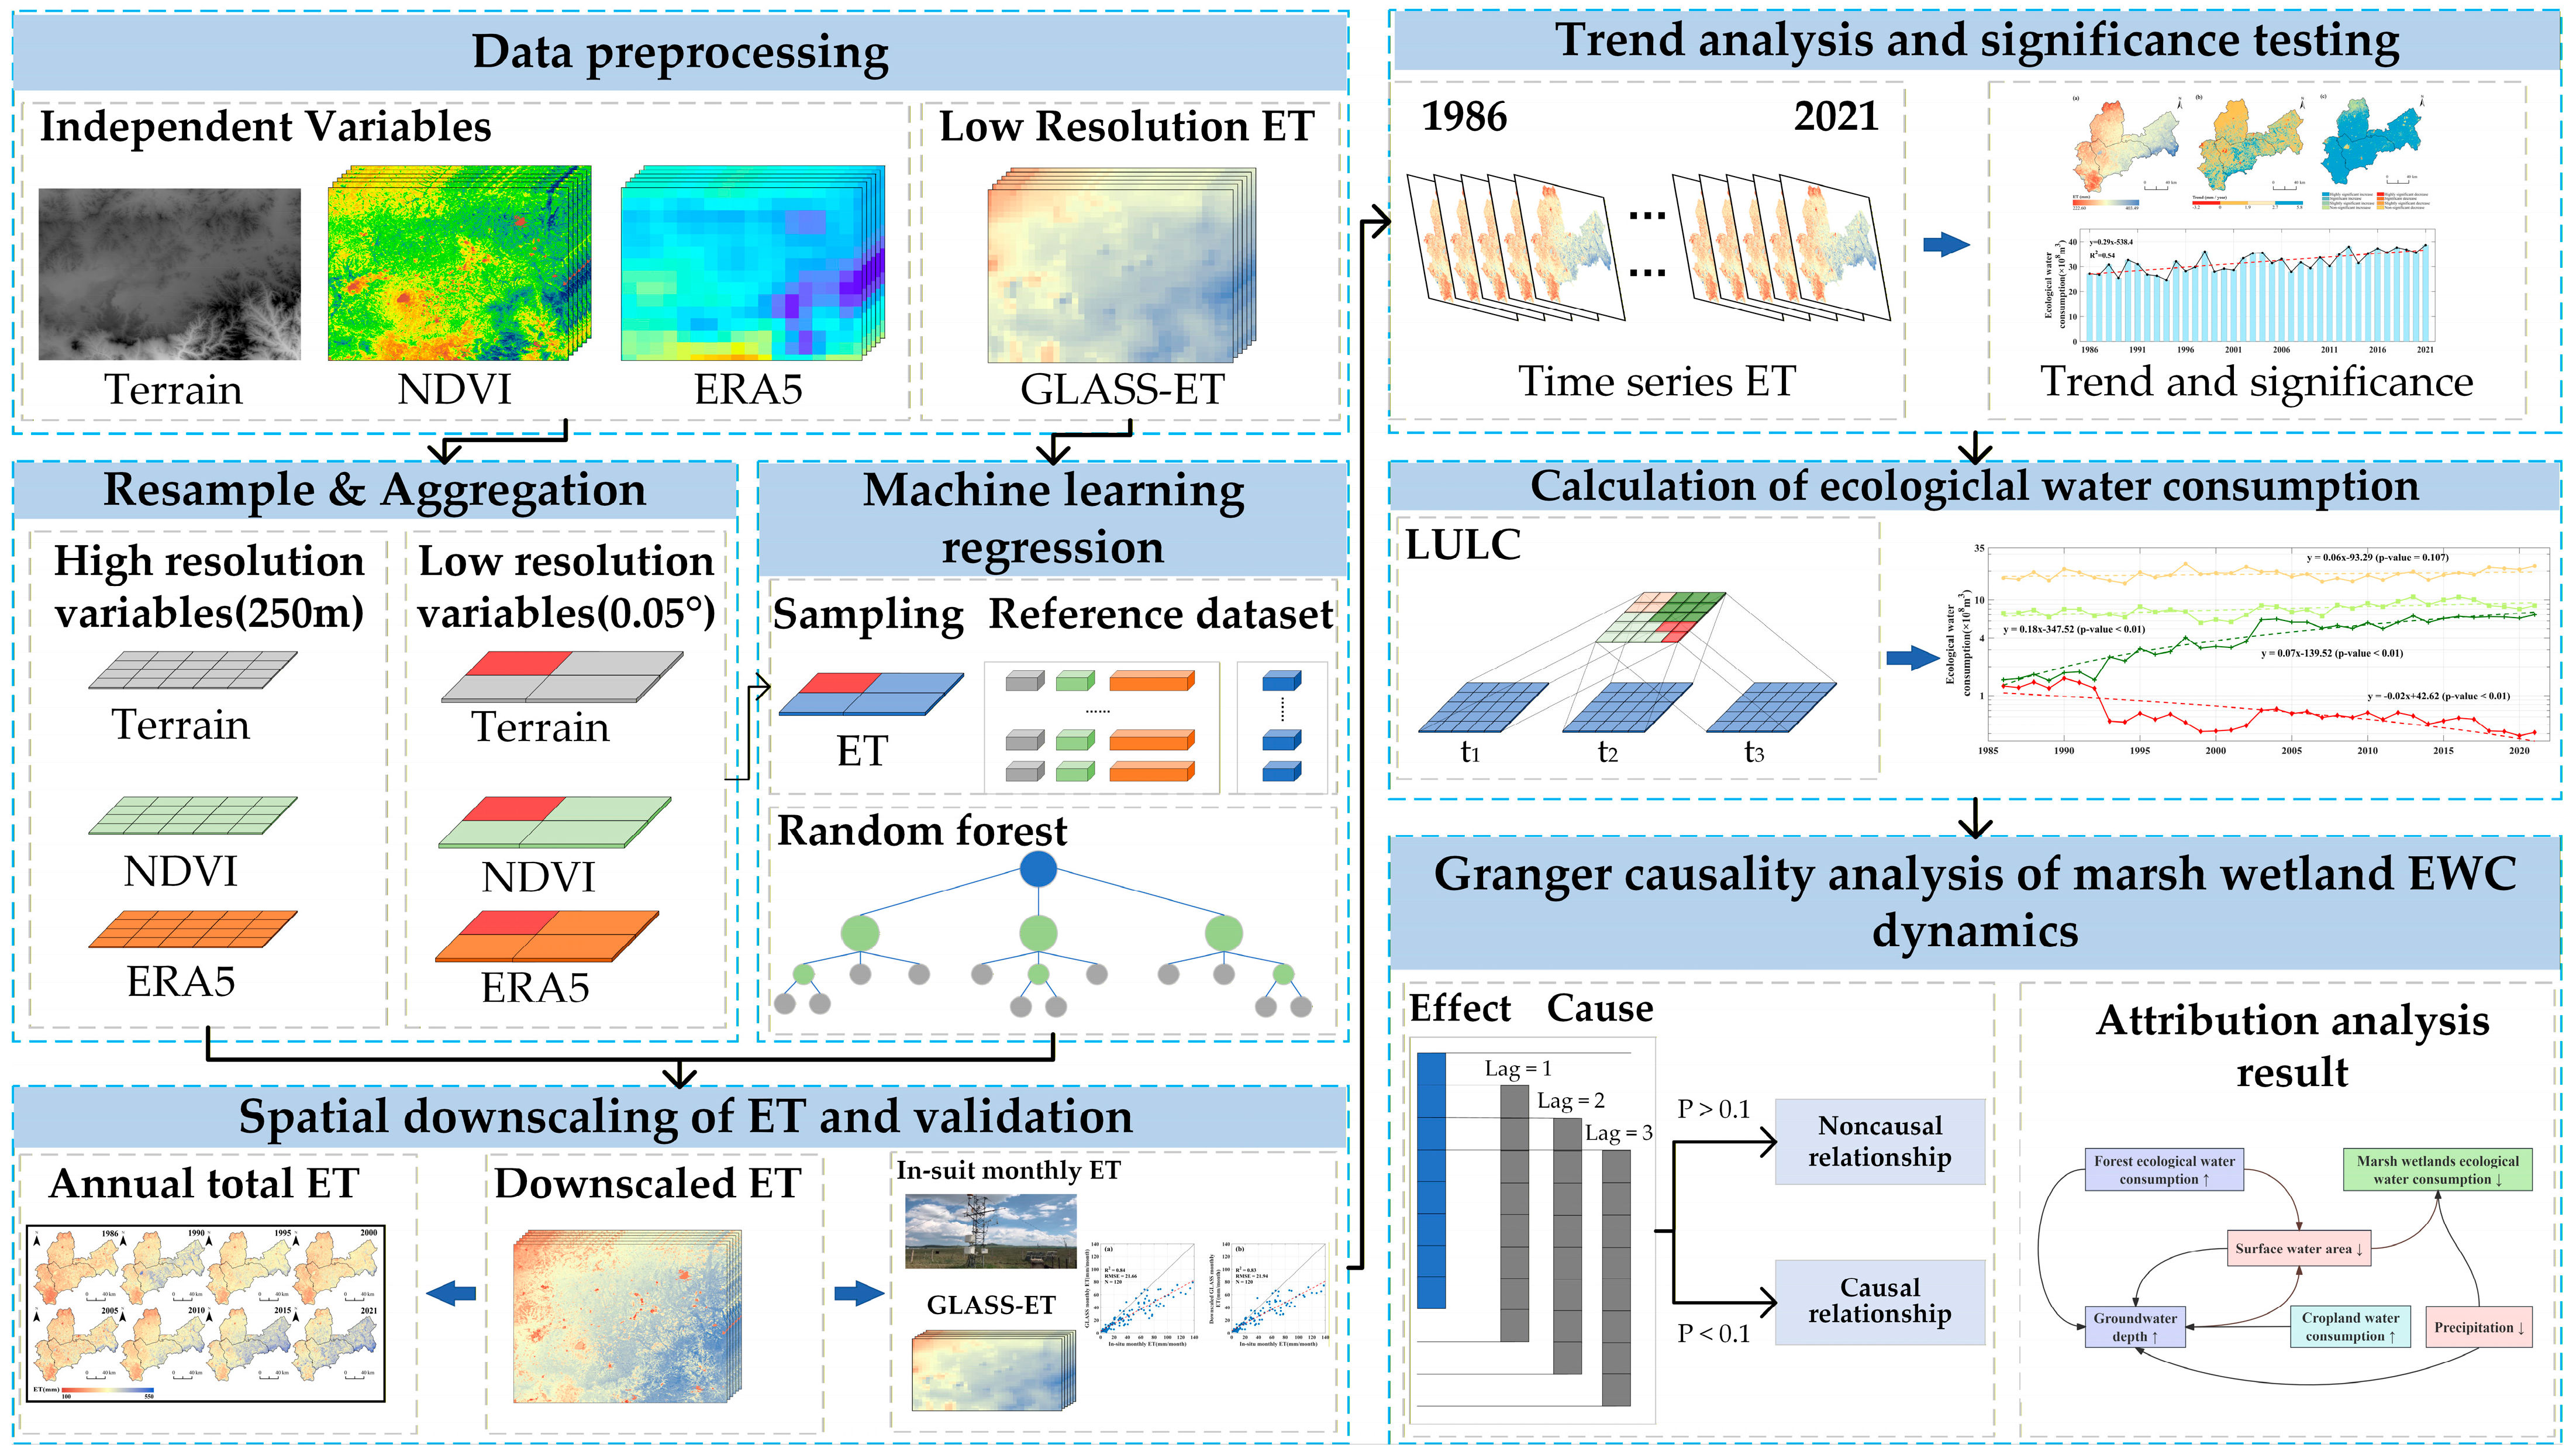
Figure 2 illustrates the workflow of this study. First, the Random Forest model was used to spatially downscale coarse-resolution ET data, generating an ET dataset that is better suited to the fragmented distribution of wetlands. Second, Theil–Sen Median trend analysis and Mann–Kendall test were applied to systematically reveal the long-term evolution patterns and spatial differences in ET. Third, EWC was calculated based on ET and LULC data, with EWC characteristics and differences among different land cover types (e.g., marsh wetlands, cropland, forest, and grassland) quantified, clarifying the structural pattern of regional water resource consumption. Finally, Granger causality analysis was employed to identify the causal relationships and lag effects between various factors and changes in marsh wetland EWC, ultimately determining the core driving factors.
Figure 2.
Flowchart of this paper: Date preprocessing; Spatial downscaling of ET and validation; Tread analysis and significance testing; Calculation of ecological water consumption; Granger causality analysis of marsh wetland EWC dynamics.
2.3.1. Spatial Downscaling of ET and Validation
This study adopted the method proposed by Chen et al. (2019) to perform spatial downscaling of the low-resolution GLASS ET dataset using a random forest model, thereby generating monthly ET data at a 250 m resolution [35]. The random forest algorithm is an ensemble learning method composed of multiple decision trees and has been widely applied in both classification and regression tasks [36]. In this study, meteorological variables, the NDVI, DEM, slope, and aspect were used as predictor variables, while ET served as the response variable.
The workflow for downscaling GLASS ET based on the random forest model is illustrated in Figure 2. First, for predictor variables such as DEM, slope, and aspect, which have a higher resolution than the GLASS ET data, their resolution was reduced to 250 m through aggregation. For predictor variables with a resolution lower than that of GLASS ET, such as precipitation, air temperature, land surface temperature, wind speed, soil moisture, and dew point temperature, their resolution was downscaled to 250 m using bilinear interpolation, resulting in a complete set of predictor variables at 250 m resolution. Second, all 250 m resolution predictor variables were aggregated to a resolution of 0.05° to match that of the GLASS ET dataset. The bilinear interpolation and resolution aggregation operations were batch implemented using the ArcGIS Python package in ArcGIS 10.8. Subsequently, the 0.05° resolution predictor variables and GLASS ET data were input into the random forest model for machine learning training on a monthly basis, with 70% of the pixels used for model training and the remaining 30% for model validation. The machine learning downscaling modeling was conducted based on Python: the low-resolution evapotranspiration data and all predictor variables were converted into digital matrices, and then the Random Forest downscaling model was constructed using the “scikit-learn” package. The trained month-specific models were then applied to the 250 m resolution predictor datasets to generate downscaled monthly ET products.
Both GLASS ET and the downscaled ET were then evaluated by the in situ ET measurements at Duolun site. The 15 min in situ ET measurements were first aggregated to monthly ET, and then compared with the GLASS ET and the downscaled ET. The root mean square error (RMSE) and the coefficient of determination (R2) were calculated. In addition, the 250 m ET were aggregated to a 0.05° and compared with the original GLASS ET data at pixel scale on a monthly basis in order to evaluate the spatial agreement of the downscaled ET with the GLASS ET. The mean absolute percentage error (MAPE) and R2 of the monthly ET from 1986 to 2021 were calculated.
2.3.2. Trend Analysis and Significance Test
The Theil–Sen Median method and Mann–Kendall test were used to perform the trend analysis for ET. The Theil–Sen Median method, also known as the Sen’s slope estimator, is a non-parametric statistical approach used to identify trends in time series data. By calculating the median slope of all pairwise linear trends, this method effectively mitigates the influence of outliers and is particularly suitable for analyzing long-term changes in time series [37]. The formula for Sen’s slope is expressed as:
where i and j represent the annual time series (1986 ≤ i ≤ j ≤ 2021), and and denote the total ET in the i-th and j-th years, respectively. A positive value of β indicates an increasing trend in ET, while a negative value indicates a decreasing trend.
The Mann–Kendall test is a widely used non-parametric method for detecting trends in time series. It employs a two-tailed test and determines the statistical significance of the trend based on the Z-statistic, which follows a standard normal distribution. At a given significance level α, if |Z| > Z1−α/2, the trend is considered statistically significant; otherwise, it is deemed insignificant. Here, Z1−α/2 is the critical value obtained from the standard normal distribution table for a confidence level of α. In this study, α is set to 0.05. Based on the standard normal distribution, Z values greater than 1.65, 1.96, and 2.58 indicate that the trend is significant at the 90%, 95%, and 99% confidence levels, respectively. Accordingly, an upward trend of ET is classified as slightly significant, significant, or highly significant, while a downward trend is classified as slightly significant, significant, or highly significant decrease [38].
2.3.3. Calculation of Ecological Water Consumption
In arid and semi-arid regions, plant transpiration accounts for more than 90% of total EWC. In this study, EWC was estimated using the evapotranspiration method, expressed as [39]:
where W denotes the total EWC of the region (m3), is the area of land use category i (m2), and is the average ET (mm) corresponding to the land use category i. To ensure consistency, land cover and land use area corresponding to the same time period, or to the closest available time to the ET data, were used to calculate EWC.
2.3.4. Granger Causality Analysis of Marsh Wetland EWC Dynamics
In this study, we first used Pearson correlation coefficient to assess the correlation between EWC and each influencing factor, specifically including the surface water area, groundwater depth, precipitation, temperature, as well as EWC of cropland, forestland, grassland, and marsh wetland. Among these, surface water area reflects the availability of wetland water sources, while groundwater depth serves as a key indicator to measure the sufficiency of water sources in lakes and swamp wetlands in arid regions. Changes in the EWC of croplands, forests, and grasslands capture their competition with marsh wetlands for water resources, whereas temperature and precipitation represent climatic influences.
Given that the EWC may respond to climate variability and human activities with a time lag, Granger causality analysis was applied to investigate the driving mechanism of EWC changes in marsh wetlands. The Granger causality test evaluates whether one time series can predict another by regressing the current value of Y (i.e., EWC of marsh wetlands) on its own lagged terms as well as on lagged terms of X (i.e., influencing factors). If the inclusion of lagged X terms significantly improves model performance, X is considered the Granger cause of [38]. The general model is expressed as:
where is constant, and are regression coefficients, u is the maximum lag order of variables X and Y, and is the residual term. The null hypothesis = 0 (v = 1, 2, …, u) implies that X is not the Granger cause of Y. Rejection of the null indicates a causal effect. To simplify computation, all variables were assumed to be stationary. A 90% confidence level was adopted, rejecting the null when [40,41], Granger causality analysis was conducted based on the statsmodels package in the Python environment.
3. Results
3.1. Spatiotemporal Dynamics of Land Cover
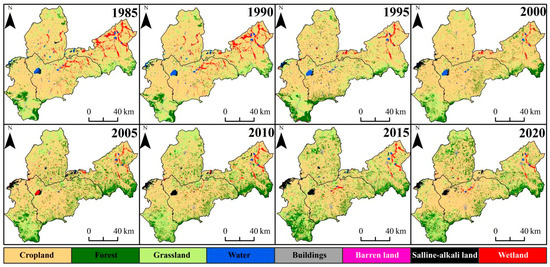
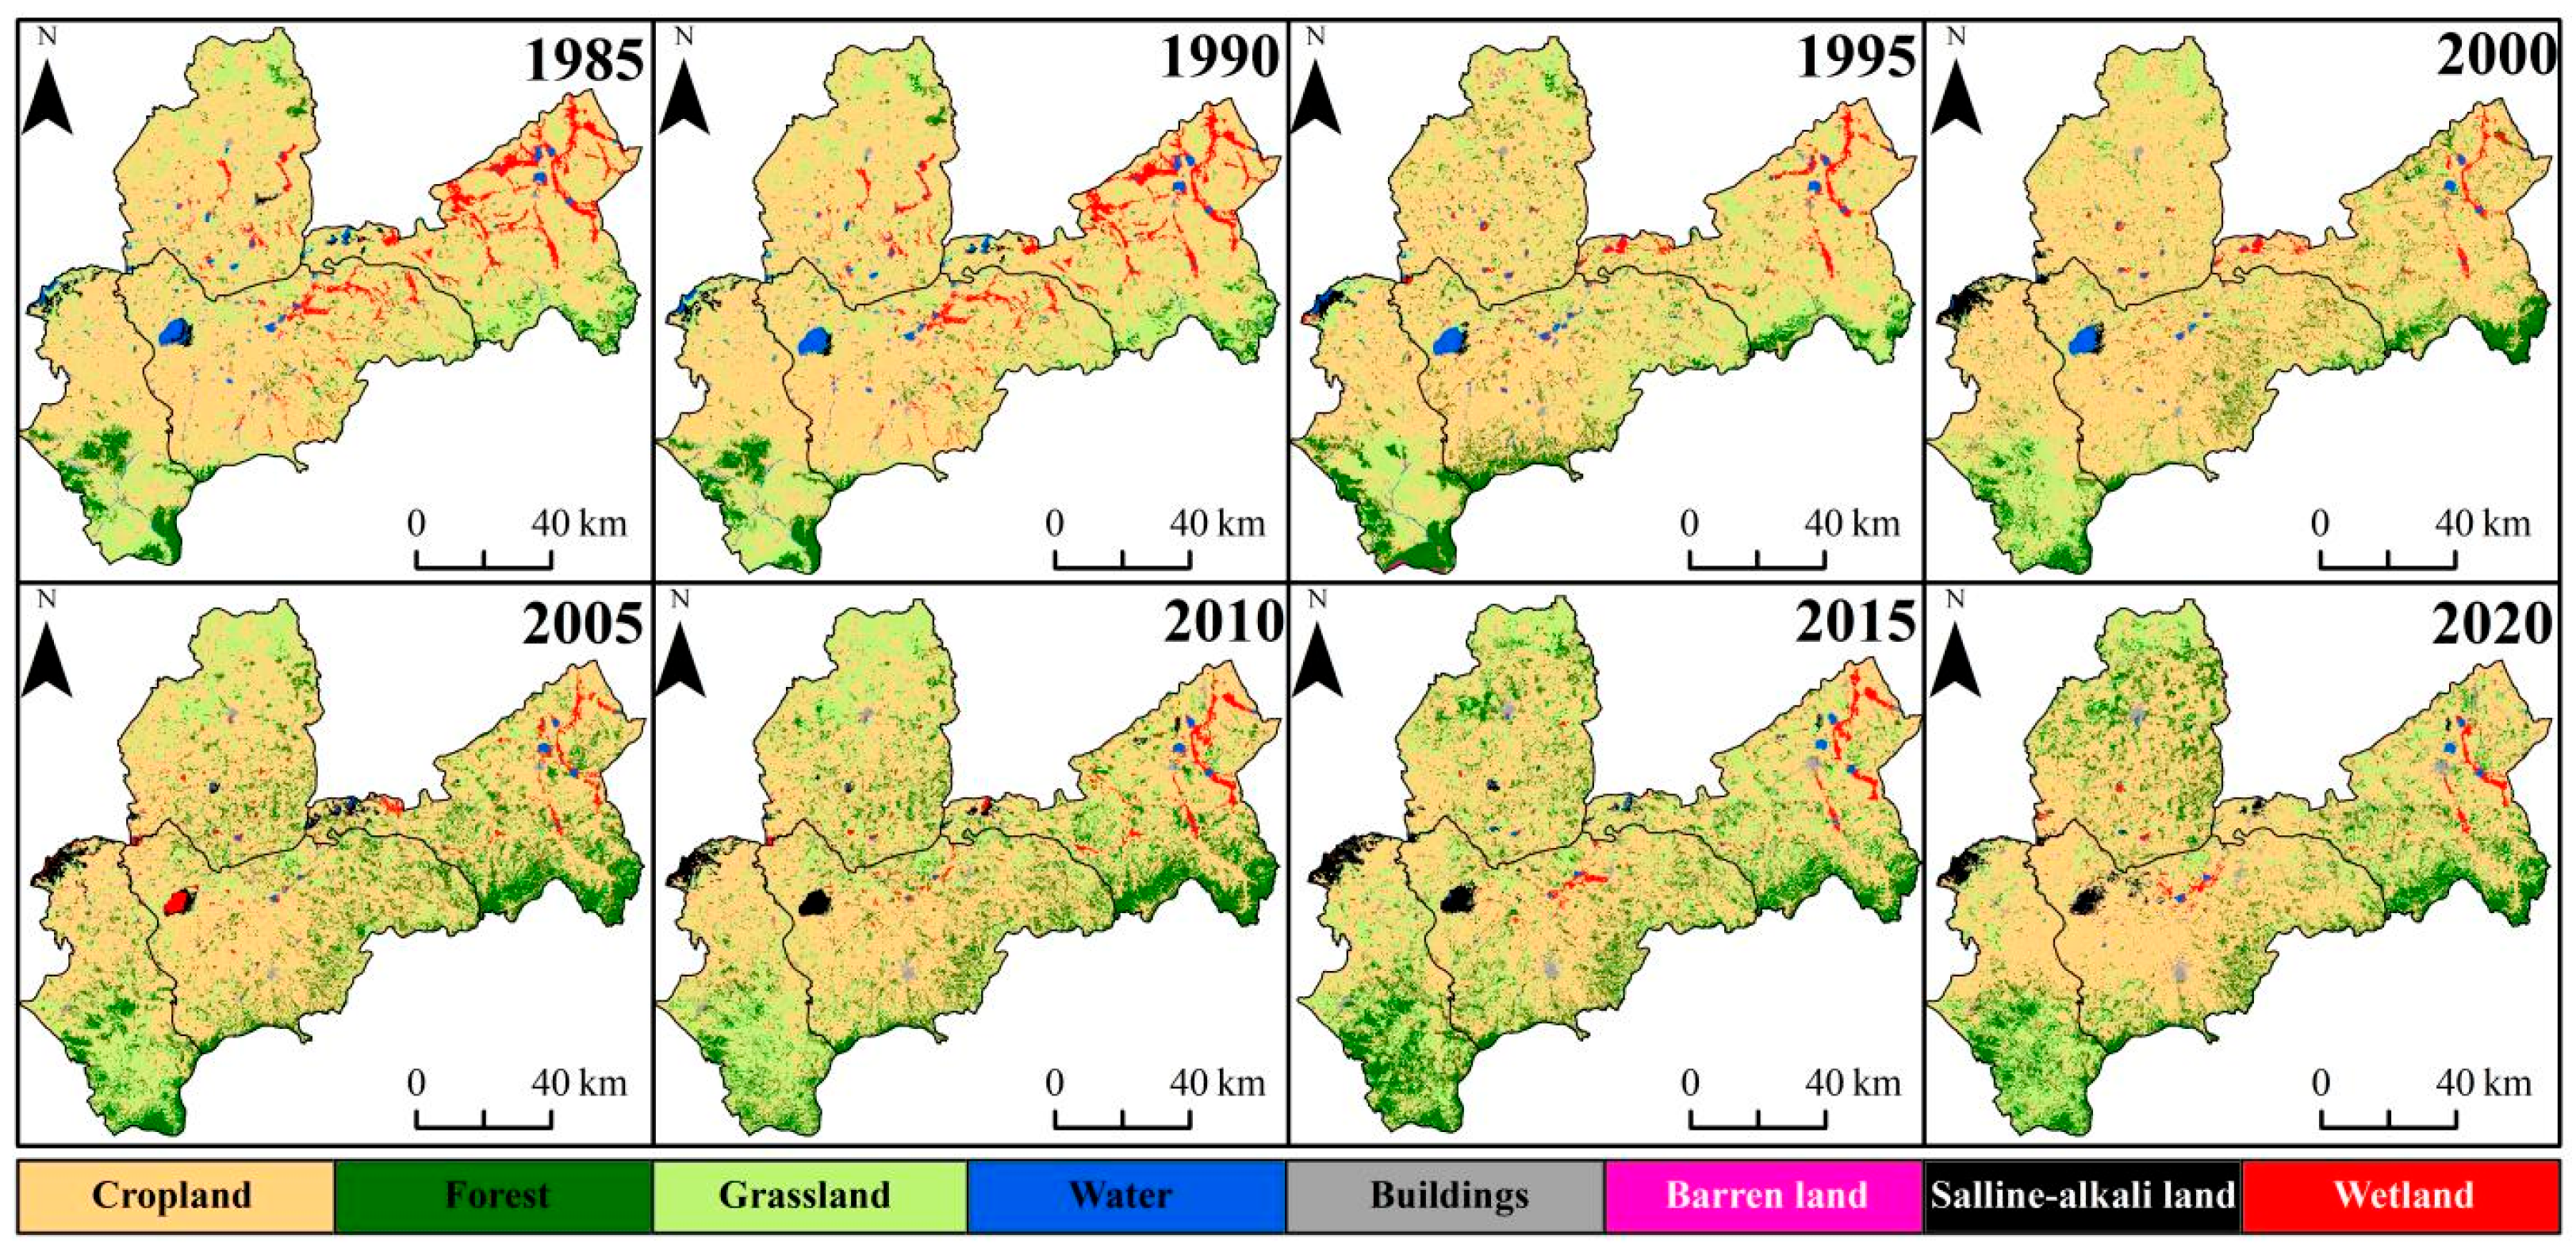
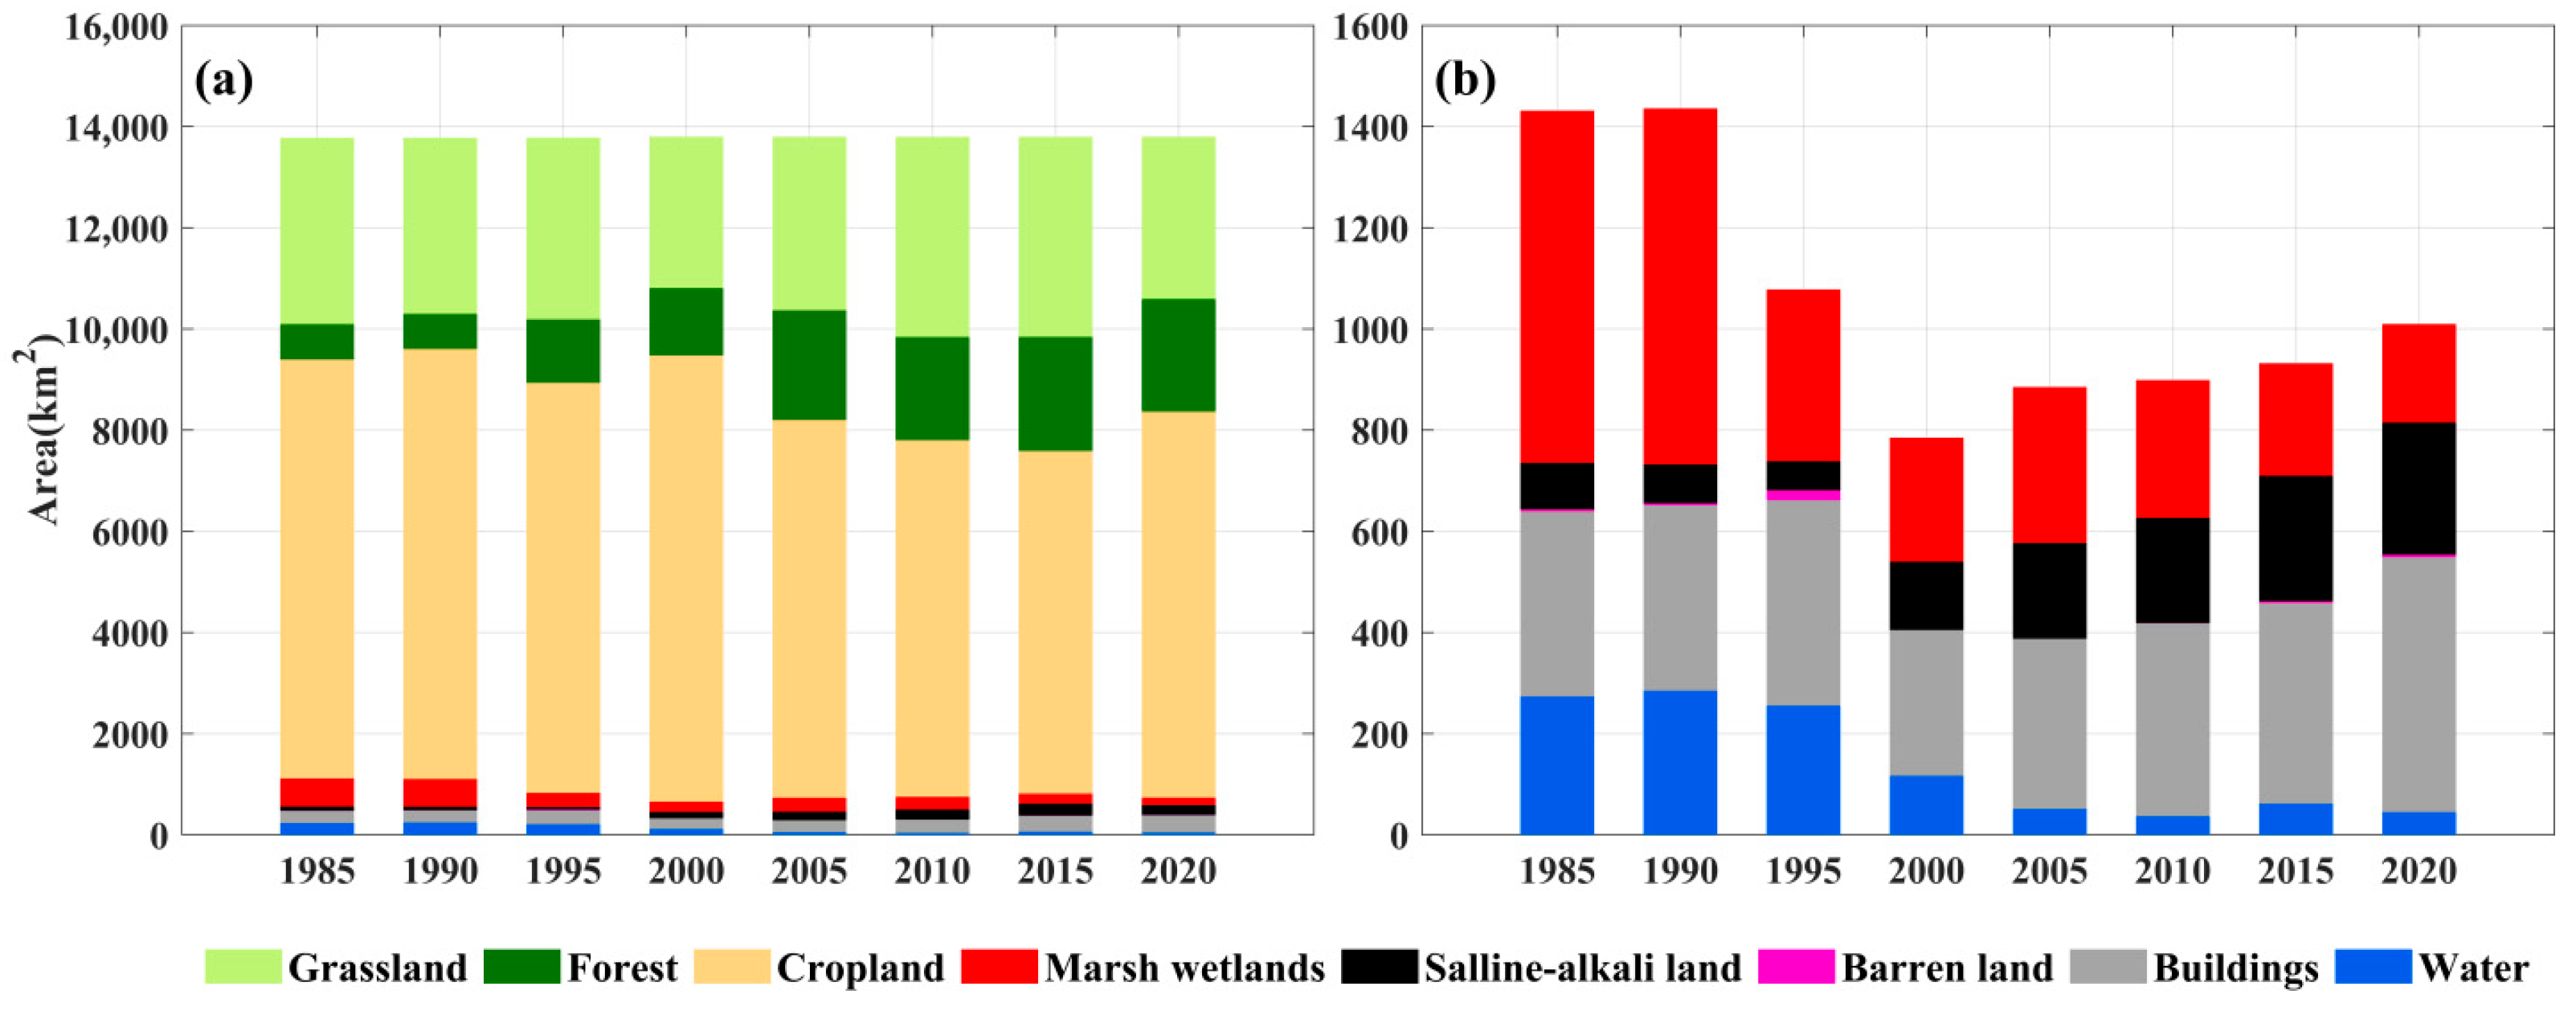
Figure 3 and Figure 4 illustrate the spatial distribution and areal changes in major land cover types in the Bashang area from 1986 to 2020. Croplands, grasslands, and forests together accounted for about 90% of the total land area, with cropland being the dominant type before 2000. Croplands were concentrated in the flat central, northern, and northeastern regions, particularly in the central area. From 1985 to 2020, the cropland area decreased steadily from 8277.44 km2 to 7627.94 km2 (a reduction of 7.84%), while spatially, croplands in the central region were gradually converted to grasslands and forests, resulting in increased fragmentation.
Figure 3.
Land cover maps in Bashang area from 1985–2020.
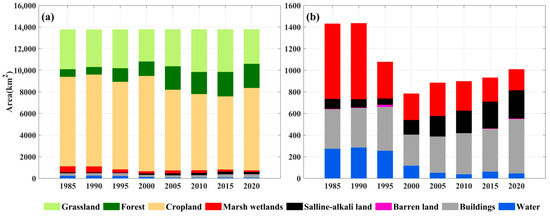
Figure 4.
Area of each land cover type; (a) area of all land cover types; (b) area of marsh wetlands, saline-alkali land, barren land, water and buildings.
Forests displayed the most significant expansion during the study period, increasing from 701.13 km2 in 1985 to 2229.56 km2 in 2020, a growth of 217%. In 1985, forests were mainly concentrated in Shangyi County, accounting for nearly half (47.82%) of the total forest area. By 1995, contiguous forest areas had formed in the southern mountainous region, with scattered patches emerging in the central and northern regions. After 1995, forests in the eastern mountainous region expanded northwestward and southwestward, becoming more concentrated. By 2020, Kangbao County had become the largest forested area (581.94 km2), and large contiguous forest zones had emerged in previously sparsely wooded central and northern areas. Grasslands were mainly distributed in the northern and southern plains and the eastern mountainous region, with only scattered patches in the central area. Their total area remained relatively stable throughout the study period, averaging about 3538.43 km2. Since 2000, new grasslands have also developed around the central lakes.
In 1985, marsh wetlands covered 552.81 km2, primarily in Zhangbei and Guyuan counties. They were typically distributed as fragmented patches interspersed with croplands and grasslands, often near rivers and lakes. Between 1990 and 1995, marsh wetlands experienced rapid shrinkage, with many continuous patches in the central and northern regions converted to croplands and grasslands, leaving only a concentration in the northeast. From 1995 to 2005, declining lake levels caused parts of central and northeastern lakes to transform into marsh wetlands, exemplified by Anguli Lake (Figure 1f), which shifted from a lake in 2000 to marsh wetlands by 2005. However, after 2005, marsh wetlands declined steadily, with only isolated patches remaining in central and northeastern Bashang by 2020. Overall, the total area of marsh wetlands decreased by 74% to 143.69 km2, accompanied by a 114.31 km2 increase in saline-alkali land.
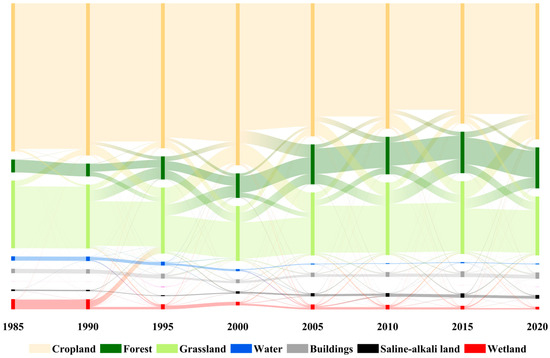
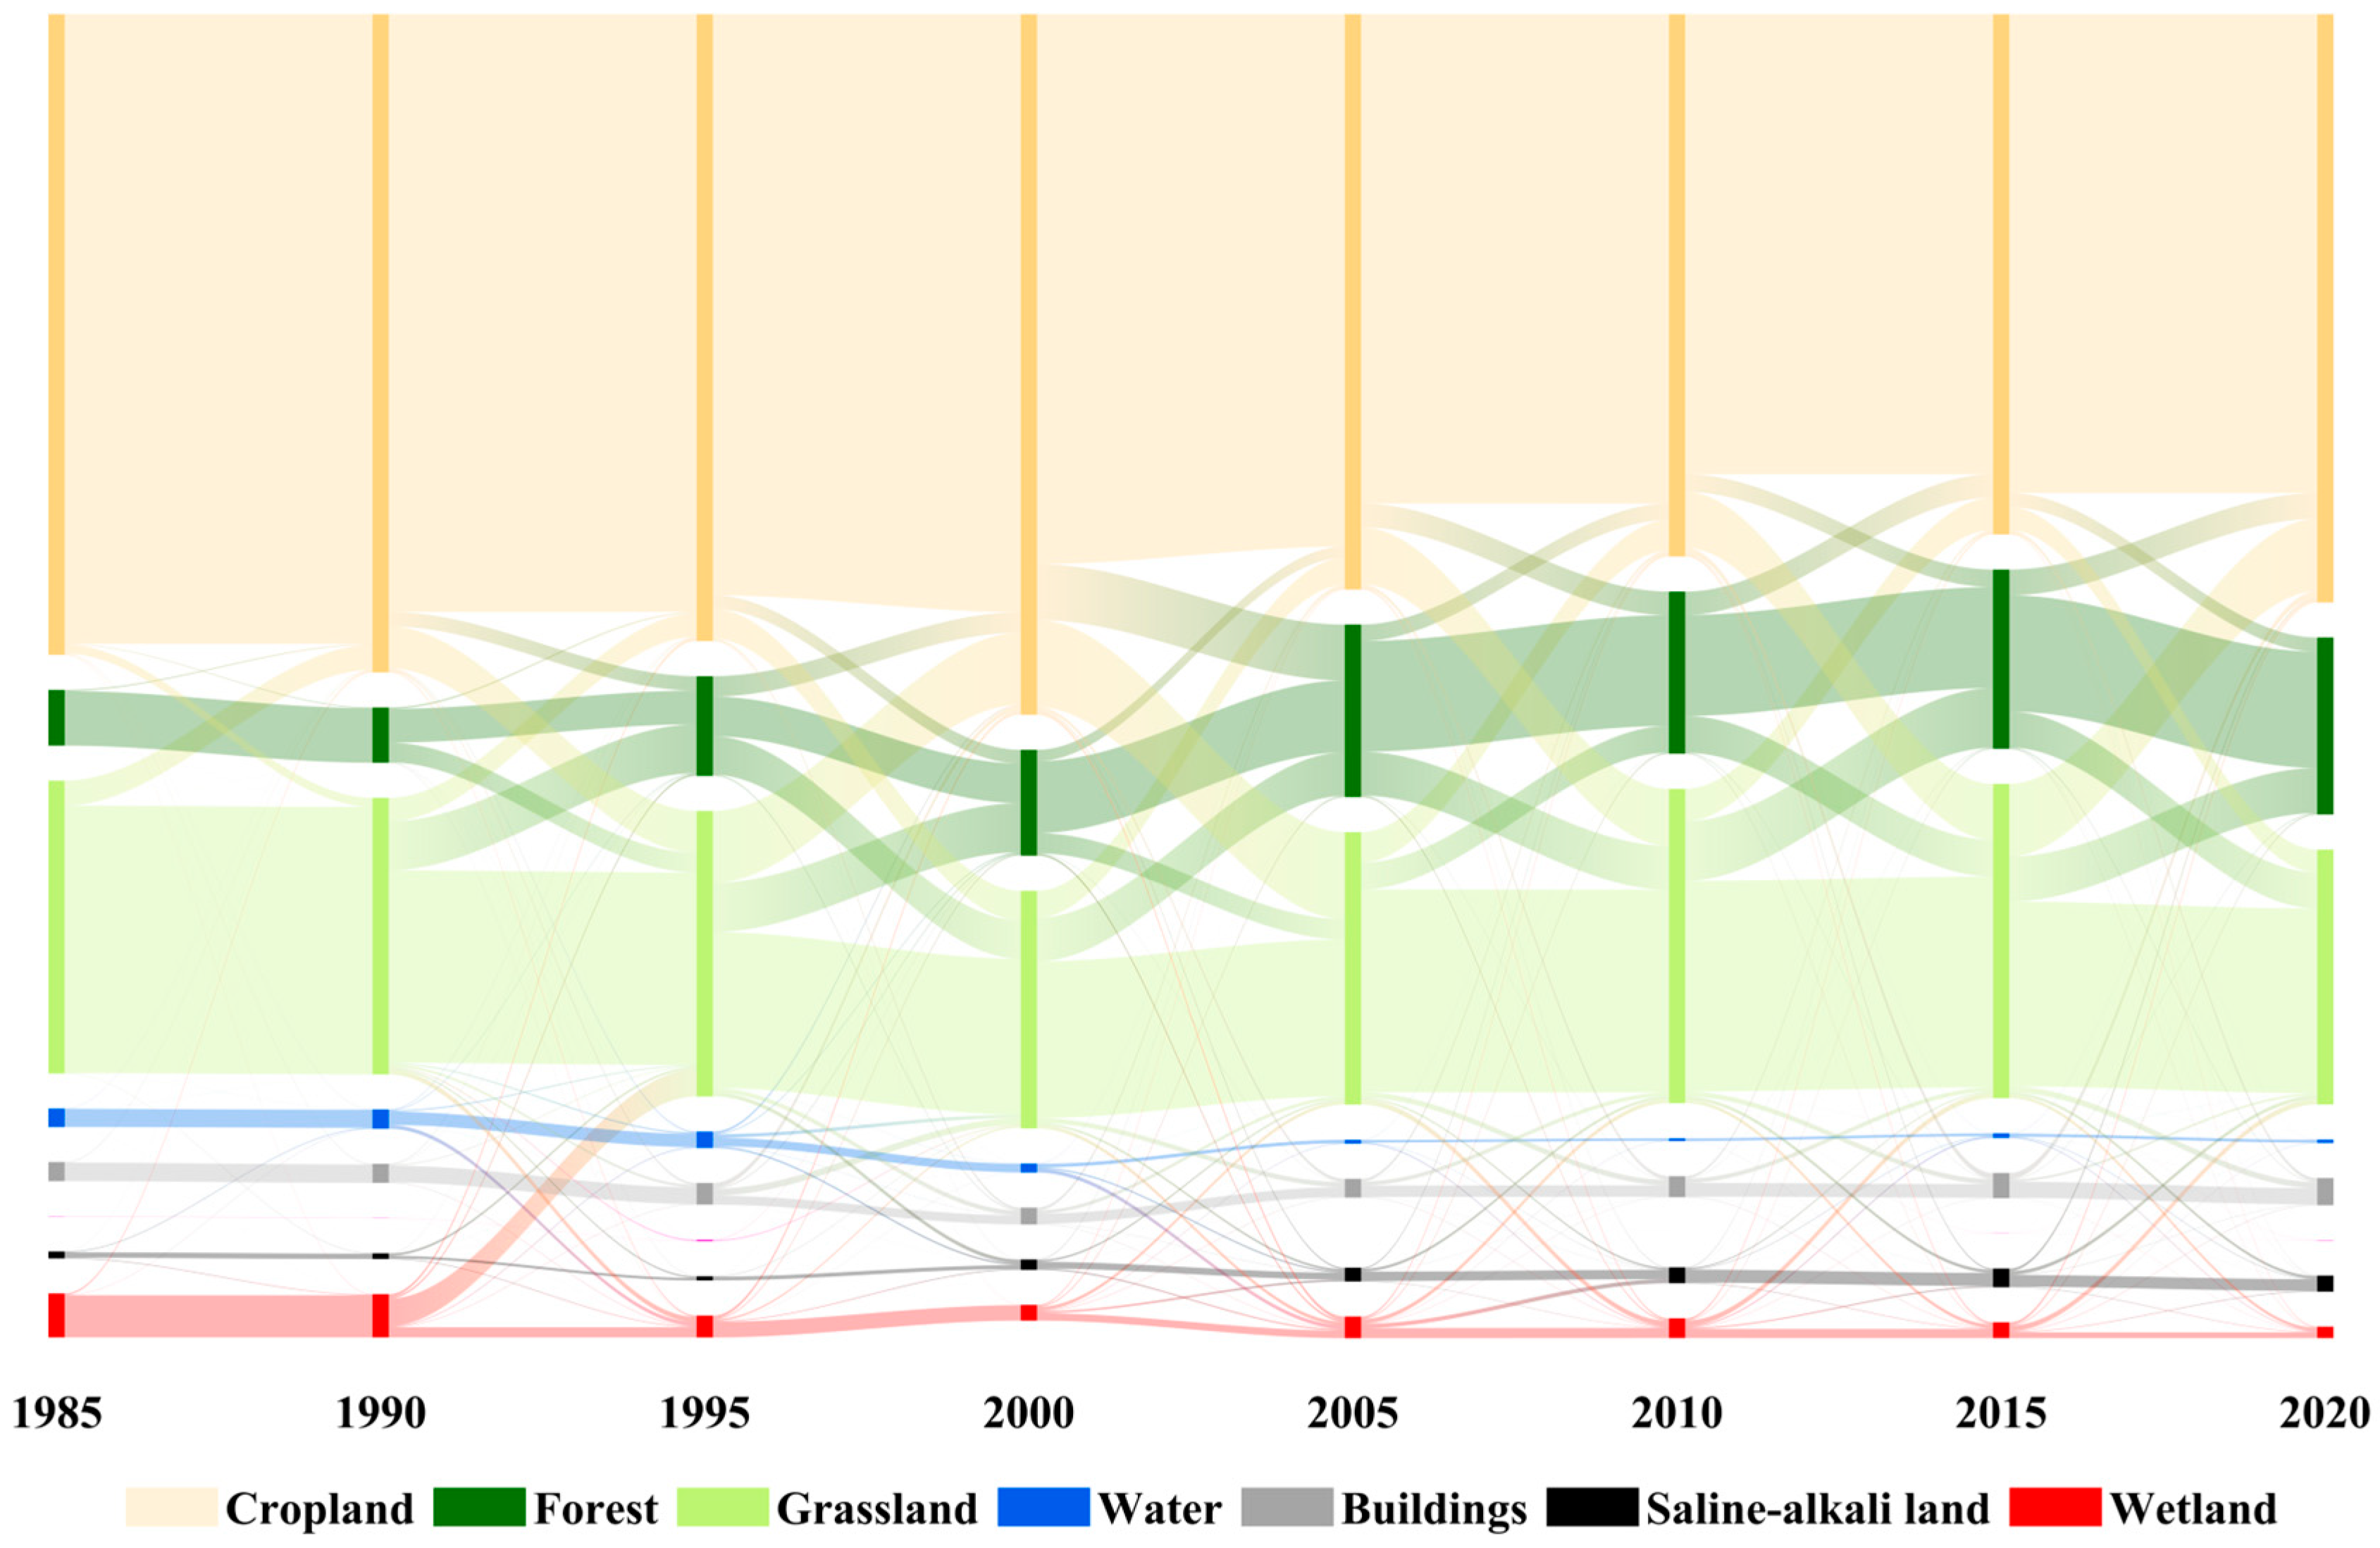
Figure 5 shows the interconversion among land cover types from 1985 to 2020. Between 1985 and 2000, 226.06 km2 of marsh wetlands were converted to grasslands (50% of the total wetland loss), 150.81 km2 to croplands, and 87.31 km2 to forests. Between 2000 and 2020, wetland loss slowed, while forest expansion accelerated, largely at the expense of croplands and grasslands. During this period, lake water bodies also shrank, with 48 km2 converted to saline-alkali lands and 11.38 km2 to marsh wetlands. Meanwhile, 59.44 km2 of marsh wetlands were degraded into grasslands, 26.31 km2 into saline-alkali land, and smaller portions into croplands and forests.
Figure 5.
The interconversion among various land cover types from 1985 to 2020.
3.2. Spatiotemporal Dynamics of ET
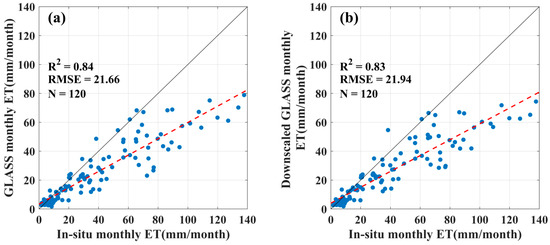
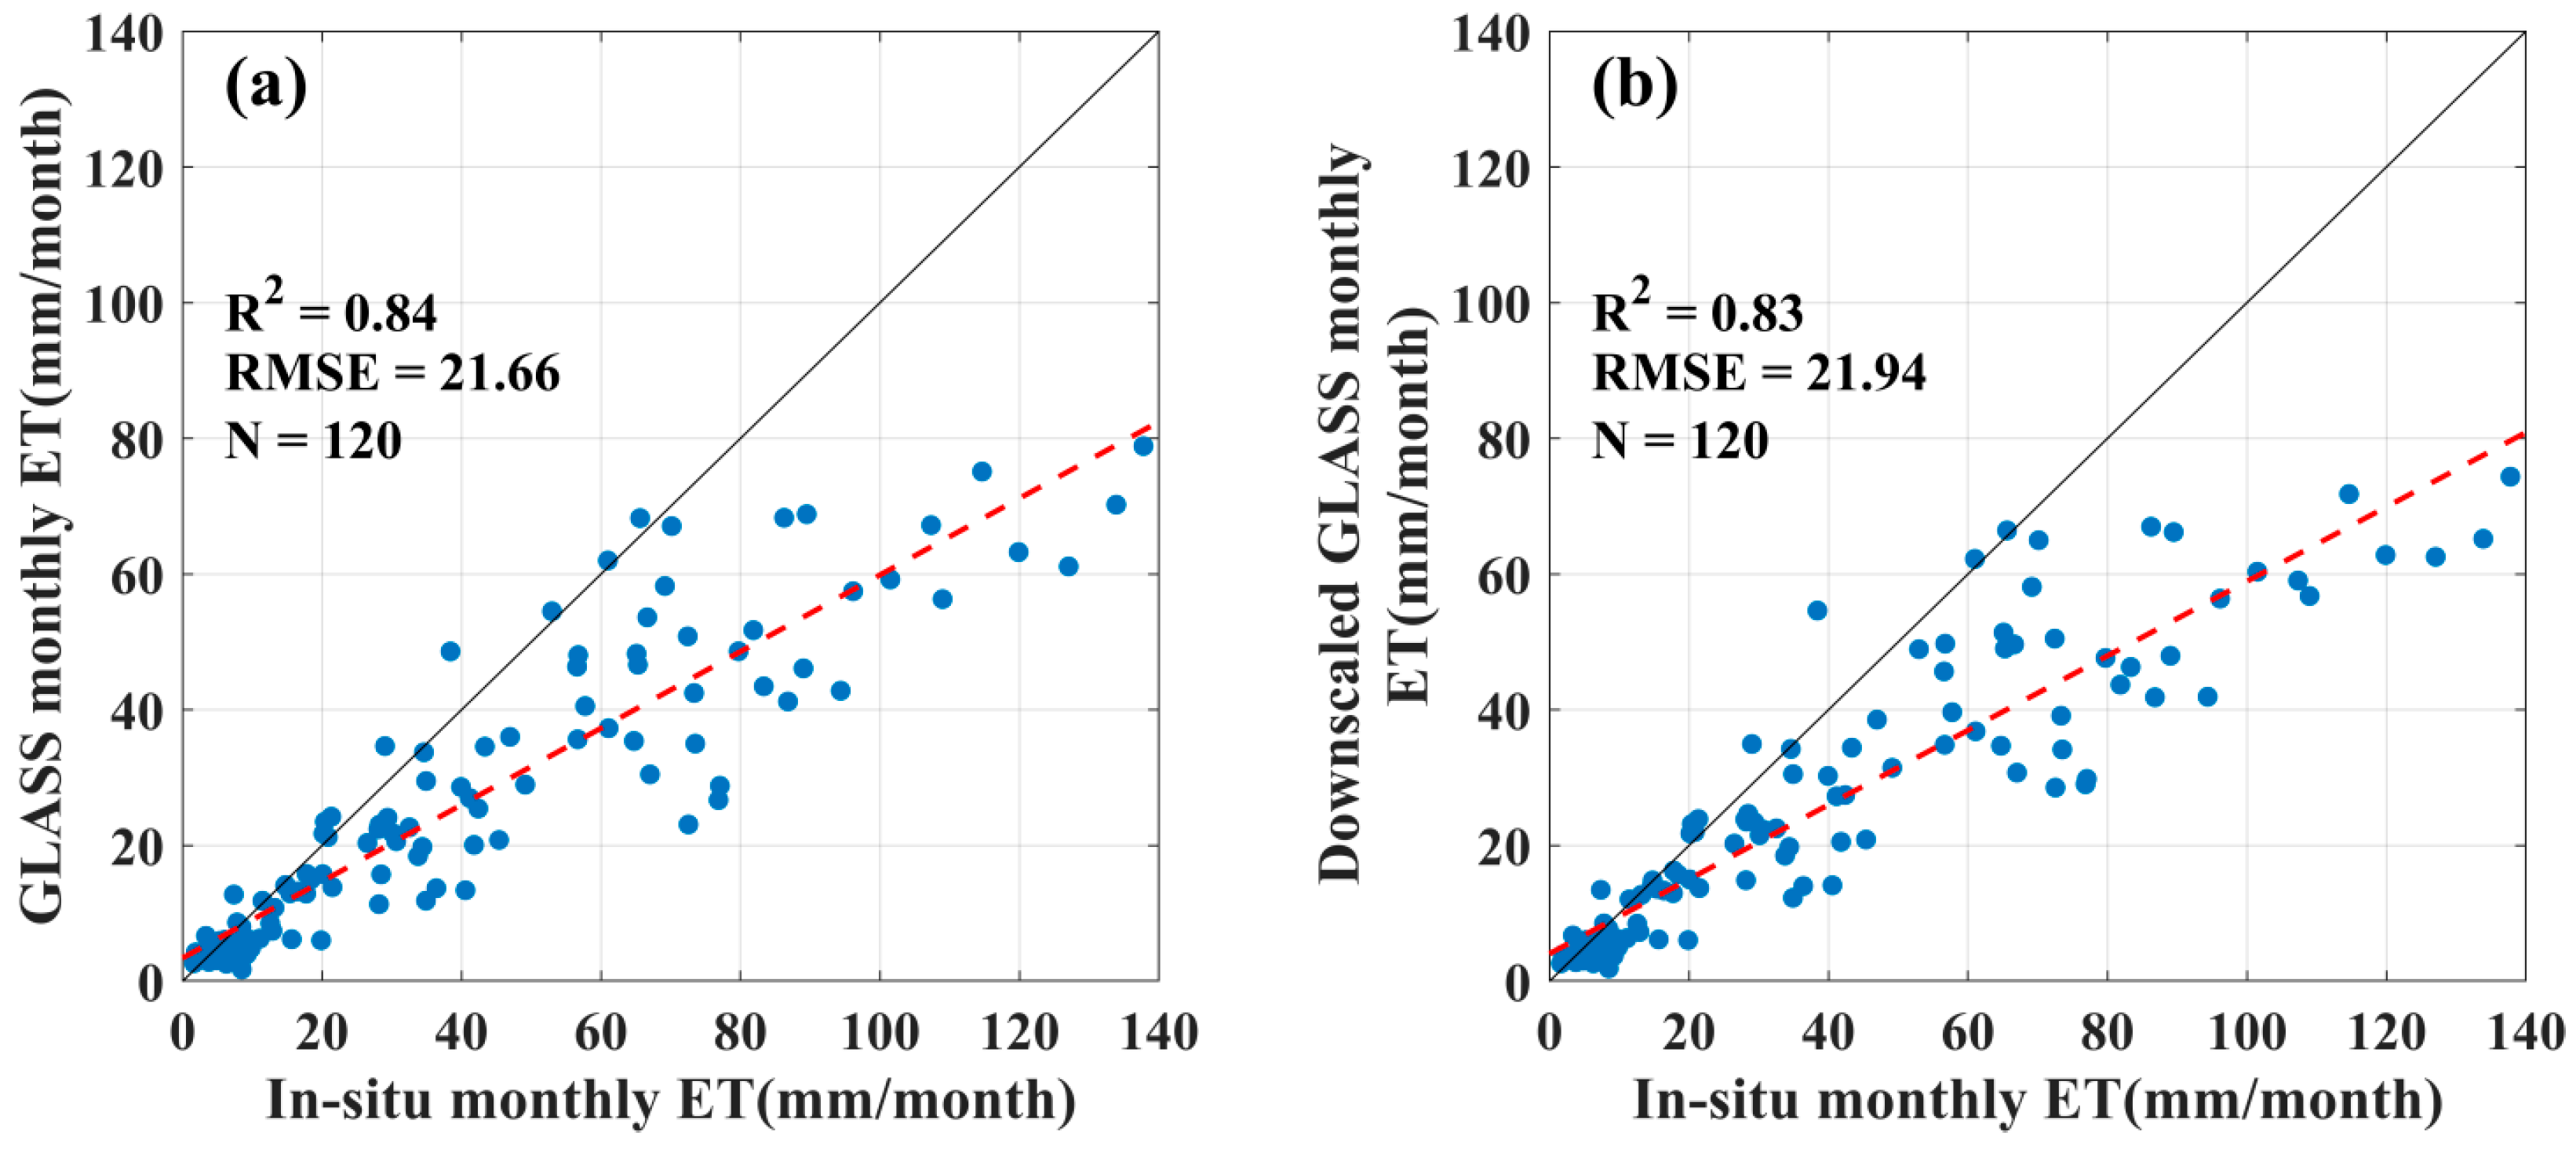
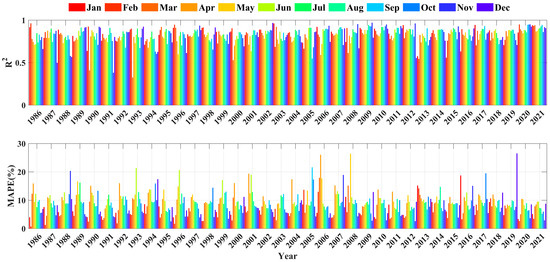
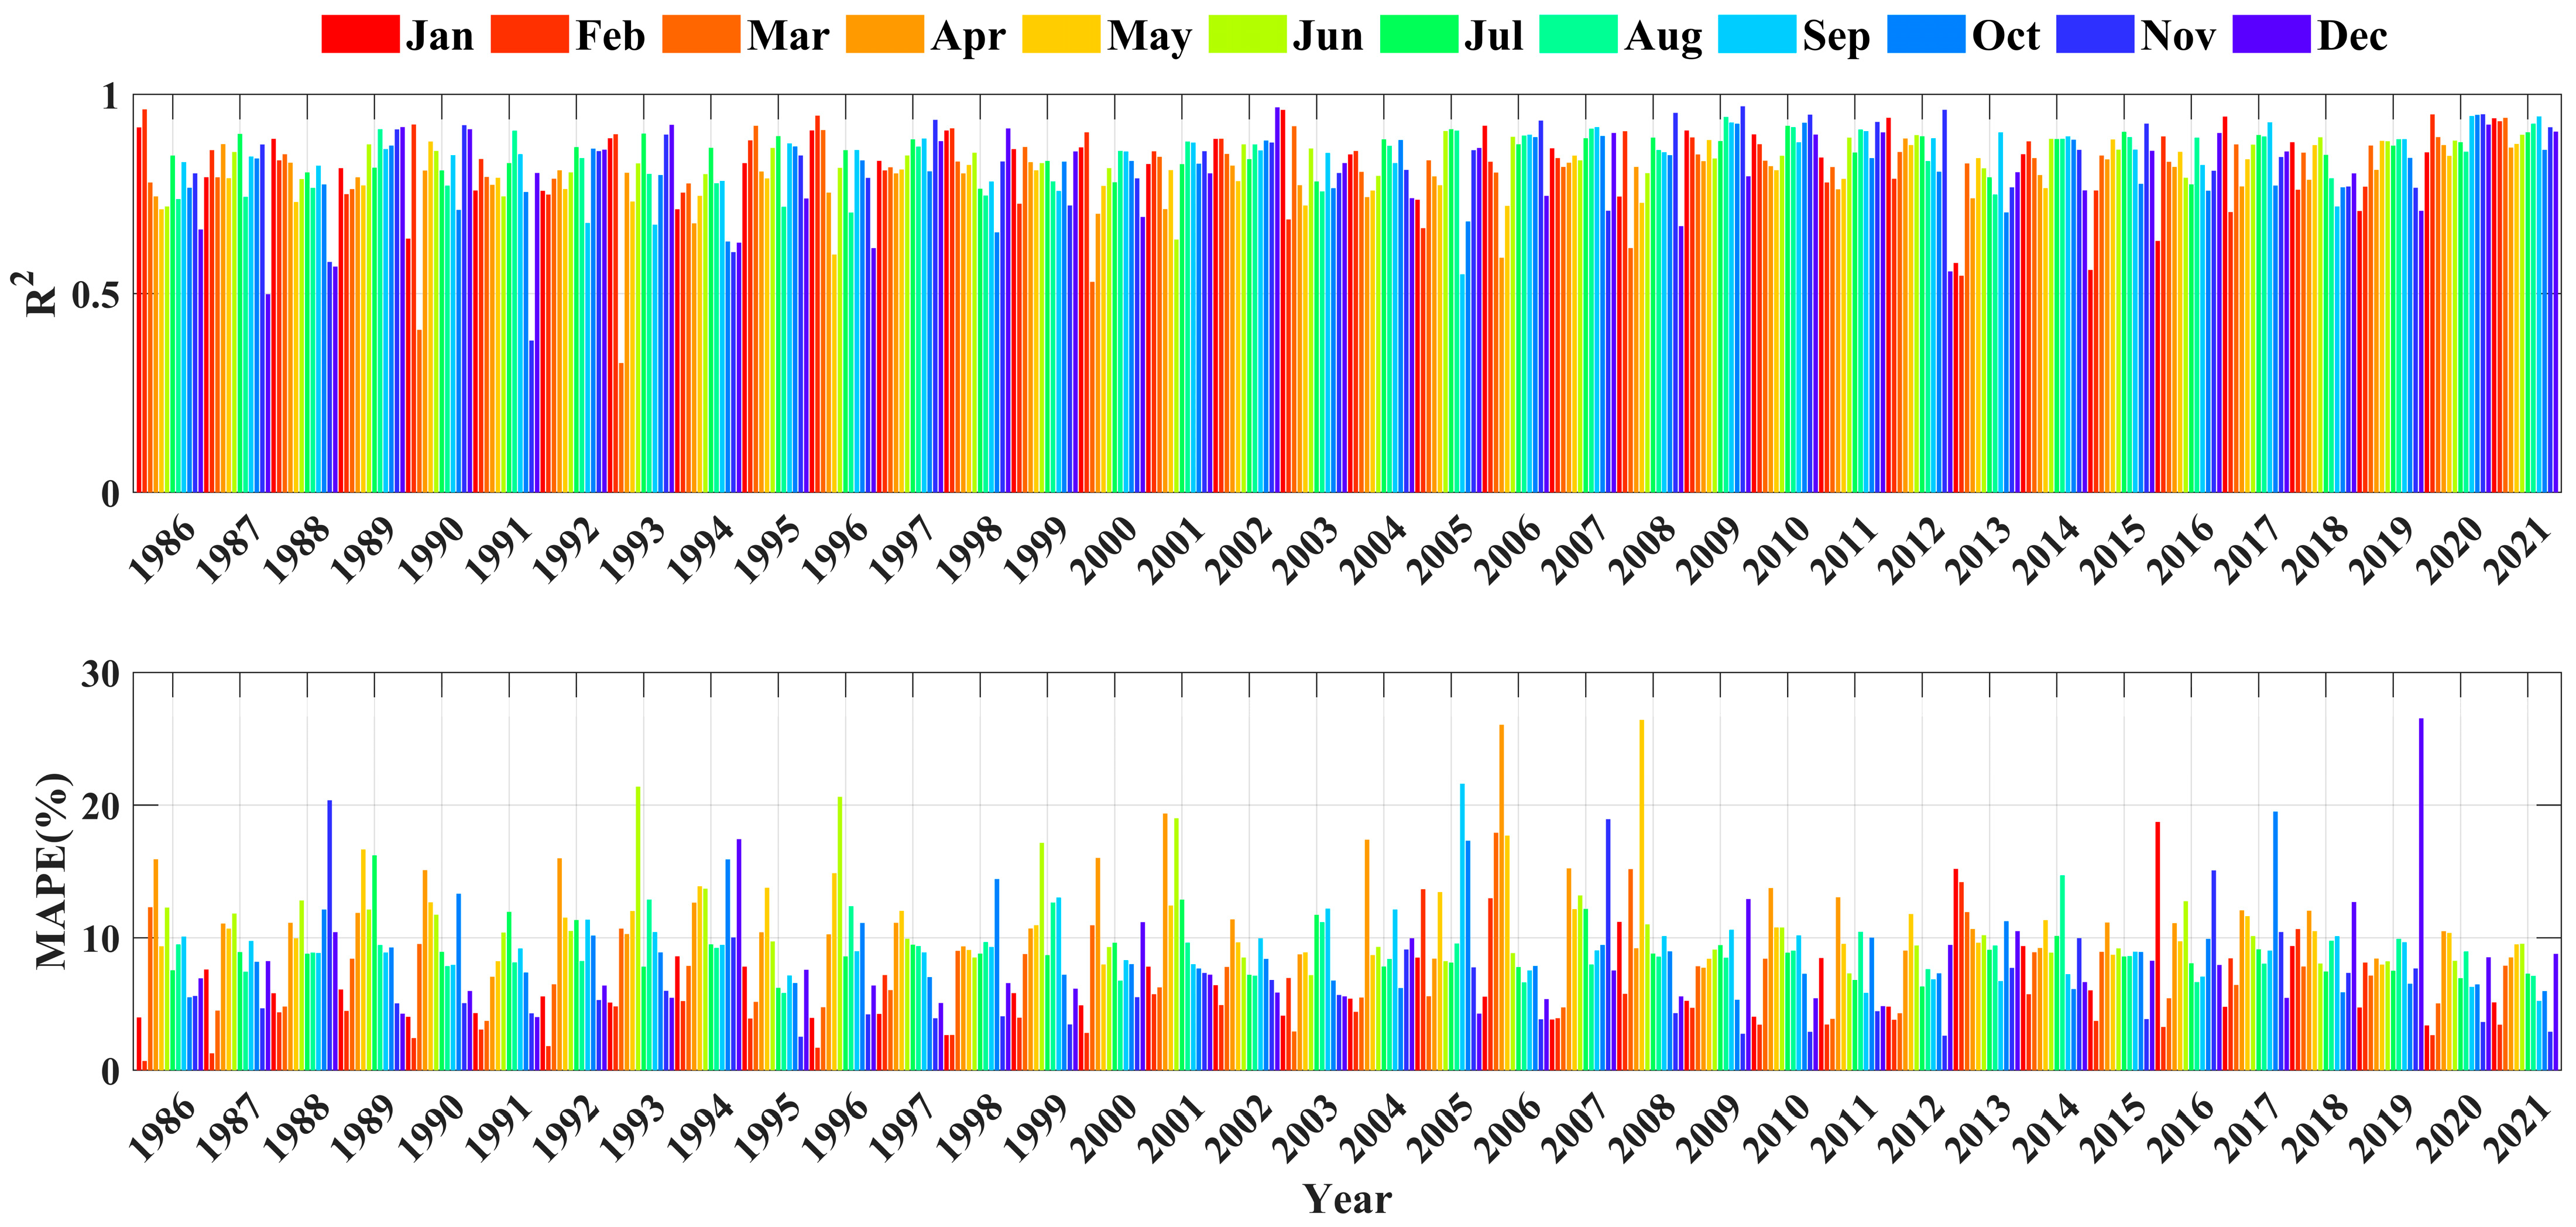
Both GLASS ET and the downscaled ET show general consistency with the in situ ET measurements (Figure 6). The RMSEs of GLASS monthly ET and the downscaled monthly ET were 21.66 mm and 21.94 mm, respectively, and the R2s were 0.84 and 0.83, respectively. This confirms the reliability of the downscaling approach. In addition, the monthly downscaled ET shows good consistency with the original GLASS ET at pixel scale. Figure 7 shows that the MAPE ranges from 0.7% to 30% with an average value of 8.81%. The R2 varies from 0.33 to 0.97 with an average value of 0.82. High MAPE and low R2 usually occur during the winter season, when the ET values are relatively low. These results indicate that the spatial consistency of ET was well preserved after downscaling.
Figure 6.
Scatter diagrams of (a) GLASS ET and (b) downscaled ET against in situ ET measurements.
Figure 7.
The (a) R2 and (b) MAPE of the downscaled ET using GLASS ET as reference.
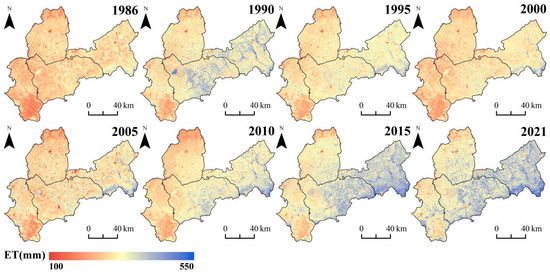
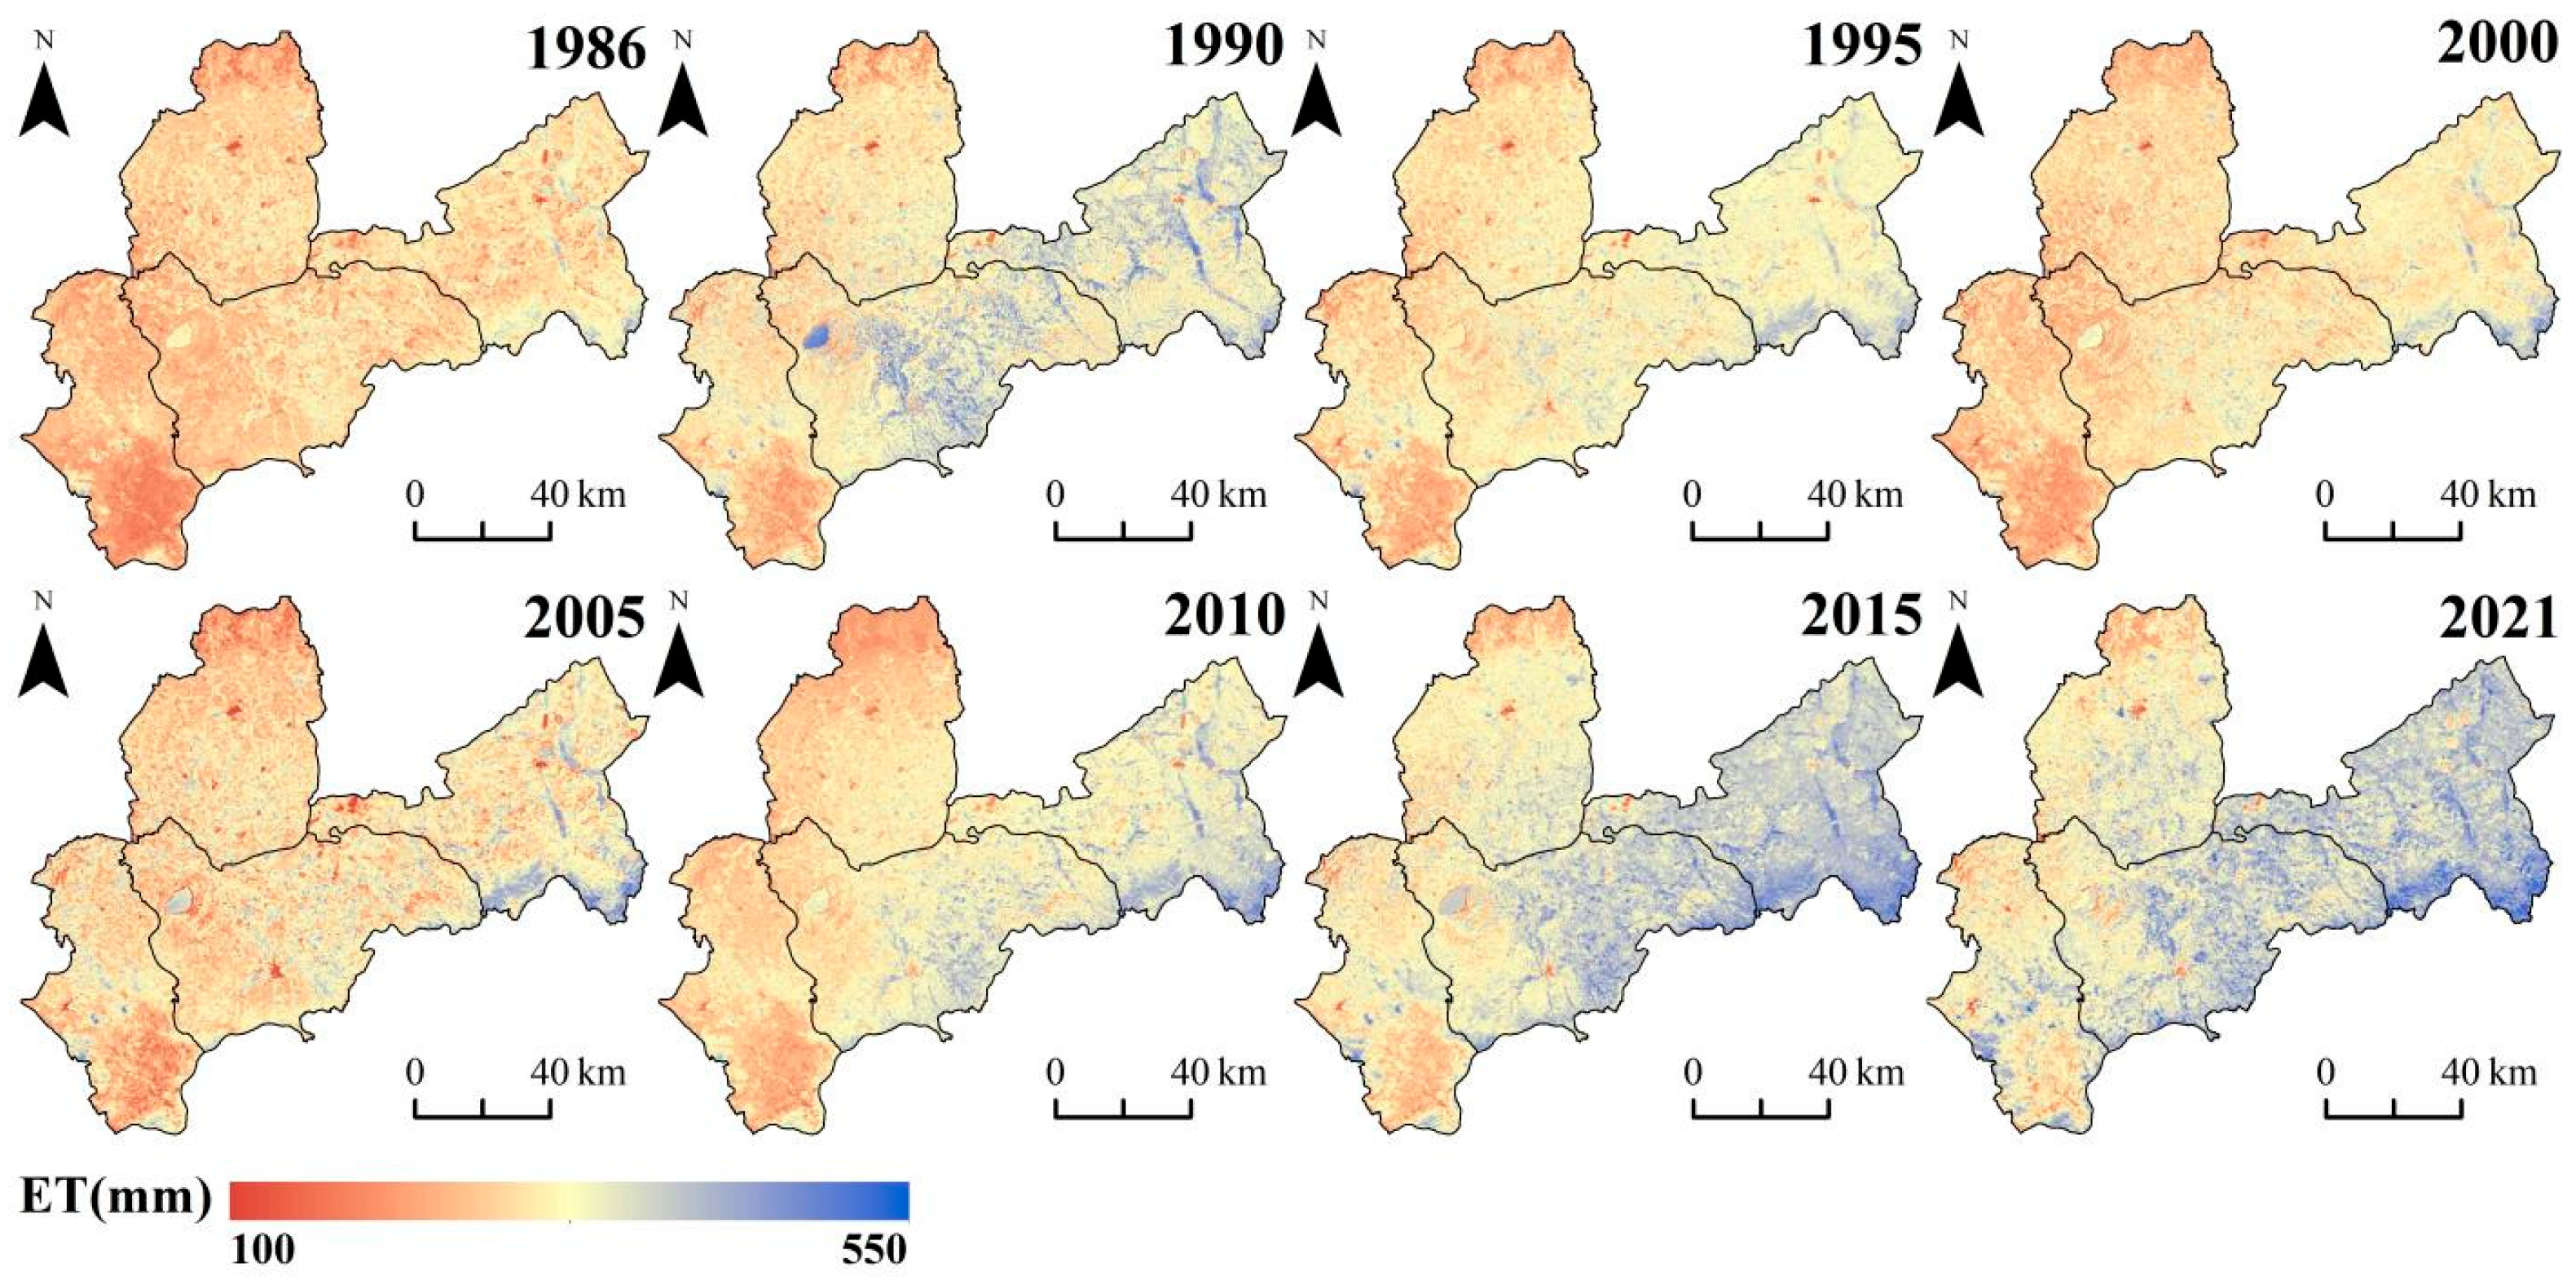
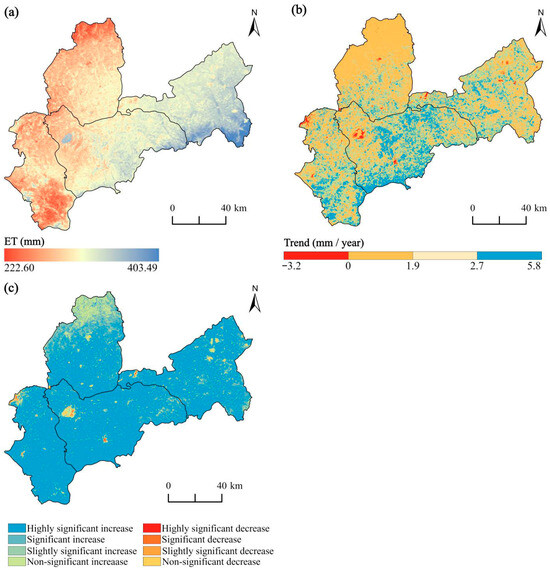
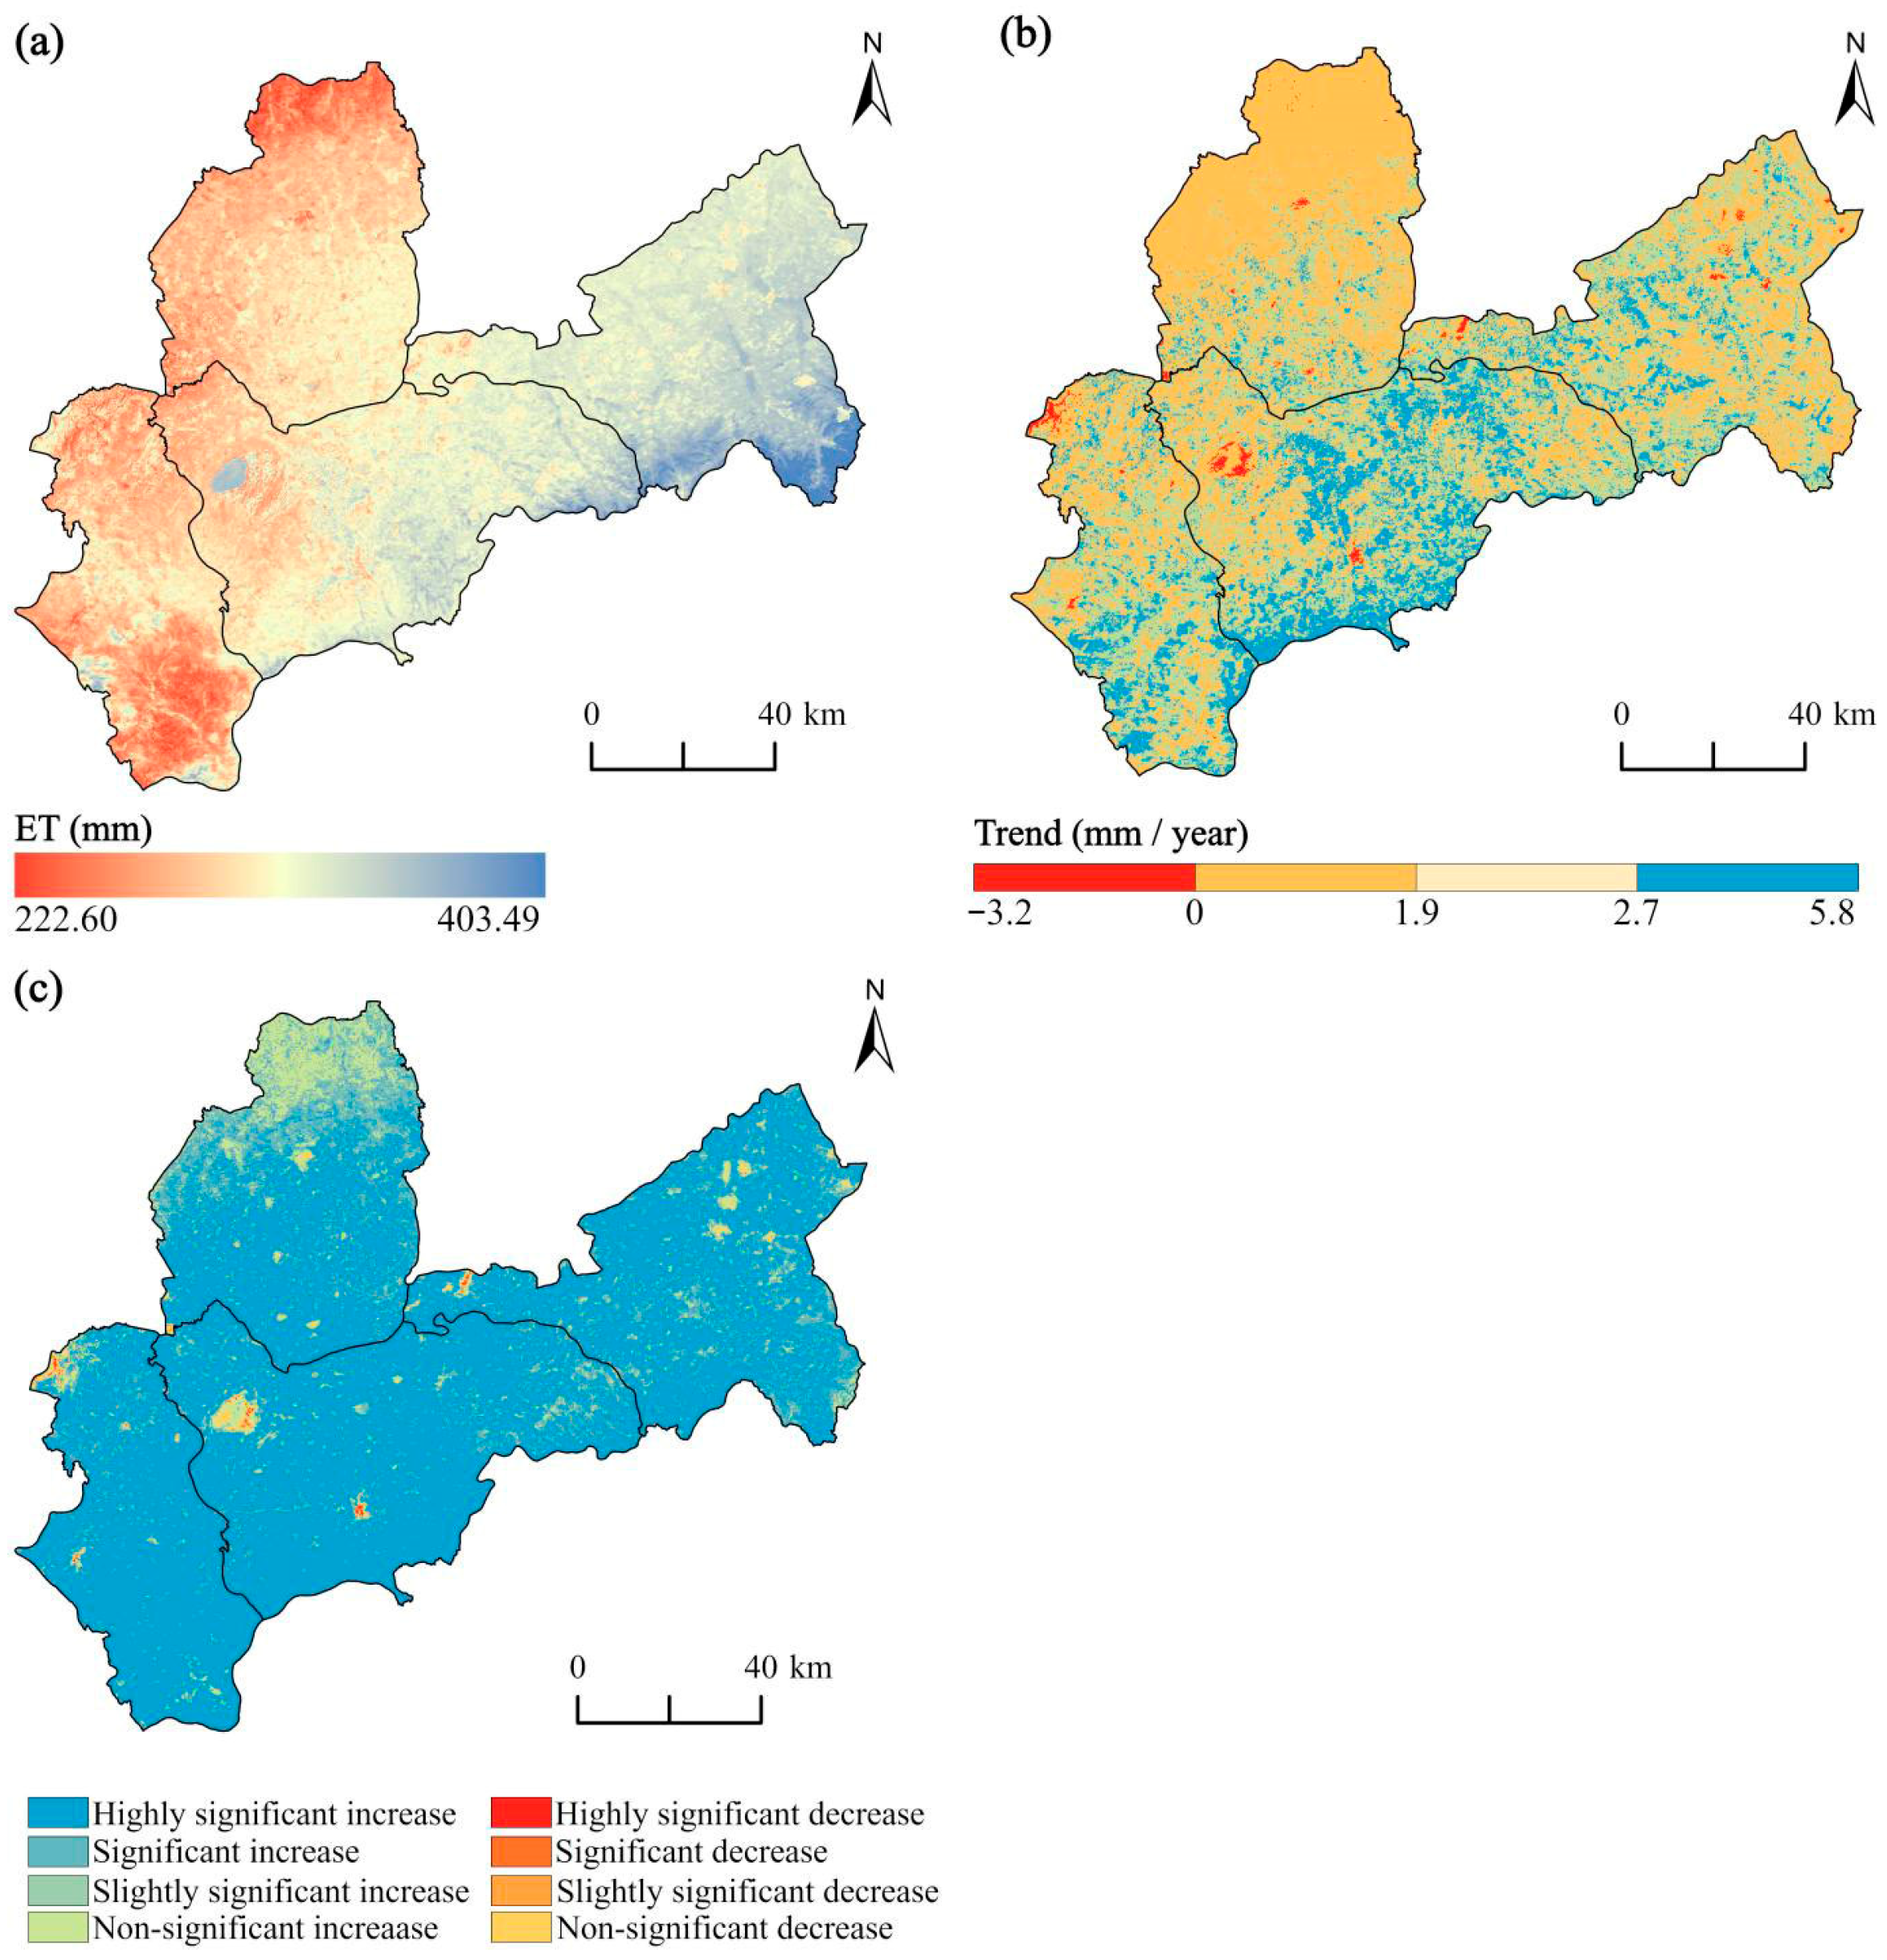
Figure 8 and Figure 9 illustrate the spatial distribution and temporal changes in ET in the Bashang area from 1986 to 2020. The average annual ET across the region is 299.68 mm/year, showing a clear east–west gradient: higher ET (320 mm/year) is concentrated in the southeastern mountainous areas, lakes, and marsh wetlands, while lower ET (270 mm/year) occurs mainly in the western steppe and southern mountains. Among land cover types, average annual ET was highest in forests (309.96 mm/year) and marsh wetlands (307.62 mm/year), followed by croplands (297.14 mm/year) and grasslands (287.55 mm/year). County-level variations were also evident: Guyuan County recorded the highest ET (326.86 mm/year), largely due to extensive wetlands and water bodies, while Zhangbei County averaged 305.18 mm/year. In contrast, Shangyi (277.13 mm/year) and Kangbao (281.38 mm/year) had lower ET, reflecting reduced water areas and lower precipitation. A notable local case is Anguli Lake (Figure 1f) in Zhangbei County—once the largest inland lake on the North China Plateau—which has become a seasonal lake, substantially reducing ET.
Figure 8.
Spatial distribution of annual evapotranspiration from 1986 to 2021.
Figure 9.
Spatial distribution of (a) multi-year average evapotranspiration; (b) change rate of ET in the Bashang from 1986 to 2021; (c) significance of the ET change.
By employing Theil–Sen Median analysis and the Mann–Kendall (MK) trend test, a trend assessment was carried out for the multi-year ET data, and the corresponding results are presented in Figure 9. Over time, ET has increased across most of Bashang, with 98.92% of the area showing positive trends. The ET in the central region, for example, rose from 270–300 mm/year in 1986 to 320–350 mm/year by 2020, and areas with ET > 350 mm expanded southwestward and northeastward from their original distribution in the southeastern mountains. However, the areas in Bashang where ET showed a decreasing trend or an insignificantly increasing trend were mainly concentrated in three types of regions: first, the regions where croplands were converted to grasslands; second, the concentrated areas of grasslands and croplands that maintained a low evapotranspiration level for a long time; third, the regions where lakes and wetlands degraded into saline-alkali lands. The dynamic variation characteristics of evapotranspiration differed depending on the types of land use conversion. When wetlands were converted to grasslands, the average annual ET change rate decreased from 1.65 mm/year (before 2000) to 1.46 mm/year (after 2000). Wetland-to-saline-alkali conversion led to an even sharper reduction, from 0.71 to 0.50 mm/year. By contrast, intact wetlands maintained a higher change rate of 1.67 mm/year throughout 1986–2021, consistently exceeding that of converted areas. These results highlight the critical role of wetlands in sustaining regional evapotranspiration capacity.
3.3. Dynamics of Ecological Water Consumption
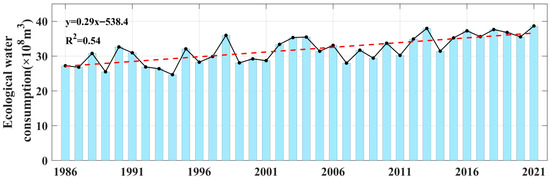
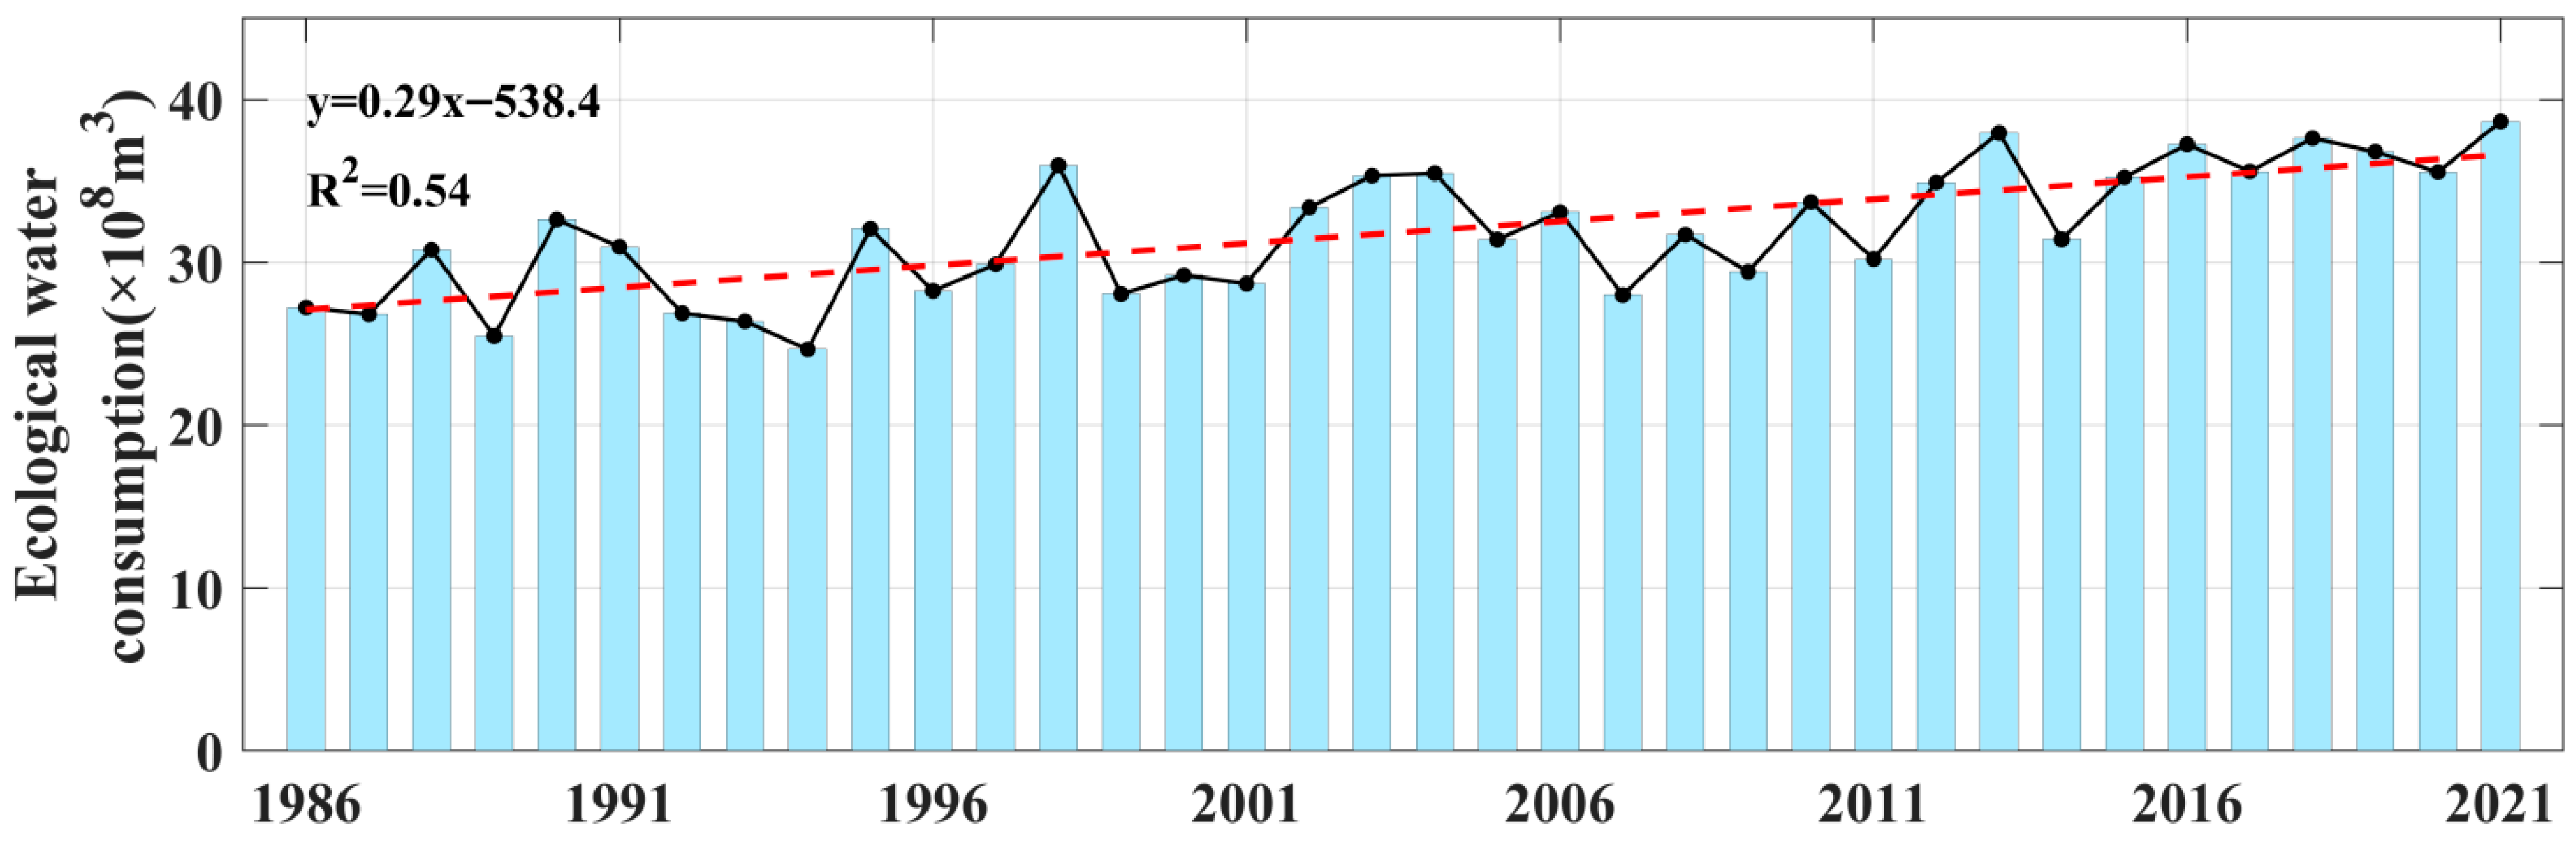
Based on annual ET maps and land cover datasets, the EWC of each land cover type in the Bashang area was estimated. The total EWC was obtained by summing the EWC of all land cover types (Figure 10). Between 1986 and 2021, total EWC in the Bashang area ranged from 2.72 to 3.87 billion m3, with an average of 3.19 billion m3, showing an overall increasing trend accompanied by interannual fluctuations. The maximum consumption (3.87 billion m3) occurred in 2021, whereas the minimum (2.55 billion m3) was observed in 1989.
Figure 10.
Sum of ecological water consumption of all land cover types in Bashang area.
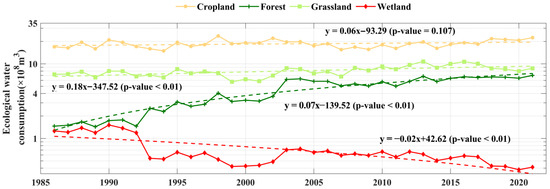
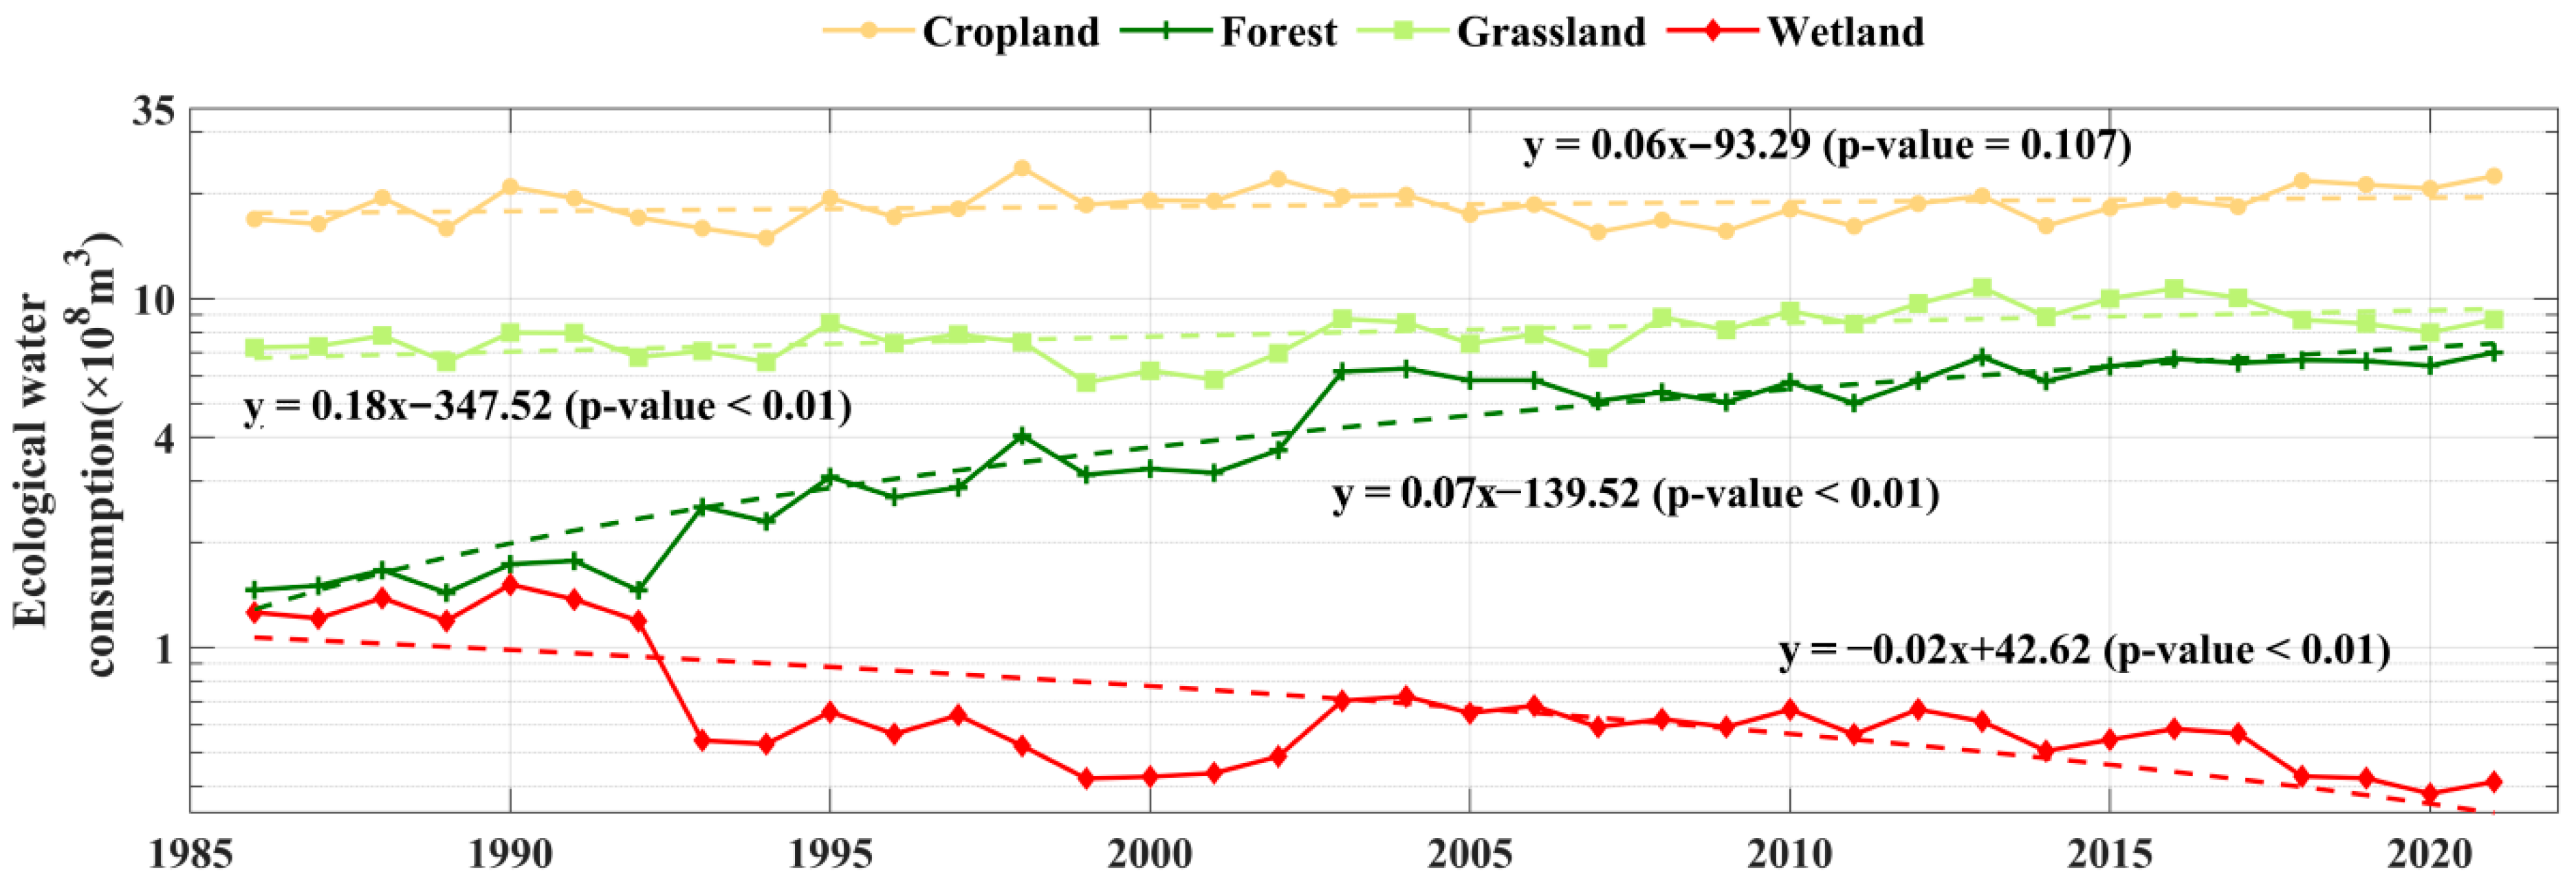
From 1986 to 2021, the EWC of different land cover types is illustrated in Figure 11. Following the implementation of the “Grain for Green Program”, the cropland area experienced a notable decline; yet, sustained groundwater exploitation for agricultural irrigation kept the cropland EWC on a slightly rising trajectory, with an increase from 1.69 billion m3 in 1986 to 2.25 billion m3 in 2021. This upward trend of cropland EWC was statistically non-significant (p = 0.107 > 0.05), meaning no definitive conclusion can be drawn regarding a clear directional change in cropland water consumption. Grassland EWC showed a statistically significant upward trend and maintained an average share of approximately 25.25% of the total regional EWC during the study period. Ecological restoration projects such as the “Grain for Green program” and “Three-North Shelterbelt program” facilitated continuous forest expansion in the Bashang region. Consequently, forest ecological water consumption rose markedly from 146 million m3 in 1986 to 699 million m3 in 2021, increasing its share from 5.37% to 18.09%—an overall increase of about 378%.
Figure 11.
Ecological water consumption of cropland, forest grassland and marsh wetlands from 1986 to 2021.
Marsh wetland EWC decreased from 125 million m3 (4.63%) in 1986 to 41 million m3 (1.07%) in 2021, a decline of about 67.2%. The EWC of marsh wetlands first increased during 1985–1990, peaking at 137 million m3 in 1990, but sharply declined to lower than 100 million m3. Compared with EWC of croplands, forests, and grasslands, the EWC of marsh wetlands exhibited more pronounced fluctuations and showed no clear signs of recovery by 2021.
3.4. Driving Forces of Marsh Wetland Ecological Water Consumption Change
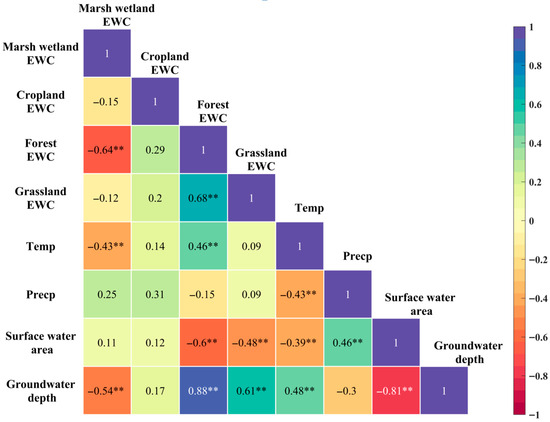
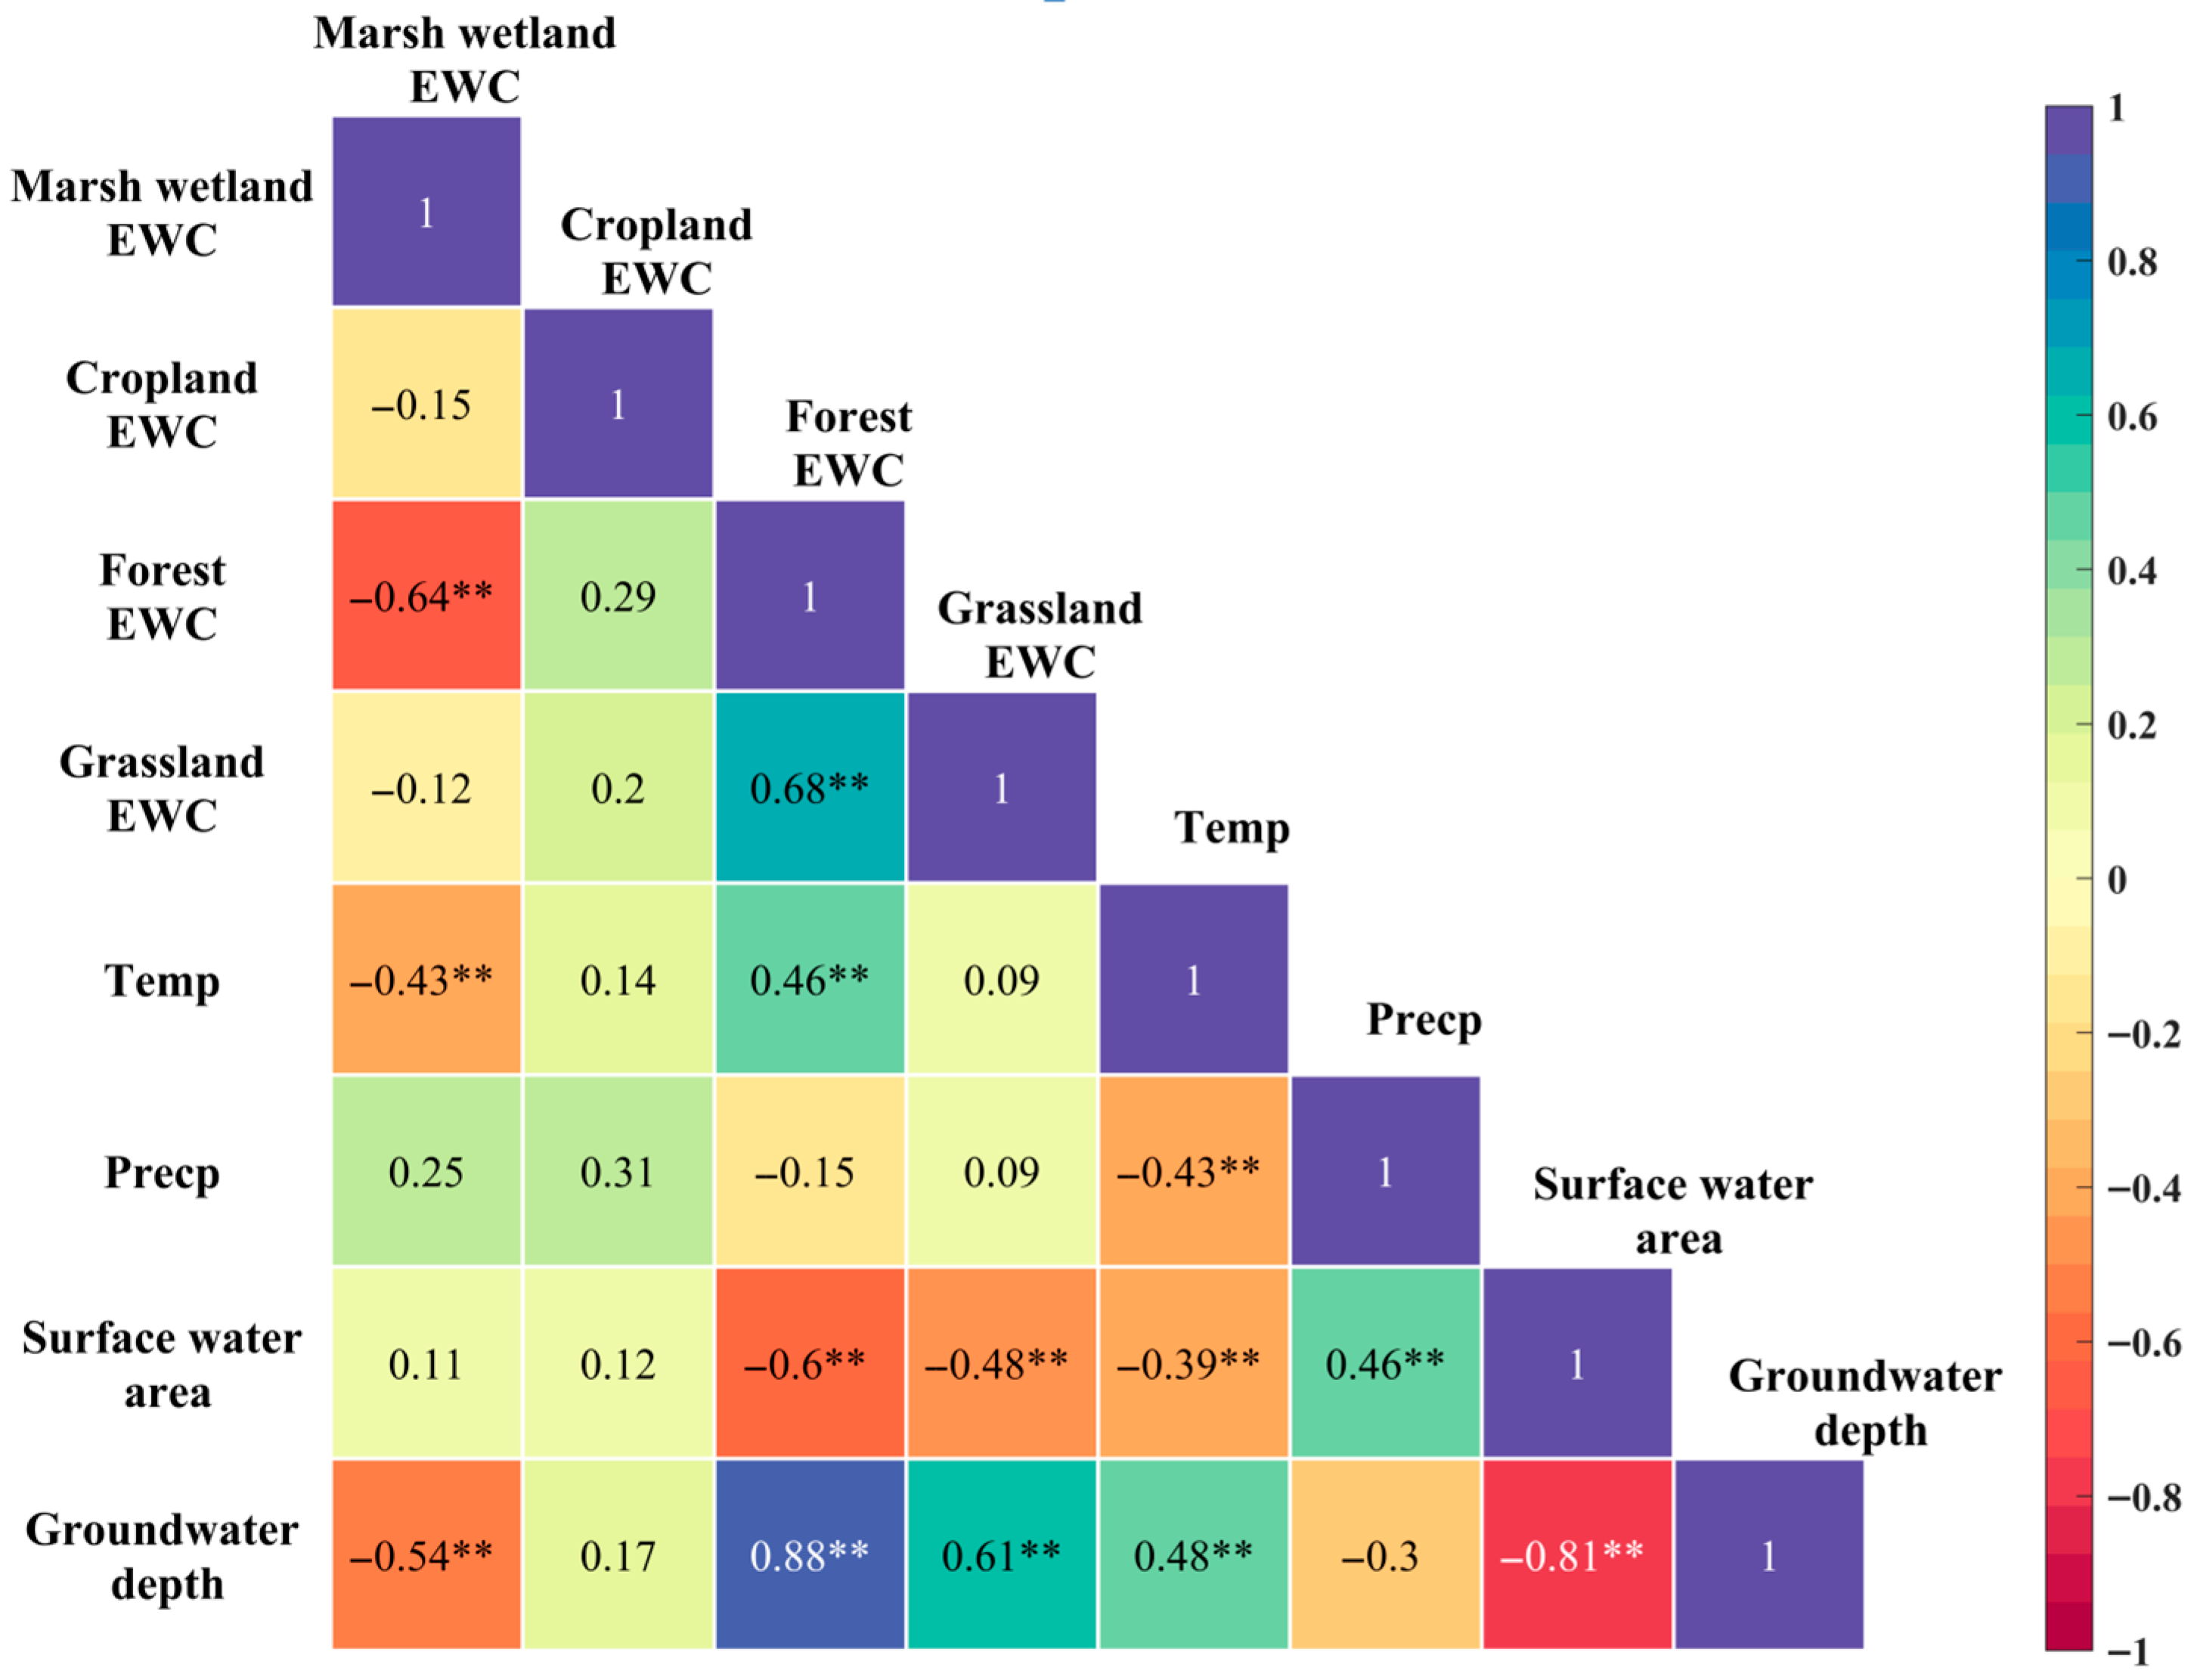
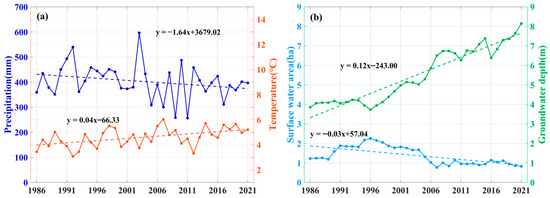
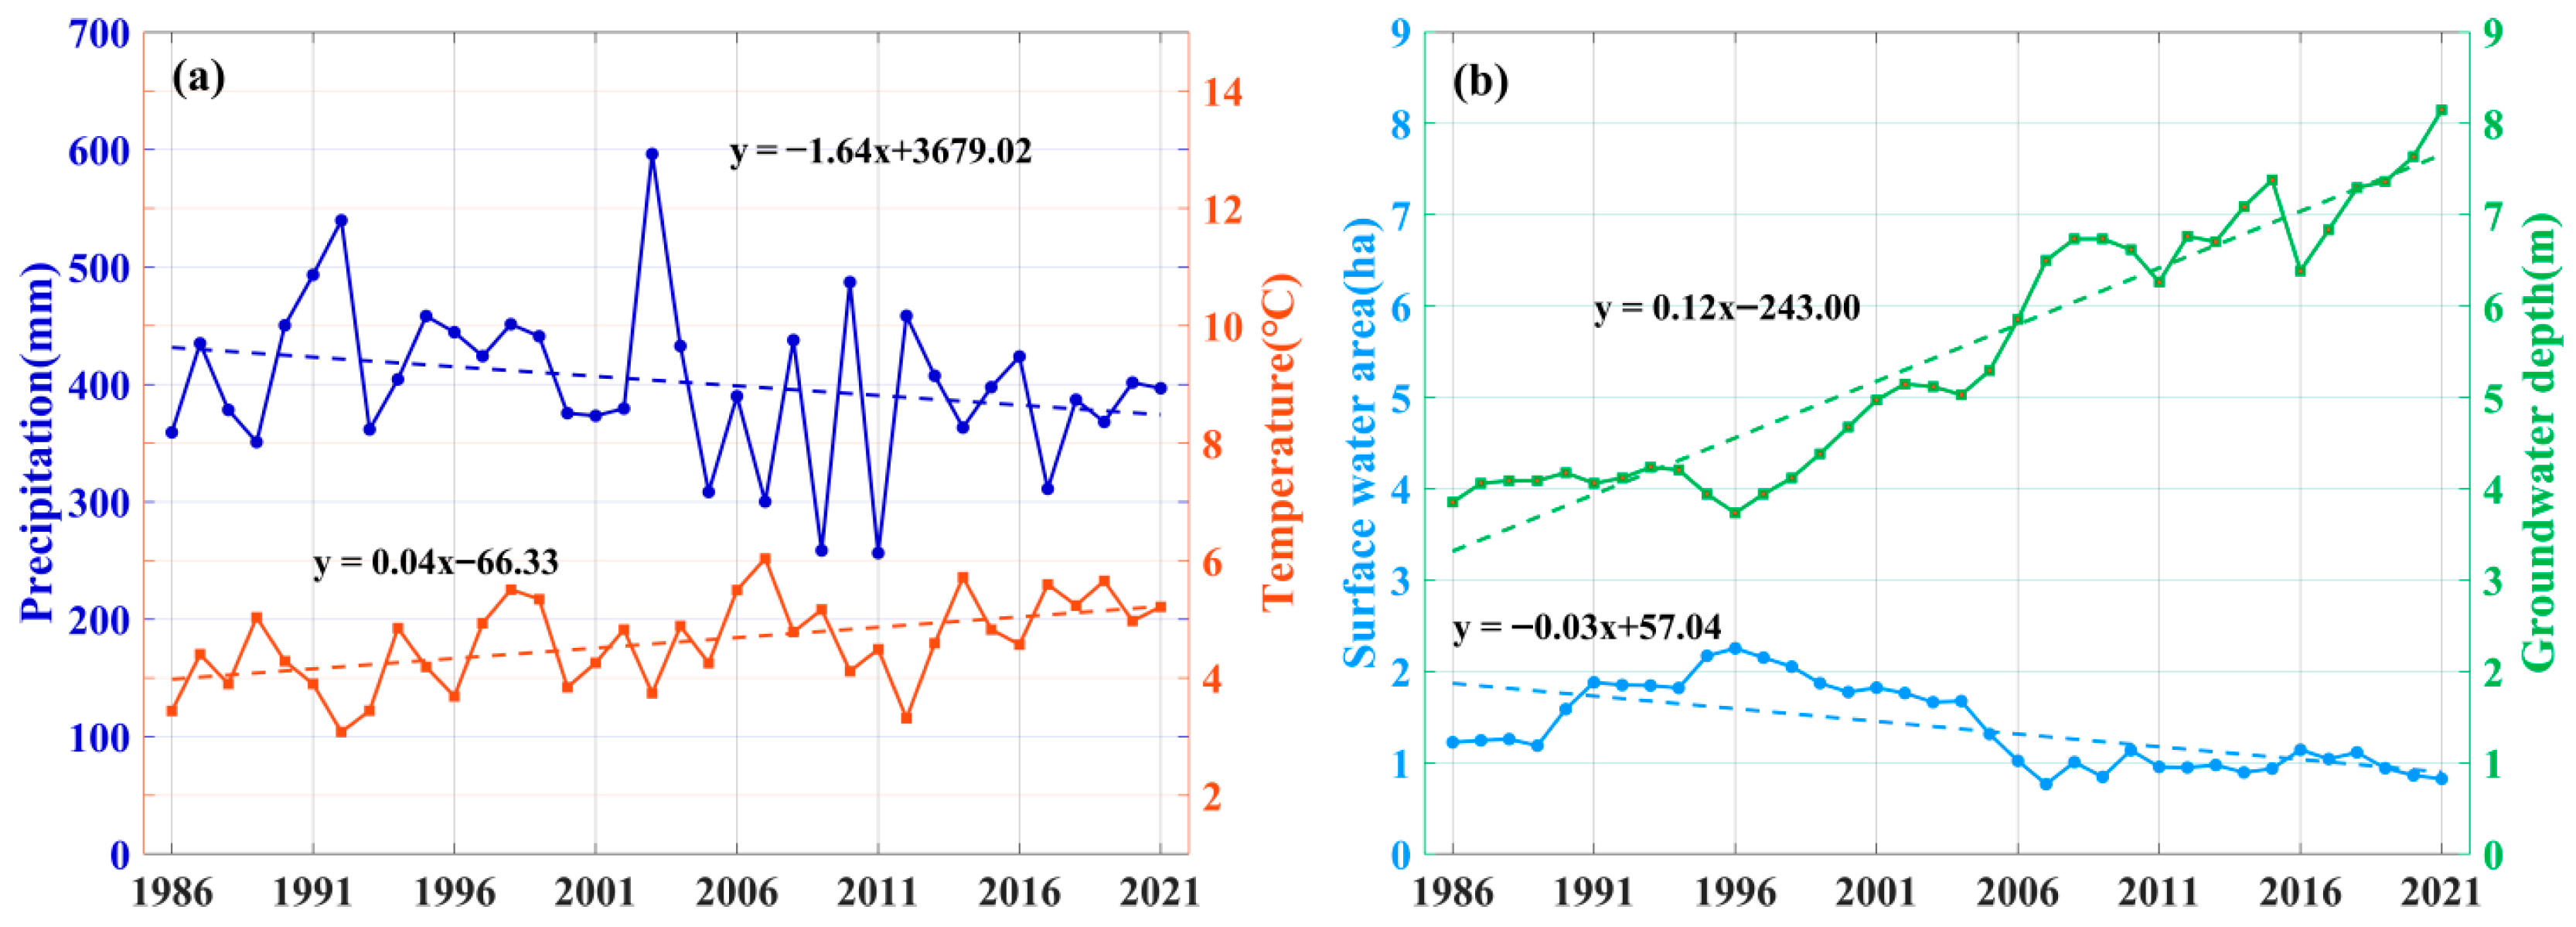
Figure 12 presents the Pearson correlation coefficients between the EWC of marsh wetlands and potential driving factors. The results show that marsh wetland EWC is significantly negatively correlated with both temperature (r = –0.43, p < 0.05) and groundwater depth (r = –0.54, p < 0.05). These findings align with the temporal trends shown in Figure 13, where temperature has steadily increased, and groundwater depth has deepened over the past 40 years. The significant negative correlation between marsh wetland EWC and forest EWC (r = –0.64, p < 0.05) further supports this, reflecting the contrasting trends in marsh wetland and forest EWC, as shown in Figure 11. Forest EWC itself is positively correlated with groundwater depth (r = 0.88, p < 0.05) and temperature (r = 0.46, p < 0.05), indicating that forest ecosystems respond differently to hydrometeorological changes compared to marsh wetlands. In contrast, forest EWC is significantly negatively correlated with surface water area, which has been declining over the past four decades.
Figure 12.
Pearson correlation coefficients among EWC of different vegetation types, temperature, precipitation, surface water area and groundwater depth, where “Temp” denotes temperature, “Precp” denotes precipitation, ** indicates significant correlation at 0.05 level.
Figure 13.
Temporal variations in key driving factors. (a) temperature and precipitation; (b) surface water area and groundwater depth.
While these correlation results suggest associations between various factors, they do not establish causality. To address this, Granger causality analysis was employed to identify the driving forces behind changes in marsh wetland EWC (Table 1). The results indicate that precipitation and surface water area are significant Granger causes of marsh wetland EWC, with precipitation affecting marsh wetland EWC with a lag of two years and surface water area influencing EWC with a lag of four years. Interestingly, neither forest EWC, temperature, nor groundwater depth were identified as significant direct Granger causes of marsh wetland EWC changes.
Given that surface water area is a key driver of marsh wetland EWC, additional Granger causality tests were performed to explore the causal linkages between surface water area and other influencing factors. Despite a strong positive relationship between precipitation and surface water area, precipitation was not detected as a Granger cause of surface water area. Instead, forest EWC, grassland EWC, and groundwater depth were found to be significant Granger causes of surface water area changes. This suggests that vegetation water use and subsurface hydrological conditions play a more critical role in regulating surface water availability than direct rainfall inputs.
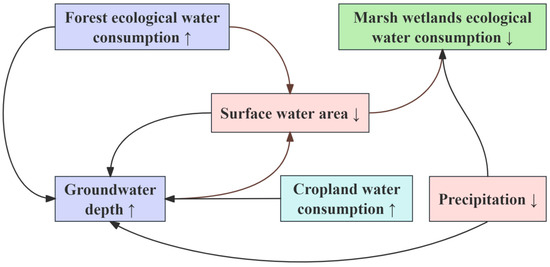
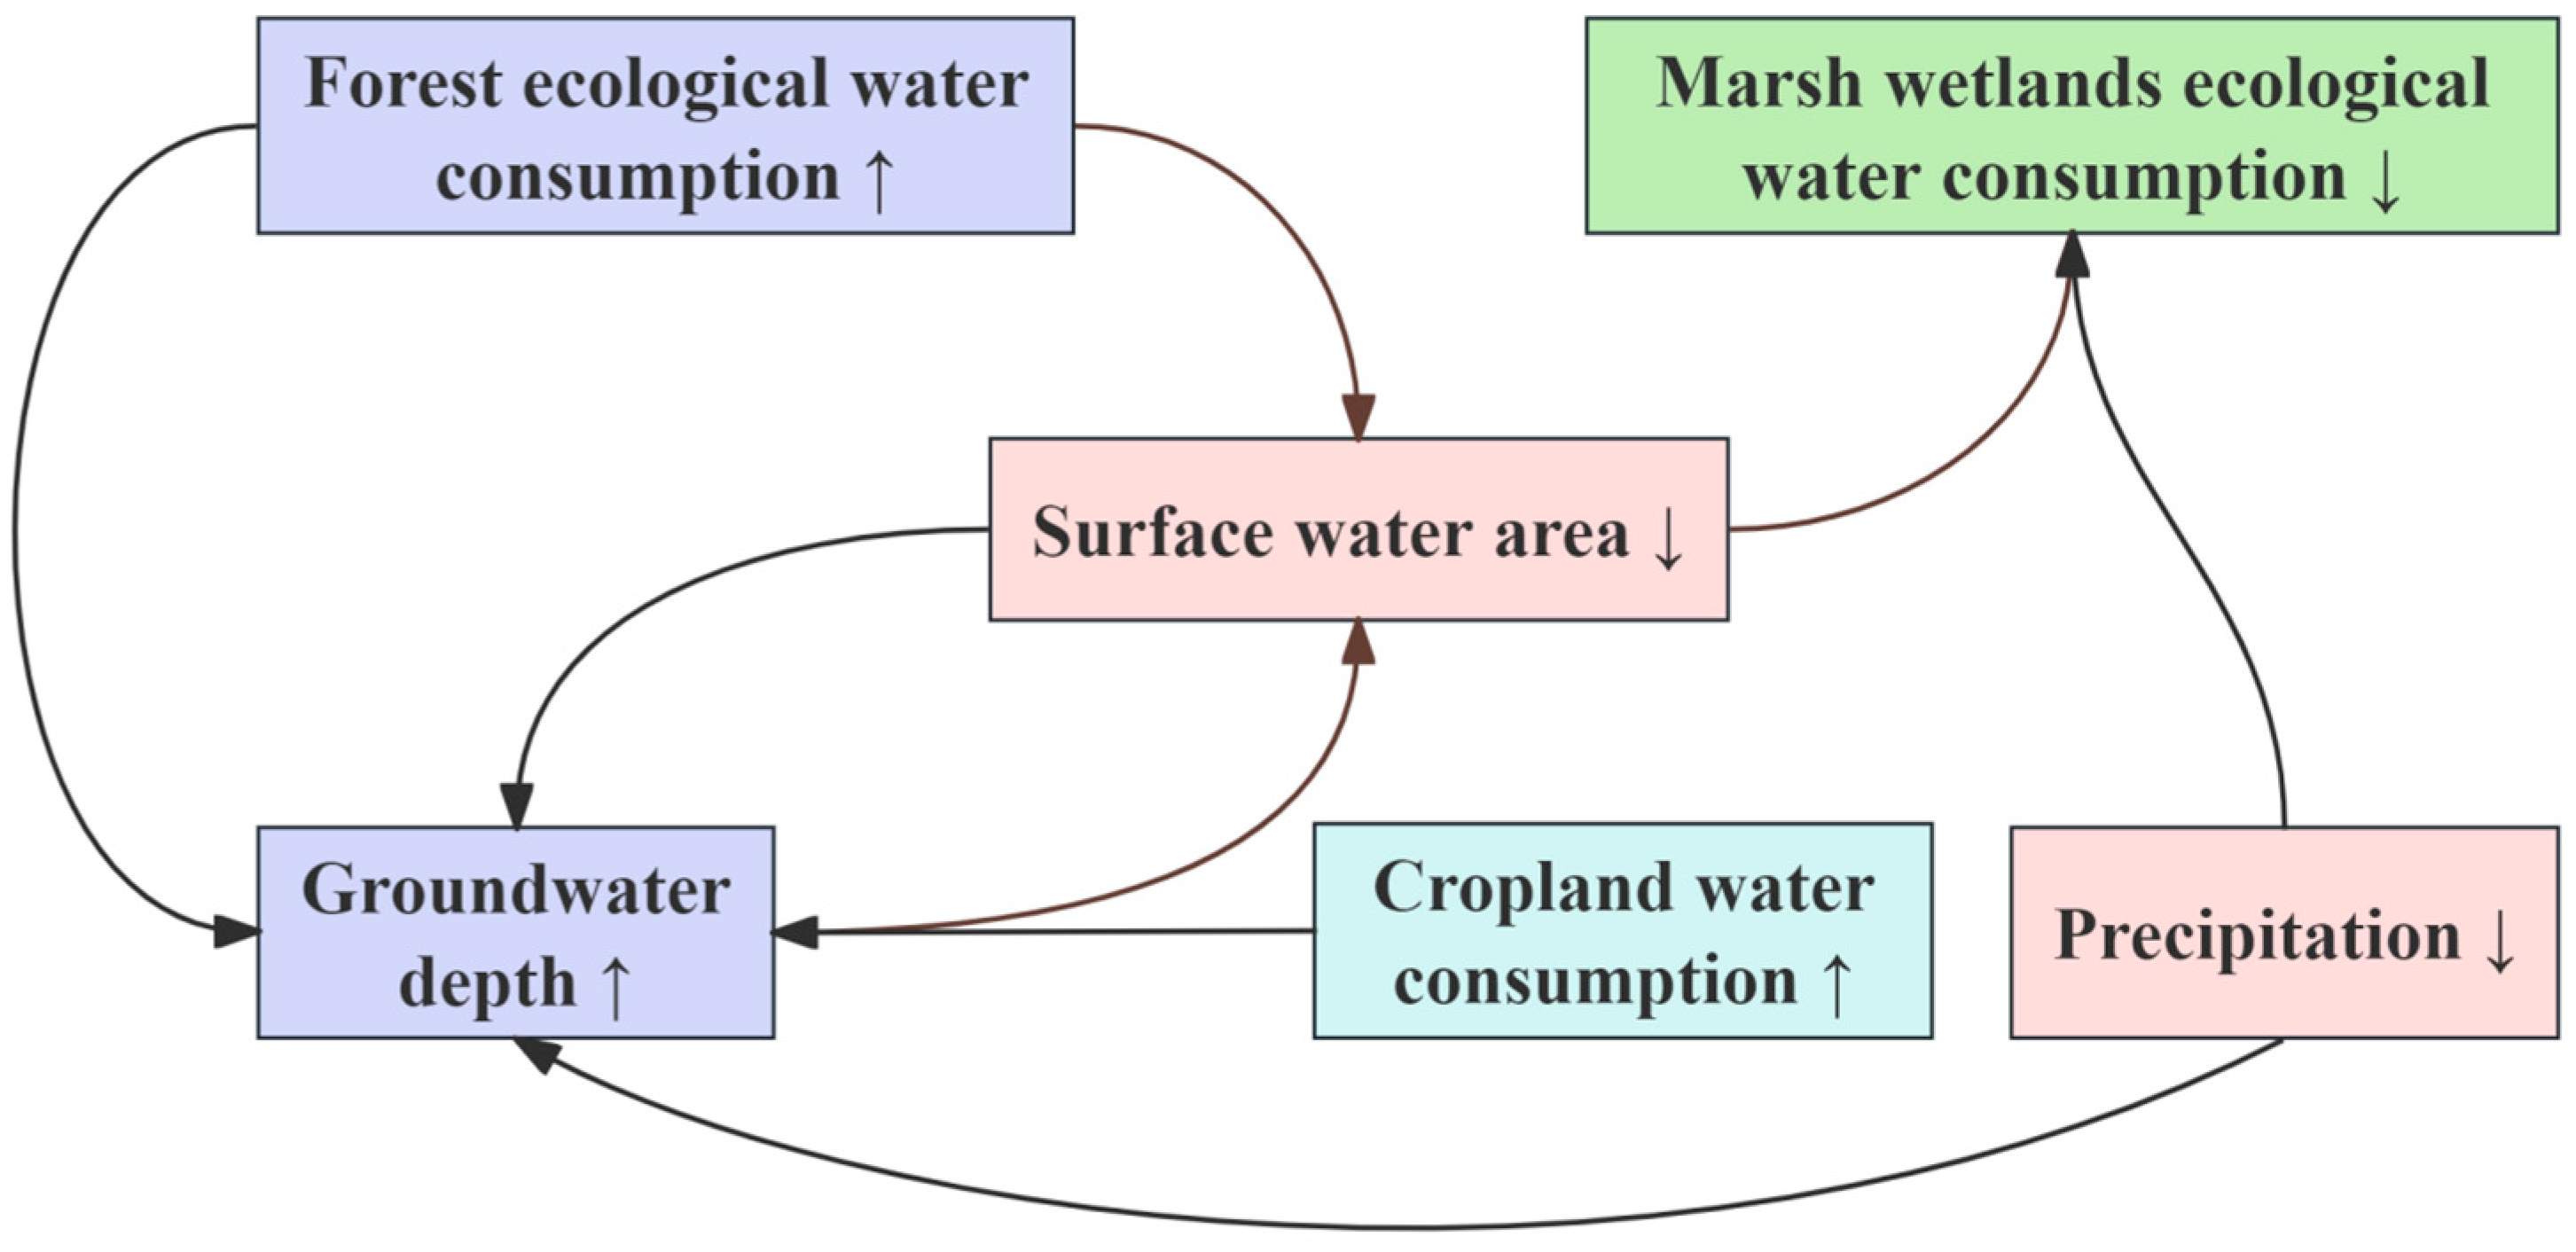
Further causality tests highlighted that cropland EWC, forest EWC, precipitation, and surface water area significantly influence groundwater depth (Table 2). This finding suggests an interactive feedback mechanism between groundwater and surface water, where infiltration and recharge processes influence each other. Precipitation also contributes to groundwater replenishment, indirectly supporting marsh wetland EWC. The strong negative correlation between marsh wetland EWC and forest EWC further supports the interpretation that increased forest EWC reduces surface water area and deepens groundwater levels, thereby indirectly driving marsh wetland degradation. Consequently, groundwater depth acts as a mediating factor that amplifies the effects of terrestrial vegetation water use on wetland hydrology. The causal loop diagram derived from the Granger causality analysis is shown in Figure 14.
Table 2.
Result of the Granger causality test.
Figure 14.
Causal loop diagram.
4. Discussion
4.1. Necessities of ET Downscaling
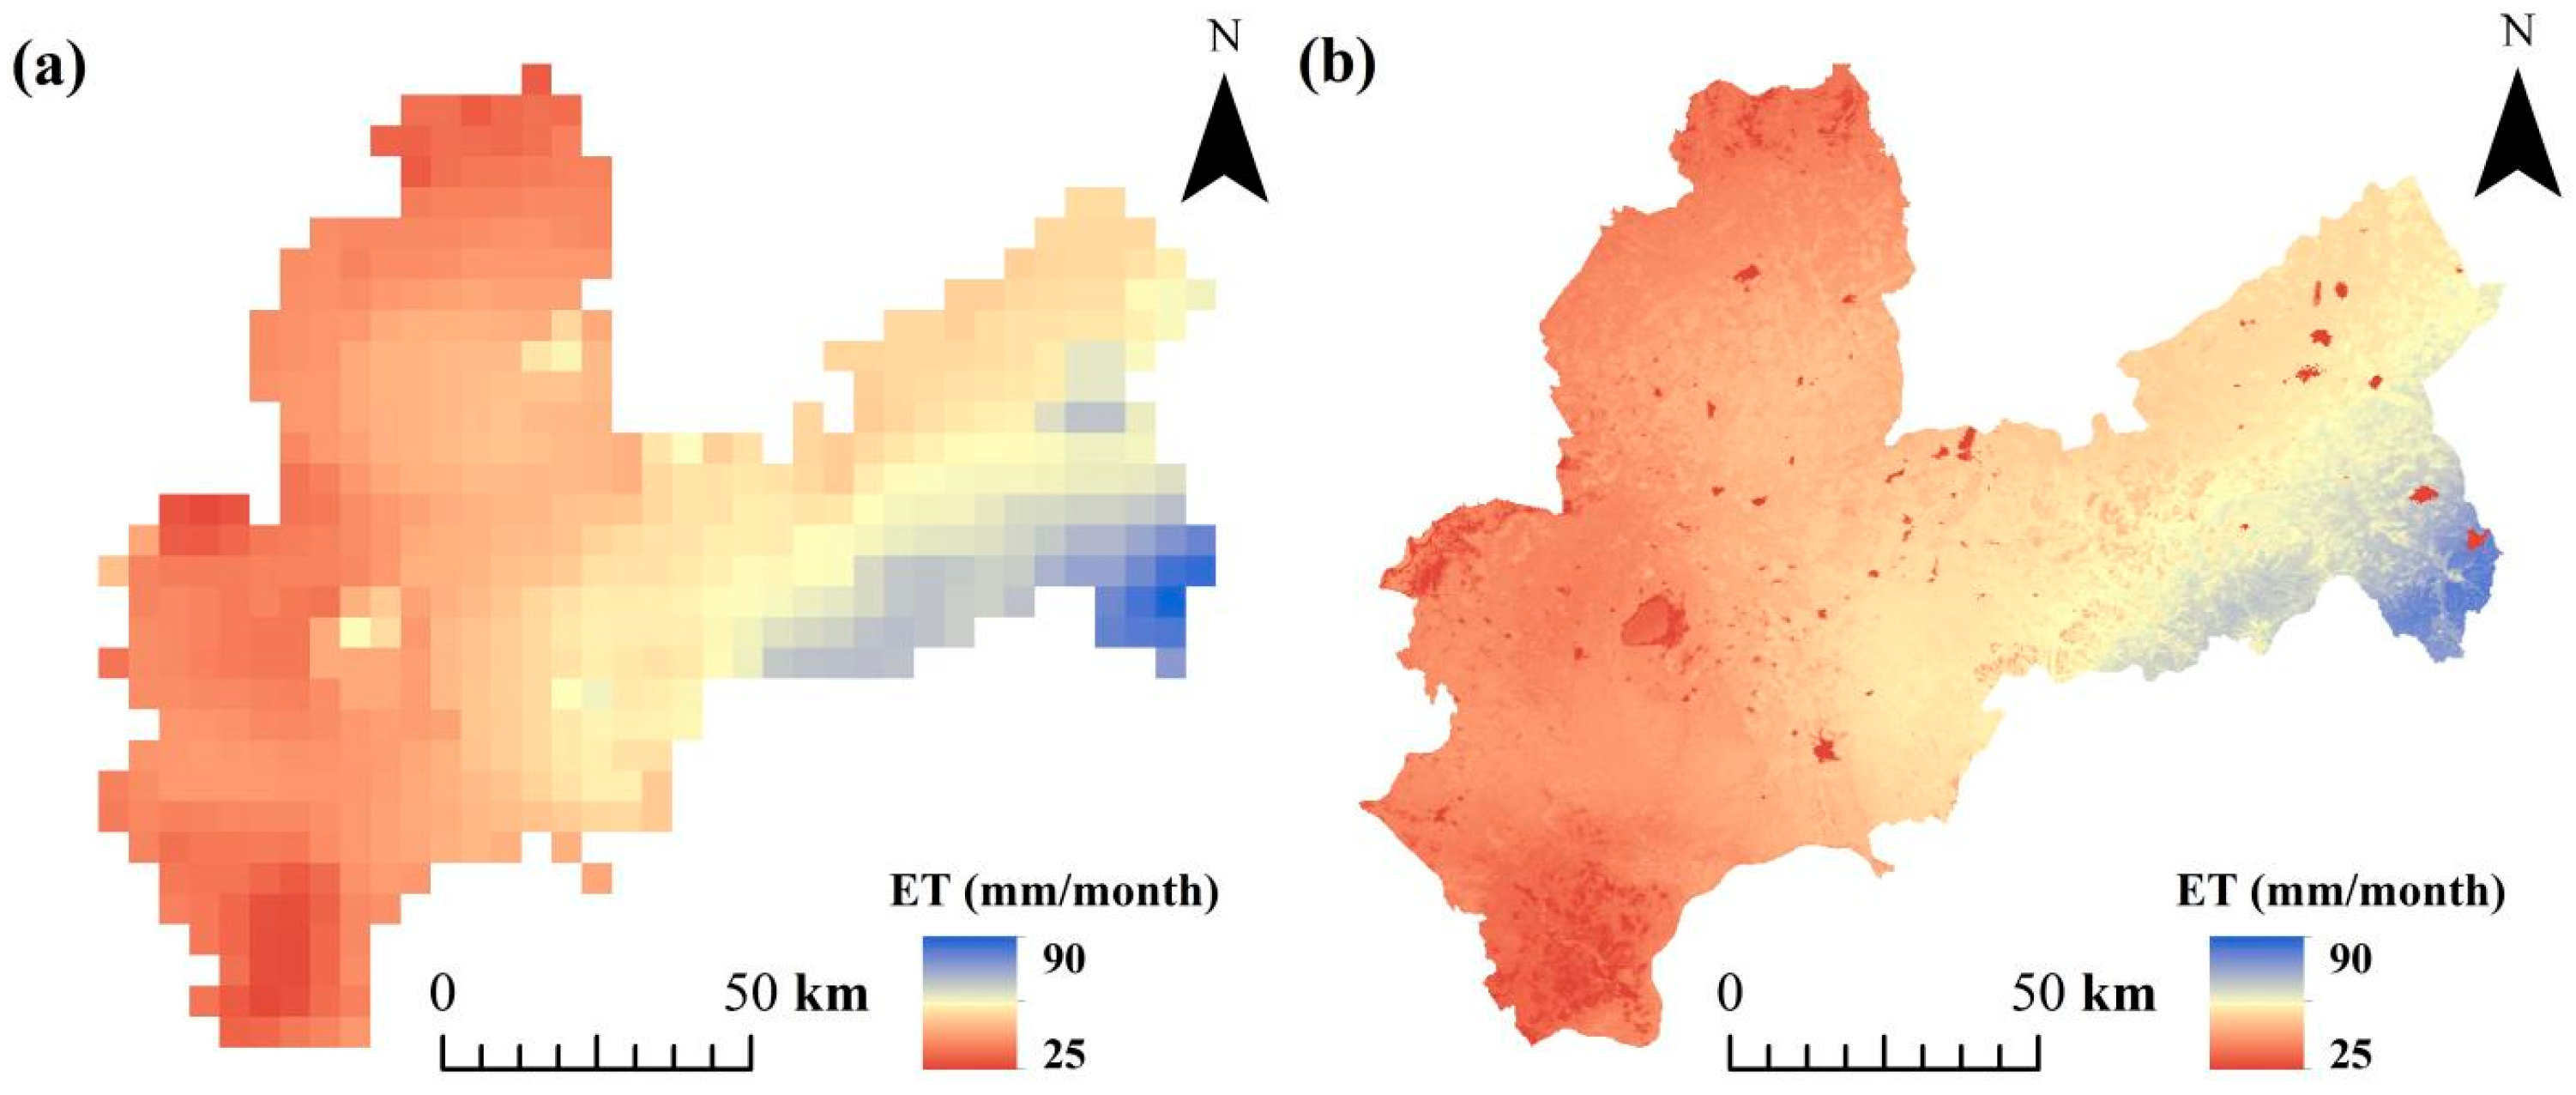
The Random Forest algorithm was employed to downscale GLASS ET from a spatial resolution of 0.05° to 250 m by integrating NDVI, meteorological variables, and topographic factors. The downscaled ET products achieve strong agreement with GLASS ET, confirming the model’s reliability in retaining temporal consistency with the original data product. In addition, the downscaled results represent more spatial details than the original coarse-resolution product. As illustrated in the example in Figure 15, the downscaled ET displays clear spatial heterogeneity across different land cover types. This advantage is particularly evident in areas with fragmented, small-area land cover types, such as marsh wetlands, rivers, and lakes—regions where the coarse resolution of the original GLASS data fails to resolve. Validation using in situ FLUXNET observations further confirms that the downscaled ET data maintain high consistency with measured values while retaining the accuracy of the original GLASS dataset (Figure 6).
Figure 15.
Comparison of Downscaling Effects in July 2007: (a) GLASS ET data; (b) Downscaled ET data.
Nevertheless, both datasets exhibit a slight underestimation of actual ET, consistent with previous findings that remote-sensing-based ET models are affected by scale effects, which are amplified by algorithmic nonlinearity [42,43]. These results underscore the need to develop a unified theoretical framework and standardized validation protocol for remote sensing ET products [44]. Future research should therefore focus on improving high-resolution ET retrieval techniques to produce more accurate fine-scale ET datasets that support precise water resource management in arid and semi-arid regions.
4.2. Comparative Analysis with Related Studies on Marsh Wetland Degradation
The results of this study indicated that the insufficient precipitation over the years and the reduction in surface water area caused by the increasing groundwater depth are the core direct factors driving the decrease in ecological water consumption (EWC) of marsh wetlands on the Bashang Plateau. This conclusion is highly consistent with the findings of existing studies in Inner Mongolia and North China of China. For instance, Jie et al. (2021) extracted information on marsh wetlands in the southern Mongolian Plateau and northern Bashang Plateau based on Landsat images from 2000 to 2018, and adopted a qualitative analysis approach, confirming that decreased precipitation and groundwater exploitation for agricultural irrigation are important driving factors for marsh wetland degradation [45]. Zheng et al. (2019) interpreted marsh wetland data in Inner Mongolia area located in the northern Bashang Plateau using Landsat images from 1993 to 2013 and conducted attribution research combining correlation analysis with generalized linear models, revealing that groundwater exploitation for agricultural irrigation cuts off the water supply to wetlands, leading to the decline in hydrological connectivity and the shrinkage of wetland area [46]. Li et al. (2023) analyzed the North China region by the AHP-EWM method based on multi-source data and Landsat-derived wetland extraction results from 2000 to 2020, also pointing out that groundwater exploitation for agricultural irrigation is the dominant factor for wetland degradation in this region [47].
These studies, conducted across different time scales, spatial scopes and research methods, have consistently revealed the significant impact of groundwater exploitation for agricultural irrigation on wetland degradation. In comparison with existing achievements, this study further highlights the negative effect of water consumption from afforestation on marsh wetland degradation, and incorporates afforestation as a human factor into the analytical framework of wetland degradation driving mechanisms, thus enriching the causal system of regional wetland degradation.
In addition, this study performed downscaling reconstruction on the low-resolution ET data spanning nearly 30 years from 1986 to 2021 based on the random forest algorithm, and quantitatively analyzed the contributions of multiple factors to marsh wetland degradation by calculating EWC, thereby realizing a long-term, continuous attribution analysis of wetland degradation. This method not only overcomes the limitation that large-scale and long-term Earth science data are difficult to apply to fine research in small areas, but also avoids the deficiency of discontinuous time series in traditional remote sensing images, which can provide a methodological reference for the research on long-term wetland evolution in similar regions.
4.3. Impact of Afforestation and Crop Irrigation on Marsh Wetland Degradation
Previous studies have long identified cropland irrigation as a primary factor driving groundwater table declines, which in turn contribute to lake shrinkage and wetland degradation in the Bashang region. For instance, Zhu et al. (2022) found a significant positive correlation between the expansion of irrigated cropland and groundwater depletion, attributing wetland degradation mainly to irrigation [17]. Zhuang et al. (2024) further noted that the increase in irrigated cropland after 2000 accelerated groundwater depletion, leading to annual declines in water tables [19]. Our study similarly observed a slight increase in cropland evapotranspiration water consumption (EWC), despite a reduction in cropland area. This increase in EWC was found to Granger-cause a deepening of the groundwater table, directly influencing water availability for marsh wetlands. While the “Grain for Green Project” initiated in 2000 helped reduce some irrigation demands, ongoing agricultural water use continues to drive groundwater depletion.
In addition to cropland irrigation, our study highlights the significant role of afforestation in driving marsh wetland degradation—a factor that has been overlooked in previous research. Large-scale afforestation, particularly in arid regions like the Loess Plateau, China, has been shown to impact soil moisture and groundwater resources. For example, Wang et al. (2025) linked the decline in groundwater levels to increased tree transpiration post-afforestation, compounded by insufficient rainfall replenishment [48]. Jiao et al. (2017) demonstrated that afforestation in arid areas can substantially reduce soil water content [49], while Schwärzel et al. (2020) reported that plantation expansion on the Loess Plateau increased soil water consumption, reduced infiltration, and lowered groundwater recharge by over 66%, especially in low precipitation conditions [50]. As evapotranspiration approaches or exceeds precipitation in forested areas, the risk of water deficit intensifies. Despite this knowledge, the impact of afforestation on water resources in the Bashang region has not been previously addressed.
The dominant afforestation species in Bashang, poplar, is known for its deep roots, which can penetrate 3 to 5 m into the ground, potentially leading to long-term groundwater extraction and the formation of persistent dry soil layers [51]. Additionally, Cao et al. (2018) emphasized that the ecological water requirements of vegetation increase with age in arid and semi-arid regions [52]. This mechanism likely contributes to the observed groundwater declines associated with forest expansion in Bashang. Together with intensified irrigation and excessive groundwater extraction, afforestation exacerbates the hydrological stress on Bashang’s wetlands. High-evapotranspiration forests, which are deep-rooted and drought-resilient, outcompete surface water-dependent wetlands for water. This competitive disadvantage accelerates the passive loss and irreversible degradation of wetlands, particularly under conditions of reduced water inflow.
4.4. Implications
The Bashang Plateau marsh wetlands are vital biodiversity reserves in North China. Although small in area, these wetlands are ecologically significant, relying on periodic inundation and drying cycles that are heavily influenced by local hydrological conditions. Afforestation offers many ecological benefits, such as soil and water retention, windbreaks, and enhanced biodiversity. However, large-scale afforestation may disrupt these natural processes, posing a threat to wetland sustainability due to increased competition for water resources.
The species selected for afforestation play a crucial role in balancing ecological benefits with water consumption. Fast-growing species, like poplars, dominate recent afforestation efforts in the Bashang region, but these species have high water demands. Such high-water-consuming species exacerbate pressure on local water resources, particularly in water-scarce areas [53]. This increased water competition threatens the water availability necessary to sustain wetland ecosystems. To mitigate this issue, future afforestation should prioritize species with lower water consumption. Native species, such as Larix principis-rupprechtii, might be more suitable for the region as they require less water and are better adapted to local conditions [54].
In addition to selecting appropriate tree species, efficient water use in agriculture is essential. Inefficient irrigation, especially flood irrigation, continues to deplete groundwater resources. Improving irrigation practices can help reduce this depletion and improve overall water efficiency [55,56]. Restoration efforts for wetland ecosystems should also prioritize water replenishment through measures like inter-regional water transfer, rainwater harvesting, and stricter groundwater management [57].
For sustainable development in the Bashang region, it is essential to integrate water-efficient forestry practices with improved agricultural water management. By prioritizing native, low-water-consuming tree species and adopting efficient irrigation techniques, both wetland ecosystems and agricultural activities can coexist more sustainably, ensuring long-term water availability and ecological balance [58].
5. Conclusions
This study quantified the spatiotemporal dynamics of marsh wetland ecological water consumption (EWC) in the Bashang Plateau from 1986 to 2021 via downscaling GLASS ET data to 250 m monthly resolution using a Random Forest model, and identified the driving forces of EWC changes through Granger causality analysis. The downscaled ET data showed high consistency with in situ measurements, providing a reliable basis for accurate EWC estimation of different land cover types. Key conclusions of the study are as follows:
Marsh wetland area in the study area declined drastically by 74% during the research period, with a concomitant 67.2% reduction in EWC, while forestland area expanded by 217% and its EWC increased by 378%, presenting an obvious inverse trend with marsh wetland EWC.
Precipitation and surface water area are the direct driving factors for the decline of marsh wetland EWC, with lag effects of 2 and 4 years, respectively; groundwater table, forest and cropland EWC act as indirect drivers by affecting surface water availability and regional hydrological balance.
Large-scale afforestation-induced increase in forest EWC is a crucial overlooked factor for groundwater table decline in the Bashang Plateau, which, together with cropland irrigation water use, exacerbates the water competition pressure on marsh wetlands and drives their irreversible degradation.
In summary, the degradation of marsh wetlands in the semi-arid Bashang Plateau is the combined result of climatic change and human activities, with the excessive water consumption of artificially planted forests being a key human driving factor. Future ecological management in the region should balance afforestation and wetland protection, prioritize low-water-consumption native tree species for afforestation, optimize agricultural irrigation practices, and strengthen groundwater and surface water joint management. This study provides a scientific basis for the sustainable utilization of water resources and the ecological restoration of marsh wetlands in semi-arid plateau regions.
Author Contributions
Conceptualization, P.S. and Y.K.; methodology, C.L. (Chonglin Li) and P.S.; software, C.L. (Chonglin Li) and P.S.; validation, C.L. (Chonglin Li); investigation, W.S. (Wei Sun), W.S. (Wanbing Sun), D.L., C.L. (Chengli Liu) and J.H.; resources, Y.K., C.L. (Chonglin Li) and X.W.; data curation, C.L. (Chonglin Li); writing—original draft preparation, C.L. (Chonglin Li) and P.S.; writing—review and editing, Y.K.; visualization, C.L. (Chonglin Li); supervision, Y.K.; project administration, J.H.; funding acquisition, X.W. All authors have read and agreed to the published version of the manuscript.
Funding
This work was funded by The Kangbao Ecological Protection Think Tank Project by the Expert Team of Capital Normal University, China (Grant No. 011-24220010048) and The Earth Mother Special Fund Project of the China Green Carbon Foundation (Grant No. 010-18220010008).
Data Availability Statement
The original contributions presented in the study are included in the article. Further inquiries can be directed to the corresponding authors.
Acknowledgments
We would like to thank all co-authors and reviewers for their valuable suggestions regarding this research.
Conflicts of Interest
The authors declare no conflicts of interest.
References
- Davidson, N.C.; Van Dam, A.; Finlayson, C.; McInnes, R. Worth of wetlands: Revised global monetary values of coastal and inland wetland ecosystem services. Mar. Freshw. Res. 2019, 70, 1189–1194. [Google Scholar] [CrossRef] [Scilit]
- Zhang, X.; Wang, G.; Xue, B.; Zhang, M.; Tan, Z. Dynamic landscapes and the driving forces in the Yellow River Delta wetland region in the past four decades. Sci. Total Environ. 2021, 787, 147644. [Google Scholar] [CrossRef] [Scilit] [PubMed]
- Zhao, D.; Wan, D.; Yang, J.; Liu, J.; Yong, Z.; Ma, C. Effects of restoration years on soil nitrogen and phosphorus in inland salt marshes. PeerJ 2024, 12, e16766. [Google Scholar] [CrossRef] [Scilit]
- Mao, D.; Yang, H.; Wang, Z.; Song, K.; Thompson, J.R.; Flower, R.J. Reverse the hidden loss of China’s wetlands. Science 2022, 376, 1061. [Google Scholar] [CrossRef] [Scilit]
- Mao, D.; Wang, M.; Wang, Y.; Jiang, M.; Yuan, W.; Luo, L.; Feng, K.; Wang, D.; Xiang, H.; Ren, Y.; et al. The trajectory of wetland change in China between 1980 and 2020: Hidden losses and restoration effects. Sci. Bull. 2025, 70, 587–596. [Google Scholar] [CrossRef] [Scilit]
- Hu, S.; Niu, Z.; Chen, Y.; Li, L.; Zhang, H. Global wetlands: Potential distribution, wetland loss, and status. Sci. Total Environ. 2017, 586, 319–327. [Google Scholar] [CrossRef] [Scilit]
- Williams, L.; Phene, C.; Grimes, D.; Trout, T. Water use of mature Thompson Seedless grapevines in California. Irrig. Sci. 2003, 22, 11–18. [Google Scholar] [CrossRef] [Scilit]
- Mohan, M.P.; Kanchirapuzha, R.; Varma, M.R. Review of approaches for the estimation of sensible heat flux in remote sensing-based evapotranspiration models. J. Appl. Remote Sens. 2020, 14, 041501. [Google Scholar] [CrossRef] [Scilit]
- Miralles, D.G.; Holmes, T.; De Jeu, R.; Gash, J.; Meesters, A.; Dolman, A. Global land-surface evaporation estimated from satellite-based observations. Hydrol. Earth Syst. Sci. 2011, 15, 453–469. [Google Scholar] [CrossRef] [Scilit]
- Running, S.; Mu, Q.; Zhao, M. MODIS/terra net evapotranspiration 8-day L4 global 500m SIN grid V061. In NASA EOSDIS Land Processes Distributed Active Archive Center (DAAC) Data Set; U.S. Geological Survey (USGS): Reston, VA, USA; NASA: Washington, DC, USA, 2021; MOD16A12. 061. [Google Scholar]
- Zheng, C.; Jia, L.; Hu, G. Global land surface evapotranspiration monitoring by ETMonitor model driven by multi-source satellite earth observations. J. Hydrol. 2022, 613, 128444. [Google Scholar] [CrossRef] [Scilit]
- Liang, S.; Chen, X.; Chen, Y.; Cheng, J.; Jia, K.; Jiang, B.; Li, B.; Liu, Q.; Ma, H.; Song, L.; et al. Updates on global Land surface satellite (GLASS) products suite. J. Remote Sens. 2023, 27, 831–856. [Google Scholar] [CrossRef] [Scilit]
- Long, X.; Cui, Y. Spatially downscaling a global evapotranspiration product for end user using a deep neural network: A case study with the GLEAM product. Remote Sens. 2022, 14, 658. [Google Scholar] [CrossRef] [Scilit]
- Ke, Y.; Im, J.; Park, S.; Gong, H. Downscaling of MODIS one kilometer evapotranspiration using Landsat-8 data and machine learning approaches. Remote Sens. 2016, 8, 215. [Google Scholar] [CrossRef] [Scilit]
- Tan, S.; Wu, B.; Yan, N. A method for downscaling daily evapotranspiration based on 30-m surface resistance. J. Hydrol. 2019, 577, 123882. [Google Scholar] [CrossRef] [Scilit]
- Zhuo, Z.; Ke, Y.; Hong, J.; Zhu, L.; Zhang, Y. Ecosystem Service Values and Their Changes of Bashang Plateau, Zhangjiakou since 2000. Wetland Sci. 2022, 20, 162–175. [Google Scholar] [CrossRef]
- Zhu, L.; Ke, Y.; Hong, J.; Zhang, Y.; Pan, Y. Assessing degradation of lake wetlands in Bashang Plateau, China based on long-term time series Landsat images using wetland degradation index. Ecol. Indic. 2022, 139, 108903. [Google Scholar] [CrossRef] [Scilit]
- Liu, M.; Jiang, Y.; Xu, X.; Huang, Q.; Huo, Z.; Huang, G. Long-term groundwater dynamics affected by intense agricultural activities in oasis areas of arid inland river basins, Northwest China. Agric. Water Manag. 2018, 203, 37–52. [Google Scholar] [CrossRef] [Scilit]
- Zhuang, Q.; Wang, J.; Pu, X.; Zhang, Y.; Gong, S.; Wang, X.; Zhang, L. Wetland Degradation Characteristics and Risk Assessment in Bashang Region of Zhangjiakou. Environ. Sci. Technol. 2024, 47, 196–205. [Google Scholar]
- Sun, M.; Xiao, D.; Lu, Y.; Bai, H.; Pan, P.; Zhang, M.; Yin, X.; Tan, H.; Wang, C. Spatiotemporal Evolution of Agricultural Land Systems in the North China Plain Over Two Decades (2002–2022). Land Degrad. Dev. 2025. early access. [Google Scholar] [CrossRef] [Scilit]
- Mirzaei, A.; Zibaei, M. Water conflict management between agriculture and wetland under climate change: Application of economic-hydrological-behavioral modelling. Water Resour. Manag. 2021, 35, 1–21. [Google Scholar] [CrossRef] [Scilit]
- Chen, P.; Zhang, B.; Ma, R.; Shi, J.; Si, L.t.; Wu, J.; Zhao, L. Ecosystem degradation risk based on health and resilience: A case study of Chahannur Lake basin on Bashang Plateau. Geol. China 2024, 51, 1034–1045. [Google Scholar] [CrossRef]
- Hu, W.; Zhang, X.; Chen, Y.; Yu, Z.; Duan, M. Herb diversity and its impact factors in different periods from 1970s to 2000s of the conversion of farmland to forests project in the Bashang Area of North China. Acta Ecol. Sin. 2021, 41, 1116–1126. [Google Scholar] [CrossRef] [Scilit]
- Li, Y.Z.; Chen, X.S.; Xie, Y.H.; Li, X.; Li, F.; Hou, Z.Y. Effects of young poplar plantations on understory plant diversity in the Dongting Lake wetlands, China. Sci. Rep. 2014, 4, 6339. [Google Scholar] [CrossRef] [Scilit]
- Zhu, W.; Zhou, O.; Sun, Y.; Li, X.; Di, N.; Li, D.; Yilihamu, G.; Wang, Y.; Fu, J.; Xi, B.; et al. Effects of stand age and structure on root distribution and root water uptake in fast-growing poplar plantations. J. Hydrol. 2023, 616, 128831. [Google Scholar] [CrossRef] [Scilit]
- Yao, Y.; Liang, S.; Li, X.; Hong, Y.; Fisher, J.B.; Zhang, N.; Chen, J.; Cheng, J.; Zhao, S.; Zhang, X.; et al. Bayesian multimodel estimation of global terrestrial latent heat flux from eddy covariance, meteorological, and satellite observations. J. Geophys. Res. Atmos. 2014, 119, 4521–4545. [Google Scholar] [CrossRef] [Scilit]
- Yao, Y.; Liang, S.; Li, X.; Chen, J.; Wang, K.; Jia, K.; Cheng, J.; Jiang, B.; Fisher, J.B.; Mu, Q.; et al. A satellite-based hybrid algorithm to determine the Priestley–Taylor parameter for global terrestrial latent heat flux estimation across multiple biomes. Remote Sens. Environ. 2015, 165, 216–233. [Google Scholar] [CrossRef] [Scilit]
- Xu, X.; Liu, J.; Zhang, S.; Li, R.; Yan, C.; Wu, S. China’s Multi-Period Land Use Land Cover Remote Sensing Monitoring Data Set (CNLUCC); Resource and Environment Data Cloud Platform: Beijing, China, 2018. [Google Scholar]
- Tu, Y.; Wu, S.; Chen, B.; Weng, Q.; Bai, Y.; Yang, J.; Yu, L.; Xu, B. A 30 m annual cropland dataset of China from 1986 to 2021. Earth Syst. Sci. Data 2024, 16, 2297–2316. [Google Scholar] [CrossRef] [Scilit]
- Yang, J.; Huang, X. The 30 m annual land cover and its dynamics in China from 1990 to 2019. Earth Syst. Sci. Data Discuss 2021, 13, 3907–3925. [Google Scholar] [CrossRef] [Scilit]
- Ma, Z.; Dong, C.; Lin, K.; Yan, Y.; Luo, J.; Jiang, D.; Chen, X. A Global 250-m Downscaled NDVI Product from 1982 to 2018. Remote Sens. 2022, 14, 3639. [Google Scholar] [CrossRef] [Scilit]
- Ouyang, Z.; Zhou, C.; Xie, J.; Zhu, J.; Zhang, G.; Ao, M. SRTM DEM correction using ensemble machine learning algorithm. Remote Sens. 2023, 15, 3946. [Google Scholar] [CrossRef] [Scilit]
- Pastorello, G.; Trotta, C.; Canfora, E.; Chu, H.; Christianson, D.; Cheah, Y.-W.; Poindexter, C.; Chen, J.; Elbashandy, A.; Humphrey, M. The FLUXNET2015 dataset and the ONEFlux processing pipeline for eddy covariance data. Sci. Data 2020, 7, 225. [Google Scholar] [CrossRef] [Scilit]
- Zhao, Y.; Luo, Z.; Yu, Y.; Chen, Y.; Zhang, S.; Zhang, Q. Spatio-temporal changes of groundwater level and its driving factors in a typical region of Beijing-Tianjin-Hebei region, China. J. Nat. Resour. 2020, 35, 1301–1313. [Google Scholar] [CrossRef] [Scilit]
- Chen, L.; He, Q.; Liu, K.; Li, J.; Jing, C. Downscaling of GRACE-derived groundwater storage based on the random forest model. Remote Sens. 2019, 11, 2979. [Google Scholar] [CrossRef] [Scilit]
- Palimkar, P.; Shaw, R.N.; Ghosh, A. Machine learning technique to prognosis diabetes disease: Random forest classifier approach. In Advanced Computing and Intelligent Technologies: Proceedings of ICACIT 2021; Springer: Berlin/Heidelberg, Germany, 2021. [Google Scholar]
- Gao, S.; Lü, Y.; Jiang, X. Increased precipitation and vegetation cover synergistically enhanced the availability and effectiveness of water resources in a dryland region. J. Hydrol. 2025, 654, 132812. [Google Scholar] [CrossRef] [Scilit]
- Wei, X.; Huang, Q.; Huang, S.; Leng, G.; Qu, Y.; Deng, M.; Han, Z.; Zhao, J.; Liu, D.; Bai, Q. Assessing the feedback relationship between vegetation and soil moisture over the Loess Plateau, China. Ecol. Indic. 2022, 134, 108493. [Google Scholar] [CrossRef] [Scilit]
- Amani, S.; Shafizadeh-Moghadam, H. A review of machine learning models and influential factors for estimating evapotranspiration using remote sensing and ground-based data. Agric. Water Manag. 2023, 284, 108324. [Google Scholar] [CrossRef] [Scilit]
- Guo, K.; He, Z.; Liang, X.; Chen, X.; Luo, R.; Qiu, T.; Zhang, K. Examining Relationships between Regional Ecological Risk and Land Use Using the Granger Causality Test Applied to a Mining City, Daye, China. Land 2023, 12, 2060. [Google Scholar] [CrossRef] [Scilit]
- Zolghadr-Asli, B.; Enayati, M.; Pourghasemi, H.R.; Naghdyzadegan Jahromi, M.; Tiefenbacher, J.P. Application of Granger-causality to study the climate change impacts on depletion patterns of inland water bodies. Hydrol. Sci. J. 2021, 66, 1767–1776. [Google Scholar] [CrossRef] [Scilit]
- Gebremichael, M.; Wang, J.; Sammis, T.W. Dependence of remote sensing evapotranspiration algorithm on spatial resolution. Atmos. Res. 2010, 96, 489–495. [Google Scholar] [CrossRef] [Scilit]
- Ma, Y.; Liu, S.; Song, L.; Xu, Z.; Liu, Y.; Xu, T.; Zhu, Z. Estimation of daily evapotranspiration and irrigation water efficiency at a Landsat-like scale for an arid irrigation area using multi-source remote sensing data. Remote Sens. Environ. 2018, 216, 715–734. [Google Scholar] [CrossRef] [Scilit]
- Meng, Y.; Jiang, P.; Dong, W. Progress in the evapotranspiration estimation using remotely sensed data. Remote Sens. Technol. Appl. 2022, 37, 839–853. [Google Scholar]
- Jie, W.-H.; Xiao, C.-L.; Zhang, C.; Zhang, E.; Li, J.-Y.; Wang, B.; Niu, H.-W.; Dong, S.-F. Remote sensing-based dynamic monitoring and environmental change of wetlands in southern Mongolian Plateau in 2000–2018. China Geol. 2021, 4, 353–363. [Google Scholar]
- Zheng, Y.; Liu, H.; Zhuo, Y.; Li, Z.; Liang, C.; Wang, L. Dynamic changes and driving factors of wetlands in Inner Mongolia Plateau, China. PLoS ONE 2019, 14, e0221177. [Google Scholar] [CrossRef] [Scilit]
- Li, Y.; Lu, C.; Liu, G.; Chen, Y.; Zhang, Y.; Wu, C.; Liu, B.; Shu, L. Risk assessment of wetland degradation in the Xiong’an New Area based on AHP-EWM-ICT method. Ecol. Indic. 2023, 153, 110443. [Google Scholar] [CrossRef] [Scilit]
- Wang, X.; Zhang, F.; Chan, N.; Liu, M.; Johnson, V.C. Decreasing terrestrial water storage limited the increase of woody plant structure resulting from afforestation in the Loess Plateau, China. J. Environ. Manag. 2025, 395, 127873. [Google Scholar] [CrossRef] [Scilit]
- Jiao, R.; Zhao, Y.; Si, B.; Lan, Z.; Zhang, J. Effects of conversion of cropland to forest measures on deep soil moisture in Loess Plateau. Agric. Res. Arid Areas 2017, 35, 129–135. [Google Scholar] [CrossRef]
- Schwärzel, K.; Zhang, L.; Montanarella, L.; Wang, Y.; Sun, G. How afforestation affects the water cycle in drylands: A process-based comparative analysis. Glob. Change Biol. 2020, 26, 944–959. [Google Scholar] [CrossRef] [Scilit]
- Wang, Q.; Zhao, Y.; Wang, H.; Zhai, J.; Zhang, Y.; He, F.; Liu, R.; Ma, M. Surface water resource attenuation attribution and patterns in Hai River Basin. Sci. China Earth Sci. 2024, 67, 1545–1560. [Google Scholar] [CrossRef] [Scilit]
- Cao, J.; Tian, H.; Adamowski, J.F.; Zhang, X.; Cao, Z.J. Influences of afforestation policies on soil moisture content in China’s arid and semi-arid regions. Land Use Policy 2018, 75, 449–458. [Google Scholar] [CrossRef] [Scilit]
- Huang, F.; Li, D.; Wang, B.; Xiang, W.; Guo, Y.; Wen, S.; CHen, T.; Li, X. Foliar stable carbon isotope composition and water use efficiency of plant in the Karst seasonal rain forest. Chin. J. Appl. Ecol. 2019, 30, 1833–1839. [Google Scholar] [CrossRef]
- Frost, M.D.; Trimas, G.E.; Johnston, K.A.; Bunch, Z.L.; Jolin, A.D.; Koerner, S.E. Native plant species exhibit consistent drought advantage over introduced species until additional global change drivers are included: A grassland meta-analysis. J. Ecol. 2025, 113, 2698–2711. [Google Scholar] [CrossRef] [Scilit]
- Jägermeyr, J.; Gerten, D.; Heinke, J.; Schaphoff, S.; Kummu, M.; Lucht, W. Water savings potentials of irrigation systems: Global simulation of processes and linkages. Hydrol. Earth Syst. Sci. 2015, 19, 3073–3091. [Google Scholar] [CrossRef] [Scilit]
- Santini, A.; Masiero, M.; Amato, G.; Pettenella, D.M. From Flood to Drip Irrigation: A Review of Irrigation Modernization Trade-Offs. Water 2025, 17, 3018. [Google Scholar] [CrossRef] [Scilit]
- Pu, Z.; Bai, J.; Zhang, Q.; Tian, K.; Yang, W.; Zhao, Y.-W. Ecological water replenishment through optimal allocation of lake water in water-scarce areas based on channel selection and replenishment period: A case study of China’s Baiyangdian Lake. Sci. Total Environ. 2024, 956, 177340. [Google Scholar] [CrossRef] [Scilit]
- Cao, S.; Shang, D.; Yue, H.; Ma, H. A win-win strategy for ecological restoration and biodiversity conservation in Southern China. Environ. Res. Lett. 2017, 12, 044004. [Google Scholar] [CrossRef] [Scilit]

Disclaimer/Publisher’s Note: The statements, opinions and data contained in all publications are solely those of the individual author(s) and contributor(s) and not of MDPI and/or the editor(s). MDPI and/or the editor(s) disclaim responsibility for any injury to people or property resulting from any ideas, methods, instructions or products referred to in the content. |
© 2026 by the authors. Licensee MDPI, Basel, Switzerland. This article is an open access article distributed under the terms and conditions of the Creative Commons Attribution (CC BY) license.