


Abstract
The uneven distribution of populations within urban and rural built-up areas restricts balanced regional development. This study employs statistical data from 296 cities in China covering the years 2010, 2015, and 2020 to analyze the coupling coordination relationship of population density in urban and rural built-up land and its influencing factors. The findings reveal the following: (1) Throughout the study period, population density in urban built-up areas (PUL) experienced a slow increase, whereas population density in rural built-up areas (PRL) declined rapidly. (2) Spatially, high levels of coupling coordination in population density between urban and rural built-up areas are primarily concentrated in the southwestern region, particularly in Sichuan, demonstrating a trend of gradual diffusion from the core to the periphery. Overall, a southwest-high to northeast-low pattern emerged. (3) The regression results indicate that economic development, agricultural structure, public services, and urbanization significantly affect the coupling coordination of population densities in urban and rural built-up areas. Among natural conditions, both elevation and temperature show significantly positive effects. This research provides theoretical foundations and policy recommendations for promoting urban-rural integrated development and achieving regional sustainable development.
1. Introduction
In the context of globalization and rapid urbanization, urban and rural areas have emerged as core drivers of socio-economic development, increasingly becoming central considerations in the pursuit of regional sustainable development [1,2]. Built-up land, which serves as the spatial medium for the flow of urban and rural elements, is a crucial link in promoting urban-rural integration [3]. Meanwhile, the permanent resident population, as the backbone of socio-economic activities in both urban and rural settings, constitutes the primary driving force behind coordinated regional development [4]. Recently, the urbanization process in China has accelerated significantly, resulting in a surge in the urban population [5] and a rapid expansion of built-up land [6]. Conversely, rural areas face a dual dilemma of population outflow [7] and inefficient land use [8]. The lack of coordination in population density between urban and rural built-up areas poses severe challenges to social harmony and sustainable economic development [9].
At present, the divergent trajectory of population density across urban and rural built-up areas has given rise to a series of structural tensions [10]. On the one hand, excessive population concentration in some urban built-up areas has made “urban maladies”—traffic congestion, environmental pollution, and resource scarcity—increasingly salient [11,12,13]. On the other hand, the “hollowing out” of rural built-up areas has intensified, with cultivated land abandonment and idle infrastructure constraining the advance of the rural revitalization strategy [13,14,15]. This spatial imbalance not only weakens the complementarity between urban and rural factors but also imposes substantive constraints on balanced regional socioeconomic development [10,16]. Although existing studies have examined the drivers of urbanization and patterns of urban–rural population mobility [17,18], systematic analyses of the coupling–coordination relationship of population density between urban and rural built-up areas remain limited, particularly with respect to its spatiotemporal evolution and multidimensional determinants [19,20,21].
Differences in urban-rural population density are inherently reasonable. However, when such differences are accompanied by a continuous decline in the population of rural built-up areas, intensifying rural hollowing-out, and the outward expansion of urban built-up areas, it often indicates a divergence in the evolution of population carrying intensity between urban and rural areas and a decrease in the coordination of the population density structure. To characterize this relationship, this study constructs two indicators, respectively: the ratio of urban permanent resident population to urban built-up land area (PUL), and the ratio of agricultural population to rural built-up land area (PRL), which are used to reflect the population carrying intensity of urban and rural built-up areas. A relatively high PUL usually implies a high intensity of urban population agglomeration, which may be accompanied by increased pressure on infrastructure load and public services. In contrast, a relatively low PUL indicates that the expansion of built-up land outpaces population growth, which is likely to lead to low-density sprawl and a decline in land use efficiency. Comparatively, PRL is used to characterize the relationship between rural population and built-up land occupation. A low PRL may not only reflect the relative abundance of rural built-up land but also point to problems such as settlement vacancy, impeded land withdrawal, and low efficiency of resource allocation against the backdrop of population outflow.
On this basis, this study constructs the coupling coordination degree (D) of population carrying intensity in urban and rural built-up areas, which is used to characterize the synchrony of PUL and PRL in terms of the direction and magnitude of change, i.e., the degree of coordinated evolution of population-built land carrying intensity in urban and rural areas during the adjustment process.
Notably, the coordination of urban–rural population density examined in this study has a well-defined theoretical boundary. Its core lies in measuring the synchronicity and interactive order (i.e., coordination) between urban and rural populations and built-up land during the process of change, rather than the equality or convergence of their density values (i.e., convergence). Coordination reflects the orderliness of the system’s adjustment process, while convergence focuses on the proximity of state outcomes. Reasonable differences in urban–rural density exist due to variations in location, function, and agglomeration economies. Therefore, the coupling coordination degree model constructed in this paper aims to diagnose the quality of the dynamic adjustment process of the urban–rural system, rather than presupposing a static goal that urban and rural densities should converge.
The organization of the study is as follows: Section 2 presents the coupling framework for population density in urban and rural built-up areas and the analysis framework for influencing factors. Section 3 introduces the materials and methods used in this study. Section 4 presents the results of the analysis. Section 5 discusses the findings and offers potential policy recommendations. Section 6 summarizes the main research conclusions.
2. Literature Review
2.1. Theoretical Foundations
The interaction between the urban-rural population distribution and the configuration of spatial forms has long been a core research topic in human geography and regional economics. In terms of the theoretical foundation, the core-periphery theory regards cities as cores of regional factor agglomeration, emphasizing that cities exert a continuous attraction on surrounding rural areas through employment opportunities, public services, and market scale, thus leading to a gradient distribution of population and economic activities in space. This provides a basic framework for understanding the differences and evolution of population density in urban and rural built-up areas [22]. On this basis, the new economic geography further reveals that economies of scale and market potential will strengthen the co-agglomeration of capital, technology and labor, resulting in an endogenous imbalance in population distribution. Meanwhile, the reduction in transportation costs, industrial spillover and factor diffusion may drive the transfer of some activities to the periphery, forming a phased rebalancing [23]. Aligned with the aforementioned theories that emphasize the mechanisms of difference generation, the urban-rural continuum perspective posits that urban and rural areas are not a binary opposition but rather exhibit functional connections and gradient transitions. Adjustments in population and land use should be understood as a process of structural reorganization along a continuous spectrum. Therefore, the key to evaluating urban-rural relations lies not in the existence of density differences themselves, but in whether population changes and the expansion of built-up land can form a relatively consistent adjustment rhythm and matching relationship.
Following this theoretical line, the analytical framework of this paper further extends insights from the dissolution of the Lewis dual-structure theory and the spatial equilibrium theory in new economic geography. Classical arguments suggest that cities, benefiting from industrial agglomeration effects, generate locational premiums that attract rural labor inflows and raise urban population density. However, once urban population density exceeds the carrying capacity of land resources, urban diseases may emerge. The marginal returns to further agglomeration then diminish, and population may flow back to rural areas where infrastructure is gradually improving. Meanwhile, China’s rural revitalization strategy promotes the downward movement of capital, technology, and other factors into rural areas. Rural industrial upgrading enhances rural population-carrying capacity, supporting a steady increase in rural population density. Accordingly, the convergence referred to in this paper denotes a dynamic equilibrium under two-way factor flows between urban and rural areas, rather than static numerical equality. In addition, the rural built-up areas examined here are not traditional dispersed agricultural settlements. They refer instead to rural agglomerations with industrial support and infrastructure provision, such as central villages and characteristic small towns. The population density of such areas is driven by industrial agglomeration and factor inflows, which may gradually narrow the gap with urban built-up areas. This is an important manifestation of urban–rural integration.
Based on the aforementioned theoretical context, this study employs the coupling coordination degree model to measure D, aiming to reveal the collaborative evolutionary order of the urban-rural system. Among them, “coordination” emphasizes the unity of interaction intensity and comprehensive development level, which is not equivalent to the numerical convergence of urban and rural population densities but highlights the matching of change trajectories and the avoidance of inefficient traps. Therefore, promoting the coordinated and orderly evolution of PUL and PRL is an important prerequisite for achieving healthy urbanization, improving the efficiency of territorial space utilization, and supporting urban-rural integrated development.
2.2. Research Progress
Aligned with this theoretical lineage, the literature relevant to this study can be grouped into three strands. (1) Urban built-up land and population. With accelerating urbanization, the interactions between urban built-up land and population have grown tighter and more complex. Prior work probes the links among the scale, structure, and spatial layout of urban built-up land and population growth/migration [24] and traces the roots of land–population mismatch from the perspectives of economic fundamentals [25], government decision-making and land finance [26], and regional differentiation [27]. (2) Rural settlements and population. Irrational urbanization and institutional barriers have induced recurrent rural land problems [28]. As spatial carriers of production and social relations, rural settlements are closely coupled with both the size and structure of the rural population [29,30], with research engaging themes such as rural revitalization [31], population aging [32], and labor transfer [33]. (3) Urban–rural integrated development. This strand seeks to dismantle the dual structure so that factors can flow freely, resources be shared, and functions complement one another. Qualitative studies elucidate the connotations and theoretical logics of integration and unpack practical dilemmas and pathways [34,35]. Quantitative studies cover level measurement [36], spatiotemporal evolution [37], drivers [38], and obstacle diagnosis [39], and make broad use of tools such as the coupling-coordination degree (CCD) model [40], the Theil index [41], scaling approaches [42], and spatial autocorrelation [43].
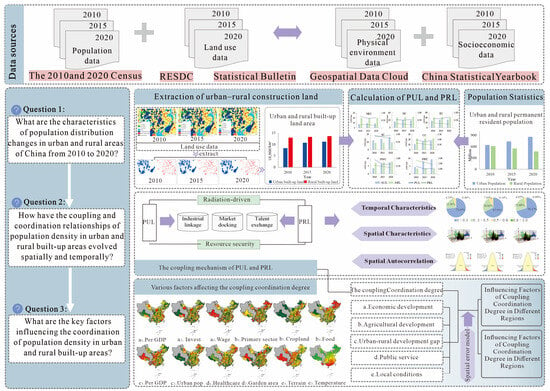
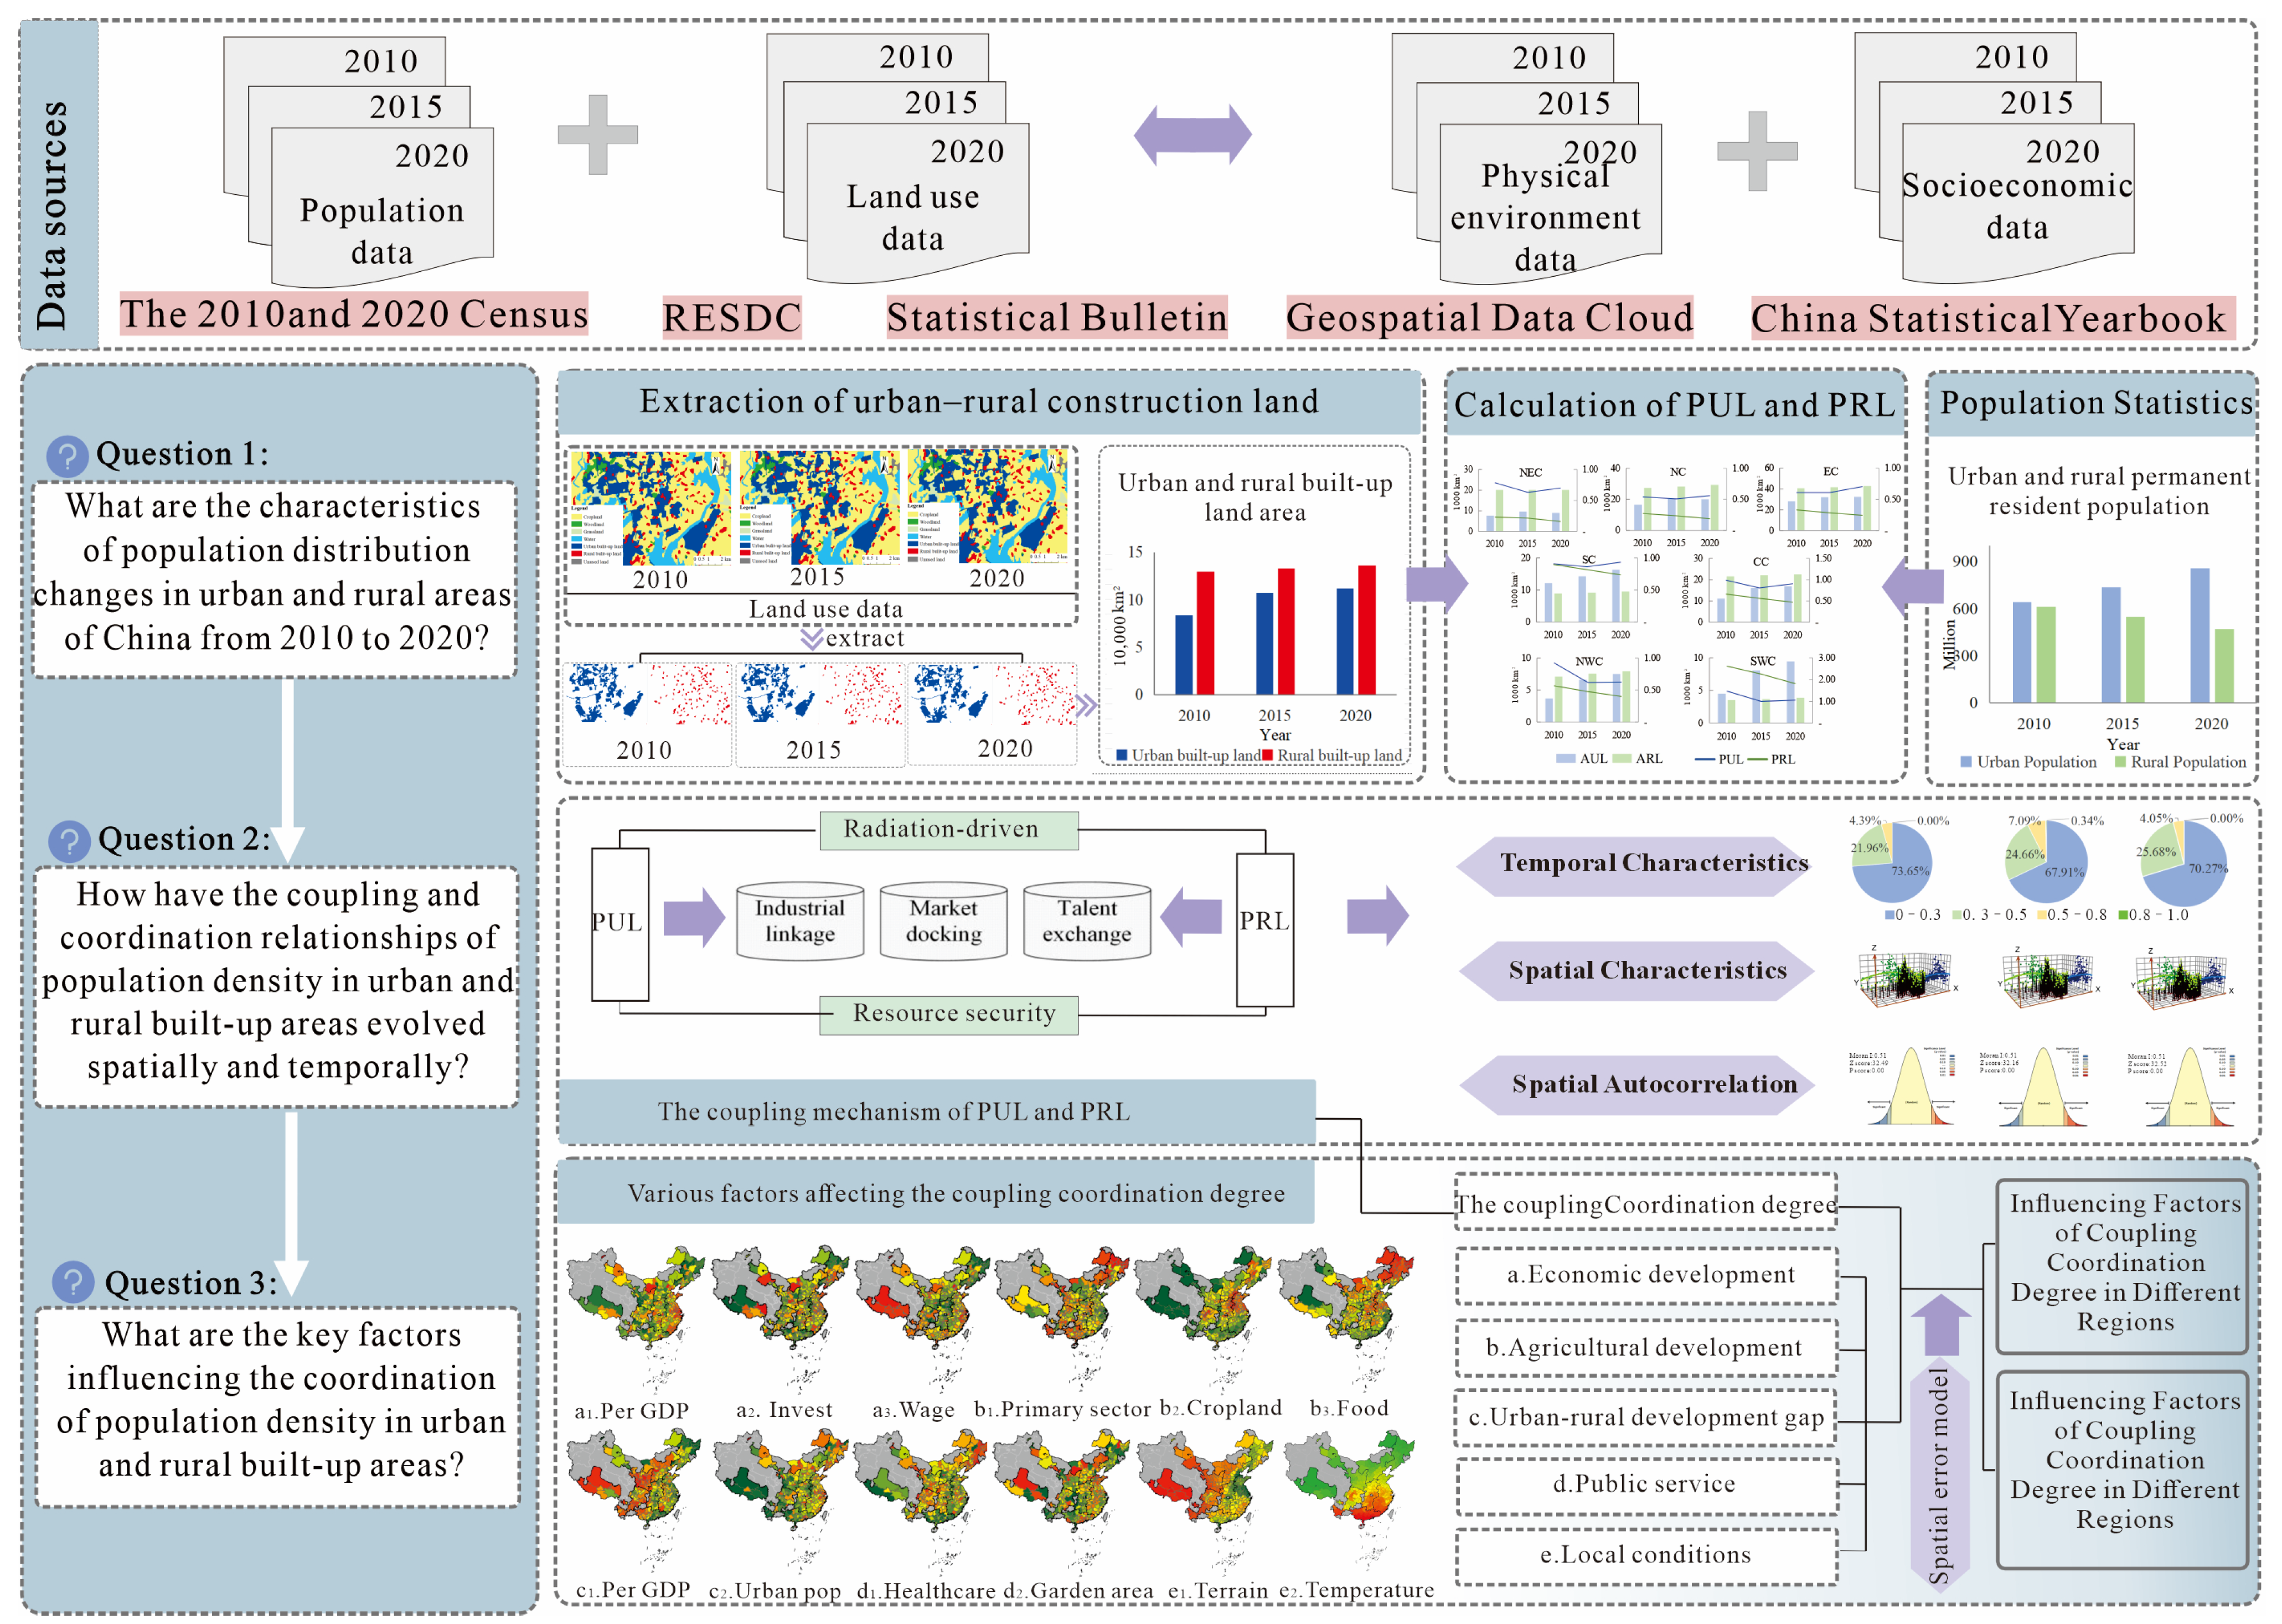
Accordingly, using cross-sections for 2010, 2015, and 2020 and a sample of 296 prefecture-level and above cities, this study develops a coupling–coordination framework for the PUL–PRL dual system. We integrate multidimensional determinants to identify the directions of influence and their spatial heterogeneity in shaping coupling–coordination. The aim is to provide empirically grounded evidence and policy insights, under a consistent measurement framework, for urban–rural integration and regional sustainable development (Figure 1). We address three questions:
Figure 1.
Analytical framework.
- (1)
- What are the patterns of change in urban and rural population distribution in China from 2010 to 2020?
- (2)
- How has the coupling–coordination between population densities in urban and rural built-up areas evolved across space and time?
- (3)
- Which factors most strongly promote or hinder coordination between urban and rural population densities in built-up areas?
2.3. Framework for Constructing Influence Factors
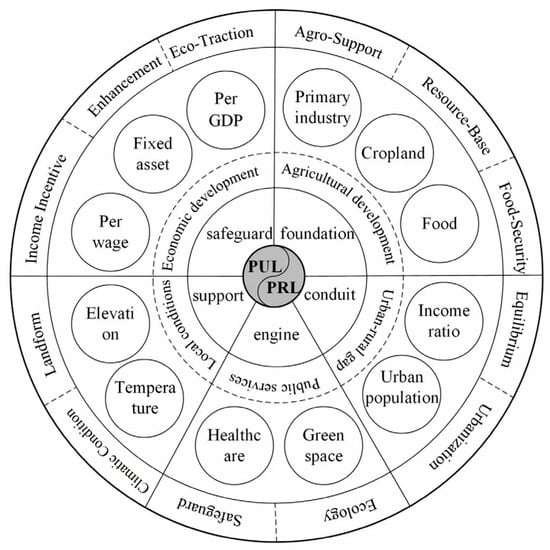
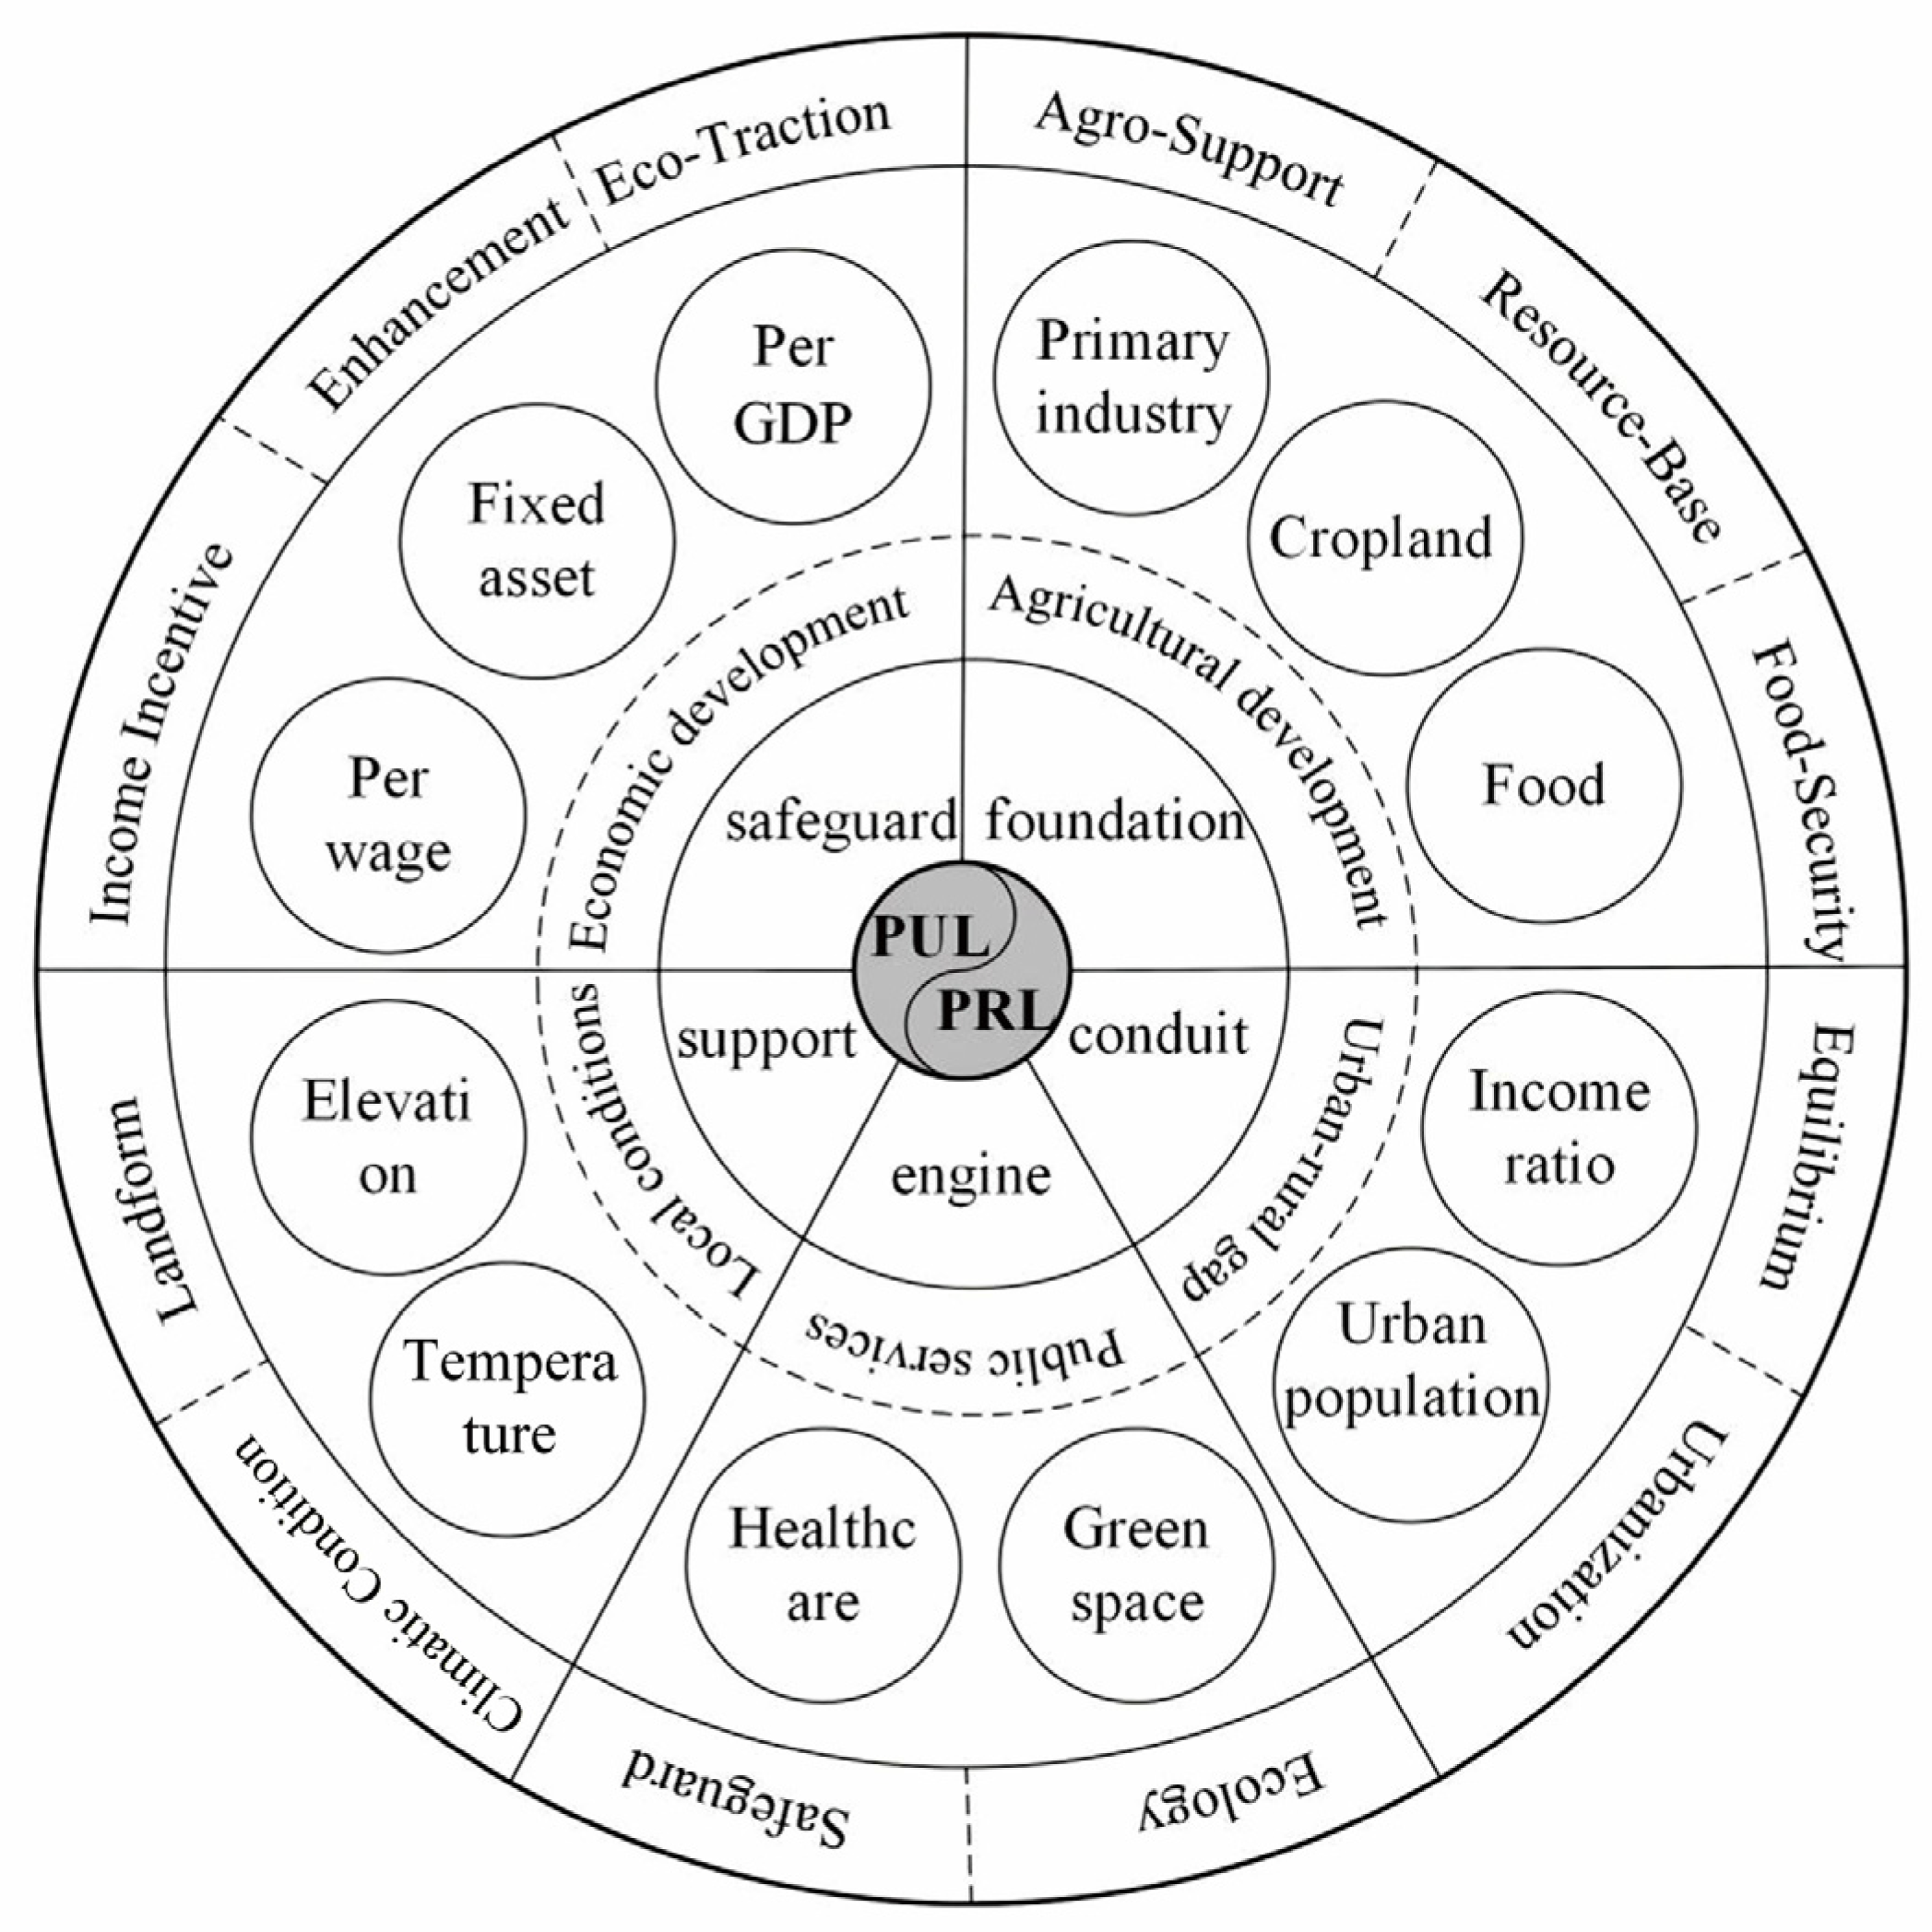
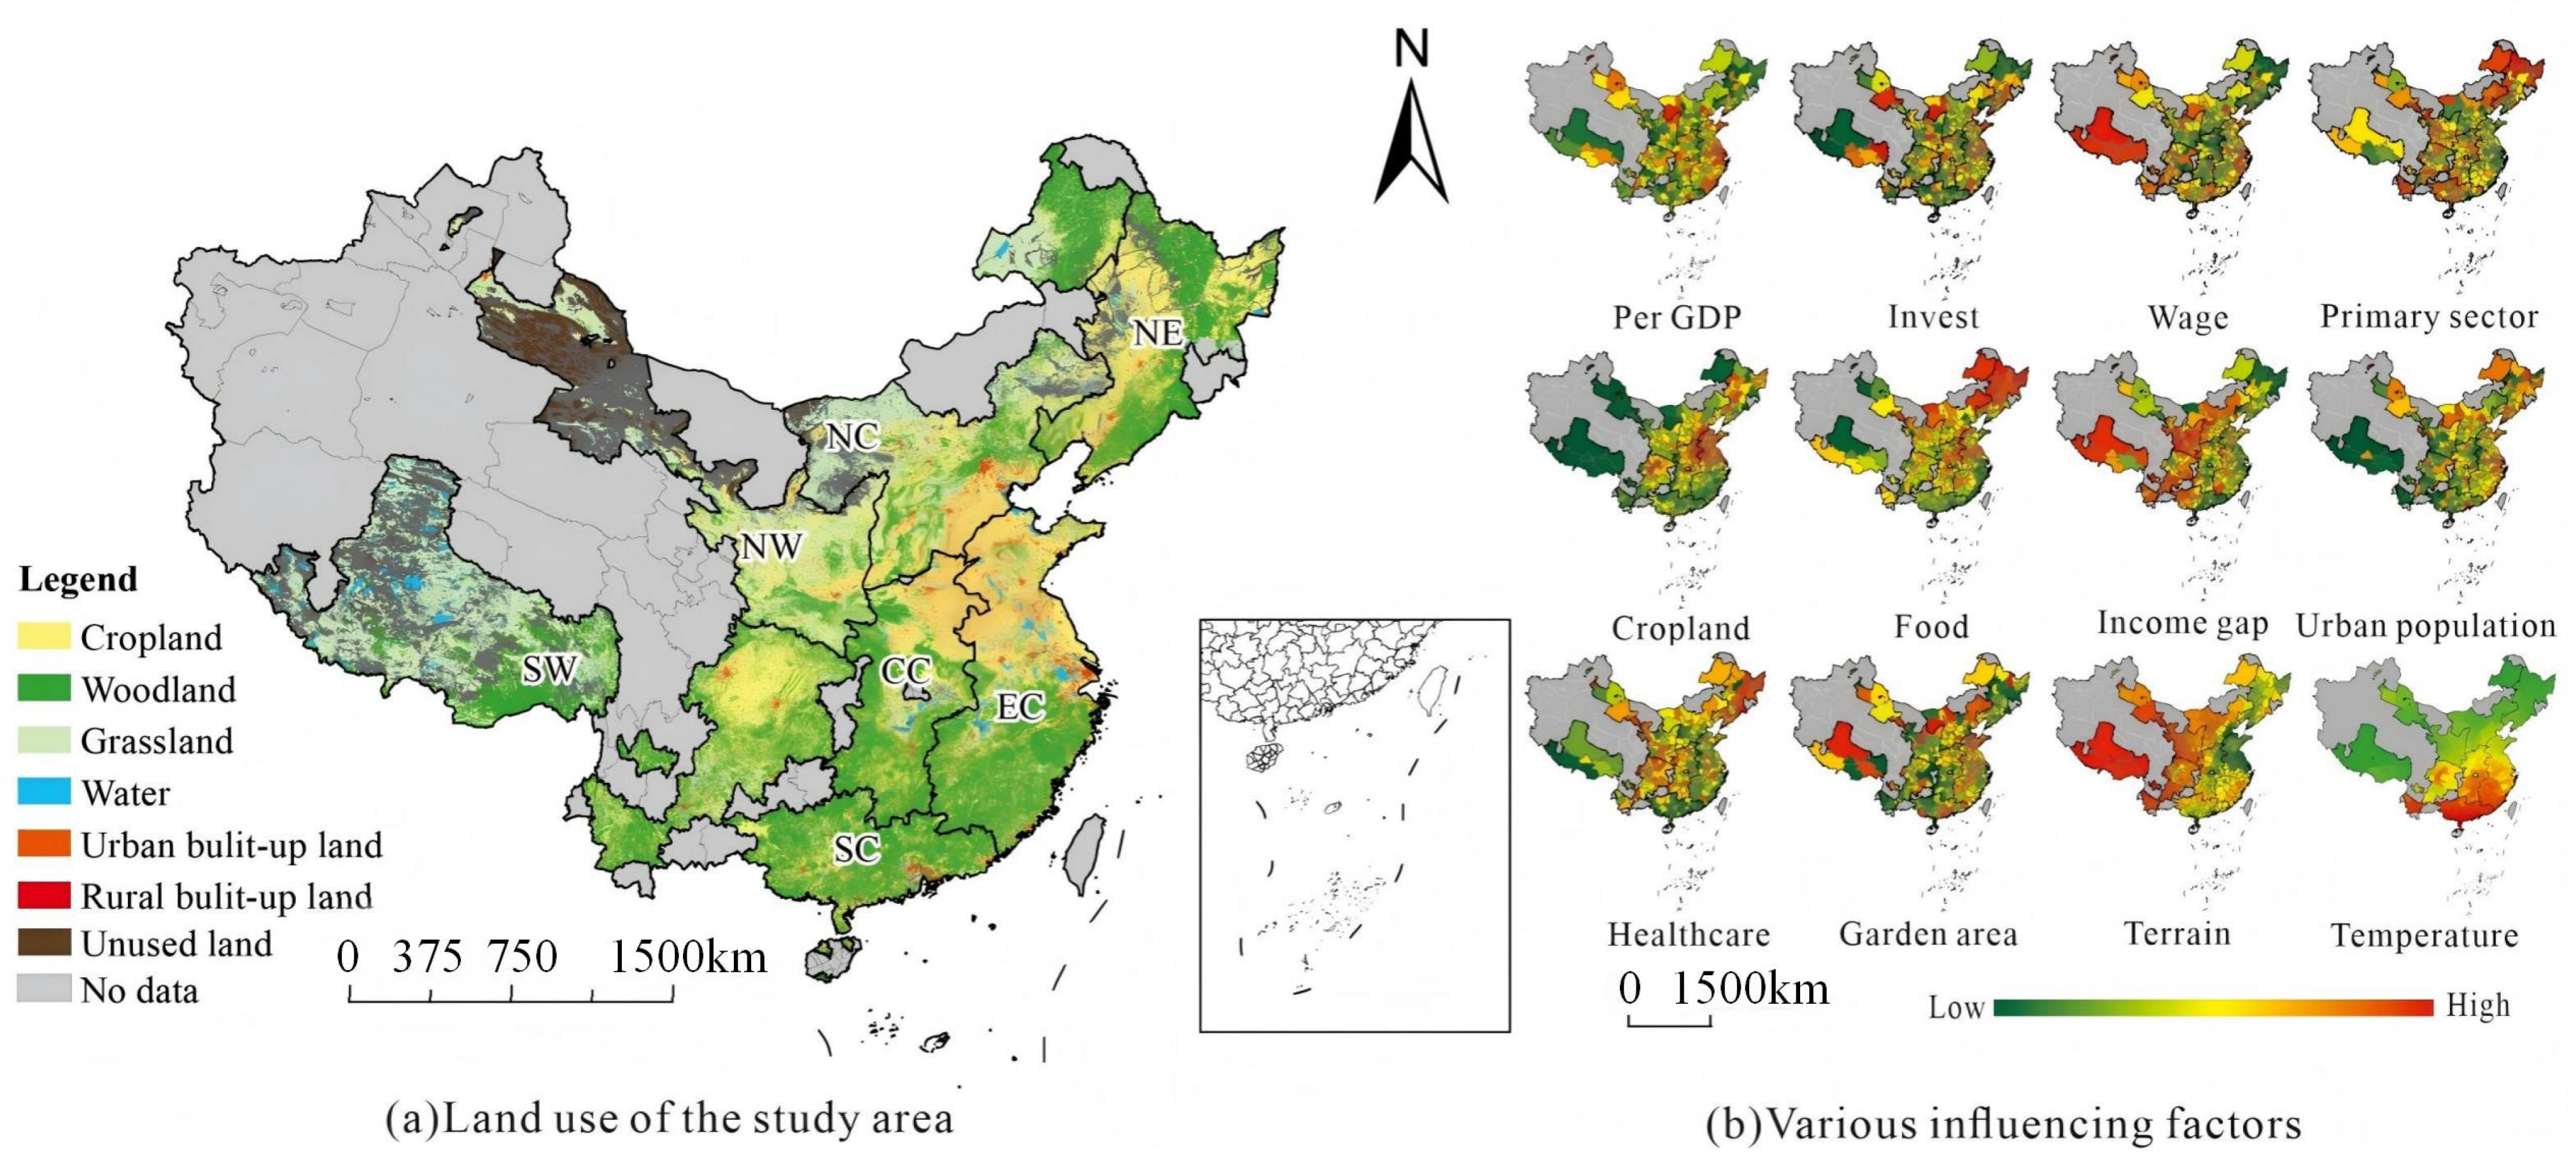
Combined with existing studies, this paper constructs an analytical framework for the influencing factors of the coupling relationship of population density in urban and rural built-up areas from five dimensions, namely, economic development level, agricultural development level, public service facility conditions, urban-rural differences and population structure, and natural geographical conditions (see Figure 2).
Figure 2.
Analytical Framework for Influencing Factors of Coupling Coordination Between Urban and Rural Built-up Area Population Densities.
- (1)
- The level of economic development is a core factor affecting population agglomeration and spatial distribution [44], which acts on population changes in urban and rural built-up areas through employment opportunities, production efficiency and income levels. This study selects per capita GDP, per capita fixed asset investment, and the average wage of on-the-job employees as the measurement indicators of the municipal-level economic development level, which, respectively, reflect the comprehensive development level, productive investment capacity, and labor market returns.
- (2)
- The level of agricultural development is related to the livelihood foundation and labor demand in rural areas. Against the backdrop of agricultural mechanization and capital deepening, the improvement of agricultural production efficiency may not only release labor force and accelerate population outflow but also enhance the population carrying capacity of rural built-up areas through the extension of the industrial chain. This study selects the proportion of the primary industry, the proportion of cultivated land, and the per capita grain possession to characterize the agricultural scale, resource base, and the characteristics of production outcomes.
- (3)
- The conditions of public service facilities directly affect residents’ housing choices and long-term settlement intentions and exert a significant impact on the stability of population density in urban and rural built-up areas. In this study, the number of beds in medical and health institutions per 10,000 people is used to measure the supply level of basic medical services, and the per capita public green space area is adopted to reflect the living environment and ecological conditions.
- (4)
- Urban-rural disparities and population structure often exert an impact on the population density relationship of urban and rural built-up areas by influencing the direction and intensity of population migration. This study selects the urban-rural residents’ income ratio to measure the urban-rural gap and uses the proportion of urban population to reflect the spatial distribution of population and urbanization mode, so as to characterize the coordinated evolution of population density in urban and rural built-up areas.
- (5)
- As the fundamental constraints on regional development, physical geographical conditions exert long-term impacts on construction costs, developable space, and settlement patterns. In this study, the municipal average altitude and average temperature are selected as the characterization indicators of physical geographical location conditions.
3. Materials and Methods
3.1. Study Area
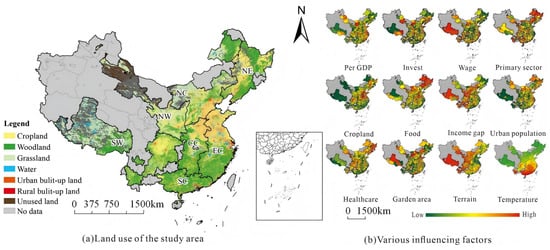
According to the Statistical Table of Administrative Divisions published by the Ministry of Civil Affairs of the People’s Republic of China in 2022 (http://xzqh.mca.gov.cn/statistics/, accessed on 24 December 2024), China has a total of 4 municipalities directly under the central government, 293 prefecture-level cities, 7 regions, 30 autonomous prefectures, and 3 leagues, along with the regions of Hong Kong, Macau, and Taiwan. Due to data unavailability, this study focuses on 296 basic research units, including 4 municipalities directly under the central government and 292 prefecture-level cities (excluding data from Sansha City). The basic spatial unit of this study is prefecture-level and above administrative units in China. Under China’s current “city governing county” system, each such administrative unit encompasses both urban and rural areas within its jurisdiction, providing a reasonable and consistent geographical basis for calculating the PUL and PRL within the same unit. These units are categorized into seven regions—Central China, South China, North China, East China, Northeast China, Northwest China, and Southwest China—based on differences in climate conditions, economic structures, and geographical locations, as shown in Figure 3 and Table 1.
Figure 3.
Study area: (a) Land use data of the study area in 2020; (b) Factors influencing the coupling coordination degree of the study area in 2020.
Table 1.
Regional Division.
3.2. Data Acquisition and Processing
3.2.1. Urban and Rural Built-Up Land and Resident Population Data
Urban and Rural Built-up Land: The land use raster data for this study comes from the Chinese Academy of Sciences and the Resource and Environmental Science Data Center (http://www.resdc.cn (accessed on 24 December 2024)). This dataset includes six primary land types and 25 secondary land types, which comprise arable land, forest land, grassland, water bodies, built-up land, and unused land. The overall estimation accuracy for secondary land use types exceeds 90% [45]. This study adopts the classification and aggregation methods for three secondary land categories within the primary category of built-up land proposed by Wang et al. (2022) [46]. Specifically, “urban land” and “other built-up land” are combined into urban built-up land, while “rural residential areas” are classified as rural built-up land. Detailed descriptions of each land use type are provided in Table 2 [47].
Table 2.
Urban built-up land and rural settlement land classification system.
Resident Population Data: The resident population data was sourced from various local government websites, statistical bulletins on national economic and social development at the prefecture-level cities, as well as data from the sixth and seventh national population censuses. The rural population was calculated as the total population minus the urban population.
The formulas for calculating the PUL and PRL are as follows:
where refers to the population density on the urban built-up land of city i (unit: ten thousand people/km2). denotes the urban population of city i and represents the area of urban built-up land in city i. Similarly, indicates the population density on the rural built-up land of city i (unit: ten thousand people/km2), with denoting the rural population and representing the area of rural built-up land in city i.
3.2.2. Influencing Factors Data
The elevation data were obtained from Digital Elevation Model (DEM) data sourced from the Geographic Data Cloud (http://www.resdc.cn (accessed on 23 December 2024)), with a spatial resolution of 250 m. Temperature data were obtained from a meteorological dataset (https://cstr.cn/18406.11.Meteoro.tpdc.270961 (accessed on 24 December 2024)) and aggregated to the city level for analysis. Relevant socioeconomic data were drawn from various editions of the “China City Statistical Yearbook” and “China Urban Construction Statistical Yearbook.” Since fixed asset investment figures for 2020 were not published, this study calculated them based on growth rates. The proportion of arable land was derived from calculations in ArcGIS 10.8, and land use data were sourced from the Chinese Academy of Sciences and the Resources and Environment Science Data Center (http://www.resdc.cn (accessed on 23 December 2024)). Total grain production figures were obtained from municipal agricultural bureaus. In the calculation of urban-rural income ratios, since Shenzhen does not report rural resident income, the maximum value for the same period in the municipality was used as a substitute. Due to missing data in certain years, this study employed mean substitution and linear interpolation methods based on the differing mechanisms of missing data. The selection of indicators and calculation methods for the influencing factors of the coupling relationship are detailed in Table 3.
Table 3.
Description of Indicators for Influencing Factors in Coupling Coordination.
3.3. Research Methods
3.3.1. Measuring Coordination Level—Coupling Coordination Model
To quantify the coordination between population density in urban built-up areas and rural built-up areas, this study applies the coupling coordination model to the PUL–PRL dual system. Specifically, we first calculate the coupling degree C to characterize the interaction intensity between the two subsystems. Then, the comprehensive coordination index T is constructed as an intermediate variable and combined with C to derive the coupling coordination degree D, which reflects the level of coordinated development between PUL and PRL [59]. The calculation formulas are as follows:
where Ci represents the coupling degree; Ti is the comprehensive coordination index; Di denotes the coupling coordination degree. The value indicates the coupling degree of city i during different research periods. Ui and Li represent the standardized values of population density in urban and rural built-up areas, to ensure the smooth and stable operation of all calculation formulas, respectively, with values standardized to 0 replaced by 0.0001. a and b are coefficients to be determined, with a + b = 1. Since urban and rural built-up area population densities often restrict each other, we set a = b = 0.5. This equal-weight assignment is a normative choice aligned with the study’s core objective of assessing balance and coordination within the urban–rural system’s internal structure. It reflects an equal emphasis on the structural importance of both urban and rural subsystems in the overall functioning of the system, aiming to capture structural risks arising from either excessive urban agglomeration or excessive rural hollowing-out in an unbiased manner. This differs from weighting schemes based on economic output contributions, which typically assign a higher weight to urban areas.
According to the existing research, the coupling coordination degree D is divided into four stages [22]. When 0 < D ≤ 0.3, it indicates low coordination coupling; when 0.3 < D ≤ 0.5, it indicates moderate coordination coupling; when 0.5 < D ≤ 0.8, it indicates high coordination coupling; and when 0.8 < D < 1.0, it indicates extremely high coordination coupling. It should be noted that the aforementioned coupling coordination degree (D) is a relative index reflecting the collaborative order of the system. Its purpose is to convert the continuously distributed D values into ordered categories, thereby facilitating the visual comparison of spatial patterns and the generalized analysis of evolutionary trends. This classification serves as a relative categorization tool and does not inherently define the absolute level of economic development.
3.3.2. Spatial Autocorrelation Analysis—Moran’s I
This study employs global and local spatial autocorrelation analysis methods [60]. Global Moran’s I can evaluate the spatial autocorrelation of the coupling coordination degree between urban built-up area population density and rural built-up area population density. The calculation formula is as follows:
where I is Moran’s I index, n is the number of municipal units, , and are the coupling coordination degrees. is the average of , and is the spatial weight matrix. Moran’s I > 0 indicates positive spatial autocorrelation, Moran’s I = 0 indicates no spatial autocorrelation, and Moran’s I < 0 indicates negative spatial autocorrelation. The larger the absolute value, the stronger the association and the higher the degree of aggregation.
3.3.3. Influencing Factor Analysis—Spatial Error Model
The spatial model primarily employs the spatial lag model (SLM) and the spatial error model (SEM) for regression analysis [61]. Based on the criteria proposed by Anselin (1995) [43], this study selects the spatial error model to investigate the influencing factors of coupling coordination degree.
SLM considers potential spatial effects between the explained variables by incorporating the spatial lag of the explained variable into the regression. The model formula for SLM is as follows:
where Y is the explained variable, i.e., the coupling coordination degree. ρ is the regression coefficient of the spatial lag variable, measuring the extent of spatial spillover. W is the spatial weight matrix. WY is the spatial lag of the explained variable. X is the explanatory variable matrix; β indicates the influence of the explanatory variables on the explained variable; and ε is the random error term.
SEM incorporates certain factors that may jointly influence neighboring units into the regression model to eliminate spatial correlation in the error term. The model formula for SEM is as follows:
where λ is the spatial error coefficient, while the meanings of the remaining parameters are the same as those in Equation (9).
4. Results
4.1. Spatial and Temporal Characteristics of Population Density in Urban and Rural Built-Up Areas
4.1.1. Overall Evolution
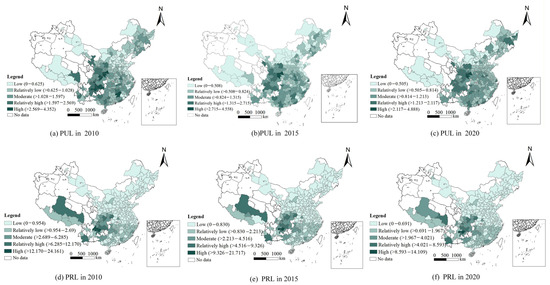
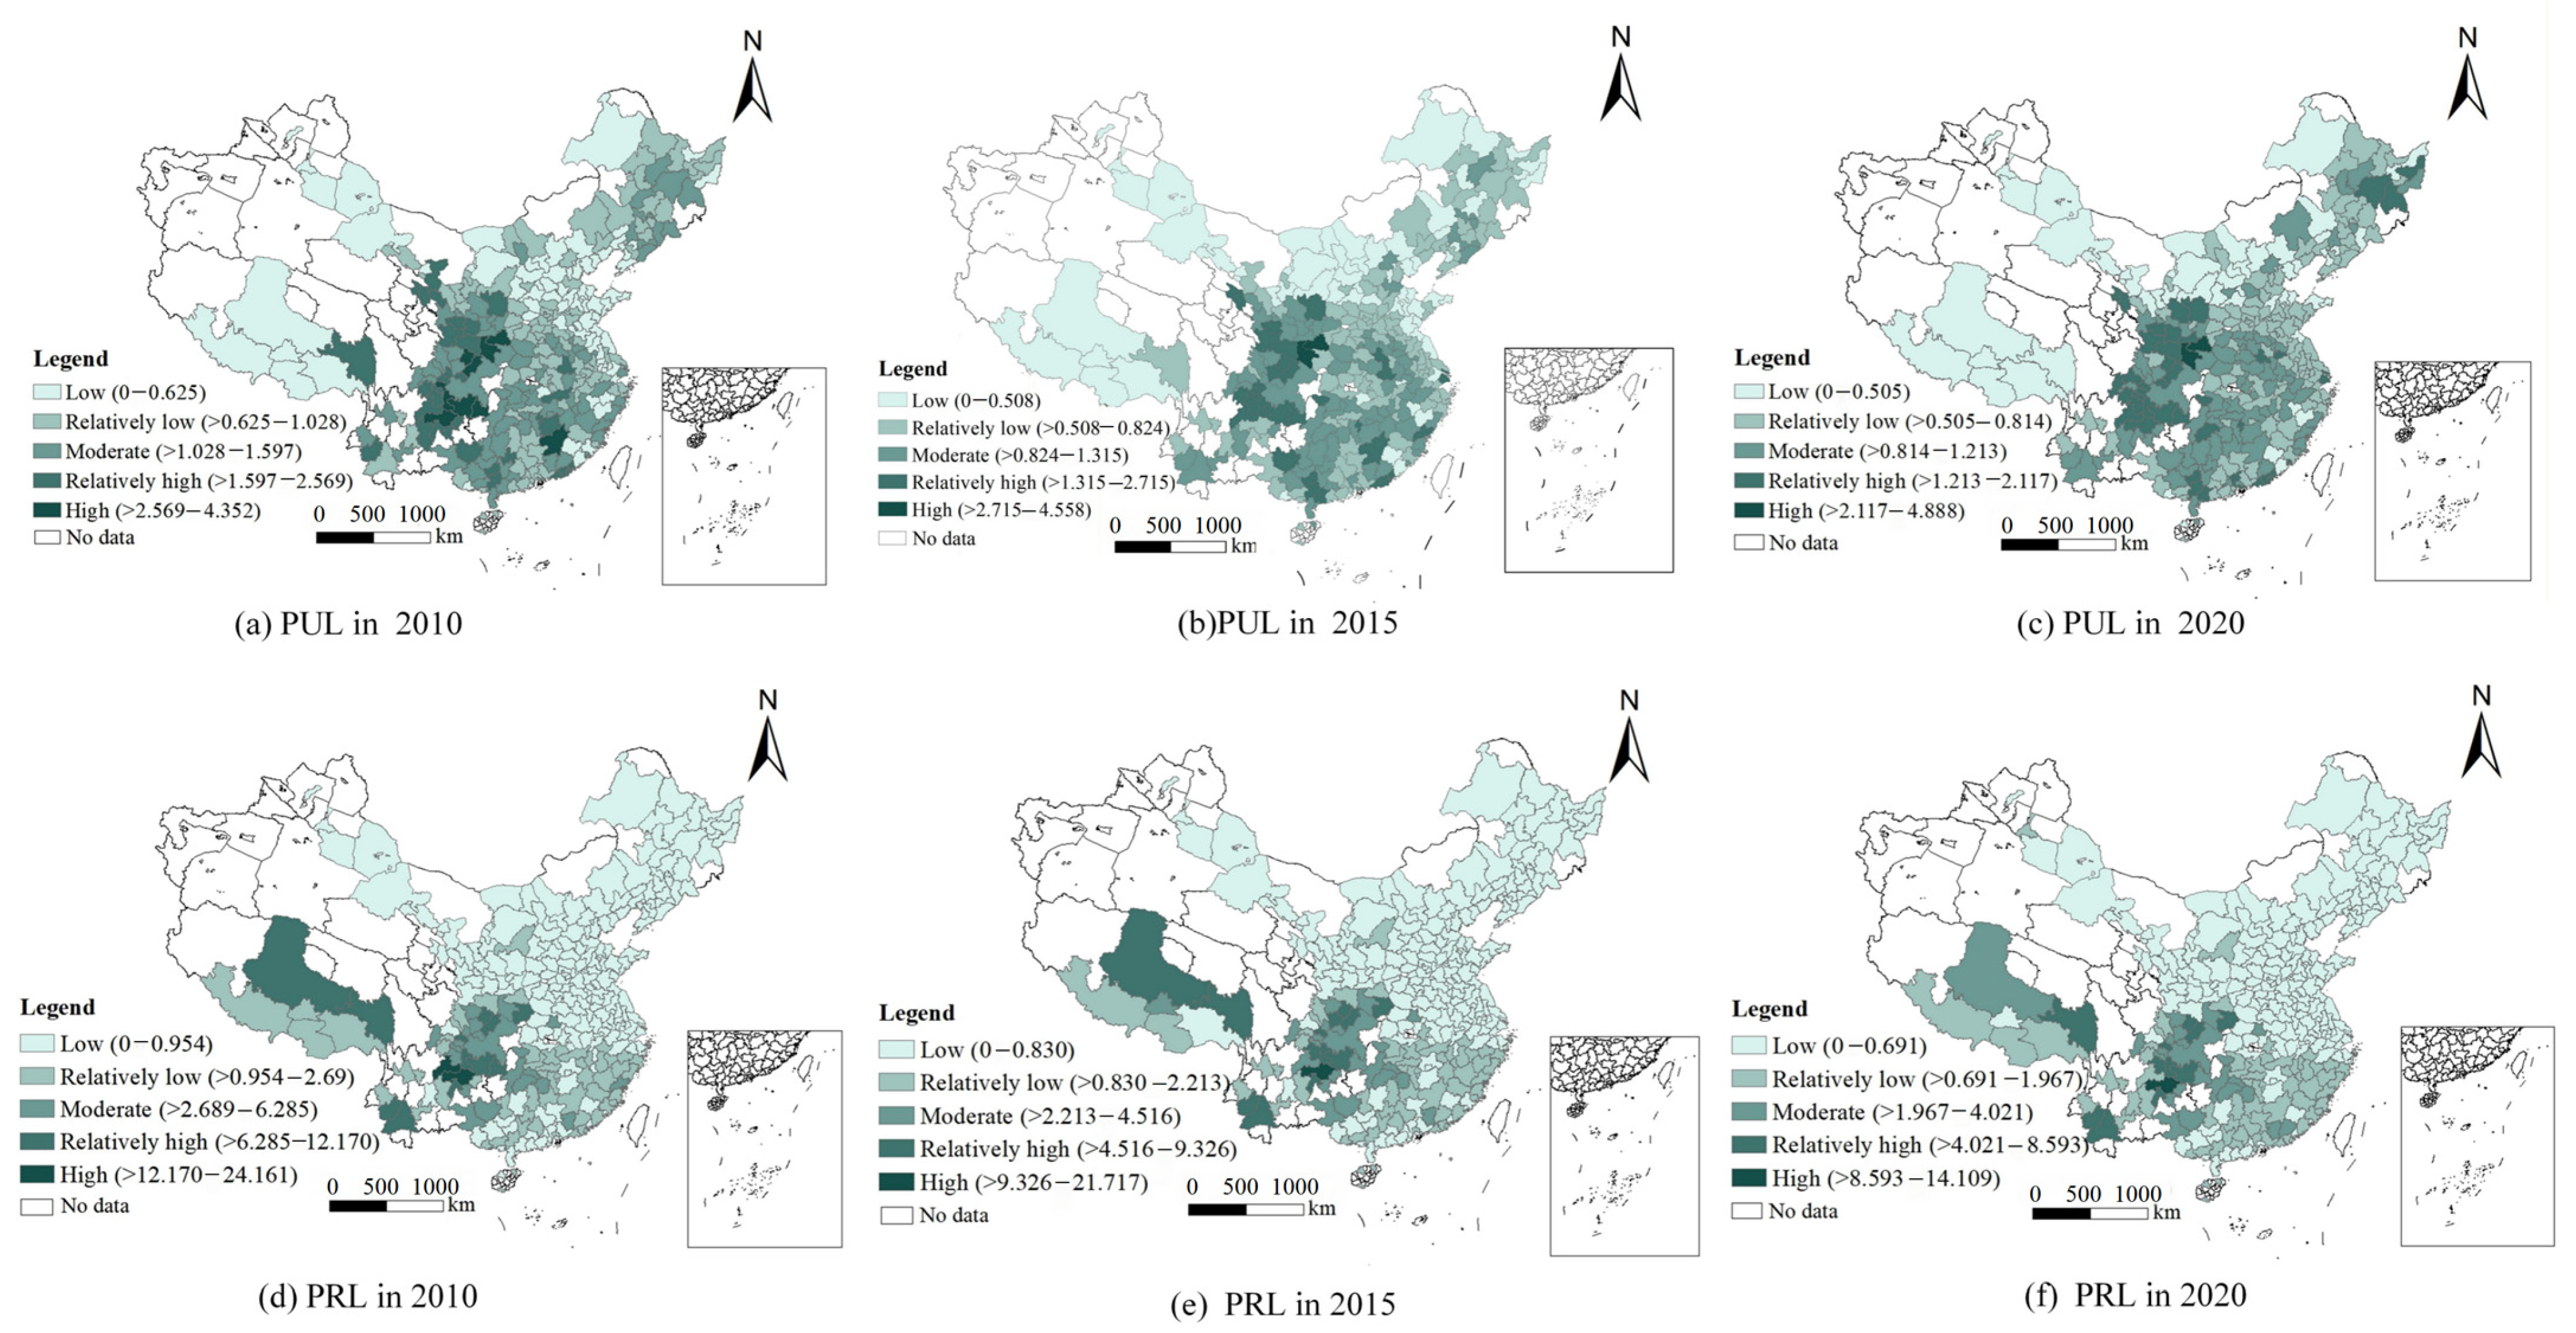
Using the natural breaks method, PUL and PRL are divided into five levels: low, relatively low, moderate, relatively high, and high (see Figure 4). For PUL, the evolution of population density in urban built-up areas from 2010 to 2020 is as follows: in 2010, the ranking was low (78) > relatively low (98) > moderate (76) > relatively high (34) > high (10), with low density concentrated in the Beijing-Tianjin-Hebei region and the northwest. In 2015, the ranking shifted to low (68) > relatively low (112) > moderate (81) > relatively high (33) > high (2). By 2020, the ranking further evolved to low (55) > relatively low (113) > moderate (83) > relatively high (43) > high (2). Throughout the study period, the PUL indicator exhibited an overall upward trend, with its peak increasing from 43.52 thousand people/km2 in 2010 to 45.58 thousand people/km2 in 2015, and then slowly rising to 48.88 thousand people/km2 in 2020. Although this growth was moderate, it was steady, indicating that the growth rate of the urban resident population outpaced the expansion of urban built-up land. Notably, the peak value of the PUL indicator remained concentrated in the economic and population core areas of central China, such as the Pearl River Delta, Yangtze River Delta, Beijing-Tianjin-Hebei urban agglomeration, and Chengdu-Chongqing urban agglomeration. These regions, as engines of economic development and major destinations for population migration, continue to attract significant population inflow, further underscoring their importance in national development strategies.
Figure 4.
The spatial and temporal evolution of overall urban built-up area population density (PUL) and rural built-up area population density (PRL).
For PRL, the ranking in 2010 was low (202) > relatively low (59) > moderate (21) > relatively high (12) > high (2). In 2015, the ranking shifted to low (201) > relatively low (59) > moderate (22) > relatively high (13) > high (1). By 2020, the ranking further evolved to low (194) > relatively low (67) > moderate (23) > relatively high (11) > high (1). Although the rankings showed slight fluctuations, the overall spatial pattern remained stable, characterized by a slight decrease in the number of cities in the low-density category, while the numbers in the relatively low- to high-density categories fluctuated with little overall change. However, the peak value of PRL exhibited a stable and significant downward trend, decreasing from 241.61 thousand people/km2 in 2010 to 217.17 thousand people/km2 in 2015 and further down to 141.09 thousand people/km2 in 2020. This trend clearly reflects the continued decrease in rural population, while rural built-up land has not shrunk correspondingly. This indicates a certain lag in land use planning and management, failing to respond timely to the changes in actual demand brought about by population loss.
4.1.2. Regional Comparison
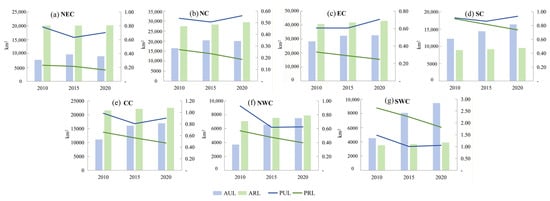
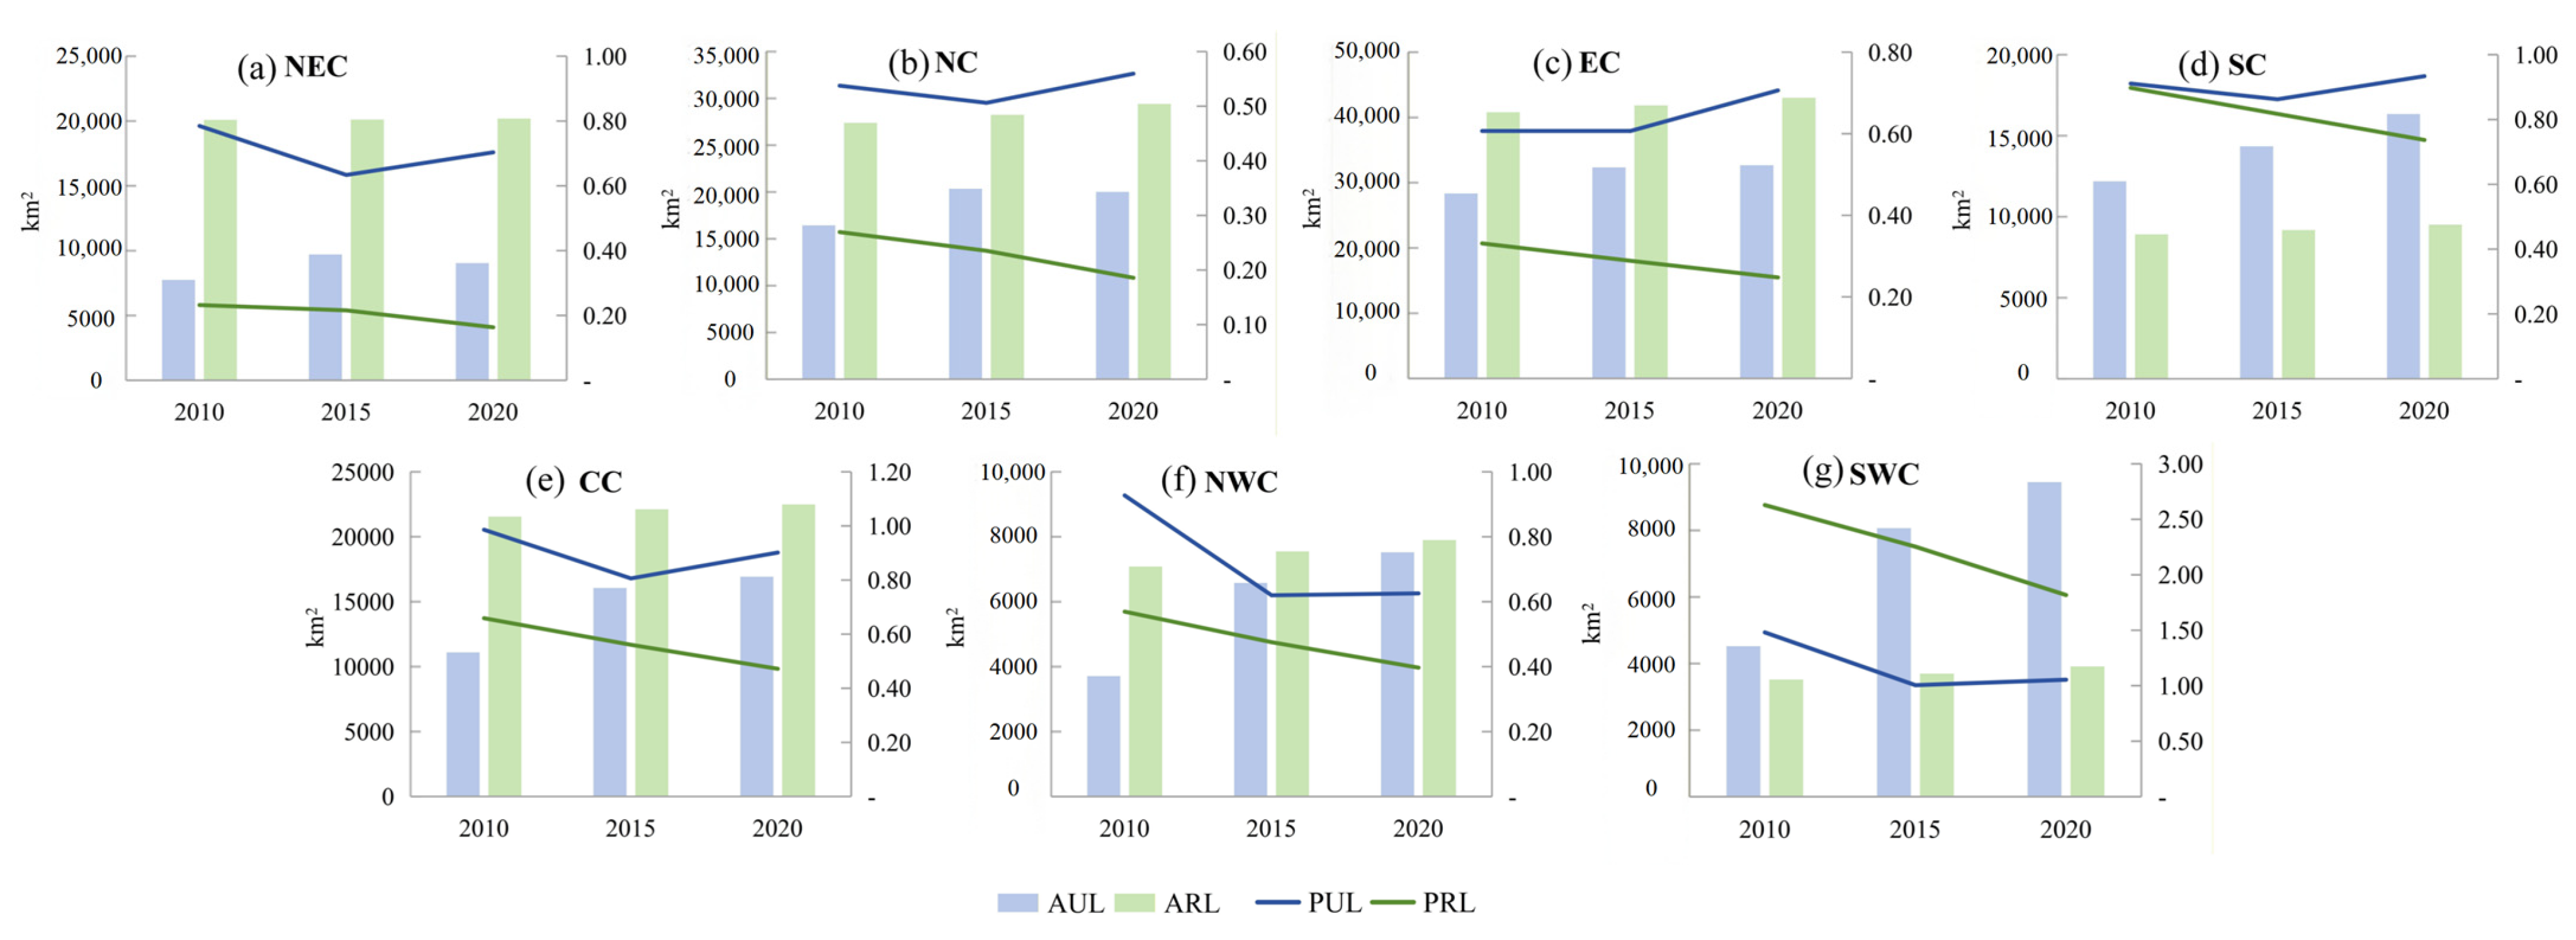
The results indicate that the disparities in PUL and PRL among different regions exhibit diverse evolutionary patterns (see Figure 5). Specifically, the gaps between PUL and PRL in Northeast China, North China, East China, Central China, and Northwest China have undergone a dynamic process of first narrowing and then widening. This change reflects the overall trend of rural population migration to urban areas, as well as the phased asynchronous relationship between the expansion of urban built-up land and the adjustment of population carrying intensity in built-up areas. During the period from 2010 to 2015, the expansion rate of urban built-up land outpaced the agglomeration of population in built-up areas, leading to a significant decline in PUL. Meanwhile, although PRL decreased with the reduction in rural population, the magnitude of change was relatively limited, thus narrowing the gap between the two indicators. After 2015, the pace of built-up land expansion slowed down relatively, the degree of population agglomeration in the existing built-up areas recovered to some extent, and PUL gradually rebounded. In contrast, the continuous outflow of rural population and the insufficient withdrawal of rural built-up land caused PRL to continue declining, ultimately driving the gap between the two to widen again.
Figure 5.
Spatio-temporal Evolution of Population Density in Urban and Rural Built-up Areas Across Different Regions. Note: For details on the regions, please refer to Table 1.
In contrast, the gap between PUL and PRL in South China has exhibited a continuous widening trend, which is closely related to its rapid urbanization process and highly concentrated economic activities. In this region, especially in economically dynamic areas such as the Pearl River Delta, the rapid development of urban economies has attracted a large number of rural population to migrate to cities, driving the continuous growth of urban permanent resident population and promoting the expansion of built-up land area (Chen et al., 2024 [40]). However, the overall speed of population agglomeration is still faster than the expansion of built-up land, leading to a continuous rise in PUL. Meanwhile, the decrease in rural population coupled with the relatively lagging adjustment of rural built-up land has caused a steady decline in PRL, thereby further widening the gap between the two.
4.2. Characteristics of Coupling Coordinated Development of Population Density in Urban and Rural Built-Up Areas
4.2.1. Temporal Characteristics of Coupling Coordination Degree
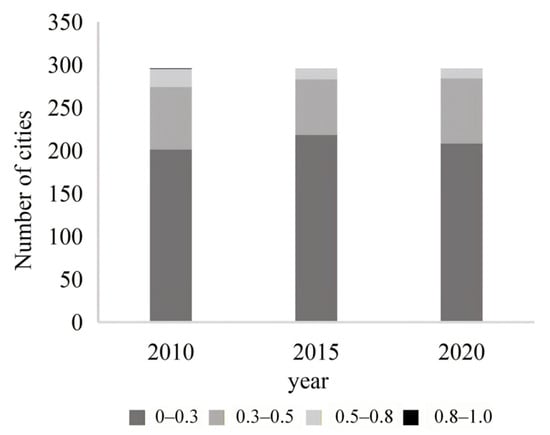
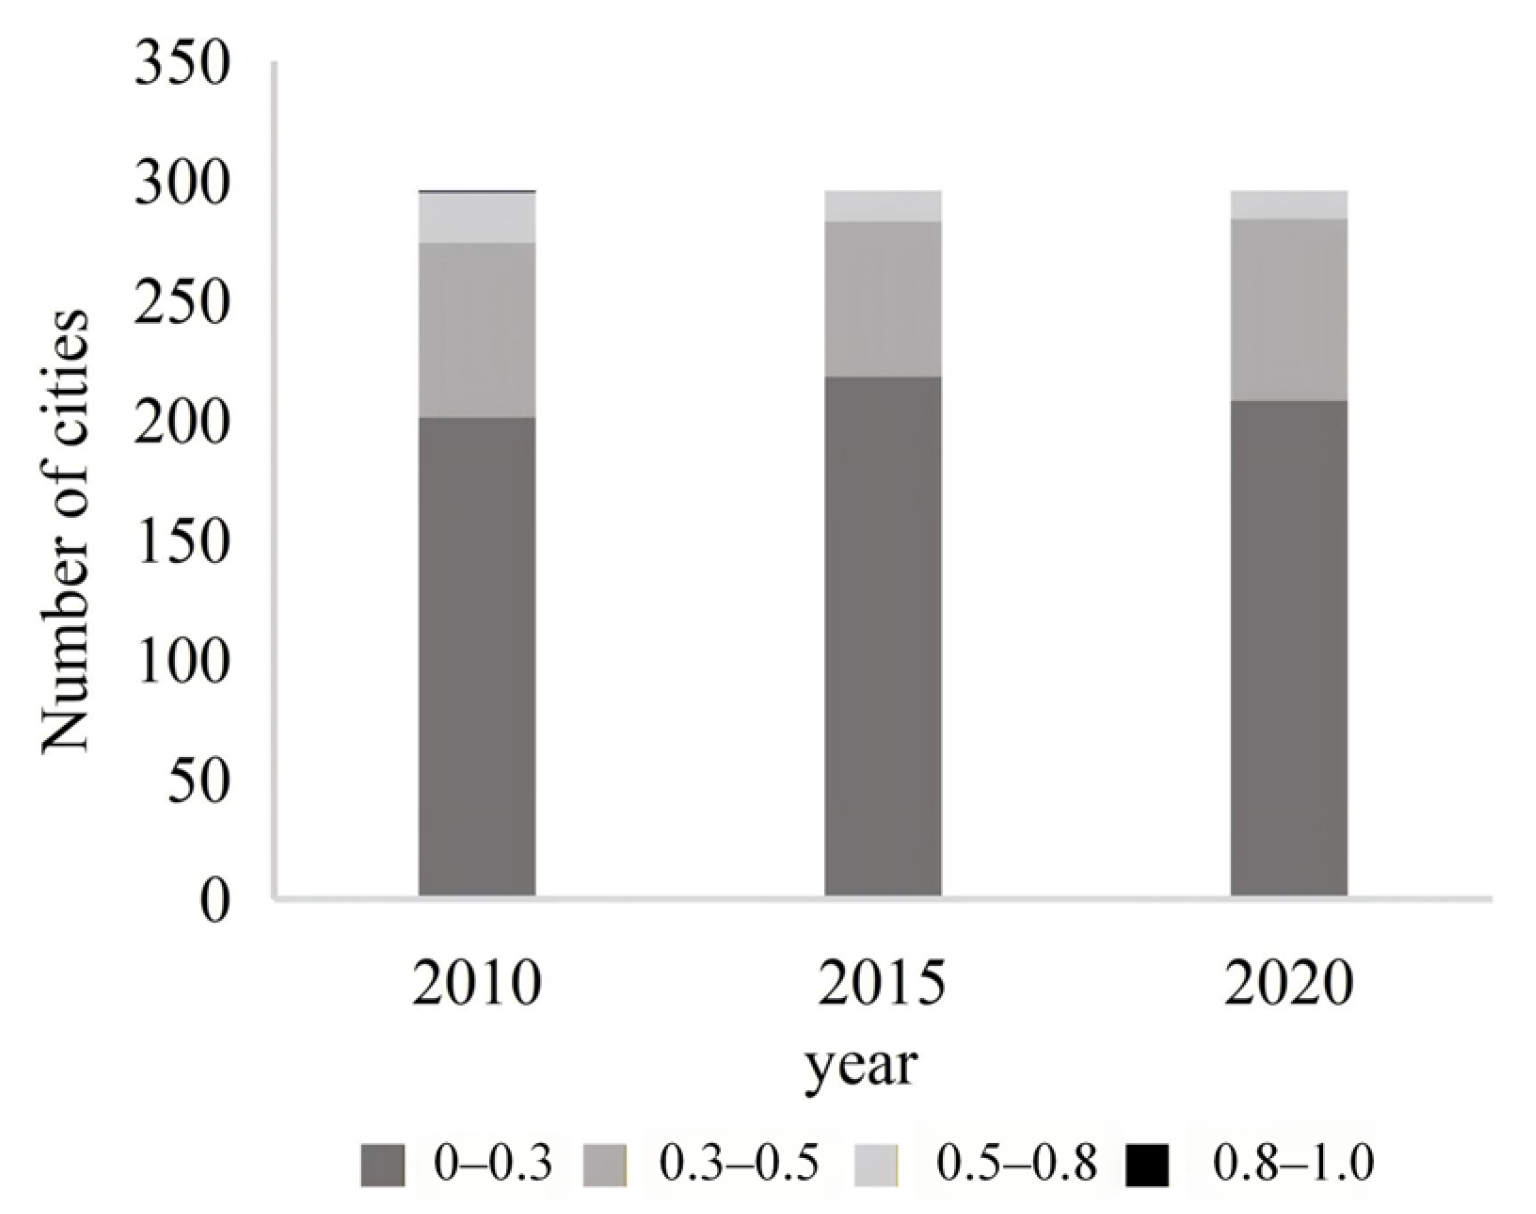
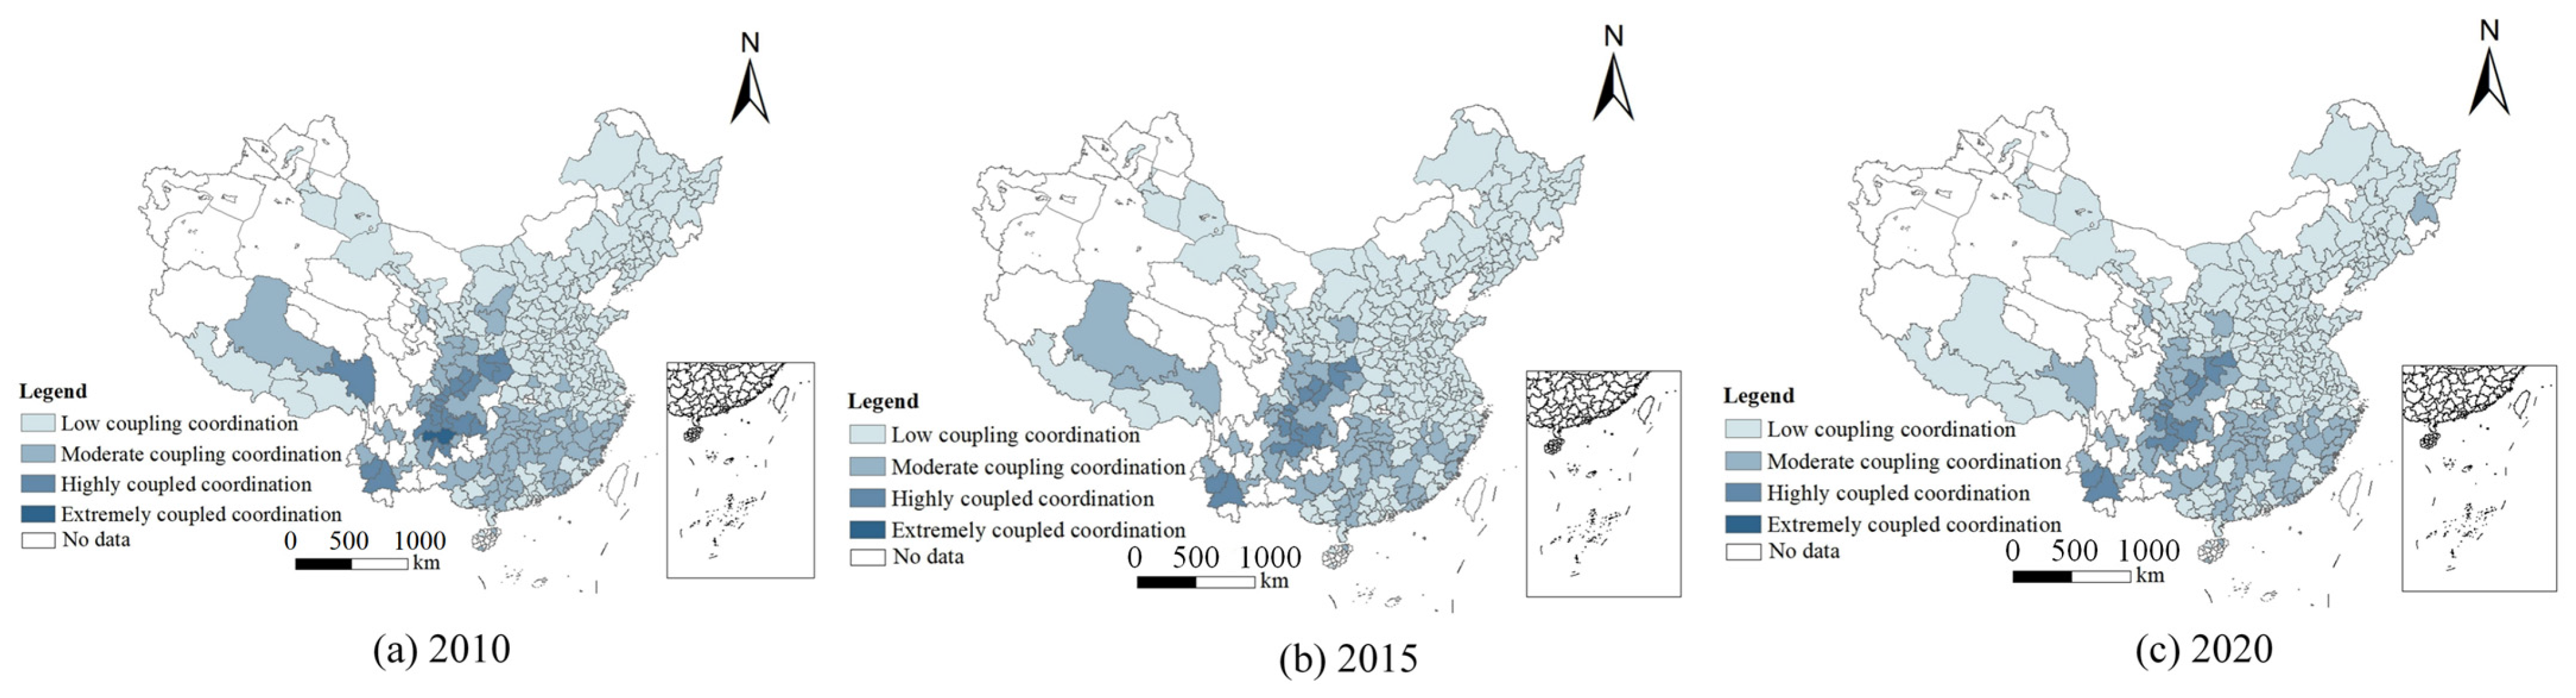
From a temporal perspective, the overall level of coupling coordination between PUL and PRL in China has declined. High-value areas are gradually decreasing, while low-value areas have increased. The average D value for the study units fell from 0.284 in 2010 to 0.262 in 2015, before slightly rising to 0.264 in 2020. A more detailed classification analysis of the coupling degree (see Figure 6) reveals a significant trend in the coordination of urban and rural built-up area population densities in China. The number of cities with low coupling increased from 201 in 2010 to 218 in 2015, before slightly declining to 208 in 2020. This indicates that most cities face challenges in enhancing their coordination. In contrast, the number of cities with high coupling decreased continuously from 21 to 12, underscoring the fragility and difficulty of maintaining a high coordination state. Notably, the phase of extremely coordinated coupling was briefly observed only in Bijie City, Guizhou, in 2010, and completely vanished in the following two years, highlighting the extreme scarcity and difficulty of sustaining such a state.
Figure 6.
Number of Cities in Different Ranges.
The results indicate that changes in population density in urban and rural built-up areas have not remained synchronous. High-density agglomeration is more concentrated in urban built-up areas, while population density in rural built-up areas continues to decline. The decrease in the number of cities with high and extremely high coordination reflects the insufficient regulatory capacity of some regions in balancing the intensity of population agglomeration in urban and rural built-up areas. Additionally, it should be pointed out that, from a system diagnostics perspective, a decline in D primarily reveals the risk of “asynchronicity” or “disorder” in the adjustment process of the urban–rural population–land system. It serves as an indicator reflecting the efficiency of internal linkages within the system. Changes in the D value signal shifts in the system’s coordinated state; there is no simple linear relationship between these changes and macroeconomic growth or environmental quality. Therefore, a decline in the coupling coordination degree does not necessarily imply a slowdown in economic growth or environmental degradation. Its more direct implication lies in the weakened coordination of the population density structure in urban and rural built-up areas, thereby increasing the difficulty of subsequent spatial regulation and public service allocation.
4.2.2. Spatial Characteristics of Coupling Coordination Degree
From the perspective of the spatial distribution pattern (Figure 7), the high coupling coordination degree values are significantly concentrated in the southwest region, with Sichuan Province as the core in particular, forming a radiation effect of “driving the whole area with key points” and gradually spreading to the surrounding areas. The formation of this phenomenon is attributed to two aspects. On the one hand, the strong development momentum of the core regions (such as Sichuan) has indeed exerted a positive driving effect on the surrounding areas. By implementing the urban-rural coordinated development strategy based on counties, it has promoted the efficient integration and circulation of resources. Meanwhile, it has actively promoted the transformation and upgrading of rural industries, such as the vigorous development of characteristic agriculture and rural tourism, which not only increased farmers’ income, but also deepened the construction of beautiful countryside by drawing on the successful experience of the “Ten-Thousand Village Demonstration and One-Thousand Village Renovation Project”. It has formed a model of coordinated development in the matching of population and land resources, which has a positive effect on the overall balanced development of the region. On the other hand, the high coupling coordination degree in this region may to a certain extent reflect the reality of the relatively lagging urbanization process. In some areas, due to insufficient urbanization, a large number of people have not been effectively transferred to cities and towns but remained in inefficiently used rural settlements. As a result, the population density in rural built-up areas has not dropped significantly, thus maintaining the relatively coupled state of population density between urban and rural built-up areas. This situation is essentially different from the benign coordination driven by policies. Behind it lies the development dilemma of sluggish non-agricultural transfer of rural population and long-term low land use efficiency. The corresponding policy implications are completely opposite to those of the benign coordination mode, which need to be solved by strengthening the motivation of urbanization and optimizing the flow mechanism of urban-rural factors.
Figure 7.
Distribution Map of Coupling Coordination Degree Between PUL and PRL in China (2010–2020).
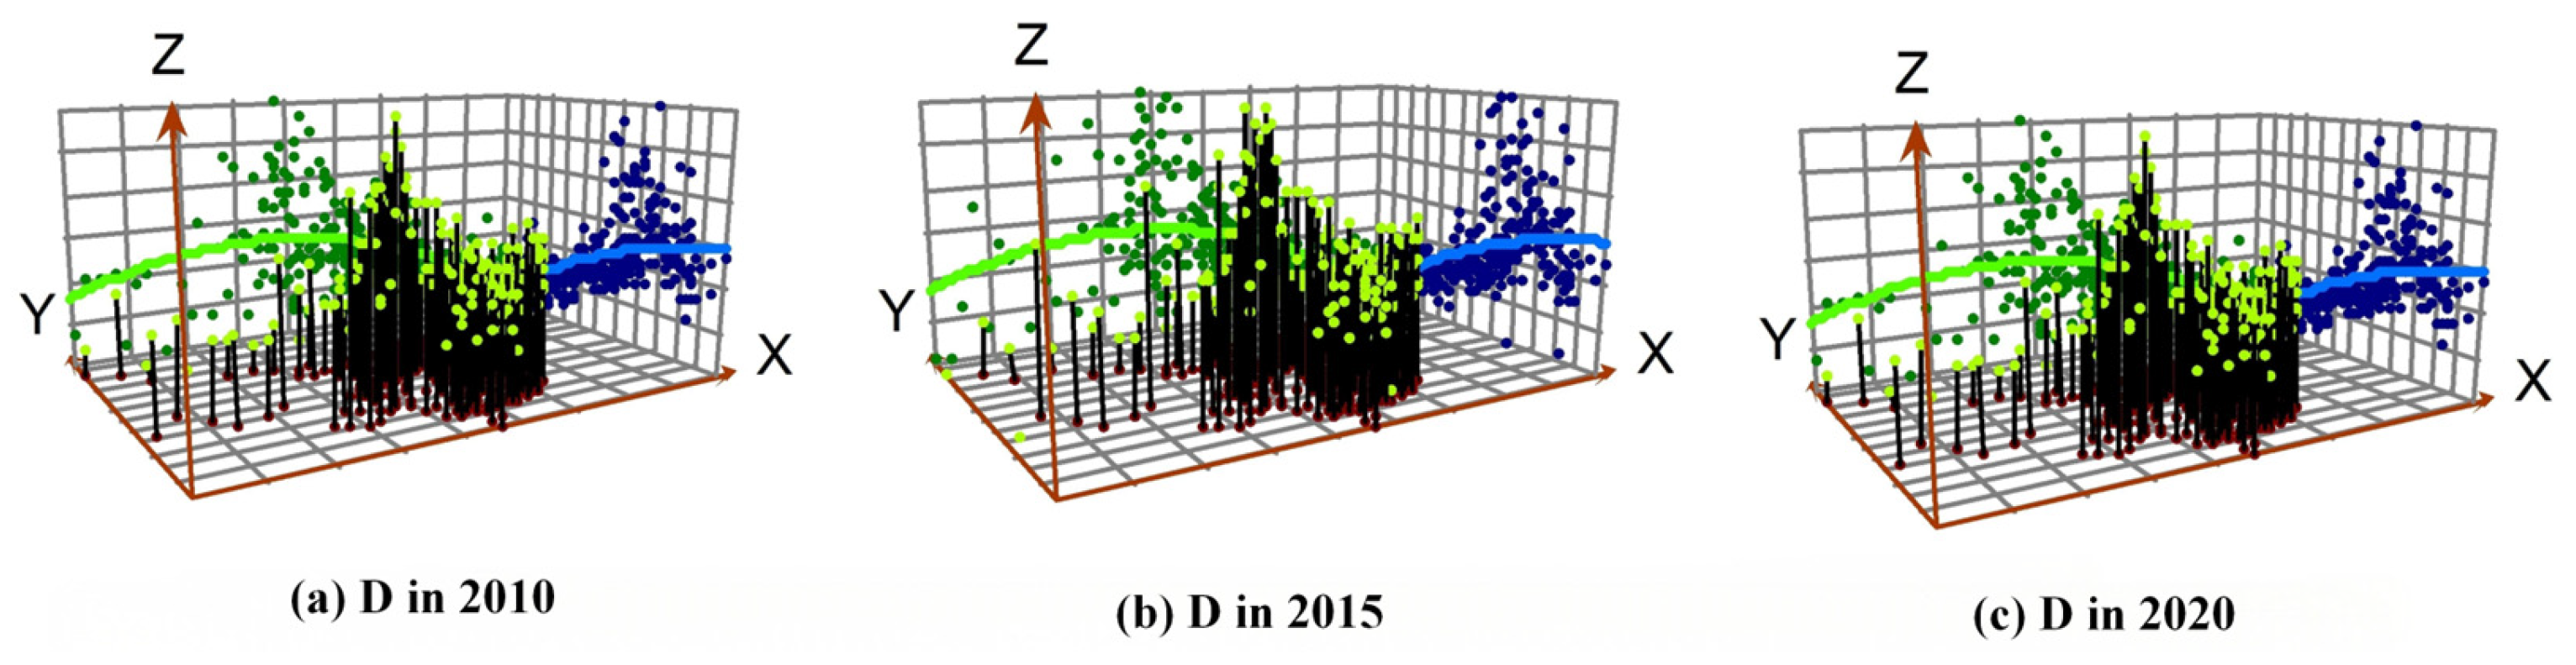
Further analysis of the trend surface map (Figure 8) shows that the coupling coordination degree presents an “inverted U-shaped” spatial distribution characteristic in both the east–west and north–south dimensions, that is, the coupling coordination degree in the central region is relatively high, while that in the surrounding areas is relatively low. This pattern reflects that due to the advantages of developed economy, optimized industrial structure, policy focus and population flow, the coupling coordination degree (D) between PUL and PRL in the central region is observably higher than that in the surrounding areas. This spatial pattern indicates a more synchronized adjustment rhythm between population agglomeration and built-up land expansion in the central region during urbanization. In contrast, the surrounding areas exhibit lower D values, which may reflect greater challenges in achieving such synchronicity, potentially due to a combination of factors such as developmental disparities, natural constraints, and resource allocation pressures. The pronounced spatial gradient in D values underscores the heterogeneity in the orderliness of urban-rural spatial restructuring across different regions of China.
Figure 8.
Trend Surface Map of Coupling Coordination Degree Between PUL and PRL in China (2010–2020).
4.2.3. Spatial Autocorrelation Analysis of Coupling Coordination Degree
The results of the global spatial autocorrelation analysis (Table 4) indicate that Moran’s I value declined from 0.511 in 2010 to 0.508 in 2015, before rising slightly to 0.514 in 2020. This suggests that the coupling coordination degree of urban and rural built-up area population densities in China has a certain degree of spatial autocorrelation over the past decade, with an increasing trend in spatial clustering. The Z-values for Moran’s I in these three periods were 32.492, 32.158, and 32.520, respectively, all significantly greater than the critical value of 1.96, and the p-values were consistently 0.001. This indicates that at a 99.9% confidence level, cities exhibit a positive spatial correlation, with areas of high values neighboring other high values and areas of low values neighboring other low values.
Table 4.
Global Moran’s I and Test Results of Coupling Coordination Degree in Chinese Cities.
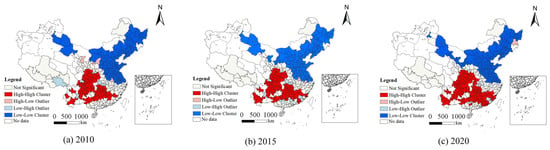
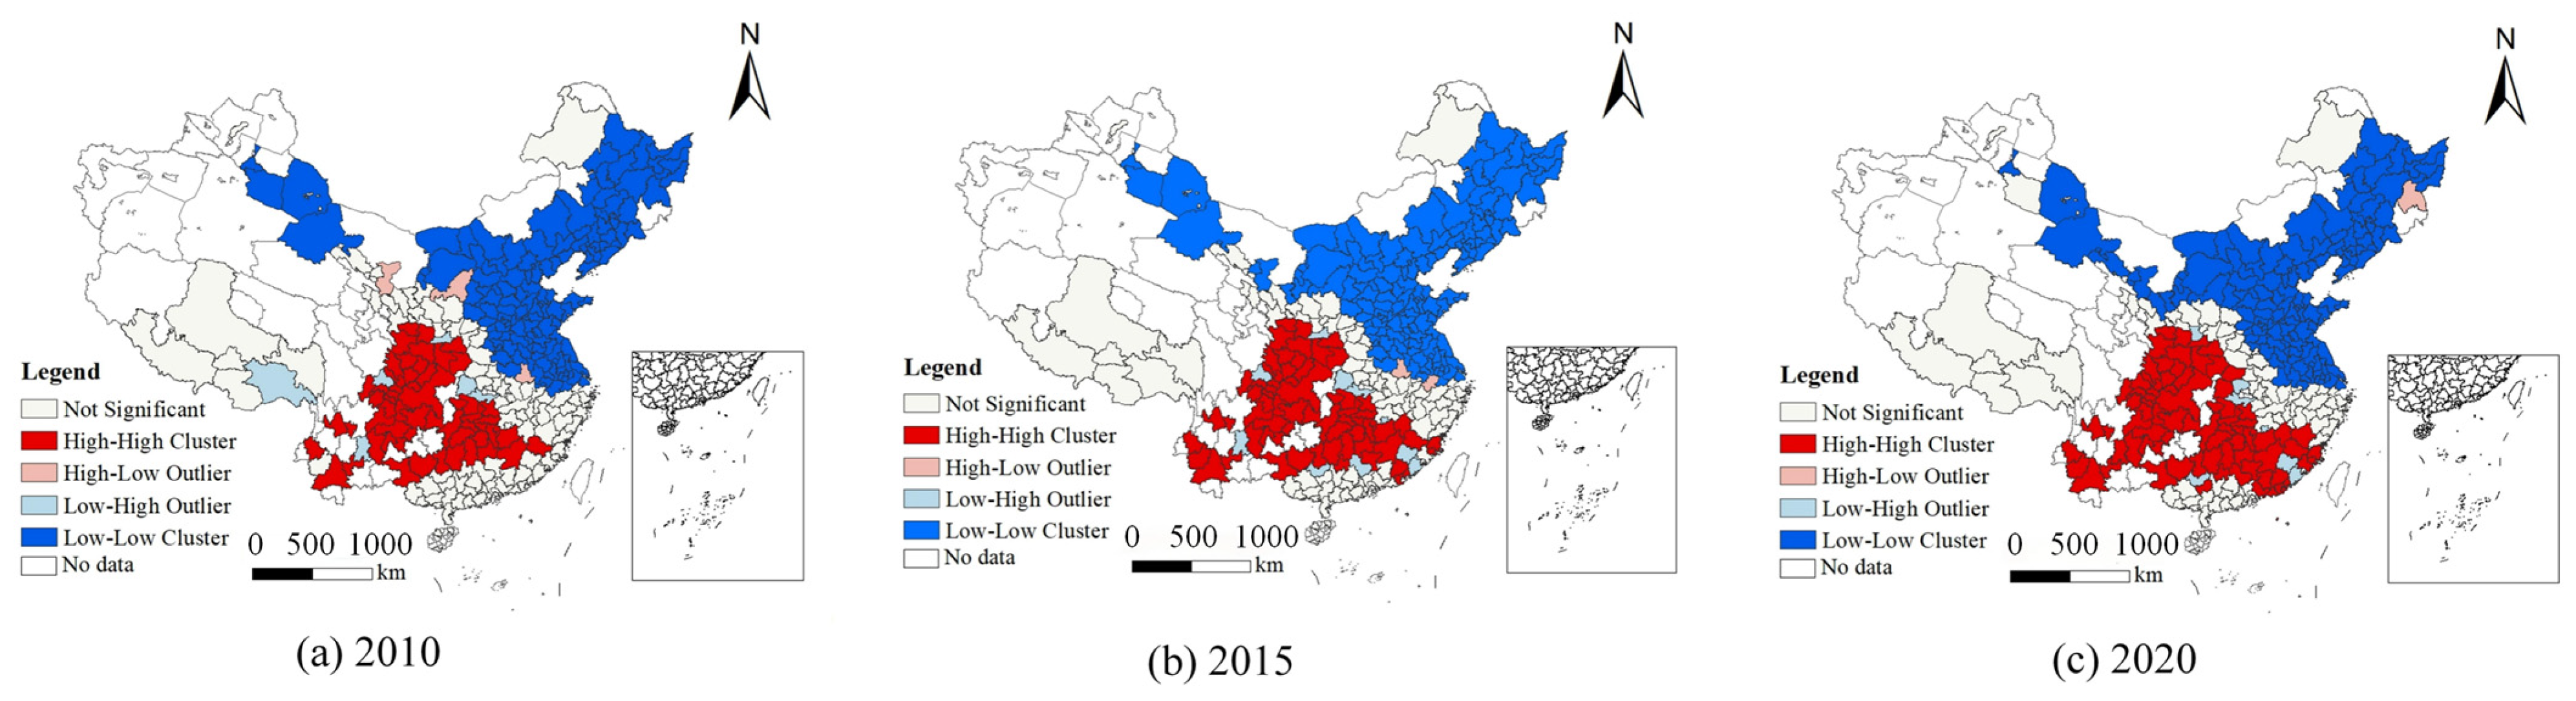
The local spatial autocorrelation analysis reveals that the coupling coordination degree of population densities in urban and rural built-up areas in China shows a distinct northeast-southwest divide across all three periods (Figure 9). In the southwest, there are numerous “high-high clusters”, indicating generally high population densities in both urban and rural built-up areas. Conversely, the northeast has many “low-low clusters”, signifying generally low population densities in these areas. From 2010 to 2015, the number of “high-high clusters” increased from 58 to 67 and further rose to 81, showing a steady growth trend. This reflects the agglomeration effect of population and resources during urbanization and an enhanced coupling coordination between urban and rural population densities. Meanwhile, the number of “low-low clusters” slightly increased from 128 to 131 before decreasing to 127, remaining relatively stable overall, indicating consistently low and stable population densities in some inland regions. Notably, cities located near “low-low clusters,” such as Wuwei, Yulin, and Lu’an, have shifted from “high-low clusters” to “low-low clusters,” highlighting a clear urbanization spillover effect.
Figure 9.
Local Spatial Autocorrelation Analysis of Coupling Coordination Degree between PUL and PRL in China (2010–2020).
4.3. Analysis of the Influencing Factors of Coupling Coordination Degree
4.3.1. Multicollinearity Diagnostics
Multicollinearity was diagnosed, and the results are presented in Table 5. The variance inflation factors (VIF) of all explanatory variables are less than 5, with the minimum value being 1.19 and the maximum value being 3.96. Therefore, the hypothesis of multicollinearity among explanatory variables can be rejected, indicating that there is no significant redundancy among the variables.
Table 5.
Test for covariance between independent variables.
4.3.2. Influencing Factors Analysis
In the baseline regression, this study employs a pooled panel estimation approach to analyze the full sample of cities from 2010 to 2020, aiming to identify the average effects on the coupling coordination degree of population density in urban and rural built-up areas. The model controls for city fixed effects and incorporates a spatial error term to capture potential spatial dependence. The regression results are reported in Table 6.
Table 6.
Spatial error model regression results for Coupling Coordination Drivers.
The model results indicate: In terms of economic development level, both per capita GDP and the average wage of on-the-job employees are significant at the 1% level, but with opposite directions of influence, while per capita fixed asset investment is not significant. This indicates that the role of economic development in the coupling of population density in urban and rural built-up land is obviously heterogeneous. The negative impact of per capita GDP suggests that in the process of economic level improvement in some regions, the expansion of built-up land is not synchronized with the adjustment of population carrying intensity in built-up areas, leading to a decline in the matching degree of population density in urban and rural built-up land. In contrast, the positive effect of the average wage of on-the-job employees indicates that the improvement of income level helps to enhance the stability of employment and residence in urban and rural areas, thereby alleviating the differentiation of population density structure at the scale of built-up areas. Fixed asset investment has no significant impact, indicating that expanding investment scale alone hardly improves the coordination of population density in urban and rural built-up land.
Regarding the level of agricultural development, the proportion of the added value of the primary industry in the GDP exerts a significant positive impact on the coupling coordination degree, while the proportion of cultivated land and the per capita grain possession exert significant negative impacts. An increase in the proportion of the primary industry helps maintain the population carrying intensity of rural built-up areas, thereby alleviating the differentiation of population density between urban and rural built-up land. However, in regions with a high proportion of cultivated land or great pressure on food security, the flexibility of rural spatial adjustment is relatively limited, and the population density of built-up land cannot be reorganized in a timely manner in response to population changes, leading to a decline in the coordination of the urban-rural density structure.
Concerning public service conditions, the per capita public green space area has a significant negative impact on the coupling coordination degree, while the number of medical and health beds fails to pass the significance test. This indicates that the expansion of public green space may be accompanied by low-density development in built-up areas to a certain extent, which dilutes the population density of urban construction land and thus weakens its matching relationship with that of rural construction land. In contrast, the direct impact of medical resource allocation on the coupling of population density between urban and rural construction land is relatively limited.
Concerning the urban-rural gap and urbanization level, the urban-rural income ratio has a significant positive impact. This indicates that in some regions, a large income gap does not necessarily exacerbate the mismatch in population density between urban and rural construction land. This may be related to factors such as restricted population mobility and slow expansion of built-up area scale, and its scope of application has obvious situational characteristics. The urban population ratio has a significant negative impact, which shows that in the process of urbanization, if the expansion speed of construction land is faster than the adjustment of the population carrying intensity of built-up areas, the population density of urban and rural construction land is more likely to diverge, thereby reducing the coupling coordination degree.
Regarding natural location conditions, both the average altitude and temperature have a significant positive impact on the coupling coordination degree. In areas with strong constraints of natural conditions, the expansion of construction land is restricted, and the population carrying capacity is adjusted more through the agglomeration of stock space, which helps to alleviate the structural differentiation of population density in urban and rural construction land. In contrast, relatively suitable climatic conditions are conducive to the stability of urban and rural production and living, thereby improving the coordination degree of the population density structure in built-up areas.
4.3.3. Robustness Test
To test the robustness of the baseline results, this paper conducts supplementary tests from three aspects. First, in terms of model specification, the ordinary least squares (OLS) estimation is used to replace the baseline spatial error model (SEM). Second, a 5% winsorization is applied to both the upper and lower tails of the coupling coordination degree to reduce the impact of extreme values on the estimation results. Third, a rolling regression is adopted to test the consistency of conclusions across different periods. The results in Table 7 show that the signs and significance levels of most core explanatory variables remain consistent under different specifications, indicating that the main conclusions of this paper are relatively robust.
Table 7.
Robustness Test of Regression Results for Coupling Coordination Drivers.
5. Discussion
5.1. Influencing Factors of Coupling Coordination Degree in Different Regions
In the seven major geographic regions, regression verification was conducted using a spatial error model, with the results presented in Table 8. The driving factors exhibited heterogeneous characteristics across these regions.
Table 8.
Regression Results of Coupling Coordination Drivers in Different Regions.
Coupling coordination degree across Northeast China is primarily constrained by three factors: the share of urban population, the level of medical service provision, and the per capita area of park green space. As an old industrial base, this region has a relatively high level of urbanization but low quality. Rural populations migrating to cities struggle to fully integrate, resulting in the coexistence of pressure on urban construction land and rural hollowing-out. Meanwhile, medical resources are highly concentrated in cities, which further weakens the carrying capacity of rural areas.
Proportions of primary industry, per capita GDP, and urban population share all exert a markedly negative influence in North China. A high proportion of agriculture restricts the development of non-agricultural sectors. The outflow of rural labor is not synchronized with urban expansion and coupled with the poor flow of factors between urban and rural areas, the imbalance in the population density structure of built-up areas has been exacerbated.
Cultivated land proportion, average elevation, and temperature across East China function as positive contributors, while per capita grain availability serves as a negative one. The intensive utilization of cultivated land resources and the advantages of natural conditions support urban-rural coordination. However, the labor surplus brought about by the improvement of agricultural mechanization has formed a certain tension with the demand for urban expansion.
Average wages of urban employees in South China exert a positive influence on the urban-rural resident income ratio, whereas per capita GDP and the share of cultivated land exert negative effects. The improvement of wage levels helps to narrow the urban-rural gap, but the coexistence of excessive expansion of core cities and constraints on cultivated land protection restricts the further improvement of the coordination level.
Average wages of employed workers, urban-rural income disparity, and cultivated land percentage stand as the primary determinants shaping Central China’s development dynamics. The increase in wages promotes the rational flow of labor force, while the cultivated land protection policy restricts the adjustment of rural construction land, which exacerbates the imbalance between population and land allocation.
Cultivated land proportion, per capita grain availability, and urban population share in Northwest China act as the primary restrictive factors. Constrained by resources and natural conditions, the outflow of rural population coexists with insufficient efficiency of urban expansion, and the level of urban-rural coordination remains restricted.
The proportion of the primary industry and the urban-rural residents’ income ratio in Southwest China have a significant positive impact, while the urban population ratio and the per capita park green space area have a negative impact. The primary industry plays a key role in stabilizing the rural population and supporting the population density of built-up areas, and it is an important foundation for the region to maintain a high degree of coordination.
5.2. Comparison with Existing Research
The current body of literature on urban-rural issues predominantly examines either urban or rural areas in isolation, seldom treating them as an integrated system for holistic analysis. For example, Li et al. (2020) [30] used multiscale analysis to reveal the synergy between urban population growth and built-up land expansion in China. Chen et al. (2024) [19] investigated the link between population distribution and underground space use in Jiangsu, employing Baidu Heatmaps for real-time population data, which offered valuable insights into urban changes. Nonetheless, these works often overlook the concurrent developments in rural areas and their potential impact on the overall process.
Conversely, rural-focused studies, such as those by Song and Liu(2014) [62], utilize decoupling analysis to examine the relationship between rural populations and settlement land. Zhu et al. (2020) [63] extended this by examining both static and dynamic relationships between rural populations and settlements in Jiangsu Province. Liu et al. (2022) [47] analyzed population and homestead land distribution across 268 villages in Yuzhong County, finding a coupling relationship between population density and residential land use, thus addressing gaps in rural research. Schiavina et al. (2022) [64] explored European population growth and built-up land using demographic and remote sensing data, offering insights into urban expansion, yet these studies fail to comprehensively depict the intricate connections between urban and rural systems.
Notably, Wang et al. (2017) [65] and Zhu et al. (2020) [63] did attempt to analyze urban-rural population and built-up land trends through spatiotemporal frameworks in China, but these studies are often region-specific and lack a nationwide perspective. In conclusion, while existing research has advanced our understanding of individual urban or rural issues, there remains a gap in fully illustrating the dynamic interaction mechanisms and intrinsic links between urban and rural systems.
5.3. Policy Insights
The research results show that the coupling coordination of population density in urban and rural built-up areas presents obvious spatial differentiation, with an overall pattern of being higher in the southwest and lower in the northeast. Policy recommendations should accordingly adopt classified governance and formulate operable measures based on the mechanism revealed by the regression results.
First, implement differentiated goals according to coordination status. For regions with high coordination in the southwest, the focus should be on stability and quality improvement. Priority should be given to restricting suburban expansion and promoting stock renewal, strengthening the restrictive relationship between newly increased construction land and population changes, and guiding population and construction activities to gather in existing built-up areas and transportation corridors, so as to avoid weakening the coordination quality due to extensive expansion. For regions with low coordination in the northeast, differentiated handling by type is appropriate. For cities with industrial and node conditions, the improvement of county-level employment and public service accessibility should be taken as the starting point to enhance the possibility of population retention and return. For areas with continuous population loss, priority should be given to promoting smart shrinkage. The overall efficiency should be improved through the integration of rural construction land and the compression of inefficient built-up areas, so as to reduce the use of expansionary land allocation to offset population decline.
Second, directly translate the significant factors into intervention directions. The negative effect of per capita GDP indicates that suburbanization and spatial expansion are more likely to occur against the background of economic growth, and the focus of governance should be placed on suburban growth management and internal structure optimization. In addition, improving the coordination degree relies more on the productive targeted investment and human capital enhancement in rural areas and counties. Priority can be given to supporting industrial chain supporting facilities, logistics and digital infrastructure to form a linkage between investment and employment. The agricultural variables show a positive-negative direction difference, indicating that pure efficiency improvement may accelerate labor outflow. Therefore, it is necessary to promote the extension of agriculture to processing, services, cultural and tourism industries, and expand local employment types. The negative effect of public green space suggests the need to improve land allocation efficiency. It is advisable to focus on small-scale, embedded greening and brownfield restoration to reduce the occupation of functional land.
Third, policy priorities should be configured in consideration of regional heterogeneity. Eastern and southern regions should prioritize suburbanization control and land use efficiency improvement, guiding investment to shift from incremental expansion to efficiency and human capital. Central regions should strengthen the capacity of counties to undertake industries and employment, so as to reduce the risk of rural hollowing-out. Under the condition of strong natural constraints, northwest regions should focus on improving weak links in public services and developing eco-friendly industries, promoting node-based intensive layout. On the basis of maintaining their advantages, southwest regions should pay more attention to the quality of coordination and constraints on expansion. Northeast regions need to implement classified governance between targeted revitalization and smart shrinkage and improve overall efficiency through land consolidation and service system reconstruction.
6. Conclusions
Through an analysis of the coupling coordination degree and its influencing factors between population density in urban and rural built-up land across 296 cities in China from 2010 to 2020, the following conclusions are derived:
- (1)
- Over the study period, the PUL increased gradually, whereas the PRL declined rapidly. Initially, high values were concentrated in the Sichuan-Chongqing region and subsequently expanded to adjacent areas, resulting in a notable spatial differentiation pattern characterized by higher values in the southwest and lower values in the northeast. When comparing PUL and PRL, the gap in most regions first narrowed and then widened, whereas in the southwest, it first widened and then narrowed.
- (2)
- From a temporal perspective, the coordination issue between urban and rural built-up land space and population density has intensified. Spatially, high-value areas of coupling coordination degree between population density in urban and rural built-up land are primarily concentrated in the southwest, particularly centering on Sichuan, exhibiting a trend of gradual diffusion from the core to the periphery. The coupling coordination degree exhibits significant spatial autocorrelation, indicating that high-value areas are adjacent to each other, and similarly, low-value areas are contiguous.
- (3)
- The analysis of influencing factors shows that factors such as wage level and the proportion of the primary industry generally help to alleviate the differentiation of the population density structure between urban and rural built-up areas, while the rise in the proportion of urban population, the increase in per capita public green space, and the increase in per capita gross domestic product (GDP) in certain development stages are often accompanied by low-density development and the dilution of population density in urban built-up areas, thereby weakening the level of coupling coordination. In terms of natural location, the average altitude and temperature are significantly positively correlated with the degree of coupling coordination.
This study has the following limitations. Firstly, when analyzing the coupling coordination degree between the population in urban and rural built-up land, it did not consider seasonal variations in population and cultural factors. Secondly, cultural backgrounds and traditional customs also influence individuals’ lifestyles, residential preferences, and social interactions. Due to the constraints on the availability and comparability of city-level data, this paper does not introduce more direct indicators related to the labor market and migration, such as the unemployment rate, the ratio of wages to housing costs, and other variables reflecting the relative residential attractiveness. Thirdly, it should be noted that this study primarily measures the degree of coupling coordination, without further interpreting what specific levels of D imply in practical, context-specific terms, such as policy performance, well-being outcomes, or ecological trade-offs. Future research will delve deeper into these aspects.
Author Contributions
Conceptualization, Y.R.; methodology, Y.R.; software, Y.R.; validation, Y.R. and C.W.; formal analysis, C.W. and K.Z.; resources, C.W.; writing—original draft preparation, C.W. and K.Z.; writing—review and editing, Y.R., C.W., K.Z. and Q.H. All authors have read and agreed to the published version of the manuscript.
Funding
This research is funded by National Social Science Fund of China (Grant Number: 24BMZ042); National Natural Science Foundation of China (Grant Number: 42371424); Natural Science Foundation of Hubei Province (Grant Number: 2023AFB630); Fundamental Research Funds for the Central Universities of South-Central Minzu University (Grant Number: CSQ24035; CSZ24001); Research Center for Forging a Strong Sense of Community for the Chinese Nation, South-central Minzu University (Grant Number: JDY23013); Fund for Academic Innovation Teams of South-Central Minzu University (Grant Number: XTS24023).
Data Availability Statement
The datasets analyzed during the current study are available from the corresponding author upon reasonable request.
Conflicts of Interest
The authors declare no conflicts of interest.
References
- Cattaneo, A.; Adukia, A.; Brown, D.L.; Christiaensen, L.; Evans, D.K.; Haakenstad, A.; McMenomy, T.; Partridge, M.; Vaz, S.; Weiss, D.J. Economic and social development along the urban–rural continuum: New opportunities to inform policy. World Dev. 2022, 157, 105941. [Google Scholar] [CrossRef] [Scilit]
- Jiang, H.; Guo, H.; Sun, Z.; Xing, Q.; Zhang, H.; Ma, Y.; Li, S. Projections of urban built-up area expansion and urbanization sustainability in China’s cities through 2030. J. Clean. Prod. 2022, 367, 133086. [Google Scholar] [CrossRef] [Scilit]
- Chen, K.; Long, H.; Liao, L.; Tu, S.; Li, T. Land use transitions and urban-rural integrated development: Theoretical framework and China’s evidence. Land Use Policy 2020, 92, 104465. [Google Scholar] [CrossRef] [Scilit]
- Wang, Z.; Ou, L.; Chen, M. Evolution characteristics, drivers and trends of rural residential land in mountainous economic circle: A case study of Chengdu-Chongqing area, China. Ecol. Indic. 2023, 154, 110585. [Google Scholar] [CrossRef] [Scilit]
- Qiang, H.; Hu, L. Population and capital flows in metropolitan Beijing, China: Empirical evidence from the past 30 years. Cities 2022, 120, 103464. [Google Scholar] [CrossRef] [Scilit]
- Zhou, Y.; Zhong, Z.; Cheng, G. Cultivated land loss and construction land expansion in China: Evidence from national land surveys in 1996, 2009 and 2019. Land Use Policy 2023, 125, 106496. [Google Scholar] [CrossRef] [Scilit]
- Wu, Y.; Zhou, Y.; Liu, Y. Exploring the outflow of population from poor areas and its main influencing factors. Habitat Int. 2020, 99, 102161. [Google Scholar] [CrossRef] [Scilit]
- Güler, K.; Kâhya, Y. Developing an approach for conservation of abandoned rural settlements in Turkey. A|Z ITU J. Fac. Archit. 2019, 16, 97–115. [Google Scholar] [CrossRef] [Scilit]
- Ma, L.; Liu, S.; Fang, F.; Che, X.; Chen, M. Evaluation of urban-rural difference and integration based on quality of life. Sustain. Cities Soc. 2020, 54, 101877. [Google Scholar] [CrossRef] [Scilit]
- World Bank; Development Research Center of the State Council, P.R. China (DRC). Urban China: Toward Efficient, Inclusive, and Sustainable Urbanization; World Bank: Washington, DC, USA, 2014; Available online: https://documents1.worldbank.org/curated/en/274891468018263655/pdf/Urban-China-toward-efficient-inclusive-and-sustainable-urbanization.pdf (accessed on 17 December 2025).
- Gong, P.; Liang, S.; Carlton, E.J.; Jiang, Q.; Wu, J.; Wang, L.; Remais, J.V. Urbanisation and health in China. Lancet 2012, 379, 843–852. [Google Scholar] [CrossRef] [Scilit]
- Smyth, R.; Mishra, V.; Qian, X. The Environment and Well-Being in Urban China. Ecol. Econ. 2008, 68, 547–555. [Google Scholar] [CrossRef] [Scilit]
- Liu, Y.; Liu, Y.; Chen, Y.; Long, H. The process and driving forces of rural hollowing in China under rapid urbanization. J. Geogr. Sci. 2010, 20, 876–888. [Google Scholar] [CrossRef] [Scilit]
- Long, H.; Li, Y.; Liu, Y.; Woods, M.; Zou, J. Accelerated restructuring in rural China fueled by ‘increasing vs. decreasing balance’ land-use policy for dealing with hollowed villages. Land Use Policy 2012, 29, 11–22. [Google Scholar] [CrossRef] [Scilit]
- Li, Y.; Liu, Y.; Long, H.; Cui, W. Community-based rural residential land consolidation and allocation can help to revitalize hollowed villages in traditional agricultural areas of China: Evidence from Dancheng County, Henan Province. Land Use Policy 2014, 39, 188–198. [Google Scholar] [CrossRef] [Scilit]
- Shen, H.; Teng, F.; Song, J. Evaluation of Spatial Balance of China’s Regional Development. Sustainability 2018, 10, 3314. [Google Scholar] [CrossRef] [Scilit]
- Chan, K.W. The Household Registration (Hukou) System and Migrant Labor in China: Notes on a Debate. Popul. Dev. Rev. 2010, 36, 357–364. [Google Scholar] [CrossRef] [Scilit]
- National Bureau of Statistics of China (NBS). Main Data of the Seventh National Population Census; National Bureau of Statistics of China (NBS): Beijing, China, 2021; pp. 1–6. Available online: https://www.stats.gov.cn/english/PressRelease/202105/t20210510_1817185.html (accessed on 17 December 2025).
- Chen, S.-J.; Dai, Q.; Liu, X.-Y. Coupling coordination and interactive relationship between population urbanization and land urbanization from the perspective of shrinking cities: A case study of Jiangsu Province, China. Front. Environ. Sci. 2024, 12, 1423221. [Google Scholar] [CrossRef] [Scilit]
- Chen, Y.; Zhang, S.; Ye, Q.; Chen, W.; Li, Y.; Cai, E.; Kong, X.; Guo, L.; Li, J. Research on the Spatiotemporal Coupling Characteristics between Urban Population and Land in China Based on the Improved Coupling Model of Polar Coordinates. Land 2024, 13, 1101. [Google Scholar] [CrossRef] [Scilit]
- Chen, S.; Yu, D. Spatio-temporal coupling and influencing factors of man–land relationship in the urbanization process of Yangtze River Delta. World Reg. Stud. 2025, 34, 114. [Google Scholar] [CrossRef]
- Friedmann, J. Regional Development Policy: A Case Study of Venezuela; MIT Press: Cambridge, MA, USA, 1966. [Google Scholar]
- Krugman, P. Increasing returns and economic geography. J. Polit. Econ. 1991, 99, 483–499. [Google Scholar] [CrossRef] [Scilit]
- Hou, Y.; Huang, Q.; Ren, Q.; Gu, T.; Zhou, Y.; Wu, P.; Fan, Y.; Zhu, G. Spatiotemporal dynamics of urban sprawl in China from 2000 to 2020. GISci. Remote Sens. 2024, 61, 2351262. [Google Scholar] [CrossRef] [Scilit]
- Bai, X.; Chen, J.; Shi, P. Landscape urbanization and economic growth in China. Environ. Sci. Technol. 2012, 46, 132–139. [Google Scholar] [CrossRef] [Scilit] [PubMed]
- Tong, D.; Wang, Q.; Cao, X. How land finance drives urban expansion under fiscal pressure: Evidence from Chinese cities. Land 2022, 11, 253. [Google Scholar] [CrossRef] [Scilit]
- Wang, X.; Zhang, X. A regional comparative study on the mismatch between population urbanization and land urbanization in China. PLoS ONE 2023, 18, e0287366. [Google Scholar] [CrossRef] [Scilit]
- Long, H.; Tu, S. Rural restructuring in China: Theory, approaches and research prospect. J. Geogr. Sci. 2017, 27, 1169–1184. [Google Scholar] [CrossRef] [Scilit]
- Tong, D.; Sun, Y.; Tang, J.; Luo, Z.; Lu, J.; Liu, X. Modeling the interaction of internal and external systems of rural settlements: The case of Guangdong, China. Land Use Policy 2023, 132, 106830. [Google Scholar] [CrossRef] [Scilit]
- Li, Y.; Kong, X.; Zhu, Z. Multiscale analysis of the correlation patterns between the urban population and construction land in china. Sustain. Cities Soc. 2020, 61, 102326. [Google Scholar] [CrossRef] [Scilit]
- Liu, Y.; Zang, Y.; Yang, Y. China’s rural revitalization and development: Theory, technology and management. J. Geogr. Sci. 2020, 30, 1923–1942. [Google Scholar] [CrossRef] [Scilit]
- Liao, L.; Long, H.; Gao, X.; Ma, E. Effects of land use transitions and rural aging on agricultural production in China’s farming area: A perspective from changing labor employing quantity in the planting industry. Land Use Policy 2019, 88, 104152. [Google Scholar] [CrossRef] [Scilit]
- Gao, J.; Song, G.; Sun, X. Does labor migration affect rural land transfer? Evidence from China. Land Use Policy 2020, 99, 105096. [Google Scholar] [CrossRef] [Scilit]
- Zhou, D.; Qi, J.; Zhong, W. Review of urban–rural integration evaluation: Connotation identification, theoretical analysis, and system reconstruction. J. Nat. Resour. 2021, 36, 2634–2651. [Google Scholar] [CrossRef] [Scilit]
- Wang, Y.; Lu, Y.; Zhu, Y. Can the integration between urban and rural areas be realized? A new theoretical analytical framework. J. Geogr. Sci. 2024, 34, 3–24. [Google Scholar] [CrossRef] [Scilit]
- Yang, Y.; Bao, W.; Wang, Y.; Liu, Y. Measurement of urban–rural integration level and its spatial differentiation in China in the new century. Habitat Int. 2021, 117, 102420. [Google Scholar] [CrossRef] [Scilit]
- Wei, L.; Zhao, X.; Lu, J. Measuring the Level of Urban–Rural Integration Development and Analyzing the Spatial Pattern Based on the New Development Concept: Evidence from Cities in the Yellow River Basin. Int. J. Environ. Res. Public Health 2023, 20, 15. [Google Scholar] [CrossRef] [Scilit]
- He, Y.; Wen, C.; Fang, X.; Sun, X. Impacts of urban–rural integration on landscape patterns and implications for sustainability. Landsc. Ecol. 2024, 39, 1409–1427. [Google Scholar] [CrossRef] [Scilit]
- Qin, Y.; Xu, J.; Zhang, H.; Ren, W. The measurement of the urban–rural integration level of resource-exhausted cities—A case study of Zaozhuang City, China. Sustainability 2023, 15, 418. [Google Scholar] [CrossRef] [Scilit]
- Chen, X.; Lang, W.; Yuan, Y.; Yan, G.; Hou, X. Conceptualizing the nexus between spatiotemporal shrinkage patterns of natural cities and driving mechanisms: Insights into urban shrinkage in Northeast China. Cities 2024, 152, 105179. [Google Scholar] [CrossRef] [Scilit]
- Silver, W. Economics and Information Theory. J. Oper. Res. Soc. 1967, 18, 328. [Google Scholar] [CrossRef] [Scilit]
- Lei, W.; Jiao, L.; Xu, G. Understanding the urban scaling of urban land with an internal structure view. Land Use Policy 2022, 112, 105781. [Google Scholar] [CrossRef] [Scilit]
- Anselin, L. Local indicators of spatial association—LISA. Geogr. Anal. 1995, 27, 93–115. [Google Scholar] [CrossRef] [Scilit]
- Tian, Y.; Kong, X.; Liu, Y.; Wang, H. Restructuring rural settlements based on an analysis of inter-village social connections: A case in Hubei Province, Central China. Habitat Int. 2016, 57, 121–131. [Google Scholar] [CrossRef] [Scilit]
- Ning, J.; Liu, J.; Kuang, W.; Xu, X.; Zhang, S.; Yan, C.; Li, R.; Wu, S.; Hu, Y.; Du, G.; et al. Spatiotemporal patterns and characteristics of land-use change in China during 2010–2015. J. Geogr. Sci. 2018, 28, 547–562. [Google Scholar] [CrossRef] [Scilit]
- Wang, Z.; Zeng, J.; Chen, W. Impact of urban expansion on carbon storage under multi-scenario simulations in Wuhan, China. Environ. Sci. Pollut. Res. 2022, 29, 45507–45526. [Google Scholar] [CrossRef] [Scilit] [PubMed]
- Liu, S.; Ma, L.; Yao, Y.; Cui, X. Man-land relationship based on the spatial coupling of population and residential land–A case study of Yuzhong County in Longzhong Loess Hilly Region, China. Land Use Policy 2022, 116, 106059. [Google Scholar] [CrossRef] [Scilit]
- Ren, Y.; Yang, J.; Zhang, C.; Zhao, Z.; Wang, J.; Wang, Y.; Gong, J. Urbanization of County in China: Differentiation and Influencing Factors of Spatial Matching Relationships between Urban Population and Urban Land. China Land Sci. 2023, 37, 92–103. [Google Scholar] [CrossRef]
- Xu, W.; Wang, M.; Zheng, J.; Liu, C. Spatio-temporal Evolution Characteristics and Driving Factors of Coupling and Coordination of Urbanization and Greenization in Yangtze River Economic Belt. Resour. Environ. Yangtze Basin 2023, 32, 1561–1572. [Google Scholar] [CrossRef]
- Yang, L.; Chen, W.; Fang, C.; Zeng, J. How does the coordinated development of population urbanization and land urbanization affect residents’ living standards? Empirical evidence from China. Cities 2024, 149, 104922. [Google Scholar] [CrossRef] [Scilit]
- Khan, S.U.; Cui, Y. Identifying the impact factors of sustainable development efficiency: Integrating environmental degradation, population density, industrial structure, GDP per capita, urbanization, and technology. Environ. Sci. Pollut. Res. 2022, 29, 56098–56113. [Google Scholar] [CrossRef] [Scilit]
- Hu, Z.; Li, Y.; Long, H.; Kang, C. The evolution of China’s rural depopulation pattern and its influencing factors from 2000 to 2020. Appl. Geogr. 2023, 159, 103089. [Google Scholar] [CrossRef] [Scilit]
- Zhang, L.; Chen, S. Empirical Analysis on Spatio-Temporal Evolution and Driving Forces of Per Capita Grain Possession in China. Econ. Geogr. 2015, 35, 171–177. [Google Scholar] [CrossRef]
- Lv, T.; Wang, L.; Zhang, X.; Xie, H.; Lu, H.; Li, H.; Liu, W.; Zhang, Y. Coupling coordinated development and exploring its influencing factors in Nanchang, China: From the perspectives of land urbanization and population urbanization. Land 2019, 8, 178. [Google Scholar] [CrossRef] [Scilit]
- Li, J.; Feng, H.; Lin, R. Evolution and Influencing Factors of Coupling Coordination Between New-type Urbanization and Common Prosperity in China. Econ. Geogr. 2024, 44, 86–95. [Google Scholar] [CrossRef]
- Jiang, C.; Li, J.; Liu, J. Does urbanization affect the gap between urban and rural areas? Evidence from China. Socio-Econ. Plan. Sci. 2022, 82, 101271. [Google Scholar] [CrossRef] [Scilit]
- Feng, Z.; Tang, Y.; Yang, Y.; Zhang, D. Relief degree of land surface and its influence on population distribution in China. J. Geogr. Sci. 2008, 18, 237–246. [Google Scholar] [CrossRef] [Scilit]
- Peng, S.Z. 1 km Monthly Mean Temperature Dataset for China (1901–2024); National Tibetan Plateau/Third Pole Environment Data Center: Beijing, China, 2019. [Google Scholar] [CrossRef]
- Jin, D.; Dai, L. Temporal and Spatial Characteristics and Driving Factors of Coordinated Development between Population Urbanization and Land Urbanization in China. China Land Sci. 2021, 35, 74–84. [Google Scholar] [CrossRef]
- Zhang, W.; Wang, M.Y. Spatial-temporal characteristics and determinants of land urbanization quality in China: Evidence from 285 prefecture-level cities. Sustain. Cities Soc. 2018, 38, 70–79. [Google Scholar] [CrossRef] [Scilit]
- Guo, A.; Yang, J.; Xiao, X.; Xia, J.; Jin, C.; Li, X. Influences of urban spatial form on urban heat island effects at the community level in China. Sustain. Cities Soc. 2020, 53, 101972. [Google Scholar] [CrossRef] [Scilit]
- Song, W.; Liu, M. Assessment of decoupling between rural settlement area and rural population in China. Land Use Policy 2014, 39, 331–341. [Google Scholar] [CrossRef] [Scilit]
- Zhu, C.; Zhang, X.; Wang, K.; Yuan, S.; Yang, L.; Skitmore, M. Urban–rural construction land transition and its coupling relationship with population flow in China’s urban agglomeration region. Cities 2020, 101, 102701. [Google Scholar] [CrossRef] [Scilit]
- Schiavina, M.; Melchiorri, M.; Corbane, C.; Freire, S.; Batista e Silva, F. Built-up areas are expanding faster than population growth: Regional patterns and trajectories in Europe. J. Land Use Sci. 2022, 17, 591–608. [Google Scholar] [CrossRef] [Scilit]
- Wang, C.; Liu, Y.; Kong, X.; Li, J. Spatiotemporal decoupling between population and construction land in urban and rural Hubei province. Sustainability 2017, 9, 1258. [Google Scholar] [CrossRef] [Scilit]

Disclaimer/Publisher’s Note: The statements, opinions and data contained in all publications are solely those of the individual author(s) and contributor(s) and not of MDPI and/or the editor(s). MDPI and/or the editor(s) disclaim responsibility for any injury to people or property resulting from any ideas, methods, instructions or products referred to in the content. |
© 2026 by the authors. Licensee MDPI, Basel, Switzerland. This article is an open access article distributed under the terms and conditions of the Creative Commons Attribution (CC BY) license.