


Abstract
Beautiful Leisure Tourism Villages (BLTVs) represent an effective pathway for advancing high-quality rural industrial development and promoting comprehensive rural revitalization. They are of great significance to enriching new rural business formats and new functions. The analysis is interpreted within an integrated location–distance attenuation framework. Based on the methods of spatial clustering analysis, geographical linkage rate and geographical weighted regression, the spatio-temporal evolution of 1982 BLTVs in China up to 2023 was examined to uncover the underlying driving mechanisms. Findings indicated that (1) a staged expansion in the number of villages across China, with the most pronounced growth occurring between 2014 and 2018, averaged 124 new villages per year; their stage characteristics showed an obvious “unipolar core-bipolar multi-core-bipolar network” development model; (2) the barycenters of villages were all located in Nanyang City of Henan Province; they migrated from east to west, and formed a push and pull migration trend from east to west and then east; (3) the spatial distribution of villages was highly aggregated and demonstrated marked regional heterogeneity, following a south–north and east–west gradient, with the highest concentration in Jiangzhe and the lowest in Ningxia Hui Autonomous Region; and (4) natural ecology, hydrological and climatic conditions, socioeconomic context, transportation accessibility, and resource endowment collectively shaped the spatial layout of villages, exhibiting pronounced spatial variation in the intensity of these driving factors. On the whole, topography, social economy, traffic condition and precipitation condition had greater influences on the spatial distribution of villages in the western than in the eastern part of China. In contrast, the effects of resource endowment and temperature on the spatial distribution of BLTVs were stronger in eastern China than in western China. These findings enhance the theoretical understanding of tourism-oriented rural development by integrating spatio-temporal evolution with a location–distance attenuation perspective and provide differentiated guidance for the sustainable development of BLTVs across regions.
1. Introduction
Beauty is the basic endowment of the countryside, and leisure is the free activity of mankind. Rural leisure tourism refers to tourism and recreation activities that take place in rural areas and are primarily motivated by leisure, relaxation, and experiential consumption, typically relying on rural landscapes, agricultural production, local culture, and village life as core attractions [1]. Beautiful leisure rural industry has distinct advantages, perfect service facilities, good village customs, and obvious brand effect, with beautiful scenery, customs, beauty, and other characteristics, the first, second, and third industries integrated in development. With the acceleration of China’s new-type urbanization process and rapid economic development [2,3], rural leisure tourism has become the spiritual demand of urban residents to escape from the city life temporarily and return to the wilderness ecology, and rural tourism destinations have increasingly become an important choice for urban residents to travel [4]. It generally includes short-break trips, sightseeing, agritainment, cultural experiences, and wellness-oriented recreation in rural settings, characterized by multifunctional land-use integration across agriculture, services, and community life. Rural leisure tourism has attracted increasing academic attention both domestically and internationally, and the discussion on rural leisure was earlier in global academia, which mainly focused on the sustainable development of rural tourism [5,6,7,8,9] and the spatial distribution characteristics and spatial evolution laws of rural tourism [10,11,12,13,14,15]. Most of the scholars are geographers and spatial economists [16,17,18]. Under the background of the in-depth promotion of new-type urbanization and the comprehensive implementation of rural revitalization strategy in China, rural leisure tourism has gained increasing attention among Chinese scholars [19,20,21], with research spanning multiple disciplines, including geography, sociology, and agronomy.
Against this backdrop, the construction of Beautiful Leisure Tourism Villages (BLTVs) can be regarded as an institutionalized and spatially explicit form of rural leisure tourism development, representing policy-recognized rural destinations with comparatively strong leisure functions and service capacity. According to official data from China, 1982 BLTVs were designated nationwide between 2010 and 2023. The promotion of BLTVs is one of the main ways to develop rural tourism, and its selection and monitoring activities have significantly contributed to the nationwide expansion of the villages across China [22]. Over the past years, China has consistently prioritized the development of BLTVs, with pace and quality becoming key drivers in advancing the national rural revitalization initiative. Rural leisure tourism has emerged as a key avenue through which both urban and rural populations seek cultural and spiritual fulfillment, increase rural farmers’ income and get rich, enhance rural livelihood value, and realize agricultural and rural modernization, providing strong support for comprehensively promoting rural revitalization.
Research on BLTVs and closely related designation-based rural leisure destinations has gradually emerged as an important research topic in the fields of rural tourism, land-use change, and rural revitalization, especially in the context of policy-driven rural development in China. Existing studies can be broadly grouped into three strands. The first strand focuses on development-oriented assessments of leisure-agriculture and rural tourism demonstration sites (e.g., performance/efficiency evaluation and construction experience) [7,8,11,12,13,14,15]. Related studies have explored BLTVs from multiple perspectives, including efficiency evaluation, spatial organization, and formation mechanisms, providing important references for understanding tourism-oriented rural development. For example, efficiency evaluation studies have been conducted at the city scale using demonstration sites of leisure agriculture and rural tourism as research objects [23]. The second strand documents spatial patterns and their evolution (e.g., clustering, regional differentiation, and center-of-gravity shifts) [24,25,26,27,28]. Existing research has gradually shifted from purely descriptive analyses toward data-driven approaches [19,20,21,29,30] that integrate quantitative methods [31]. The third strand investigates determining factors and mechanisms, increasingly adopting quantitative spatial methods to capture spatial heterogeneity. Studies have examined the formation mechanisms of rural tourism resources, revealing the roles of natural conditions, socioeconomic development, and transportation accessibility [32,33,34]. Despite these advances, three gaps remain. First, many studies examine rural leisure tourism destinations, demonstration sites, or “national leisure villages”, but national-scale evidence explicitly targeting BLTVs as a policy-defined and continuously updated designation system remains limited, making it difficult to evaluate their long-term spatial dynamics. Second, existing work often emphasizes static patterns at a single time point, while the full-process evolution over a long time span—particularly staged expansion, barycenter migration, and the transition from core concentration to networked configurations—has not been sufficiently quantified and interpreted. Third, although spatial econometric approaches are increasingly adopted, interpretations frequently remain at the level of local coefficient descriptions; a unified theoretical framing that links regional development dynamics (core–periphery and diffusion), rural restructuring, and market interaction under distance attenuation to explain east–west heterogeneity is still underdeveloped. Accordingly, the following review and gap identification are framed around BLTVs and closely comparable designation-based leisure village systems, rather than rural leisure tourism in general.
To address these gaps, this study constructs a national dataset of 1982 villages (2010–2023) and combines spatial clustering, geographical linkage analysis, and GWR to (i) reveal staged spatio-temporal evolution and barycenter dynamics, (ii) quantify spatially heterogeneous driving forces, and (iii) interpret the findings within an integrated location–distance attenuation perspective to provide region and stage-sensitive implications for tourism-oriented rural development. The findings provide theoretical insights into advancing high-quality tourism development amid China’s rural revitalization. This study makes three distinct contributions beyond reporting descriptive results. Empirically, we advance a mechanism-oriented explanation for tourism-oriented rural settlement patterns by integrating location advantages with distance attenuation and by clarifying how environmental feasibility constraints, market interaction, and resource-led agglomeration jointly shape spatial differentiation. Methodologically, we provide a transparent, reproducible analytical workflow that links stage-based evolution analysis with spatial clustering diagnostics and spatially varying inference, combining OLS-based diagnostics with GWR to reveal spatial non-stationarity rather than relying on global-average effects. In terms of application, we translate the heterogeneous driver patterns into actionable, region-sensitive development pathways: quality-oriented upgrading and cluster governance in eastern China; corridor-based connectivity and balanced diffusion in central China; and accessibility improvement aligned with environmental suitability and resource-led clustering around scenic nodes in western China. These pathways offer an evidence-based reference for differentiated destination planning, inter-village cooperation, and sustainable rural land development.
2. Materials and Methods
2.1. Materials
The paper utilizes data obtained from 14 batches of China’s BLTVs officially announced by the Ministry of Agriculture and Rural Affairs (http://www.moa.gov.cn/). This study focuses on mainland China at the provincial scale (31 provincial-level administrative units). Hong Kong SAR, Macao SAR, and Taiwan are not included because the BLTV list used in this study is derived from the official designation program released by the competent mainland authority, which follows a mainland administrative/institutional framework and does not provide directly comparable designation records for these territories. This exclusion does not imply an absence of rural tourism or “beautiful village” practices in Hong Kong, Macao, or Taiwan; rather, it reflects differences in institutional systems and data availability/compatibility within the official program scope. The dataset encompasses 40 villages designated as China’s charming leisure tourism villages (2010–2013), 220 sites recognized as BLTVs (2014–2015), and 1722 additional villages identified between 2016 and 2023. The study population is defined as all officially designated BLTVs released by the competent national authority during 2010–2023. Accordingly, the compiled dataset of 1982 BLTVs is practically equivalent to a census (census-equivalent population) for this policy-defined category. Nevertheless, villages with similar leisure-tourism functions that were not officially designated are not included, which may introduce selection bias associated with administrative recognition. We acknowledge this issue and discuss its implications for interpretation in Section 5.3. The initial stage contains a relatively small number of villages (n = 40), which can increase uncertainty in early-stage spatial pattern characterization. To address this issue, we (i) treated 2010–2013 as an initial/pilot phase and emphasized robust comparisons across later stages with much larger samples; (ii) applied consistent spatial analysis settings (e.g., KDE parameters) across stages to ensure comparability while recognizing that early-stage density surfaces are inherently sparser; and (iii) interpreted early-stage structural features conservatively (e.g., the presence of an initial core), avoiding over-inference regarding fine-grained multi-core or network attributes in this period. Spatial coordinates of these samples were retrieved via the Amap API for geolocation purposes; minor positional uncertainty may exist for some villages and does not affect the overall spatial pattern analysis. Village coordinates were obtained using the Amap (Gaode) API through standardized place-name queries that combined village names with administrative identifiers (province–city–county). For each village, a single representative point was retained by prioritizing the village administrative center/committee point of interest (POI) when available; otherwise, the best-matched village-level POI returned by the API was used. To control positional uncertainty, a quality-control procedure was implemented that included (i) a random manual review of approximately 5% of the villages against satellite imagery and official map interfaces; (ii) rule-based re-queries for ambiguous or low-confidence matches; and (iii) boundary-consistency checks to ensure that coordinates fell within the reported county. Records with evident mismatches were corrected by manual adjustment or excluded and documented. Considering the national-scale mapping and the analytical resolution adopted (e.g., kernel density estimation, buffer-based proximity analysis, and provincial-scale modeling), a positional tolerance within approximately 0.5–1.0 km was considered acceptable and unlikely to affect the main spatial pattern results [35].
With reference to existing studies [36,37,38], this study identifies six key dimensions, including natural ecology, hydrological setting, climatic context, socio-economic foundation, transportation accessibility, and tourism resources, that shape the spatial configuration of villages. The data of the digital elevation model were derived from the 30 m resolution data of the geospatial data cloud “China STRM DEM Dataset” (http://www.gscloud.cn/). The study involved population and economic data from the National Bureau of Statistics (http://www.stats.gov.cn) and Statistical Yearbook 2024 released by Statistical bureau of provinces, municipalities, and autonomous regions. Tourism resource data were obtained via the official website of China’s Ministry of Culture and Tourism (http://www.mct.gov.cn). Information on rivers, transportation infrastructure, and climatic conditions was sourced from the Resource and Environmental Science Data Center of the Chinese Academy of Sciences (RESDC) and supplemented by records from the U.S. National Climatic Data Center (NCDC). For visualization and comparative interpretation, BLTV points were categorized into three designation stages (2010–2013, 2014–2018, and 2019–2023) and mapped using three distinct colors (Figure 1).
Figure 1.
Elevation background of China and spatial distribution of BLTVs by designation stage (2010–2013, 2014–2018, and 2019–2023), with village points color-coded by stage.
2.2. Methods
In this paper, the spatio-temporal database of villages was first constructed, and then the spatio-temporal distribution patterns of 1982 sample sites were investigated using a combination of analytical tools, including spatial clustering analysis, spatial overlay analysis, geographical linkage rate, and correlation analysis. Furthermore, the study explored the key drivers underlying the spatial differentiation of China’s BLTVs.
(1) Kernel density estimation. According to the input factor data, the overall clustering tendency of BLTV locations (within the study area) was quantified to capture the degree of spatial aggregation, while the analysis mainly revealed the relative strength of each factor’s spatial influence. Higher values of the kernel density estimate, f(x), correspond to greater spatial clustering of BLTV locations and stronger spatial spillovers and shared development conditions.
Equation (1) defines the kernel density estimate (KDE) for point events (e.g., BLTVs), following the classic formulation [21,26] of kernel density methods. In Equation (1), is the kernel function and h is the bandwidth that controls the smoothing scale; n is the number of observed points, d denotes the data dimension, and () represents the distance between the evaluation location x and point xi. Larger values of f(x) indicate stronger spatial concentration of BLTVs and thus a higher likelihood of clustering. In this study, KDE is used to convert the discrete village locations into a continuous density surface, enabling the identification and comparison of high-density cores and their stage-based evolution across 2010–2013, 2014–2018, and 2019–2023.
(2) Nearest neighbor analysis. Following Tobler’s First Law of Geography, which states that spatial similarity and interaction tend to decrease with increasing distance, point-pattern analysis provides an appropriate approach for assessing whether spatial phenomena exhibit clustering, randomness, or dispersion [39]. In this study, the spatial arrangement of BLTVs is treated as a set of point features, and the nearest neighbor index (NNI) is applied to quantify their spatial distribution pattern.
The is calculated as the ratio between the observed mean nearest neighbor distance () and the expected mean distance () under a random spatial distribution. Values of indicate spatial clustering, suggests a random pattern, and implies spatial dispersion. Statistical significance was assessed using a Z-test (). This method enables an objective evaluation of whether BLTV locations are spatially aggregated beyond what would be expected by chance.
(3) Geographical linkage rate. The geographical linkage rate measures the degree of spatial coincidence (distributional consistency) between a target indicator and related factors across areal units, and it has been widely used to evaluate the matching relationship of two spatial distributions [16]. It is homologous to the family of the Index of Dissimilarity proposed by Duncan and Duncan (1955) [31]. This study employs the geographical linkage rate to investigate spatial associations between BLTVs and regional economic indicators. This relationship is expressed mathematically as follows:
In Formula (3), represents the geographical linkage rate, represents the share of BLTVs in region relative to the national total, and is the proportion of geographical elements in the total number of geographical elements in the region. The value of ranges from 1 to 100, and the greater the value of , the higher the degree of spatial coincidence of economic factors.
(4) Geographically weighted regression. By introducing the spatial location information into the regression equation, the geographical weighted regression model (GWR) [40] can realize the estimation of local parameters and explore the non-stationarity of spatial relations, revealing the geographical law more effectively than the traditional regression model. This study applies GWR model to examine the drivers shaping the spatial distribution of BLTVs.
In Formula (4), denote the coordinates of sample point and corresponds to the local value of the independent variable ; represents the residual, assumed to follow a normal distribution. Geographically weighted regression (GWR) was implemented in ArcGIS 10.8 using a Gaussian kernel. An adaptive bandwidth was adopted to account for the highly uneven spatial distribution of BLTVs across China. The optimal bandwidth was selected by minimizing the corrected Akaike Information Criterion (AICc), ensuring the best trade-off between model fit and complexity. This configuration allows local coefficients to be estimated under comparable neighborhood sizes and improves the robustness of spatially varying inference. All other GWR settings followed the standard implementation, and local coefficients were estimated at each observation location.
Why GWR rather than a global spatial econometric model (e.g., SDM)? Although spatial econometric models such as the spatial Durbin model are powerful for quantifying global average effects and potential spatial spillovers, they typically assume spatial stationarity of coefficients and mainly provide a single (global) parameter estimate for each driver. In contrast, our objective is explicitly to identify where and to what extent the effects of topography, accessibility, climate, socioeconomic conditions, and resource endowment vary across space, given the pronounced east–central–west gradients in China’s physical and market systems. Therefore, GWR is more suitable for this study because it allows regression relationships to vary locally and directly maps spatial heterogeneity in coefficients, which is essential for mechanism interpretation and region-sensitive pathways [41].
2.3. Research Framework
The research design links data, indicators, analytical methods, and result types in a coherent workflow (Figure 2). First, the official BLTV designation list (2010–2023) and validated village coordinates constitute the spatio-temporal database. Second, indicators were constructed to describe both patterns and drivers, including stage-based village counts, barycenter coordinates, kernel density surfaces, nearest neighbor distance metrics, geographical linkage measures between village distribution and provincial attributes, and a set of environmental–socioeconomic–accessibility–resource variables. Third, complementary methods were applied to produce different outputs: KDE identifies hotspots and core-to-network evolution; NNI tests whether BLTV locations are clustered beyond randomness; the geographical linkage rate quantifies spatial correspondence between BLTV counts and provincial attributes; and GWR captures spatially varying relationships between village density and potential drivers. Together, this framework supports an integrated interpretation of spatio-temporal dynamics and spatially heterogeneous mechanisms.
Figure 2.
Research framework connecting data sources, indicator construction, analytical methods (KDE, NNI, geographical linkage rate, and GWR), and expected result types.
2.4. Theoretical Framework: Integrating Location Theory and Spatial Distance Attenuation
The spatial distribution and evolution of BLTVs are shaped by the combined effects of location advantages and spatial interaction constraints. To address the limited theoretical integration in existing studies, this research constructs an analytical framework that combines location theory and spatial distance attenuation theory to interpret the spatio-temporal dynamics and driving mechanisms of BLTV development.
According to location theory, the spatial selection of tourism-oriented rural settlements depends primarily on location advantages, including environmental suitability, tourism resource endowment, socioeconomic foundations, and transportation accessibility. These factors determine the basic feasibility, development potential, and attractiveness of villages by influencing production conditions, service capacity, and tourist experience. Villages located in areas with stronger location advantages are more likely to emerge and form spatial clusters due to lower development costs and higher expected returns.
However, location advantages alone cannot fully explain observed spatial differentiation patterns. Spatial distance attenuation theory emphasizes that the intensity of spatial interaction between destinations and tourism markets declines as distance increases. In tourism geography, distance reflects not only physical separation but also time cost and accessibility constraints. Consequently, villages closer to major tourist source markets, urban centers, and transportation hubs benefit from stronger market interaction, higher tourist flows, and greater development intensity, whereas more remote villages face stronger distance-related constraints.
In this study, the spatial pattern of BLTVs is interpreted as the outcome of location advantages operating under distance attenuation constraints. Location-related factors define where villages can develop, while distance attenuation shapes the strength and spatial reach of market interaction, producing spatial gradients, clustering tendencies, and core–periphery structures. Moreover, the effects of location factors are expected to vary spatially under different distance conditions, resulting in regional heterogeneity in driving mechanisms.
This integrated framework provides a conceptual basis for variable selection and empirical analysis. By combining location-related indicators with distance-related evidence and applying spatial analytical methods, the study links empirical findings to classical spatial theories, thereby strengthening the theoretical contribution of tourism-oriented rural land development research.
3. Results
3.1. Temporal Evolution of Beautiful Leisure Tourism Villages
3.1.1. Changes in Village Quantity
It should be noted that the results reported in this section are aggregated spatial patterns derived from the official administrative designation list and geocoded village locations, rather than household or tourist survey microdata. To foster the coordinated growth of China’s primary, secondary, and tertiary rural sectors and enhance the multifunctional value of rural areas, Chinese government agencies have implemented a series of recreational rural development initiatives annually from 2010 onward. China’s BLTVs expanded markedly over 2010–2023, increasing from 10 villages in 2010 to a cumulative total of 1982 villages by 2023, of which 40 (2.02%) were selected from 2010 to 2013, 670 (33.80%) from 2014 to 2018, and 1272 (64.18%) from 2019 to 2023.
From 2010 to 2013, 10 villages were selected every year, and there are four consecutive villages in Beijing, including two in Miyun District; there are three in Shandong, Jiangsu, Fujian, Shaanxi, Jilin, Tianjin and other six provinces and cities; there are two in Zhejiang Province, Guizhou Province and Xinjiang Uygur Autonomous Region. One site is located across multiple regions, including Sichuan, Chongqing, Hunan, Hubei, Jiangxi, Guangxi, Liaoning, Hebei, Yunnan, Guangdong, Shanghai, and Tibet. From 2014 to 2018, the total number of villages increased rapidly, with an average annual increase of 124 compared with 2010–2013. The provinces of Zhejiang and Fujian, along with Xinjiang Uygur Autonomous Region, experienced the highest increases, with respective gains of 32, 30, and 28 villages. Tianjin Municipality, together with Tibet Autonomous Region, recorded the smallest increases of 11 and 12 villages, respectively. Between 2019 and 2023, China’s BLTVs continued to expand, albeit at a slower rate, with an average annual increase of 120 villages compared with 2014–2018. Zhejiang Province has consistently maintained the highest count of BLTVs, while Jiangsu, Anhui, Chongqing, and Sichuan have surpassed the previous top-ranked provinces since 2020.
3.1.2. Spatial Changes of Barycenters of Beautiful Leisure Tourism Villages
Barycenter shifts of China’s BLTVs reveal the spatial evolution tendencies of rural distribution. The migration trajectory moved from Weidu District, Xuchang City (2010–2013) to Nanzhao County, Nanyang City (2014–2018), and then to Wolong District, Nanyang City (2019–2023), with the centroid overall remaining in Wolong District (Figure 1). The barycenters migration track shows that in 2010–2013–2018, the barycenters of beautiful leisure village moved rapidly to the west and south, and the number of reviews changed greatly during this period; in 2023, the barycenters of beautiful leisure countryside continued to migrate south and slightly east, and the change was relatively stable during this period. From the perspective of the migration distance and speed of the barycenters in each stage, the migration of the barycenters of the beautiful leisure countryside changed from fast to slow down. The barycenters of China’s BLTVs shifted 161.02 km southwestward from the initial to the middle phase, followed by a 35.03 km southeastward movement during the subsequent phase transition. The distribution trend of the beautiful leisure countryside gradually maintained at a relatively stable level. On the whole, the gravity center migration amplitude is larger in the east–west direction, forming a push and pull migration trend from east to west and then east.
During the initial stage (2010–2013), newly designated villages were highly concentrated in eastern China, which accounted for 57.5% of the total increment, while central and western China accounted for 15.0% and 27.5%, respectively. In the rapid-expansion stage (2014–2018), the spatial increment became more evenly distributed, with the eastern, central, and western regions accounting for 41.2%, 28.8%, and 30.0%, respectively. In the later stage (2019–2023), the spatial increment exhibited a relatively balanced pattern, with eastern, central, and western China accounting for 37.2%, 32.7%, and 30.1%, respectively. Figure 3 visualizes the three-stage village distribution using period-specific colors and explicitly marks the corresponding barycenters (centroids) with labeled symbols and directional arrows to facilitate visual tracking of the migration.
Figure 3.
Spatial distribution of China’s Beautiful Leisure Tourism Villages by designation stage (2010–2013, 2014–2018, and 2019–2023) and barycenter (centroid) migration. Village locations are color-coded by stage; stage barycenters are marked with labeled symbols and connected by arrows showing migration direction and distance. The inset map enlarges the Nanyang area (Henan Province) where the barycenter remains located; the Heihe–Tengchong Line is shown as a demographic divide for east–west comparison.
3.1.3. Characteristics of the Above Changes at Different Stages
Kernel density estimation results for China’s BLTVs reveal marked spatio-temporal variations, forming a distinct spatial evolution pattern characterized by a transformation from a single-core structure to a bipolar and multi-core network (Figure 4). By using a fixed high-density threshold (top 1%) to extract kernel density patches and quantitatively examined their number and spatial concentration across stages, the results show that 48 high-density patches in 2010–2013 were primarily concentrated in the Beijing–Tianjin–Hebei region, 164 patches in 2014–2018 expanded to both the Beijing–Tianjin–Hebei and Yangtze River Delta regions, and 184 patches in 2019–2023 further extended toward the middle and lower reaches of the Yangtze River while forming a more networked and radiating configuration.
Figure 4.
Kernel density distribution map of the BLTVs from 2010 to 2023.
Between 2010 and 2013, a “unipolar core” pattern was observed, with its center located in the area encompassing Beijing, Tianjin, and Hebei Province. From 2014 to 2018, it showed the characteristics of “bipolar multi-core”, that is, the Beijing–Tianjin–Hebei region and the Yangtze River Delta region were the main growth poles, and the density distribution of the middle and lower reaches of the Yangtze River and the Beijing–Tianjin–Hebei region was not much different. From 2019 to 2023, the development pattern of “bipolar network” presents, and the gap between other regions and the two high-value centers gradually narrows. Density levels in the middle-lower Yangtze River basin have exceeded those observed in the Beijing–Tianjin–Hebei metropolitan belt, making it the most densely clustered area nationwide.
3.2. Spatial Evolution and Spatial Differentiation of Beautiful Leisure Tourism Villages
3.2.1. General Spatial Patterns Exhibited by Beautiful Leisure Tourism Villages
The nearest neighbor index (NNI) is applied to examine spatial patterns of point features, indicating the degree of clustering or dispersion among them. The computed actual (r1 = 23.8 km) and theoretical (r2 = 48.1 km) nearest neighbor distances yielded an NNI of 0.50 (p < 0.05), indicating that the villages tend to cluster spatially.
3.2.2. Geographic Zoning Differences of Beautiful Leisure Tourism Villages
Spatial distribution patterns of China’s BLTVs vary markedly across regions, with the country divided into seven geographical regions: East, North, South, Northeast, Southwest, Northwest, and Central China. East China accounted for 26.99% of all villages; the southwest region accounted for 16.30%; Northwest China (primarily Xinjiang and Tibet) and North China constituted 13.72% and 13.77% of all BLVs, respectively. Central China accounted for 11.15%, South China accounted for 8.6%, and Northeast China accounted for 9.5%.
Based on the north–south divide defined by the Qinling Mountains–Huaihe River line, southern regions hosted more villages than northern regions, with 1095 villages, representing 55.25% of the total; the number of the north was 887, accounting for 44.75%. From the perspective of east–west difference, the proportion of BLTVs in the southeast half of the country is as high as 86.07%, while northwest China accounts for only 13.93% of all villages, reflecting a clear east–west spatial disparity, with most villages located to the east of the Heihe–Tengchong Line (China’s well-known demographic divide).
3.2.3. Interprovincial Distribution Characteristics of Beautiful Leisure Tourism Villages
Based on spatial position and economic development, the country is categorized into three major regions, namely the eastern, central, and western regions. The western region encompasses 10 administrative units, including Northwest, Southwest, and Qinghai Tibet regions. The central region encompasses nine administrative units, including Heilongjiang, Inner Mongolia, Jilin, Shanxi, Anhui, Jiangxi, Henan, Hubei, and Hunan. The eastern region comprises 12 administrative units, including Northeast, North China, East China and Southeast China regions. Based on regional classification, the eastern, central, and western regions host 772, 615, and 595 villages, respectively, highlighting the dominance of the eastern region and comparable totals in the central and western regions.
On the whole, the provincial-scale pattern of villages can be classified into four tiers. Zhejiang, Jiangsu, and Shandong lead the country in village counts, placing them in the first tier; Fujian, Sichuan, Anhui, Chongqing, Hunan, Hubei, Jiangxi, and Guangxi constitute the second tier; Henan, Liaoning, Guizhou, Shaanxi, Hebei, Shanxi, Jilin, Yunnan, Guangdong, Inner Mongolia, Heilongjiang and Xinjiang are in the third tier. Beijing, Gansu, Shanghai, Qinghai, Tianjin, Hainan, Tibet and Ningxia are ranked at the fourth level, receiving the least number of evaluations.
3.2.4. Distance Attenuation Pattern of Beautiful Leisure Tourism Villages
From the perspective of spatial interaction, the distribution of BLTVs exhibits a clear distance attenuation pattern relative to major urban tourism markets. Based on the Euclidean distance to the nearest prefecture-level city or provincial capital, villages are grouped into several distance intervals. The results show that the number and density of villages are highest within short-distance ranges and gradually decline as distance increases.
Specifically, a large proportion of villages are distributed within approximately 50–100 km of major cities, indicating strong spatial interaction with urban tourism markets. Beyond this range, village density decreases steadily, reflecting increased travel costs and reduced market accessibility.
3.3. Driving Factors and Spatial Heterogeneity of Beautiful Leisure Tourism Villages
3.3.1. Driving Factors of Beautiful Leisure Tourism Villages
Six dimensions were used to characterize potential drivers of BLTV distribution, including natural ecological conditions, hydrological conditions, climatic environment, socio-economic foundations, transportation accessibility, and tourism resources.
Natural ecological conditions (altitude). BLTVs were distributed across five elevation bands: ≤200 m (44.25%), 200–500 m (20.89%), 500–1000 m (15.09%), 1000–2000 m (14.33%), and >2000 m (5.45%) (see Figure 5 and Figure 6).
Figure 5.
The relationship between rivers/lakes and the spatial distribution of BLTVs.
Figure 6.
BLTVs’ Lorenz curve within river buffer zones.
Hydrological conditions (river proximity). Buffer analysis showed that 742 villages (37.44%) were located within 5 km of river systems, 452 (22.81%) within 5–10 km, 327 (16.50%) within 10–15 km, 184 (9.28%) within 15–20 km, and 277 (13.98%) beyond 20 km (Figure 5 and Figure 6).
Socio-economic foundations. The association between BLTV counts and provincial economic performance was weak and statistically insignificant during 2010–2013, whereas it became statistically significant during 2014–2023, with the geographical linkage rate exceeding 70.
Transportation accessibility (road/rail proximity). Buffer analysis indicated that 953 villages (48.08%) were located within 5 km of major transportation routes, 383 (19.32%) within 5–10 km, 227 (11.45%) within 10–15 km, 118 (5.95%) within 15–20 km, and 301 (15.19%) beyond 20 km (Figure 7 and Figure 8).
Figure 7.
The relationship between highway/railway and the spatial distribution of BLTVs.
Figure 8.
Spatial pattern curve of BLTVs in highway/railway buffer range.
Tourism resources. Using high-grade scenic resources as indicators, the geographical linkage rate between BLTV distribution and tourism resources reached 77.07, with a Pearson correlation coefficient of 0.796, indicating strong spatial correspondence at the provincial scale.
3.3.2. Spatially Heterogeneous Effects
Based on these factors, an index framework was established to quantify their collective influence on spatial distribution patterns. An ordinary least squares (OLS) model was first estimated as a baseline to assess multicollinearity and overall model performance. The multicollinearity diagnostics indicated that variance inflation factors remain within acceptable ranges, with a maximum VIF below 7.5 (Table 1). These results suggest that multicollinearity does not critically bias coefficient interpretation at the provincial scale. In this sense, OLS was used as a baseline (including multicollinearity diagnostics), while GWR was adopted to reveal spatial non-stationarity that cannot be captured by global models (Figure 9).
Table 1.
Determinants shaping the spatial pattern of China’s Beautiful Leisure Tourism Villages.
Figure 9.
Geographical patterns of regression estimates for key determinants across the settlements.
Accordingly, we employed a geographically weighted regression (GWR) model to examine the spatially varying influences of different factors on BLTV distribution. Analysis indicated that there are obvious spatial differences in the influence properties and intensity of each influencing factor. The model achieved a high goodness of fit, with R2 = 0.968 and an adjusted R2 = 0.957. The spatial distributions of local regression coefficients varied substantially across regions (Figure 9).
4. Discussion
This section moves beyond pattern description to interpret the observed spatio-temporal evolution of BLTVs through integrated regional development and distance-attenuation mechanisms. Rather than being driven by a single dominant factor, the observed spatial patterns emerge from the interaction of location-related advantages operating under spatial distance constraints. This integrated perspective provides a unified explanatory framework for understanding regional differentiation and clustering patterns of leisure-oriented rural settlements. To deepen explanation rather than restate results, we organize the discussion around three linked mechanisms: (i) environmental suitability as a feasibility constraint (terrain–hydrology–precipitation), (ii) market interaction under distance attenuation (socioeconomy × accessibility) that converts location advantages into effective demand, and (iii) resource-led agglomeration and spillover around high-quality attraction nodes. We further compare the observed heterogeneity with related evidence on leisure-oriented rural tourism destinations and demonstration villages to clarify both similarities and incremental insights.
Existing studies on leisure-oriented rural tourism destinations and national or provincial demonstration villages consistently report pronounced clustering and regional differentiation, largely driven by environmental suitability, socioeconomic foundations, and accessibility conditions [36,37]. Compared with earlier cross-sectional or single-period analyses, this study extends the literature by explicitly incorporating a temporal dimension. By examining stage-based expansion, barycenter migration, and transitions from core concentration to networked structures, the results reveal the dynamic evolution of BLTVs over a longer policy-defined period. Moreover, the identified east–west heterogeneity suggests that the relative importance of driving factors is spatially uneven, providing a more mechanism-oriented interpretation of rural tourism village development.
4.1. Determinants Shaping the Spatial Heterogeneity of Beautiful Leisure Tourism Villages
4.1.1. Topographic Factors Play a Fundamental Role in Shaping the Geographical Pattern of Beautiful Leisure Tourism Villages
Landforms form the foundation for rural existence and development, with diverse types influencing the distinctive rural traits across regions [42]. China has a large latitude and longitude and significant geographical differences. The western regions are characterized by elevated topography, while the eastern areas are predominantly low-lying, featuring a diverse range of landforms including plains, plateaus, mountains, hills, and basins.
China’s beautiful recreational villages occur at varying elevations; while a few are positioned in the Altai, Tianshan, and Qilian Mountains and the southern margin of the Qinghai–Tibet Plateau, the majority are situated across the low-elevation mountains and hilly plains of the eastern and central regions (see Figure 1 in Section 2). Analysis indicates that rural leisure tourism settlements have low altitude, and the lower the altitude, the more villages there are. Low-altitude areas have dense populations, convenient transportation, developed economy, and close exchanges. Rural leisure tourism development has obvious advantages in terms of passenger flow and transportation. Mechanistically, terrain primarily operates as a “feasibility constraint” that narrows the development envelope and increases spatial friction in high-relief areas, thereby amplifying the marginal role of accessibility and market proximity under distance attenuation (Figure 9).
4.1.2. River Factor Is the Constraint Condition That Affects the Geographical Pattern of Beautiful Leisure Tourism Villages
River networks play a crucial role in supporting village domestic water supply, agricultural irrigation, and water transportation, and villages have obvious river directivity [43]. River networks are crucial for the initial phases of village establishment and growth. Living along water and building by water is a common survival and construction method for the construction and layout of primitive villages [44,45]. River networks significantly influence the selection and development of recreational village areas. Areas with high river network density have abundant water resources, which can fully guarantee the normal production and life of villages. In addition, a good ecological environment can also shape diverse rural landscape space, preparing for and empowering rural tourism [46]. Distance from water source directly affects the formation and development of villages [42], The superposition analysis of beautiful recreational villages and river systems across the country shows that beautiful recreational villages are hydrophilic, and there are a large number and dense distribution of villages around the river network. Rural leisure tourism settlements are densely clustered along both upper and lower sections of the Yellow River, the middle and lower reaches of the Yangtze and Pearl rivers, northeastern rivers such as Liaohe and Heilongjiang, and the northwestern Tarim River. River networks not only serve as a key channel linking villages to surrounding regions but also support residents’ domestic water needs. Suitable hydrological conditions are not only conducive to agricultural production and regulate the local microclimate but also shape the beautiful rural ecotourism landscape. Therefore, to a certain extent, river networks significantly shape the geographical pattern of China’s rural leisure tourism settlements. Beyond basic livelihood support, hydrological proximity also functions as an amenity-and-landscape generator that strengthens place attractiveness and productability, which helps villages overcome distance-related constraints by enhancing visitors’ perceived value per trip (Figure 10).
Figure 10.
Conceptual framework illustrating how environmental suitability, market interaction under distance attenuation, and resource-led agglomeration jointly shape the spatial configuration of BLTVs.
4.1.3. Socioeconomic Conditions Strongly Shape the Geographical Pattern of Rural Leisure Tourism Settlements
Leisure tourism is essentially an activity in which tourists spend more leisure time and economic income. Regional socioeconomic development strongly shapes the geographical pattern of rural leisure tourism settlements. Before 2013, the state selected 10 BLTVs every year, but the sample size was small, which increased the error of data analysis, and the results were not comprehensive and scientific. Between 2014 and 2023, the designation of BLTVs expanded markedly, showing a statistically significant association. This result suggests that regional socioeconomic conditions strongly shaped the development of leisure-oriented rural areas, with economically advanced regions displaying greater tourism demand and spending capacity. In parallel, designation and related tourism development are associated with income gains in regions with stronger tourism-resource endowments and higher economic bases, suggesting that market demand and capacity can condition the effectiveness of village-oriented development initiatives [47].
4.1.4. Transportation Accessibility Serves as a Key Determinant Shaping Where Beautiful Leisure Tourism Villages Are Located
Transport infrastructure functions as a key link bridging tourist origins with rural leisure destinations. The degree of accessibility not only shapes regional socioeconomic vitality but also influences living standards in rural communities and the sustainable interaction between people and their surrounding environment. A considerable proportion of the villages cluster near major transportation corridors, indicating that regional transport development plays a crucial role in shaping their spatial pattern [48]. The impact of traffic distance on the spatial distribution of the villages gradually weakens along the west–east gradient, with the clustering effect most pronounced in northwestern and southwestern China where most villages are located close to major transport routes. In Xinjiang and Tibet, the regression coefficients are relatively high, indicating a strong sensitivity of leisure-oriented rural development to accessibility. However, transport networks in these regions remain limited due to vast territorial extent and complex terrain. As a result, the development of leisure countryside is strongly constrained by transportation conditions, and the spatial distribution of villages is highly correlated with distance from major transport corridors and urban centers. The closer it is to the coastal area, the denser the traffic network and the more developed the traffic, and the less the influence of traffic on the beautiful leisure countryside. Beautiful leisure countryside is basically a rural area, and its development is closely related to the convenience of transportation. Good accessibility can create favorable conditions for rural development, thereby supporting the establishment and expansion of the villages. Transportation accessibility reduces spatial friction and moderates distance-related constraints by lowering travel time and costs, thereby strengthening interaction between villages and major tourism markets. Efficient transport serves as a key foundation for tourism development. Efficient transport lowers the temporal and spatial constraints for linking demonstration villages to external regions, and poor regional accessibility seriously affects tourists’ choice of destinations. Transportation is the key factor of space selection and sustainable development of beautiful rural demonstration village [47]. In the location–distance attenuation framework, transport accessibility mainly works by reducing spatial friction (time–cost), thereby expanding the effective market catchment of villages and strengthening the conversion from location advantages into realized visitation (Figure 10).
4.1.5. Tourism Resource Factors Are Key Determinants Shaping the Location Patterns of Rural Leisure Tourism Settlements
Tourism resources constitute a fundamental basis for tourism development and act as a key driver for tourism activities. Tourism resource endowment amplifies existing location advantages, especially in regions with favorable market proximity and accessibility conditions. Tourism resources constitute the foundation for tourism growth, and China’s attractions represent a key component of these resources, particularly top-tier scenic sites, whose influence fosters the clustering and expansion of rural leisure tourism destinations [49]. For instance, 5A-level scenic spots are a tourism business card and concentrated essence of tourism resources in various provinces [28]. Geographical linkage rate serves to indicate the patterns of rural leisure settlements and the degree to which tourism resources align with village locations across provinces and cities. High-level scenic spots are employed as indicators of tourism resource availability to assess their impact on the spatial arrangement of rural leisure tourism settlements through geographical linkage rate and correlation analyses. Most regions choose to build beautiful villages near high-level scenic spots, because high-level tourist spots have relatively stable tourist source market and relatively perfect traffic conditions, which can effectively promote the construction and development of the local sites [50]. As rural tourism progresses, the integration between rural leisure areas and tourism activities strengthens. Mature tourism resources in rural areas provide a material foundation and a stable tourist flow for tourism activities, thereby supporting the development and modernization of rural communities. This aligns with a resource-led agglomeration logic: high-quality scenic nodes provide stable flows and brand spillovers, and villages benefit through spatial co-location and networked destination management effects rather than isolated development (Figure 10).
4.1.6. Climatic Factors Have Influenced the Geographic Patterns of Rural Leisure Tourism Settlements
Temperature together with precipitation conditions profoundly affect agricultural production and determine, to a large extent, the natural agglomeration of rural areas dominated by agriculture. China’s climate is complex and diverse, and different regions make use of different natural conditions to seek advantages and avoid disadvantages to develop the economy. In the process of exploring development, rural areas in various regions have formed tourism and cultural resources with local customs.
In this study, 50 years of national average temperature and precipitation data from 1960 to 2010 and the national villages were analyzed in spatial superposition. Climate strongly shapes the spatial patterns of rural leisure tourism settlements. Most of these settlements are concentrated in subtropical humid regions and warm temperate semi-humid zones with favorable climate, whereas arid and high-altitude cold regions in western China show sparse and scattered distributions, including areas of Xinjiang and certain parts of Tibet. Based on China’s climatic zones, the eastern coastal region experiences a distinctive monsoon climate characterized by abundant precipitation and warm temperatures due to Pacific Ocean influences. Such favorable climatic conditions provide a strong natural basis for agricultural activities and contribute to the formation of diverse agricultural landscapes, making this region the primary concentration area for recreational villages.
4.2. Influencing Mechanisms of Spatial Differentiation of Rural Leisure Tourism Settlements
The spatial configuration of rural leisure tourism settlements is the result of joint and spatially heterogeneous effects of transportation accessibility, socioeconomic conditions, and environmental suitability, as evidenced by the spatial distribution of GWR coefficients (Figure 9) and synthesized in the mechanism framework (Figure 10). The influencing factors influence each other, and different factors have significant impact on the pattern of beautiful leisure countryside. The results show that socioeconomic conditions and high-grade tourism resources exhibit the strongest and most stable explanatory power nationwide, while natural and accessibility-related factors display more spatially uneven effects. In particular, environmental constraints and accessibility factors tend to show higher influence intensity and significance coverage in western provinces, whereas tourism resource endowment and amenity-related climatic conditions are relatively more influential in eastern provinces. These patterns are broadly consistent with the spatial heterogeneity identified at the village scale while also reflecting scale effects associated with provincial aggregation. Compared with prior studies [19,20,21] that mainly report clustering patterns and broad determinants of leisure-oriented rural tourism destinations (e.g., accessibility, environmental suitability, and socioeconomic foundations), our findings corroborate the general direction of these drivers while further demonstrating their spatial non-stationarity through local coefficients. In particular, the stronger marginal effects of accessibility and basic constraints in western China versus the amplified role of amenity preferences and resource endowment in eastern China provide a mechanism-oriented refinement beyond global-average interpretations. This also helps explain why similar policy-defined village programs can yield differentiated spatial outcomes under varying market proximity and distance-related constraints.
Rather than interpreting the geographically weighted regression (GWR) outputs as isolated local coefficients, the spatial differentiation of BLTVs can be summarized as the joint outcome of three interrelated mechanisms. First, environmental suitability (terrain, hydrology, and precipitation) sets the foundational constraints that define the feasible envelope for settlement formation and tourism-oriented rural land development. Second, market interaction under distance attenuation operates through socioeconomic vitality and transportation accessibility, which jointly determine the effective market reach, visitor mobility, and the conversion efficiency from location advantages into tourism functions. Third, resource-led agglomeration and spillover occurs where high-quality scenic resources strengthen destination competitiveness and generate spatial spillovers, thereby reinforcing village clustering around established attraction nodes. Importantly, these mechanisms are spatially heterogeneous: in western China, the marginal effects of accessibility and basic environmental constraints tend to be stronger due to higher spatial friction and harsher physical conditions, whereas in eastern China, mature markets and dense networks amplify the roles of resource endowment and amenity-based preferences. This integrated interpretation provides an explanatory bridge between spatial heterogeneity identified by GWR and the broader location–distance attenuation perspective. As basic geographical elements and landscape elements, the regression coefficient of landform is negatively correlated, showing a decreasing trend of spatial differentiation from west to east (Figure 8). The distribution of recreational villages in high-altitude areas is more restricted, and the areas with higher altitude and greater topographic relief have bad light, heat and soil conditions, which are unfavorable for residential and economic activities. Optimal edaphic and hydrological conditions and well-developed infrastructure in low-altitude and low-lying areas support local livelihoods and agricultural operations. China has a variety of climate types, including monsoon climate, continental climate, and high cold climate, with significant regional differences. Temperature and precipitation are important reflections of climatic characteristics. The regression coefficient of temperature declines from west to east and remains positive, indicating that temperature’s impact on the spatial pattern of the settlements gradually strengthens from east to west. Climate comfort zones are more and more favored by consumers [51]; because the temperature difference is too large, the cold winter and hot summer climate restrict the population from going out to some extent [52], and it is difficult to meet the diversified consumer needs such as going out for leisure and vacation. Precipitation exhibits a negative correlation with the settlements, with smaller regression coefficients primarily observed in the western arid regions. These areas experience limited annual rainfall and low land productivity, which significantly constrains the spatial pattern of settlements. The regression coefficients of hydrological factors decline from the southwestern to northeastern regions, with 71% showing a negative relationship. Higher coefficient zones are concentrated in the southwest, whereas lower coefficient zones are predominantly located in the northeast. This pattern aligns with the broader rural geography literature [25,26,27] emphasizing environmental suitability as a foundational constraint, while our results further show that its marginal effects become more pronounced under higher spatial friction in western regions.
Acting as a key driver in the socioeconomic system, the influence degree of per-capita consumption expenditure on the distribution of villages is shown as a downward trend from east to west with a positive correlation (Figure 10). The urban–rural dual structure in northwest China continues to widen, population decline is pronounced, and socioeconomic development in this region remains weaker compared with the southeastern coastal areas. Resource development, infrastructure construction, and rural development in northwest China are more dependent on social economy. The smaller the traffic distance, the greater the possibility of tourist flow. The rapid construction of high-speed and high-speed railway network leads to the gradual weakening of the geographical blocking effect of traffic distance on the pattern of leisure countryside. Regionally, elevated traffic coefficient values are mainly observed across Xinjiang, Tibet, and other parts of western China, where limited transport infrastructure makes rural growth highly reliant on accessibility. Considering the convenience of production and life, villages tend to gather along traffic routes, and improving traffic conditions can promote the construction of leisure villages, shorten the distance from tourist source to leisure villages, and reduce travel time and cost. Consistent with tourism geography studies [44,52] on accessibility and market reach, the results suggest that transport conditions primarily operate by moderating distance-related constraints rather than acting as an isolated driver.
The availability of scenic resources exerts a strong positive influence on how rural leisure tourism settlements are spatially arranged, with the regression coefficient gradually declining from west to east. The brand competitiveness and trickle-down effect of tourist attractions have a direct driving effect on rural development. By giving full play to the demonstration influence and spillover effect of scenic areas, the attraction of leisure villages in and around them can be enhanced to achieve drainage and synergistic development. Xinjiang, Yunnan and Hainan are rich in 4A-level scenic spots and above, and villages belong to the scenic spot driven development mode, which is more obviously influenced by high-level scenic spot resources. High-level tourist attractions have a relatively stable tourist market and relatively perfect infrastructure, which can effectively facilitate the growth and improvement of beautiful leisure tourism destinations. This supports resource-led agglomeration arguments in rural tourism research and extends them by demonstrating spatial spillover tendencies around high-quality scenic nodes under dense market networks in eastern China.
5. Conclusions, Policy Implications, and Limitations
5.1. Conclusions
Based on geospatial analysis and geographically weighted regression, this study investigates the spatial patterns and driving mechanisms of China’s BLTVs between 2010 and 2023, leading to the following findings:
- (1)
- The rural settlements expanded markedly, showing the most rapid growth during 2014–2018. On the whole, there was a clear development pattern of “unipolar nuclear–bipolar multi-nuclear bipolar network”, which developed from the “unipolar nuclear” centered on the Beijing–Tianjin–Hebei region to the bipolar growth of the Beijing–Tianjin–Hebei region and the Yangtze River Delta, radiating to the continuous development of China’s eastern coastal and central hinterland regions. The center of gravity of the countryside was distributed in Nanyang City, forming a trend of push and pull migration from east to west and then east.
- (2)
- Across China, the rural settlements display a relatively concentrated spatial pattern, with a sharper contrast observed along the east–west axis than along the north–south direction. Regionally, eastern China hosts a considerably denser cluster of such villages compared with other parts of the country, whereas northeastern China records the smallest number. Among the eastern provinces, Zhejiang, Jiangsu, and Shandong stand out for their particularly high concentrations of the rural settlements.
- (3)
- The spatial configuration of rural settlements results from the combined influence of multiple environmental and socioeconomic dimensions, each exerting different levels of impact. Terrain serves as the fundamental foundation shaping their geographical presence, while climatic conditions contribute to regional differentiation. Hydrological systems, economic development, transport accessibility, and tourism resources further reinforce or constrain the spatial clustering of these villages. Overall, the effects of topography, socioeconomic conditions, transportation, and precipitation are more pronounced in the western part of the country, whereas resource endowment and temperature exert stronger influences across the eastern regions.
5.2. Implications
Translating the identified location–distance attenuation effects and spatially heterogeneous drivers into actionable guidance requires differentiating village development pathways by accessibility, environmental constraints, and proximity to attraction nodes.
- (1)
- High-accessibility villages near large cities (low spatial friction). For villages located within short travel distances to major urban markets, development should prioritize quality-oriented upgrading rather than extensive expansion. Practical actions include (i) diversifying leisure products to avoid homogeneous competition (e.g., weekend micro-vacations, cultural experiences, wellness and agritainment), (ii) strengthening visitor flow management and carrying capacity control to mitigate crowding and environmental pressure, and (iii) enhancing inter-village coordination within dense clusters through integrated destination management and shared branding to reduce duplicated investments.
- (2)
- Villages in western areas with strong physical constraints (high spatial friction). In regions where topography, hydrological constraints, and accessibility exert stronger marginal effects, village development should adopt niche and resource-led strategies with staged infrastructure prioritization. Practical actions include (i) prioritizing “effective accessibility” investments that reduce travel time/cost to the nearest market gateway or transport corridor, (ii) aligning village construction with environmental suitability (terrain–water–climate constraints) to avoid high-risk or low-efficiency land-use transformation, and (iii) integrating with high-value scenic nodes via product bundling and route design (village–scenic spot linkage), thereby leveraging stable tourist flows and infrastructure spillovers while maintaining ecological security.
- (3)
- Potential areas with currently low density (planning corridors and network diffusion). For transitional regions where village increments are increasing but clustering remains weak, planning should emphasize corridor-based and hub-and-spoke organization. Practical actions include (i) identifying candidate corridors that connect villages to nearby core markets and scenic nodes based on reduced effective distance, (ii) sequencing new designations and investments along these corridors to promote balanced diffusion rather than isolated points, and (iii) strengthening cross-county cooperation to build village networks (shared services, joint itineraries, and coordinated marketing) that enhance regional competitiveness.
Overall, these recommendations operationalize the empirical findings by linking spatial pattern evolution to concrete village-level planning instruments—product strategy, infrastructure sequencing, node-corridor organization, and cluster governance—thereby enhancing the practical contribution of this study to rural revitalization.
5.3. Limitations
The above findings contribute a national-scale, long-term understanding of BLTV evolution and a mechanism-oriented explanation integrating location advantages, distance attenuation, and spatially heterogeneous drivers, while the main research contributions are explicitly summarized at the end of the Introduction. Limitations: Despite these contributions, several limitations should be noted. First, the village sample is derived from official designation lists, which may introduce selection bias and does not fully capture informal or emerging tourism villages. Second, village locations obtained through geocoding may involve positional uncertainty, and buffer-based indicators represent simplified proxies of accessibility and environmental interaction. Third, although spatial heterogeneity is rigorously examined, the analysis primarily reflects spatial associations rather than strict causal relationships, and micro-level factors such as governance arrangements, enterprise participation, and investment dynamics are not explicitly modeled. Global spatial econometric models (e.g., SDM) could be used in future work to further test spillover effects under a unified regional system, but the present study prioritizes heterogeneity-oriented explanation aligned with the research questions and empirical outputs. Future prospects: Future research could (1) construct multi-period/panel models to examine dynamic causality and cross-stage transitions; (2) incorporate multi-source big data (e.g., POIs, mobile signaling, online reviews, and mobility data) to refine market interaction and effective distance measures; and (3) conduct typology-based analyses (e.g., resource-led vs. market-led villages) and evaluate development outcomes such as land-use change, livelihood effects, and ecological impacts.
Author Contributions
Conceptualization, X.W., Y.W., H.C. and D.C.; methodology, X.W., J.M., Z.M., Y.W., W.L., L.W., H.C. and D.C.; software, X.W., J.M., Z.M., Y.W., W.L., L.W., H.C., D.C. and Z.G.; validation, X.W., Y.W., L.W., H.C., W.L., J.M., D.C. and Z.G.; formal analysis, X.W., J.M., Z.M., Y.W., W.L., L.W., H.C., D.C. and Z.G.; investigation, X.W., Y.W., Z.M., L.W., W.L., H.C., J.M., D.C. and Z.G.; resources, X.W., Y.W., L.W., H.C., W.L., J.M., D.C. and Z.G.; data curation, X.W., Y.W., L.W., H.C.,W.L., J.M., D.C. and Z.G.; writing—original draft preparation, X.W., Y.W., L.W., H.C., W.L., J.M., D.C. and Z.G.; writing—review and editing, X.W., Y.W., Z.M., L.W., W.L., H.C., J.M., D.C. and Z.G.; visualization, X.W., Y.W., Z.M., L.W., W.L., H.C., J.M., D.C. and Z.G.; supervision, X.W., Y.W., Z.M., L.W., W.L., H.C., J.M., D.C. and Z.G.; project administration, X.W., Y.W., Z.M., L.W., W.L., H.C., J.M., D.C. and Z.G.; funding acquisition, Y.W. and X.W. All authors have read and agreed to the published version of the manuscript.
Funding
This research was funded by National Natural Science Foundation of China, grant number 42201266; Collaborative Education and Industry Cooperation Program of the Ministry of Education, grant number 231103793160436.
Data Availability Statement
The data were obtained from 14 batches of the Beautiful Leisure Tourism Villages in China (1982 in total) list released by the Ministry of Agriculture and Rural Affairs of China (http://www.moa.gov.cn/), the sample coordinate attributes were obtained by Amap API for spatial positioning. The data of the digital elevation model were derived from the 30 m resolution data of the geospatial data cloud “China STRM DEM Dataset” (http://www.gscloud.cn/). The study involved population and economic data from the National Bureau of Statistics (http://www.stats.gov.cn) and Statistical Yearbook 2022 released by Statistical bureau of provinces, municipalities and autonomous regions. The tourism resources data were obtained from the official website of the Ministry of Culture and Tourism (http://www.mct.gov.cn). The basic data of rivers, traffic and climate were from the Resources and Environmental Sciences and Data Center of the Chinese Academy of Sciences and the U.S. National Climatic Data Center (NCDC).
Acknowledgments
The authors appreciate the constructive comments of the anonymous reviewers.
Conflicts of Interest
The authors declare no conflicts of interest.
References
- Dajun, L.; Jing, H.; Junzi, C. The Spatial Structure and Disparities of Leisure Tourism Destinations in Wuhan. Econ. Geogr. 2014, 34, 176–181. [Google Scholar]
- Ge, D.Z. The characteristics and multi-scale governance of rural space in the new era in China. Acta Geogr. Sin. 2023, 78, 1849–1868. [Google Scholar]
- Wang, X.W.; Ge, D.Z. The challenges and the development path of poverty alleviation through tourism strategy: A case study of typical villages in Shandong Province. Res. Agric. Mod. 2019, 40, 728–735. [Google Scholar]
- Zhang, Y.G.; Wong, I.A.; Cheng, J.J.; Yu, X.Y.; Chen, X. The influence of multidimensional deconstruction of stressors onenhancing urban residents’ well-being: From the perspective of rural tourism and leisure involvement. Geogr. Res. 2019, 38, 971–987. [Google Scholar]
- Kusumastuti, H.; Pranita, D.; Viendyasari, M.; Rasul, M.S.; Sarjana, S. Leveraging Local Value in a Post-Smart Tourism Village to Encourage Sustainable Tourism. Sustainability 2024, 16, 873. [Google Scholar] [CrossRef] [Scilit]
- Ciolac, R.; Iancu, T.; Popescu, G.; Adamov, T.; Feher, A.; Stanciu, S. Smart Tourist Village-An Entrepreneurial Necessity for Maramures Rural Area. Sustainability 2022, 14, 8914. [Google Scholar] [CrossRef] [Scilit]
- Utami, D.D.; Dhewanto, W.; Lestari, Y.D. Rural tourism entrepreneurship success factors for sustainable tourism village: Evidence from Indonesia. Cogent Bus. Manag. 2023, 10, 3329–3346. [Google Scholar] [CrossRef] [Scilit]
- Sumarto, R.; Sumartono, S.; Muluk, M.; Nuh, M. Penta-Helix and Quintuple-Helix in the Management of Tourism Villages in Yogyakarta City. Australas. Account. Bus. Financ. J. 2020, 14, 46–57. [Google Scholar] [CrossRef] [Scilit]
- Sulthan, M.; Ardiputra, S. Komunikasi Penyuluhan Pariwisata Menuju Desa Wisata Pamboborang. Community Dev. J. J. Pengabdi. Masy 2021, 2, 1239–1245. [Google Scholar] [CrossRef] [Scilit]
- Nazarian, A.; Shabankareh, M.; Ranjbaran, A.; Sadeghilar, N.; Atkinson, P. Determinants of Intention to Revisit in Hospitality Industry: A Cross-Cultural Study Based on Globe Project. J. Int. Consum. Mark. 2023, 36, 62–79. [Google Scholar] [CrossRef] [Scilit]
- Arintoko, A.; Ahmad, A.A.; Gunawan, D.S.; Supadi, S. Community-based tourism village development strategies: A case of Borobudur tourism village area, Indonesia. Geoj. Tour. Geosites 2020, 29, 398–413. [Google Scholar] [CrossRef] [Scilit]
- Dewi, N.L.Y.; Supriyono, B.; Wijaya, A.F.; Rochmah, S. Dynamics of Collaboration as an Effort to Develop a Sustainable Tourism Village: The perspective of Tri Hita Karana in Sangeh Tourism Village, Badung Regenc. Int. J. Membr. Sci. Technol. 2023, 10, 249–256. [Google Scholar] [CrossRef] [Scilit]
- Kurniawan, T.; Indrawati, L.N.; Asmara, I.M. Development of Community Participation-Based Tourism Village in Genggelang Village, Lombok Utara District. J. Educ. 2023, 5, 9130–9140. [Google Scholar] [CrossRef] [Scilit]
- Karunia, I.P.; Widnyana, I.K.; Sujana, I.P. Strategy for Development of Tourist Village in Bali Island. Int. J. Res. Granthaalayah 2020, 8, 324–330. [Google Scholar]
- Purnamawati, I.G.A.; Jie, F.; Hatane, S.E. Cultural Change Shapes the Sustainable Development of Religious Ecotourism Villages in Bali, Indonesia. Sustainability 2022, 14, 7368. [Google Scholar] [CrossRef] [Scilit]
- Luo, Y.X.; Gan, C.L.; Li, W.; Zhou, L.L.; Fan, S.S.; Mao, L.Y. Study of the spatial distribution characteristics and corresponding influencing factors of beautiful leisure villages in Fujian province. Chin. J. Agric. Resour. Reg. Plan. 2021, 42, 276–286. [Google Scholar]
- Song, J.; Zhu, Y.; Chu, X.; Yang, X. Research on the Vitality of Public Spaces in Tourist Villages through Social Network Analysis: A Case Study of Mochou Village in Hubei, China. Land 2024, 13, 359. [Google Scholar] [CrossRef] [Scilit]
- Nie, C.; Liu, Z.; Yang, L.; Wang, L. Evaluation of Spatial Reconstruction and Driving Factors of Tourism-Based Countryside. Land 2022, 11, 1446. [Google Scholar] [CrossRef] [Scilit]
- Yan, H.L.; Wang, Q.; Xiong, H.; Xu, F. Analysis on spatial distribution characteristics and influencing factors of China’s most beautiful leisure country demonstration sites. J. Arid Land Resour. Environ. 2019, 33, 45–50. [Google Scholar]
- Zhu, L.; Li, Y.N.; Hu, J.; Fang, Y.P. Study on spatiotemporal pattern evolution and its influences on the most beautiful leisure villages in China. J. Agric. Resour. Environ. 2022, 39, 1049–1058. [Google Scholar]
- Wang, Z.F.; Shi, W.J. Spatial distribution characteristics and influencing factors of China’s beautiful leisure villages. Sci. Geogr. Sin. 2022, 42, 104–114. [Google Scholar]
- Wang, X.Y.; Si, W.X. Spatial structure and influencing factors of China’s most beautiful leisure villages. J. Arid Land Resour. Environ. 2017, 31, 195–200. [Google Scholar]
- Zhang, Q.Y.; Lv, W.J. Evaluation of leisure agriculture efficiency in Qingdao city based on DEA model-take leisure agriculture and rural tourism demonstration sites of Qingdao city as examples. Chin. J. Agric. Resour. Reg. Plan. 2018, 39, 284–288. [Google Scholar]
- Zhang, S.Y.; He, F.; Hu, X.H.; Yang, H.J. Spatial distribution characteristics and influencing factors of rural tourism destinations in Hebei Province. J. Nat. Sci. Hunan Norm. Univ. 2023, 46, 103–112. [Google Scholar]
- Guo, X.D.; Zhang, Q.Y.; Ma, L.B. Analysis of the spatial distribution character and its influence factors of rural settlement in transition-region between mountain and hilly. Econ. Geogr. 2012, 32, 114–120. [Google Scholar]
- Lin, J.P.; Lei, J.; Wu, S.X.; Yang, Z.; Li, J.G. Spatial pattern and influencing factors of oasis rural settlements in Xinjiang, China. Geogr. Res. 2020, 39, 1182–1199. [Google Scholar]
- Guo, X.D.; Niu, S.W.; Wu, W.H.; Ma, L.B. Characters of rural settlement spatial distribution and its influence factors in loesshilly area of Gansu Province—A case of Qin’an County, Gansu Province. J. Arid Land Resour. Environ. 2010, 24, 27–32. [Google Scholar]
- Xie, Y.C.; Meng, X.Z.; Cenci, J.; Zhang, J.Z. Spatial pattern and formation mechanism of rural tourism resources in China: Evidence from 1470 national leisure villages. ISPRS Int. J. Geo-Inf. 2022, 11, 445. [Google Scholar] [CrossRef] [Scilit]
- Wang, X.; Gong, J.; Meng, X.Y.; Wang, H.; Li, S.C. Spatial differentiation of poor villages in the middle reaches of the Yangtze River. Resour. Environ. Yangtze Basin 2020, 29, 2136–2145. [Google Scholar]
- Ma, B.B.; Chen, X.P.; Ma, K.K.; Pu, L.L. Spatial distribution, type structure and influencing factors of key rural tourism villages in China. Econ. Geogr. 2020, 40, 190–199. [Google Scholar]
- Duncan, O.D.; Duncan, B. A Methodological Analysis of Segregation Indices. Am. Sociol. Rev. 1955, 20, 210–217. [Google Scholar] [CrossRef] [Scilit]
- Sun, C.Z.; Ma, Q.F.; Zhao, L.S. Analysis of driving mechanism based on a GWR model of green efficiency of water resources in China. Acta Geogr. Sin. 2020, 75, 1022–1035. [Google Scholar]
- Cao, Z.; Shao, X. The spatial structure and optimization of leisure agriculture and rural tourism in Shanxi Province. World Reg. Stud. 2019, 28, 208–213. [Google Scholar]
- Xiong, H.; Wang, Q.; Yan, H.L.; Yu, J. Analysis on spatial distribution characteristics and influencing factors of leisure rural country in China in muti-scale. Chin. J. Agric. Resour. Reg. Plan. 2019, 40, 232–239. [Google Scholar]
- Hu, Y.Y.; He, Y.; Li, Y.L. Urban Spatial Development Based on Multisource Data Analysis: A Case Study of Xianyang City’s Integration into Xi’an International Metropolis. Sustainability 2022, 14, 4090. [Google Scholar] [CrossRef] [Scilit]
- Wu, Z.B.; Qu, Y.H.; Xu, Y.M. Analysis of Spatial-Temporal Differentiation Characteristics and Influencing Factors of Beautiful Villages in China from a Cultural Geography Perspective. Fujian Trib. 2020, 8, 47–59. [Google Scholar]
- Guo, Y.Z.; Liu, Y.S. The process of rural development and paths for rural revitalization in China. Acta Geogr. Sin. 2021, 76, 1408–1421. [Google Scholar]
- Wang, X.W.; Li, X.J. Characteristics and influencing factors of the key villagesof rural tourism in China. Acta Geogr. Sin. 2022, 77, 900–917. [Google Scholar]
- Tobler, W. A computer movie simulating urban growth in the detroit region. Econ. Geogr. 1970, 46, 234–240. [Google Scholar] [CrossRef] [Scilit]
- Brunsdon, C.; Fotheringham, A.S.; Charlton, M.E. Geographically Weighted Regression: A Method for Exploring Spatial Nonstationarity. Geogr. Anal. 1996, 28, 281–298. [Google Scholar] [CrossRef] [Scilit]
- Lei, H.; Zeng, S.P.; Namaiti, A.; Zeng, J. The Impacts of Road Traffic on Urban Carbon Emissions and the Corresponding Planning Strategies. Land 2023, 12, 800. [Google Scholar] [CrossRef] [Scilit]
- Lu, C.K. Spatial distribution and influencing factors of key rural tourism villages in Northeast China. Res. Soil Water Conserv. 2022, 29, 425–430. [Google Scholar]
- Huang, T.; Li, D.H.; Jiang, W.F.; Li, Q.; Lu, L. Spatial distribution and influencing factors of key villages of rural tourism in urban agglomeration in middle reaches of Yangtze River. Resour. Environ. Yangtze Basin 2023, 32, 2466–2477. [Google Scholar]
- Bin, J.Y. Spatial differentiation and its influencing factors of traditional villages in Guangdong Province. J. Cent. South Univ. For. Technol. 2020, 14, 35–43+60. [Google Scholar]
- Li, Y.J.; Chen, T.; Wang, J.; Wang, D.G. Temporal-spatial distribution and formation of Historic and cultural villages in China. Geogr. Res. 2013, 32, 1477–1485. [Google Scholar]
- Xu, Y.; Sun, S.; Jiang, W.F.; Ren, Y.S. Study on spatial distribution characteristics and influencing factors of model villages of the beautiful countryside in Hainan Island. J. Hainan Norm. Univ. 2022, 35, 76–85. [Google Scholar]
- Huang, Z.H.; Song, W.H.; Cheng, W.S.; Li, X.X. Has the development of leisure agriculture and rural tourism promoted the increase of farmers’ income: An evidence from quasi-natural experiment. Econ. Geogr. 2022, 42, 213–222. [Google Scholar]
- Shen, C.F.; Chang, P.P.; Qian, Y.; Zhou, C.S. Spatio-temporal differentiation and influencing mechanism of best leisure villages in China. J. Northwest Norm. Univ. 2022, 58, 70–77. [Google Scholar]
- Zhu, Z.Y.; Wang, R.; Hu, J.; Li, Y.J. Classification and spatial distribution pattern of rural leisure tourism destinations in Jiangxi Province. Resour. Environ. Yangtze Basin 2020, 29, 824–835. [Google Scholar]
- Cao, K.J.; Wang, M.M. Spatial pattern evolution and influencing factors of beautiful village in China. Sci. Geogr. Sin. 2022, 42, 1446–1454. [Google Scholar]
- Glaeser, E.L.; Kolko, J.; Saiz, A. Consumer city. J. Econ. Geogr. 2001, 1, 27–50. [Google Scholar] [CrossRef] [Scilit]
- Qi, H.G.; Zhao, M.F.; Liu, S.H.; Gao, P.; Liu, Z. Evolution pattern and its driving forces of China’s interprovincial migration of highly-educated talents from 2000 to 2015. Geogr. Res. 2022, 41, 456–479. [Google Scholar]
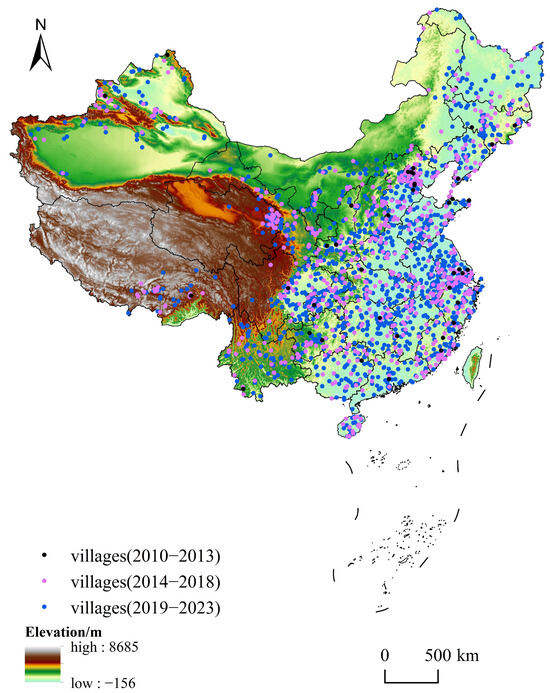
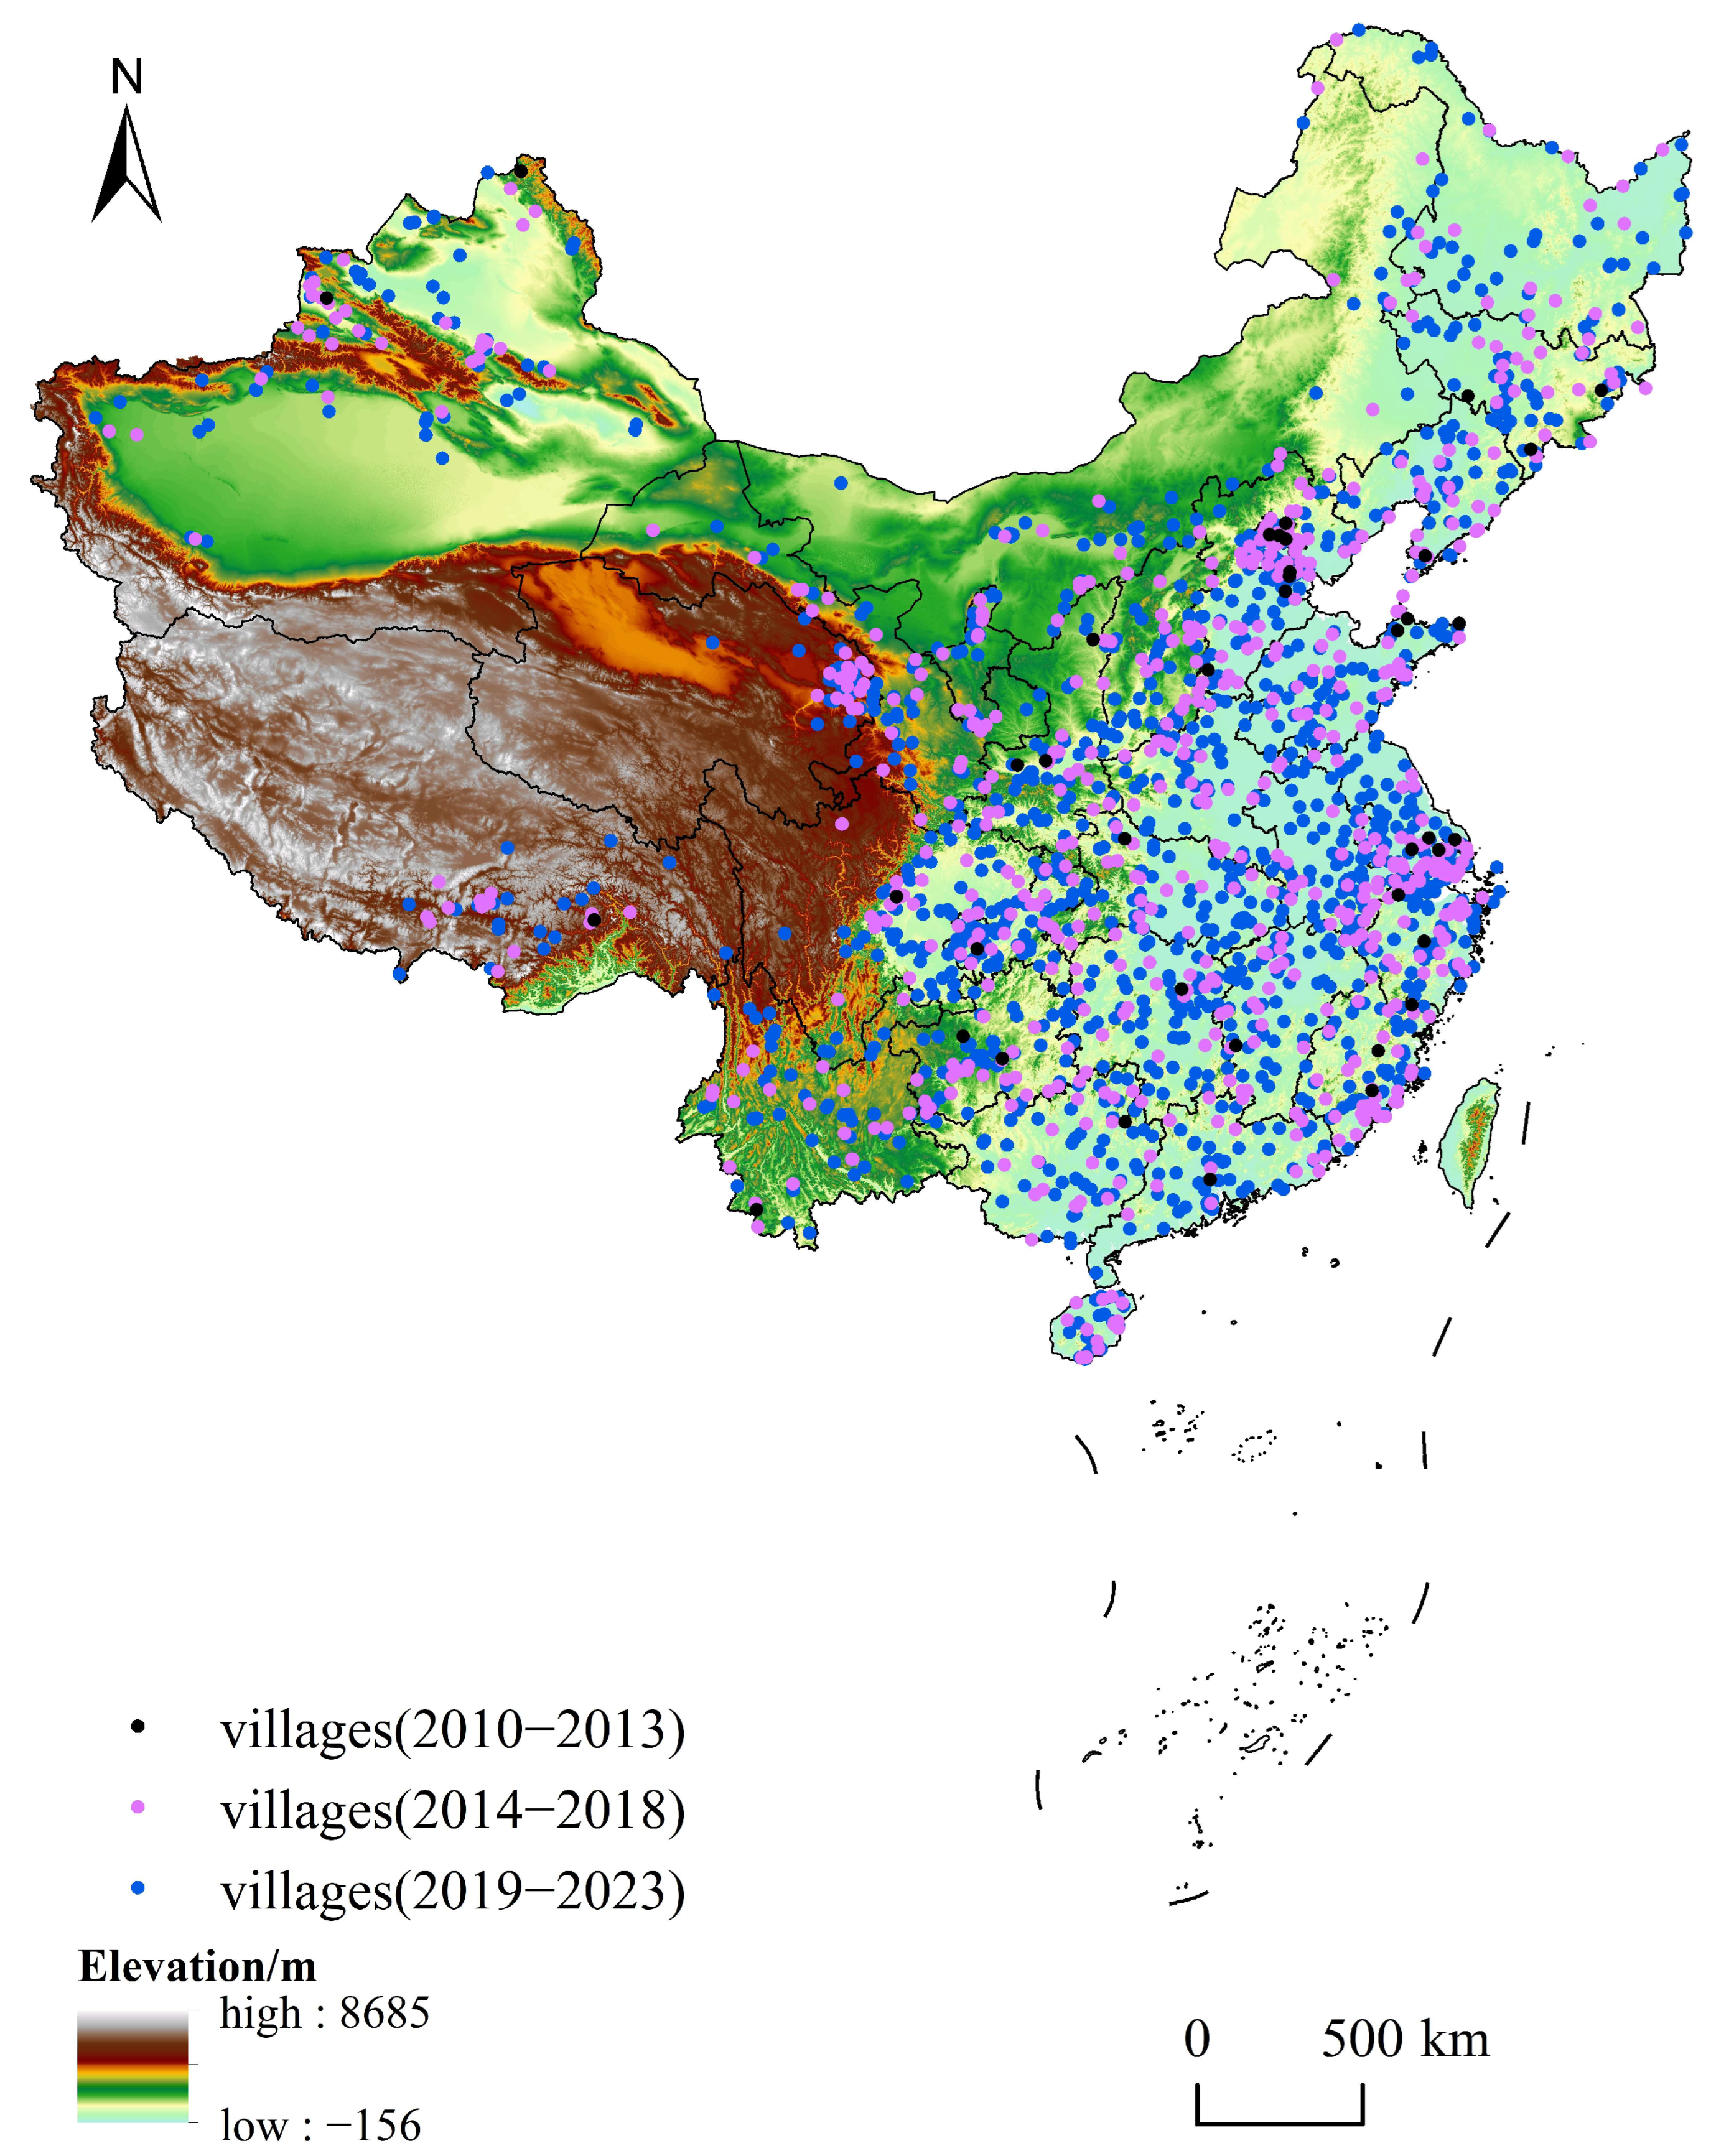
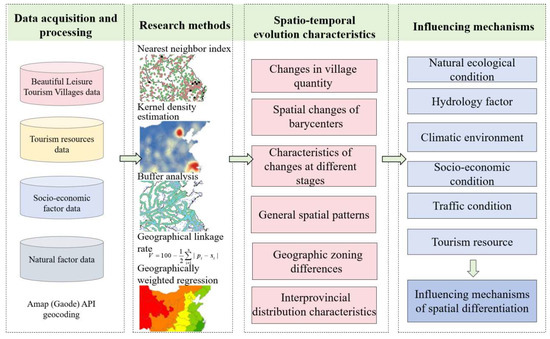
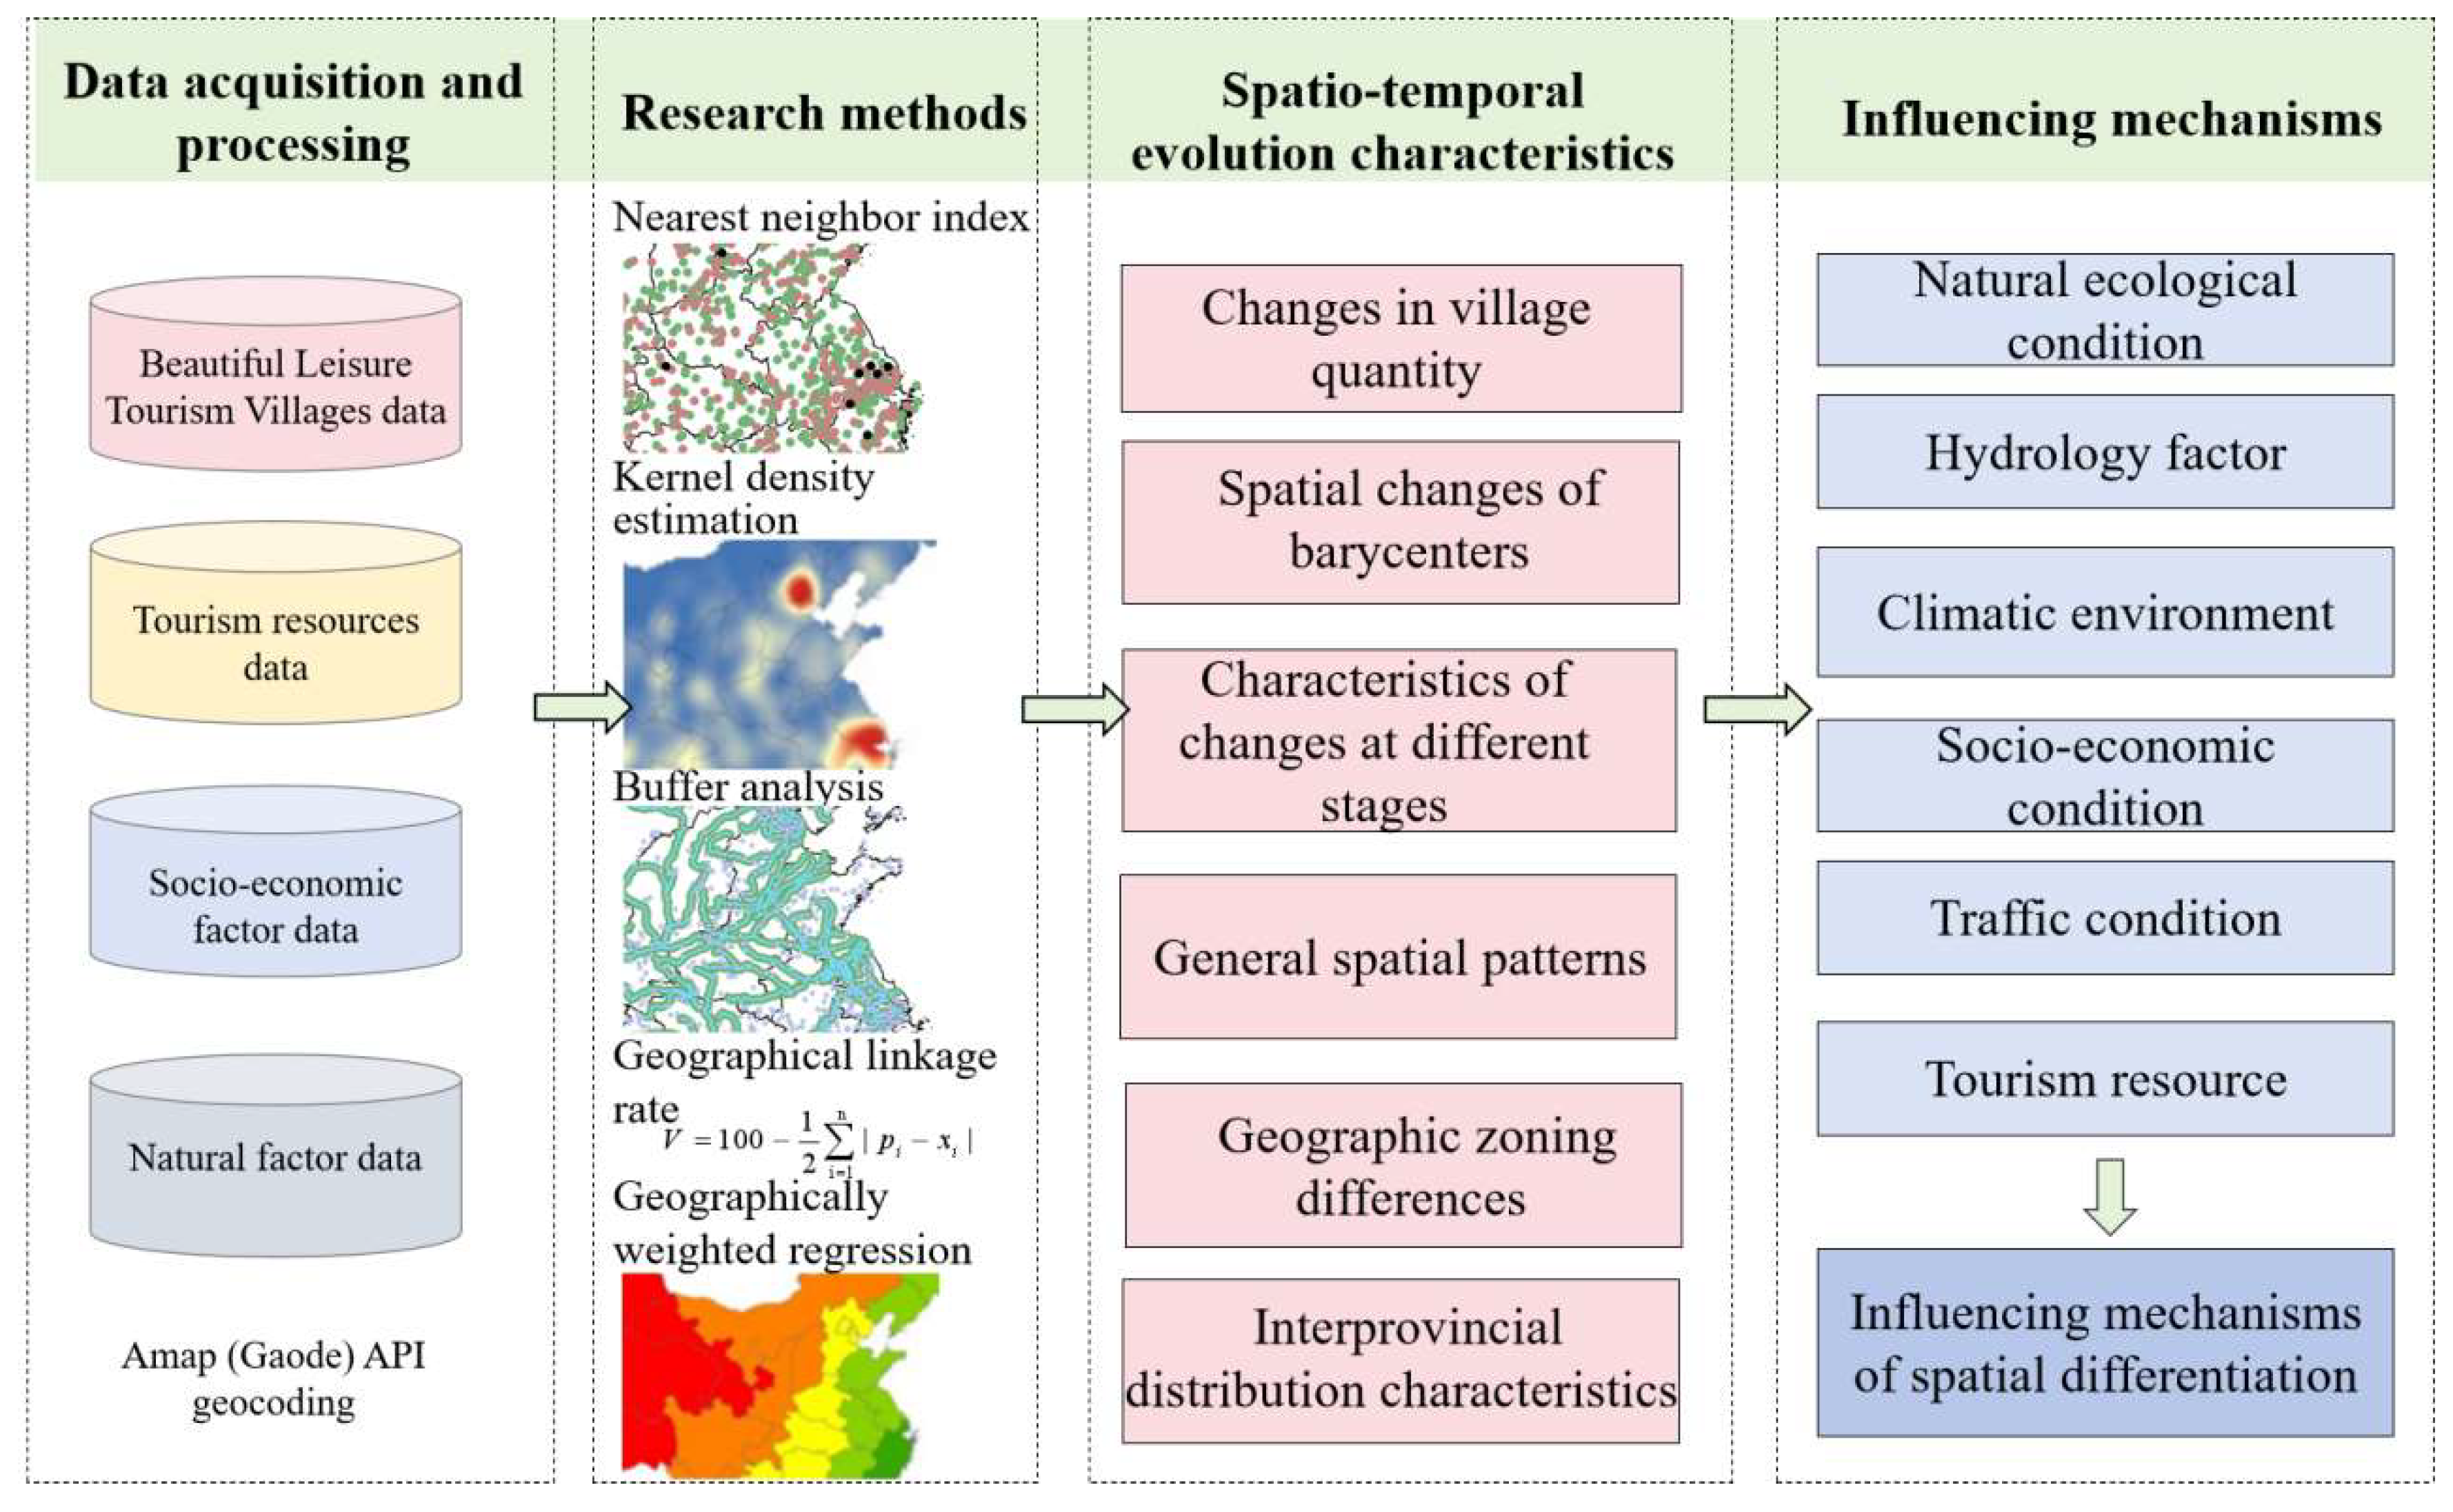
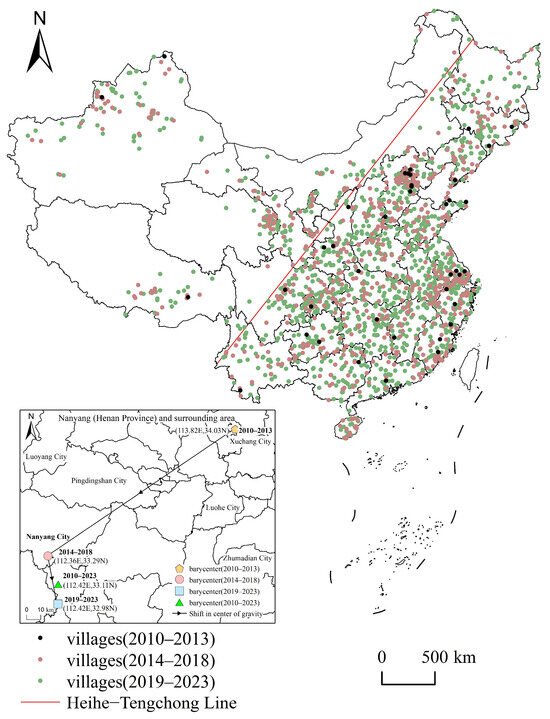
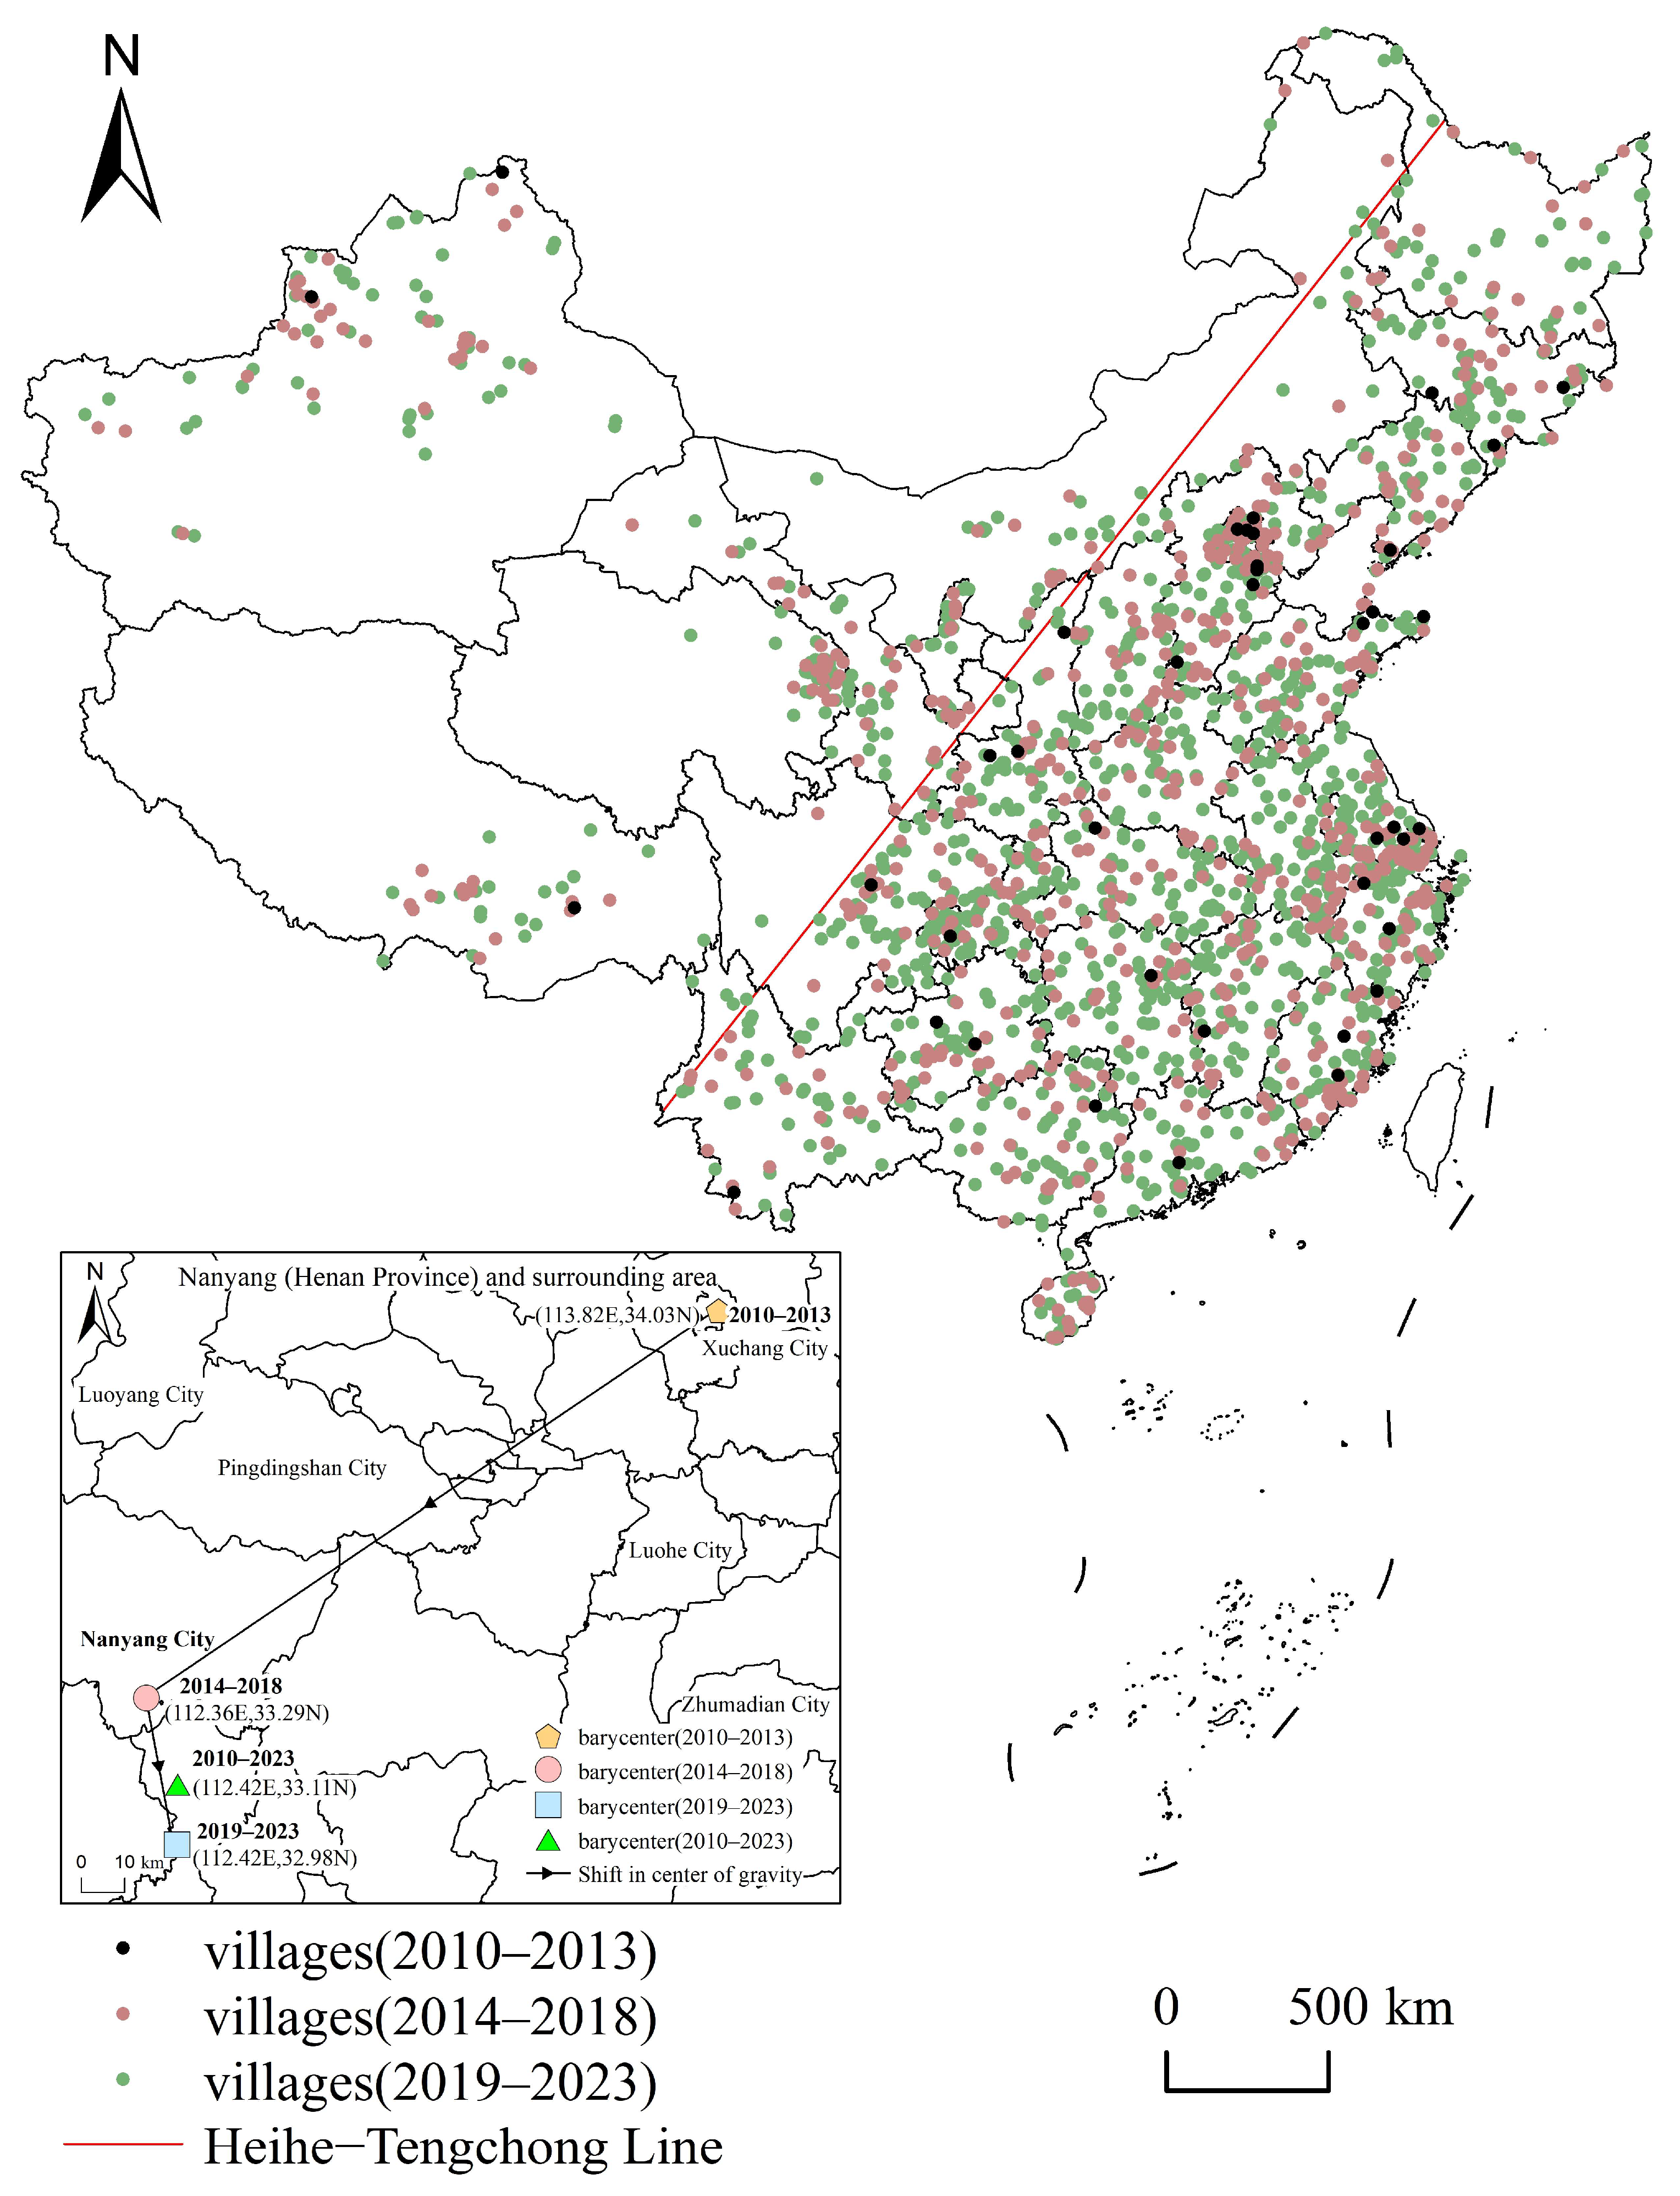
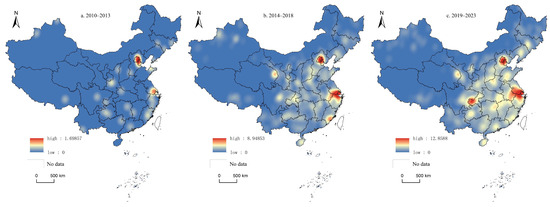
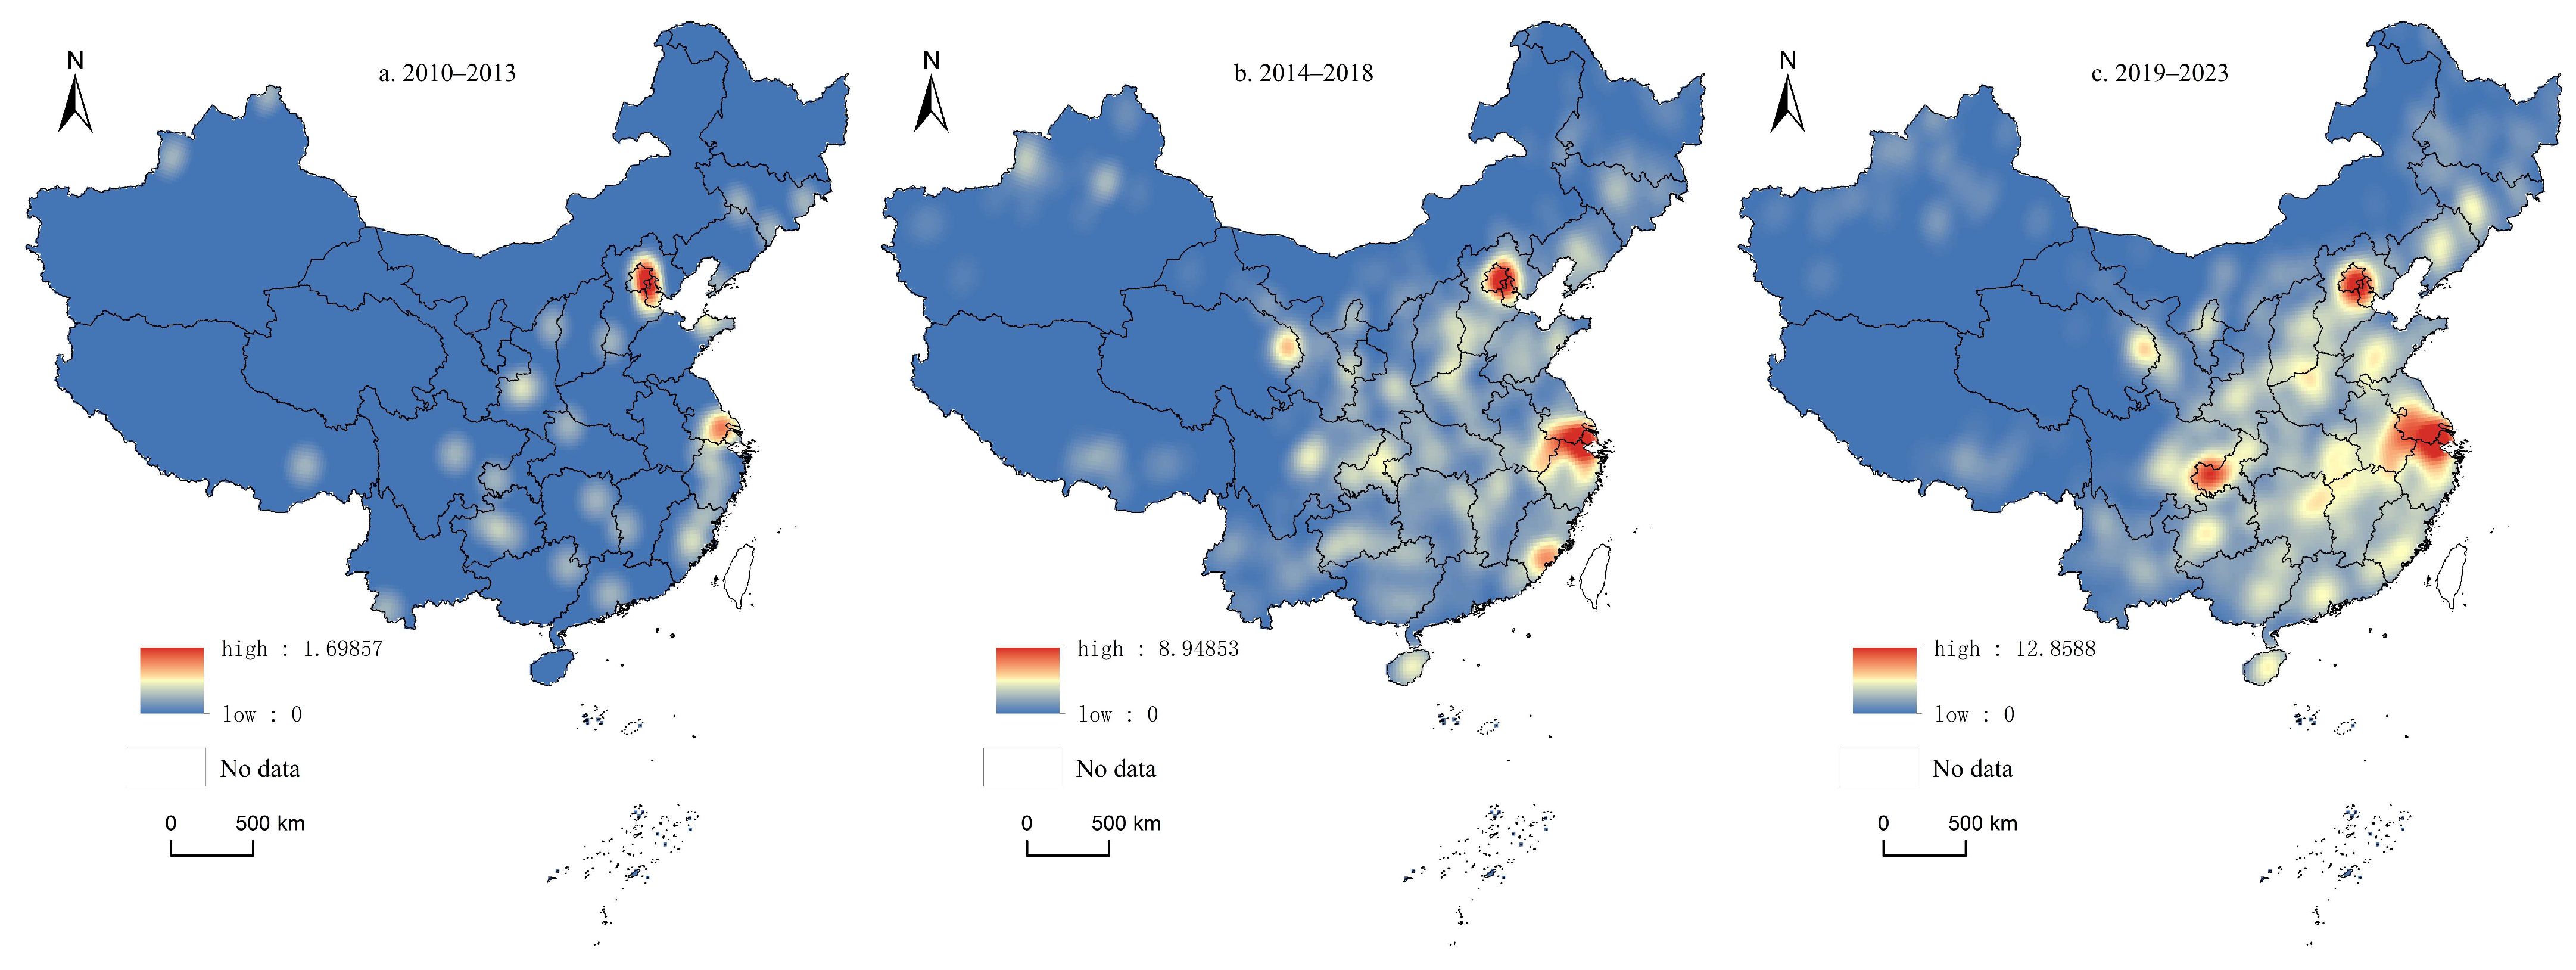
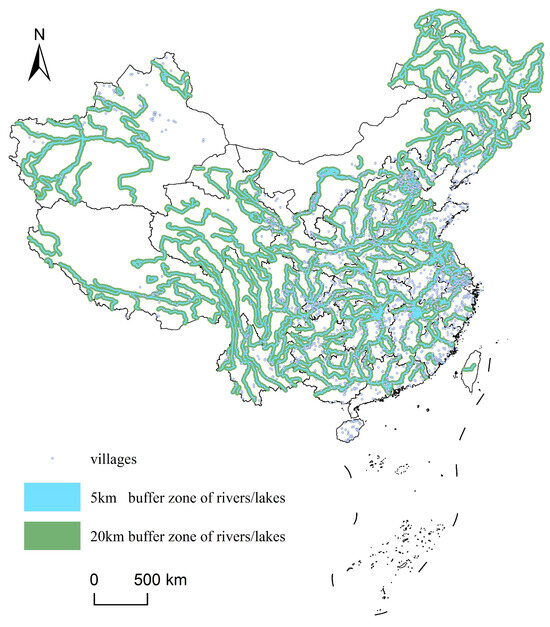
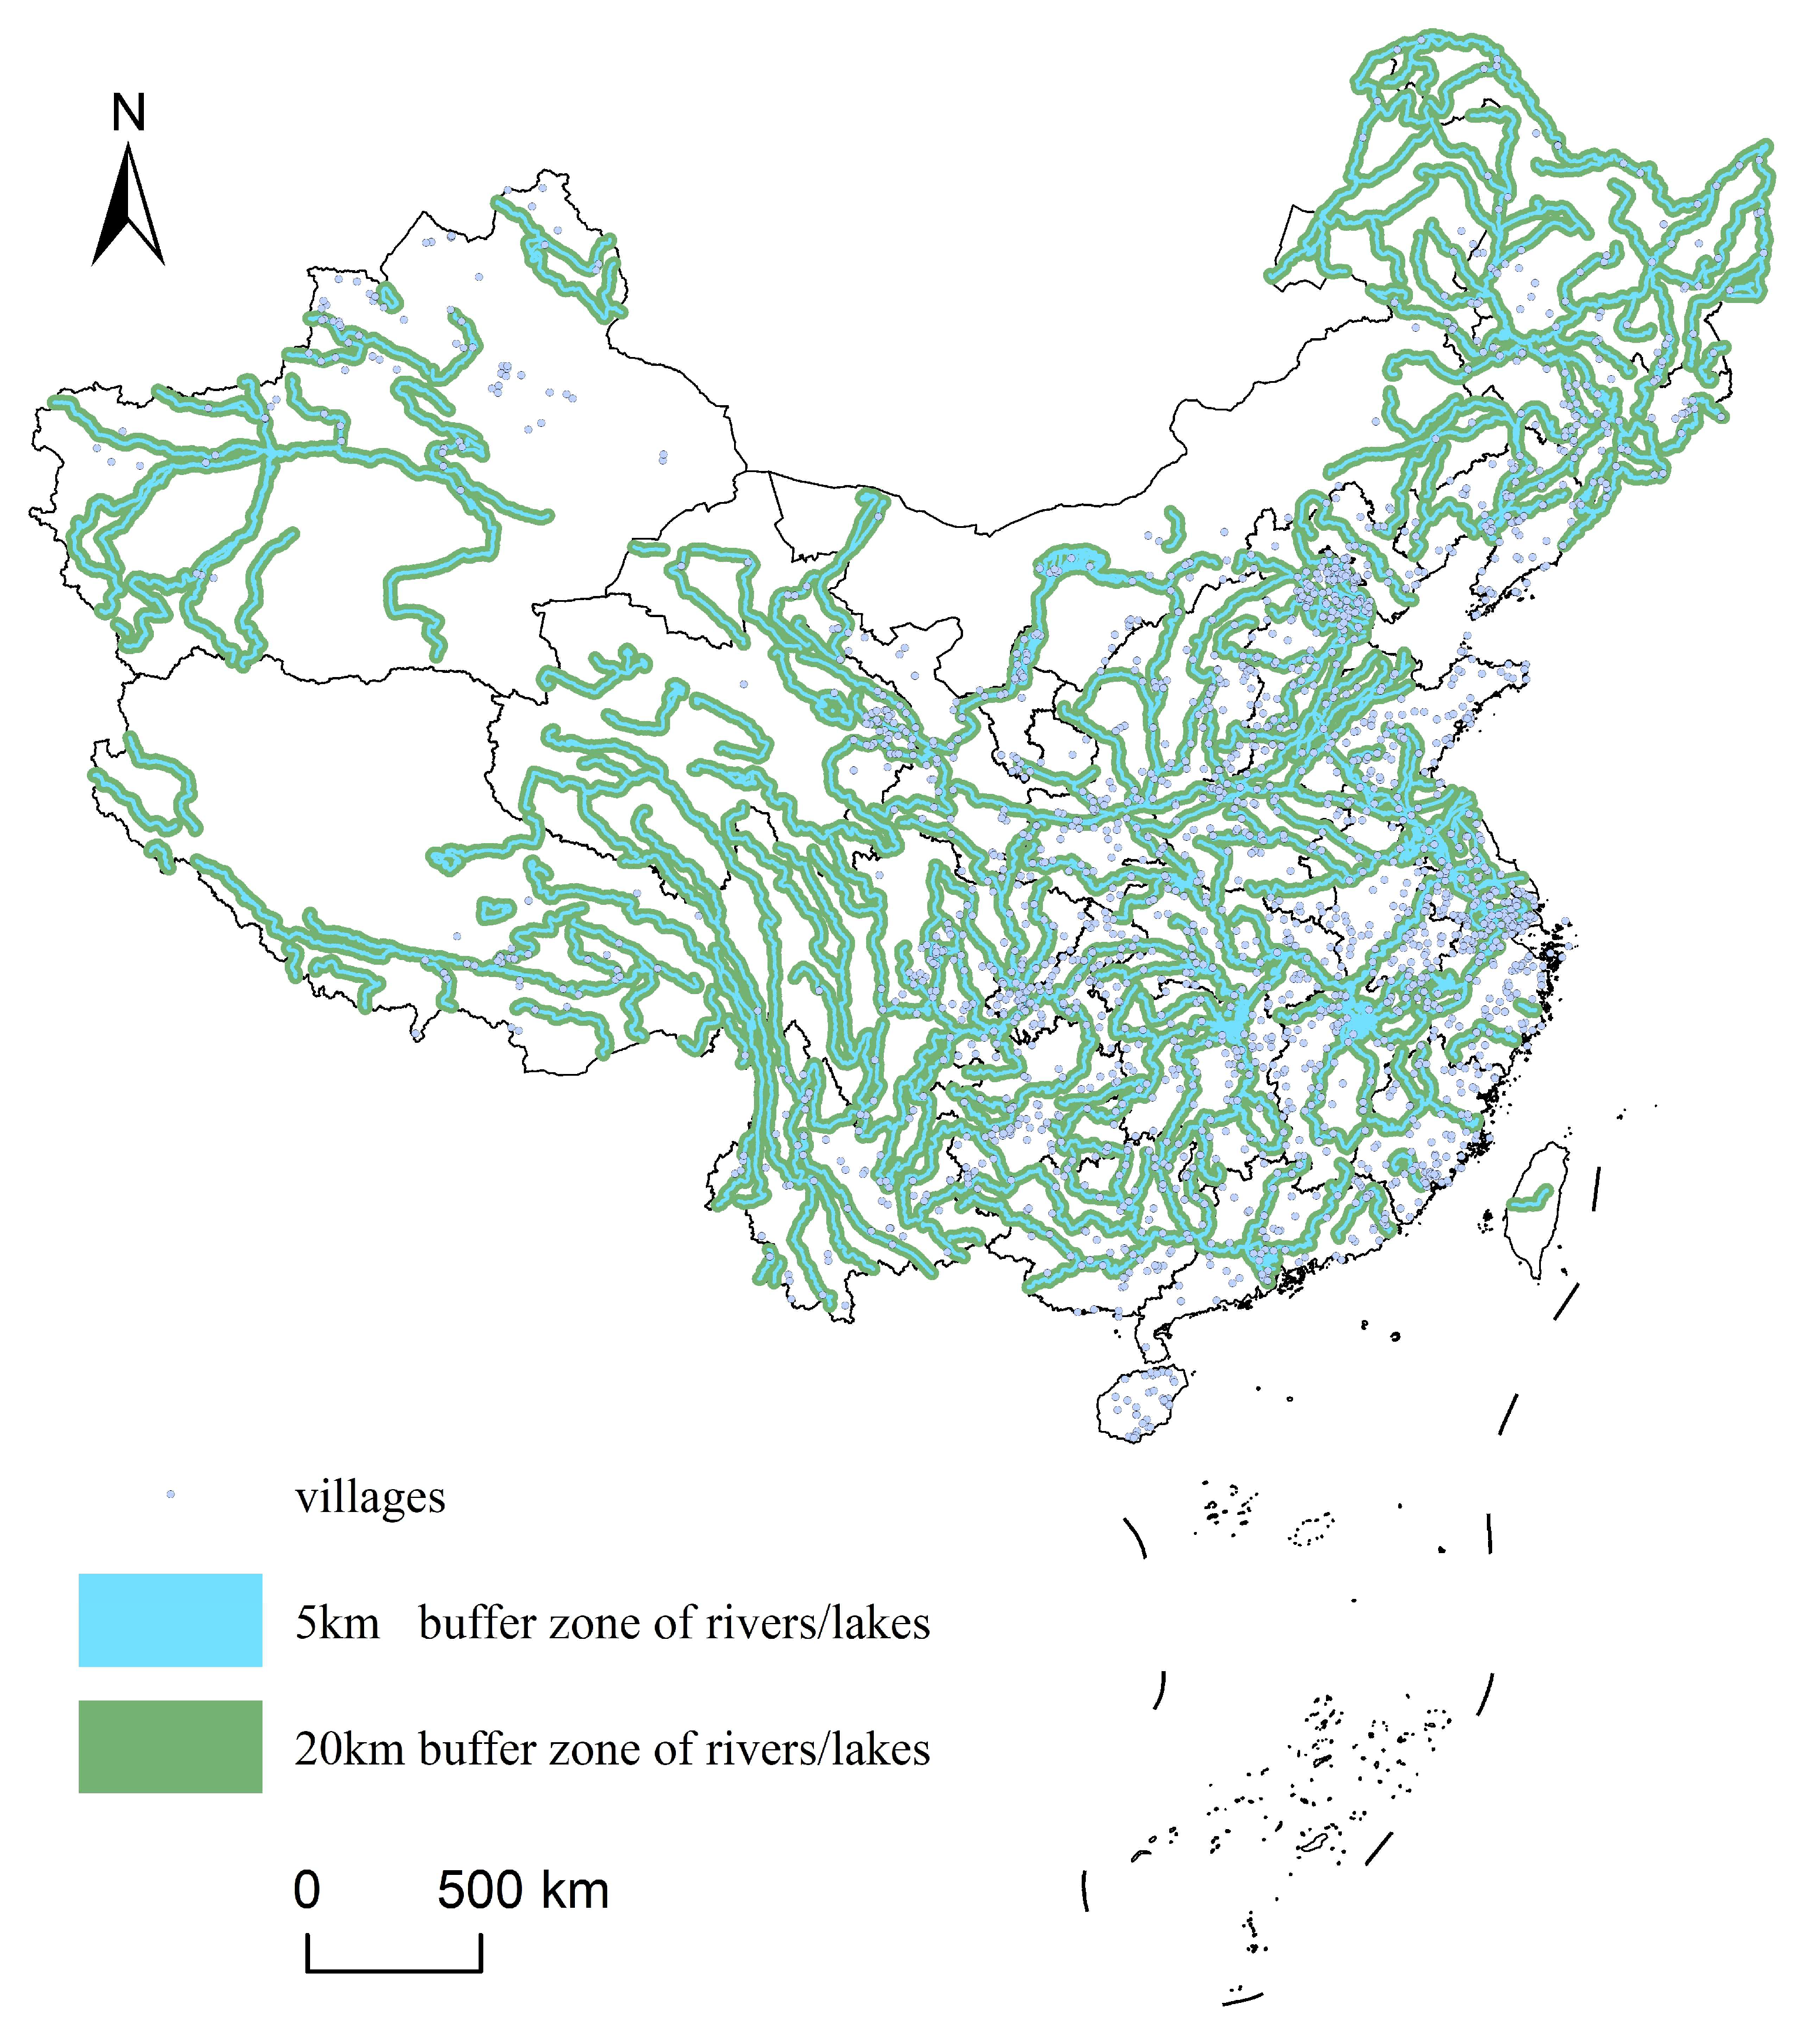
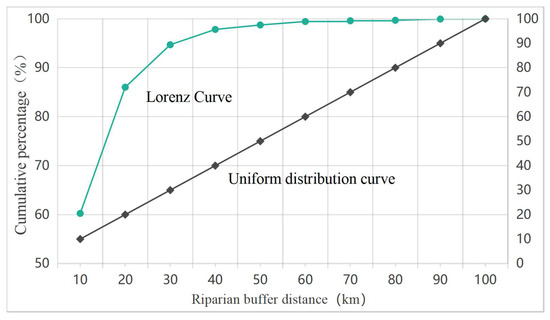
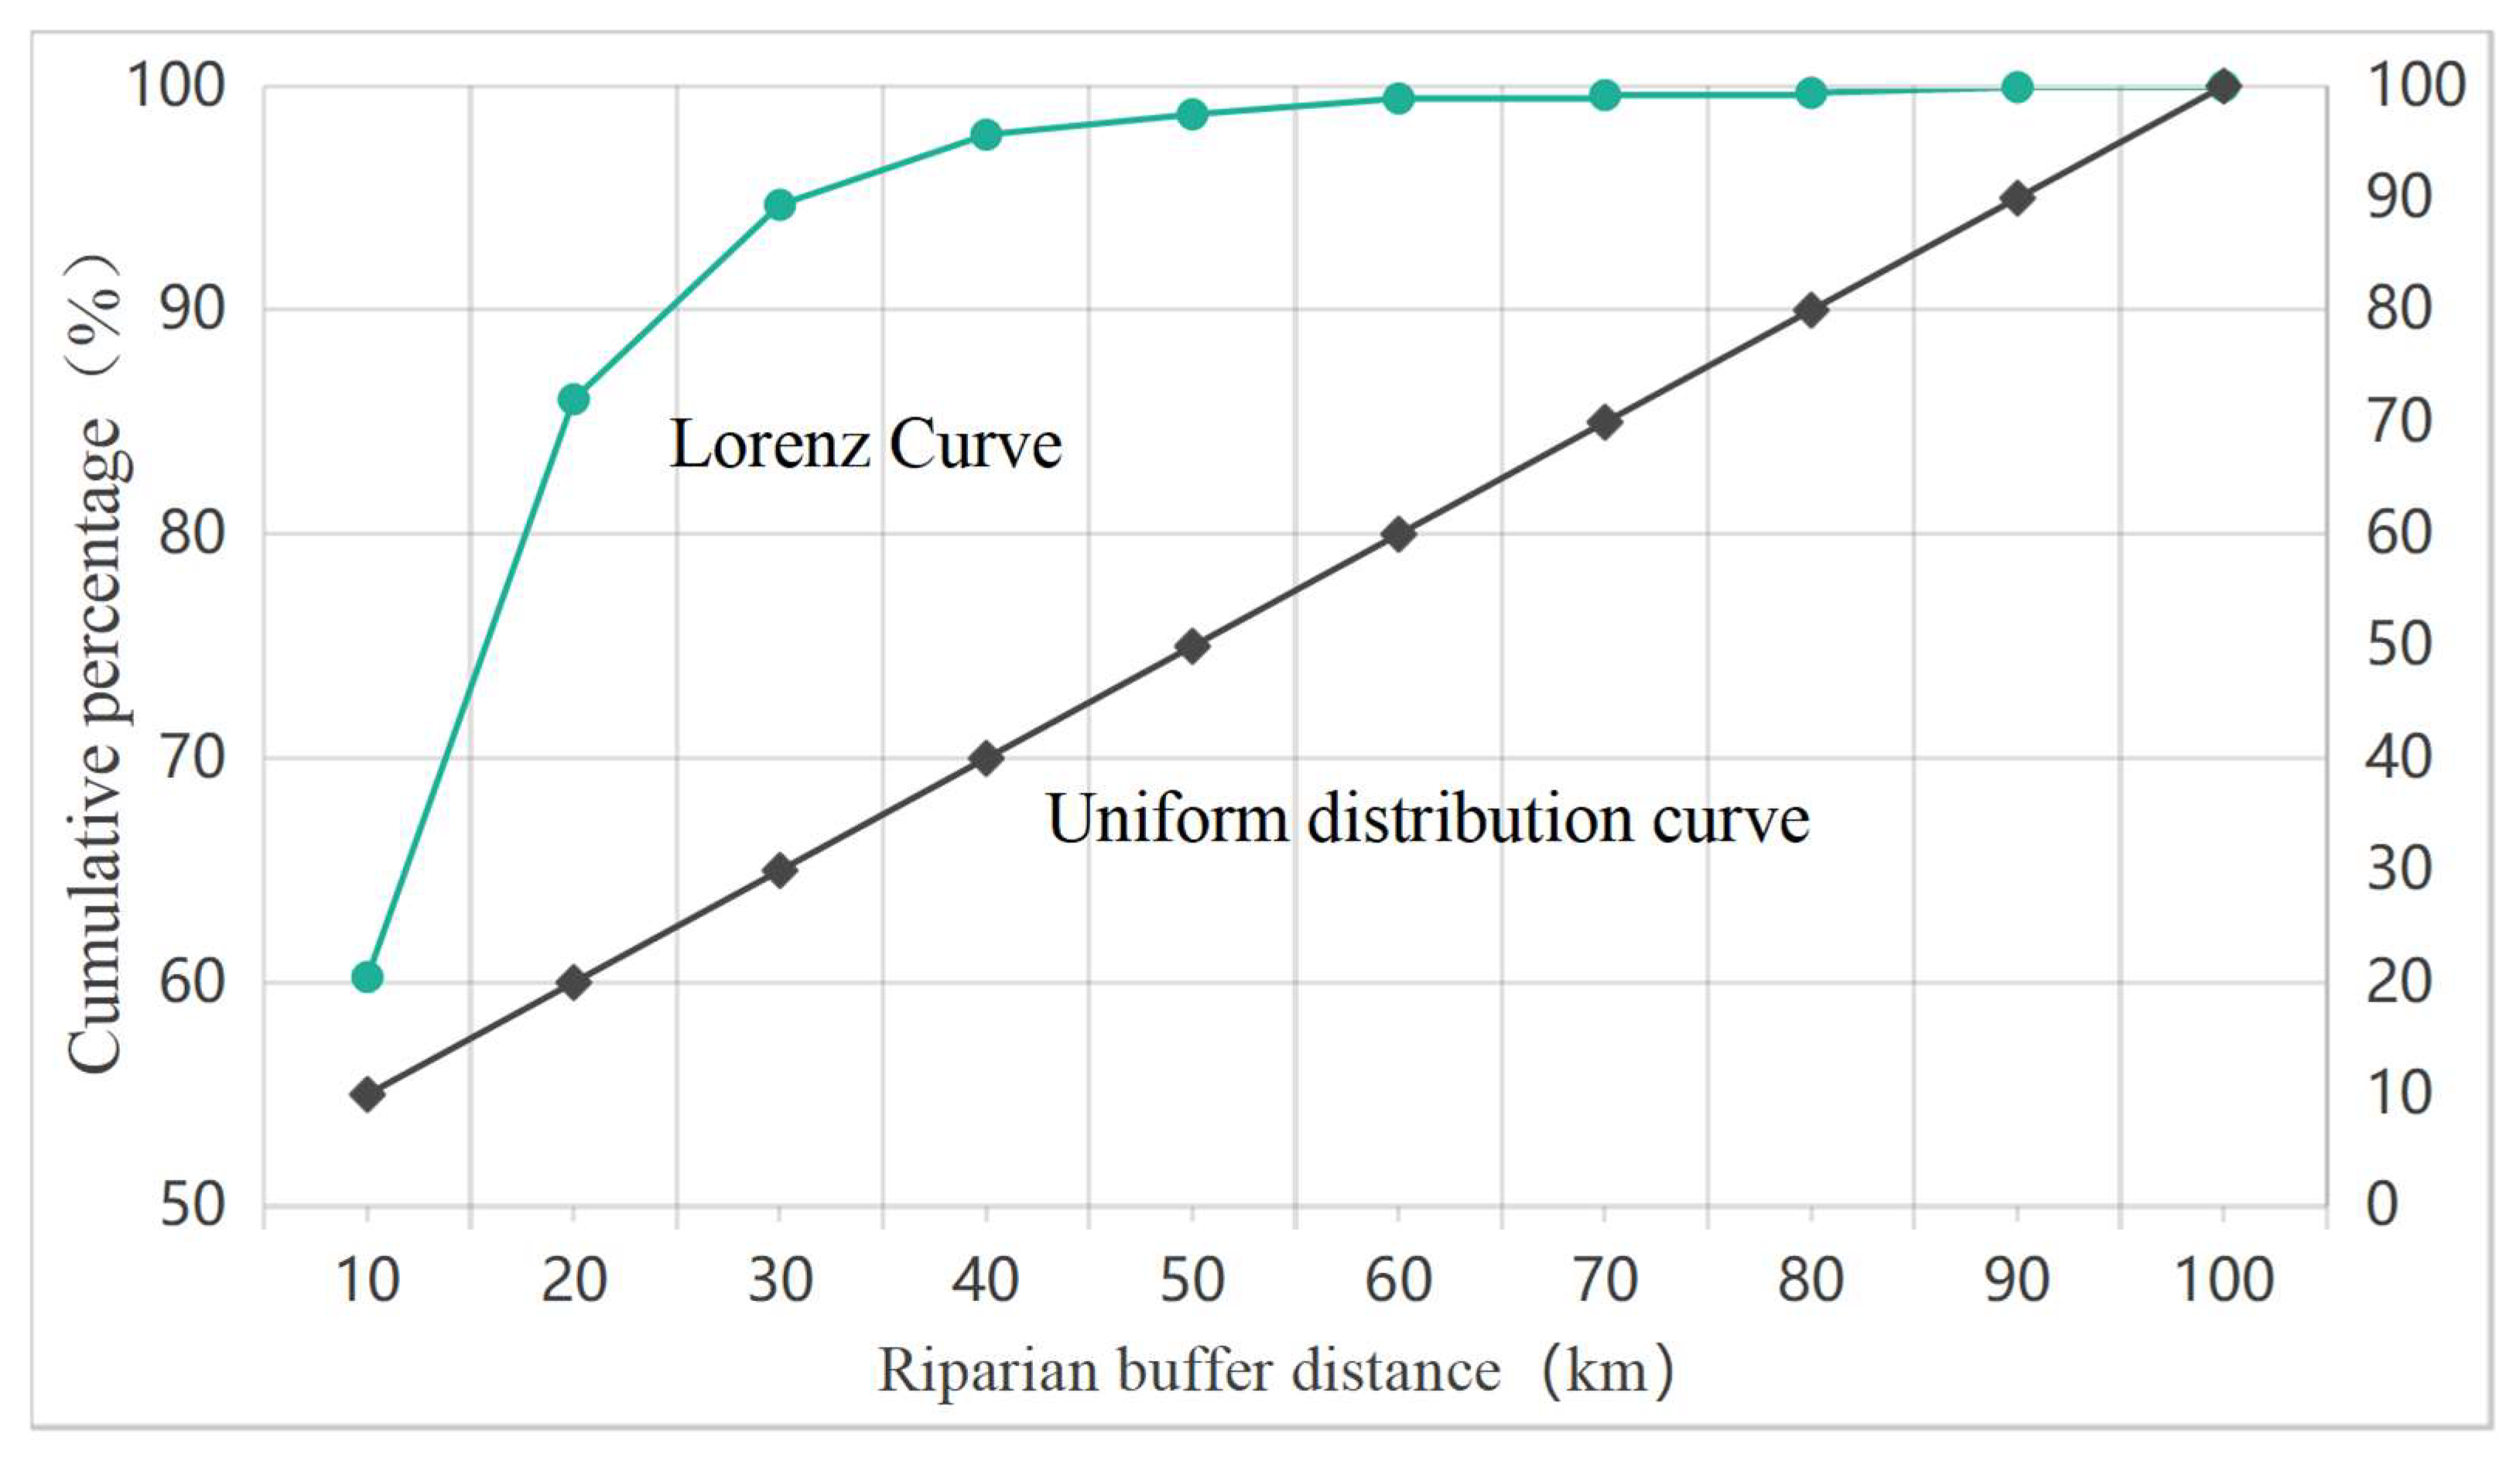
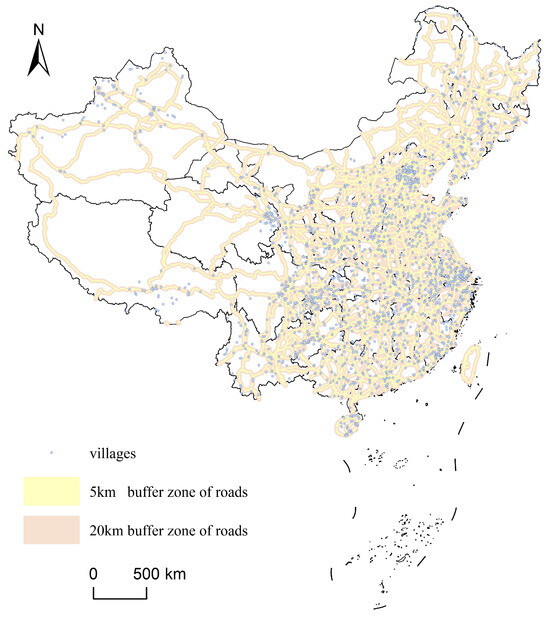
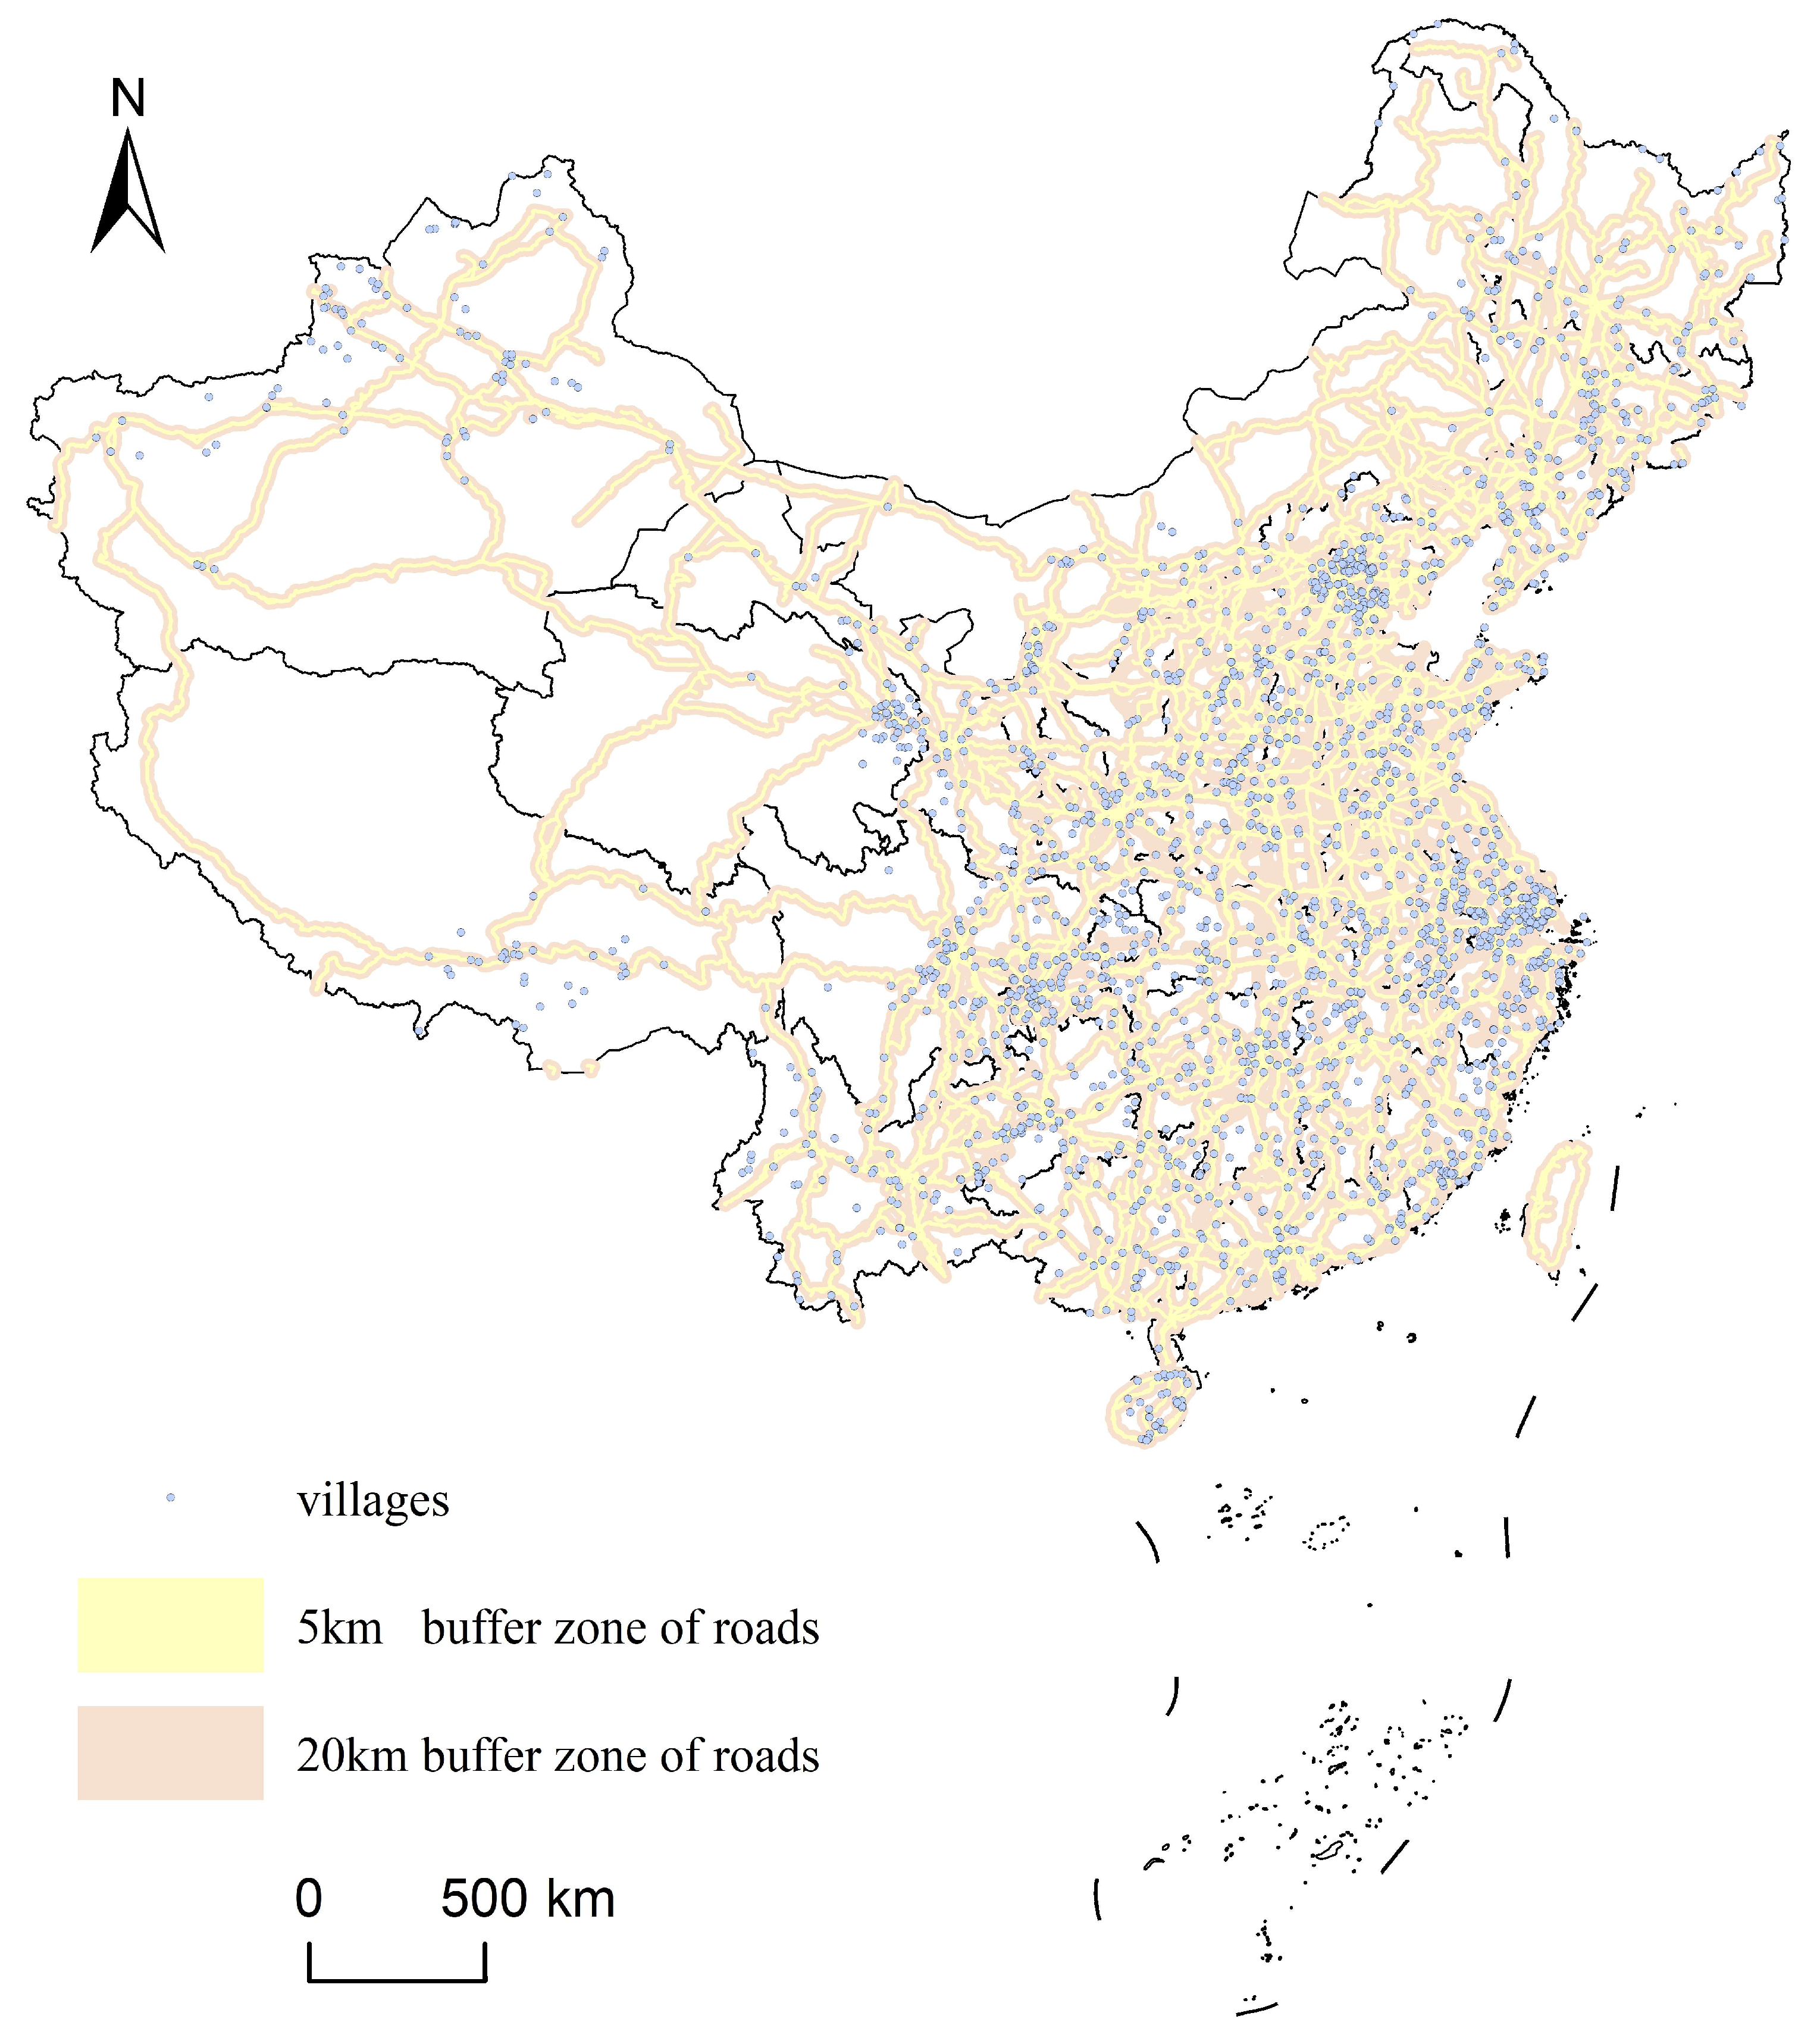
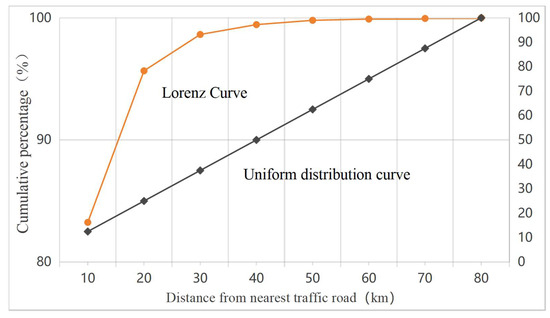
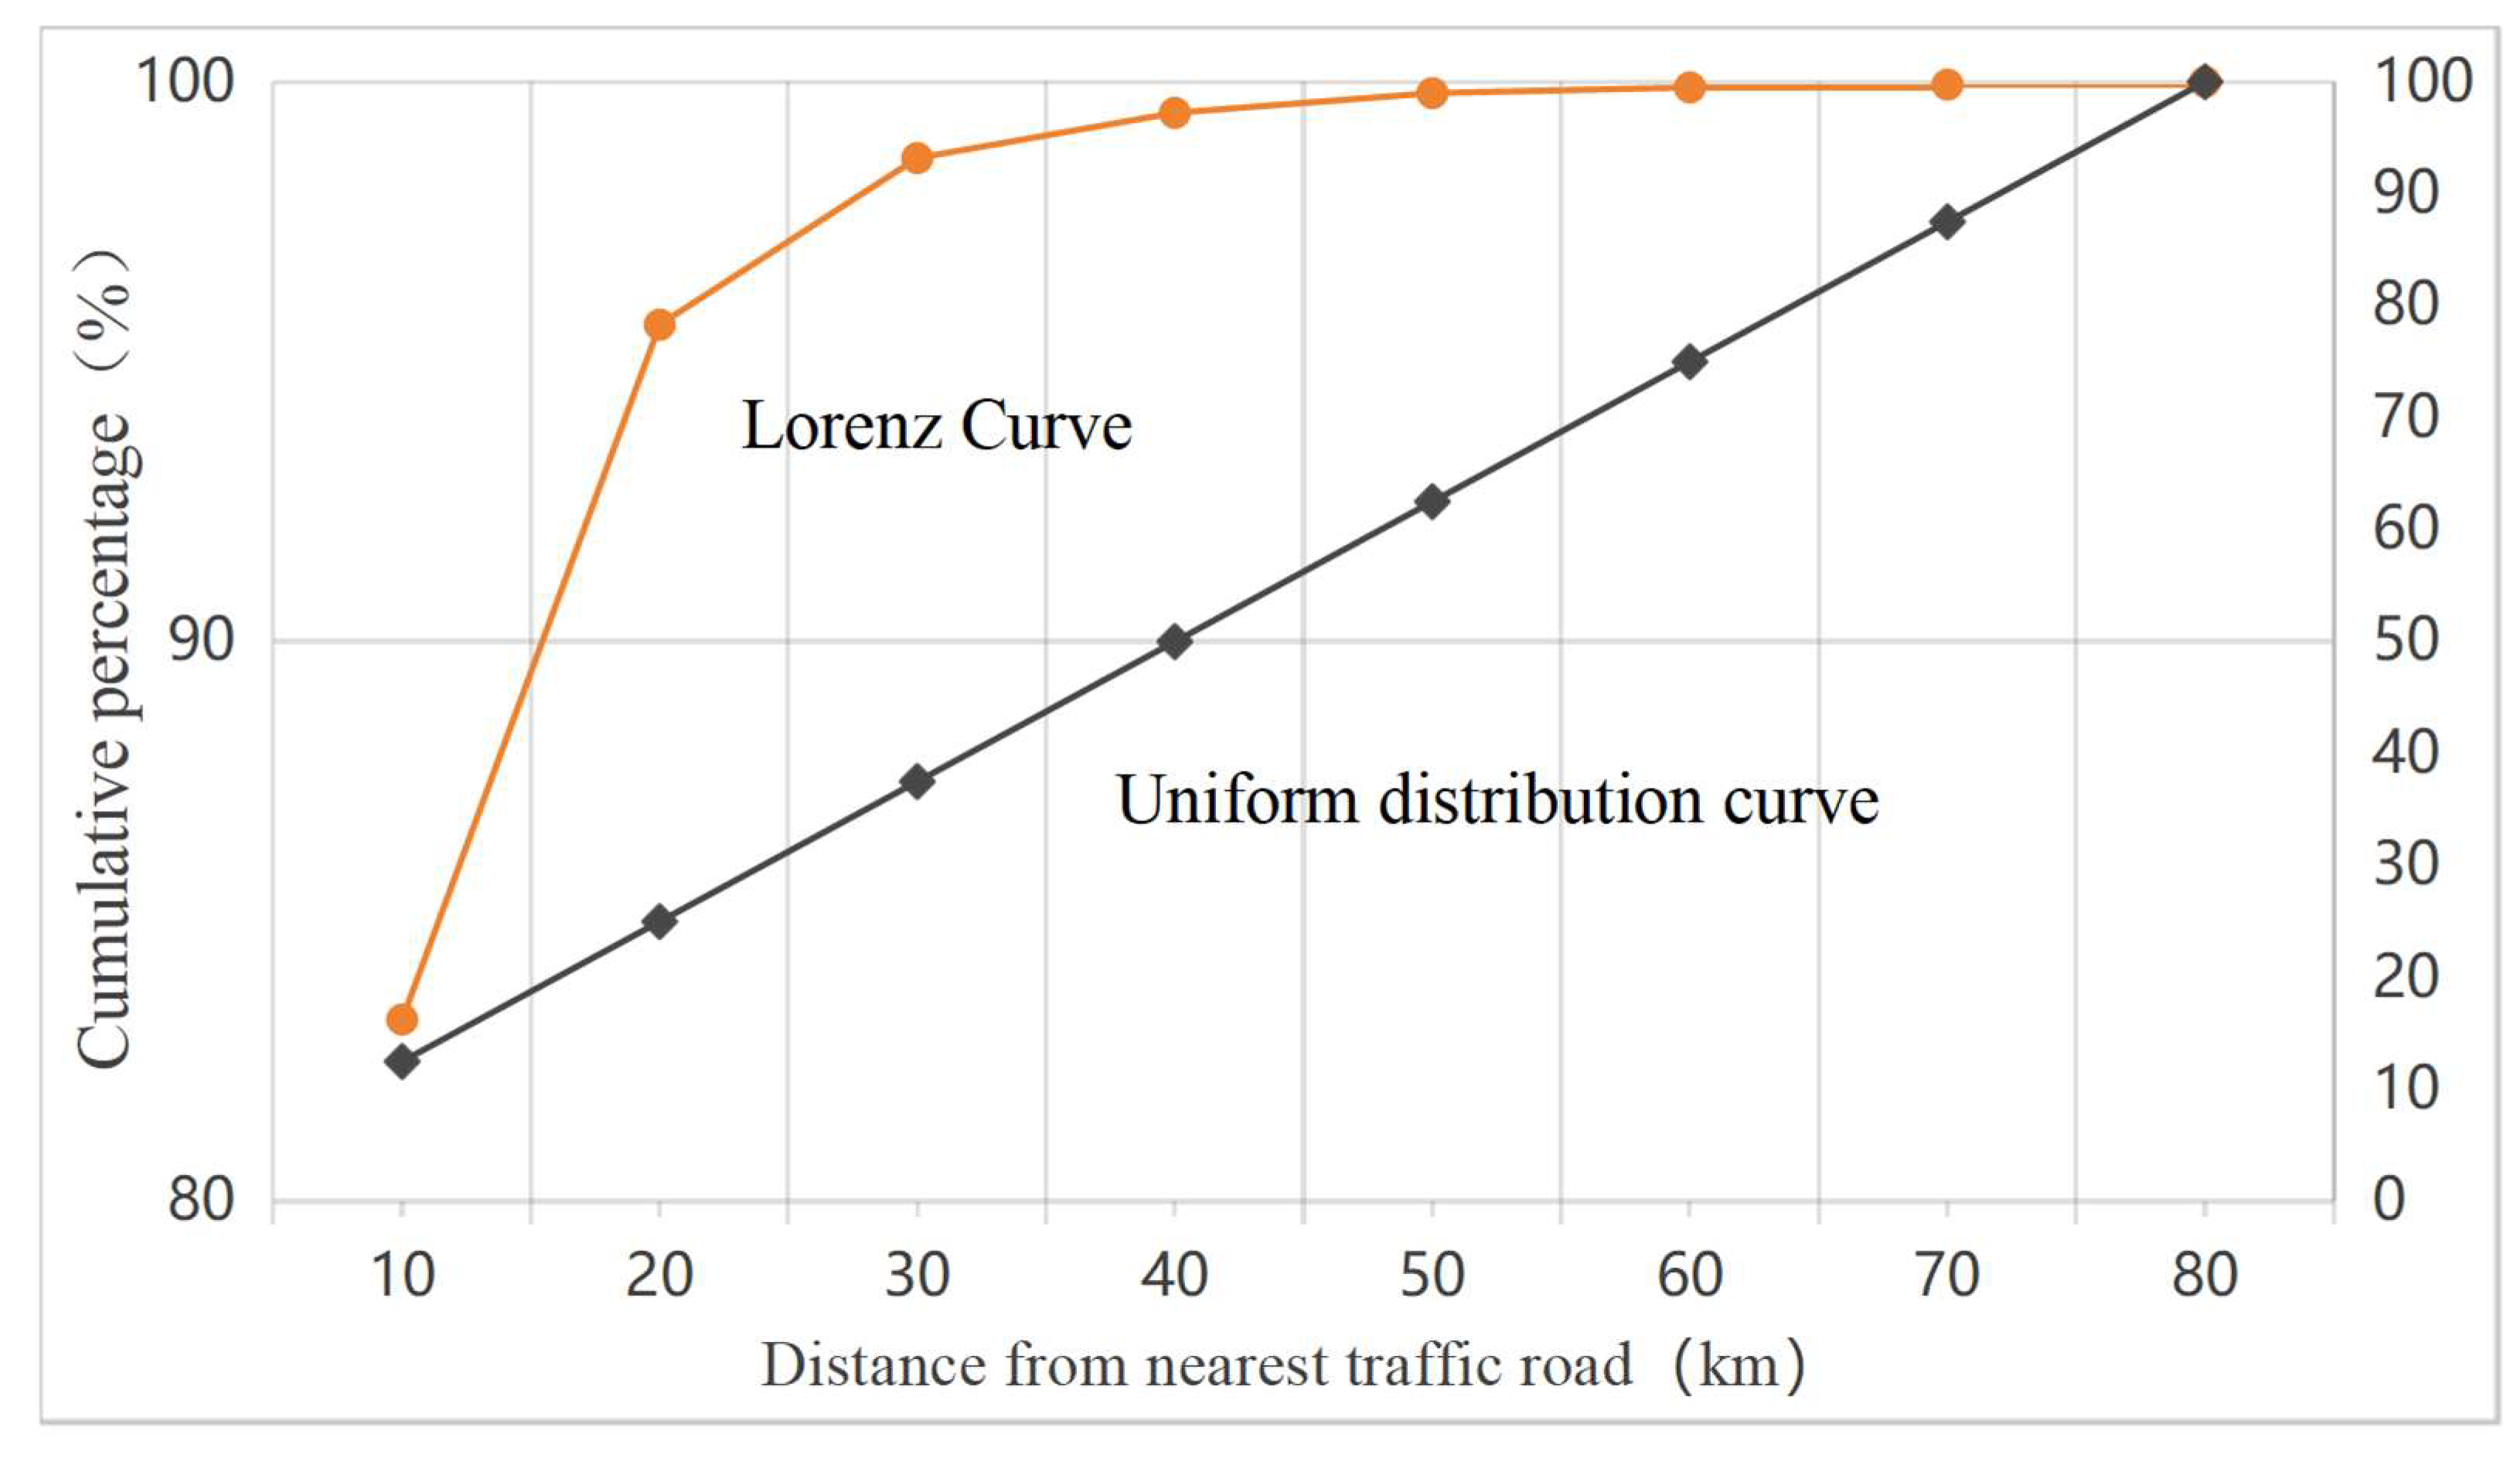
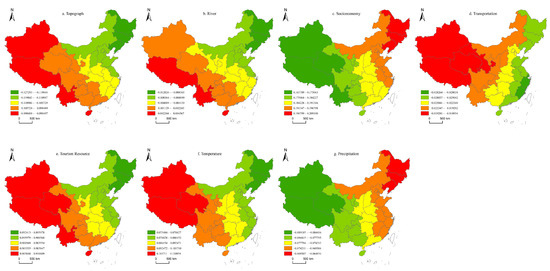
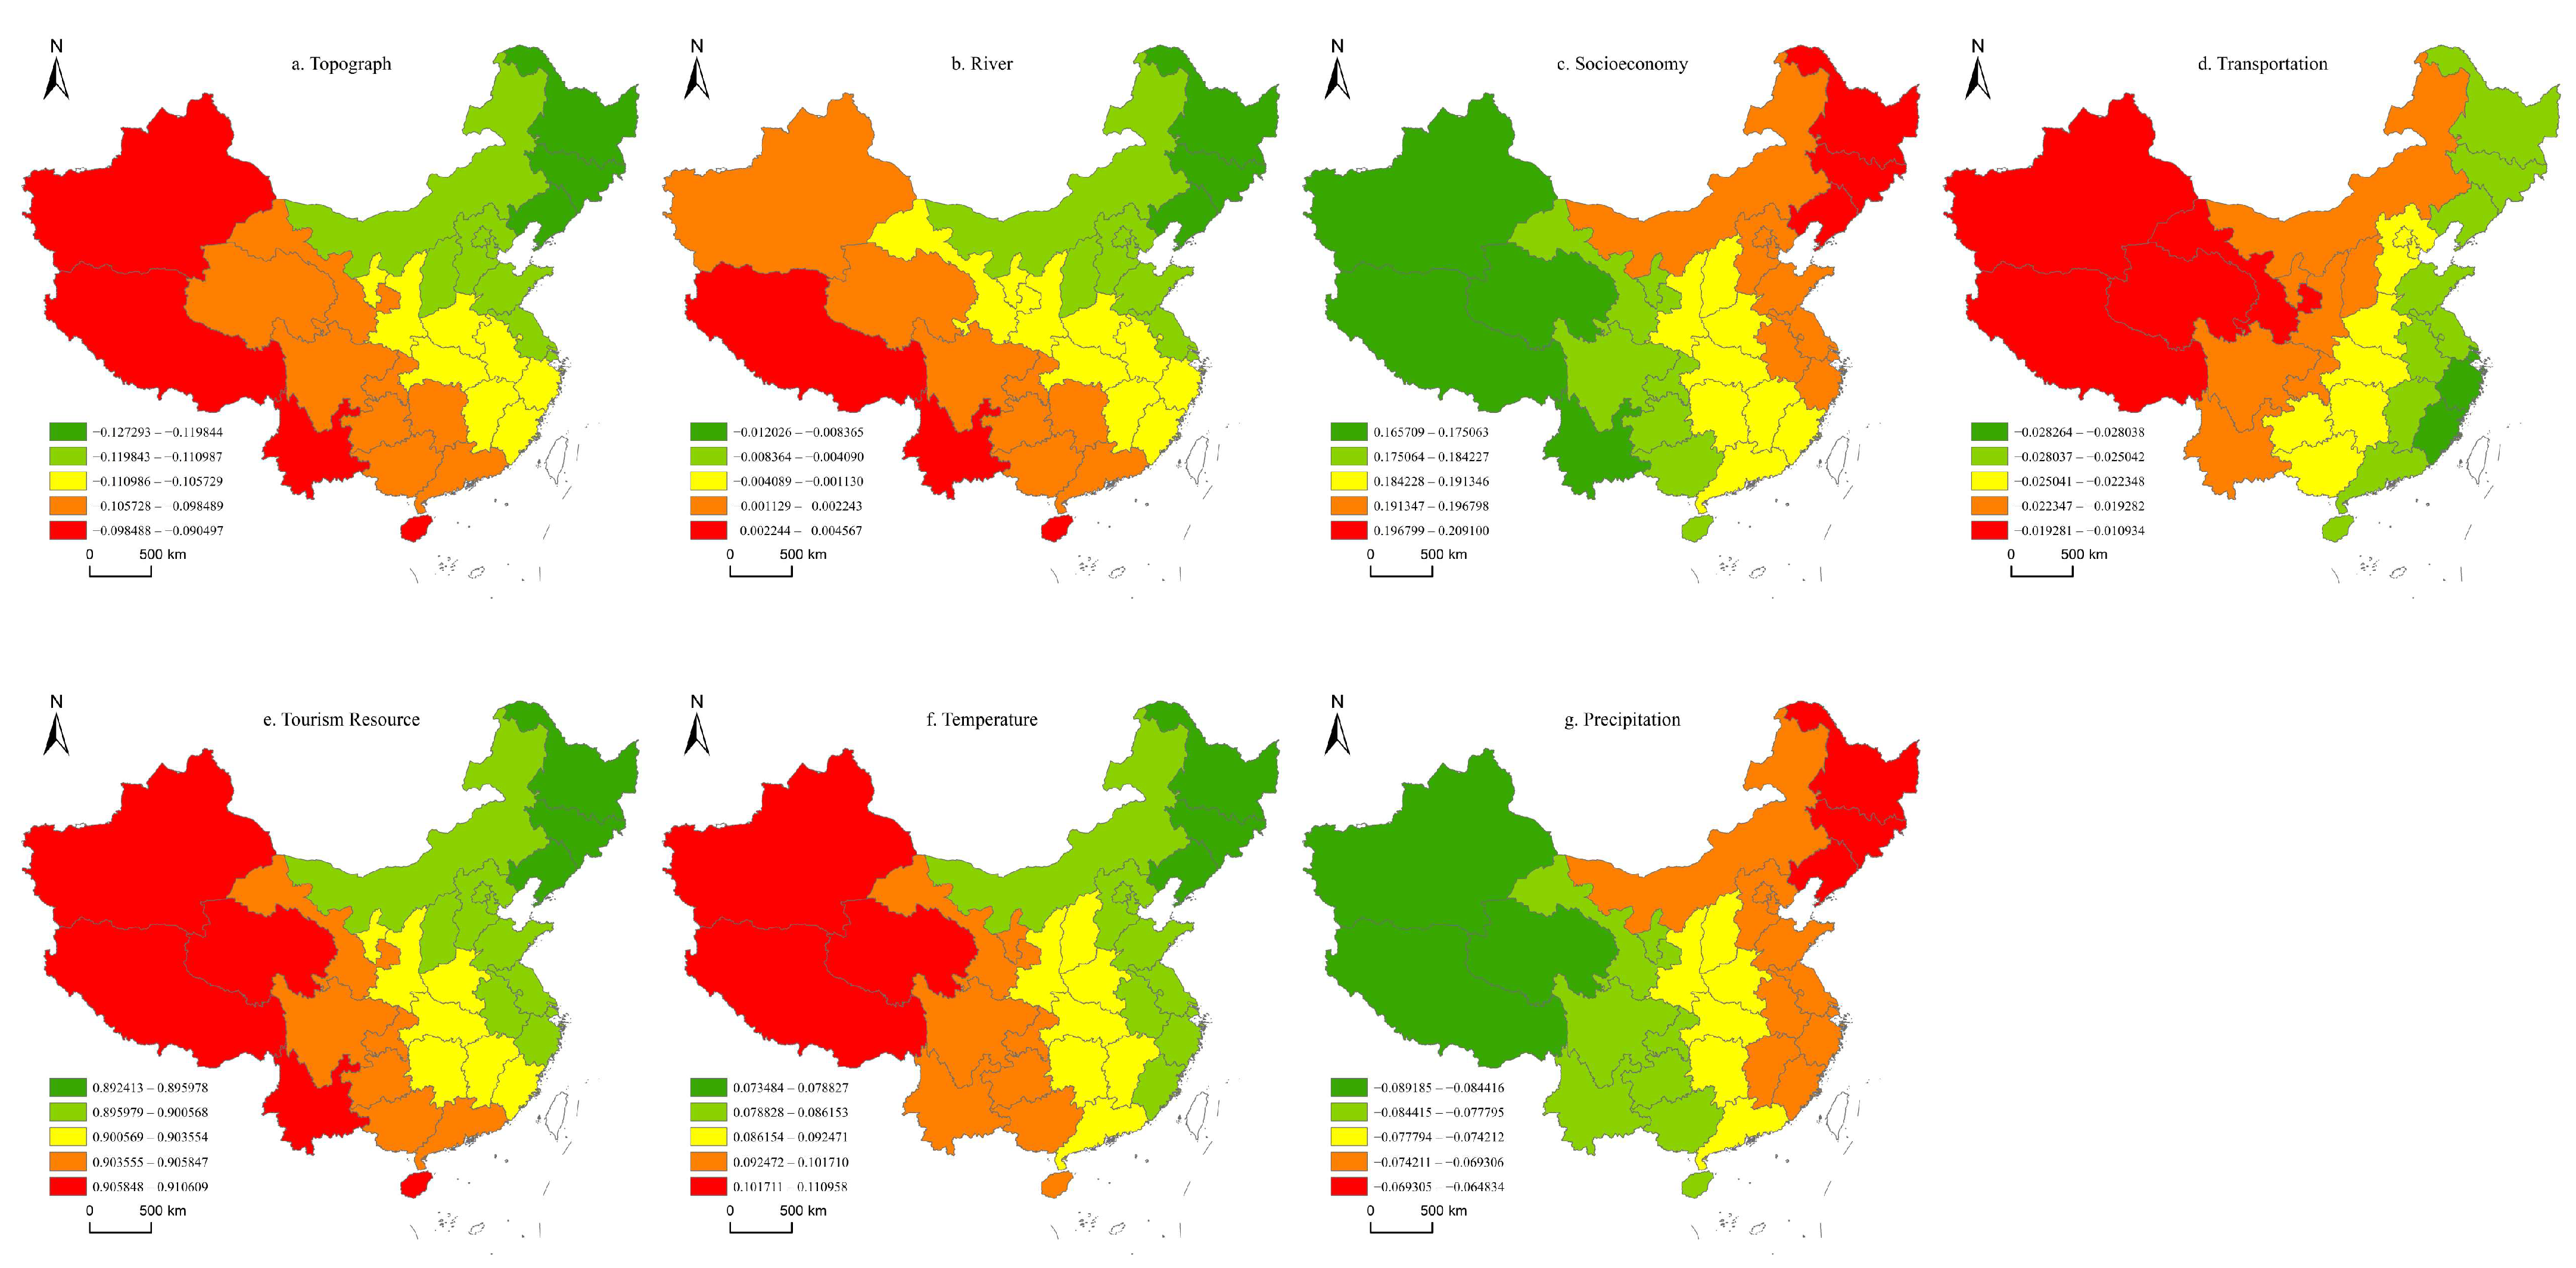
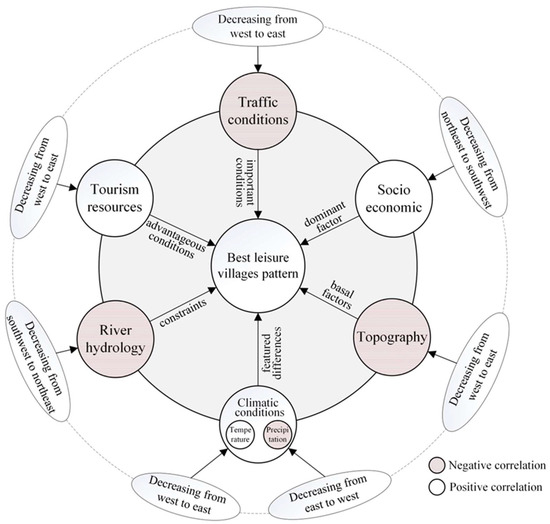
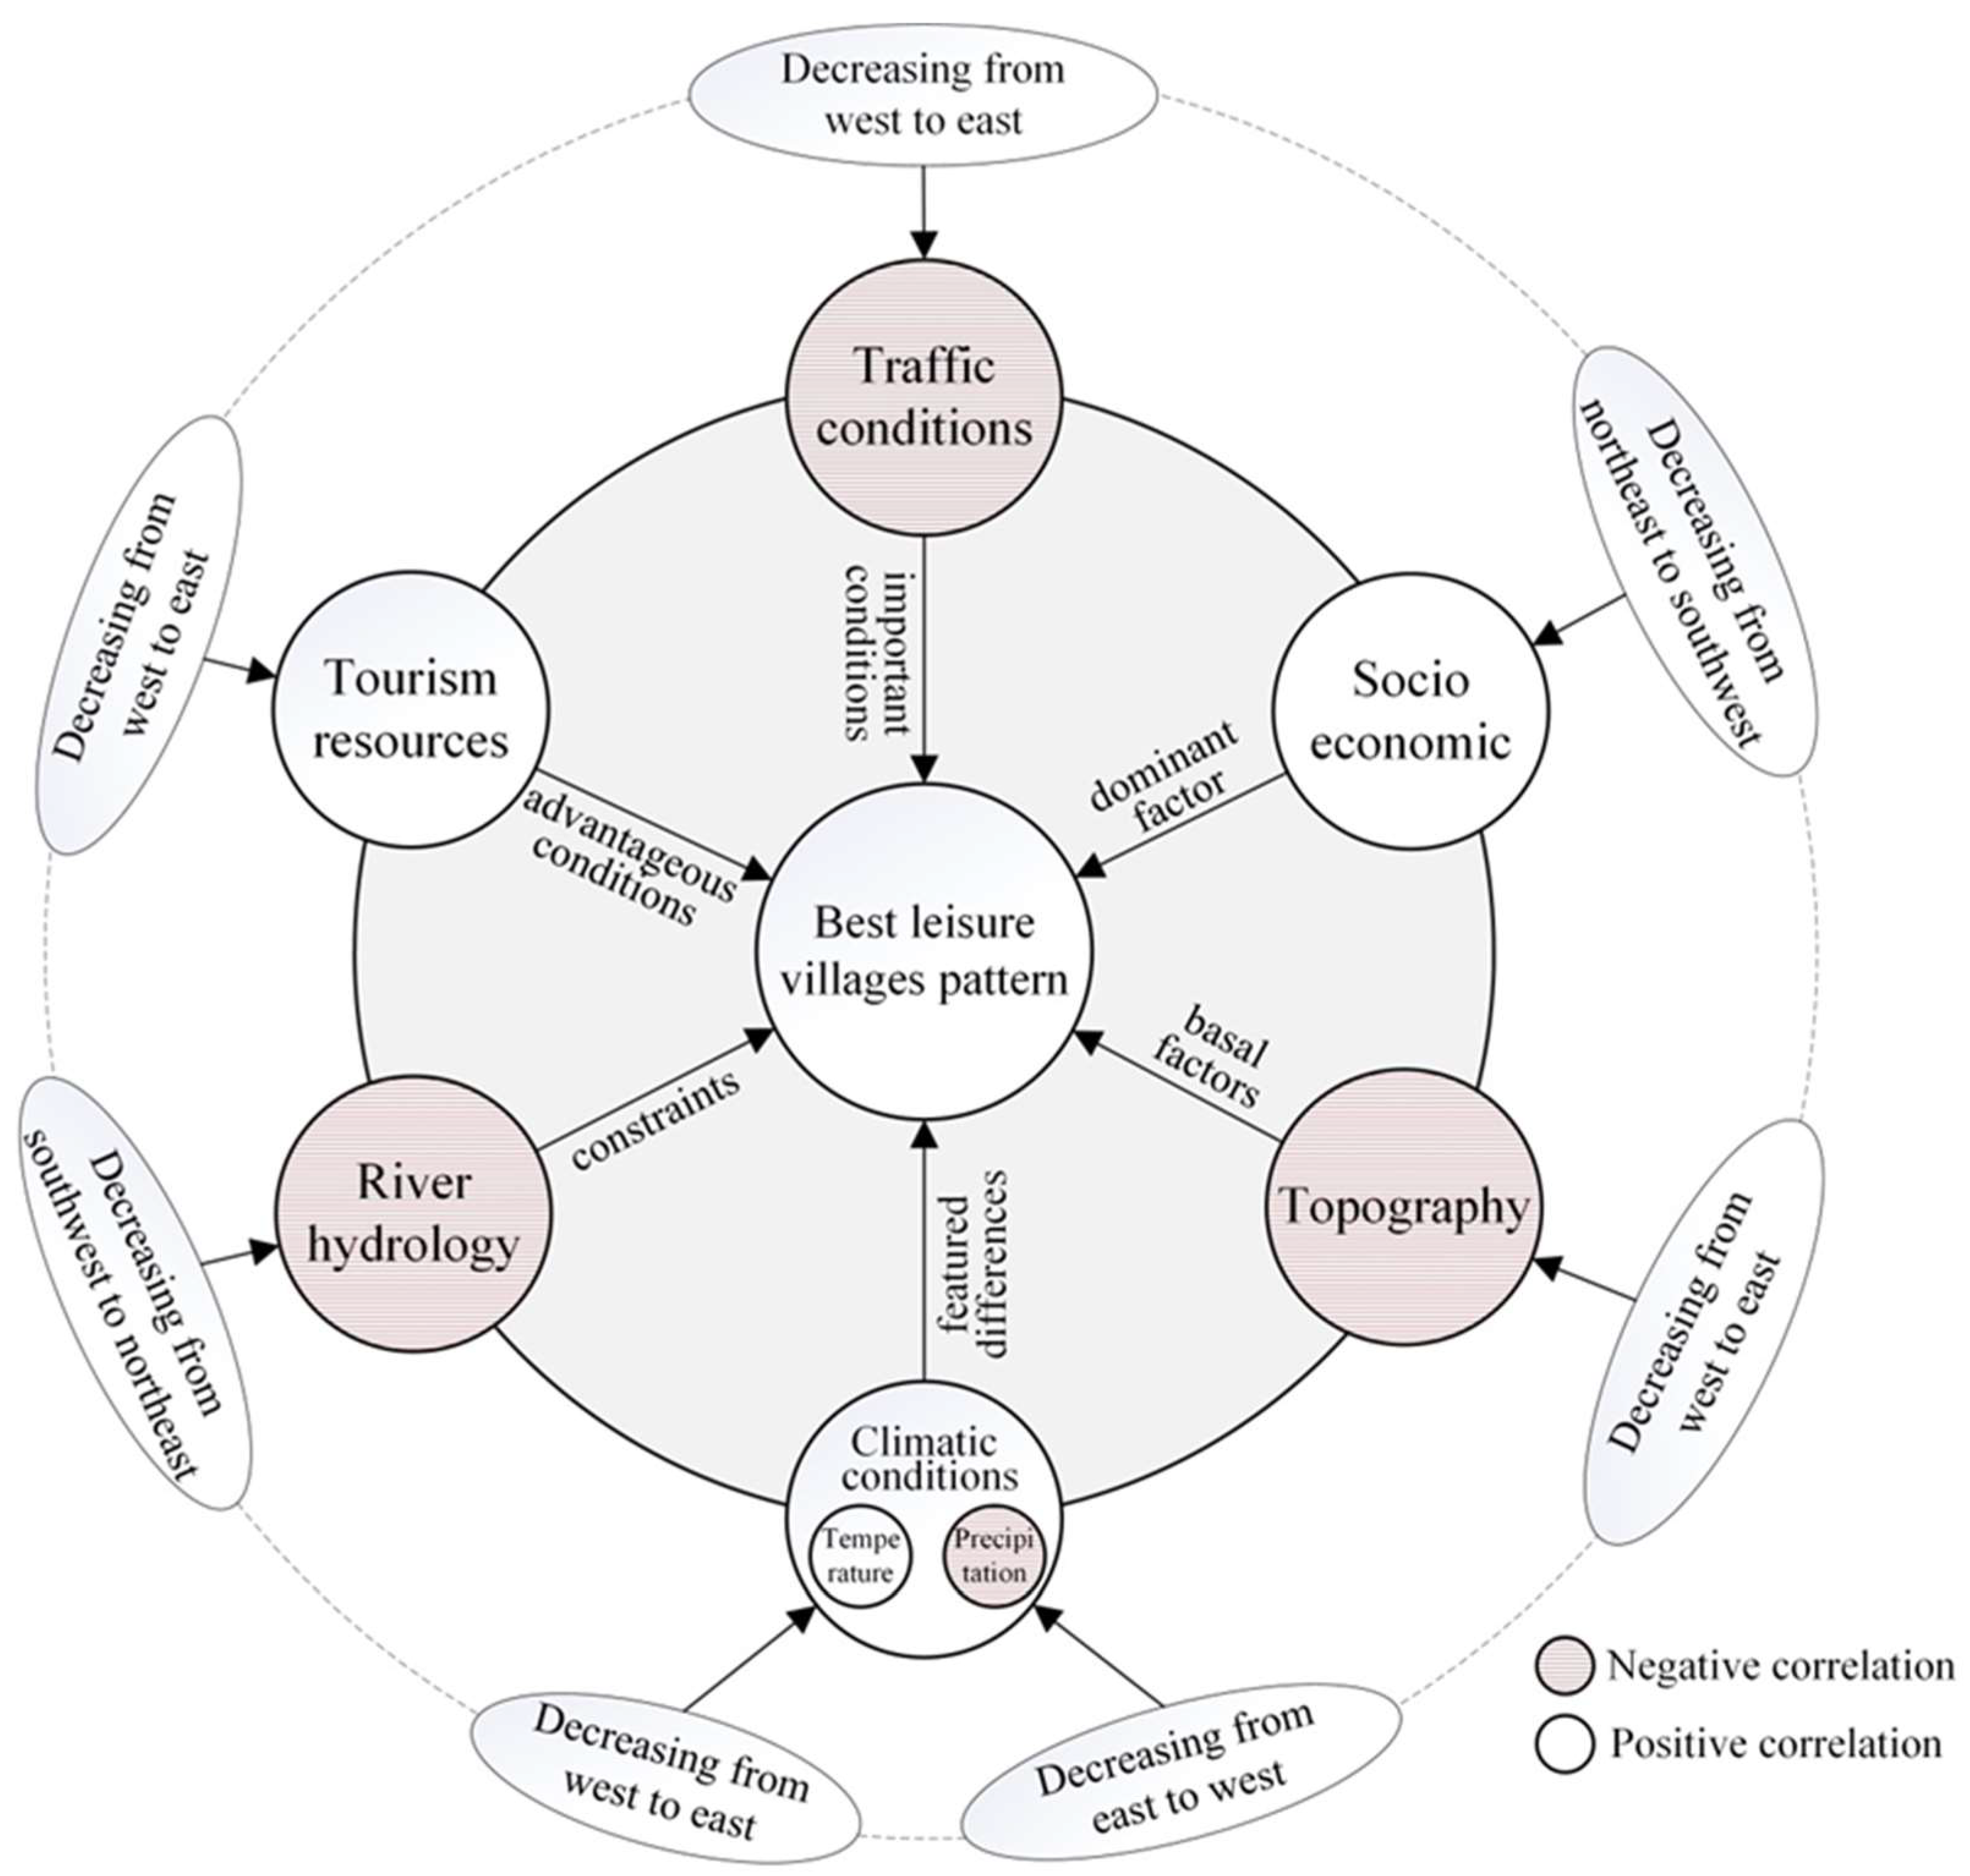

Disclaimer/Publisher’s Note: The statements, opinions and data contained in all publications are solely those of the individual author(s) and contributor(s) and not of MDPI and/or the editor(s). MDPI and/or the editor(s) disclaim responsibility for any injury to people or property resulting from any ideas, methods, instructions or products referred to in the content. |
© 2026 by the authors. Licensee MDPI, Basel, Switzerland. This article is an open access article distributed under the terms and conditions of the Creative Commons Attribution (CC BY) license.