Abstract
Understanding the spatial distribution and associated contextual factors of historic and cultural districts is essential for heritage conservation and land-based spatial planning. Previous studies have largely focused on site-level authenticity and development models, while national-scale quantitative analyses remain limited, particularly in the Chinese context. This study constructs a nationwide dataset of 1212 historic and cultural districts across 31 provincial-level regions in China and applies a GIS-based framework integrating Global Moran’s I, kernel density estimation, and standard deviation ellipse analysis. The results reveal significant spatial clustering broadly aligned with the Hu Huanyong Line, with high-density concentrations in major urban agglomerations such as the Yangtze River Delta and an overall orientation along an east–west axis at the national scale. Further analysis suggests that these spatial patterns are broadly consistent with natural geographic conditions and long-term historical–cultural contexts; river systems, dynastic capital construction, economic development, and population migration provide important interpretive backgrounds for understanding regional differentiation. By providing a national-scale quantitative characterization of designated historic and cultural districts, this study offers spatial evidence to support more differentiated, land-oriented conservation and spatial planning strategies and to facilitate comparable spatial-heritage analytics in other regions where designation lists exist.
1. Introduction
Across the world, historic areas and heritage districts are increasingly exposed to development pressures driven by urban renewal, real-estate investment, infrastructure upgrading, and tourism-led transformation, which may undermine their spatial integrity and long-term sustainability [1,2]. In response, international heritage governance has progressively emphasized more integrative frameworks—most notably the UNESCO “Historic Urban Landscape” (HUL) approach—which advocates embedding heritage conservation into comprehensive planning and multi-stakeholder governance to balance preservation with urban regeneration and sustainable development [3]. These challenges are particularly pronounced in China, where rapid urbanization and economic growth have accelerated land-use change and reshaped traditional urban spaces, making it increasingly important to understand the spatial organization of historic and cultural districts and the factors that associated with their distribution at broader geographic scales.
Historic and cultural districts typically refer to areas with a rich concentration of preserved cultural relics, clusters of historic buildings, which can comprehensively and authentically reflect traditional layouts and historical features on a significant scale [4]. These districts hold irreplaceable value in terms of cultural preservation, architectural aesthetics, cultural heritage, and commercial development. In many European cities, historic city centers have been analyzed as key heritage spaces under intense tourism and real-estate pressure, with research examining how touristification and visitor flows reshape urban form and threaten the long-term conservation of historic urban landscapes [1]. Such understanding is crucial for formulating more scientifically sound and effective policies and measures. Therefore, studying the spatial distribution patterns and influencing factors of historic and cultural districts is of great significance, especially in the context of China.
Previous research on historic and cultural districts has primarily focused on four aspects: authenticity [1,2], development models [4,5], cultural inheritance [6,7], and heritage governance and planning operationalization [8,9]. Regarding the authenticity of historic and cultural districts, scholars emphasize the importance of preserving the spatial structure of these areas. This involves maintaining and protecting their unique regional characteristics and historical features while ensuring the orderly and rational use of their spatial environment [6]. Additionally, the preservation of the spatial environment itself is critical [10]. On one hand, this entails maintaining the original layout of the natural environment, including distinctive surrounding residential buildings. On the other hand, when restoring damaged areas, efforts should be made to recreate their original appearance and maintain harmony within the human environment, aligning preservation with modern urban development [11].
In terms of development models, some scholars have noted that many Chinese cities, during urban renewal processes, have developed historic and cultural districts without adequate planning, altering their original features and being associated with their decline or even disappearance [12]. Given the current state of historic and cultural districts in China, some researchers have proposed a classification-based protection approach. Well-preserved districts can maintain their status and functions, while those in poor condition should undergo restoration to their original appearance, integrating as seamlessly as possible into modern urban renewal efforts to maximize their value [13].
Regarding cultural inheritance, past studies have often explored aspects of heritage preservation. The original inhabitants of historic and cultural districts are the bearers and transmitters of cultural heritage, forming the soul of these districts. However, the mass relocation of these residents has led to a gradual decline in the cultural richness of some historic districts [14]. Some scholars suggest that to reduce resident displacement, it is possible to restore the cultural scenes of these districts. For example, utilizing public spaces in historic and cultural districts to regularly host unique folk activities such as dragon and lion dances during the Spring Festival, temple fairs and lantern festivals, or Dragon Boat Festival races along historic waterways can enrich the lives of residents and provide a space for broader cultural exchange [15]. Other scholars believe that appropriate modifications to the internal architecture of these districts can protect them without compromising their authenticity [16].
Historic and cultural districts also function as land-based policy instruments that operationalize heritage values through planning and governance [8]. In practice, designation typically triggers conservation planning requirements, development and design controls (e.g., restrictions on land use, building intensity, facade and streetscape guidelines), and review procedures that influence redevelopment decisions and infrastructure upgrading within and around designated areas [9]. In addition, contemporary heritage governance increasingly emphasizes integrating conservation objectives into urban planning and multi-stakeholder coordination so as to manage change in historic areas under rapid urbanization. From this governance-and-planning perspective, observed spatial patterns of designated districts may reflect not only historical–cultural endowments but also differences in policy implementation capacity and local institutional resources, which should be acknowledged when interpreting national-scale clustering and regional disparities [17].
In terms of research methods for historic and cultural districts, traditional approaches have included field surveys, observation, and the collection of historical documents and literature [18]. Different researchers have employed various methods. Field surveys and observation are fundamental for studying historic and cultural districts, allowing researchers to record information on location, architectural style, structure, layout, historical development, community environment, and cultural activities [5]. The collection of historical documents involves reviewing archives, local records, and other materials to understand the historical evolution, construction processes, and related events and figures of these districts [19]. Additionally, semi-qualitative and semi-quantitative methods, such as Landscape Character Assessment (LCA) and Historic Landscape Characterization (HLC), have been used to describe landscapes and their features [20]. It should be noted that LCA/HLC studies may also rely on GIS as a mapping and visualization platform. However, their typical application is often case- or region-specific and focuses on landscape classification and descriptive characterization, rather than conducting reproducible, national-scale spatial statistical assessments of clustering and directional structure. In this context, Geographic Information Systems (GIS), already used in landscape design, offer a promising approach for mapping and measuring spatial patterns at broader geographic scales. However, spatial-analytic outputs are sensitive to methodological choices and data representation. The modifiable areal unit problem (MAUP) suggests that detected patterns may vary with analysis scale and aggregation units [21,22]. In addition, measures of clustering and spatial dependence depend on how spatial relationships are specified (e.g., distance-based or k-nearest-neighbor spatial weights [23,24]), and hotspot surfaces produced by kernel density estimation (KDE) can change noticeably with bandwidth/search-radius settings [25,26]. Therefore, spatial-pattern studies should explicitly report key parameters (analysis scale, weights specification, bandwidth settings) and, where feasible, conduct sensitivity checks across plausible specifications to communicate uncertainty in pattern identification and interpretation [27].
Building on the above literature, we propose a conceptual framework in which the national-scale geography of designated historic and cultural districts may reflect the combined context of heritage endowments, urbanization pressures, and governance/planning capacity. Natural settings (e.g., topography and river corridors) are linked to long-term settlement suitability and provide the environmental context for historic urban development, while historical–cultural processes (e.g., political centers, economic cores, and population movements) offer interpretive context for the emergence of heritage-rich regions over time. Under rapid urbanization, development intensity and redevelopment demand tend to concentrate in economically dynamic regions, creating uneven pressures on historic areas. Meanwhile, governance structures—including nomination incentives, planning resources, and the ability to implement conservation controls—affect which areas are more likely to be designated and effectively managed. Consequently, observed core–periphery clustering and directional structures can be interpreted as outcomes of interactions among environmental constraints, historical trajectories, urbanization dynamics, and governance-mediated designation and management.
In conclusion, while previous scholars have conducted extensive research on the authenticity, development models, and cultural inheritance of historic and cultural districts, yielding important results, there are still two main gaps. First, much of the research has focused on single districts [5,11,19], lacking a macro-scale study of all historic and cultural districts across the country. Second, existing research in China has largely emphasized qualitative analysis [28,29], with insufficient reproducible, national-scale spatial-statistical characterization of clustering/cores/directionality. Third, contextual factors associated with the observed national-scale patterns remain under-discussed. Key questions remain: (1) What is the national-scale distribution of China’s designated historic and cultural districts based on a consolidated dataset? (2) How can clustering, density cores, and directional structure be characterized reproducibly using spatial statistics? (3) How can the observed patterns be interpreted in relation to contextual factors such as topography, river corridors, and historical–cultural processes? Beyond China, this research offers a transferable national-scale spatial-analytic framework for mapping and quantifying heritage-district patterns, which can support cross-country comparison where similar designation lists exist. China provides a critical case due to rapid urbanization and large territorial heterogeneity, allowing us to observe how governance and development pressures are reflected in core–periphery and directional structures. The explicit reporting of methodological sensitivity and uncertainty further strengthens international reproducibility and comparability of heritage spatial analytics.
To address these gaps, we first assembled and systematized a nationwide dataset of 1212 historic and cultural districts from the National Cultural Heritage Administration (NCHA), where records are dispersed across multiple releases and formats, and supplemented these with historical sources. The general goal of this study is to compile a consolidated nationwide dataset of China’s officially designated historic and cultural districts and to map and quantify their spatial distribution patterns, while exploring the contextual factors associated with these patterns. Building on this consolidated dataset, this study applies Global Moran’s I, kernel density estimation (KDE), and the standard deviation ellipse (SDE) to examine spatial distribution and its determinants. The objectives are to: (1) provide a systematic census of historic and cultural districts in China; (2) analyze their spatial distribution patterns; and (3) explore the factors shaping these patterns. The findings aim to offer new perspectives for the protection and development of such districts and to inform related studies in other countries or regions.
This paper is organized as follows. Section 2 introduces the study area and describes data sources and processing. Section 3 presents the research methods, including Global Moran’s I, kernel density analysis, and the standard deviation ellipse. Section 4 reports and discusses the results on the number of historic and cultural districts, their spatial distribution characteristics (patterns, direction, and centroid), and the contextual factors associated with pattern formation (natural and historical–cultural). Section 5 concludes with key findings, policy implications, and limitations with directions for future research.
2. Study Area and Data
2.1. Study Area
China is in Southeast Asia, along the western coast of the Pacific Ocean, spanning from 73°40′ E to 135°05′ E and from 53°30′ N to 4° N (Figure 1). The country’s total land area is approximately 9.6 million square kilometers (Figure 1). Figure 1 presents the study area map of China, showing provincial boundaries, major river systems, and administrative centers over a DEM-based relief background; the color gradient represents elevation and thus visually differentiates major landform types, broadly indicating high-elevation mountains and plateaus, mid-elevation hills and basins/valleys, and low-elevation plains and lowlands. China’s terrain is highly diverse—mountains, plateaus, basins, plains, and river valleys—with a general west-to-east decline and a commonly recognized three-step topographic structure [30]. The climate types across China are equally varied, including subtropical, temperate, plateau, mountain, and tropical rainforest zones. As of 2022, China had a Gross Domestic Product (GDP) of 17.88 trillion USD and a population of approximately 1.41 billion people (World Bank, 2023) [31]. China is one of the world’s four ancient civilizations, with a history spanning over 4000 years and a rich cultural heritage accumulated through dynasties such as the Shang, Zhou, Qin, Han, Tang, Song, Yuan, Ming, and Qing [32]. This heritage encompasses various domains, including architecture, art, literature, philosophy, and science and technology. The dominant cultural influences in China include Confucianism, Daoism, Buddhism, literary arts, and traditional medicine, among others [33]. These cultural elements have developed and evolved over different historical periods, contributing to the formation of unique thematic cultures. Historic and cultural districts in China are distributed across all provinces, preserving ancient architecture, traditional crafts, and local culinary culture. These districts serve as important sites for the display and transmission of local historical and cultural heritage. Therefore, studying the national-scale spatial distribution of China’s historic and cultural districts and the contextual factors associated with it is both academically and practically significant.
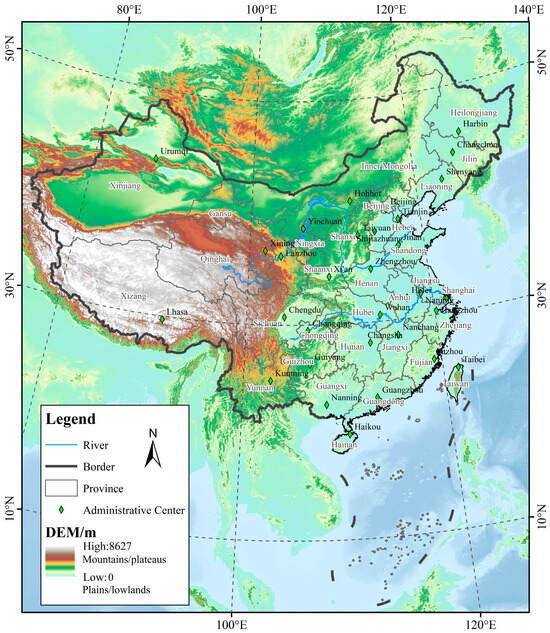
Figure 1.
Overview of the Study Area.
2.2. Data Sources and Processing
In 2015, the Ministry of Housing and Urban-Rural Development and the National Cultural Heritage Administration announced the first list of 30 historic and cultural districts in China. Since then, additional lists have been released by relevant authorities, and by 2023, over 1200 historic and cultural districts had been officially recognized. This study obtained a total of 1212 officially recognized historic and cultural districts (as of 2023) from authoritative sources, including the NCHA and provincial government websites, and cross-checked entries to ensure consistency. Accordingly, the primary data used in this study consist of (i) the official designation list of historic and cultural districts and (ii) the geocoded point locations for each district, supplemented by national-scale spatial layers (DEM and river networks) for contextual overlay analyses. It should be noted that the dataset represents officially designated historic and cultural districts rather than an exhaustive census of all historically significant urban areas. In China, designation is typically implemented through a multi-level process involving local nomination, documentation, and compliance with planning/management requirements, followed by recognition through staged official releases. Accordingly, the observed distribution may reflect not only heritage endowments but also differences in governance capacity and nomination incentives, implying potential selection bias; therefore, results are interpreted as describing the spatial patterns of designated districts.
The geographic coordinates (latitude and longitude) of each district were collected using the Baidu Maps API coordinate picker (BD-09). To ensure coordinate consistency for national-scale analysis, all records were batch-transformed using the Xingchen Coordinate Batch Conversion Software (V2.0) following a standardized conversion workflow (BD-09 → WGS84). The converted coordinates were then imported into ArcGIS 10.8 as a geographic coordinate dataset in WGS 1984 (WGS84) and projected to a China-wide projected coordinate system, Asia North Albers Equal Area Conic, to support national-scale mapping and spatial statistics. Spatial analyses were conducted in ArcGIS, including Global Moran’s I, Kernel Density Estimation (KDE), and Standard Deviational Ellipse (SDE), to characterize spatial clustering, density cores, and overall directional trends of historic and cultural districts across China.
For the analysis of spatial distribution and influencing factors, the study categorizes the districts into five historical periods: the Han-Tang period (including the Spring and Autumn Period, Warring States, Qin, Han, Three Kingdoms, Jin, Northern and Southern Dynasties, Sui, and Tang Dynasties), the Song period (including the Northern and Southern Song, Liao, Jin, Western Xia, and Dali), the Yuan-Ming period, the Qing period, and the modern era. Of the 1212 historically documented districts, 146 date back to before the Han-Tang period, 379 to the Song period, 285 to the Yuan-Ming period, 292 to the Qing period, and 110 to the modern era. Regarding the influencing factors, this study references a variety of sources, including brief histories of certain dynasties, historical records of population migration, economic development histories, and research findings from other scholars.
3. Research Methods
To address the above research gaps and ensure a transparent and reproducible analytical process, this study develops an integrated workflow that links data compilation, spatial-pattern measurement, and contextual interpretation. Figure 2 presents the overall analytical workflow of this study. It begins with a synthesis of the literature review and identified research gaps, followed by the compilation and processing of a consolidated nationwide dataset of historic and cultural districts (including geocoding, coordinate verification, and projection). The framework then applies a set of GIS-based spatial statistical methods—spatial distribution mapping, Global Moran’s I, kernel density estimation (KDE), and the standard deviational ellipse (SDE)—using ArcGIS software (version 10.8; Environmental Systems Research Institute (Esri) Inc., Redlands, CA, USA) to quantify national-scale spatial patterns. Finally, the observed patterns are interpreted through contextual association analyses using DEM and river-proximity overlays, leading to conclusions, policy implications, and directions for future research.
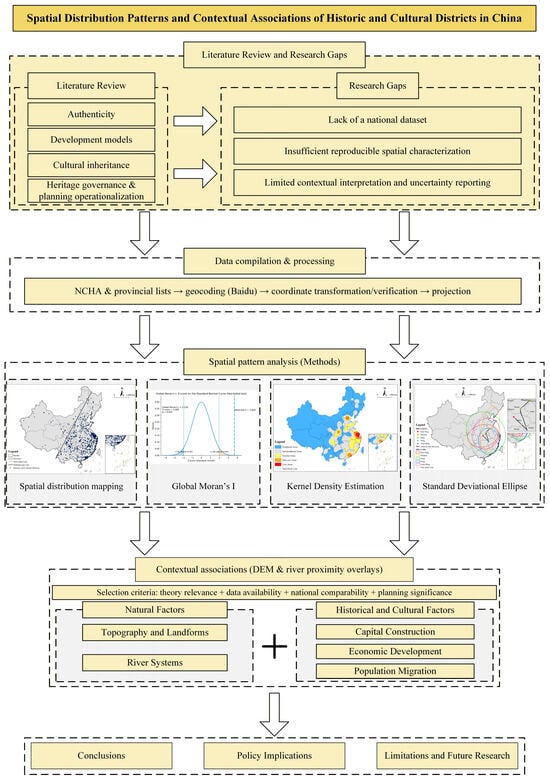
Figure 2.
Methodological framework and analytical workflow of the study.
3.1. Global Moran’s I
In this study, Global Moran’s I is utilized to assess the spatial distribution pattern of historic and cultural districts in China [34]. Global Moran’s I is a statistical measure used to detect spatial autocorrelation, indicating whether the attributes of a specific area exhibit a clustered distribution pattern in space. The formula is as follows:
where represents the Global Moran’s I index, with a value range of [−1, 1]. is the total number of spatial units, , is the spatial weight, for which this study adopts the adjacency weight method. and represent the attribute values of spatial units i and j, respectively, and is the mean of all spatial unit attribute values.
In this study, Global Moran’s I was implemented in ArcGIS 10.8 using an inverse-distance conceptualization of spatial relationships (INVERSE_DISTANCE), Euclidean distance (EUCLIDEAN_DISTANCE), and no standardization (NONE). No threshold distance band or external weights matrix file was specified.
3.2. Kernel Density Analysis
Kernel Density Analysis is employed in this study to identify the dense areas of historic and cultural districts in China, reflecting their specific clustering patterns. Kernel Density Analysis is a method used to estimate the density distribution of spatial data points [35]. The formula is as follows:
Kernel density estimation (KDE) was performed in ArcGIS 10.8 using an output cell size of 1000 m and a search radius of 200 km (projected units). To assess bandwidth sensitivity, we tested alternative search radii of 150 km, 200 km, and 250 km; the main density cores and overall spatial pattern were broadly stable across specifications, and 200 km was selected as the final setting to balance pattern stability and interpretability at the national scale. For map visualization, the KDE surface was classified into five classes using Natural Breaks (Jenks). All analyses were conducted under the China Albers Equal Area Conic projected coordinate system (meters).
3.3. Standard Deviation Ellipse
The Standard Deviation Ellipse (SDE) method is used to quantitatively analyze the directional characteristics and extent of dispersion in the distribution of historic and cultural districts in China [36]. This method is widely used in spatial analysis. The key parameters of SDE include the center, area, and the lengths of the major and minor axes of the ellipse. The center of the ellipse represents the centroid of the spatial distribution of historic and cultural districts in China. The major axis describes the distribution direction, expressed as the azimuthal angle relative to true north, while the minor axis measures the degree of dispersion of the historic districts. The eccentricity, or the ratio of the lengths of the major and minor axes, evaluates the directional tendency of the distribution. The steps involved are as follows:
- (1)
- Center of the Ellipse
- (2)
- Orientation of the Ellipse
In Formulas (5)–(8), θ represents the azimuthal angle of the ellipse, i.e., the angle from the true north to the major axis in a clockwise direction. and are the differences between the coordinates of each study object and the mean center.
- (3)
- Standard Deviation Distances for the Ellipse Axes
In Formulas (9) and (10), and represent the lengths of the X and Y axes, respectively, and n indicates the total number of historic and cultural districts.
The standard deviational ellipse was generated in ArcGIS 10.8 and reported at the 1-standard-deviation (1 SD) level for the full dataset and for each historical period to summarize directional trend and dispersion. Calculations were based on projected coordinates in China Albers Equal Area Conic (meters).
3.4. Qualitative Synthesis of Historical–Cultural Factors
Historical–cultural factors (capital construction, economic development, and population migration) were derived through a structured qualitative synthesis of secondary sources. We compiled evidence from peer-reviewed studies and authoritative historical references that document (i) major political centers and state-building processes, (ii) long-term economic cores and trade development, and (iii) demographic change and migration dynamics in different historical periods (e.g., [37,38,39,40,41]). Information relevant to the five historical periods defined in this study was extracted and organized into period-specific summaries and spatial cues (e.g., locations of major political centers, economic hubs, and migration-related contexts). These qualitative summaries were then used as contextual lenses to interpret the spatial-statistical outputs (KDE cores and SDE centroid migration/orientation), rather than as direct causal determinants.
4. Results and Discussion
4.1. National Inventory (Systematic Census) of Historic and Cultural Districts in China
A systematic national inventory based on the compiled dataset (n = 1212) reveals substantial provincial heterogeneity in the distribution of historic and cultural districts. Provinces along the eastern and southeastern seaboard account for a large share of designated districts, with Jiangsu (n = 128, 10.56%), Guangdong (n = 114, 9.41%), and Zhejiang (n = 107, 8.83%) ranking among the highest. By contrast, several inland and frontier regions contribute only a small proportion of the national total, underscoring a pronounced large-scale spatial imbalance.
To interpret this national-scale differentiation, we further use the Hu Line (Heihe–Tengchong Line), proposed in 1935 by Chinese geographer Hu Huanyong as a demographic dividing line in China [40]. It separates the country into two distinct parts: the southeast, which covers 36% of the land area and is home to 96% of the population, and the northwest, which contains only 4% of the population. Given its long-standing relevance for describing China’s population and settlement geography, this study uses the Hu Line as a reference to interpret the large-scale spatial differentiation of historic and cultural districts. As shown in Figure 3, the overall distribution of historic and cultural districts roughly aligns with the Hu Line, with a much higher concentration in the southeast than in the northwest. Specifically, the southeast region hosts 1120 districts, accounting for 93.9% of the total, while the northwest region contains only 73 districts, representing 6.1%. This pattern indicates a strong spatial correspondence between the distribution of historic and cultural districts and the demographic contrast represented by the Hu Line.
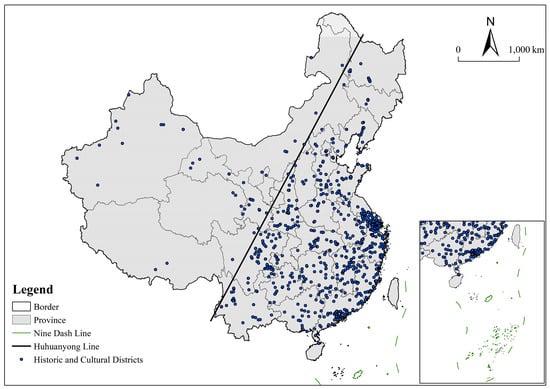
Figure 3.
Spatial distribution of historical and cultural districts in China.
4.2. Spatial Distribution Characteristics of Historic and Cultural Districts in China
4.2.1. Spatial Distribution Patterns
Using ArcGIS 10.8, the Global Moran’s I index for the spatial distribution of historic and cultural districts in China was calculated. The results yielded a Moran’s I value of 0.150, a Z-score of 3.669, and a p-value of 0.000, indicating statistical significance at the 0.01 level. This suggests that, at the provincial scale, the distribution of historic and cultural districts exhibits positive spatial autocorrelation—provinces with a higher (or lower) number of districts tend to cluster spatially.
Further analysis of the spatial distribution structure across provinces (Figure 4) allows us to categorize the spatial distribution of historic and cultural districts into core areas, sub-core areas, general areas, sub-peripheral areas, and peripheral areas. The core areas are primarily concentrated in the Yangtze River Delta. The sub-core areas are distributed around the periphery of the Yangtze River Delta, the Pearl River Delta, the Beijing-Tianjin-Hebei region, and the Guanzhong Plain. Regions including the middle reaches of the Yangtze River, the Chengdu-Chongqing area, and the northern part of the Central Plains represent a transition from general areas to sub-peripheral areas. The peripheral areas are mainly located in the Northwest and Northeast, encompassing most parts of Inner Mongolia, Ningxia, Qinghai, Tibet, Xinjiang, Gansu, Sichuan, Yunnan, Heilongjiang, and Jilin.
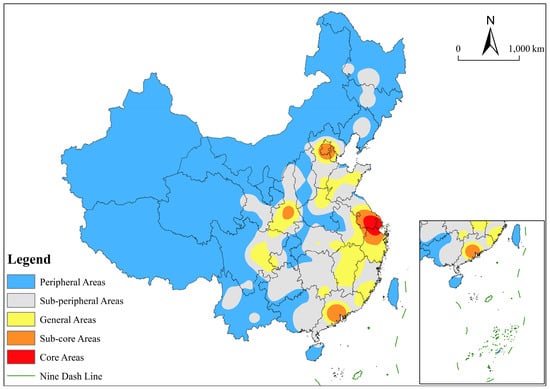
Figure 4.
Spatial distribution of kernel density of Chinese historical and cultural districts.
The Yangtze River Delta region, which includes Shanghai, Jiangsu, and Zhejiang, stands out as the core area for the distribution of historic and cultural districts in China. This concentration can be interpreted in relation to a combination of contextual conditions, including transportation networks, climate and land resources, long-term economic activity, trade connections, and cultural traditions. The Yangtze River Delta is located in the lower reaches of the Yangtze River, with abundant water resources and extensive water-transport corridors. The region is characterized by a subtropical monsoon climate, featuring warm and humid conditions, ample rainfall, and fertile soils, which have historically supported intensive agricultural production. Since the Tang and Song dynasties, the Yangtze River Delta has been widely documented as one of China’s major economic centers; cities such as Hangzhou and Suzhou were flourishing commercial hubs during the Song dynasty [42]. During the Ming and Qing dynasties, with the expansion of maritime trade routes, ports such as Ningbo and Shanghai functioned as important gateways for foreign trade, coinciding with regional economic prosperity [4]. The region is also rich in cultural heritage, including the Wu–Yue cultural tradition and the dissemination of Confucianism; cultural assets such as classical gardens, academies, and ancient towns constitute key elements of the region’s cultural landscape [35].
The areas on the periphery of the Yangtze River Delta, along with the Pearl River Delta and the Beijing–Tianjin–Hebei region, can be regarded as secondary core areas. The concentration of historic and cultural districts in these regions can be discussed in relation to historical trajectories, economic development, cultural diversity, and geographic settings. Historically, these regions have long been important centers of economy, culture, and politics. In the process of modernization, these regions have experienced rapid development, and existing studies often note the role of geographic advantages and policy support in shaping conservation capacity and resource allocation for heritage preservation and restoration. Culturally, the diversity and inclusiveness of these regions are commonly associated with rich intangible cultural heritage that continues to be maintained and adapted within contemporary urban development. Geographically, these regions are predominantly alluvial plains with flat terrain, fertile land, and convenient transportation, providing a context in which dense settlement and commercial activity have been historically documented. Representative cultural districts are therefore frequently observed in these areas over time.
4.2.2. Spatial Distribution Direction and Centroid
The calculation results of the Standard Deviation Ellipse reveal that the area of the standard deviation ellipse for China’s historic and cultural districts is 254.03 km2, with the centroid located in Dawu County, Xiaogan City, Hubei Province. The overall distribution tends to be along an east–west axis and has undergone an evolution characterized by initial contraction followed by expansion, with significant differences across historical periods (Figure 5). The centroid migration exhibits a distinct “southeast–northwest–northeast” trajectory, with the migration area primarily concentrated in the four provinces of Hubei, Jiangxi, Henan, and Jiangsu. The directional changes in the ellipse tend to flatten over time.
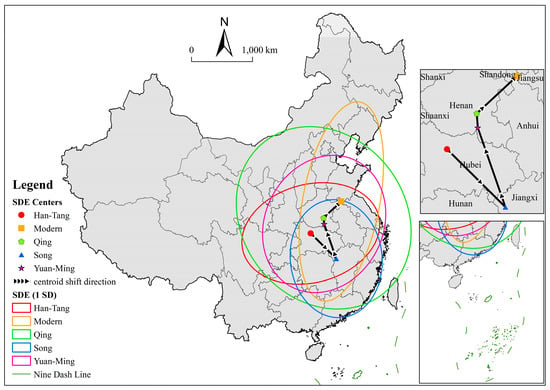
Figure 5.
Elliptic distribution of standard deviation of historical and cultural districts in China.
Specifically, during the Han-Tang period, the centroid of historic and cultural districts was located in Nanzhang County, Xiangyang City, Hubei Province, with an overall east–west distribution. In the Song dynasty, the centroid shifted southeast to Tonggu County, Yichun City, Jiangxi Province, and the distribution orientation changed to a north–south axis. Compared to the Han-Tang period, the area of the ellipse decreased by 22.74%. During the Yuan-Ming period, the centroid migrated northwest to Xinyang City, Henan Province, and the area expanded by 52.08% compared to the Song period, with a spatial distribution orientation along a northeast-southwest axis. In the Qing dynasty, the centroid further moved northwest to Queshan County, Zhumadian City, Henan Province, with the ellipse area expanding by 108.54% compared to the Yuan-Ming period, and the distribution orientation shifted to a northwest-southeast axis. In the modern era, the centroid moved northeast to Xuzhou City, Jiangsu Province, with the spatial distribution orientation returning to a northeast-southwest axis, and the ellipse area decreased by 52.06%.
During the Han–Tang period, China’s political and economic centers were primarily located in the Central Plains, particularly around Chang’an (modern-day Xi’an) and Luoyang. Against this background, the subsequent centroid shift to the southeast in the Song period can be interpreted in relation to widely discussed southward changes in economic gravity and the relocation of the political center to Lin’an (modern-day Hangzhou) during the Southern Song. The contraction of the ellipse relative to the Han–Tang period (−22.74%) may also be discussed in the context of documented warfare and urban decline in parts of northern China during the late Northern Song and Southern Song period [43]
In the Yuan–Ming period, the establishment of capitals in Dadu (modern-day Beijing) and Nanjing coincided with a northwestward shift in the centroid and an expansion of the ellipse (+52.08% compared to the Song period). The observed changes in directional structure (e.g., the northeast–southwest orientation) can be contextualized alongside historical processes of state consolidation and regional integration. For example, governance arrangements and frontier management policies during the Yuan and Ming dynasties (e.g., the Tusi system, the Weiso system, and the Gaitu Guiliu policy) are frequently discussed in relation to strengthening territorial control and administrative reach [44]. During the Qing dynasty, with the capital remaining in Beijing, historical accounts emphasize further consolidation of frontier governance and territorial integration, which provides a broader context for the continued expansion of the distribution area (+108.54% compared to the Yuan–Ming period) and the associated directional adjustments [45].
In the modern era, the centroid migrated northeastward and the ellipse area decreased substantially (−52.06%). This shift can be interpreted in relation to the widely documented acceleration of industrialization and capitalist development in the eastern coastal regions and parts of Northeast China [46], which coincided with intensified urban growth and heritage-related designation and conservation activities in these regions.
4.3. Contextual Factors Related to the Spatial Pattern Formation of Historic and Cultural Districts in China
This section provides an exploratory, descriptive interpretation of the observed spatial patterns by examining their contextual associations with natural and historical–cultural conditions. Because the analyses are based on spatial overlays and descriptive statistics rather than explanatory causal modeling, we avoid causal language and interpret the findings as associations. We selected these factors because they represent core natural constraints and historical–cultural processes repeatedly highlighted in the literature on Chinese settlement evolution and heritage formation, and they can be examined at the national scale with available data. Accordingly, we consider topography/landforms and river systems (DEM and river-proximity overlays) together with capital construction, economic development, and population migration (historical records) as contextual lenses for interpreting the observed spatial patterns.
4.3.1. Natural Factors
- (1)
- Topography and Landforms
This study used ArcGIS 10.8 to overlay the point locations of historic and cultural districts with a digital elevation model (DEM), in order to characterize their topographic context (elevation-based distribution) across China (Figure 6). Based on the elevation standards jointly set by the International Organization for Standardization (ISO) and the International Civil Aviation Organization (ICAO), and according to the study’s needs, the historic and cultural districts were categorized into three elevation zones: below 200 m, 200–500 m, and above 500 m.
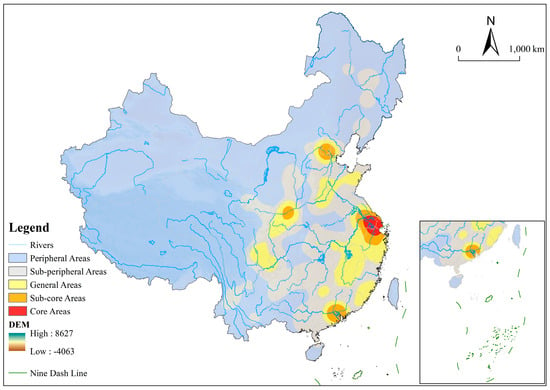
Figure 6.
Geographical spatial distribution and hydrological characteristics of Chinese historical and cultural districts.
The results indicate that 70.38% of historic and cultural districts are located in plains (below 200 m, 853 districts), 16.99% in hilly areas (200–500 m, 206 districts), and 12.63% in mountainous regions (above 500 m, 153 districts) (Table 1). The majority of historic and cultural districts are concentrated in plains. Plains are widely recognized as areas with favorable geographic conditions for human habitation and development, and ancient cities were commonly established in these settings, where historic and cultural districts are now frequently observed. These regions are also typically characterized by relatively mild climatic conditions and long-standing commercial activity, which form an important contextual background for interpreting the current spatial pattern. In addition, contemporary urban development and heritage designation practices are more commonly observed in low-altitude and highly accessible areas, which may help explain the continued concentration of historic and cultural districts in plains.

Table 1.
Elevation- and landform-based distribution of historic and cultural districts in China.
- (2)
- River Systems
China’s major river systems, from north to south, include the Songhua River, Liao River, Hai River, Yellow River, Huai River, Yangtze River, and Pearl River basins [47]. River systems were included in this study because major rivers and their tributaries have historically structured settlement corridors, transport and trade connectivity, agricultural productivity, and the location of early cities in China; therefore, proximity to rivers provides a relevant natural-context lens for interpreting the observed spatial pattern of designated historic and cultural districts. Using ArcGIS 10.8, this study mapped the distribution of these rivers and employed buffer analysis to explore the spatial relationship between historic and cultural districts and river systems, thereby quantifying the proximity of these districts to water bodies more accurately. As shown in Table 2, a significant proportion of historic and cultural districts are clustered within 5000 m of a river, with 73.02% of these districts located within this range, and only 26.92% situated beyond 5000 m from a river. This highlights the critical role that rivers have played in the development and evolution of historic and cultural districts.
Table 2.
Distance of Historic and Cultural Districts from Rivers in China.
The distribution and development of historic and cultural districts are closely linked to rivers, reflecting economic, social, and cultural connections. Economically, rivers have often been key drivers of regional development [48]. In ancient times, rivers provided more convenient transportation routes compared to overland routes, facilitating the flow of goods, people, and cultural exchange. This ease of transportation supported the prosperity of commerce and trade, ultimately laying the economic foundation for the development of historic and cultural districts and ensuring robust transport links. Additionally, the fertile lands along rivers were conducive to agricultural production, supporting the formation and growth of settlements, and providing a population base essential for the establishment of historic and cultural districts.
- (3)
- Integrated overlay summary
To provide an integrated, zone-based summary of natural-context associations, we further overlaid the KDE-derived spatial zones (core, sub-core, general, sub-peripheral, and peripheral) with the DEM and the distance-to-river layer, and calculated mean elevation and mean distance to rivers for each zone (Table 3).
Table 3.
Mean elevation and distance to rivers by KDE zone.
As shown in Table 3, the overlay statistics indicate a clear natural-context gradient from peripheral to core areas. Peripheral and sub-peripheral zones are associated with higher elevations and greater distances to rivers, whereas sub-core and core zones coincide with low-elevation plains and markedly shorter river distances. This pattern is also visually supported by the integrated overlay map (Figure 6), which shows that KDE-derived core zones largely align with major river corridors and low-relief plains. The “general” zone displays a larger mean river distance, likely reflecting within-class heterogeneity and potential outlier influence. Importantly, these findings are interpreted as contextual associations based on descriptive overlays rather than causal determinants.
4.3.2. Historical and Cultural Factors
- (1)
- Capital Construction
Consistent with the dynasty-specific centroid migration and directional shifts identified by the SDE analysis (Section 4.2.2), the following synthesis summarizes how changes in political centers may provide historical context for interpreting the observed spatial pattern. Capital construction is included as a historical–cultural contextual factor because the establishment and relocation of major political centers historically concentrated administrative resources, population, and cultural production, thereby shaping long-term urban development trajectories. In this study, it is not treated as a causal determinant, but as a contextual lens to interpret the period-based spatial-statistical results (KDE cores and SDE centroid migration/orientation).
Changes in dynasties and shifts in political centers across Chinese history provide an important historical context for interpreting the spatial distribution of historic and cultural districts. During the Qin Dynasty, following the unification of China under Qin Shi Huang, the capital was established in Xianyang, and the construction of a nationwide road network greatly enhanced territorial connectivity. Within this historical context, the spatial pattern of early urban development and subsequent historic districts can be interpreted in relation to these institutional and infrastructural arrangements [49].
In the Han–Tang period, Chang’an adopted the “li-fang” system, characterized by a planned urban layout that clearly distinguished residential, commercial, and artisanal spaces. This spatial structure represents an important morphological reference in Chinese urban history, within which many characteristics of later historic districts can be understood [16].
During the Song Dynasty, commercial activities became increasingly prominent, and the strict spatial separation between residential and market areas gradually weakened. Historical records describe flourishing night and morning markets in the capital city of Bianjing (modern-day Kaifeng), with commercial activities distributed throughout the city. Such urban phenomena reflect a more open and mixed spatial structure, which provides a useful historical background for understanding the diversity of district forms observed in later periods [29].
In the Yuan Dynasty, the capital was established in Dadu (modern-day Beijing), and the expansion of the empire coincided with intensified ethnic interaction. Historical accounts indicate increasing cultural exchange during this period, and architectural forms in urban areas exhibit diverse stylistic elements, which are commonly reflected in the cultural characteristics of historic districts [37].
During the early Ming Dynasty, the capital shifted from Nanjing to Beijing, and large-scale urban construction activities were documented, particularly in the construction of city walls. The layout of Nanjing’s city wall and surrounding districts has been widely discussed as an expression of political, military, and cultural considerations of the time, providing important historical references for interpreting the spatial organization of historic urban areas. The maritime prohibition policy in the Ming Dynasty was also closely associated with functional changes in some coastal cities, as documented in existing historical studies [7].
In the Qing Dynasty, with Beijing remaining the political center, the integration of Manchu and Han cultural traditions became evident in urban spaces. For example, hutongs and siheyuan in Beijing retained traditional Han architectural forms while incorporating Manchu cultural elements, a combination that is widely recognized as a distinctive characteristic of the city’s historic districts [50]. These historical references are used to contextualize the SDE-based centroid trajectory and ellipse-orientation changes across periods, rather than to claim a direct causal relationship.
- (2)
- Economic Development
To interpret the KDE-identified core areas and period differences, we summarize key economic contexts documented in the literature that coincide with long-term urban prosperity in the major concentration regions. Economic development across Chinese history provides an important historical context for interpreting the emergence and characteristics of historic and cultural districts. Periods of sustained agricultural productivity, craft specialization, commercial activity, and urban expansion are frequently discussed in the literature as broader conditions under which distinctive urban spaces and district forms were documented and later preserved as heritage landscapes.
During the Qin and Han periods, historical accounts describe economic policies such as land privatization and currency unification, alongside the diffusion of iron tools, new farming techniques, and water conservancy projects (e.g., the “Jingqu Law”), which are commonly associated with improvements in agricultural production and irrigation conditions. Contemporary descriptions also note the rapid development of handicrafts, particularly iron smelting and silk weaving, and such developments coincided with increasingly differentiated urban functions and spatial organization [32]. In the Tang Dynasty, agricultural and handicraft industries continued to expand, and the Jiangnan region’s land development and rice production, together with advances in silk weaving and ceramics, were accompanied by intensified commercial activities and the growth of urban space. The East and West Markets in Chang’an (the Tang capital) functioned as major commercial nodes and reflected the social and cultural characteristics of the time, providing historical references for understanding the district-like urban spaces discussed in existing studies [28].
During the Song–Yuan period, the spread of advanced agricultural practices (e.g., double-cropping rice and wheat), increased cultivation of cash crops, and achievements in porcelain production corresponded with a broader picture of commercial prosperity. The emergence of paper currency (“Jiaozi”) and the expansion of overseas trade—often illustrated by the historical prominence of Quanzhou as a major port—are widely interpreted as part of the economic and cultural context in which commercial areas developed distinctive architectural forms and commercial cultures. These characteristics are frequently highlighted as components of later-recognized historic and cultural districts, as exemplified by the markets of Kaifeng and Hangzhou [43].
In the Ming–Qing period, historical narratives emphasize the diffusion of high-yield crops (e.g., double-cropping rice, corn, and sweet potatoes), the expansion of private handicrafts, and advances in porcelain craftsmanship (such as blue-and-white and polychrome porcelains), alongside long-distance trade and the activities of merchant guilds. Urban prosperity extended to small and medium-sized cities and towns [38]. Guild halls, shops, and residential areas established by merchant guilds are documented as important elements of urban space with distinctive regional cultural features, and such built environments provide a historical basis for interpreting the preservation of valuable urban layouts, streets, and buildings that are now represented within historic and cultural districts. This synthesis is presented as contextual evidence to support interpretation of the KDE cores and regional concentrations, not as statistical proof of causation.
- (3)
- Population Migration
We compiled major, well-documented migration episodes and their dominant directions to provide context for the observed centroid shifts and regional pattern changes across periods. Several well-documented population migrations in Chinese history provide an important historical context for interpreting the spatial evolution of historic and cultural districts, with major movements frequently described as oriented toward the south, the northeast, and the southwest (Figure 7). The Yongjia Rebellion (307–317 AD) in the late Western Jin Dynasty, associated with the War of the Eight Princes and northern incursions, was followed by large-scale southward migration of northern aristocrats and commoners. Historical accounts report that approximately one million people moved into the Jiangnan region, and existing studies discuss this demographic shift in relation to regional economic and cultural changes that are often considered relevant to later heritage landscapes in the area [51]. The An Lushan Rebellion (755–763 AD) in the mid-Tang Dynasty was also accompanied by substantial southward migration, with estimates of around one million migrants. During this period, the population distribution between north and south became more balanced, and migration flows were concentrated in Hubei, Hunan, the Taihu Basin, and along the Han River—regions that subsequently feature prominently in historical narratives of socio-economic and cultural development [41].
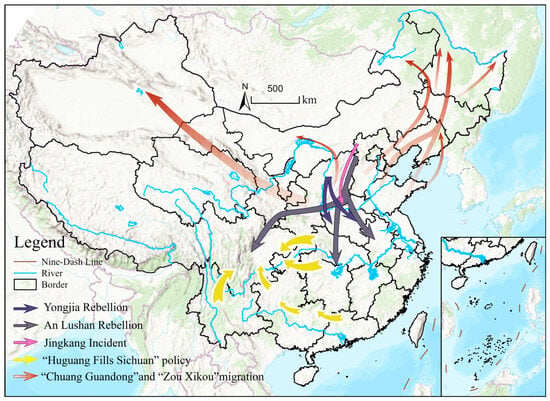
Figure 7.
Map of several important historical population migrations in China.
The Jingkang Incident (1126–1127 AD), marking the fall of the Northern Song Dynasty, was followed by the southward relocation of the Song court and large-scale population movement, with historical estimates of about five million migrants mainly to Zhejiang, Jiangsu, Hubei, and Sichuan. Southern Jiangsu and Zhejiang, in particular, are frequently described as emerging cultural centers in subsequent periods, and such historical trajectories provide a useful background for interpreting the concentration of historic and cultural districts in the south [41]. In the Qing Dynasty, the policy known as “Huguang Fills Sichuan” (initiated in 1654) encouraged migration from Huguang (modern Hunan and Hubei) to Sichuan; existing records suggest that roughly six million people responded. Studies commonly discuss this migration in relation to population recovery and socio-economic reconstruction in Sichuan, offering contextual explanations for later cultural landscapes in the region [39].
In the mid-19th to early 20th centuries, “Chuang Guandong” involved residents from Shandong, Hebei, and Henan moving to northeast China. The movement is often discussed in connection with push factors such as disasters in the lower Yellow River region and pull factors such as fertile land and resources in the northeast, alongside broader regional development processes [52]. Similarly, the “Zou Xikou” migration—beginning in the late Ming and early Qing dynasties and peaking during the late Qing and early Republican periods—involved movement from Shanxi, Shaanxi, and other provinces to Inner Mongolia, Ningxia, and other northwestern areas. Historical narratives frequently link this migration to the expansion of livestock production, trade, and frontier commerce, which provide an interpretive background for the cultural exchange documented in these regions [53].
Overall, these migration episodes corresponded with notable demographic restructuring and the relocation of skilled artisans and other groups. Rather than implying direct causality, the evidence summarized here indicates that population mobility formed part of broader historical processes—together with institutional change, economic activity, and urban development—that can help interpret the regional differentiation and long-term evolution of historic and cultural districts. These migration contexts are discussed alongside the SDE/KDE outputs to interpret regional differentiation in the mapped patterns.
5. Conclusions and Implications
5.1. Conclusions
5.1.1. Current Spatial Distribution Patterns
Overall, the designated historic and cultural districts in China exhibit a clear macro-scale spatial differentiation, with a strong concentration in the southeast side of the Hu Line. At the national scale, the pattern can be summarized as a multi-core structure, with the most prominent concentration in the Yangtze River Delta and additional secondary concentrations in the Pearl River Delta and the Beijing–Tianjin–Hebei region.
5.1.2. Evolution of Spatial Distribution Patterns
The period-based SDE analysis indicates a consistent directional structure at the national scale and a distinct trajectory of centroid migration across historical periods. The centroid shift follows a “southeast–northwest–northeast” pathway, suggesting that the spatial focus of designated districts has changed over time in ways that correspond to broader historical regional dynamics. These results provide a compact, comparable description of how the distribution pattern evolved at the national scale.
5.1.3. Contextual Associations
The observed spatial patterns can be interpreted in relation to both natural constraints and historical–cultural contexts. Districts are more frequently located in low-elevation plains and tend to occur closer to major river corridors, consistent with long-term settlement suitability and accessibility. Historical–cultural contexts—including shifts in political centers, long-term economic cores, and major population movements—provide complementary lenses for interpreting the regional differentiation and temporal evolution of the spatial pattern. These associations are discussed as contextual interpretations rather than as causal determinants.
5.2. Policy Implications
5.2.1. Recognizing Historic and Cultural Districts as Spatially Clustered Land Units
Historic and cultural districts should be understood not only as isolated heritage sites, but as spatially clustered land units embedded within broader territorial systems. From a land and spatial planning perspective, conservation should move from site-based protection toward overlay-based zoning that can be directly embedded into statutory plans. Specifically, KDE-derived core areas can be translated into heritage cluster overlay zones with clear management objectives (e.g., core protection, buffer, and compatible development sub-zones). In these overlay zones, coordinated land-use controls—such as limits on redevelopment intensity, height and form regulations, and protection of key view corridors—should be implemented to manage cumulative development pressure. In addition, Heritage Impact Assessment (HIA) triggers can be established: major construction, infrastructure expansion, or land-use conversion projects within core and buffer overlays should be required to submit HIA documentation before approval, ensuring that planning decisions address cluster-level integrity rather than treating districts in isolation.
5.2.2. Integrating Natural Geographic Constraints into Long-Term Land-Use Planning
Planning in heritage-dense areas should integrate topographic and river-corridor constraints into long-term land-use planning through risk-management overlay zones. The concentration of districts along major river corridors indicates that rivers have historically structured settlement and cultural development, and therefore must be incorporated into contemporary planning controls. In operational terms, planning interventions in areas with dense historic districts should adopt river-corridor risk management overlays, integrating heritage protection with flood mitigation and ecological safeguards. For example, river-adjacent clusters can be assigned development setback requirements, restrictions on shoreline hardening, and conservation of riparian buffers to reduce exposure to flooding and land degradation. Where redevelopment is unavoidable, risk-sensitive development controls (e.g., ground-floor elevation requirements, drainage capacity upgrades, and restrictions on high-risk land uses) should be introduced as part of local development regulations. Aligning heritage conservation with river-basin management can improve long-term sustainability and reduce hazard-driven heritage loss.
5.2.3. Advancing Regionally Differentiated Land-Based Conservation Strategies
Planning strategies should be regionally differentiated by adopting stricter heritage-cluster controls in core areas and preventive, low-intensity protection measures in peripheral areas. This pattern indicates that uniform planning solutions are unlikely to be effective. Instead, spatial analysis results should guide differentiated planning solutions for central core areas and outer districts. In core regions with high heritage concentration and intensive urbanization, stricter redevelopment controls and zoning overlays are needed, including tighter limits on construction intensity, mandatory HIA triggers for key projects, and active management of land-use conflicts within heritage cluster zones. In contrast, in peripheral regions where districts are fewer but historical environments remain relatively intact, policy priorities should emphasize preventive protection: controlling new land conversion, avoiding large-scale infrastructure fragmentation, and using low-intensity, landscape-compatible development guidelines. Such regionally differentiated strategies allow planning tools to match local heritage density and development pressure, thereby improving the effectiveness of land-based conservation.
5.3. Limitations and Future Research
Despite the contributions of this study, several limitations should be acknowledged. First, spatial uncertainty may exist due to the geocoding process and the use of point-based representations for historic and cultural districts, which may not fully capture their actual spatial extent. In addition, although all spatial analyses were conducted under a projected coordinate system, minor positional deviations and scale effects may still influence the accuracy of distance and density measurements. Second, the designation of historic and cultural districts is subject to administrative selection and policy priorities, which may introduce designation bias and affect the completeness and representativeness of the dataset. Moreover, the use of provincial-level aggregation may obscure finer-scale spatial heterogeneity.
Future research could further improve this framework in two directions. On the one hand, explanatory spatial modeling techniques (e.g., spatial regression or geographically weighted models) could be applied to quantitatively test the determinants of spatial distribution patterns. On the other hand, temporal designation analysis based on multi-period datasets would allow for a more dynamic understanding of how historic and cultural districts emerge, evolve, and decline over time. Such efforts would help strengthen the causal interpretation and deepen the policy relevance of spatial heritage studies.
Author Contributions
Conceptualization, H.Z. and X.L.; Methodology, H.Z., X.L. and X.Z.; Software, H.Z. and X.L.; Validation, H.Z., X.L. and X.Z.; Formal analysis, H.Z., X.L. and X.Z.; Investigation, H.Z. and X.L.; Resources, H.Z. and X.L.; Data curation, H.Z. and X.L.; Writing—original draft, H.Z. and X.L.; Writing—review & editing, H.Z., X.L. and X.Z.; Visualization, H.Z., X.L. and X.Z.; Supervision, H.Z. and X.L.; Project administration, X.L.; Funding acquisition, X.L. All authors have read and agreed to the published version of the manuscript.
Funding
This research was funded by the National Social Science Foundation of China, grant number 22BJY156.
Data Availability Statement
The data presented in this study are available on request from the corresponding author. The data are not publicly available due to the extensive manual processing required for dataset consolidation and institutional intellectual property policies.
Conflicts of Interest
The authors declare no conflict of interest.
References
- García-Hernández, M.; De la Calle-Vaquero, M.; Yubero, C. Cultural Heritage and Urban Tourism: Historic City Centres under Pressure. Sustainability 2017, 9, 1346. [Google Scholar] [CrossRef]
- Zhao, Y.; Liu, J.; Zheng, Y. Preservation and Renewal: A Study on Visual Evaluation of Urban Historical and Cultural Street Landscape in Quanzhou. Sustainability 2022, 14, 8775. [Google Scholar] [CrossRef]
- UNESCO Recommendation on the Historic Urban Landscape. Available online: https://whc.unesco.org/en/hul/ (accessed on 29 December 2025).
- Fan, J.; Maliki, N.Z.; Abidin, N.A.Z. Spatial Patterns of Historical and Cultural Blocks Based on Multisource Data and Protection and Development Strategies within the Context of Urban Renewal: A Case Study of Xi’an, China. Landsc. Res. 2024, 50, 4–22. [Google Scholar] [CrossRef]
- Jiao, L.; Wu, Y.; Fang, K.; Liu, X. Typo-Morphological Approaches for Maintaining the Sustainability of Local Traditional Culture: A Case Study of the Damazhan and Xiaomazhan Historical Area in Guangzhou. Buildings 2023, 13, 2351. [Google Scholar] [CrossRef]
- Chen, S.; Meng, B.; Liu, N.; Qi, Z.; Liu, J.; Wang, J. Cultural Perception of the Historical and Cultural Blocks of Beijing Based on Weibo Photos. Land 2022, 11, 495. [Google Scholar] [CrossRef]
- Bai, X.; Jiao, X.; Sakai, T.; Xu, H. Mapping the Past with Historical Geographic Information Systems: Layered Characteristics of the Historic Urban Landscape of Nanjing, China, Since the Ming Dynasty (1368–2024). Herit. Sci. 2024, 12, 283. [Google Scholar] [CrossRef]
- Gale, D.E. The Impacts of Historic District Designation Planning and Policy Implications. J. Am. Plan. Assoc. 1991, 57, 325–340. [Google Scholar] [CrossRef]
- National Park Service. National Register Bulletin 24: Guidelines for Local Surveys: A Basis for Preservation Planning; U.S. Department of the Interior, National Park Service, Interagency Resources Division: Washington, DC, USA, 1985.
- Zhang, F.; Liu, Q.; Zhou, X. Vitality Evaluation of Public Spaces in Historical and Cultural Blocks Based on Multi-Source Data, a Case Study of Suzhou Changmen. Sustainability 2022, 14, 14040. [Google Scholar] [CrossRef]
- Ding, W.; Wei, Q.; Jin, J.; Nie, J.; Zhang, F.; Zhou, X.; Ma, Y. Research on Public Space Micro-Renewal Strategy of Historical and Cultural Blocks in Sanhe Ancient Town under Perception Quantification. Sustainability 2023, 15, 2790. [Google Scholar] [CrossRef]
- Liang, F.; Pan, Y.; Gu, M.; Liu, Y.; Lei, L. Research on the Paths and Strategies of the Integrated Development of Culture and Tourism Industry in Urban Historical Blocks. Front. Public Health 2022, 10, 1016801. [Google Scholar] [CrossRef]
- Chen, F.; Romice, O. Preserving the Cultural Identity of Chinese Cities in Urban Design through a Typomorphological Approach. Urban Des. Int. 2009, 14, 36–54. [Google Scholar] [CrossRef]
- Kuo, S.-L.; Chen, C.-L. Operation Analysis of Cultural Heritage Service Ecosystems: Empirical Study Based on Dihua Street and Guansi Shihdianzih Old Street in Taiwan. Appl. Syst. Innov. 2022, 5, 42. [Google Scholar] [CrossRef]
- Zhou, J.; Zhou, Y.; Li, D. Exploring the Complex Mechanism of the Influence of a Multisensory Tourism Experience on Tourists’ Mental Restoration in the Research Context of Historical and Cultural Blocks. Curr. Issues Tour. 2024, 27, 2682–2702. [Google Scholar] [CrossRef]
- Chen, S.; Dong, Y.; Chen, X.; Xu, X.; Gong, J. Analysis of the Characteristics and Ideas of Ancient Urban Land-Use Based on GIS and an Algorithm: A Case Study of Chang’an City in the Sui and Tang Dynasties. Remote Sens. 2023, 15, 2962. [Google Scholar] [CrossRef]
- Mérai, D.; Veldpaus, L.; Pendlebury, J.; Kip, M. The Governance Context for Adaptive Heritage Reuse: A Review and Typology of Fifteen European Countries. Hist. Environ. Policy Pract. 2022, 13, 526–546. [Google Scholar] [CrossRef]
- Zhang, Y.; Han, Y. Vitality Evaluation of Historical and Cultural Districts Based on the Values Dimension: Districts in Beijing City, China. Herit. Sci. 2022, 10, 137. [Google Scholar] [CrossRef]
- Cheng, Z.; Zhou, S.; Zhang, B. The Spatial Factors of Cultural Identity: A Case Study of the Courtyards in a Historical Residential Area in Beijing. Sustainability 2018, 10, 2587. [Google Scholar] [CrossRef]
- Isa, M.M.; Ismail, N.A.; Rasam, A.R.A.; Teh, M.Z. Landscape Characterization Using GIS-Based Landscape Character Assessment in Hulu Langat District, Malaysia. Geogr.-Malays. J. Soc. Space 2023, 19, 17–33. [Google Scholar] [CrossRef]
- Fotheringham, A.S.; Wong, D.W.S. The Modifiable Areal Unit Problem in Multivariate Statistical Analysis. Environ. Plan. A 1991, 23, 1025–1044. [Google Scholar] [CrossRef]
- Wong, D.W. Modifiable Areal Unit Problem. Int. Encycl. Hum. Geogr. 2009, 7, 169–174. [Google Scholar] [CrossRef]
- Anselin, L. Spatial Econometrics: Methods and Models; Springer Science & Business Media: Dordrecht, The Netherlands, 1988; ISBN 978-90-247-3735-2. [Google Scholar]
- Cliff, A.D.; Ord, J.K. Spatial Processes: Models and Applications, 1st ed.; Pion Ltd.: London, UK, 1981; ISBN 978-0-85086-081-8. [Google Scholar]
- Wand, M.P.; Jones, M.C. Kernel Smoothing; Chapman and Hall/CRC: New York, NY, USA, 1994; ISBN 978-0-429-17059-1. [Google Scholar]
- Silverman, B.W. Density Estimation for Statistics and Data Analysis; Routledge: New York, NY, USA, 2018; ISBN 978-1-315-14091-9. [Google Scholar]
- Haining, R. Spatial Data Analysis: Theory and Practice; Cambridge University Press: Cambridge, UK, 2003; ISBN 978-0-521-77437-6. [Google Scholar]
- Guo, L.; Rong, X. Taking the High Ground: Construction of the Regional Spatial Order of Chang’an Area in Tang Dynasty. Plan. Perspect. 2020, 35, 115–141. [Google Scholar] [CrossRef]
- Zong, Y. “Share the Pleasures with the Public”: Evolution of Urban Landscapes in Nanjing in Song Dynasty China (976–1279). Cult. Soc. Hist. 2024, 21, 1–22. [Google Scholar] [CrossRef]
- The People’s Republic of China. The People’s Republic of China Fourth National Communication on Climate Change; Ministry of Ecology and Environment of the People’s Republic of China: Beijing, China, 2023.
- World Bank. World Development Indicators: GDP (Current US$) and Population, Total for China (2023). Available online: https://data.worldbank.org/ (accessed on 28 January 2026).
- Wright, A.F. The Study of Chinese Civilization. J. Hist. Ideas 1960, 21, 233–255. [Google Scholar] [CrossRef]
- Kuhn, D. The Age of Confucian Rule: The Song Transformation of China, 1st Harvard University Press Paperback ed.; History of Imperial China; Belknap Press of Harvard University Press: Cambridge, MA, USA; London, UK, 2011; ISBN 978-0-674-06202-3. [Google Scholar]
- Ezimand, K.; Aghighi, H.; Ashourloo, D.; Shakiba, A. The Analysis of the Spatio-Temporal Changes and Prediction of Built-up Lands and Urban Heat Islands Using Multi-Temporal Satellite Imagery. Sustain. Cities Soc. 2024, 103, 105231. [Google Scholar] [CrossRef]
- Wang, J.; Chen, M.; Zhang, H.; Ye, F. Intangible Cultural Heritage in the Yangtze River Basin: Its Spatial Distribution Characteristics and Influencing Factors. Sustainability 2023, 15, 7960. [Google Scholar] [CrossRef]
- Xiong, Y.; Zhang, F. Effect of Human Settlements on Urban Thermal Environment and Factor Analysis Based on Multi-Source Data: A Case Study of Changsha City. J. Geogr. Sci. 2021, 31, 819–838. [Google Scholar] [CrossRef]
- Fei, X. The Formation and Development of the Chinese Nation with Multi-Ethnic Groups. Int. J. Anthropol. Ethnol. 2017, 1, 1. [Google Scholar] [CrossRef]
- Brook, T. The Confusions of Pleasure: Commerce and Culture in Ming China; First Paperback Printing; University of California Press: Oakland, CA, USA; London, UK, 2011; ISBN 978-0-520-22154-3. [Google Scholar]
- Chen, S. Demography of Qing China. In Oxford Research Encyclopedia of Asian History; Oxford University Press: Oxford, UK, 2022; ISBN 978-0-19-027772-7. [Google Scholar]
- Kong, X.; Fu, M.; Zhao, X.; Wang, J.; Jiang, P. Ecological Effects of Land-Use Change on Two Sides of the Hu Huanyong Line in China. Land Use Policy 2022, 113, 105895. [Google Scholar] [CrossRef]
- Chen, T.; Kung, J.K. War Shocks, Migration, and Historical Spatial Development in China. Reg. Sci. Urban Econ. 2022, 94, 103718. [Google Scholar] [CrossRef]
- Feng, L.R. Senses of the City: Perceptions of Hangzhou and Southern Song China, 1127–1279; The Chinese University of Hong Kong Press: Hong Kong, China, 2017; ISBN 978-962-996-786-4. [Google Scholar]
- Li, H. The Song Dynasty’s Fiscal and Economic Policy and Its Social Economy. Soc. Sci. China 2023, 44, 90–114. [Google Scholar] [CrossRef]
- Herman, J.E. Empire in the Southwest: Early Qing Reforms to the Native Chieftain System. J. Asian Stud. 1997, 56, 47–74. [Google Scholar] [CrossRef]
- Dai, Y. Qing Military Institutions and Their Effects on Government, Economy, and Society, 1640–1800. J. Chin. Hist. 2017, 1, 329–352. [Google Scholar] [CrossRef]
- Chen, Y. Regional Decline and Structural Changes in Northeast China: An Exploratory Space–Time Approach. Asia-Pac. J. Reg. Sci. 2024, 8, 397–427. [Google Scholar] [CrossRef]
- Yin, S.; Gao, G.; Huang, A.; Li, D.; Ran, L.; Nawaz, M.; Xu, Y.J.; Fu, B. Streamflow and Sediment Load Changes from China’s Large Rivers: Quantitative Contributions of Climate and Human Activity Factors. Sci. Total Environ. 2023, 876, 162758. [Google Scholar] [CrossRef]
- Zhu, M.; Shao, L. An Analysis on the Economic Cooperation and the Industrial Synergy of the Main River Region: From the Perspective of the Yangtze River Economic Zone. J. Ambient Intell. Humaniz. Comput. 2020, 11, 1055–1064. [Google Scholar] [CrossRef]
- Liu, Y.; Chen, M.; Tian, Y. Temporal and Spatial Patterns and Influencing Factors of Intangible Cultural Heritage: Ancient Qin-Shu Roads, Western China. Herit. Sci. 2022, 10, 201. [Google Scholar] [CrossRef]
- Huang, B.-X.; Chiou, S.-C.; Li, W.-Y. Study on Courtyard Residence and Cultural Sustainability: Reading Chinese Traditional Siheyuan through Space Syntax. Sustainability 2019, 11, 1582. [Google Scholar] [CrossRef]
- Bi, S.; Du, J.; Tian, Z.; Zhang, Y. Investigating the Spatial Distribution Mechanisms of Traditional Villages from the Human Geography Region: A Case Study of Jiangnan, China. Ecol. Inform. 2024, 81, 102649. [Google Scholar] [CrossRef]
- Reardon-Anderson, J. Reluctant Pioneers: China’s Expansion Northward, 1644–1937 (Studies of the Weatherhead East Asian Institute, Columbia University); Stanford University Press: Redwood City, CA, USA, 2005; ISBN 978-0-8047-5167-4. [Google Scholar]
- Gibbs, L.S. Going Beyond the Western Pass: Chinese Folk Models of Danger and Abandonment in Songs of Separation. Mod. China 2021, 47, 178–207. [Google Scholar] [CrossRef]


Disclaimer/Publisher’s Note: The statements, opinions and data contained in all publications are solely those of the individual author(s) and contributor(s) and not of MDPI and/or the editor(s). MDPI and/or the editor(s) disclaim responsibility for any injury to people or property resulting from any ideas, methods, instructions or products referred to in the content. |
© 2026 by the authors. Licensee MDPI, Basel, Switzerland. This article is an open access article distributed under the terms and conditions of the Creative Commons Attribution (CC BY) license.