


Abstract
Aligning rural digitalization and agricultural modernization with risk-coping and adaptive capacities is important for sustainable rural development. Using panel data from 30 Chinese provinces (2011–2024), we assess coordination and mismatches in relative development positions among digital village development, agricultural modernization, and rural resilience using entropy weighting, coupling coordination analysis, and provincial ranking comparisons. Two-way fixed effects (TWFE) and geographically and temporally weighted regression (GTWR) examine associations with government, market, and social conditions. All three subsystems improved, but growth rates and provincial rankings differed. The national mean coupling coordination degree increased from 0.336 to 0.545, while the absolute gap between leading and lagging provinces widened. In 2024, five provinces combined relatively high digital village development with relatively low rural resilience, and seven showed the same pattern for agricultural modernization. In the TWFE model, government and market conditions were positively associated with coupling coordination, whereas social conditions showed no statistically significant association. GTWR revealed spatiotemporal variation, with stronger government associations in some central and western provinces and stable market associations. Temporal trends and provincial rankings were robust to weighting choices, whereas discrete coordination categories were sensitive to them. The findings support place-based policies integrating digital and agricultural development with resilience building.
1. Introduction
Rural areas worldwide are experiencing rapid shifts in the drivers of development amid growing uncertainty and risk. The diffusion of digital technologies, changes in agricultural production, and flows of production factors between urban and rural areas create new opportunities to improve agricultural productivity, expand rural industries, and enhance public service provision. At the same time, pressures associated with food security, climate change, market volatility, and demographic change continually test rural systems’ capacity to sustain production and everyday life, protect farmers’ livelihoods, and adapt to environmental change. Approximately 673 million people worldwide experienced hunger in 2024 [1], and the effects of climate change on agricultural production, food security, and rural livelihoods are increasingly apparent [2]. Rural development in China similarly combines substantial achievements with persistent risk constraints. In 2024, national grain output reached 706.50 million tonnes and rural per capita disposable income increased to CNY 23,119, yet the urban-to-rural per capita disposable income ratio remained 2.34 [3]. Rural revitalization therefore requires more than increases in output, income, and efficiency: development gains must also withstand shocks and support continued adaptation. In practice, development and security are sometimes pursued as separate tasks. However, rural development provides the material, technological, and industrial foundations for security, while rural security creates stable conditions for consolidating and sustaining development gains. Advancing either alone is insufficient to sustain rural development. An important question is thus how to release rural development potential while strengthening systemic stability, adaptability, and transformative capacity.
In this context, digital village development and agricultural modernization are profoundly changing the technological conditions, industrial foundations, and governance of rural development. By integrating digital technologies into rural production and governance, digital village development can improve information flows and public service provision and strengthen links between digital transformation and community capacity building [4,5,6]. Agricultural modernization converts digital technologies and other production factors into productive capacity through upgraded technology and equipment, innovative management practices, structural optimization, and value chain extension, while strengthening production stability and risk-coping capacity [7,8,9]. Rural resilience encompasses the capacity of rural systems to withstand shocks, restore functions, adapt to change, and transform. Through risk-related needs and adaptive feedback, it also influences the applications of digital technologies and the direction of agricultural transformation [10,11,12,13]. However, expanding digital infrastructure or production efficiency does not automatically strengthen multidimensional rural resilience; integrating rural development and security depends on whether the three systems establish mutually supportive coupling relationships and adaptive feedback.
Research on digital village development, agricultural modernization, and rural resilience has produced a substantial body of findings. Studies of digital village development and agricultural modernization primarily examine how digital infrastructure, digital finance, and digital technologies relate to agricultural production, business organization, and industrial upgrading, and assess coupling coordination between the two systems [7,14]. Research on digital village development and rural resilience focuses on digital technologies in rural risk governance, agricultural resilience, and county-level economic resilience, as well as the spatiotemporal evolution of coordination between the two systems [6,13,15,16]. Studies linking agricultural modernization and resilience examine the roles of mechanization and modern agricultural technologies in production stability and risk-coping capacity [8,9]. Scholars have also expanded the conceptualization and measurement of rural resilience in terms of resistance, recovery, adaptation, and transformation [10,11,12,17,18]. Empirical studies have also examined the measurement, spatial variation, and determinants of rural resilience at different spatial scales [18,19,20]. These studies provide a foundation for understanding the development of individual systems and their interrelationships. Research integrating digital village development and agricultural modernization with farmers’ objective well-being [21] or agricultural carbon emission efficiency [22] has extended the analysis to three systems, providing a direct basis for this study.
However, incorporating rural resilience is more than replacing the third component of an existing framework. Farmers’ well-being [21] and carbon emission efficiency [22] describe welfare and efficiency outcomes of routine development, whereas rural resilience—measured here across industrial, ecological, cultural, organizational, and livelihood dimensions—concerns the capacity of rural systems to withstand shocks, maintain core functions, and adapt. Including it shifts the question from how much development has been achieved to whether development is matched by security; that is, whether technological and efficiency gains strengthen risk-coping capacity or coexist with vulnerabilities arising from capital concentration, ecological pressure, or digital exclusion. From this perspective, three issues require further investigation. First, the reciprocal links among digital technology provision, the conversion of technological inputs into agricultural productive capacity, and corrective feedback from rural resilience remain insufficiently theorized. Second, the overall coordination of the three systems, and mismatches in provinces’ relative development positions across them, have received limited attention. Third, the associations of government, market, and social conditions with three-system coordination—both on average and across space and time—require further examination.
Building on this analysis, this study addresses three questions. First, how can the reciprocal links among digital village development, agricultural modernization, and rural resilience be understood theoretically? Second, what spatiotemporal patterns characterize the development levels and coupling coordination of the three subsystems, and are provinces’ relative development positions consistent across them? Third, what are the average associations of government, market, and social conditions with the coupling coordination degree, and how do these associations vary locally across space and time? To address these questions, we develop a three-system analytical framework informed by complex adaptive and social–ecological resilience perspectives [12,23] and evaluate panel data for 30 Chinese provinces from 2011 to 2024. Combining entropy weighting, coupling coordination modeling, within-year percentile rank comparisons, and panel two-way fixed effects (TWFE) and geographically and temporally weighted regression (GTWR) models, we examine both overall conditional associations and local spatiotemporal heterogeneity to inform place-based policies that integrate rural development and security.
2. Mechanisms of Coupling Coordination Among Digital Village Development, Agricultural Modernization, and Rural Resilience
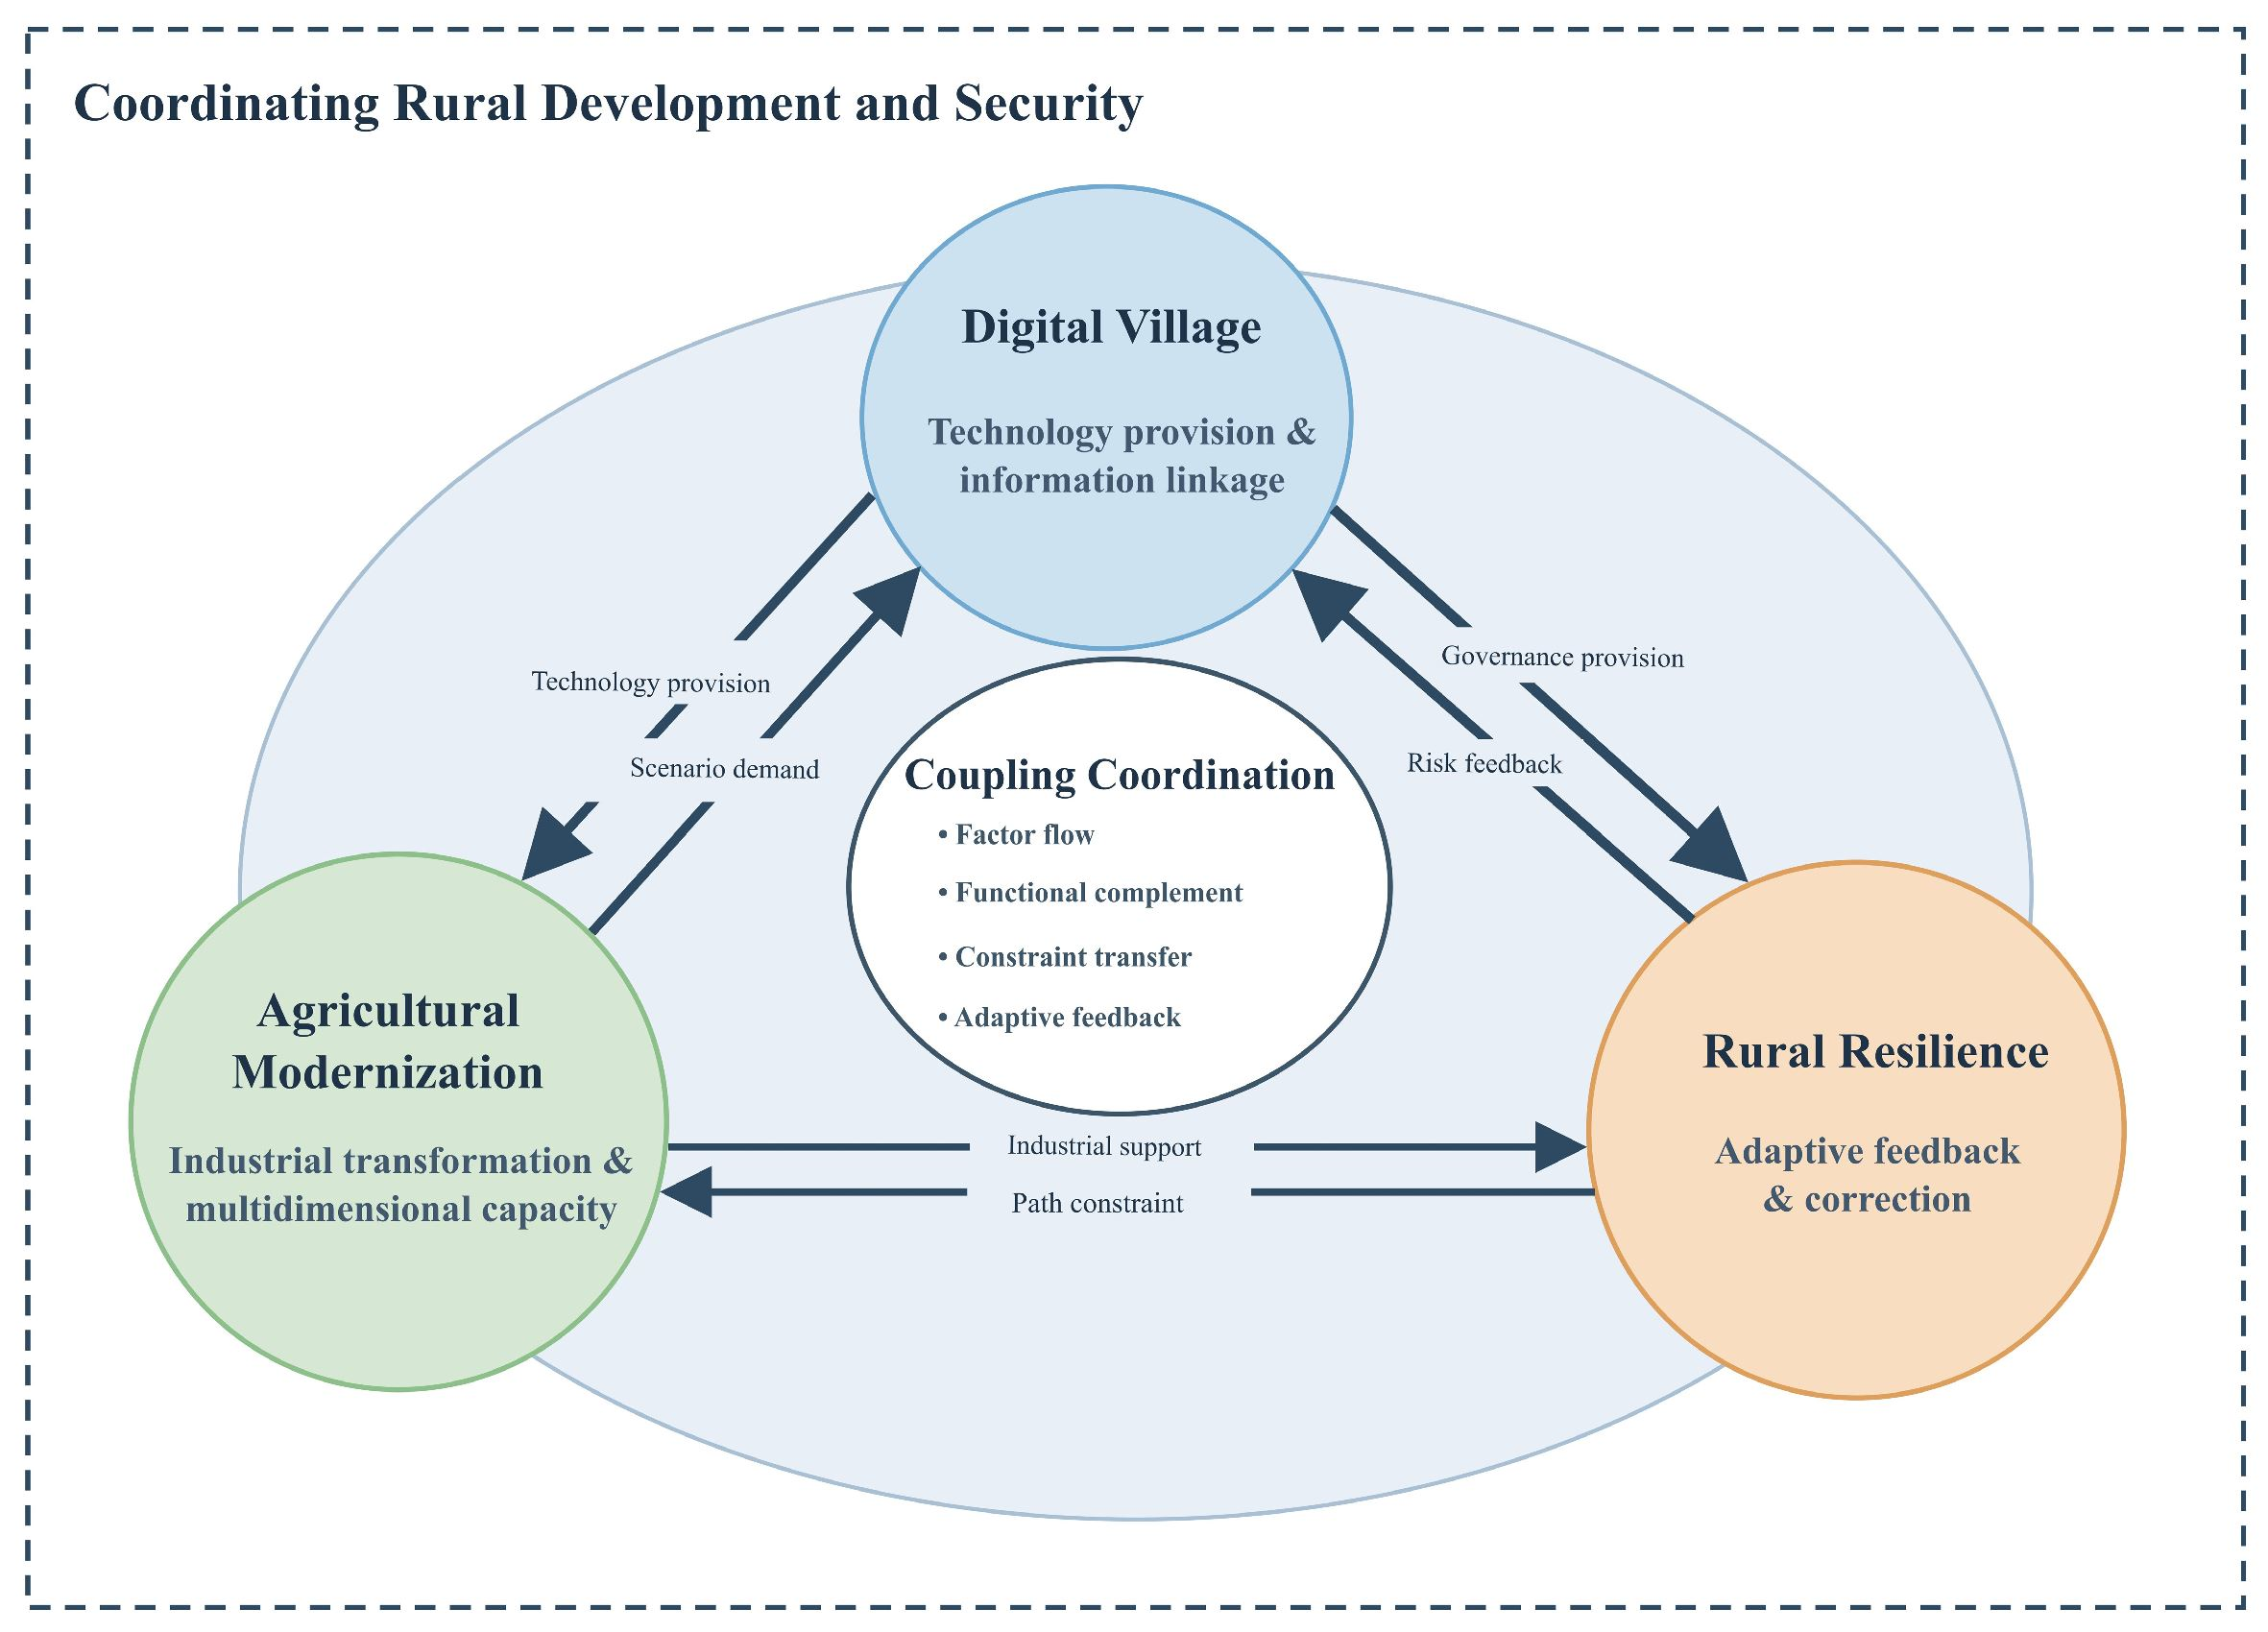
Integrating rural development and security requires the coordinated evolution of digital village development, agricultural modernization, and rural resilience. Drawing on complex adaptive and social–ecological resilience perspectives, this study conceptualizes them as three interconnected subsystems of sustainable rural development [12,23]. Their equal standing derives from their complementary and irreplaceable functions. Digital village development reshapes information and resource flows through digital infrastructure, digital finance, and digital governance, establishing the technological conditions of rural systems. Agricultural modernization converts technological inputs into productive capacity by upgrading industries, management, and production methods, forming the industrial foundation. Rural resilience safeguards basic functions under shocks through resistance, recovery, adaptation, and transformation, providing a foundation for rural security. Each performs an indispensable function and therefore warrants equal standing at the conceptual level. Furthermore, the relationships among the three systems extend beyond a unidirectional causal chain: dynamic connections and structural tensions may emerge through factor flows, capacity conversion, and feedback from demand [13]. Digital village development and agricultural modernization are interdependent through technology provision and demand for its applications. Agricultural modernization and rural resilience balance the formation of industrial capacity against constraints on development pathways arising from security requirements. Digital village development and rural resilience connect the provision of governance capacity with feedback from risk signals. On this basis, we develop an analytical framework of coupling coordination and feedback among the three systems (Figure 1). The following subsections examine the mechanisms associated with each subsystem.
Figure 1.
Analytical framework of coupling coordination among digital village development, agricultural modernization, and rural resilience. Note: Adapted from Figure 1 in Xiong et al. [21], licensed under CC BY 4.0. The third subsystem, system functions, and relationship labels have been modified.
2.1. Digital Village Development: Technology Provision and Information Linkages
Digital village development embeds digital transformation in rural production, everyday life, and governance. Its core function is to overcome spatial and temporal barriers to information transmission and resource flows, connecting agricultural operators, market demand, public services, and governance resources [4,6,7]. It comprises three mutually supportive dimensions: digital infrastructure, including networks, terminals, and data platforms; digitalized production, including remote sensing, smart agricultural machinery, and precision management; and digital governance, including government services, risk monitoring, and public services.
In agricultural production, digital technologies support information sharing and the application of smart machinery and precision management [7]. Digital finance promotes the adoption of green control techniques by family farms through improved credit availability, information acquisition, and social trust [24]. Rural e-commerce expands farmers’ access to markets and strengthens their connections with agricultural markets [25]. Digital village development thus enables new combinations of production factors for modernizing agricultural industries, management, and production. Digital technologies also strengthen rural resilience through public services and risk governance. Digital village development improves access to basic public services and promotes service integration and public participation [4]. Disaster monitoring, market early-warning systems, and emergency management platforms improve risk identification and organizational response. The digital documentation and dissemination of community heritage offer new avenues for sustaining local identity and strengthening rural community resilience [26].
2.2. Agricultural Modernization: Industrial Transformation and Multidimensional Capacity
Agricultural modernization encompasses the modernization of agricultural industries, management, and production, linking investment in digital technologies to improvements in rural capacities [7]. Digital infrastructure, data resources, and financial tools become productive capacity only when integrated into agricultural production organization, business management, and industry chain operations. By selecting applications, adapting organizations, and allocating factors, agricultural modernization converts technological, capital, labor, and organizational resources into production efficiency, industrial value, and market competitiveness [7,27].
Translating digital technologies into agricultural development capacity requires alignment with farmers’ knowledge and skills, advisory services, and production organization [7,27]; the governance outcomes of digital village development also depend on combinations of social and technical factors [5]. From the perspective of demand for technological applications, the development of farming at an appropriate scale, environmentally sustainable production, and agricultural branding creates practical applications for digital technologies and new requirements for precision services and risk governance. When digital infrastructure is disconnected from industrial demand, farmers’ capabilities, and governance needs, equipment may remain idle, platforms may operate inefficiently, and digital exclusion may emerge, limiting the conversion of technological investment into systemic capacity. Agricultural modernization thus creates demand for digital technologies and strengthens the capacity to adopt and use them, linking technology provision to practical application needs. The industrial and organizational capacities created through agricultural modernization also underpin rural resilience. Diversifying industrial structures reduces reliance on individual products and markets and distributes risks from natural disasters and price fluctuations. Agricultural mechanization enhances the climate resilience of food production by improving the timeliness of farming operations and reducing disaster losses [8]. Evidence from National Modern Agricultural Demonstration Zones indicates that the promotion and adoption of modern agricultural technologies can enhance agri-food system resilience [9]. Agricultural index insurance provides farmers with a tool for managing production risks [28], while digital finance can improve credit access and support technology adoption [24]. Cooperatives can strengthen organizational and member-level resilience by building social capital, collaborative relationships, and wider social networks [29]. The adoption of green control techniques also supports the transition toward greener agricultural production [24]. It therefore supports rural resilience through economic, organizational, and ecological capacities.
2.3. Rural Resilience: Adaptive Feedback and Adjustments to Coordination Pathways
Rural resilience is the comprehensive capacity of rural systems to maintain basic functions, restore operations, adapt to environmental change, and achieve transformation and upgrade under external shocks and internal pressures [10,17,18]. It encompasses five dimensions: industrial resilience concerns production stability and supply chain security; ecological resilience concerns resource carrying capacity and environmental quality; organizational resilience concerns collaborative governance and emergency response; livelihood resilience concerns farmers’ capacity to cope with risks; and cultural resilience concerns local knowledge and rural identity [18]. Related research on community resilience further emphasizes that resilience extends beyond recovery after shocks to include preparedness, capacity building, proactive adaptation, and transformative learning [30,31,32].
Rural resilience does not simply absorb technological shocks passively; it draws on the foundations of digital village development and agricultural modernization while guiding them through corrective feedback. For digital village development, industrial and ecological resilience steer digital monitoring toward supply-chain forecasting, precision fertilization, smart irrigation, and pollution control; organizational resilience requires platforms that support interdepartmental coordination, public participation, and emergency response [4,5,30,31]; and livelihood and cultural resilience require inclusive digital finance and respect for local knowledge and rural identity. For agricultural modernization, ecological and industrial resilience call for resource-efficient production, diverse industrial structures, and stable value chains; organizational resilience requires inclusive business organizations and multi-actor collaboration across local social networks [33]; and cultural and livelihood resilience require production methods compatible with local knowledge and farmers’ capabilities [10,34,35]. Conversely, excessive emphasis on scale expansion, capital intensity, or resource-intensive monoculture can crowd out smallholders, weaken ecological carrying capacity, and amplify exposure to common shocks. Rural resilience thus constrains and calibrates agricultural modernization pathways from the perspective of security.
Together, the three subsystems form an interconnected coupling network (Figure 1), yet capacity conversion across them is neither automatic nor frictionless. Structural trade-offs and implementation bottlenecks explain why advances in digitalization or agricultural modernization may fail to translate into commensurate rural resilience. Specifically, when digital village initiatives prioritize hardware investment over farmers’ digital literacy and inclusive service design, digital exclusion can prevent technological gains from reaching vulnerable households. Similarly, when agricultural modernization relies heavily on capital-intensive monoculture, excessive agrochemical inputs, or land consolidation that crowds out smallholder participation, short-term gains in production efficiency can erode ecological carrying capacity and livelihood buffers. At the provincial scale, these micro- and meso-level interactions manifest as three observable macro-level regularities examined in our empirical analysis: whether the three subsystems co-evolve synchronously (coupling coordination), whether provinces’ relative advantages in digitalization and agricultural modernization align with their rural resilience positions (within-year percentile ranks), and how external government, market, and social conditions relate to three-system coordination (TWFE and GTWR).
3. Research Design
3.1. Construction of the Indicator System
Drawing on existing assessments of digital village development and agricultural modernization [14,36,37] and studies measuring rural resilience [10,17,18], we construct an indicator system for each subsystem. Digital village development is characterized by rural digital infrastructure, digitalization of rural production, and rural digital services. These dimensions capture digital infrastructure provision, conditions for applying digital technologies in agricultural production, and the foundations of digital public services. Agricultural modernization is characterized by the modernization of agricultural industries, agricultural management, and agricultural production, reflecting the modernization of industrial structures, business organizations, production efficiency, and the availability of production inputs. Rural resilience is characterized by industrial, ecological, cultural, organizational, and livelihood resilience, reflecting the capacity of rural systems to maintain basic functions, cope with external shocks, adapt to environmental change, and sustain development.
Based on conceptual relevance, comparability, and temporal continuity, we select 33 indicators across digital village development (11), agricultural modernization (9), and rural resilience (13), as detailed with their measurement definitions, units, directions, entropy weights, and data sources in Table 1 (compilation details are provided in Appendix A). Regarding construct validity, certain foundational indicators capture essential physical and productive enabling conditions within rural systems. Specifically, fixed asset investment in transport, storage, and postal services and rural electricity consumption are included in the digital village subsystem because physical logistics networks and stable power supply constitute the indispensable material and energy substrates required to operate rural e-commerce fulfillment, cold-chain distribution, and digital terminals [14,21,36]. Similarly, within the industrial resilience dimension, comprehensive grain production capacity and agricultural labor productivity serve as proxy measures for baseline productive redundancy and buffer capacity; under external climate or market shocks, regions with stronger baseline grain capacity and labor efficiency possess a greater margin of safety to absorb disturbances and maintain core food-supply functions [10,17,18]. Within the remaining resilience dimensions, the cultural, organizational, and livelihood indicators capture the social and institutional foundations of rural adaptability [10,18,30,33]: rural compulsory-education teachers and township cultural stations reflect human capital and public spaces supporting risk awareness, knowledge diffusion, and community cohesion; the concurrent serving of village Party branch secretaries and committee directors, village development plans, and village improvement programs capture grassroots administrative integration, forward-looking spatial planning, and collective implementation capacity; and rural disposable income, the urban–rural income ratio, and village healthcare personnel measure household financial buffers, distributional equity, and frontline medical capacity to absorb livelihood and public-health shocks. To ensure that our conclusions do not depend on the four physical and productive proxy indicators, Section 4.4.3 reports robustness checks excluding them jointly as well as a systematic leave-one-indicator-out analysis across all 33 indicators.
Table 1.
Indicator system for digital village development, agricultural modernization, and rural resilience.
3.2. Research Methods
3.2.1. Entropy Weighting Method
We use the entropy weighting method to calculate composite development indices for digital village development, agricultural modernization, and rural resilience separately [36,37]. Min–max normalization is conducted across the pooled panel of N = 420 province-year observations (30 provinces, 2011–2024) rather than within each year, because year-by-year normalization would rescale annual national means around a similar midpoint and obscure temporal progress. Normalization parameters and indicator weights are therefore held fixed across the study period, so that index values are comparable across provinces and years; within-year percentile ranks (Section 3.2.4) complement this pooled benchmark in cross-sectional comparisons. Zero normalized values are handled using the standard information-theoretic limit p ln p → 0 as p → 0+. The full normalization and entropy-weighting formulas and the first-stage weights of the external condition indices are reported in Appendix A, and the resulting indicator weights are listed in Table 1.
Government, market, and social condition indices are calculated separately using the same procedure. Government conditions comprise fiscal support for agriculture and rural digitalization; market conditions comprise the marketization index and the agricultural land transfer rate; and social conditions comprise the social consumption level and agricultural socialized services. First, the two indicators within each dimension are normalized and assigned entropy weights to construct three dimension-specific indices. Second-stage entropy weights are then calculated directly from the full-sample observations of these indices, without repeating min–max normalization, and are used to construct the composite government–market–society conditions index. The second-stage weights for government, market, and social conditions are 0.1073, 0.3923, and 0.5005, respectively. The three dimension-specific indices are used in the subsequent two-way fixed effects and GTWR models to examine associations with coupling coordination, whereas the composite conditions index is used only to describe the overall level and spatiotemporal distribution of external conditions.
3.2.2. Coupling Coordination Model
To assess coordination among digital village development, agricultural modernization, and rural resilience, we calculate the coupling degree and coupling coordination degree using the composite development indices of the three subsystems [13,37]. The coupling degree measures the relative balance among the three subsystem indices and is calculated as follows:
Here, i denotes the province and t denotes the year. U1it, U2it, and U3it are the composite development indices of digital village development, agricultural modernization, and rural resilience, respectively, for province i in year t. The coupling degree, Cit, ranges from 0 to 1, with values closer to 1 indicating more balanced subsystem indices.
To incorporate the overall development level of the three subsystems, we construct their composite development index, Tit, and calculate the coupling coordination degree, Dit, as follows:
Tit = αU1it + βU2it + γU3it
Here, α, β, and γ are non-negative subsystem weights satisfying α + β + γ = 1. Reflecting the complementary functions of the three subsystems (Section 2), we set α = β = γ = 1/3 in the baseline. This represents a transparent normative benchmark rather than a unique mathematical requirement: in practice, a province with high rural resilience and moderate digital development may be more stable than one whose subsystems are balanced but uniformly weak, and distance-to-frontier or benefit-of-the-doubt approaches would weight the subsystems asymmetrically (alternative intersystem weights are examined in Section 4.4.3). Under equal weights, the denominator of Cit cancels with Tit, so that Dit = (Cit × Tit)1/2 = (U1itU2itU3it)1/6, the sixth root of the product of the three subsystem indices. Dit thus acts as a non-compensatory geometric aggregator that penalizes severe imbalance while scaling monotonically with overall performance. To distinguish relative intersystem balance from overall development level behind the composite coordination score, we report Cit and Tit alongside Dit in Section 4.4.1. Following [13,14,37], Dit ∈ [0, 1] is divided into ten equal-width intervals that serve as heuristic benchmark categories (Table 2).
Table 2.
Ten categories of coupling coordination degree.
3.2.3. Two-Way Fixed Effects and Geographically and Temporally Weighted Regression
To examine the associations of government, market, and social conditions with the coupling coordination degree among digital village development, agricultural modernization, and rural resilience, we combine a two-way fixed effects (TWFE) model with geographically and temporally weighted regression (GTWR) to analyze overall associations and their local spatiotemporal variation. Table 3 presents the indicators of government, market, and social conditions.
Table 3.
Indicators of government, market, and social conditions.
First, we use a two-way fixed effects model with province and year effects to examine the overall associations between the three conditions and the coupling coordination degree. The model estimates a common regression coefficient for each condition while controlling for time-invariant provincial characteristics and shocks common to all provinces in each year. It is specified as follows:
Dit = α + β1Govit + β2Marit + β3Socit + μi + λt + εit
Here, Dit denotes the coupling coordination degree of the three systems in province i in year t. Govit, Marit, and Socit denote the government, market, and social condition indices, respectively. The constant is α, and β1, β2, and β3 are the corresponding regression coefficients. Province and year fixed effects are denoted by μi and λt, respectively, and εit is the error term. Standard errors are clustered by province.
To further examine how these associations vary across provinces and years, we use GTWR, which expresses regression coefficients as functions of geographical location and time to estimate local associations for each province and year [13,39]. The model is specified as follows:
Here, ui and vi denote the longitude and latitude of the administrative center of province i, respectively, and t denotes the year. For j = 1, 2, 3, Xjit denotes the government, market, and social condition indices, respectively, for province i in year t. The term β0(ui, vi, t) is the local intercept, and βj(ui, vi, t) is the local regression coefficient for the corresponding condition in that province and year.
GTWR uses spatiotemporal distance to determine the weight of each observation in local estimation. In our baseline specification, spatiotemporal coordinates are constructed using longitude (ui), latitude (vi), and year (t), with the spatiotemporal distance between target observation (i, t) and observation (r, s) defined as follows:
where τ scales temporal relative to spatial proximity (τ = 1 in the baseline, which at China’s mid-latitudes equates roughly 1° ≈ 100 km of spatial separation with one year). To account for meridian convergence across latitudes, Section 4.5.2 also evaluates spherical great-circle distances (dit,rsS, measured in 100 km units via the Haversine formula) across τ ∈ {0.5, 1.0, 2.0}. Local weights are determined using an adaptive Gaussian kernel:
Here, wit,rs is the weight assigned to observation (r, s) in the local regression for target observation (i, t), and bit is the local adaptive bandwidth defined by the distance to the k-th nearest neighbor (k = 51 in the baseline, including the target observation itself). In panel GTWR with 14 annual observations per province, unconstrained minimization of in-sample AICc or point-wise leave-one-out cross-validation (LOOCV) monotonically favors narrow bandwidths because a tight kernel assigns excessive weight to a province’s own adjacent years and exploits strong within-province serial correlation (AR(1) ρ = 0.867). To prevent single-province temporal self-fitting and ensure genuine cross-provincial pooling, we select the smallest k (k = 51) satisfying three criteria: (1) mean own-province kernel-weight share ≤ 10.0%; (2) effective number of contributing provinces (inverse Herfindahl index of provincial weight shares) > 15; and (3) maximum local design-matrix condition number < 16 across all 420 regressions. Diagnostics across k ∈ {35, 45, 51, 60, 75, 90} are reported in Appendix B (Table A1) and discussed in Section 4.5.2.
3.2.4. Sensitivity Analysis and Relative Development Positions
We conduct sensitivity analyses of intersystem weights, indicator weights within subsystems, and sample composition. In the order of digital village development, agricultural modernization, and rural resilience, alternative intersystem weights are set to (0.4, 0.3, 0.3), (0.3, 0.4, 0.3), (0.3, 0.3, 0.4), and (0.5, 0.25, 0.25). Entropy weights within all three subsystems are replaced with equal weights in a separate analysis. We also exclude the four municipalities of Beijing, Tianjin, Shanghai, and Chongqing and recalculate the coupling coordination degree under two approaches: retaining the original subsystem indices and repeating normalization and entropy weighting using the remaining sample. Weight sensitivity is assessed by comparing annual mean coupling coordination degrees, rank correlations between provincial multiyear means under each alternative and the baseline, and the proportion of observations whose coordination categories change. Sample sensitivity is assessed by comparing annual means and interprovincial coefficients of variation.
To compare relative provincial development positions across systems, we calculate annual Spearman rank correlations for two pairs: digital village development and rural resilience, and agricultural modernization and rural resilience. Each system index is also converted into a within-year provincial percentile rank using P = (r − 1)/(N − 1), where r is the ascending rank, with tied values assigned their average rank, and N is the number of provinces. Observations with percentile ranks of at least 0.5 are classified as relatively high, and the remainder as relatively low. We then identify four high–low combinations for each of the two system pairs.
3.3. Data Sources
Based on data availability, continuity, and statistical comparability, the study covers 30 provincial-level administrative divisions in mainland China from 2011 to 2024, yielding a balanced panel of 420 province-year observations. Hong Kong, Macao, and Taiwan are excluded because their statistical systems and indicator definitions differ from the mainland national accounting framework; Tibet is excluded due to historical gaps in several agricultural modernization and rural digitalization series during the early years of the study period. Consequently, the national trends and interprovincial distributions reported in this study reflect mainland China’s 30 provinces rather than all 34 provincial-level divisions.
The period 2011–2024 was selected for both data-related and substantive reasons. First, core data relevant to digital village development, including the Peking University Digital Financial Inclusion Index, provide continuous provincial observations from 2011 onward and can be matched consistently with agricultural modernization and rural resilience indicators. Second, this period encompasses major policy and risk contexts, including agricultural supply-side structural reform, targeted poverty alleviation, the rural revitalization strategy (2018), the digital village strategy (2019), and the COVID-19 shock. Extending the analysis to 2024 increases its relevance to contemporary rural development.
Data are compiled from three primary sources (Table 1 and Appendix A): (1) official national and provincial statistical publications (2012–2025 editions, reporting 2011–2024 data), including the China Statistical Yearbook, China Rural Statistical Yearbook, and provincial statistical yearbooks and communiqués; (2) specialized research datasets, specifically the Peking University Digital Financial Inclusion Index of China (2011–2024 release compiled by the Institute of Digital Finance at Peking University, for which Guo et al. [38] provide the methodological foundation) and the provincial rural revitalization and marketization index datasets; and (3) provincial administrative-center coordinates from the National Catalogue Service for Geographic Information. Regarding data provenance [21,37,38], the 11 digital village and 9 agricultural modernization indicators reuse the cleaned 2011–2024 provincial panel series compiled by Xiong et al. [21] (accessed via the authors’ shared repository without altering definitions or values), whereas Xiong et al. [37] is cited strictly for methodological reference. The 13 rural resilience indicators are taken from the provincial rural revitalization index dataset, and the 6 external condition indicators were compiled for the present study. All 420 province-year observations across the 39 indicators are complete after standard linear interpolation of sporadic gaps, and common price effects in nominal monetary series are absorbed by year fixed effects and within-year rank comparisons (see Appendix A).
4. Empirical Results
4.1. Spatiotemporal Characteristics of Digital Village Development
ArcGIS 10.8 was used to map the digital village development index, with 2011, 2018, and 2024 selected for comparison (Figure 2). The national mean increased from 0.082 in 2011 to 0.205 in 2018 and 0.318 in 2024. This upward trend indicates continued improvement in digital village development in China.
Figure 2.
Spatial distribution of digital village development in 2011, 2018, and 2024. Map approval number: GS (2022) 1873. Note: Class boundaries are determined using pooled equal-interval thresholds fixed across 2011, 2018, and 2024 to ensure intertemporal comparability; colors depict composite index levels rather than within-year percentile ranks.
Spatially, provinces with high digital village development indices were mainly located along the eastern coast. In 2011, Guangdong and Jiangsu recorded index values of 0.271 and 0.257, respectively, substantially higher than those of most other provinces, while Hainan, Ningxia, Qinghai, Guizhou, and Gansu had relatively low values. By 2018, the indices for Guangdong and Jiangsu had risen to 0.504 and 0.473. Zhejiang, Shandong, Shanghai, and Sichuan also recorded relatively high values, with high-value areas extending from a few coastal provinces toward neighboring areas and selected inland provinces. In 2024, Guangdong, Jiangsu, Zhejiang, and Shandong reached 0.707, 0.567, 0.550, and 0.548, respectively, while Sichuan reached 0.484. Ningxia, Hainan, Jilin, Qinghai, and Tianjin remained relatively low. Overall, digital village development improved widely. High-value provinces remained mainly located along the eastern coast, while some inland provinces also performed strongly, and regional disparities persisted.
4.2. Spatiotemporal Characteristics of Agricultural Modernization
ArcGIS 10.8 was used to map agricultural modernization in 2011, 2018, and 2024 (Figure 3). The national mean index increased continuously from 0.083 in 2011 to 0.131 in 2018 and 0.207 in 2024. The increase was 0.048 over 2011–2018 and 0.076 over 2018–2024, suggesting that agricultural modernization accelerated after 2018.
Figure 3.
Spatial distribution of agricultural modernization in 2011, 2018, and 2024. Map approval number: GS (2022) 1873. Note: Class boundaries are determined using pooled equal-interval thresholds fixed across 2011, 2018, and 2024 to ensure intertemporal comparability; colors depict composite index levels rather than within-year percentile ranks.
High values of agricultural modernization were mainly found in selected centrally administered municipalities, eastern coastal provinces, and northern agricultural regions, whereas low values were mainly distributed across southwestern China and some other provinces. In 2011, Shanghai (0.220), Beijing (0.152), Zhejiang (0.145), and Tianjin (0.144) ranked relatively high, while Gansu (0.031), Guizhou (0.035), Hainan (0.044), and Yunnan (0.045) ranked relatively low. In 2018, Shanghai, Zhejiang, Beijing, and Tianjin remained among the leaders, and Inner Mongolia, Jilin, and Heilongjiang also recorded relatively high values. By 2024, Beijing, Shanghai, and Zhejiang had reached 0.585, 0.544, and 0.526, respectively, forming a distinct high-value group. Yunnan, Guizhou, Hainan, Guangxi, Sichuan, and Shaanxi remained relatively low. Agricultural modernization improved in most provinces, but the spatial distribution of high- and low-value provinces remained relatively stable, indicating persistent interprovincial disparities.
4.3. Spatiotemporal Characteristics of Rural Resilience
ArcGIS 10.8 was used to map rural resilience in 2011, 2018, and 2024 (Figure 4). The national mean index increased from 0.273 in 2011 to 0.386 in 2018 and 0.486 in 2024. The steady annual increase indicates an overall improvement in the capacity of rural systems to respond to external disturbances, maintain basic functions, and adapt.
Figure 4.
Spatial distribution of rural resilience in 2011, 2018, and 2024. Map approval number: GS (2022) 1873. Note: Class boundaries are determined using pooled equal-interval thresholds fixed across 2011, 2018, and 2024 to ensure intertemporal comparability; colors depict composite index levels rather than within-year percentile ranks.
Spatially, rural resilience indices were generally higher in eastern coastal areas and selected centrally administered municipalities and lower in some western provinces. In 2011, Shanghai (0.532), Guangdong (0.492), Beijing (0.484), Jiangsu (0.448), and Shandong (0.432) recorded relatively high values, while Qinghai, Gansu, Ningxia, Xinjiang, Inner Mongolia, and Yunnan recorded relatively low values. In 2018, Beijing, Guangdong, Shanghai, Zhejiang, Shandong, and Liaoning formed the high-value group, whereas Guangxi, Shaanxi, Qinghai, Inner Mongolia, Guizhou, and Yunnan remained relatively low. In 2024, Guangdong, Beijing, and Shanghai reached 0.845, 0.840, and 0.806, respectively, while Shandong, Zhejiang, and Jiangsu all exceeded 0.700. Shaanxi, Qinghai, Ningxia, Guangxi, Inner Mongolia, and Guizhou remained relatively low. Although rural resilience improved in both high- and low-value provinces, their relative spatial positions changed little, suggesting persistent regional disparities.
4.4. Spatiotemporal Evolution of Coupling Coordination Among the Three Systems
4.4.1. Spatiotemporal Evolution of the Coupling Coordination Degree
Figure 5 shows the national mean subsystem indices (U1, U2, U3), the coupling degree (C), the comprehensive development index (T), and the coupling coordination degree (D) for 2011–2024. Because each subsystem index measures a distinct domain using domain-specific indicators and weights, our analysis evaluates within-system growth trajectories and relative provincial rankings rather than raw cross-system score differences. All three subsystems improved steadily: between 2011 and 2024, the national mean increased by 286.1% for digital village development, 148.5% for agricultural modernization, and 77.7% for rural resilience (calculated from unrounded means). The coupling degree was already high in 2011 (0.812) and rose to 0.909 in 2024, whereas the comprehensive development index increased from 0.146 to 0.337. The rise in the coupling coordination degree, from 0.336 in 2011 to 0.454 in 2018 and 0.545 in 2024, was therefore driven mainly by higher overall development levels, supported by greater balance among the subsystems. Under the baseline weights, the national mean entered the ‘barely coordinated’ interval [0.5, 0.6) in 2022, although the timing of such category transitions depends on the weighting scheme (Section 4.4.3).
Figure 5.
Two-panel comparison of (a) within-system temporal trajectories of the composite indices of digital village development (U1), agricultural modernization (U2), and rural resilience (U3) and (b) evolution of the coupling degree (C), comprehensive development index (T), and coupling coordination degree (D), 2011–2024.
To examine spatial changes in coupling coordination, we use ArcGIS 10.8 to compare the distributions in 2011, 2018, and 2024 (Figure 6). Overall, coordination was higher along the eastern coast and in centrally administered municipalities and lower in western China and some border provinces.
Figure 6.
Spatial distribution of coupling coordination among digital village development, agricultural modernization, and rural resilience in 2011, 2018, and 2024. Map approval number: GS (2022) 1873. Note: Class boundaries are determined using pooled equal-interval thresholds fixed across 2011, 2018, and 2024 to ensure intertemporal comparability; colors depict composite index levels rather than within-year percentile ranks.
In 2011, the national mean coupling coordination degree was 0.336. None of the 30 provinces reached 0.500, and 24 remained below 0.400. Jiangsu, Guangdong, Zhejiang, Shanghai, Beijing, and Shandong recorded relatively high values, while Gansu, Ningxia, Guizhou, Qinghai, Hainan, and Yunnan recorded relatively low values. Most provinces therefore exhibited some degree of imbalance at the beginning of the study period. By 2018, the national mean had risen to 0.454. Zhejiang and Shanghai exceeded 0.600, while Jiangsu, Beijing, Guangdong, and Shandong exceeded 0.500. The number of provinces at or above 0.500 increased to six, and the number below 0.400 fell to eight.
In 2024, the national mean increased further to 0.545, and 21 provinces reached at least 0.500. Beijing, Zhejiang, and Shanghai exceeded 0.700, while Guangdong, Jiangsu, and Shandong exceeded 0.600. Yunnan, Guizhou, Ningxia, Hainan, Shaanxi, and Gansu remained relatively low, but every province exceeded 0.400. Coupling coordination improved widely during the study period. High-value areas remained mainly located along the eastern coast and in selected centrally administered municipalities, while some central provinces gradually entered coordinated development categories. However, the relative spatial positions of high- and low-value provinces changed little. Interprovincial disparities widened in absolute terms but narrowed in relative terms. Between 2011 and 2024, the range increased from 0.252 to 0.346 and the standard deviation from 0.076 to 0.099, whereas the interquartile range remained stable (0.098 and 0.093), indicating that the widening was driven mainly by rapid gains in leading eastern provinces and municipalities. Because the mean rose faster than the standard deviation, the coefficient of variation declined from 0.225 to 0.181 (annual values are reported in Appendix B, Table A2).
4.4.2. Comparison of Relative Provincial Development Positions Across the Three Systems
Because the three subsystem indices are measured on different scales, our operational definition of mismatch evaluates discordance in provinces’ within-year relative positions (percentile ranks) rather than absolute capability deficits. Provincial rankings in digital village development and agricultural modernization were both positively correlated with provincial rankings in rural resilience, but the strength and temporal evolution of these rank correlations differed markedly. The Spearman rank correlations between digital village development and rural resilience were 0.614 (p < 0.001), 0.633 (p < 0.001), and 0.564 (p = 0.0012) in 2011, 2018, and 2024, respectively; a paired bootstrap test (5000 replications) shows that the change between 2011 and 2024 is not statistically significant (Δr = −0.050, p = 0.698). By contrast, the Spearman rank correlations between agricultural modernization and rural resilience were 0.671 (p < 0.001), 0.347 (p = 0.0604), and 0.393 (p = 0.0318) in 2011, 2018, and 2024, respectively. This decline is statistically significant (Δr = −0.278, p = 0.046), indicating a growing divergence between provinces’ relative positions in agricultural modernization and their overall rural resilience.
Using the baseline threshold of 0.5 for within-year provincial percentile ranks (Figure 7), five provinces in 2024 combined relatively high digital village development (Pdig ≥ 0.5) with relatively low rural resilience (Pres < 0.5): Fujian, Henan, Hunan, Guangxi, and Chongqing. Meanwhile, seven provinces combined relatively high agricultural modernization (Pagr ≥ 0.5) with relatively low rural resilience (Pres < 0.5): Inner Mongolia, Heilongjiang, Fujian, Hunan, Qinghai, Ningxia, and Xinjiang. As a continuous supplement, the largest positive percentile-rank gaps (ΔP = Pdev − Pres) in 2024 occurred in Guangxi (+0.483), Henan (+0.448), Shaanxi (+0.414), and Sichuan (+0.276) for digitalization versus resilience and in Inner Mongolia (+0.724), Qinghai (+0.655), Ningxia (+0.586), and Heilongjiang (+0.448) for agricultural modernization versus resilience. With alternative thresholds of 0.4 and 0.6, Inner Mongolia, Heilongjiang, Qinghai, and Ningxia remain mismatched in agricultural modernization, whereas in the digital comparison only Henan is mismatched under all three thresholds. Thus, strong relative performance in agricultural modernization or digitalization does not automatically translate into a commensurate position in rural resilience.
Figure 7.
Relative provincial development positions in digital village development, agricultural modernization, and rural resilience in 2024. Note: Coordinates represent percentile ranks among the 30 provinces in the corresponding year. Dashed lines indicate the 0.5 threshold, and colors distinguish combinations of relatively high and low positions.
4.4.3. Sensitivity to Weighting and Sample Composition
Table 4 summarizes the sensitivity analyses. The national mean coupling coordination degree increased throughout 2011–2024 under all alternative weighting and indicator specifications, and provincial rankings remain close to the baseline: Spearman correlations range from 0.979 to 0.997 for the four alternative intersystem weights, are 0.941 and 0.958 for equal and principal component analysis (PCA) indicator weights, are 0.984 when the four infrastructure and productive proxy indicators discussed in Section 3.1 are excluded jointly, and range from 0.986 to 1.000 when each of the 33 indicators is removed in turn (Appendix B, Table A3). Discrete categories are less stable. Alternative intersystem weights change the category of 5.2–14.5% of observations and shift the year in which the national mean reaches 0.500 by at most one year. Equal and PCA indicator weights, however, raise the overall scale of the indices, because entropy weighting gives more weight to right-skewed indicators such as rural online sales and agricultural credit; as a result, 91.9% of observations move up one category and the threshold is reached in 2013–2014 rather than 2022. In the leave-one-indicator-out analysis, the most influential indicators are high-entropy indicators such as agricultural credit services, rural online purchases, and agricultural insurance density, and the median share of observations changing category is 4.8%. Temporal trends and provincial rankings are therefore robust, whereas category labels and transition years are better read as indicative benchmarks.
Table 4.
Sensitivity of coupling coordination to weighting schemes and indicator composition.
Excluding the four centrally administered municipalities (Beijing, Tianjin, Shanghai, and Chongqing) yields the same pattern. With the original indices, the mean for the remaining 26 provinces rises from 0.329 in 2011 to 0.530 in 2024; the range and standard deviation widen slightly, whereas the coefficient of variation declines from 0.224 to 0.158 and the interquartile range remains stable. Recomputing normalization and entropy weights within the 26-province sample gives similar results (mean from 0.338 in 2011 to 0.568 in 2024; coefficient of variation from 0.243 to 0.161).
4.5. Analysis of Factors Associated with Coupling Coordination
4.5.1. Baseline Two-Way Fixed Effects Results
Table 5 reports the TWFE estimates. In the baseline model (Model 1), with province and year fixed effects and standard errors clustered by province, the coefficients for government and market conditions are positive (0.0457 and 0.0548). The government association is statistically significant at the 5% level (p = 0.036 based on the t(29) distribution for 30 clusters), and the market association is marginally significant (p = 0.051; p = 0.042 under asymptotic inference). The coefficient for social conditions is small and not statistically significant (−0.0145, p = 0.765). With time-invariant provincial differences and common annual trends absorbed by the two-way fixed effects, the three indices account for 4.5% of the residual within-province variation (rising to 11.1% when structural controls are included in Model 3).
Table 5.
Baseline two-way fixed effects and robustness regression results.
The residuals show strong first-order serial correlation (AR(1) ρ = 0.851), which is addressed by clustering standard errors by province, but no significant cross-sectional dependence (Pesaran CD = 0.564, p = 0.573) and only mild spatial correlation (block-permutation Moran’s I test, p = 0.122).
Models 2–5 examine the robustness of these associations. Removing rural broadband subscribers from the dependent variable (Model 2, Dno-bb), which overlaps conceptually with the broadband indicator in the government index (r = 0.412), increases the government coefficient, and the corresponding GTWR estimates are consistent with the baseline (global R2 = 0.8783). Controlling for rural human capital and grain production capacity (Model 3) and adding a predetermined spatial lag (Model 4) leave both associations positive and significant at the 5% level. When predictors are lagged by one year (Model 5), the market association remains significant, whereas the government association does not, suggesting that it is largely contemporaneous. Restricting the government index to fiscal agricultural expenditure yields a coefficient close to zero (β = 0.0007, p = 0.979), suggesting that fiscal support is associated with coordination mainly when it is translated into rural digital and public infrastructure. Spatial autoregressive (SAR-QML) and spatial two-stage least squares (S2SLS; province-clustered Kleibergen–Paap F = 7.83) specifications and equal-weighted external indices likewise preserve positive estimates for both conditions at the 5% or 10% level. Taken together, after accounting for province and year fixed effects, key covariates, spatial spillovers, and one-year lags, these estimates establish robust conditional associations—rather than strict unidirectional causal effects—linking government and market conditions to three-system coordination.
4.5.2. Dimension-Specific Associations of Government, Market, and Social Conditions
The global variance inflation factors (VIFs) for the government, market, and social condition indices are 1.44, 1.43, and 1.29, respectively. The baseline GTWR model (k = 51) achieves a global R2 of 0.8790 (adjusted R2 = 0.8751). Local multicollinearity is also not a concern: local VIFs do not exceed 2.13, and the maximum local condition number is 15.91 (Table 6). The residuals show no significant spatial autocorrelation (block-permutation Moran’s I test, p = 0.849), although temporal persistence remains (AR(1) ρ = 0.867). Ten-fold province-grouped cross-validation (three provinces held out per fold), spatially blocked cross-validation across six macro-regions, and temporally blocked validation (trained on 2011–2021 to predict 2022–2024) yield out-of-sample R2 values of 0.8271, 0.8320, and 0.8317, respectively, each benchmarked against the training-fold mean. The estimates are also robust to bandwidths between k = 35 and k = 90 (Appendix B, Table A1). Replacing coordinate degrees with spherical great-circle distances (in units of 100 km) under space–time scaling parameters τ ∈ {0.5, 1.0, 2.0} yields global R2 values of 0.8797–0.8830, and at τ = 1.0, the Spearman rank correlations of provincial mean coefficients with the baseline are 0.976 (government), 0.981 (market), and 0.984 (social). Table 6 reports local standard errors from both homoskedastic [39] and province-clustered estimators. All local coefficients for government and market conditions are positive and statistically significant under both, whereas 87.4% of the coefficients for social conditions are significant with homoskedastic standard errors and 67.4% with province-clustered standard errors. Reporting both homoskedastic and province-clustered local standard errors thus provides a rigorous benchmark for evaluating local estimation precision in the presence of temporal persistence.
Table 6.
Descriptive statistics of GTWR local regression coefficients.
All local coefficients for government conditions are positive (Table 6). Local coefficients for government conditions exhibit relatively large variation compared with those for market and social conditions, indicating an overall positive association with coupling coordination but substantial spatiotemporal differences in its strength. Multiyear mean coefficients are relatively high in Sichuan, Gansu, Qinghai, Chongqing, Ningxia, and Shaanxi and relatively low in Jilin, Liaoning, and Heilongjiang. Associations are therefore stronger in some central and western provinces and weaker in northeastern China. Over time, the national annual mean coefficient increased from 0.3128 in 2011 to 0.3233 in 2018, before declining to 0.3107 in 2024, following a modest rise-and-fall pattern.
The relatively high local coefficients in some central and western provinces may reflect considerable scope for improving digital infrastructure, agricultural production conditions, and rural public services, where incremental fiscal support and rural network expansion are closely linked to gains in digital adoption, production capacity, and risk-coping capability. Because GTWR coefficients capture marginal local sensitivity rather than absolute input levels, the lower coefficients in northeastern China indicate that incremental changes in government conditions have a smaller marginal association with coordination gains where foundational infrastructure is already established but industrial restructuring and demographic headwinds persist.
All local coefficients for market conditions are also positive. Local coefficients for market conditions exhibit the least variation among the three dimensions, indicating a relatively stable positive association with coupling coordination across regions and years. Multiyear mean coefficients are relatively high in Fujian, Guangdong, Hainan, Zhejiang, and Shanghai and lower in Sichuan, Chongqing, Henan, and Shaanxi. Associations are thus stronger in some southeastern coastal provinces and weaker in some central and western provinces. The national annual mean coefficient declined slightly from 0.3452 in 2011 to 0.3432 in 2013, then increased each year to 0.3675 in 2024.
Market conditions primarily comprise the marketization index and the agricultural land transfer rate. Higher local coefficients in some southeastern coastal provinces indicate closer links between marketization, the transfer of agricultural land-use rights, and coordination among the three systems, reflecting environments that more readily translate market mechanisms into changes in production organization, appropriately scaled farming operations, and digital technology adoption. Conversely, the comparatively lower coefficients in Sichuan, Chongqing, Henan, and Shaanxi suggest that this conversion process remains constrained by local industrial foundations, operator capabilities, and factor allocation efficiency.
Of the 420 local coefficients for social conditions, 417 (99.3%) are positive. Negative coefficients occur only in Hebei in 2020 and 2021 and Shanxi in 2022. Associations are therefore predominantly positive, with exceptions in a small number of places and years. Multiyear mean coefficients are relatively high in Jiangxi, Fujian, Jilin, Heilongjiang, Guangdong, and Liaoning and relatively low in Inner Mongolia, Ningxia, Qinghai, Hebei, Shanxi, and Gansu. This indicates stronger associations in parts of southeastern coastal and northeastern China and weaker associations in parts of northwestern and northern China. The national annual mean coefficient decreased gradually from 0.1578 in 2011 to 0.0920 in 2024, suggesting an overall weakening of the association between social conditions and coupling coordination.
Social conditions mainly comprise the social consumption level and agricultural socialized services. Higher local coefficients reflect closer connections between consumer demand, agricultural service provision, digital technology use, and rural risk response, whereas lower coefficients in some northwestern and northern provinces may relate to dispersed settlement patterns and longer service radii that limit the translation of consumer demand into agricultural upgrading. Over time, the gradual decline in the annual mean coefficient suggests that general consumption expansion and conventional service coverage alone increasingly fail to account for marginal coordination gains, highlighting the need for more specialized, digitalized, and value-chain-integrated agricultural socialized services.
Overall, the positive association between government conditions and coupling coordination exhibits pronounced spatial variation, whereas the positive association with market conditions is relatively stable. Local coefficients for social conditions are generally positive, but their national annual mean declines over time. Figure 8 shows the spatial distribution of the multiyear mean local coefficients for the three conditions.
Figure 8.
Spatial distribution of multiyear mean GTWR local coefficients for government, market, and social conditions, 2011–2024. Map approval number: GS (2022) 1873. Note: Class boundaries are determined using natural breaks across the 30 provincial multiyear mean GTWR local coefficient estimates (2011–2024); see Table 6 for local standard errors and statistical significance rates.
4.5.3. Spatiotemporal Characteristics of Composite Government, Market, and Social Conditions
The national mean of the composite government–market–society conditions index increased each year, from 0.1950 in 2011 to 0.3449 in 2018 and 0.4117 in 2024, indicating a sustained improvement in the overall level of external conditions during the study period. Across provinces, the standard deviation rose from 0.0746 to 0.1344 and the range widened from 0.2940 to 0.4437, whereas the coefficient of variation declined from 0.3827 to 0.3264 (Appendix B, Table A2).
The spatial distribution of provincial multiyear means for 2011–2024 reveals clear regional differences (Figure 9). Shanghai, Jiangsu, Beijing, Guangdong, Zhejiang, and Fujian have relatively high composite condition indices, as do some central provinces, including Hubei, Hunan, and Anhui. Qinghai, Yunnan, Ningxia, Inner Mongolia, and Xinjiang have relatively low values. Overall, the index is higher along the eastern coast, followed by central China, and lower in some western provinces. This distribution reflects regional differences in the combined foundations of government support, market allocation, and social services.
Figure 9.
Spatial distribution of the multiyear mean composite government–market–society conditions index, 2011–2024. Map approval number: GS (2022) 1873. Note: Class boundaries are determined using natural breaks across the 30 provincial multiyear mean composite condition index scores (2011–2024), depicting external condition levels rather than within-year percentile ranks.
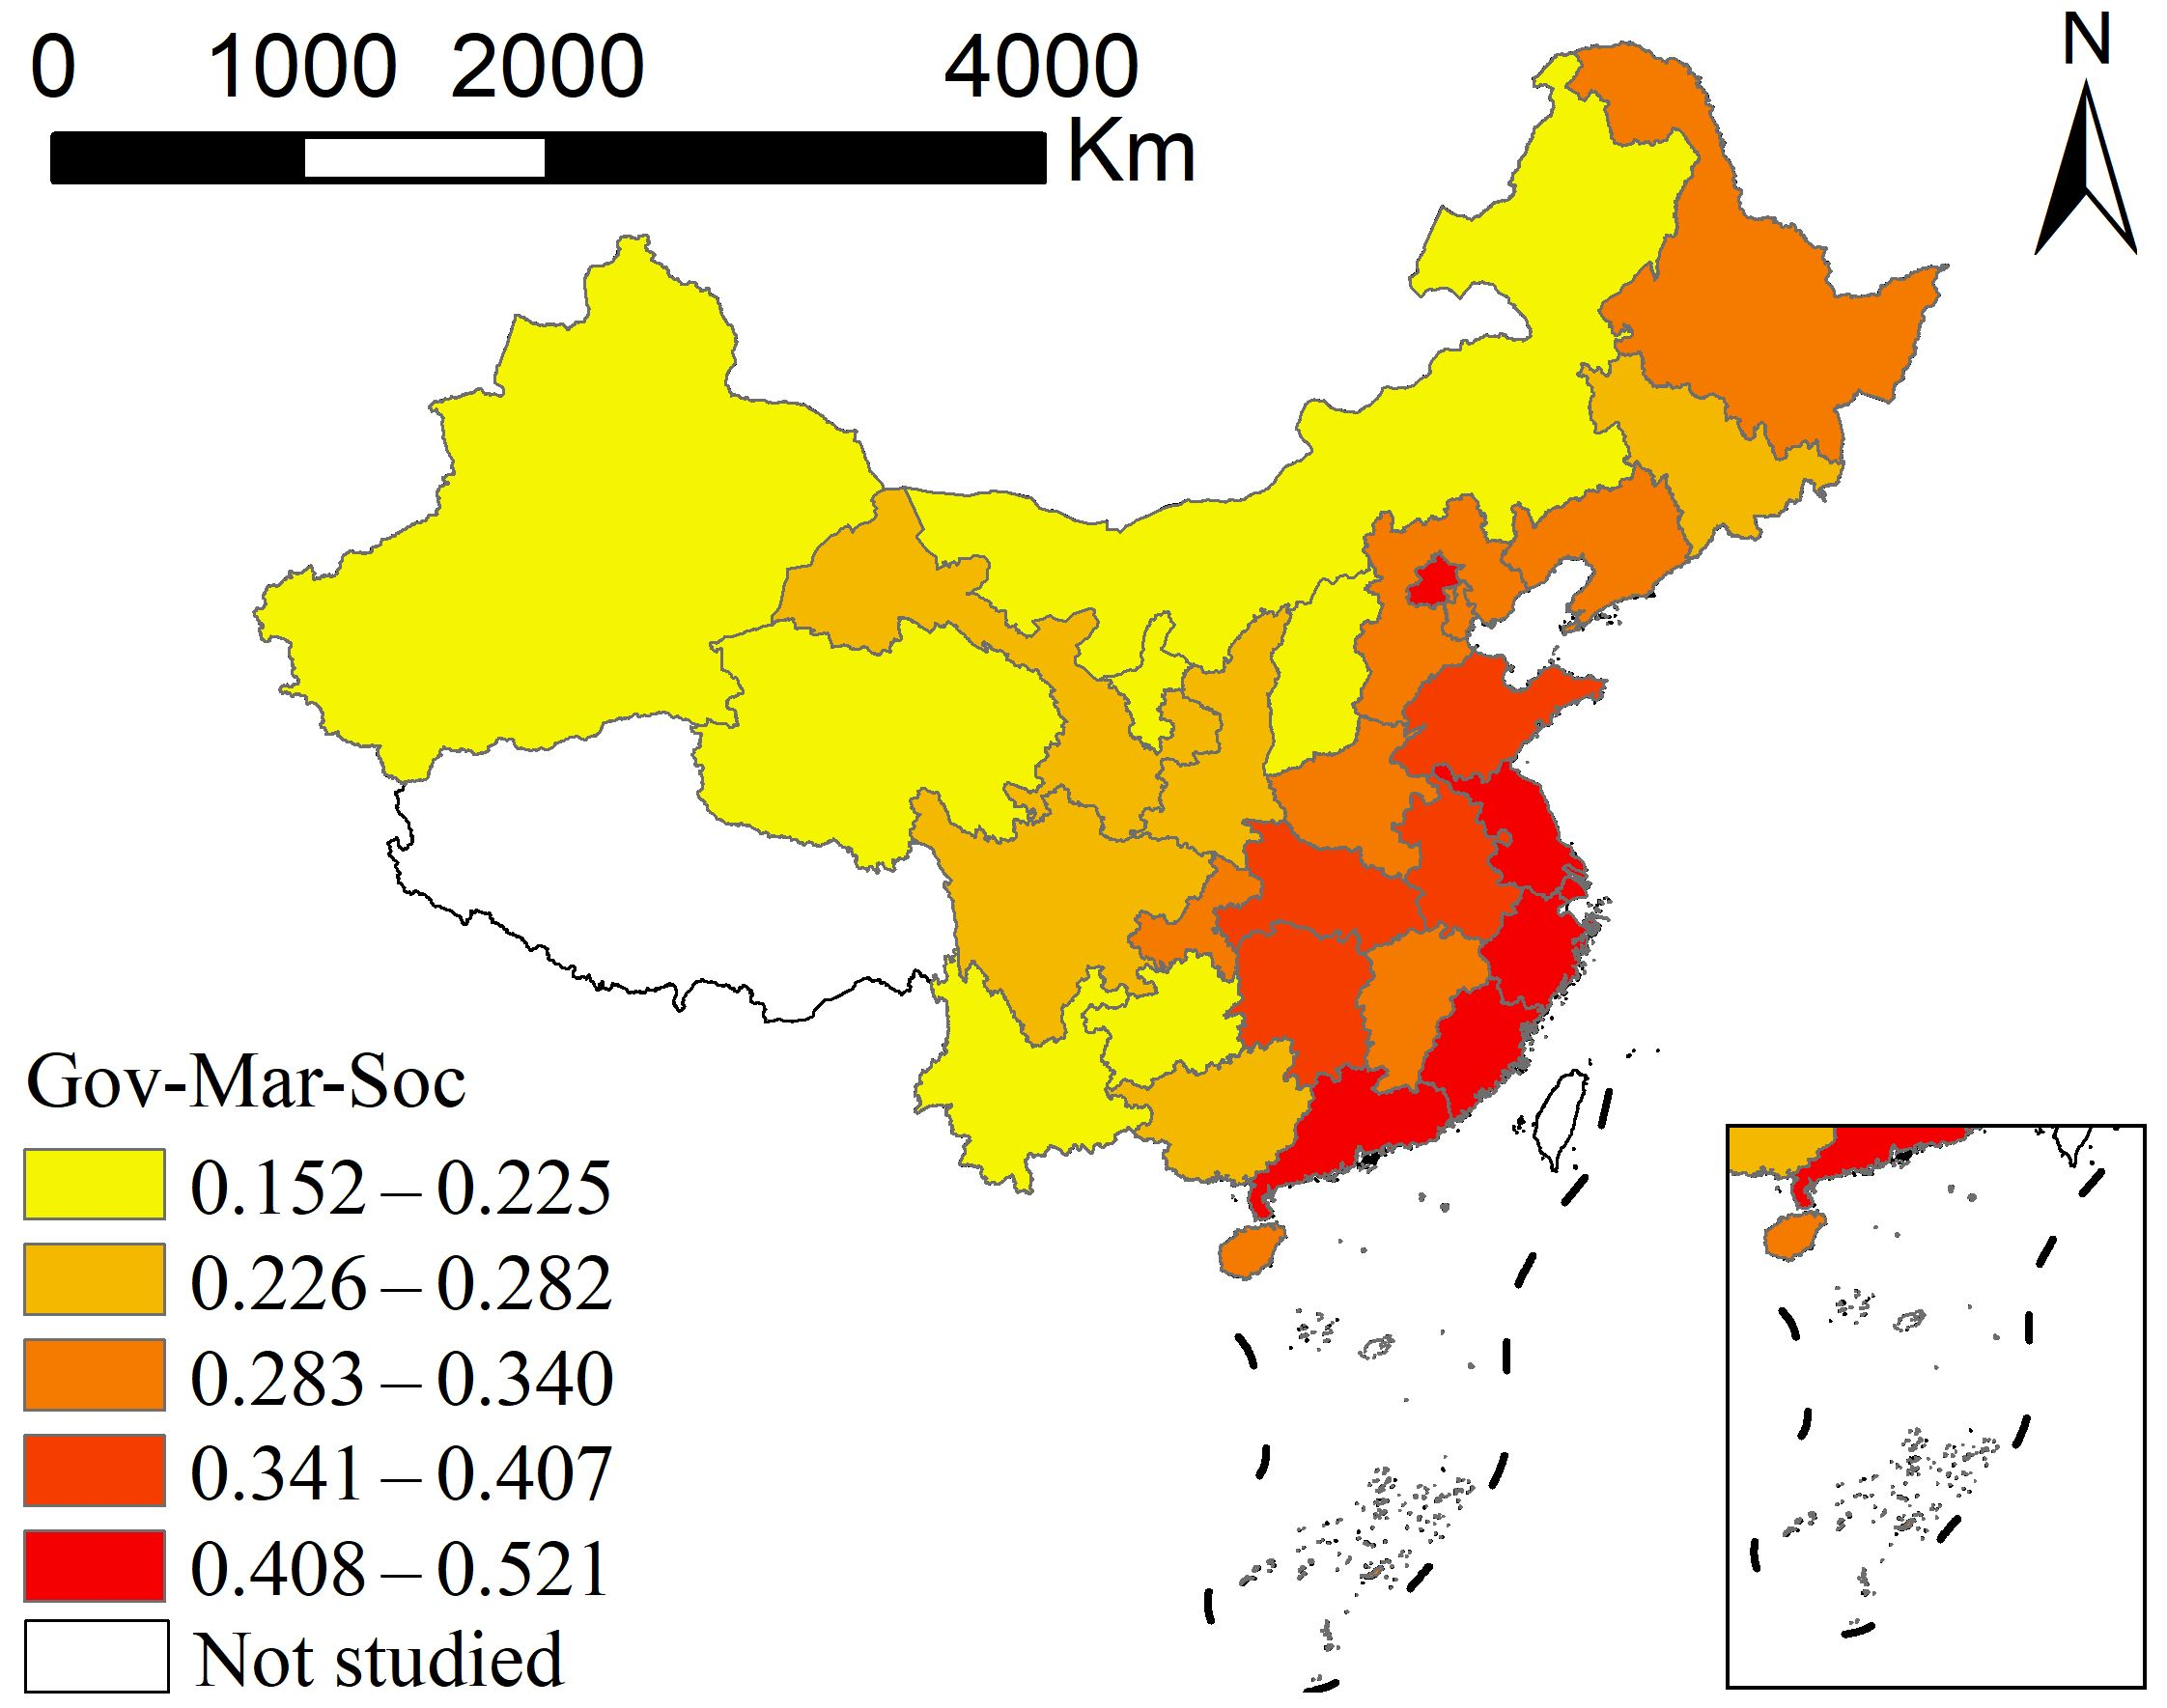
The dimension-specific results indicate different associations between external conditions and coupling coordination. Government coefficients are positive for every observation but vary relatively widely across space. Market coefficients are also uniformly positive and exhibit the smallest variation, indicating a relatively stable positive association. Social conditions are positively associated with coordination in most places and years, but the national annual mean association generally declines. The composite conditions index reflects the development foundations of the external environment, whereas GTWR coefficients reflect the strength of local associations between these conditions and coordination. Figure 10 summarizes these relationships.
Figure 10.
Framework of associations between government, market, and social conditions and coupling coordination among the three systems. Note: Adapted from Figure 9 in Xiong et al. [21], licensed under CC BY 4.0. The third subsystem, its dimensions, and the descriptions of associations with government, market, and social conditions have been modified.
5. Discussion
5.1. Comparison with Previous Studies
Consistent with prior studies linking digital village development to agricultural modernization and rural economic resilience [13,14,40], we find sustained improvements in subsystem development and coupling coordination alongside persistent eastern-led regional disparities. Extending beyond two-system assessments, our results further show that subsystem growth rates and provincial rankings diverged, and that the absolute gap between leading and lagging provinces widened even as relative dispersion narrowed.
Whereas recent three-system studies have paired digital village development and agricultural modernization with farmers’ objective well-being [21] or agricultural carbon emission efficiency [22], incorporating multidimensional rural resilience reveals that high agricultural modernization can coexist with relatively low resilience rankings in several provinces. Integrating rural development and security therefore requires aligning technological and industrial upgrading with industrial, ecological, cultural, organizational, and livelihood buffers.
When comparing these results with previous multi-system assessments [13,14,21,22], two points are relevant. First, because studies use different indicators and weighting schemes, differences in index levels across studies—and across the three subsystems in this study—partly reflect measurement choices rather than differences in actual capacity. Second, the rank mismatches observed in major grain-producing and pastoral provinces, such as Heilongjiang and Inner Mongolia, point to substantive tensions. Besides a lag in converting productive capacity into resilience, two explanations are plausible. Intensive modernization based on large-scale mechanization, monoculture, and high agrochemical inputs can raise output efficiency while increasing ecological pressure and exposure to market and climatic fluctuations. In addition, national food-security strategies assign major agricultural provinces a leading role in grain production, whereas the fiscal and public-service investments that support organizational, cultural, and healthcare resilience remain concentrated in eastern regions. High modernization alongside relatively low resilience may therefore reflect regional specialization and the uneven provision of non-agricultural public goods rather than a failure of agricultural modernization itself.
The results for external conditions differ between the panel and local models. In the TWFE estimates, government and market conditions are positively associated with coupling coordination, with the market association marginally significant under small-sample inference, whereas social conditions show no significant association; in the GTWR model, most local coefficients for social conditions are positive, but their national annual mean declines. These results are not directly comparable. The TWFE model removes time-invariant provincial differences and common time trends, so its within-R2 (0.045) reflects only within-province variation, whereas the GTWR model is estimated on undemeaned data, and its global R2 (0.8790) largely reflects cross-sectional level differences and shared trends. Likewise, predominantly positive local coefficients for social conditions describe the direction of local associations; they do not imply significance everywhere (12.6% are not significant even with homoskedastic standard errors) and do not contradict the insignificant TWFE estimate, which is identified only from within-province changes.
5.2. Theoretical and Practical Implications
The theoretical contribution of this study lies in translating the perspective of integrating rural development and security into an analytical framework linking technological conditions, industrial foundations, and resilience capacities. Digital village development and agricultural modernization provide technological and industrial support, respectively, while rural resilience reflects the security requirements of rural development through the capacity to maintain basic functions, cope with shocks, adapt to change, and transform. Within this framework, development provides resources and opportunities for building resilience capacities, while resilience needs provide feedback and guide and constrain technological development and industrial transformation. Comparisons of relative provincial development positions show that the advantages of the three systems do not fully overlap. This suggests that integrating development and security requires attention to alignment among different capacities, alongside growth within individual systems. By bringing technological, industrial, and resilience capacities into a common assessment framework, this study offers a perspective for understanding coordination between rural development and security.
More broadly, our findings connect to research on resource-nexus trade-offs and multi-objective decision-making in agricultural systems. Advancing digital infrastructure, expanding agricultural production, and conserving ecological and social buffers often compete for limited fiscal, land, water, and labor resources, so coordination should not be treated as an unconditional objective. Two-stage multi-objective frameworks developed for the agricultural water–energy–food nexus show how such trade-offs can be structured and how compromise solutions robust to stakeholder preferences can be identified [41]; combining such frameworks with the diagnostics developed here is a promising direction for future research.
The practical contribution of this study is to provide a basis for identifying regional differences relevant to differentiated governance. Coordination levels, relative development positions, and the combined foundations of government, market, and social conditions constitute important dimensions of regional variation. Regional diagnosis can combine coordination levels, subsystem weaknesses, and external conditions: the coupling coordination degree describes the overall state; comparisons of development positions identify relatively weak subsystems; and external condition indices and local association analyses identify conditions warranting further attention. In applying this diagnostic framework, because discrete coordination categories are sensitive to indicator weighting rules, policy evaluation and resource allocation should rely on continuous index trajectories and relative subsystem rank gaps rather than rigid category cut-offs (such as the 0.500 threshold). This approach brings digital village development, agricultural modernization, and rural resilience enhancement into a common framework for regional analysis, informing place-based rural development policies that reflect regional differences in subsystem strengths, weaknesses, and external conditions.
6. Conclusions and Policy Recommendations
6.1. Main Conclusions
Using panel data for 30 Chinese provinces from 2011 to 2024, this study examines the development levels and coupling coordination of digital village development, agricultural modernization, and rural resilience, together with their associations with government, market, and social conditions, from the perspective of integrating rural development and security. The main conclusions are as follows.
(1) Development levels increased continuously across all three subsystems, but the magnitudes of improvement and spatial distributions differed. The national mean indices of digital village development, agricultural modernization, and rural resilience increased from 0.082, 0.083, and 0.273 in 2011 to 0.318, 0.207, and 0.486 in 2024, respectively. Under the measurement framework adopted here, digital village development showed the largest relative increase (286.1%), followed by agricultural modernization (148.5%) and rural resilience (77.7%); because the three indices are constructed from different indicators and weights, their levels are not directly comparable across systems. High values of digital village development and rural resilience were mainly located along the eastern coast and in selected centrally administered municipalities, while high agricultural modernization values were also found in some northern agricultural regions. Comparisons of relative provincial positions revealed mismatches in relative development positions between digital village development or agricultural modernization and rural resilience. In 2024, five provinces combined relatively high digital village development with relatively low rural resilience, while seven combined relatively high agricultural modernization with relatively low rural resilience.
(2) Coupling coordination among the three systems improved overall, but regional disparities persisted. The national mean coupling coordination degree increased from 0.336 in 2011 to 0.545 in 2024, entering the barely coordinated development stage in 2022 under the baseline weighting scheme. By 2024, the number of provinces at or above 0.500 had increased to 21, with high values mainly located along the eastern coast and in selected centrally administered municipalities. The difference between the highest and lowest values increased from 0.252 to 0.346, indicating that overall coordination improved while the absolute gap between the highest- and lowest-value provinces widened. These upward trends and provincial rankings are robust to alternative weights, whereas category transitions, such as the year of entering the ‘barely coordinated’ stage, depend on the weighting scheme and are best read as indicative benchmarks.
(3) Government, market, and social conditions exhibited different associations with coupling coordination among the three systems. TWFE results showed positive associations for government and market conditions after controlling for province and year fixed effects (statistically significant for government conditions and significant to marginally significant for market conditions, depending on the inference method), whereas the association for social conditions was not statistically significant. GTWR results showed pronounced spatial variation in local associations for government conditions, with higher coefficients mainly found in some central and western provinces. Positive associations for market conditions were relatively stable. Local coefficients for social conditions were positive in most provinces and years, but their national annual mean generally declined. Meanwhile, the composite government–market–society conditions index increased continuously, with higher values along the eastern coast, followed by central China, and lower values in some western provinces.
6.2. Policy Recommendations
Integrating rural development and security requires linking digital technology applications, agricultural industrial upgrading, and resilience capacity building, while tailoring policies to regional coordination levels, relative weaknesses, and external conditions. Based on these findings, the following recommendations are proposed.
(1) Incorporate resilience capacity building into joint planning for digital village development and agricultural modernization. Digital infrastructure should be translated into practical applications in agricultural production, business management, marketing and distribution, public services, and risk governance, alongside support for agricultural operators, industry chain connections, and agricultural service provision. Project planning and evaluation should jointly address production efficiency, industrial stability, ecological adaptation, organizational response, cultural continuity, and livelihood security, enabling technological and industrial development to better support rural risk-coping and adaptive capacities. Cross-departmental project coordination and evaluation mechanisms could jointly assess subsystem development levels, relative positions, and changes in weaknesses. Specifically, policy implementation can be evaluated by tracking whether the provincial rank mismatches identified in Section 4.4.2 narrow over subsequent planning cycles, alongside concrete monitoring indicators such as agricultural insurance density and credit coverage (industrial and management buffers), livestock manure utilization and agrochemical reduction (ecological resilience), village planning and improvement implementation (organizational resilience), and village healthcare staffing and urban–rural income ratios (livelihood resilience).
(2) Set development priorities according to regional foundations and differences among systems. Consistent with our GTWR findings that market conditions exhibit strong positive associations in southeastern coastal provinces whereas government conditions show stronger associations in central and western regions, interventions should be tailored to regions at different stages of development: high-coordination eastern coastal provinces and municipalities could prioritize deeper market-driven integration of digital technologies with agricultural management, green transformation, and risk management; intermediate-stage central and northern agricultural provinces—particularly major grain-producing provinces exhibiting high agricultural modernization but lagging resilience—could prioritize agro-ecological restoration, risk-sharing financial instruments, and specialized socialized services; and lower-coordination western provinces could prioritize targeted fiscal investments in foundational digital infrastructure, basic public services, and disaster-prevention capacity, selecting suitable applications based on local ecological resources and distinctive industries. Provinces with relatively high agricultural modernization but relatively low rural resilience should further identify specific weaknesses across industrial, ecological, cultural, organizational, and livelihood dimensions. To link macro-regional diagnostics with targeted local delivery, provincial governments can use these province-level rankings as a first-stage screening tool and pair them with county-, village-, and household-level assessments when allocating project funds to specific rural communities.
(3) Coordinate government support, market-based resource allocation, and agricultural service provision. Government support should coordinate investment in digital infrastructure, agricultural production conditions, and public services according to regional development stages. Market development should improve agricultural factor allocation and market connections, strengthening linkages among capital, technology, data, and agricultural operators. Given the declining local association between general social conditions and coupling coordination observed in our empirical analysis, agricultural service provision should move beyond aggregate scale expansion to respond to the practical needs of smallholders, cooperative organizations, and new types of agricultural business entities by improving the specialization, digitalization, and accessibility of agricultural socialized services. Policy implementation and evaluation should jointly address improvements in conditions, actual service utilization rates, and household-level risk-coping outcomes, enabling external support to better connect with local technology applications, industrial development, and risk governance.
6.3. Limitations and Future Research
This study uses province-level aggregate statistics to characterize overall development trends and interprovincial differences across the three systems. Its coverage of within-province variation and microlevel characteristics, including farmers’ digital literacy, risk perceptions, and social networks, remains limited. These province-level relative rankings do not directly identify village-level weaknesses or specific local planning needs. Future research could combine county- and village-level data with household survey data to examine relationships among technology applications, industrial development, and resilience capacities at different scales. Regarding measurement, coordination categories are relatively sensitive to weighting schemes. Further research could compare how indicator selection, weighting methods (including expert-based weights), alternative aggregation approaches such as distance-to-frontier or benefit-of-the-doubt models, and classification criteria affect evaluation results. Regarding empirical identification, our TWFE and GTWR models are designed to characterize macro-level conditional associations and spatiotemporal heterogeneity across provinces rather than unidirectional causal effects or micro-level feedback loops. Because major rural strategies were implemented nationwide and the 30-province panel spans 14 years, future research seeking quasi-experimental causal identification or direct tests of dynamic feedback can move to the county scale by exploiting staggered policy pilots—such as the national digital village pilot areas designated in 2020—alongside natural-disaster or market shocks to investigate how external conditions and feedback operate across the three systems.
Author Contributions
Conceptualization, Y.L.; methodology, H.L. and Z.W.; investigation, T.T.; data curation, Y.L.; formal analysis, T.T., H.L. and Z.W.; visualization, Z.W.; writing—original draft preparation, Y.L.; writing—review and editing, Y.L., H.L. and Z.W.; supervision, S.W.; project administration, S.W. and Z.W. All authors have read and agreed to the published version of the manuscript.
Funding
This research was funded by the National Social Science Foundation of China Education Project “Digital Empowerment for the Localized Growth of Rural Teachers in Western China”, grant number CHA230314.
Data Availability Statement
The data were compiled from the public sources listed in Table 1 and Section 3.3. The compiled provincial panel dataset (2011–2024, N = 420) and the code used to compute the indices and models are available from the corresponding author upon reasonable request.
Acknowledgments
We are grateful to all participants in this study.
Conflicts of Interest
The authors declare no conflicts of interest.
Appendix A. Data Compilation, Normalization, and Entropy Weighting
All 39 indicators (33 subsystem indicators in Table 1 and 6 external condition indicators in Table 3) cover 2011–2024 for the 30 sample provinces and are compiled from the sources listed in Table 1 and Section 3.3 (statistical yearbook editions 2012–2025, reporting 2011–2024 data). A small number of missing values in a few series were filled by linear interpolation between adjacent years or, at the ends of a series, by trend extrapolation, so that all 420 province-year observations are available; indicator definitions were kept consistent across years. Ratio and structural share indicators are unit-free; monetary indicators are expressed in current CNY as published, and common price effects across years are absorbed by year fixed effects in the panel regressions and eliminated in within-year percentile rank comparisons.
To establish a common intertemporal benchmark that preserves both cross-sectional disparities and longitudinal growth trajectories, min–max normalization is conducted across the pooled panel of N = 420 province-year observations (30 provinces over 2011–2024). Specifically, if normalization were performed separately within each year, annual national means would be artificially rescaled around a similar midpoint each year, obscuring temporal progress over the 14-year period. Let xitj denote the raw value of indicator j for province i in year t. For positive indicators, the normalized value zitj ∈ [0, 1] is computed as , and for negative indicators as , where min(xj) and max(xj) are the minimum and maximum values of indicator j across all 420 observations. Next, within each subsystem containing m indicators, the indicator proportion is , the information entropy is , the information utility is dj = 1 − ej, and the entropy weight is . For observations where zitj = 0 (and thus pitj = 0), we apply the standard information-theoretic limit (verified to yield weights and index scores identical to a 10−8 zero-shift adjustment to six decimal places). The composite index for each subsystem is then obtained as the weighted sum . Keeping normalization parameters and indicator weights fixed across the full study period ensures consistent comparability across provinces and years. In the first stage of external conditions weighting, the entropy weights are 0.4201 (fiscal support for agriculture) and 0.5799 (rural digitalization) for government conditions, 0.3572 (marketization index) and 0.6428 (agricultural land transfer rate) for market conditions, and 0.1977 (social consumption level) and 0.8023 (agricultural socialized services) for social conditions.
Appendix B. Additional Tables
Table A1 reports GTWR diagnostics across candidate bandwidths (Section 3.2.3), Table A2 reports annual summary statistics (Section 4.4.1), and Table A3 reports the leave-one-indicator-out results (Section 4.4.3).
Table A1.
GTWR diagnostics and national mean local coefficients across candidate bandwidths.
Local standard errors for Table 6 of the main text: For target observation (i, t), the local estimator is β^(i, t) = City with Cit = (XTWitX)−1XTWit. Homoskedastic local standard errors are SEhomo = [σ^2(CitCitT)jj]1/2, with σ^2 = RSS/ν1 and ν1 = N − 2tr(S) + tr(STS) = 401.22 (tr(S) = 13.21; tr(STS) = 7.64). Province-clustered local sandwich standard errors are SEcluster = {G/(G − 1)[Cit(ΣgegegT)CitT]jj}1/2, evaluated against t(29). Significance criteria: unadjusted p < 0.05 (|t| > 1.966); Benjamini–Hochberg FDR q < 0.05; effective-number-of-parameters adjustment αadj = 0.05/[tr(S)/p] = 0.0151 (|t| > 2.439); province-clustered t(29) at p < 0.05.
Table A2.
Annual summary statistics of coupling coordination and external conditions (2011–2024).
Table A3.
Leave-one-indicator-out sensitivity of the coupling coordination degree (33 indicators).
References
- FAO; IFAD; UNICEF; WFP; WHO. The State of Food Security and Nutrition in the World 2025: Addressing High Food Price Inflation for Food Security And Nutrition; FAO: Rome, Italy, 2025. [Google Scholar]
- IPCC. Climate Change 2023: Synthesis Report. Contribution of Working Groups I, II and III to the Sixth Assessment Report of the Intergovernmental Panel on Climate Change; IPCC: Geneva, Switzerland, 2023; pp. 35–115. [Google Scholar]
- National Bureau of Statistics of China. Statistical Communiqué of the People’s Republic of China on the 2024 National Economic and Social Development. 28 February 2025. Available online: https://www.stats.gov.cn/sj/zxfb/202502/t20250228_1958817.html (accessed on 10 July 2026). (In Chinese)
- Mao, Z.; Zhu, X.; Zou, Q.; Jin, W. How Can Digital Villages Improve Basic Public Services Delivery in Rural Areas? Evidence from 1840 Counties in China. Agriculture 2024, 14, 1802. [Google Scholar] [CrossRef] [Scilit]
- He, Z.; Chen, M.; Gu, D. How digital village construction affects to the effectiveness of rural governance?—Research on the NCA and QCA methods. Cities 2025, 156, 105514. [Google Scholar] [CrossRef] [Scilit]
- Roberts, E.; Anderson, B.A.; Skerratt, S.; Farrington, J. A review of the rural-digital policy agenda from a community resilience perspective. J. Rural Stud. 2017, 54, 372–385. [Google Scholar] [CrossRef] [Scilit]
- Klerkx, L.; Jakku, E.; Labarthe, P. A review of social science on digital agriculture, smart farming and agriculture 4.0: New contributions and a future research agenda. NJAS—Wagening. J. Life Sci. 2019, 90–91, 100315. [Google Scholar]
- Fang, D.; Chen, J.; Wang, S.; Chen, B. Can agricultural mechanization enhance the climate resilience of food production? Evidence from China. Appl. Energy 2024, 373, 123928. [Google Scholar] [CrossRef] [Scilit]
- Zhang, Y.; Shang, J.; Yu, Z. The impact of modern agricultural technology promotion and adoption on agri-food system resilience. Front. Nutr. 2025, 12, 1677104. [Google Scholar] [CrossRef] [Scilit]
- Qiu, M.; Liu, D.; Liu, Y. A theoretical framework and measurement system for rural resilience. China Land Sci. 2021, 35, 107–114. (In Chinese) [Google Scholar]
- Meuwissen, M.P.M.; Feindt, P.H.; Spiegel, A.; Termeer, C.J.A.M.; Mathijs, E.; de Mey, Y.; Finger, R.; Balmann, A.; Wauters, E.; Urquhart, J.; et al. A framework to assess the resilience of farming systems. Agric. Syst. 2019, 176, 102656. [Google Scholar] [CrossRef] [Scilit]
- Folke, C. Resilience: The emergence of a perspective for social-ecological systems analyses. Glob. Environ. Change 2006, 16, 253–267. [Google Scholar] [CrossRef] [Scilit]
- Su, F.; Wu, B.; Zhang, P.; Cao, Y. Spatiotemporal evolution and driving mechanisms of coupling coordination between digital village development and rural economic resilience. Prog. Geogr. 2025, 44, 1434–1451. (In Chinese) [Google Scholar]
- Zhao, Y.; Zhao, X.; Yang, J. Coupling Coordination and Influencing Factors Between Digital Village Development and Agricultural and Rural Modernization: Evidence from China. Agriculture 2024, 14, 1901. [Google Scholar] [CrossRef] [Scilit]
- Zhao, X.; Zhao, R. The Impact and Mechanism of Digital Villages on Agricultural Resilience in Ecologically Fragile Ethnic Areas: Evidence from China’s Provinces. Agriculture 2024, 14, 221. [Google Scholar] [CrossRef] [Scilit]
- Cao, Y.; Teng, F. Boosting county economic resilience through digital villages: The dual role of innovation capacity and fiscal investment. Transform. Bus. Econ. 2026, 25, 118–141. [Google Scholar] [CrossRef] [Scilit]
- Jiang, G.; Zhu, T. Construction and empirical application of an indicator system for rural resilience in China. Stat. Decis. 2024, 40, 75–80. (In Chinese) [Google Scholar]
- Yang, M.; Jiao, M.; Zhang, J. Spatio-Temporal Analysis and Influencing Factors of Rural Resilience from the Perspective of Sustainable Rural Development. Int. J. Environ. Res. Public Health 2022, 19, 12294. [Google Scholar] [CrossRef] [Scilit]
- Gan, Z.; Chen, J.; Li, Y.; Zhang, Y.; Zhu, M.; Li, D. Spatial differentiation and obstacle factors of rural resilience at the village scale: Empirical evidence from Qianshan City, Anhui Province, China. Sustainability 2026, 18, 2440. [Google Scholar] [CrossRef] [Scilit]
- Li, H.; Jin, X.; Liu, J.; Feng, D.; Xu, W.; Zhou, Y. Analytical framework for integrating resources, morphology, and function of rural system resilience—An empirical study of 386 villages. J. Clean. Prod. 2022, 365, 132738. [Google Scholar] [CrossRef] [Scilit]
- Xiong, C.; Jiang, D.; Fan, R. Technology Empowerment, Industrial Support, and Welfare Orientation: Coupling Coordination and Synergistic Evolution Mechanisms of Digital Villages, Agricultural Modernization, and Farmers’ Objective Well-Being. Sustainability 2026, 18, 4674. [Google Scholar] [CrossRef] [Scilit]
- Xiong, C.; Fan, R.; Jiang, D. Spatiotemporal Evolution and Driving Factors of the Coupling Coordination Among Digital Village Development, Agricultural Modernization, and Agricultural Carbon Emission Efficiency: An Empirical Study Based on a Triple-System Coupling and GTWR Model. Agriculture 2026, 16, 1135. [Google Scholar] [CrossRef] [Scilit]
- Willett, J. Place-based rural development: A role for complex adaptive region assemblages? J. Rural Stud. 2023, 97, 583–590. [Google Scholar] [CrossRef] [Scilit]
- Yu, L.; Zhao, D.; Xue, Z.; Gao, Y. Research on the use of digital finance and the adoption of green control techniques by family farms in China. Technol. Soc. 2020, 62, 101323. [Google Scholar] [CrossRef] [Scilit]
- Ma, W.; Rahut, D.B.; Sonobe, T.; Gong, B. Linking farmers to markets: Barriers, solutions, and policy options. Econ. Anal. Policy 2024, 82, 1102–1112. [Google Scholar] [CrossRef] [Scilit]
- Beel, D.E.; Wallace, C.D.; Webster, G.; Nguyen, H.; Tait, E.; Macleod, M.; Mellish, C. Cultural resilience: The production of rural community heritage, digital archives and the role of volunteers. J. Rural Stud. 2017, 54, 459–468. [Google Scholar] [CrossRef] [Scilit]
- Ingram, J.; Maye, D. What Are the Implications of Digitalisation for Agricultural Knowledge? Front. Sustain. Food Syst. 2020, 4, 66. [Google Scholar] [CrossRef] [Scilit]
- Jensen, N.; Barrett, C. Agricultural Index Insurance for Development. Appl. Econ. Perspect. Policy 2017, 39, 199–219. [Google Scholar] [CrossRef] [Scilit]
- Wulandhari, N.B.I.; Gölgeci, I.; Mishra, N.; Sivarajah, U.; Gupta, S. Exploring the role of social capital mechanisms in cooperative resilience. J. Bus. Res. 2022, 143, 375–386. [Google Scholar] [CrossRef] [Scilit]
- Kapucu, N.; Hawkins, C.V.; Rivera, F.I. Disaster preparedness and resilience for rural communities. Risk Hazards Crisis Public Policy 2013, 4, 215–233. [Google Scholar] [CrossRef] [Scilit]
- Cox, R.S.; Hamlen, M. Community disaster resilience and the Rural Resilience Index. Am. Behav. Sci. 2015, 59, 220–237. [Google Scholar] [CrossRef] [Scilit]
- Skerratt, S. Enhancing the analysis of rural community resilience: Evidence from community land ownership. J. Rural Stud. 2013, 31, 36–46. [Google Scholar] [CrossRef] [Scilit]
- Zhou, Y.; Gu, H. Enhancing rural resilience through the rural revitalisation strategy in rural China: Evidence from Wushi Village, Hunan Province. J. Rural Stud. 2025, 113, 103493. [Google Scholar] [CrossRef] [Scilit]
- Daskon, C.D. Cultural resilience—The roles of cultural traditions in sustaining rural livelihoods: A case study from rural Kandyan villages in Central Sri Lanka. Sustainability 2010, 2, 1080–1100. [Google Scholar] [CrossRef] [Scilit]
- McManus, P.; Walmsley, J.; Argent, N.; Baum, S.; Bourke, L.; Martin, J.; Pritchard, B.; Sorensen, T. Rural community and rural resilience: What is important to farmers in keeping their country towns alive? J. Rural Stud. 2012, 28, 20–29. [Google Scholar] [CrossRef] [Scilit]
- Nong, W.; Wen, J.; He, J. Spatial-Temporal Variations and Driving Factors of the Coupling and Coordination Level of the Digital Economy and Sustainable Rural Development: A Case Study of China. Agriculture 2024, 14, 849. [Google Scholar] [CrossRef] [Scilit]
- Xiong, C.; Zhou, X.; Liu, F. Assessment of the synergistic effect of digital villages, green agriculture and farmers’ well-being in China. Sci. Rep. 2026, 16, 5079. [Google Scholar]
- Guo, F.; Wang, J.; Wang, F.; Kong, T.; Zhang, X.; Cheng, Z. Measuring China’s digital financial inclusion: Index construction and spatial characteristics. China Econ. Q. 2020, 19, 1401–1418. (In Chinese) [Google Scholar]
- Huang, B.; Wu, B.; Barry, M. Geographically and temporally weighted regression for modeling spatio-temporal variation in house prices. Int. J. Geogr. Inf. Sci. 2010, 24, 383–401. [Google Scholar] [CrossRef] [Scilit]
- Deng, S.; Zheng, W. Coupling coordination and sustainable improvement path of digital village and rural economic resilience at county level in Hunan Province. Sustainability 2026, 18, 5269. [Google Scholar] [CrossRef] [Scilit]
- Yang, G.; Xia, S.; Huo, L.; Li, M.; Zhang, C.; Su, Y.; Guo, D. Two-Stage Multiobjective Decision-Making Method Based on Agricultural Water-Energy-Food Nexus: Case Study in Hetao Irrigation District, China. J. Water Resour. Plan. Manag. 2023, 149, 05023006. [Google Scholar] [CrossRef] [Scilit]
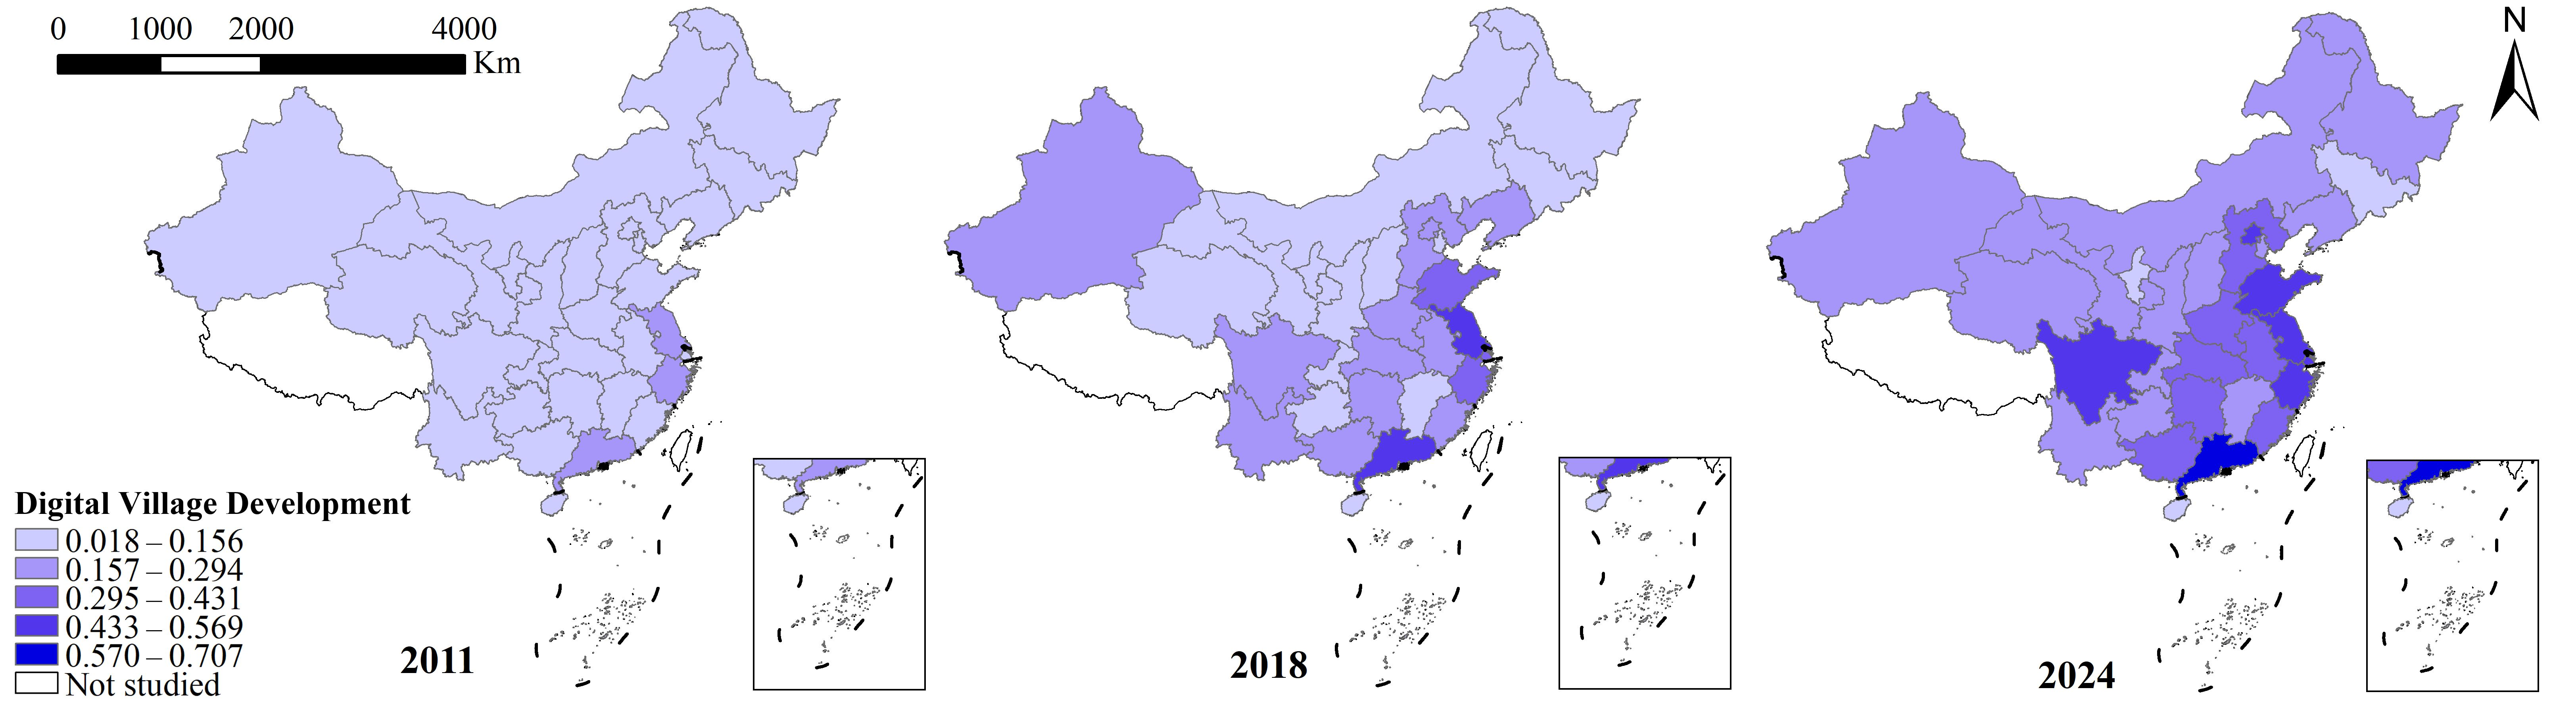
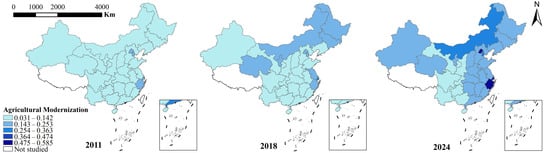
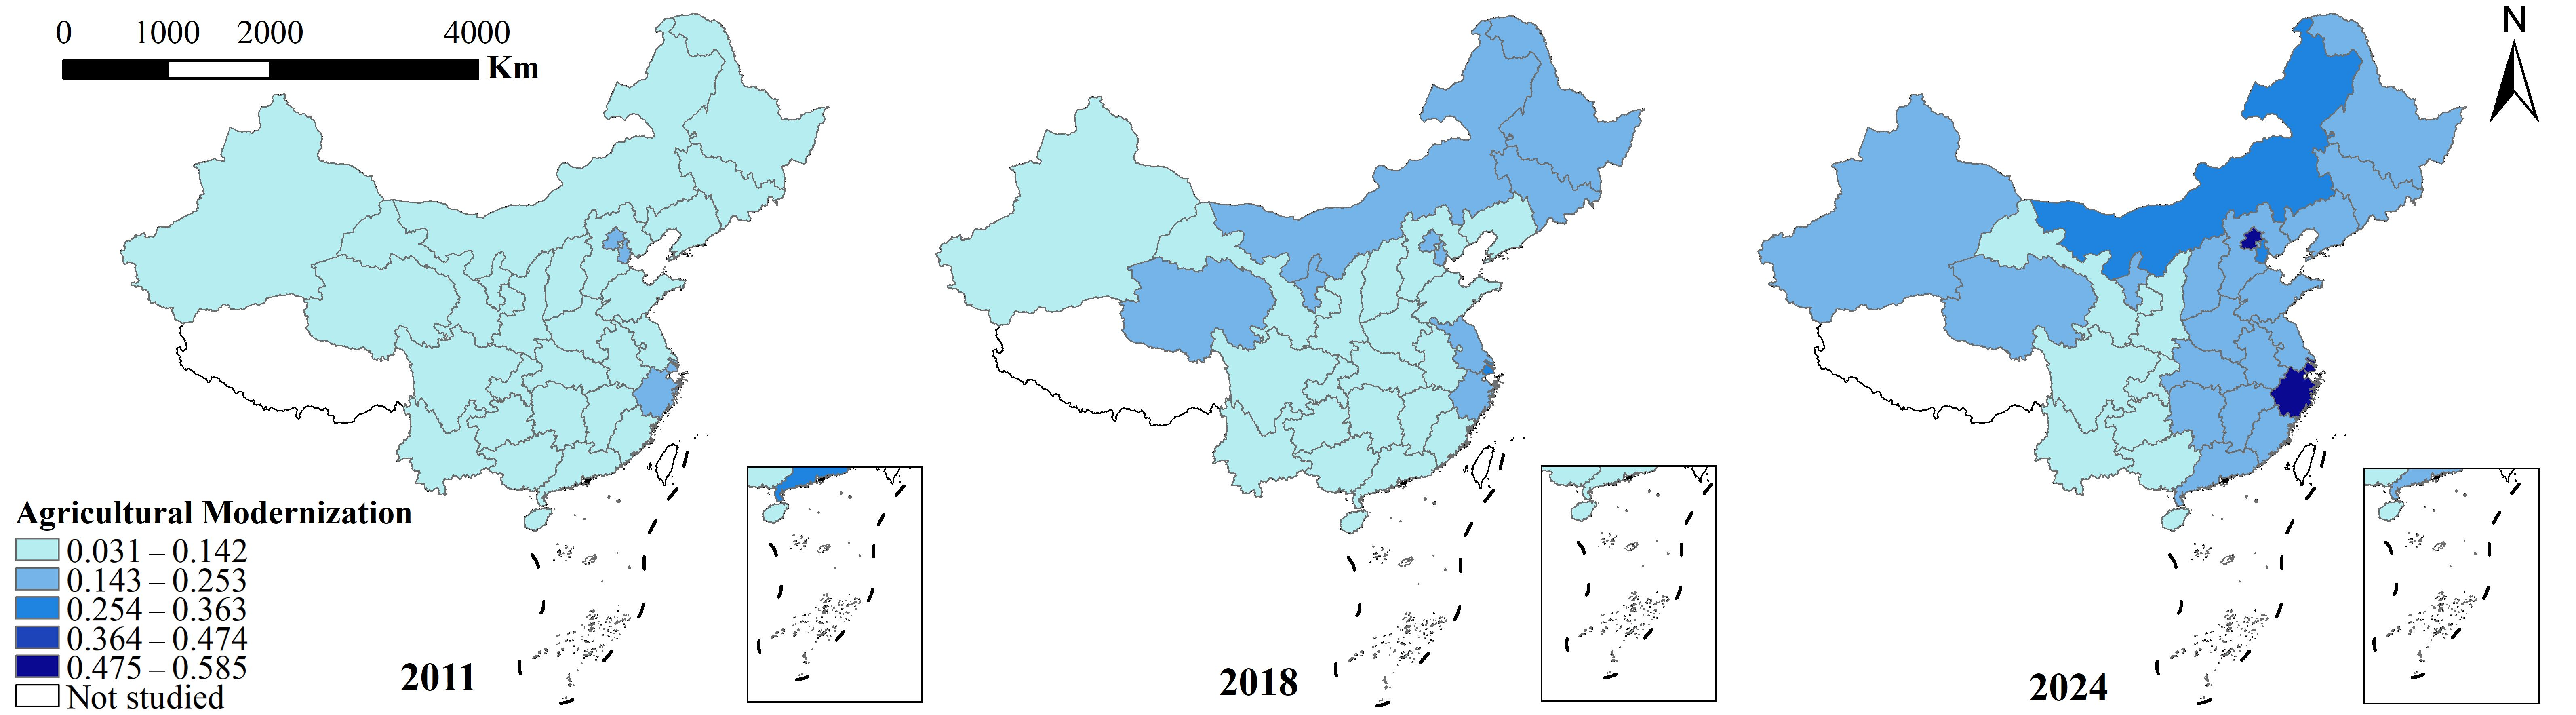
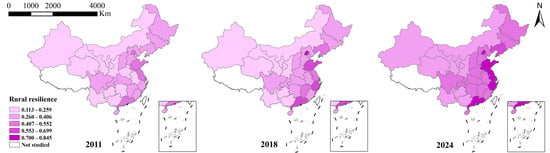
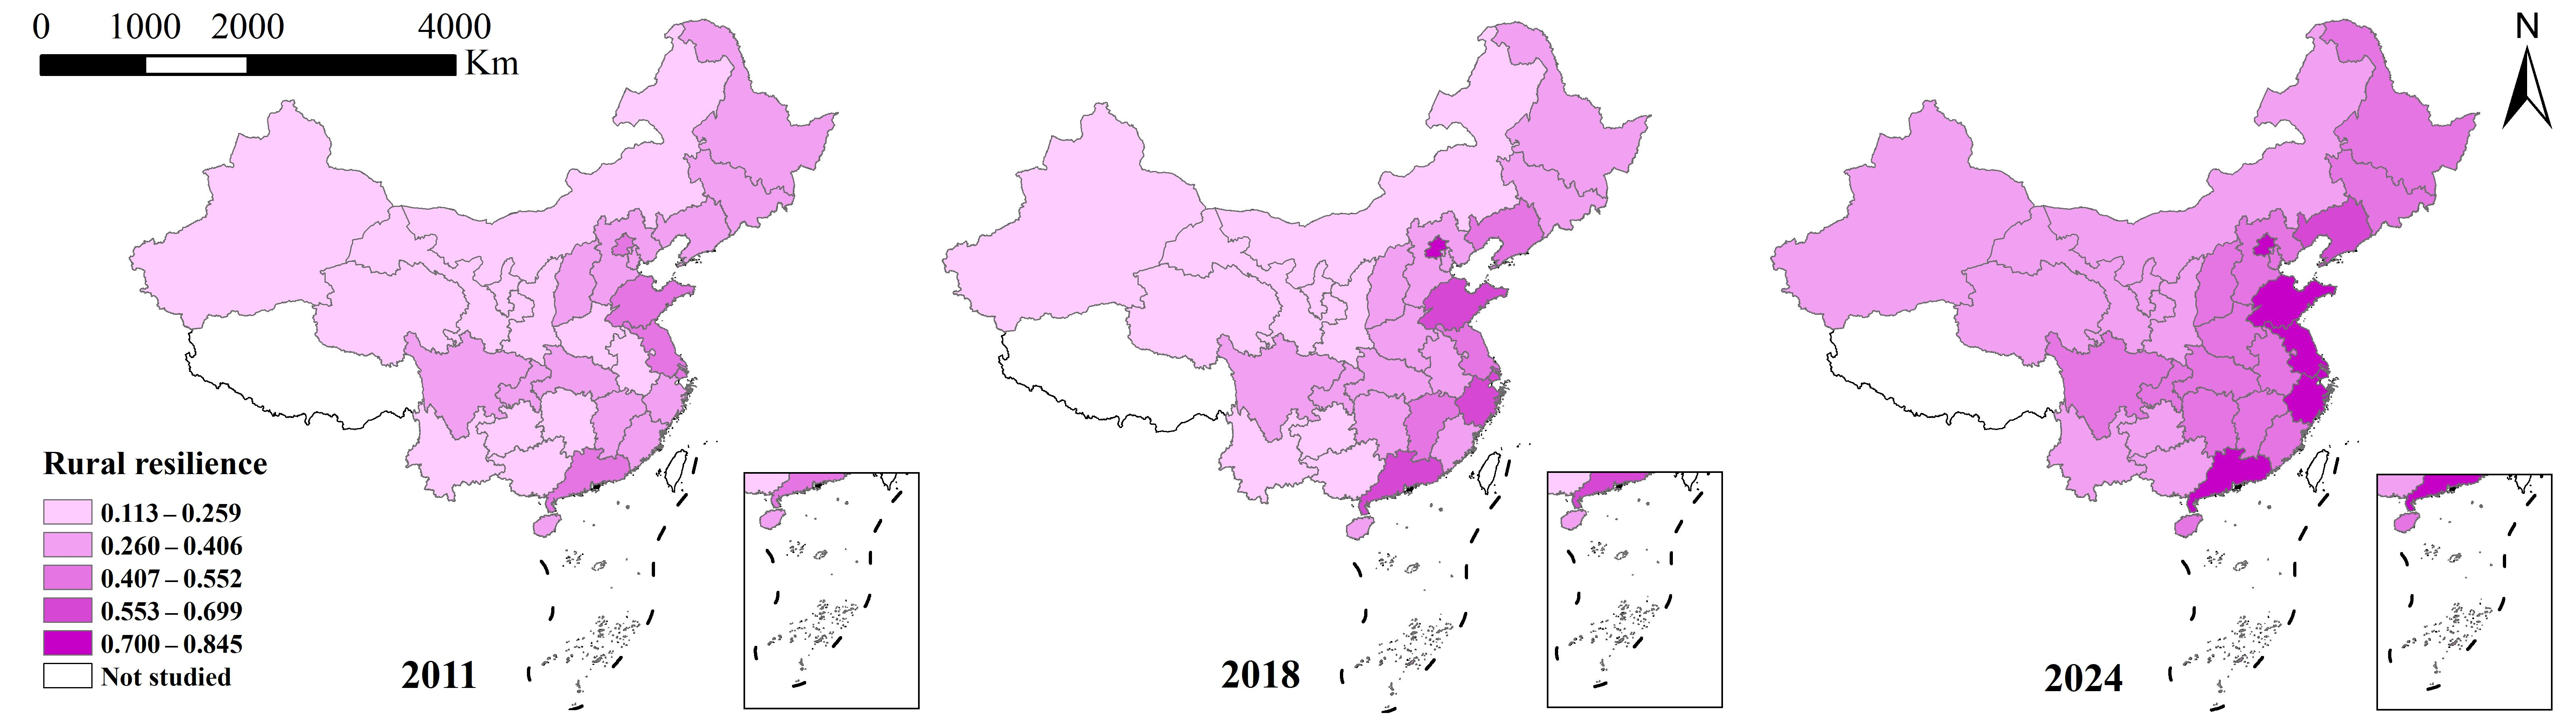
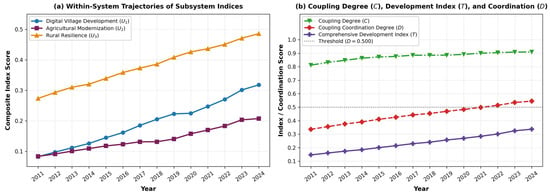
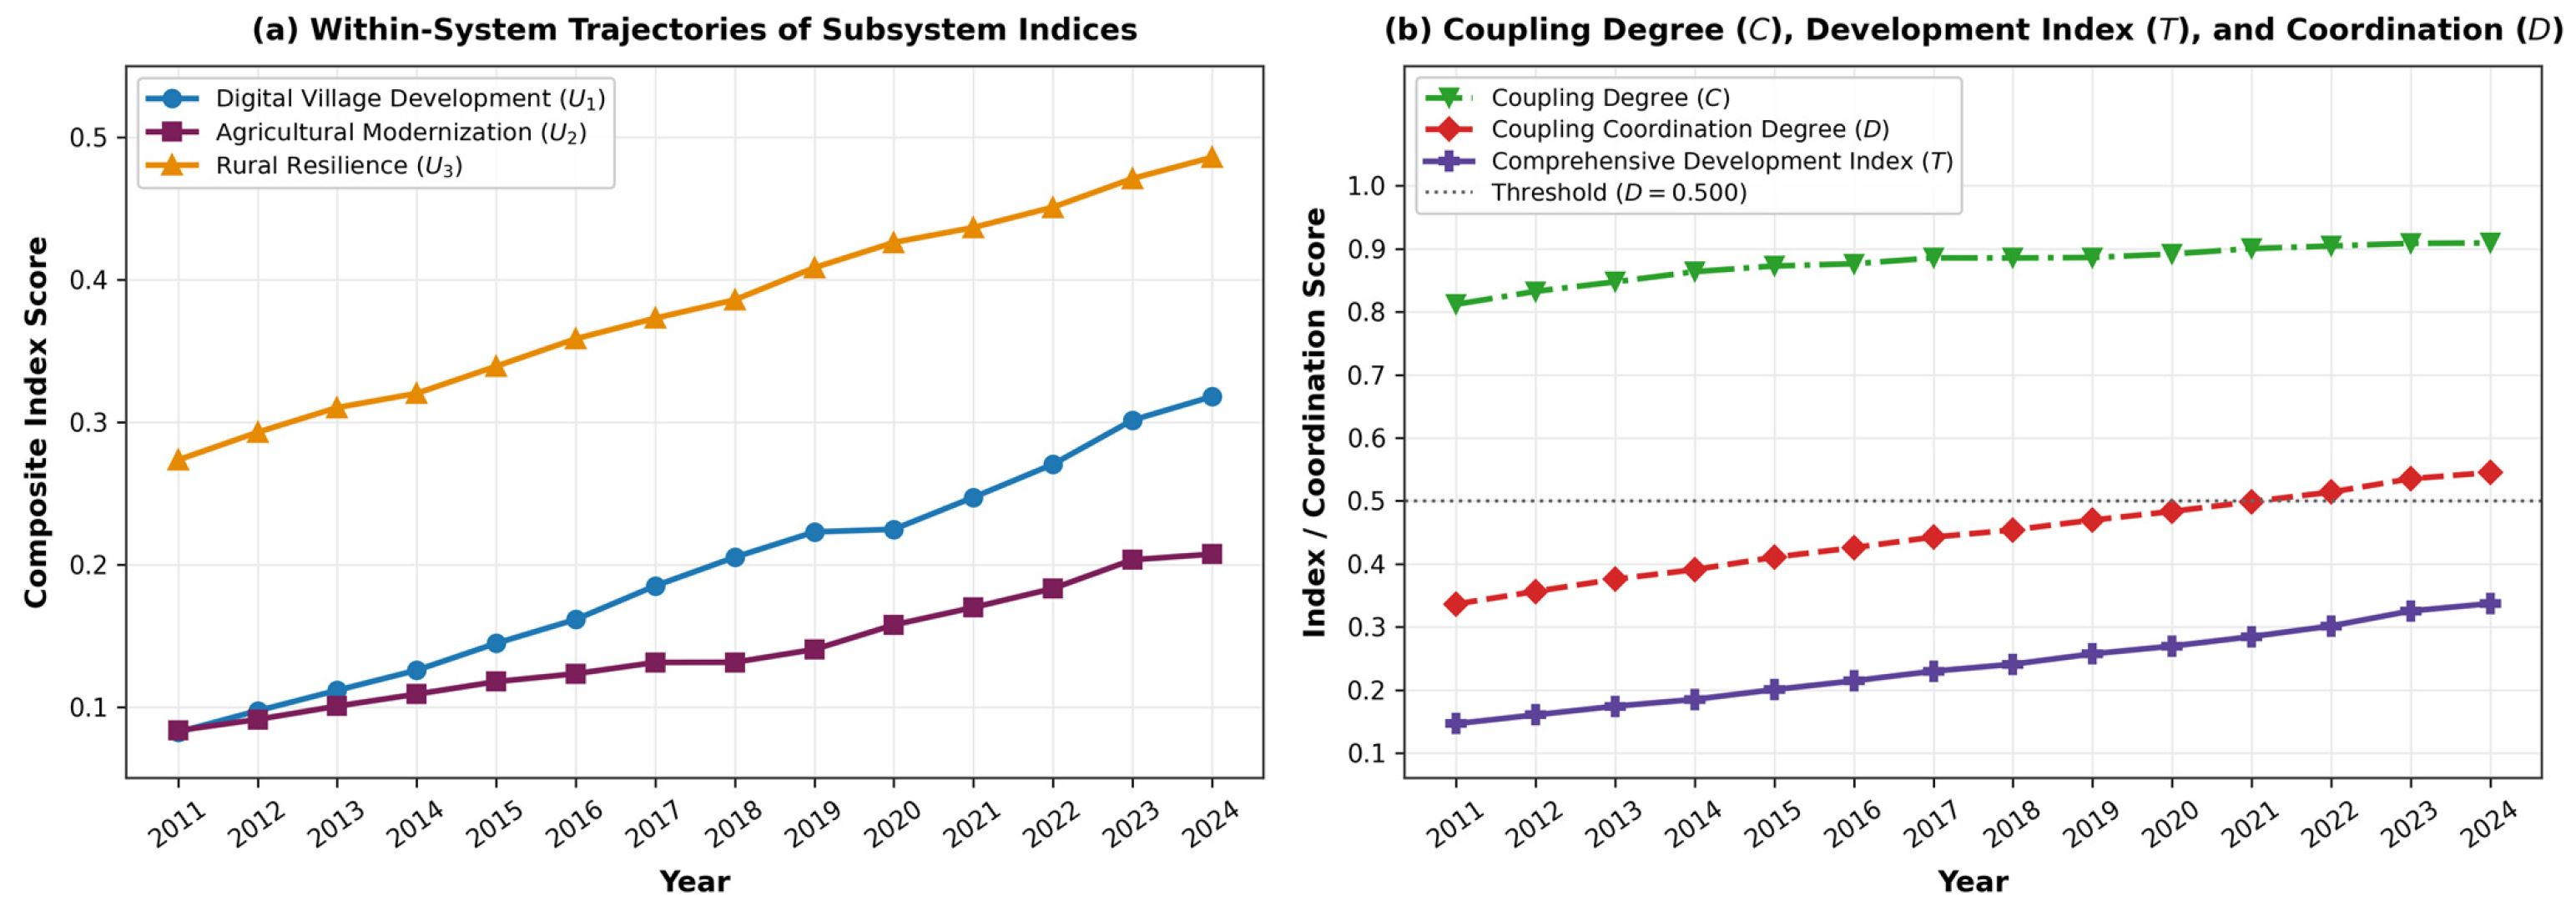
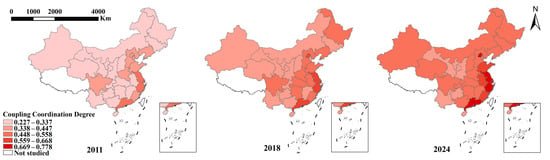
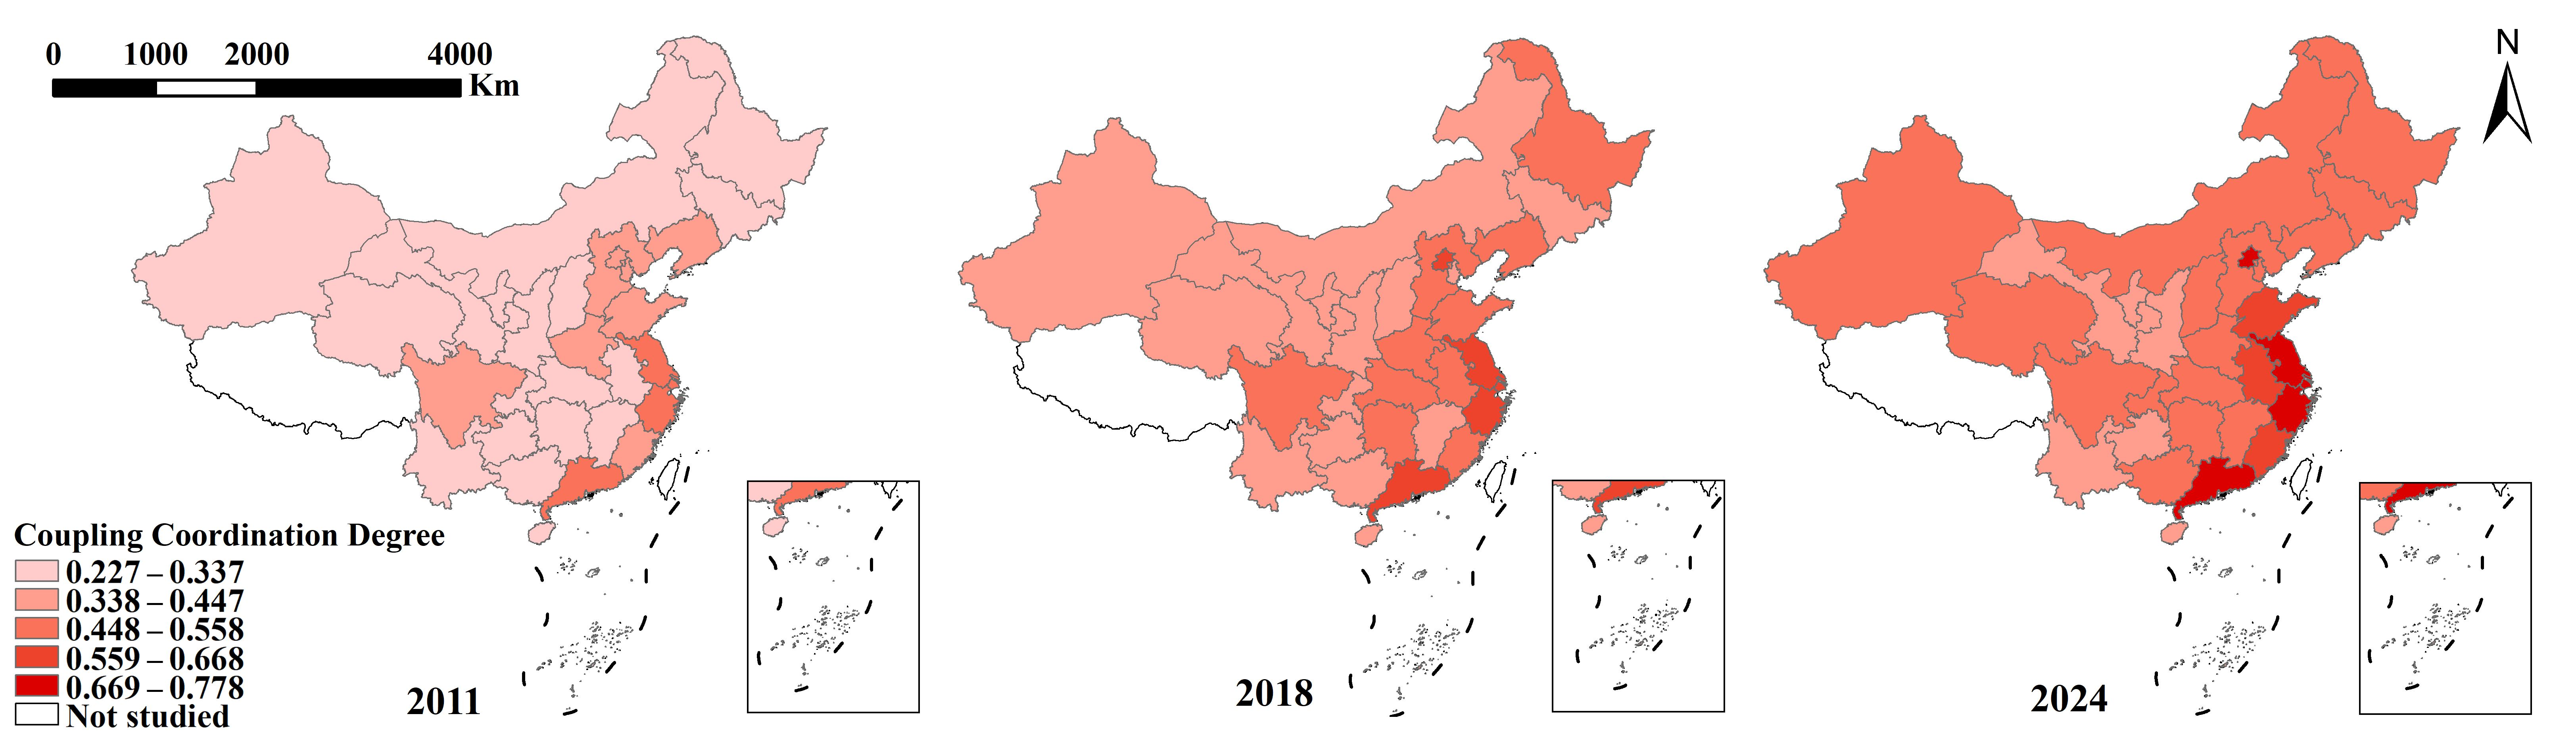
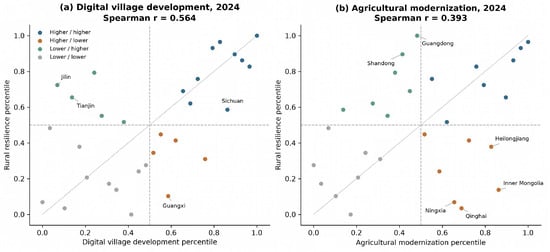
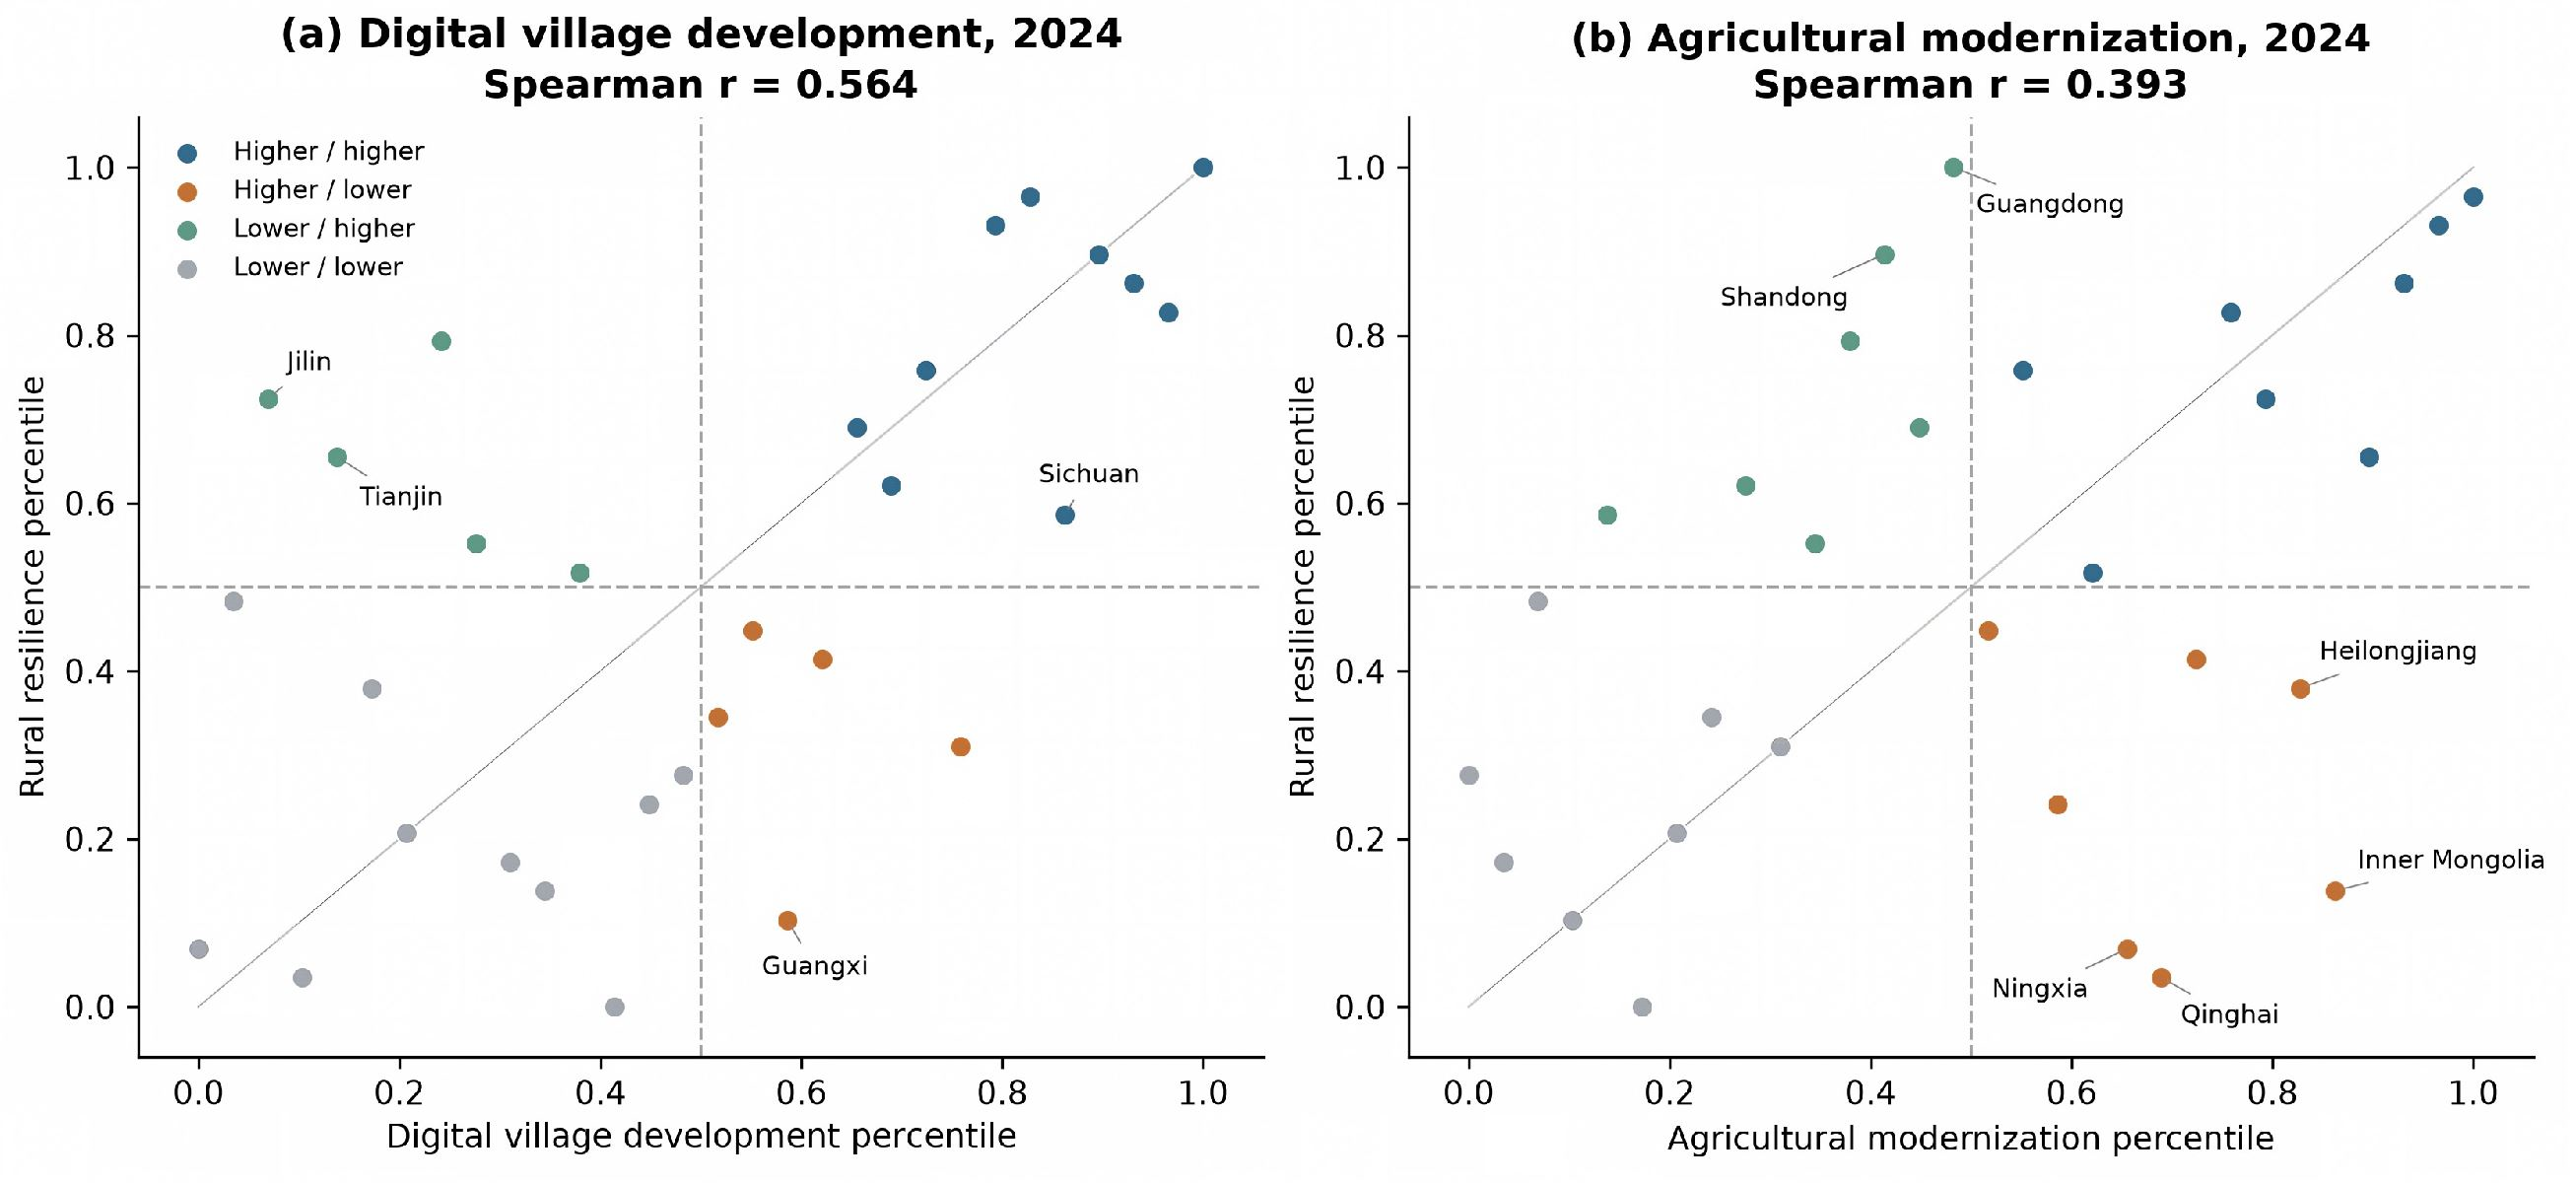
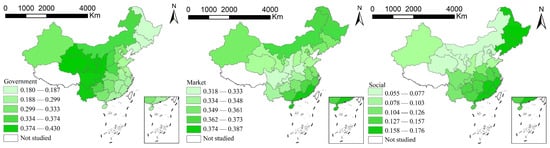
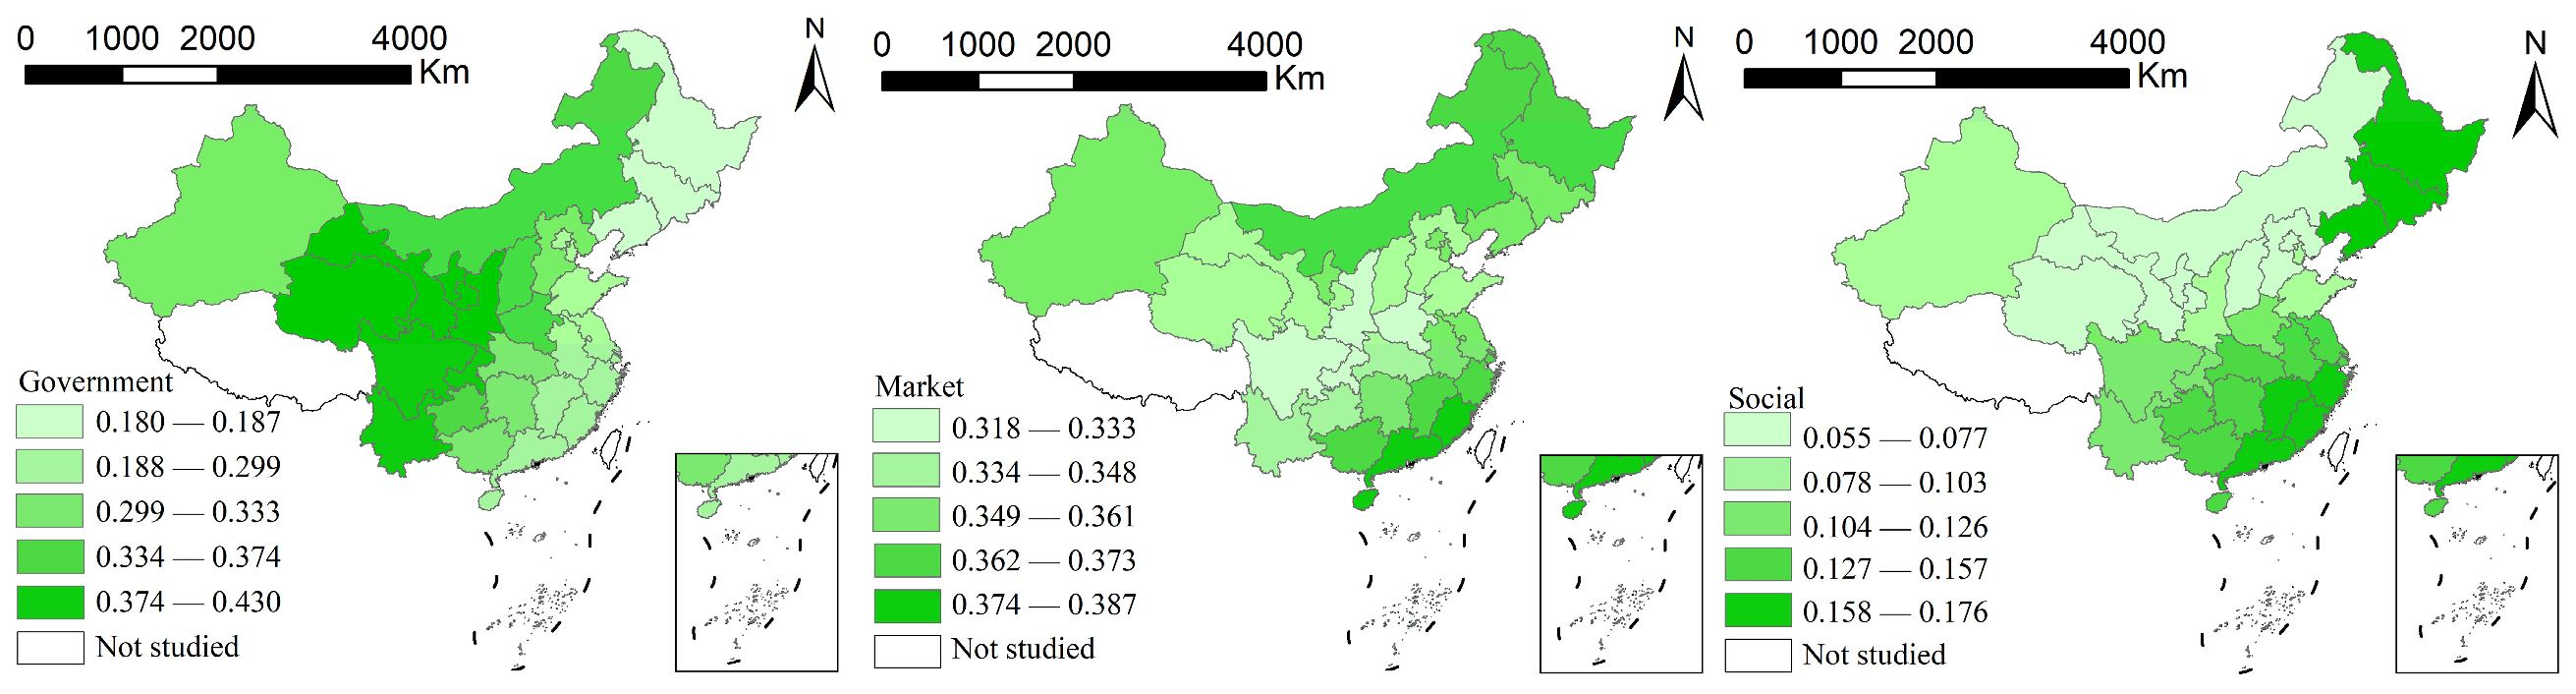
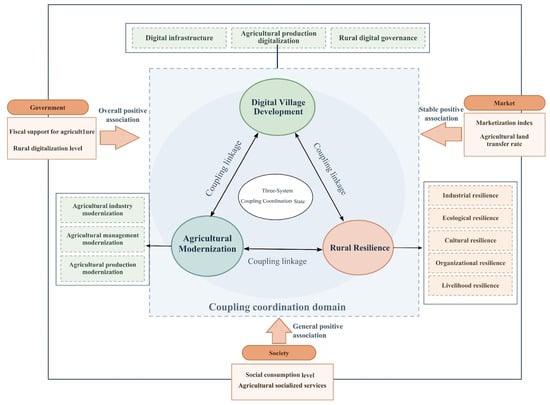
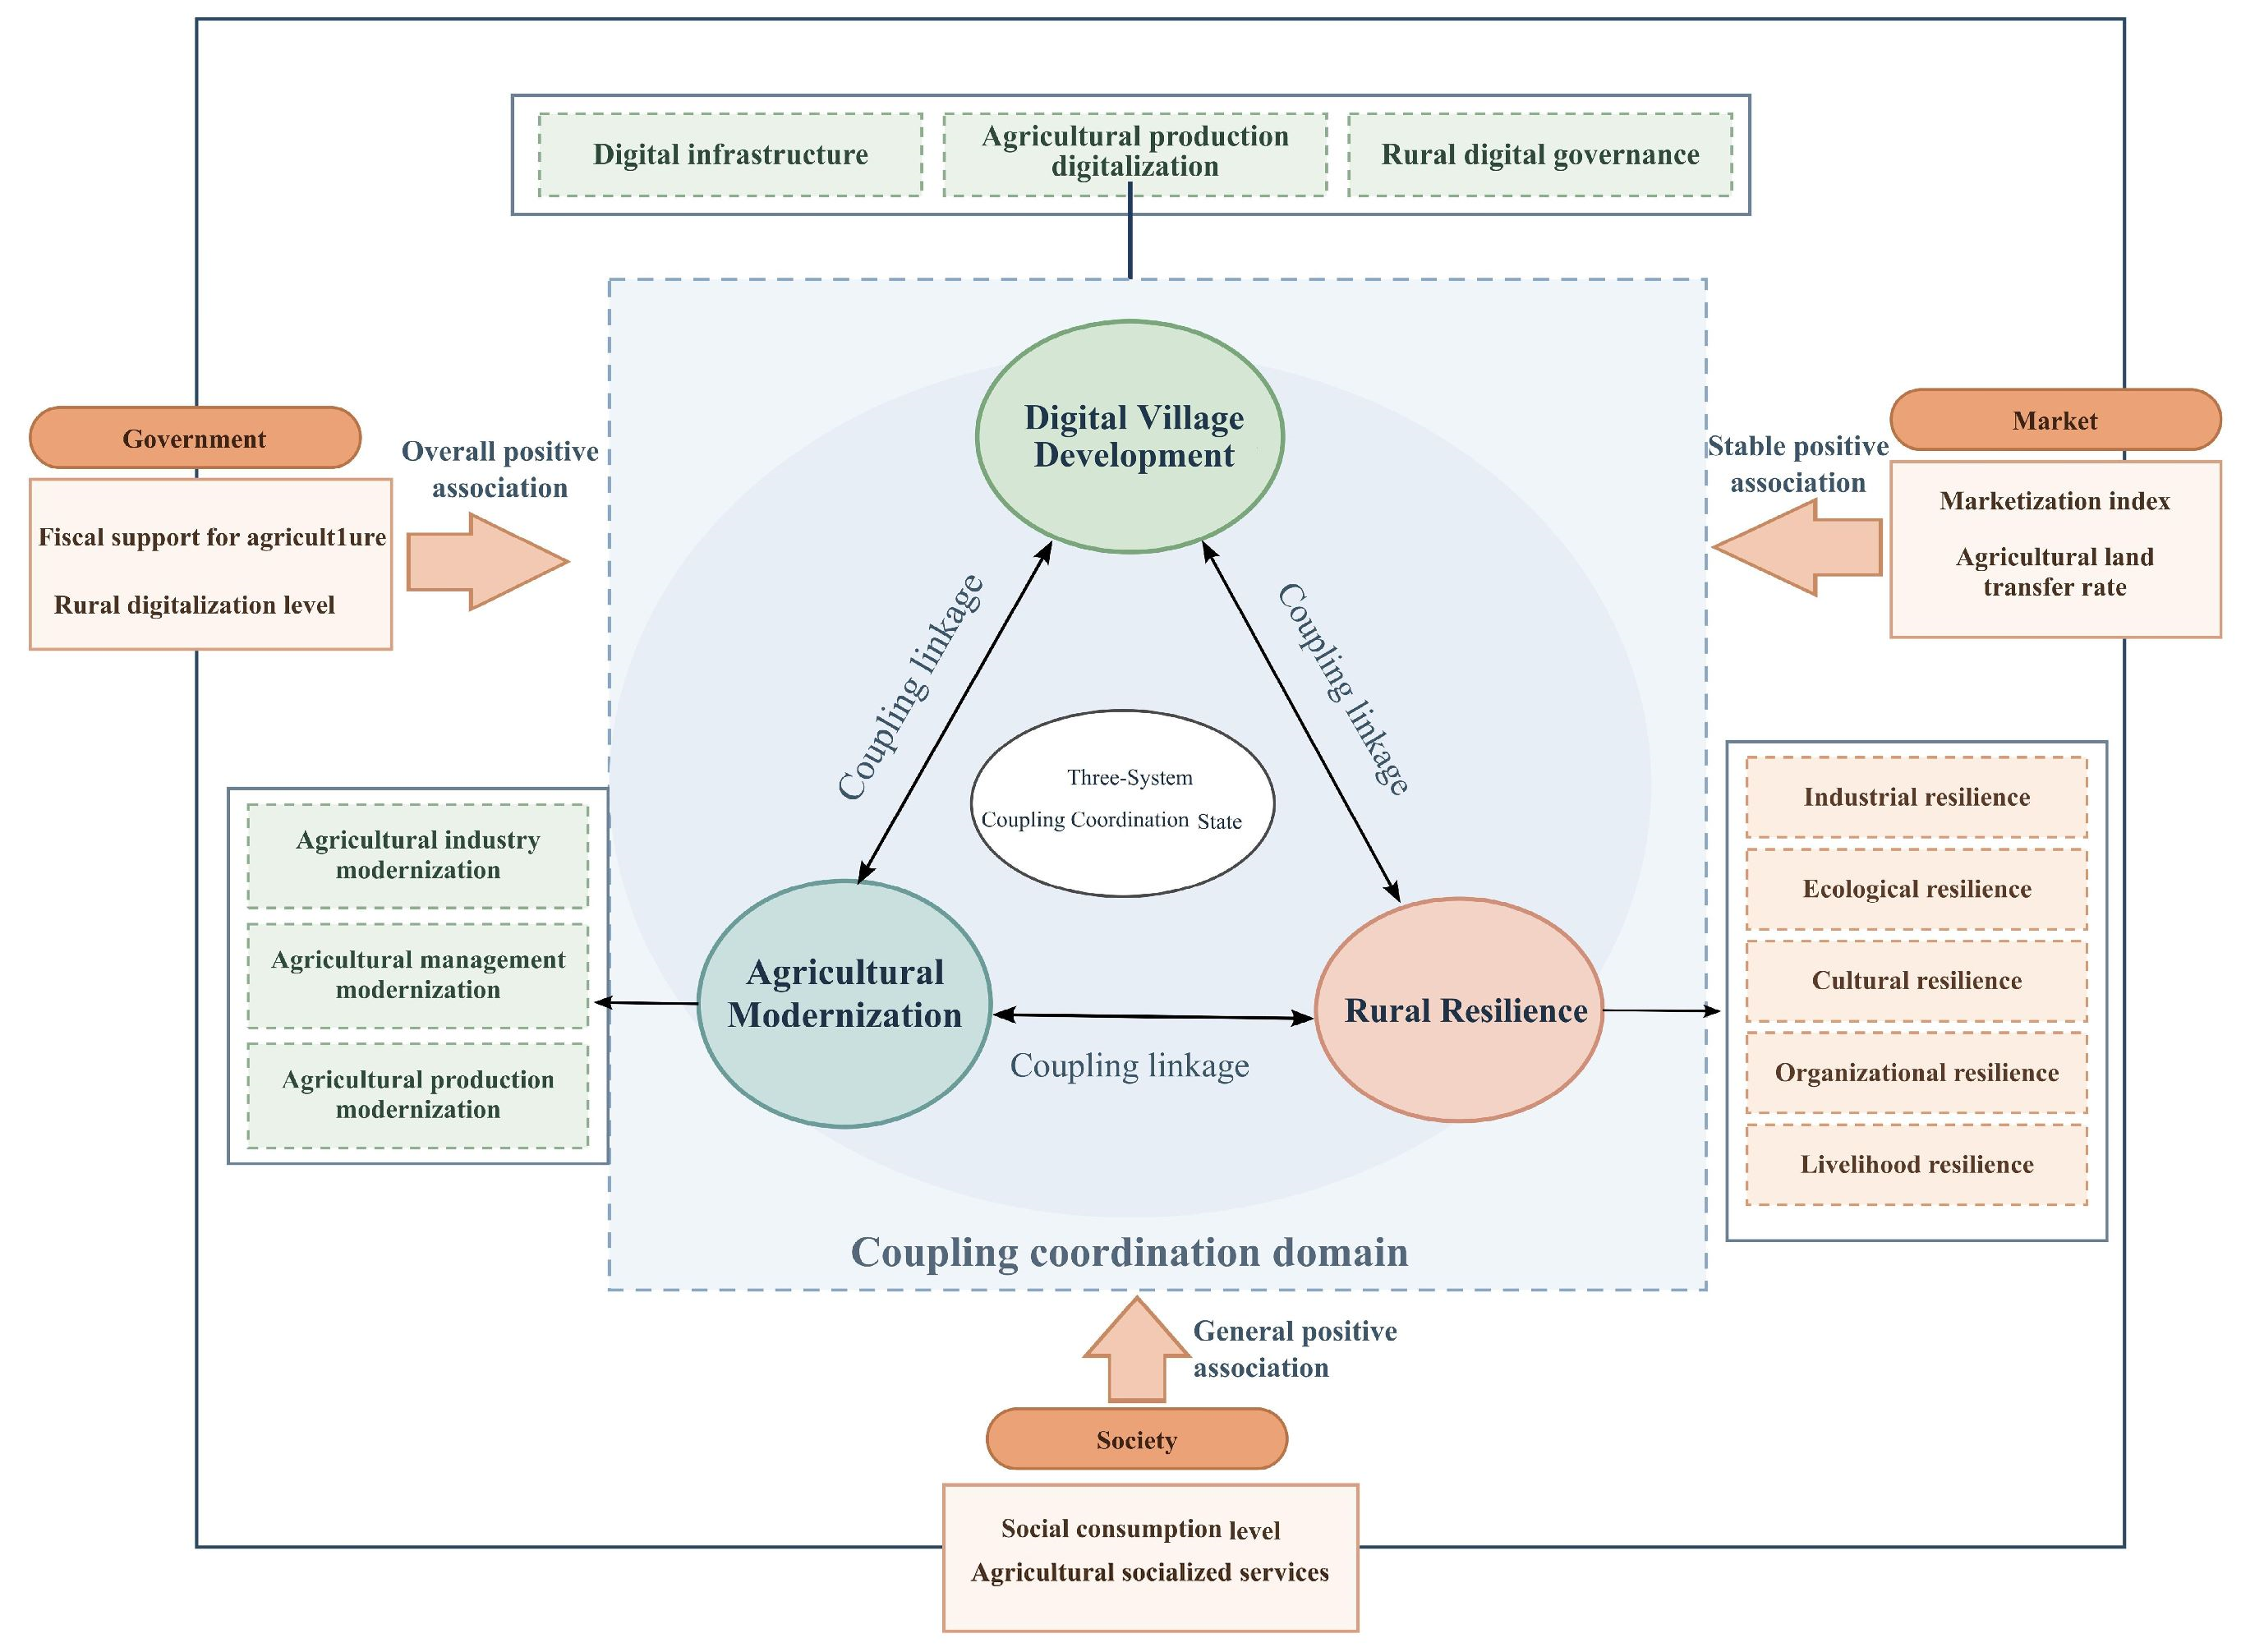

Disclaimer/Publisher’s Note: The statements, opinions and data contained in all publications are solely those of the individual author(s) and contributor(s) and not of MDPI and/or the editor(s). MDPI and/or the editor(s) disclaim responsibility for any injury to people or property resulting from any ideas, methods, instructions or products referred to in the content. |
© 2026 by the authors. Licensee MDPI, Basel, Switzerland. This article is an open access article distributed under the terms and conditions of the Creative Commons Attribution (CC BY) license.