


Abstract
Land-use change is a key driver of carbon cycling and carbon stock changes in regional ecosystems. Taking Huangling County as a case study, this study combined land-use data from 1990 to 2020 with the InVEST model, the Patch-generating Land-Use Simulation (PLUS) model, and GeoDetector to examine the spatiotemporal evolution of land-use change and carbon stocks, identify the drivers of carbon stock spatial heterogeneity, and project land-use patterns and carbon stock changes under alternative development scenarios for 2030. The results showed the following: (1) The land-use structure of Huangling County remained relatively stable during 1990–2020, with forestland and grassland accounting for more than 80% of the total area. Built-up land expanded from 12.58 km2 to 30.12 km2, while cropland decreased overall, indicating the coexistence of ecological land reconfiguration and urban expansion. (2) Total carbon stocks showed a fluctuating decline during 1990–2020, decreasing by 2.57% from 5517 × 104 t to 5375 × 104 t. Forestland constituted the dominant carbon pool, and its change was the primary driver of carbon stock dynamics. (3) Precipitation, NDVI, and elevation were the leading factors associated with carbon stock spatial heterogeneity, with mean q-values of 0.722, 0.669, and 0.588, respectively. Interaction detection revealed the strongest interaction for precipitation–GDP in 2010 (q = 0.829) and NDVI–GDP in 2020 (q = 0.799), highlighting the joint associations of natural and socioeconomic factors with carbon stock patterns. (4) Carbon stocks varied markedly among the 2030 scenarios. The Natural Development Scenario produced the highest carbon stock (5409.98 × 104 t), an increase of 35.36 × 10⁴ t relative to 2020. The Economic Development Priority Scenario exhibited the largest built-up land area (34.18 km2), while the Sustainable Development Scenario maintained a more coordinated land-use structure by balancing ecological protection and socioeconomic development. These findings provide valuable scientific support for land-use optimization and carbon sink enhancement in the hilly–gully region of the Loess Plateau.
1. Introduction
Global climate change has emerged as a major environmental challenge, with the continuous increase in atmospheric CO2 concentrations exerting profound impacts on the global carbon cycle and ecosystem stability [1,2]. Terrestrial ecosystems play a crucial role in carbon sequestration [3]. Land use and land cover change (LUCC) directly affects regional carbon stocks and carbon source–sink dynamics by modifying vegetation cover, ecosystem structure, and soil carbon processes, making it one of the most important drivers of carbon cycle dynamics in terrestrial ecosystems [4,5,6].
Against the backdrop of global carbon neutrality initiatives, enhancing the carbon sequestration capacity of ecosystems has become a key measure for mitigating climate change [3,7]. However, tradeoffs among ecological conservation, cropland protection, and urban expansion are often unavoidable in land management, and different land-use strategies may result in markedly different carbon stock trajectories [4,5]. Therefore, assessing the impacts of land-use change on carbon stocks and exploring future land-use and carbon stock dynamics under alternative development scenarios are essential for elucidating regional carbon stock dynamics, optimizing land-use planning, and enhancing ecosystem carbon sequestration capacity.
Previous studies have widely applied land-use simulation models, including CA–Markov, FLUS, and PLUS, to predict future land-use patterns and, in combination with the InVEST carbon storage module, to evaluate potential changes in ecosystem carbon stocks under alternative development scenario [8,9,10]. Compared with conventional land-use prediction approaches, the PLUS model integrates natural, socioeconomic, and locational drivers to capture spatial competition among land-use types and patch-level expansion processes [9]. Meanwhile, the InVEST model quantifies regional carbon stocks by assigning carbon density values to different land-use types, enabling spatially explicit assessments of carbon storage [8]. Such integrated modeling approaches have been widely used to investigate land-use change and ecosystem services across watershed, regional, and provincial scales, offering an effective framework for evaluating the impacts of alternative land management scenarios, such as natural development, ecological conservation, cropland protection, and economic development [11]. For instance, the integrated application of the LUH2, PLUS, and InVEST models has been used to simulate future land-use change and associated carbon stock responses under multiple scenarios in the Yellow River Basin [12]. Taking the Loess Plateau as a whole, previous studies have analyzed the impacts of land-use change on the spatiotemporal dynamics of regional carbon stocks and assessed future carbon stock trajectories under different development scenarios [13]. Furthermore, studies using Shanxi Province as the study area have evaluated the effects of land-use change on carbon stocks and examined their spatial heterogeneity. Overall, land-use change plays a critical role in shaping regional carbon stock dynamics [14]. The protection and restoration of ecological land, particularly forestland and grassland, contribute substantially to enhancing regional carbon sequestration capacity, whereas alternative land-use development pathways may result in distinct carbon stock trajectories.
The Loess Plateau, a key ecological security barrier and ecologically vulnerable region in China, is highly sensitive to land-use change in terms of its ecosystem structure and function and has therefore become a major focus of land-use and ecosystem research [15]. Despite substantial progress in land-use scenario modeling and carbon stock assessment at the Yellow River Basin, Loess Plateau, and provincial scales, existing studies have largely focused on broad regional patterns. Consequently, the effects of intra-county land-use transitions on carbon stock dynamics remain insufficiently understood, and limited attention has been given to the tradeoffs among ecological conservation, cropland preservation, and urban expansion. It should also be noted that scenario-based simulations relying on fixed carbon density coefficients and predefined land-use transition rules are inherently subject to uncertainty. Consequently, the results are better interpreted as comparative assessments of alternative land management pathways rather than precise predictions of future land-use configurations and carbon stock dynamics [16,17]. Therefore, a systematic assessment of historical land-use change and carbon stock responses under alternative development scenarios at the county scale is needed. Such an approach can improve understanding of regional carbon stock dynamics and provide scientific support for land-use optimization and ecological spatial management in the hilly–gully region of the Loess Plateau [4,18].
Accordingly, this study selected Huangling County, a typical county in the hilly–gully region of the Loess Plateau, as the study area. Based on land-use data from 1990, 2000, 2010, and 2020, land-use transition analysis, the PLUS model, the InVEST model, and GeoDetector were employed to characterize land-use change and carbon stock dynamics. Future land-use patterns and carbon stock changes under alternative development scenarios for 2030 were then simulated, and the drivers of spatial heterogeneity in carbon stocks were identified. The findings are expected to provide scientific support for territorial spatial planning, ecological restoration, and carbon sequestration enhancement in the hilly–gully region of the Loess Plateau.
2. Materials and Methods
2.1. Study Area
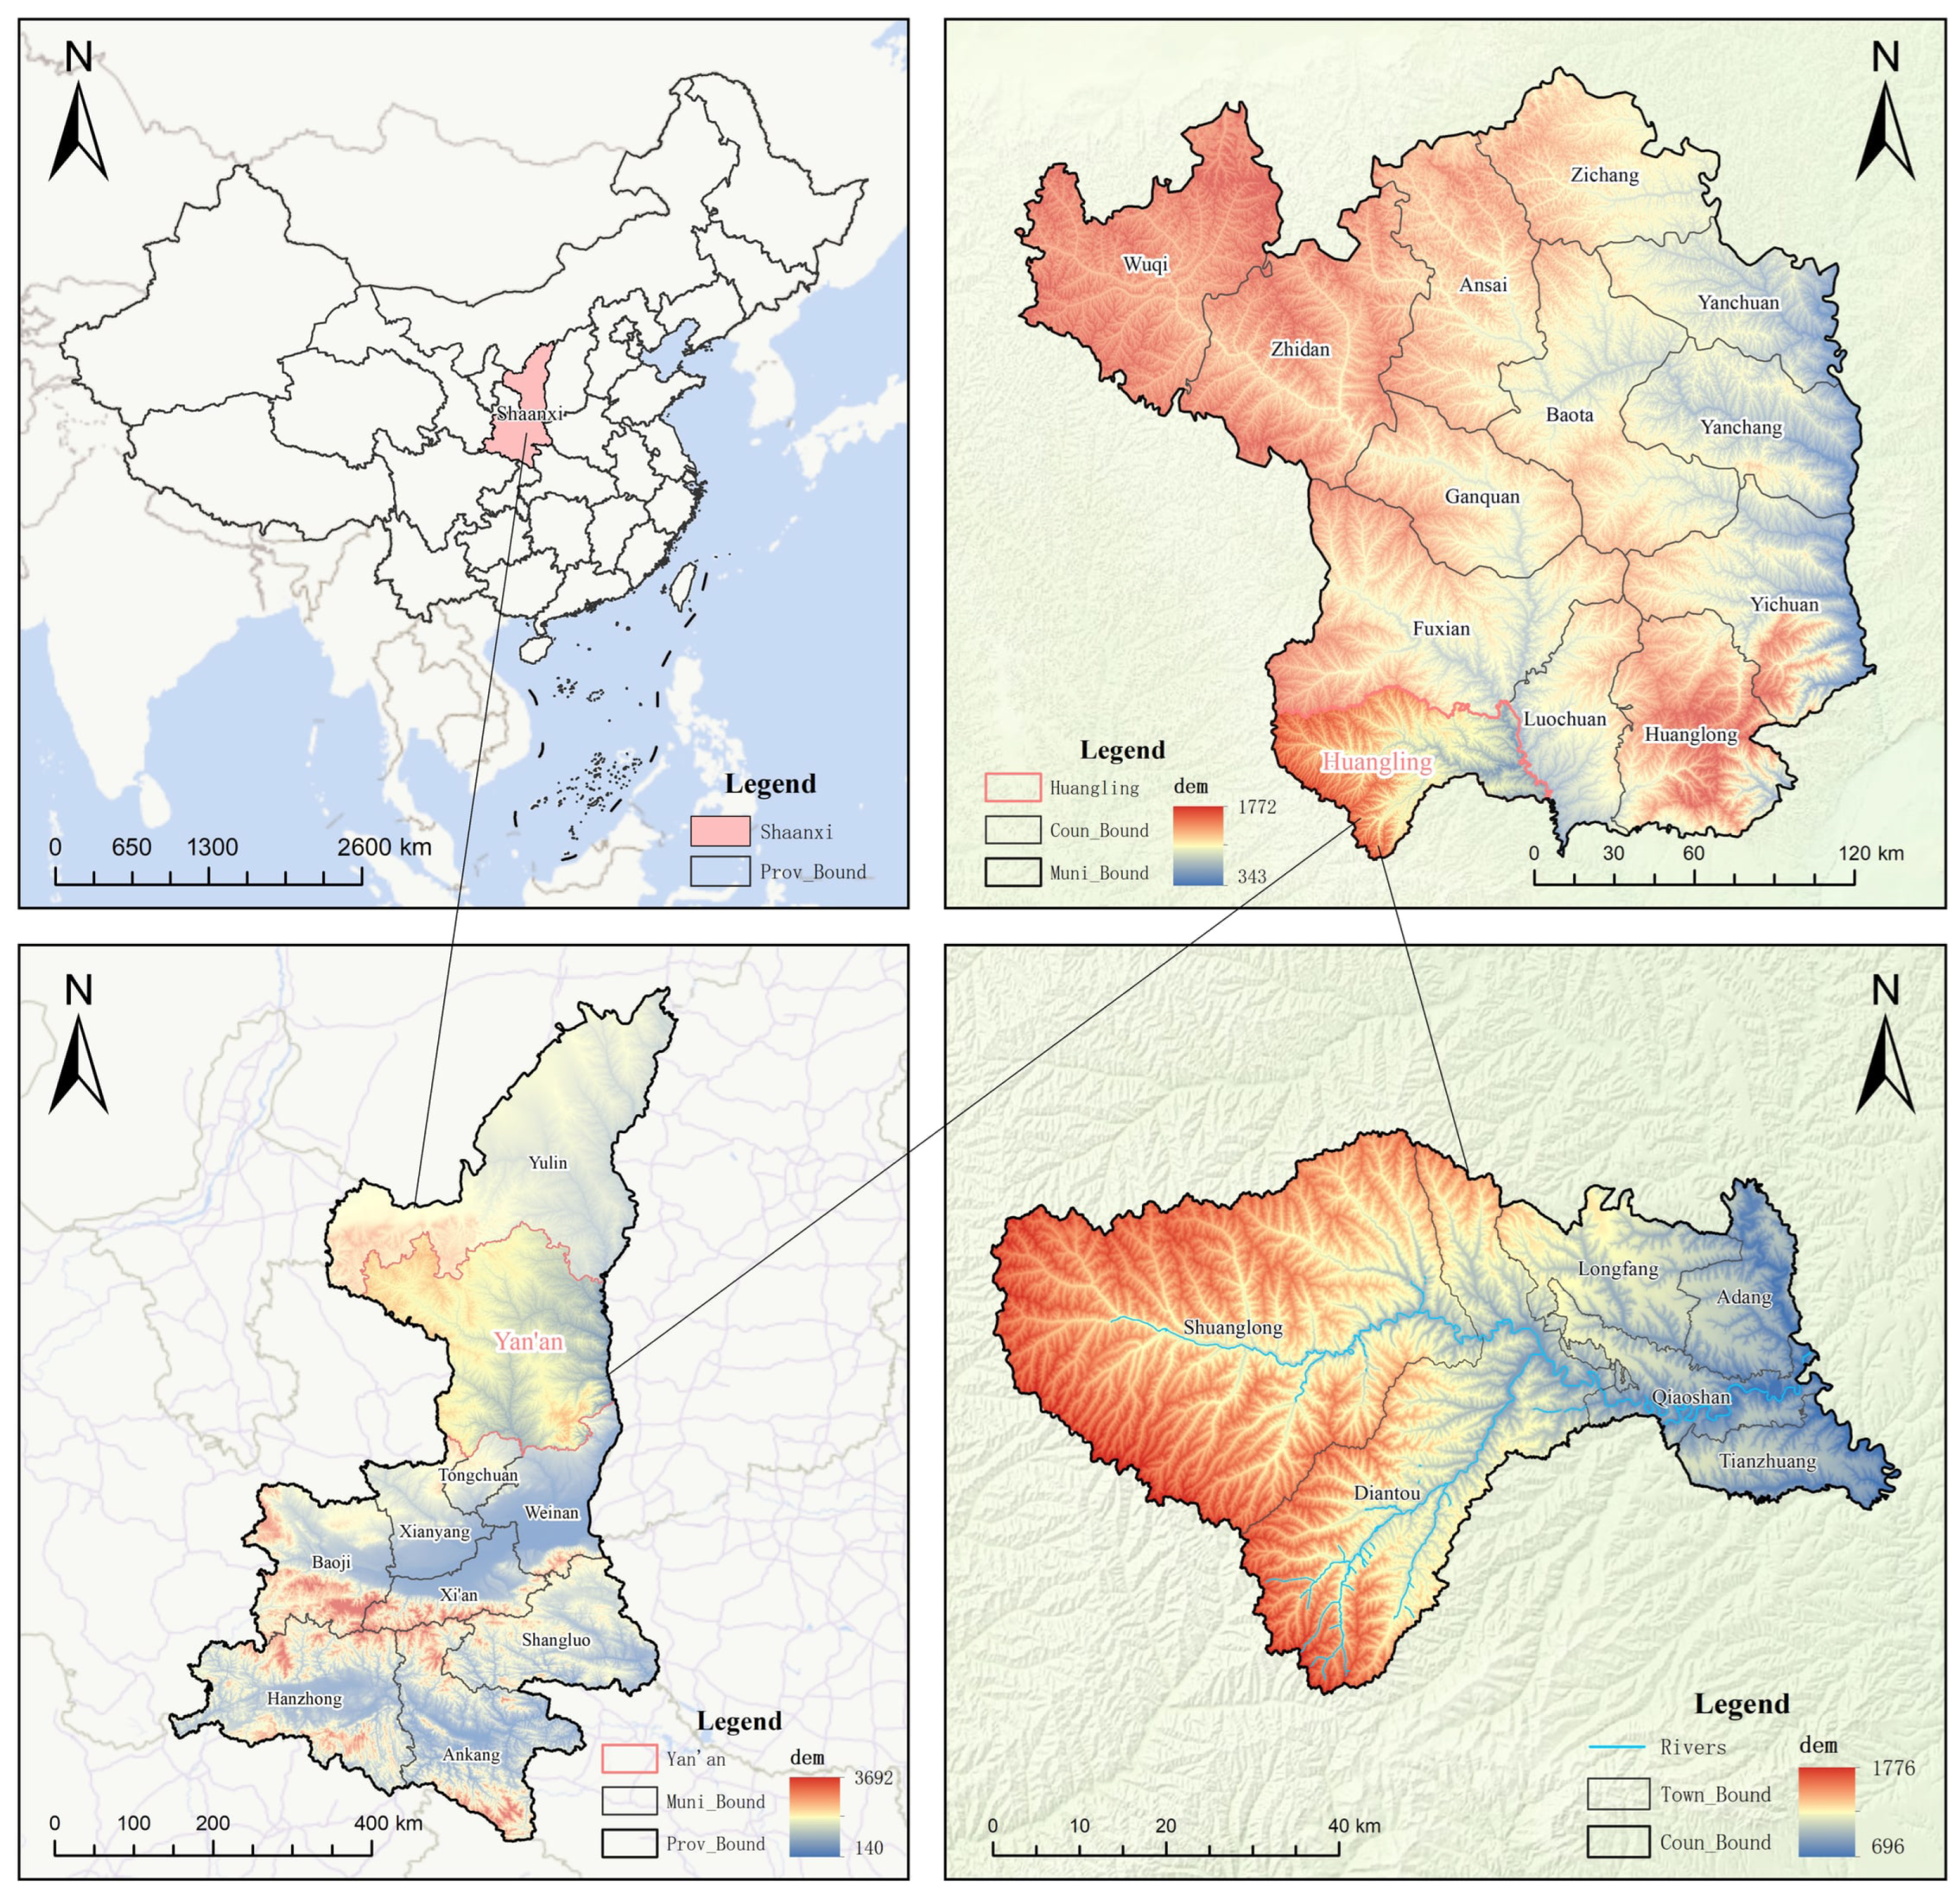
Huangling County is located in central Shaanxi Province, southern Yan’an City, within the hinterland of the Loess Plateau and the middle reaches of the Yellow River Basin. As a key transitional zone between the Guanzhong Plain and the Northern Shaanxi Plateau (Figure 1), it spans 108°45′–109°27′ E and 35°26′–36°04′ N, covering a total area of approximately 2288 km2. The region is dominated by a hilly–gully loess landscape, characterized by intensive gully development and highly fragmented terrain, and is recognized as one of the typical geomorphological units of the Loess Plateau [15]. Huangling County has a warm temperate continental monsoon climate, and its ecosystem structure and functions are highly sensitive to both environmental change and human activities. As an important area for ecological conservation and restoration on the Loess Plateau, the county has undergone long-term ecological restoration through the Grain for Green Program and has been simultaneously influenced by ecological policy adjustments and socioeconomic development. Therefore, Huangling County represents an ideal case for investigating the interactions between land-use change and ecosystem carbon stock dynamics in the hilly–gully region of the Loess Plateau [19,20].
Figure 1.
Location of the study area. Connecting lines indicate map correspondence.
2.2. Data Sources and Processing
Considering the requirements of land-use change analysis, ecosystem carbon stock assessment, and scenario-based land-use simulation, multiple datasets were employed in this study, including land-use, topographic, meteorological, vegetation index, socioeconomic, and transportation accessibility data. The land-use/land-cover data were obtained from the China Land Use Remote Sensing Monitoring Dataset (CNLUCC), provided by the Resource and Environmental Science and Data Center (RESDC), Chinese Academy of Sciences (http://www.resdc.cn/DOI, accessed on 12 August 2026; 2026; DOI: 10.12078/2026071401). CNLUCC is a national-scale, multi-period land-use/land-cover database for China, constructed primarily from Landsat satellite remote sensing imagery through visual interpretation. The dataset covers multiple periods from the late 1970s to 2025, including 1980, 1990, 1995, 2000, 2005, 2008, 2010, 2013, 2015, 2018, 2020, 2023, and 2025. It adopts a two-level land-use classification system, with six first-level categories: cropland, forestland, grassland, water bodies, built-up land, and unused land. In this study, the national-scale land-use raster data for 1990, 2000, 2010, and 2020 were used, and the data were spatially clipped to the boundary of Huangling County to obtain the land-use data for the study area. Within Huangling County, five of the six first-level land-use categories are present, namely cropland, forestland, grassland, water bodies, and built-up land, while no unused land occurs in the study area. These datasets served as the basis for land-use change analysis, PLUS-based land-use simulation, and InVEST-based carbon stock assessment [8,9].
Topographic variables included elevation, slope, and aspect. Elevation was obtained from a digital elevation model (DEM), and terrain derivatives such as slope and aspect were generated using GIS spatial analysis tools to characterize terrain conditions and their effects on land-use distribution (Table 1). Meteorological variables, including annual mean temperature and annual precipitation, were used to represent spatial heterogeneity in heat and moisture conditions. Vegetation conditions were represented by the normalized difference vegetation index (NDVI), which reflects vegetation growth and ecological status [11]. Socioeconomic factors included population density and gross domestic product (GDP), serving as proxies for human activity intensity and economic development. Transportation and locational factors comprised roads, rivers, rural settlements, and urban centers. Based on spatial distance and density analyses, variables including distance to major roads, distance to rivers, distance to rural settlements, distance to urban centers, and road density were derived to quantify the influence of locational conditions on land-use pattern evolution [21,22].
Table 1.
Sources and applications of the datasets used in this study.
To ensure the consistency and suitability of multi-source datasets for spatial analyses and model simulations, all data were standardized to a common coordinate system, spatial resolution, and study-area boundary. Preprocessing procedures, including clipping, resampling, format conversion, and spatial registration, were conducted prior to analysis. Subsequently, a land-use simulation driving-factor framework and a carbon stock driver indicator system were developed to support land-use change modeling and carbon stock assessment. These processed datasets provided the foundation for PLUS-based land-use simulations, InVEST-based carbon stock evaluations, and analyses of the mechanisms driving carbon stock dynamics.
2.3. Methods
2.3.1. Carbon Storage Module of the InVEST Model
The Integrated Valuation of Ecosystem Services and Tradeoffs (InVEST) model is a widely applied tool for ecosystem service assessment. Its Carbon module estimates ecosystem carbon stocks by integrating land-use information with carbon density values assigned to different land-use types. Carbon storage is divided into four pools: aboveground biomass, belowground biomass, soil organic matter, and dead organic matter. The total carbon stock of the study area is obtained by summing the carbon stored in these four pools across all land-use types.
where Ctotal is the total ecosystem carbon stock; Cabove is the aboveground biomass carbon stock; Csoil is the soil organic carbon stock; and Cdead is the dead organic matter carbon stock.
Ctotal = Cabove + Cbelow + Csoil + Cdead
The InVEST model does not provide built-in carbon density parameters, and the values of these parameters vary considerably with regional environmental conditions, vegetation characteristics, and soil properties [13]. Given the substantial human and material resources required for field sampling and measurements of the four carbon pools, site-specific carbon density measurements were not conducted in this study. Instead, carbon density parameters were determined through a review and comparison of published studies. Priority was given to data reported for Huangling County and Shaanxi Province, followed by studies from the Loess Plateau and adjacent regions, supplemented by national-scale estimates and relevant parameters reported by the Intergovernmental Panel on Climate Change (IPCC). During parameter selection, the regional comparability of climatic conditions, vegetation characteristics, soil properties, and land-use types was considered to improve the applicability of the selected values to Huangling County. Based on this process, carbon density parameters for the four carbon pools associated with each land-use type were determined from the selected literature sources [13,23,24,,25,26,27,28]. The adopted parameter values and their corresponding references are presented in Table 2.
Table 2.
Carbon density parameters of different land-use types used in the InVEST model (t/hm2).
2.3.2. Calculation of Carbon Stock Changes from Land-Use Transitions
To quantify the contribution of individual land-use transition pathways to carbon storage changes from 1990 to 2020, the carbon storage change associated with each transition was calculated based on the transition area and the difference in carbon density between the initial and final land-use types, as follows [29,30]:
where ΔCij represents the carbon storage change resulting from the conversion of land-use type i to type j; Aij is the transition area (km2); and Ci and Cj are the carbon densities of the initial and final land-use types, respectively (t C/ha). The factor of 100 converts the transition area from km2 to ha. A negative value indicates a decrease in carbon storage, whereas a positive value indicates an increase. This calculation was used to quantify the contributions of different land-use transition pathways to carbon storage changes.
ΔCij = Aij × 100 × (Cj − Ci)
2.3.3. PLUS Model
The Patch-generating Land Use Simulation (PLUS) model is a spatially explicit land-use simulation framework designed to capture the dynamic processes of land-use change and predict future land-use patterns. The model effectively represents the driving mechanisms underlying land-use expansion and the associated spatial evolution of land-use systems. Owing to its ability to integrate driving-factor analysis with patch-level simulation, PLUS has been widely employed in studies of land-use dynamics, scenario-based forecasting, and territorial spatial planning [9,21]. The framework comprises two key components: the Land Expansion Analysis Strategy (LEAS) module and the Cellular Automata based on Random Seeds (CARS) module. The LEAS module identifies the drivers of land-use expansion and generates occurrence probability surfaces for different land-use types, while the CARS module simulates patch generation, spatial competition, and landscape evolution through a multi-type random seed mechanism.
- (1)
- Land Expansion Analysis Strategy (LEAS)
The LEAS module identifies the driving mechanisms of land-use expansion and generates occurrence probability surfaces for different land-use types. Using land-use data from two periods, expansion areas of each land-use category are extracted, and expansion and non-expansion samples are selected to construct a random forest training dataset. Expansion samples denote pixels converted from other land-use types to the target category, whereas non-expansion samples denote pixels without such transitions. By incorporating natural, locational, and socioeconomic driving factors, the random forest algorithm quantifies the relationships between land-use expansion and its drivers and generates occurrence probabilities for each land-use type at the pixel level. The probability of a pixel transitioning to a target land-use type is calculated as follows:
where is the probability that cell i will develop into land-use type k; x denotes the vector of driving factors; d ∈ {0,1}, where d = 1 indicates a transition from other land-use types to type k, and d = 0 indicates no such transition; hn(x) is the prediction result of the n-th decision tree for the input vector x; I[hn(x) = d] denotes the indicator function, taking a value of 1 when the prediction equals d and 0 otherwise; and M is the total number of decision trees in the random forest model.
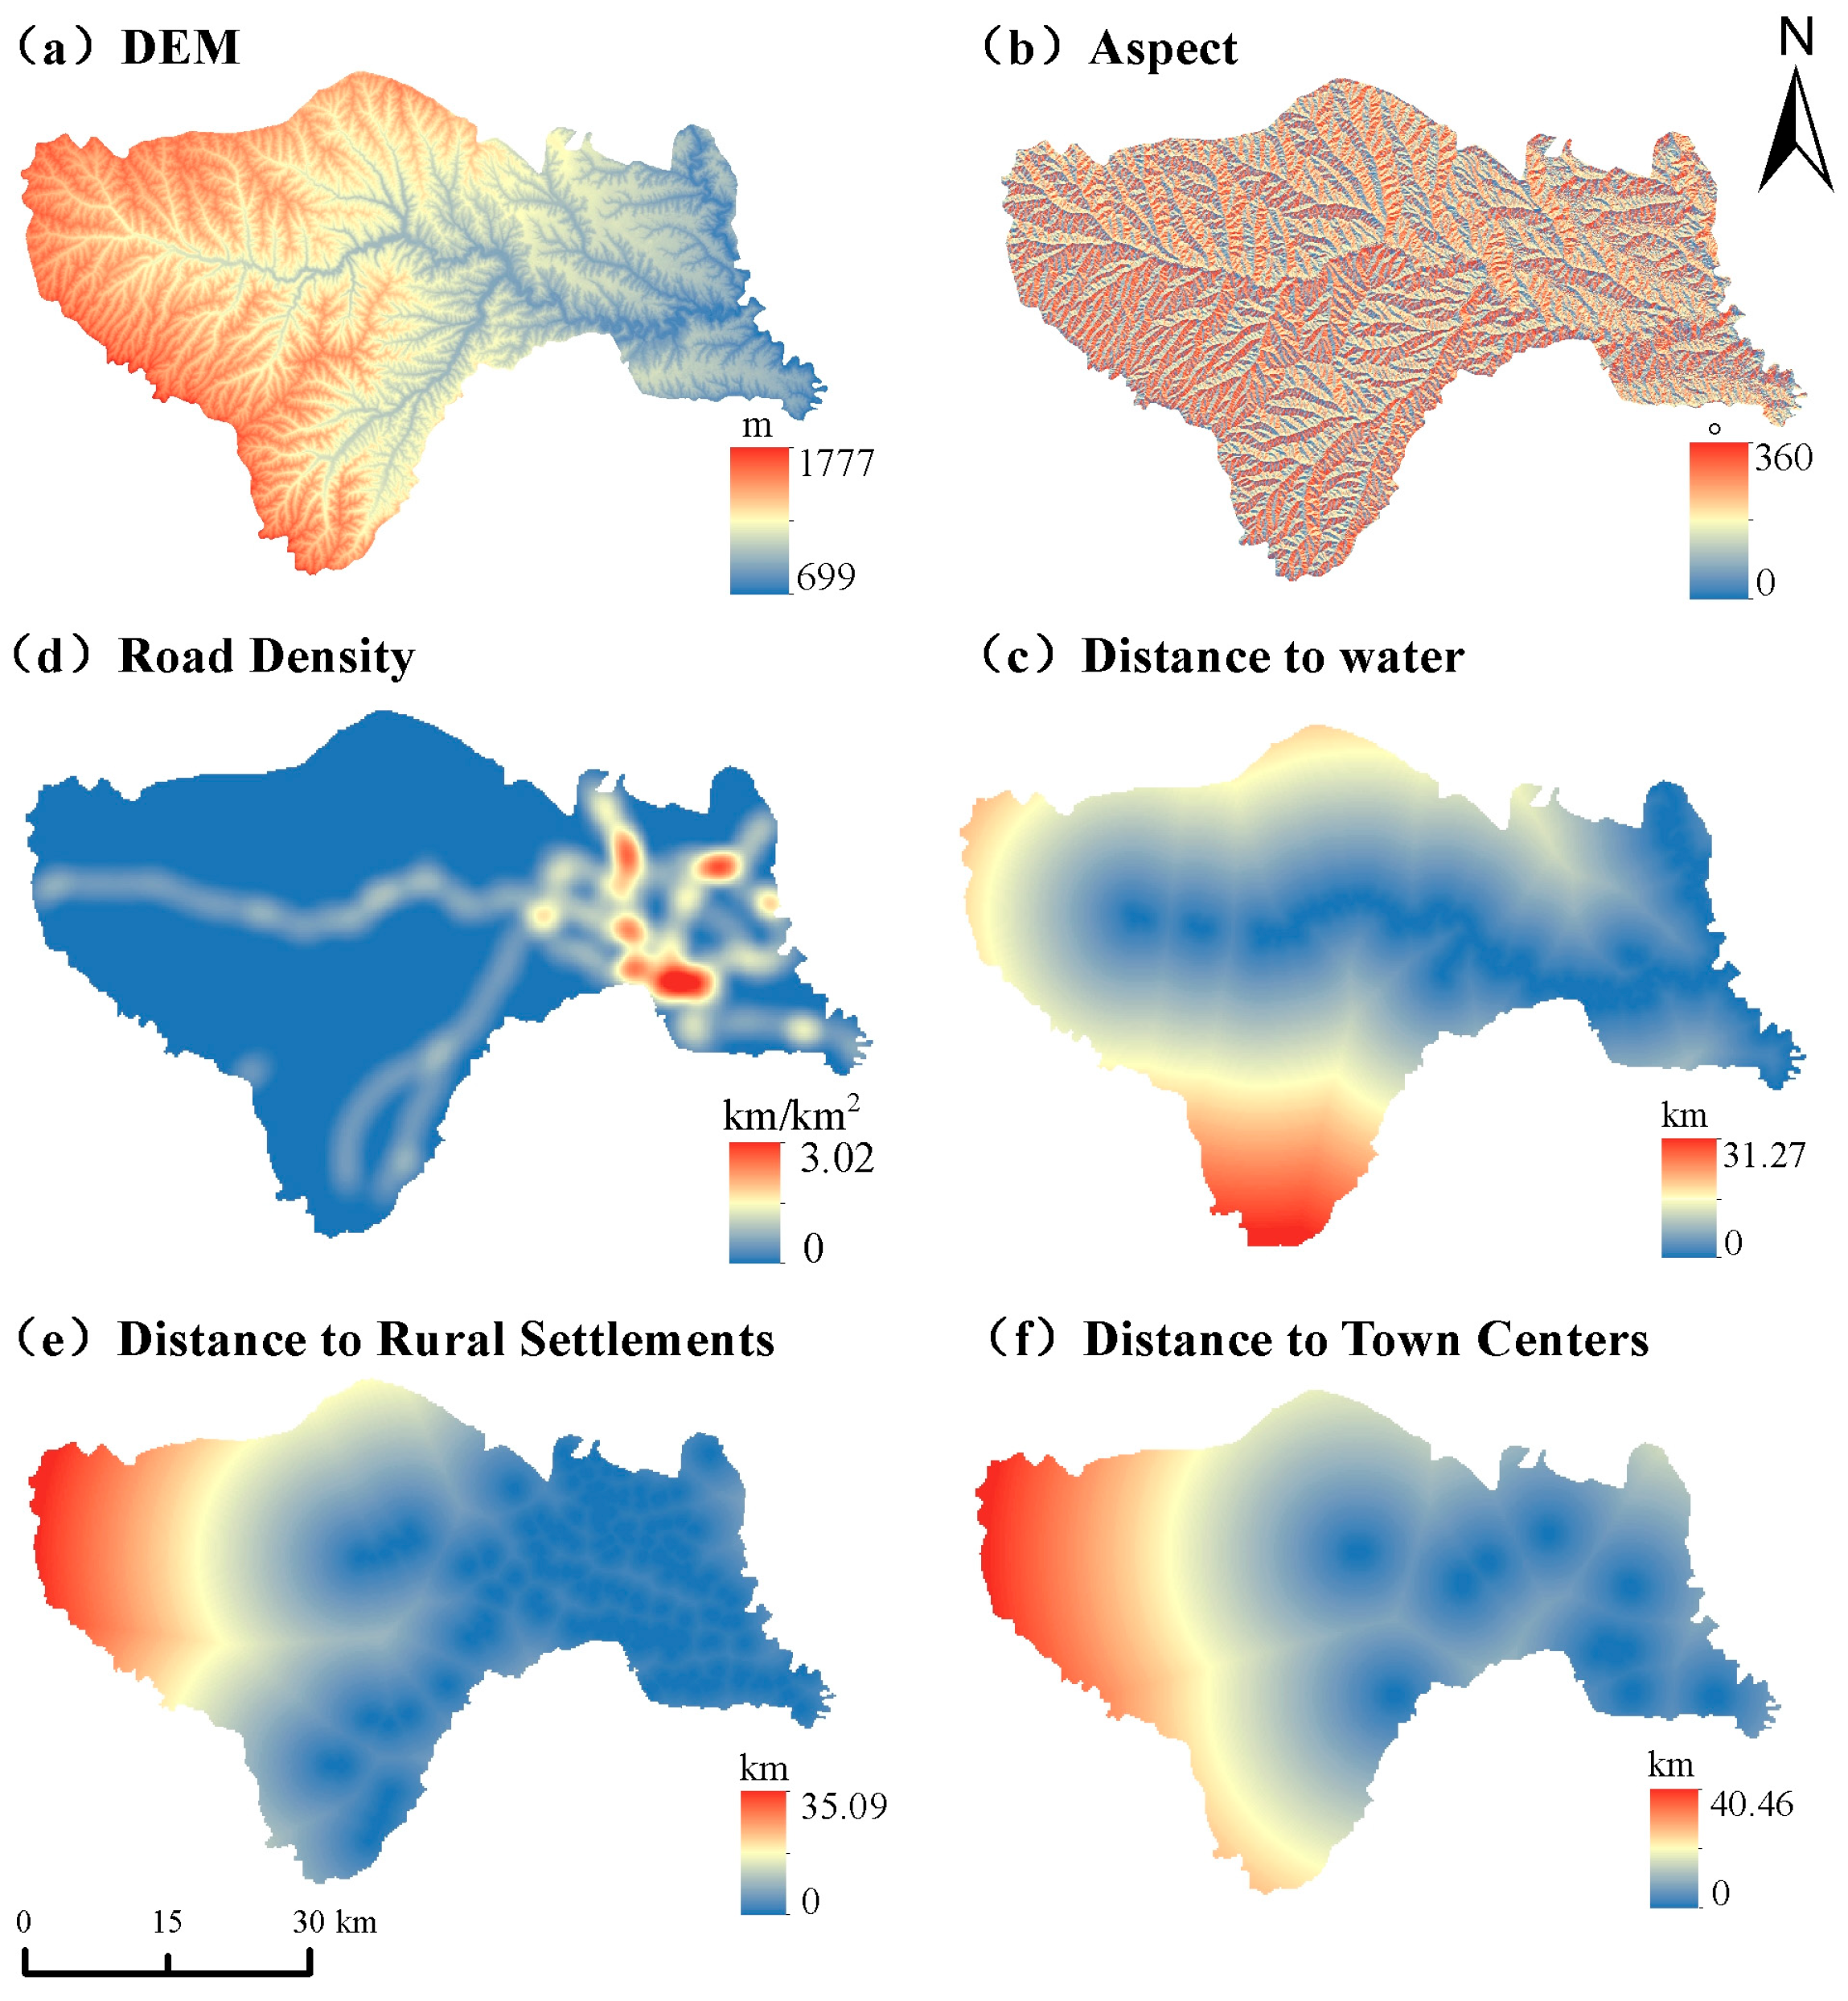
Considering previous research findings and the regional characteristics of Huangling County, six land-use change driving factors were selected as input variables for the LEAS module [13,31]. These factors comprised natural and locational variables, including elevation and aspect as natural factors, and distance to rivers, road density, distance to rural settlements, and distance to urban centers as locational factors. All driving factors were standardized into raster layers with a consistent spatial resolution to capture the spatial heterogeneity of land-use change. Their spatial distributions are presented (Figure 2).
Figure 2.
Spatial distribution of driving factors for land-use simulation: (a) DEM; (b) Aspect; (c) Distance to water; (d) Road Density; (e) Distance to Rural Settlements; (f) Distance to Town Centers.
- (2)
- Cellular Automata based on Random Seeds (CARS)
The CARS module employs the development probability surfaces derived from the LEAS module to simulate land-use spatial dynamics. By integrating a random patch seed mechanism with a cellular automata (CA) framework, the module captures the patch-based expansion and competition processes among different land-use types. The comprehensive transition probability of each cell converting to a specific land-use type is determined by considering the development probability, neighborhood effects, and adaptive inertia coefficients, which can be expressed as follows:
where denotes the overall transition probability of cell i being converted into land-use type k at time t; is the development probability derived from the LEAS module; is represents the neighborhood effect, reflecting the influence of neighboring cells with the same land-use type on the conversion probability of the target cell; and represents the adaptive inertia coefficient, which regulates the discrepancy between the projected land-use demand and the simulated results.
During the simulation process, land-use allocation is performed based on the comprehensive transition probability, neighborhood effects, and adaptive inertia competition mechanism. The expansion processes of different land-use types are simulated through random patch generation and iterative cellular automata operations, resulting in the spatial distribution pattern of land use in the target year [9].
2.3.4. Model Validation
To validate the performance of the PLUS model, a hindcast simulation was conducted by using the 2010 land-use map to predict the 2020 land-use pattern. The simulated 2020 land-use map was then compared with the observed land-use map. Model accuracy was evaluated using the overall accuracy (OA) and Kappa coefficient [32]. OA indicates the ratio of correctly classified cells to the total number of cells, whereas the Kappa coefficient quantifies the agreement between the simulated and actual land-use distributions. The calculation is expressed as follows:
where P0 denotes the observed agreement, namely the overall classification accuracy, which is calculated as the proportion of the sum of diagonal elements in the confusion matrix to the total number of samples; Pe denotes the expected agreement by chance, derived from the row and column marginal totals of the confusion matrix. The Kappa coefficient ranges from −1 to 1, and higher values indicate a greater consistency between the simulated and reference land-use patterns. OA and the Kappa coefficient were jointly used to evaluate the reliability of the PLUS model, providing a basis for subsequent land-use scenario simulations.
2.3.5. Scenario Design
Based on the 2020 land-use pattern, four future development scenarios were designed to simulate land-use changes in 2030 by integrating historical land-use trajectories and regional development objectives of Huangling County. The scenarios included the Natural Development Scenario (NDS), Farmland Protection Scenario (FPS), Economic Development Priority Scenario (EDS), and Sustainable Development Scenario (SDS). The NDS represents a continuation of historical land-use transition trends without additional constraints. The FPS aims to minimize cropland loss by imposing stricter restrictions on cropland conversion. The EDS focuses on meeting the demand for built-up land expansion to facilitate urbanization and socioeconomic growth. The SDS incorporates ecological conservation, farmland preservation, and development needs to promote balanced and sustainable land-use allocation [33,34].
The 2030 land-use demand under the NDS was estimated using a Markov chain based on historical land-use transition patterns and served as the baseline for the other three scenarios. The land-use demand for the FPS, EDS, and SDS was then adjusted from this baseline according to their respective scenario objectives. These demand adjustments were implemented alongside scenario-specific land-use transition rules to simulate alternative land-use patterns in 2030 [22,35,36,37]. The projected land-use demand for each land-use category under the four scenarios is presented in Table 3.
Table 3.
Projected land-use demand under different scenarios in 2030 (km2).
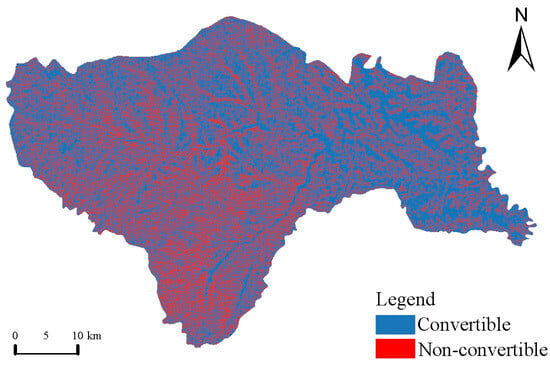
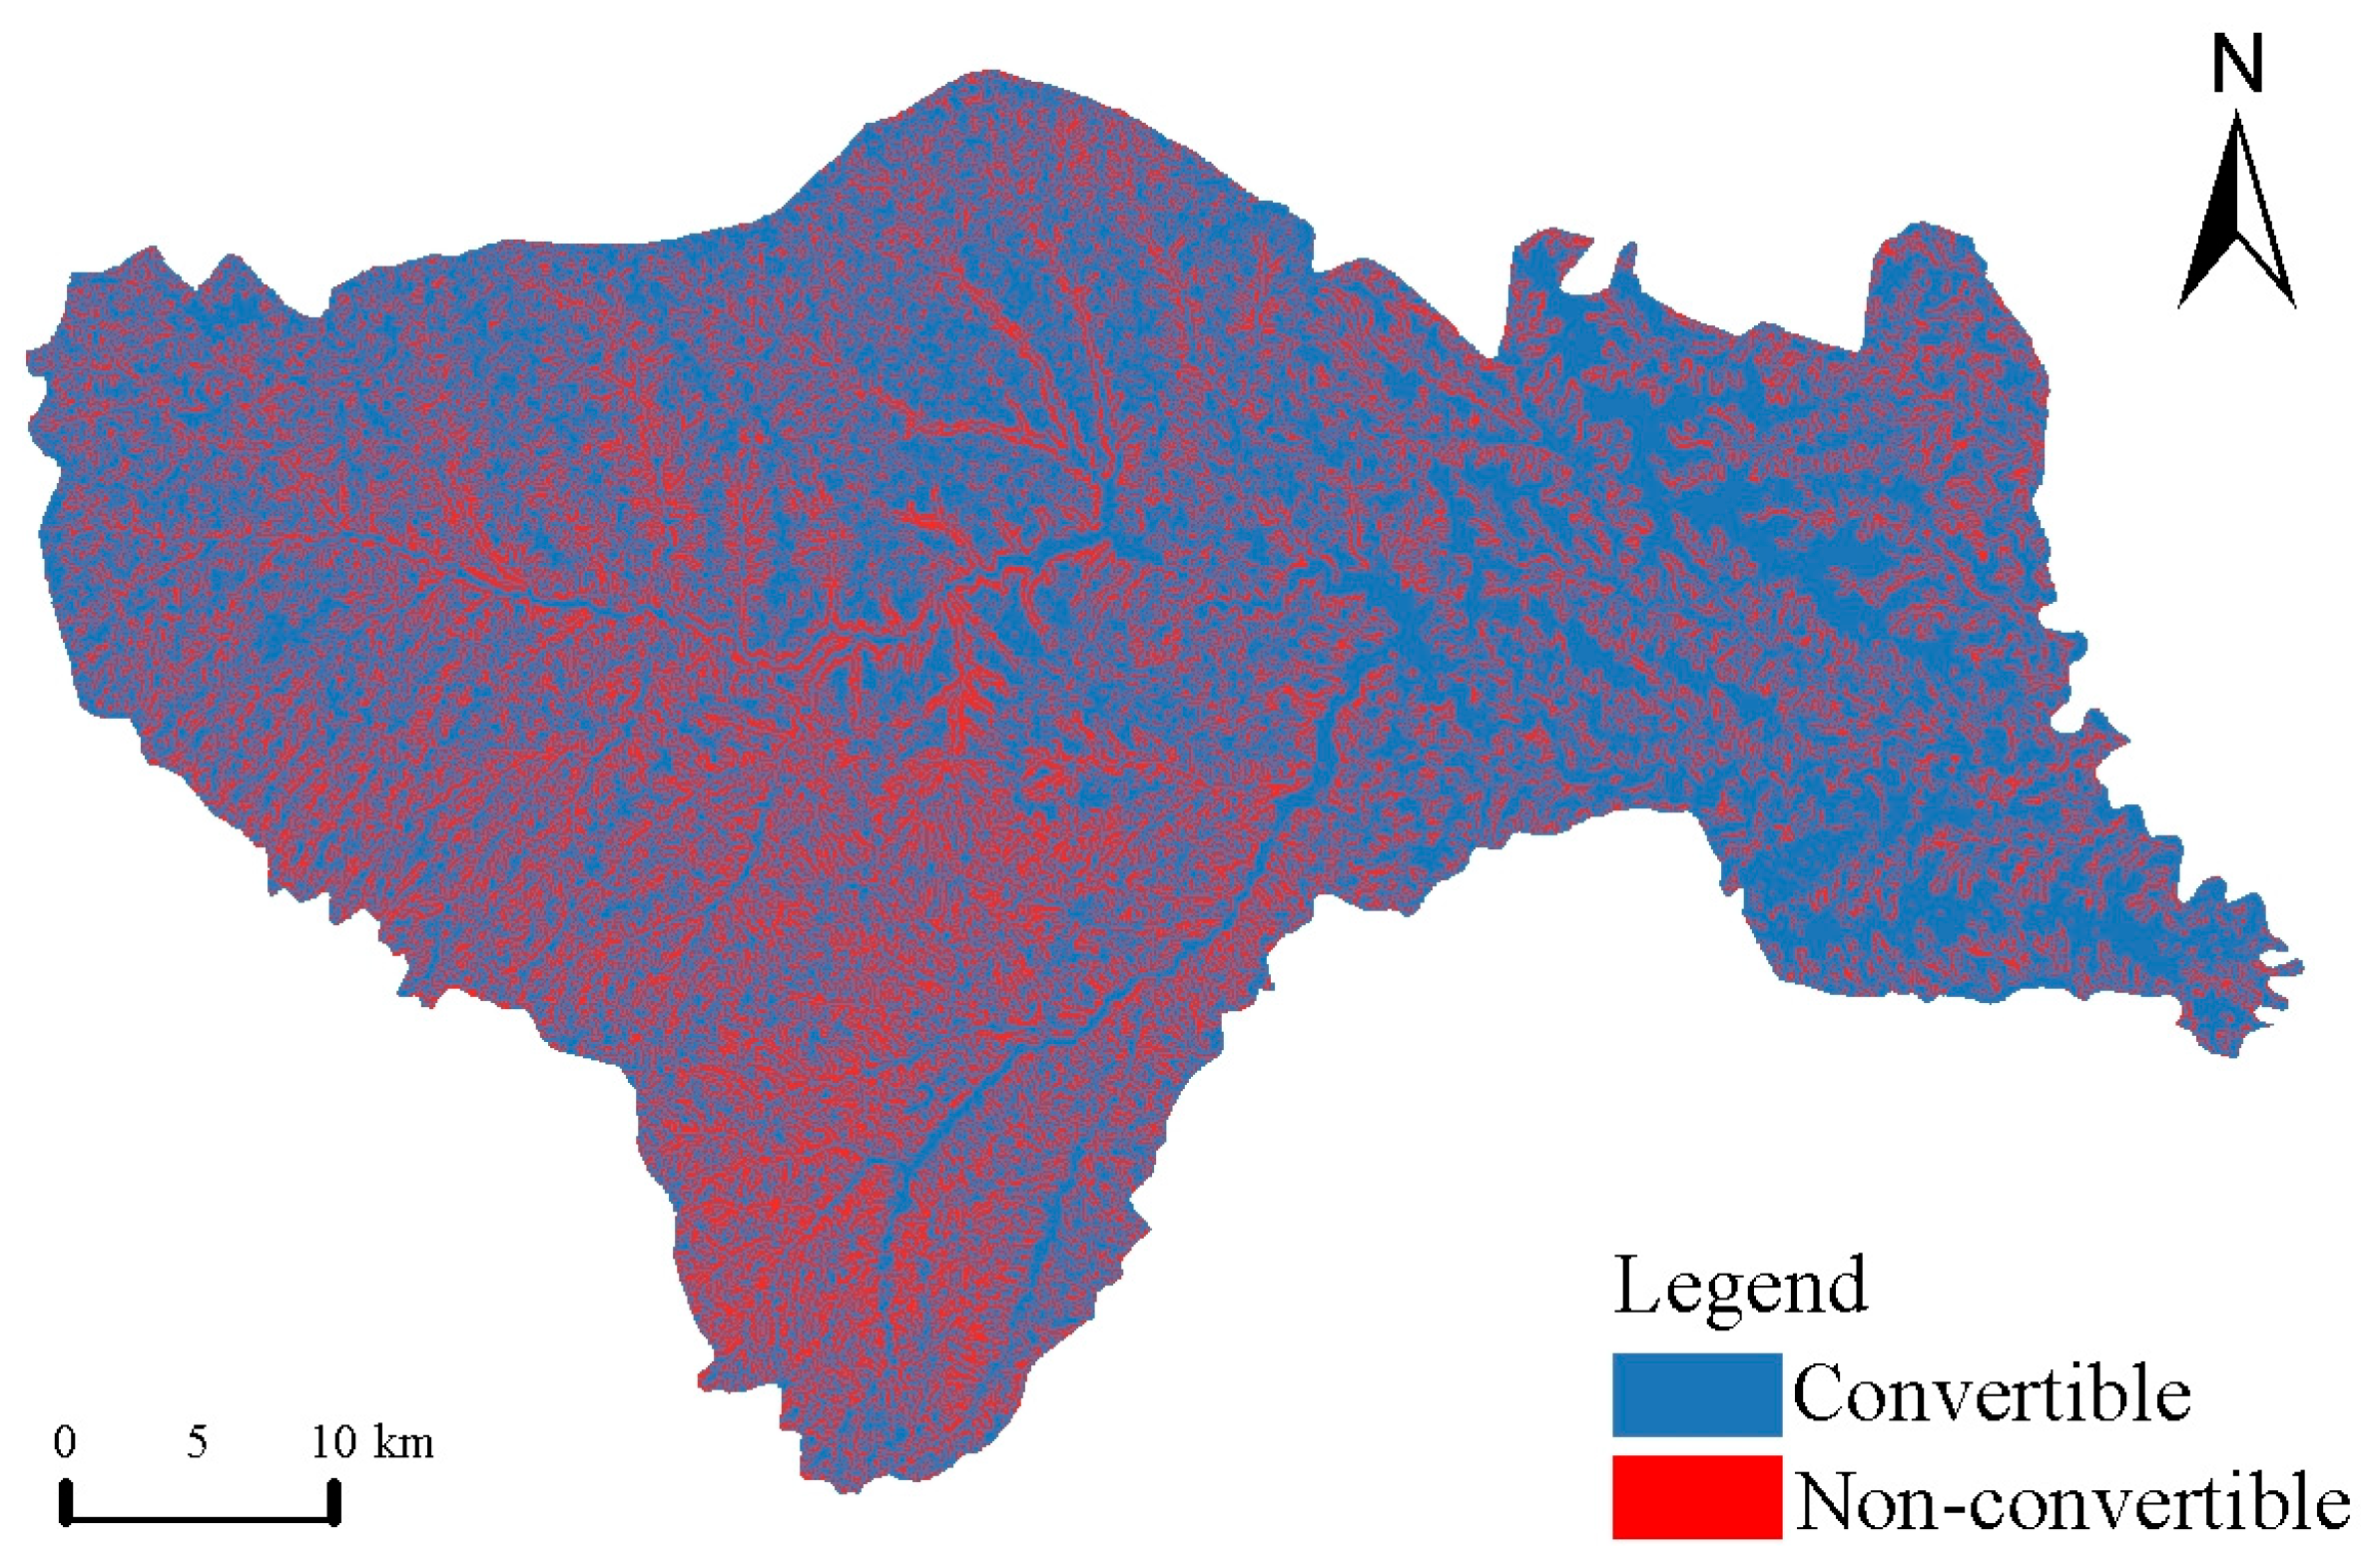
To enhance the reliability and realism of the simulated results, land-use transition constraints were incorporated according to the characteristics of Huangling County [36,38]. Within constrained areas, land-use types were restricted from conversion, while land-use transitions in non-constrained areas were permitted following the predefined transition rules. The spatial distribution of land-use transition constraints is shown (Figure 3).
Figure 3.
Land-use transition constraint matrix.
Accordingly, scenario-specific land-use transition rule matrices were constructed to regulate the allowable conversion pathways and constraints among different land-use categories [39,40]. The detailed rules are provided in (Table 4). In the transition rule matrices, A–E represent cultivated land, forest, grassland, water area, and built-up land, respectively.
Table 4.
Land-use transition rule matrices under different development scenarios.
2.3.6. Geographic Detector
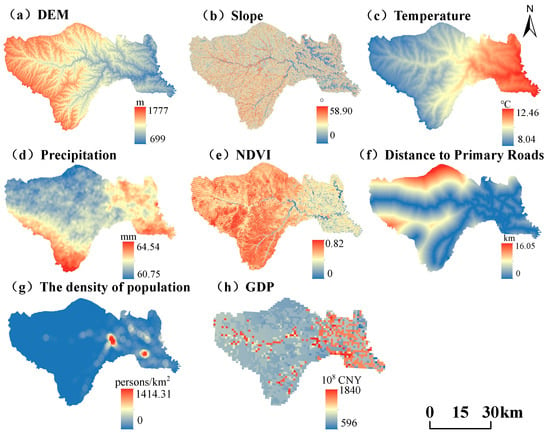
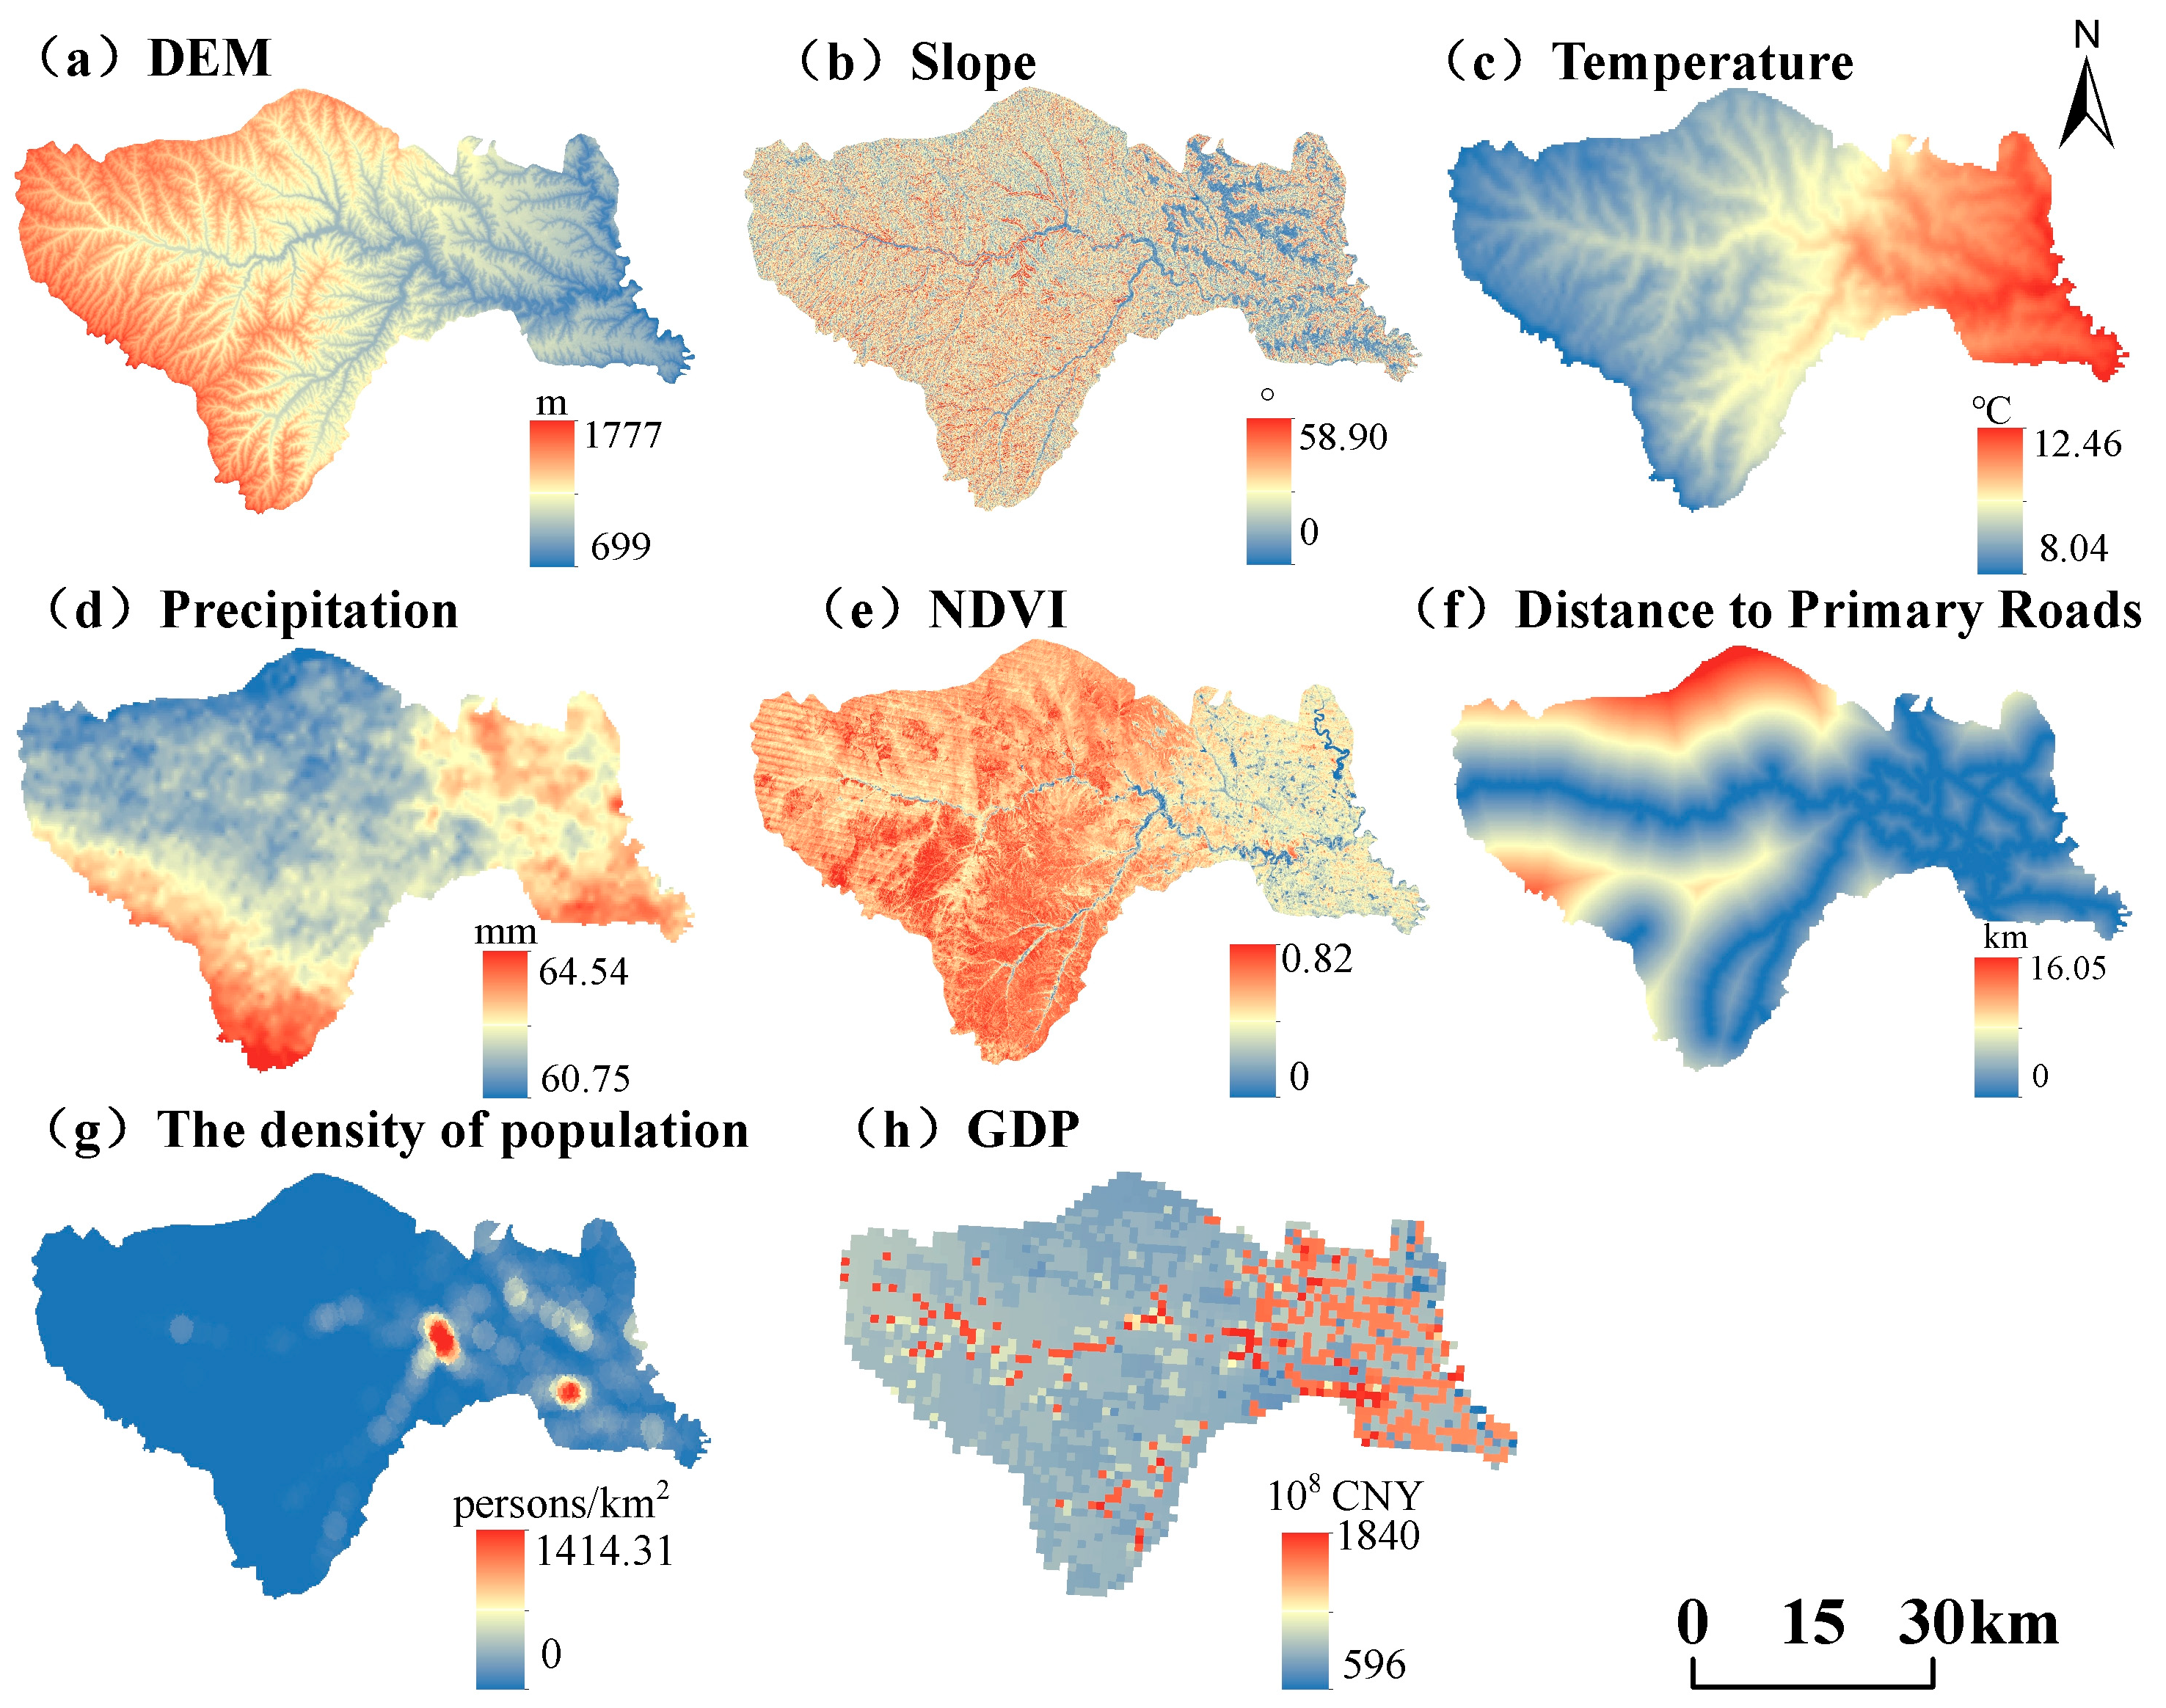
To identify the dominant drivers and their interactive effects on the spatial differentiation of ecosystem carbon stocks in Huangling County, the Geodetector model was employed to quantify the driving mechanisms [41]. Based on the regional topography, ecological characteristics, and anthropogenic influences, eight explanatory variables were selected, including elevation, slope, temperature, precipitation, NDVI, distance to major roads, population density, and GDP. Elevation, slope, temperature, precipitation, and NDVI were used to represent natural environmental conditions; land-use type reflected surface cover characteristics; and distance to major roads, population density, and GDP represented human activity intensity. The spatial distributions of these driving factors are presented (Figure 4).
Figure 4.
Spatial distribution of driving factors influencing ecosystem carbon stocks: (a) DEM; (b) Slope; (c) Temperature; (d) Precipitation; (e) NDVI; (f) Distance to Primary Roads; (g) The density of population; (h) GDP.
Before conducting the GeoDetector analysis, the variance inflation factor (VIF) was used to assess multicollinearity among the eight explanatory variables. The VIF for the (i)-th explanatory variable was calculated as follows [42,43]:
where is the coefficient of determination obtained by regressing the (i)-th explanatory variable against the remaining explanatory variables. Higher VIF values indicate stronger multicollinearity. The VIF results were used to assess potential multicollinearity among the selected explanatory variables.
To satisfy the categorical data requirements of the Geodetector model, continuous variables, including elevation, slope, precipitation, temperature, NDVI, GDP, distance to major roads, and population density, were discretized using the natural breaks classification method and divided into five classes.
Factor detection and interaction detection were applied to quantify the driving mechanisms of carbon stock spatial differentiation. Factor detection evaluates the explanatory power of each individual factor for the spatial variation of carbon stocks, which is calculated as follows [41]:
where q denotes the explanatory power of a given factor in accounting for the spatial differentiation of carbon stocks, with values ranging from 0 to 1; h represents the stratification unit; L indicates the number of strata; Nh and N are the sample sizes of stratum h and the entire study area, respectively; and and σ2 represent the variances of stratum h and the overall area, respectively. Higher q values indicate greater explanatory power of the factor for the spatial differentiation of carbon stocks.
Interaction detection was applied to evaluate the effects of factor interactions on the spatial differentiation of carbon stocks. The interaction relationships among factors were identified by comparing the q-values of individual factors with those of their pairwise combinations, thereby revealing the multi-factor synergistic mechanisms driving the spatial patterns of carbon stocks.
3. Results
3.1. Spatiotemporal Dynamics of Land-Use Change in Huangling County
3.1.1. Land-Use Composition and Quantitative Change Characteristics
Statistical analysis of land-use data from 1990, 2000, 2010, and 2020 (Table 5) showed that the land-use composition of Huangling County remained relatively stable during the study period and was consistently dominated by forestland and grassland. Forestland represented the largest land-use category, accounting for 58.16–64.15% of the total area, followed by grassland (20.24–26.59%). These two ecological land types jointly occupied more than 84% of the study area, highlighting the strong ecological land dominance of Huangling County. Cropland accounted for approximately 13%, serving as the primary productive land type. In contrast, built-up land and water bodies occupied limited proportions (<2% and <1%, respectively), and their contributions to overall land-use structure were relatively minor.
Table 5.
Areas and proportions of different land-use types during 1990–2020.
Land-use changes in Huangling County from 1990 to 2020 showed clear stage-specific characteristics (Table 6). During 1990–2000, changes in individual land-use types were relatively limited, indicating a stable land-use pattern. Cropland increased by 10.60 km2, whereas grassland decreased by 12.34 km2. During 2000–2010, land-use transitions intensified, with built-up land expanding by 13.40 km2 and exhibiting the greatest increase among all land-use categories. During 2010–2020, the land-use pattern underwent significant transformations, characterized by a sharp decline in forestland (−137.28 km2) and a substantial increase in grassland (+145.31 km2). These changes were much greater than those of other land-use types and represented the dominant land-use transition during the study period.
Table 6.
Changes in the areas of different land-use types (km2).
Overall, the land-use composition of Huangling County remained relatively stable from 1990 to 2020; however, internal transitions among ecological land types and the expansion of built-up areas showed an increasing trend over time.
3.1.2. Evolution of Land-Use Spatial Patterns
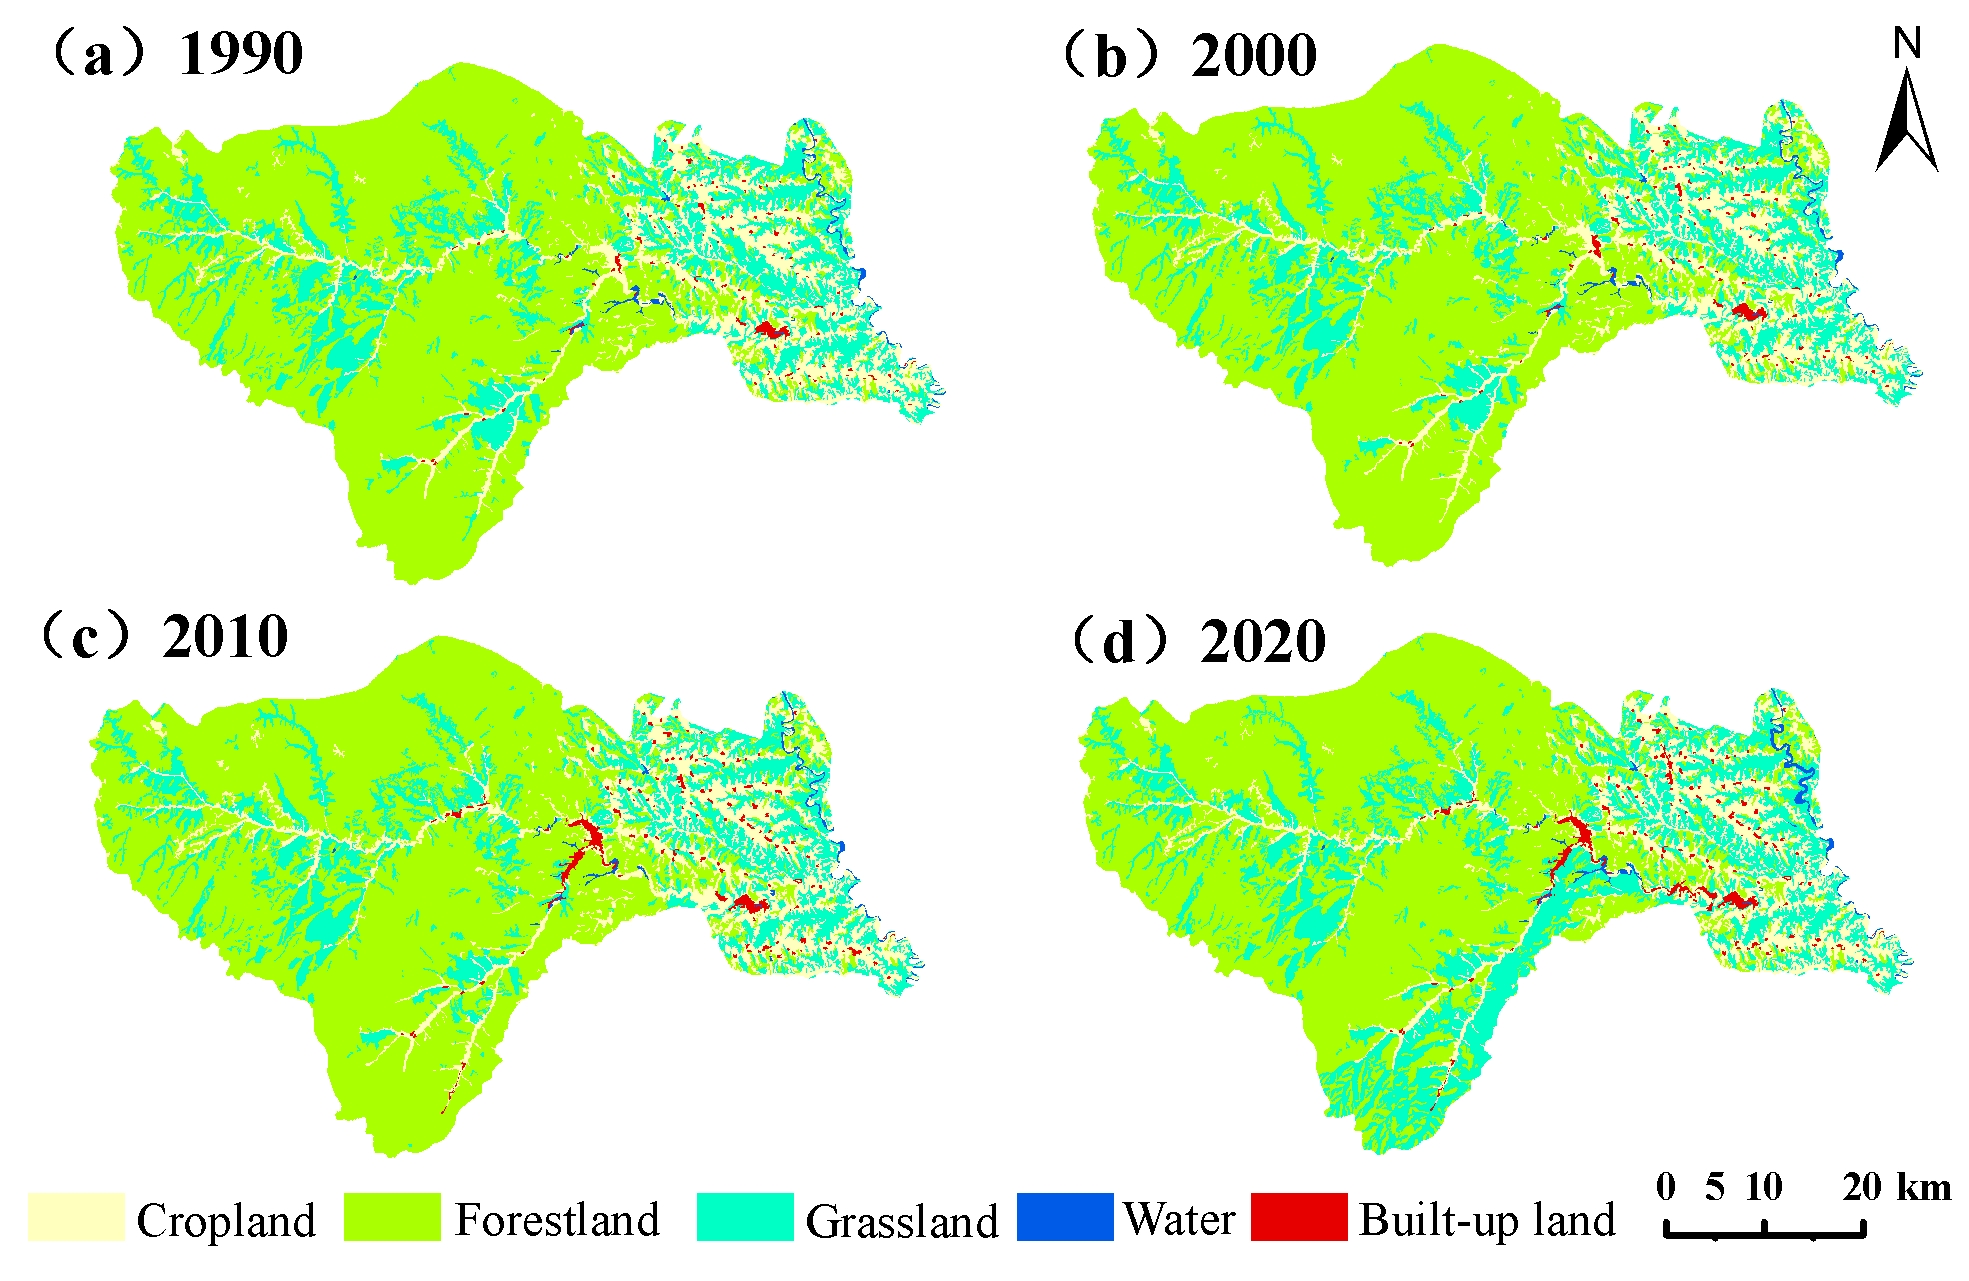
The spatial distribution of land use in Huangling County during 1990–2020 demonstrated pronounced topographic differentiation (Figure 5). Forestland and grassland were extensively distributed throughout the hilly and gully landscapes, constituting the primary ecological space of the study area. Cropland was mainly located in low-relief areas, including river valleys and loess tablelands, while built-up land exhibited a clustered and linear expansion pattern along the county center and major transportation networks. Water bodies accounted for a small proportion of the landscape and were mainly distributed along rivers, reservoirs, and localized depressions.
Figure 5.
Spatial distribution of land use in Huangling County in 1990, 2000, 2010, and 2020.
Temporally, land-use patterns remained relatively stable during 1990–2000. Between 2000 and 2010, built-up land expanded rapidly, mainly around the county center and along major transportation corridors. From 2010 to 2020, ecological land transitions became more pronounced, characterized by the conversion of forestland to grassland and the emergence of new spatial patches. Meanwhile, built-up land continued to expand from existing urban areas, further strengthening spatial clustering.
3.1.3. Characteristics of Land-Use Transitions
From 1990 to 2020, land-use transitions in Huangling County were dominated by exchanges among forestland, grassland, and cropland, alongside the expansion of built-up land (Table 7). Forestland-to-grassland conversion was the largest transition (152.23 km2), followed by grassland-to-forestland conversion (21.27 km2). Cropland was mainly converted to grassland (9.14 km2), built-up land (16.52 km2), and forestland (5.16 km2), while grassland and forestland also contributed 18.97 km2 and 6.34 km2 to cropland, respectively.
Table 7.
Land-use transition matrix for Huangling County from 1990 to 2020 (km2).
During this period, forestland decreased from 1464.76 to 1331.88 km2 (−132.88 km2), whereas grassland increased from 489.65 to 608.82 km2 (+119.17 km2). Cropland declined slightly from 311.06 to 304.39 km2, while built-up land expanded from 12.58 to 30.12 km2. Water bodies increased modestly from 11.97 to 14.81 km2. Overall, land-use change was characterized by forestland loss, grassland expansion, and substantial growth in built-up land.
3.2. Spatiotemporal Dynamics of Ecosystem Carbon Stocks in Huangling County
3.2.1. Temporal Dynamics of Carbon Stocks
Using the revised carbon density parameters for each land-use type, the InVEST model was employed to quantify carbon stock dynamics in Huangling County from 1990 to 2020 (Table 8). The results showed that total carbon stocks exhibited an overall fluctuating decline during the study period. Carbon stocks increased slightly from 5516.7 × 104 t in 1990 to 5520.81 × 104 t in 2000, followed by a continuous decrease to 5510.15 × 104 t in 2010 and 5374.62 × 104 t in 2020. Compared with the initial period, total carbon stocks decreased by 142.05 × 10⁴ t (2.57%) by 2020. Temporally, carbon stocks remained relatively stable during 1990–2000, showed a minor decline during 2000–2010, and underwent the most substantial reduction during 2010–2020, with a loss of 136.39 × 10⁴ t, indicating that the last decade was the dominant period of carbon stock decline.
Table 8.
Carbon stocks (×104 t) and contributions (%) of different land-use types in Huangling County during 1990–2020.
3.2.2. Contribution of Land-Use Transitions to Carbon Stock Changes
From 1990 to 2020, land-use transitions in Huangling County resulted in an overall net decrease in carbon storage, with different transition pathways contributing to carbon losses and gains (Table 9). The conversion of forestland to grassland was the largest contributor to carbon storage loss, involving a transition area of 152.23 km2 and reducing carbon storage by approximately 130.67 × 10⁴ t. This loss was primarily attributable to the lower carbon density of grassland compared with forestland, highlighting the importance of forestland conservation for maintaining regional carbon storage. In contrast, the conversion of grassland to forestland increased carbon storage by approximately 18.26 × 10⁴ t, demonstrating the potential of forest restoration to enhance carbon sequestration. Other carbon losses were associated with the conversion of cropland to built-up land (27.36 × 10⁴ t), cropland to grassland (5.19 × 10⁴ t), forestland to cropland (1.84 × 10⁴ t), cropland to water (4.14 × 10⁴ t), and grassland to built-up land (1.44 × 10⁴ t). Meanwhile, the conversion of grassland to cropland increased carbon storage by approximately 10.77 × 10⁴ t, while the conversion of cropland to forestland contributed a gain of 1.50 × 10⁴ t. Overall, the effects of land-use transitions on carbon storage were determined by both the area of land converted and the difference in carbon density between the initial and final land-use types. These results indicate that forestland-to-grassland conversion was the dominant pathway of carbon loss, whereas grassland-to-forestland conversion contributed to carbon sequestration in Huangling County.
Table 9.
Contribution of land-use transitions to carbon storage change from 1990 to 2020.
3.2.3. Contribution Characteristics of Carbon Stocks Among Different Land-Use Types
Carbon stocks in Huangling County were mainly contributed by forestland, grassland, and cropland, with average contribution rates of 69.42%, 16.75%, and 13.55%, respectively. Together, these three land-use types accounted for more than 99% of the total regional carbon stocks, indicating that ecological land was the dominant source of carbon storage in the study area. Forestland consistently exhibited the highest carbon stock, but its carbon storage decreased from 3891.28 × 104 t in 1990 to 3538.27 × 104 t in 2020, representing a loss of 353.01 × 10⁴ t. This decline was the primary contributor to the overall reduction in regional carbon stocks.
In contrast, grassland carbon stocks showed an increasing trend, rising from 880.49 × 10⁴ t to 1094.78 × 104 t, with an increase of 214.29 × 10⁴ t, which partially offset the carbon loss caused by forestland reduction. Cropland carbon stocks remained relatively stable, decreasing slightly from 735.97 × 10⁴ t to 720.19 × 10⁴ t, and thus had a limited influence on overall carbon stock variations. Although carbon stocks in built-up land showed a continuous increasing trend, its low carbon density and small spatial proportion resulted in an average contribution rate of only 0.28%, indicating a minor effect on regional carbon stock changes. Carbon stocks in water bodies remained unchanged during the study period and contributed little to the total carbon storage.
Overall, forestland remained the dominant contributor to carbon stocks in Huangling County, and its area changes primarily determined the regional carbon stock dynamics. Although the increase in grassland carbon stocks provided a certain compensatory effect, it was insufficient to offset the carbon losses resulting from forestland decline.
3.2.4. Spatial Distribution Characteristics of Carbon Stocks
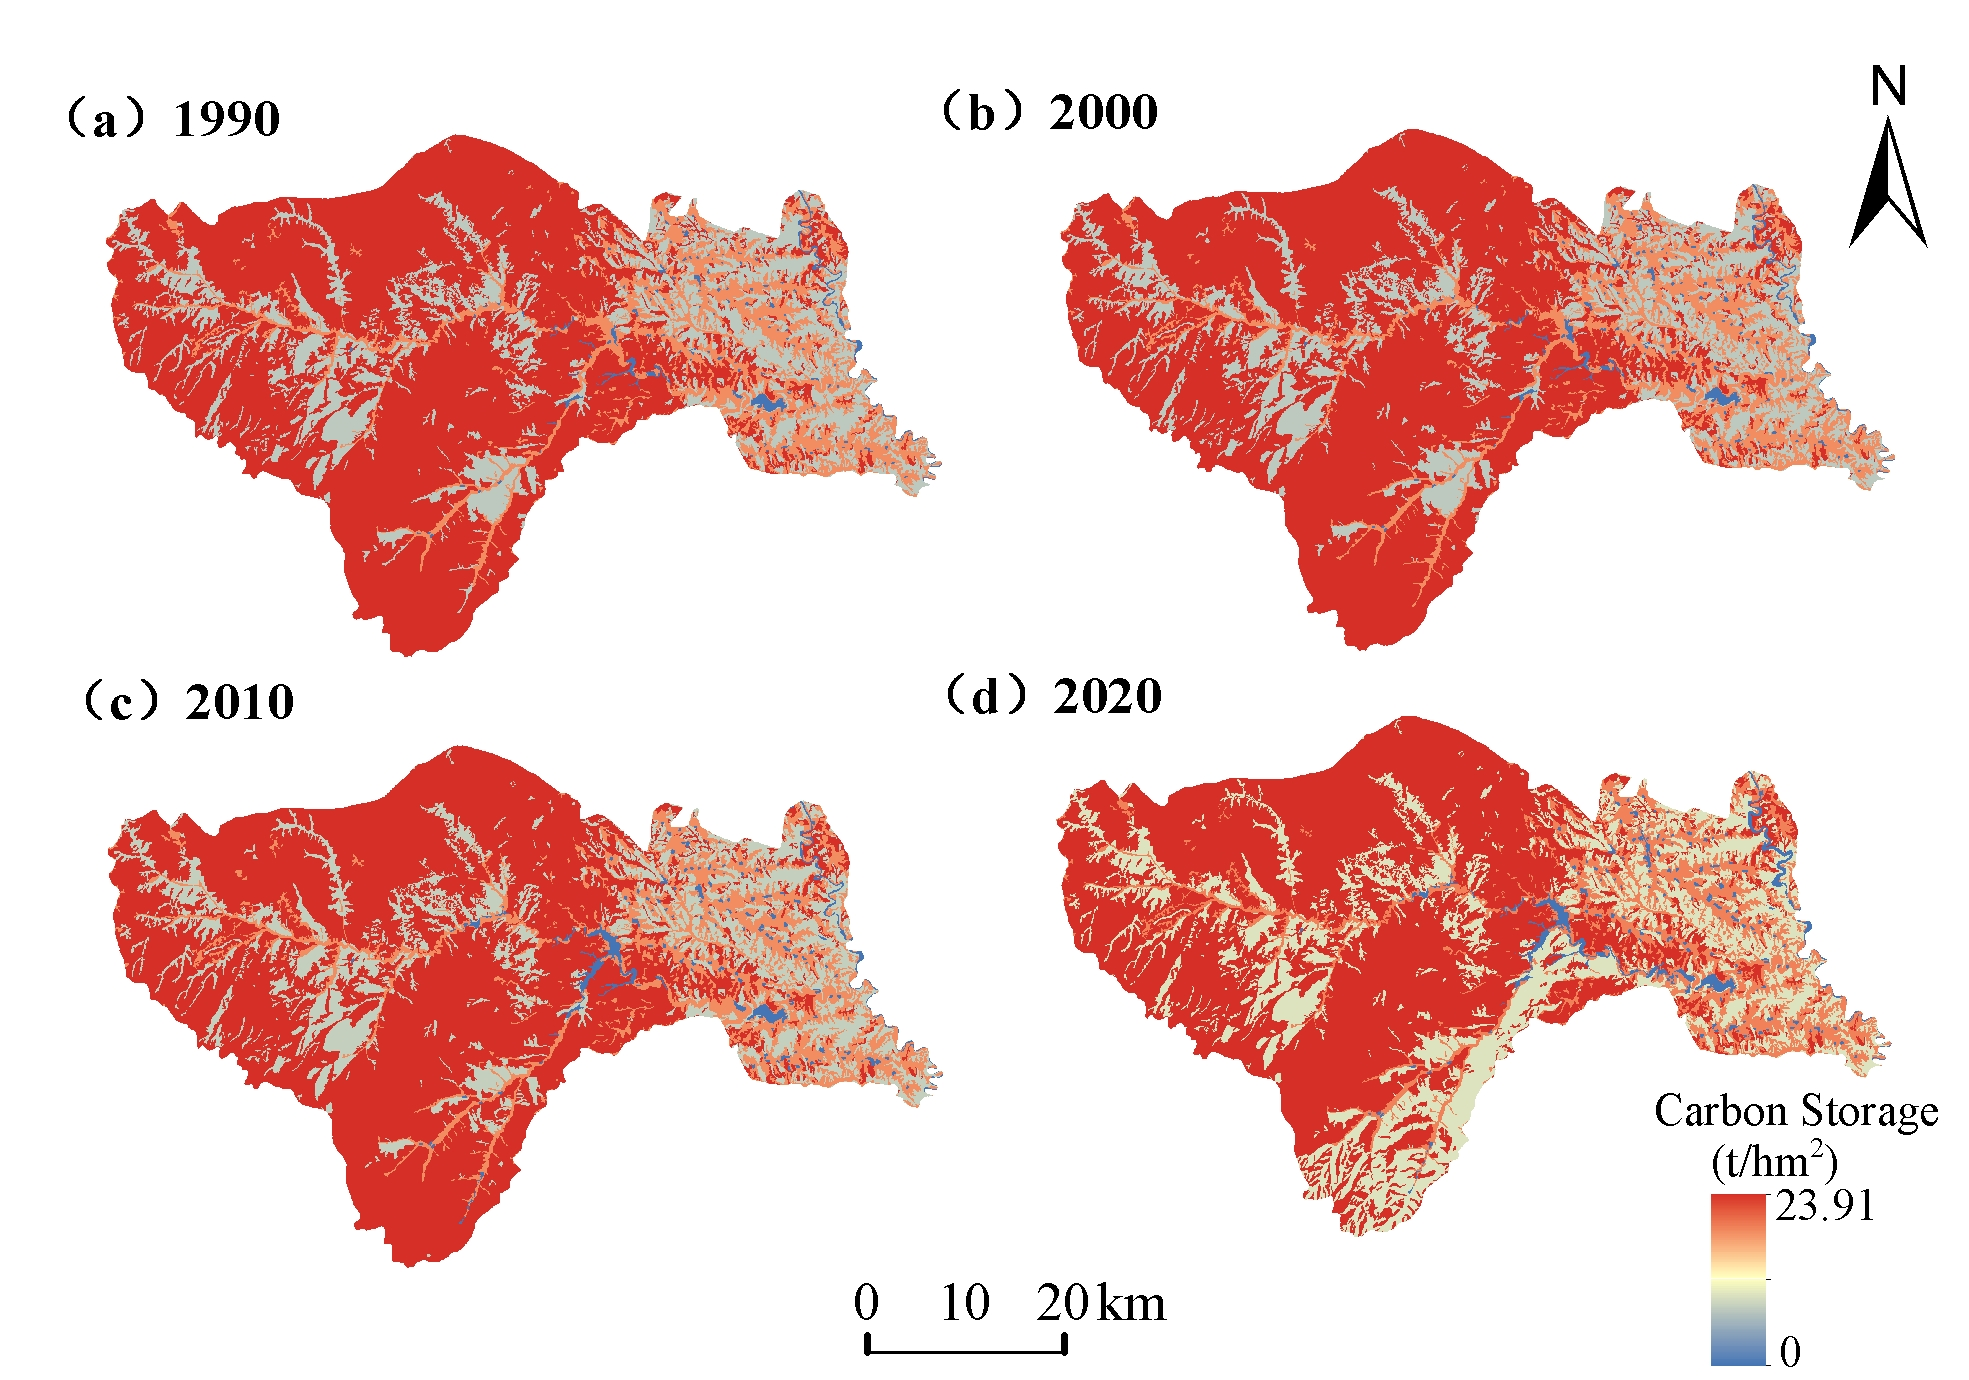
The spatial patterns of carbon stocks (Figure 6) demonstrated significant heterogeneity across Huangling County during 1990–2020. Higher carbon stocks were primarily associated with areas dominated by forestland, whereas lower carbon stocks occurred mainly in regions with extensive built-up land and cropland. High-value areas were concentrated in the hilly and mountainous zones, while low-value areas were mainly distributed around the county center, along major transportation routes, and within river valleys and loess tablelands where agricultural activities were concentrated.
Figure 6.
Spatial distribution of carbon stocks in Huangling County in 1990, 2000, 2010, and 2020.
In terms of temporal dynamics, medium- and low-value carbon stock areas expanded during 2000–2010, coinciding with areas of built-up land expansion and ecological land transitions. From 2010 to 2020, high-value carbon stock areas partially decreased, accompanied by an expansion of medium- and low-value areas, reflecting the spatial effects of forestland-to-grassland conversion.
3.2.5. Spatial Variation Characteristics of Carbon Stocks
During 1990–2020, carbon stock changes in Huangling County showed pronounced spatial differentiation, with distinct areas of carbon gain and loss (Figure 7). Carbon stock increases mainly occurred in regions with enhanced vegetation restoration and grassland expansion, whereas carbon stock declines were concentrated in areas affected by forestland loss, built-up land expansion, and cropland conversion. Areas with minor carbon stock changes were primarily distributed in regions with relatively stable land-use patterns.
Figure 7.
Spatial distribution of changes in ecosystem carbon stocks in Huangling County during 1990–2020.
Carbon stock loss areas exhibited mainly patchy and linear spatial patterns, corresponding closely to built-up land expansion areas and ecological land transition zones. Carbon stock gains were mainly observed in areas undergoing ecological restoration. Because the extent and magnitude of carbon stock losses exceeded those of carbon stock gains, Huangling County experienced a net reduction in total carbon stocks during the study period, consistent with the temporal dynamics of carbon stocks.
3.3. Driving Forces of Spatial Differentiation of Carbon Stocks in Huangling County
To facilitate graphical representation, elevation, slope, temperature, precipitation, NDVI, distance to major roads, population density, and GDP were denoted as X1–X8, respectively.
3.3.1. Multicollinearity Analysis Based on VIF
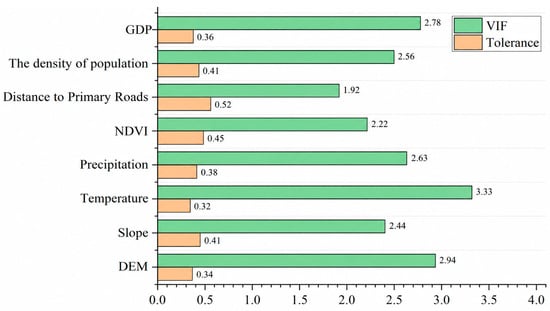
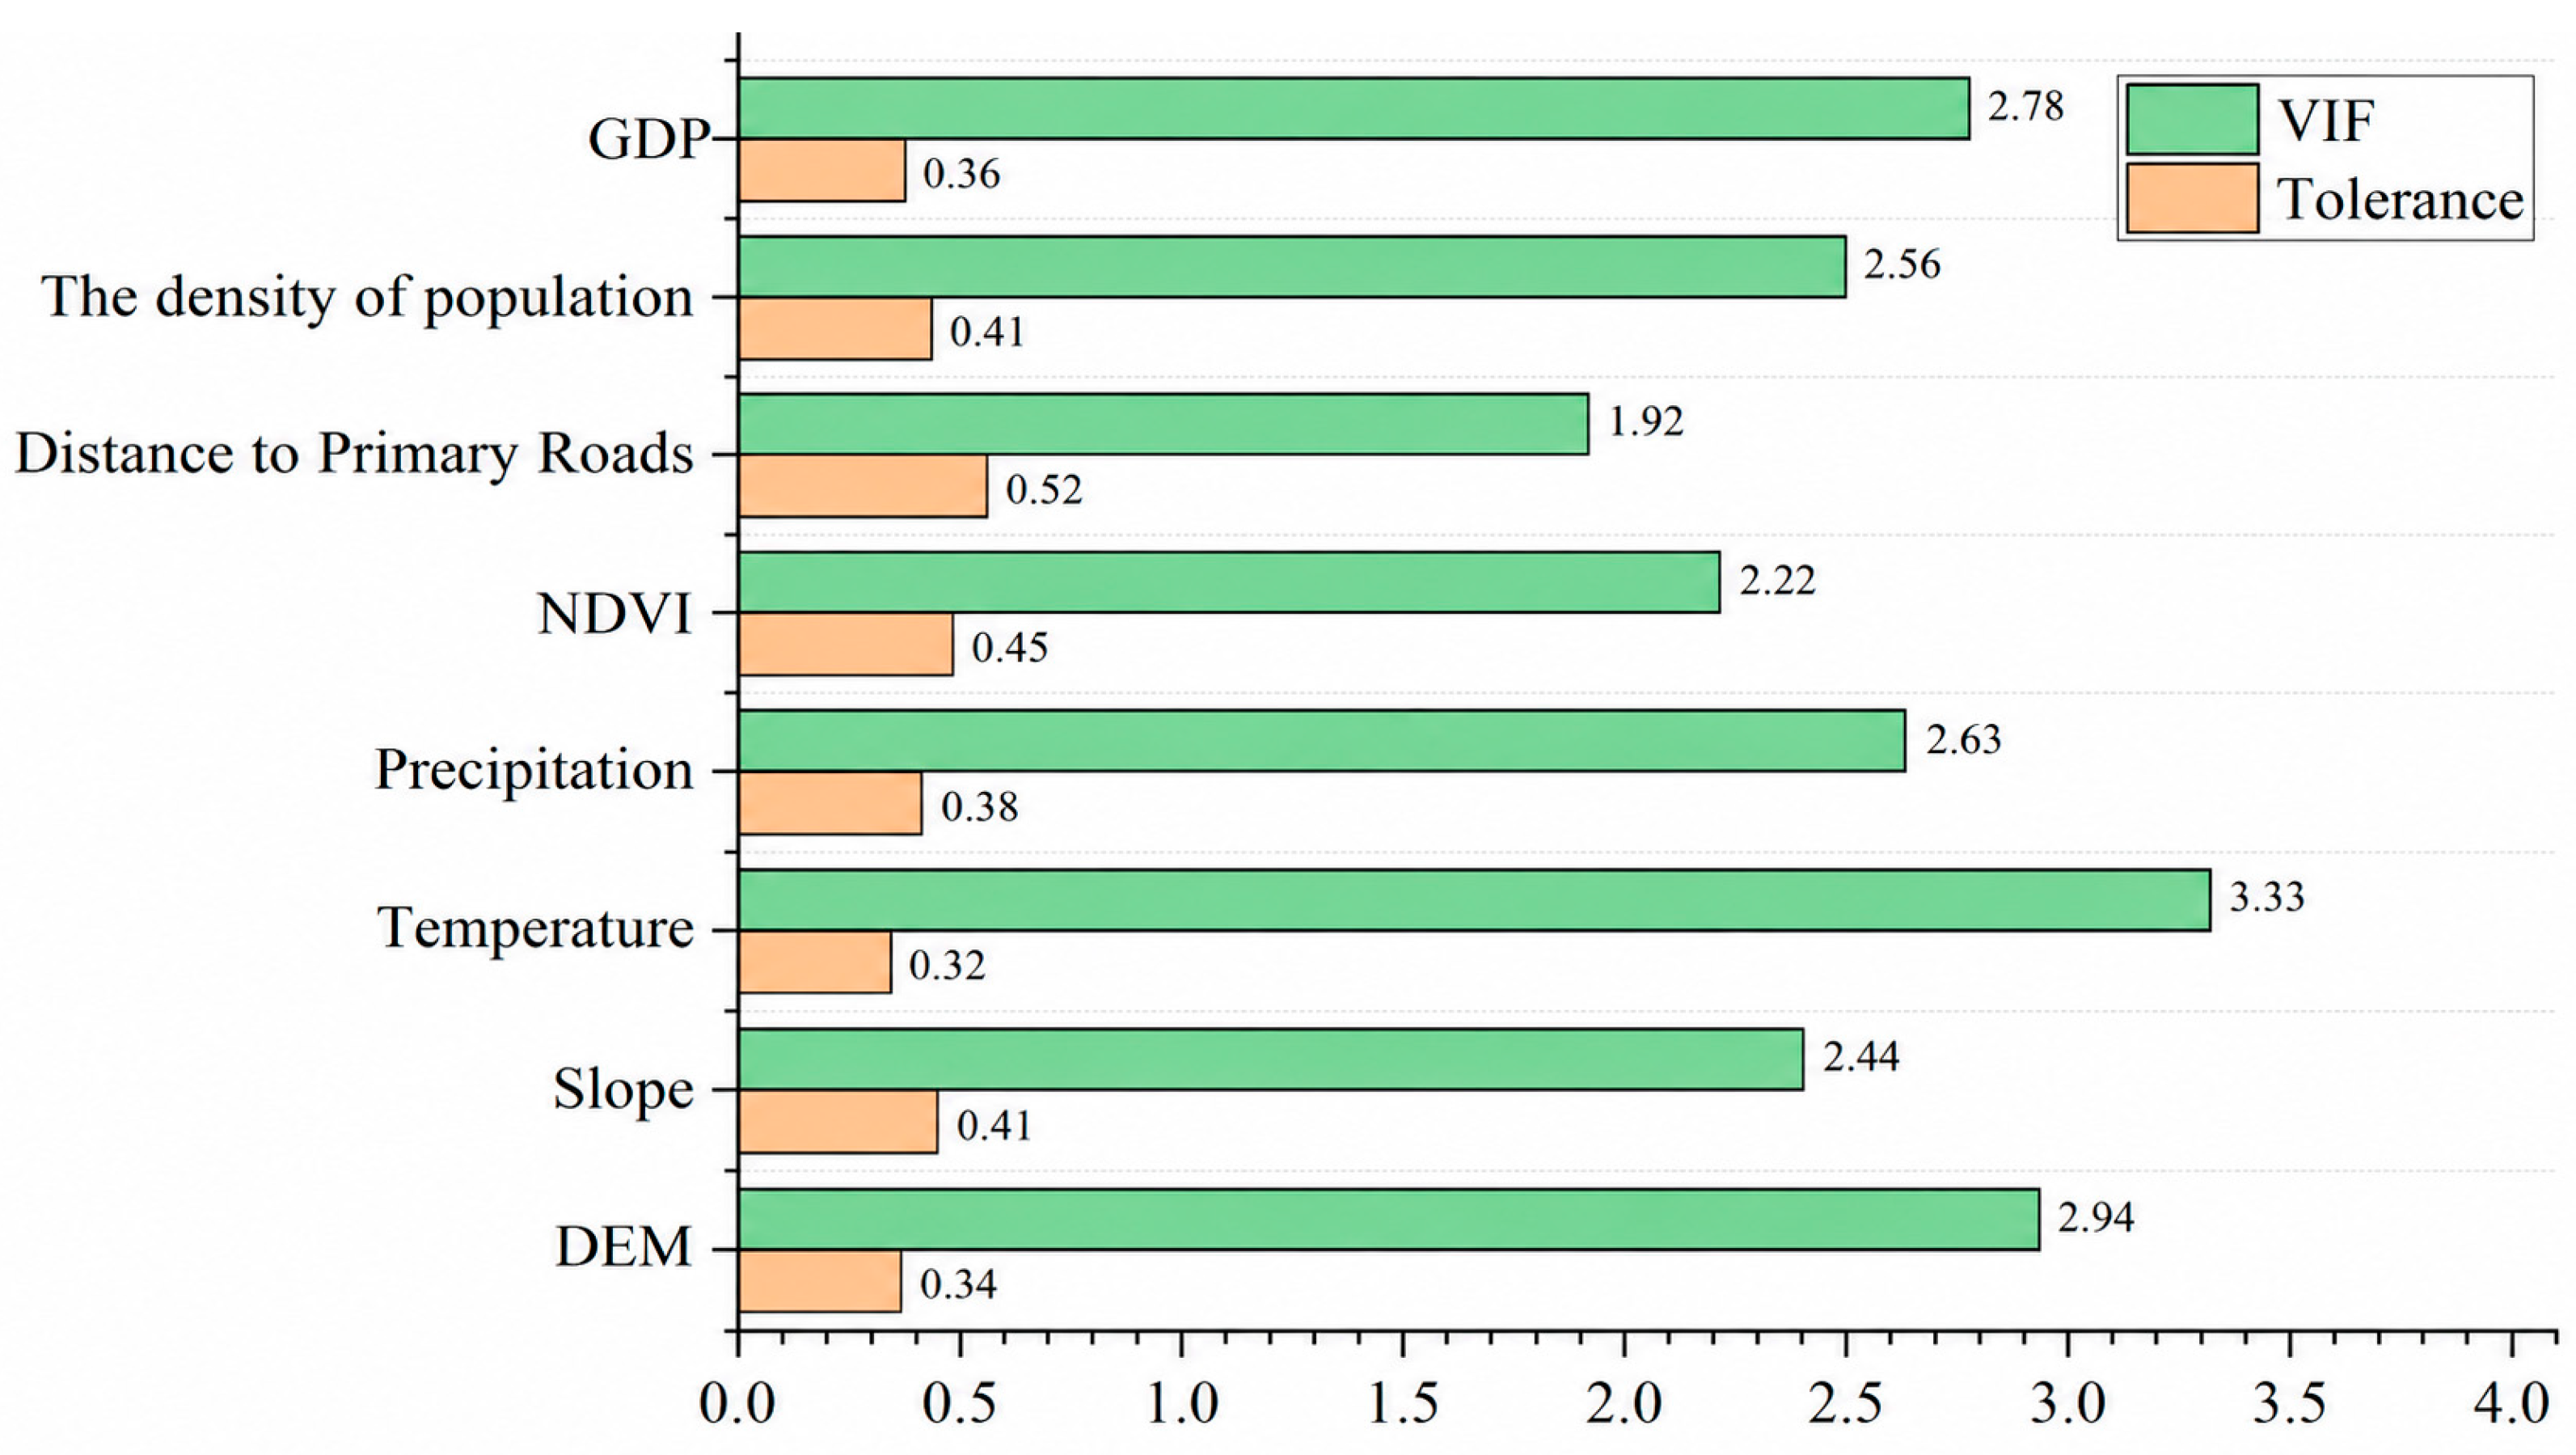
Variance inflation factor (VIF) and tolerance analyses were conducted to assess multicollinearity among the eight explanatory variables (Figure 8). The VIF values ranged from 1.92 to 3.33, while the tolerance values ranged from 0.32 to 0.52. All variables had VIF values below 5 and tolerance values above 0.2, indicating that multicollinearity was not a major concern. Temperature had the highest VIF (3.33), whereas distance to major roads had the lowest (1.92). These results support the use of the selected variables in subsequent GeoDetector analysis.
Figure 8.
VIF and tolerance values of the eight explanatory variables.
3.3.2. Results of Single-Factor Detection
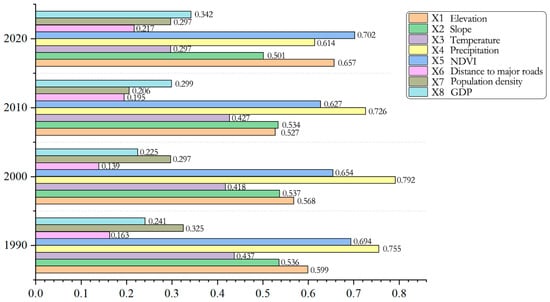
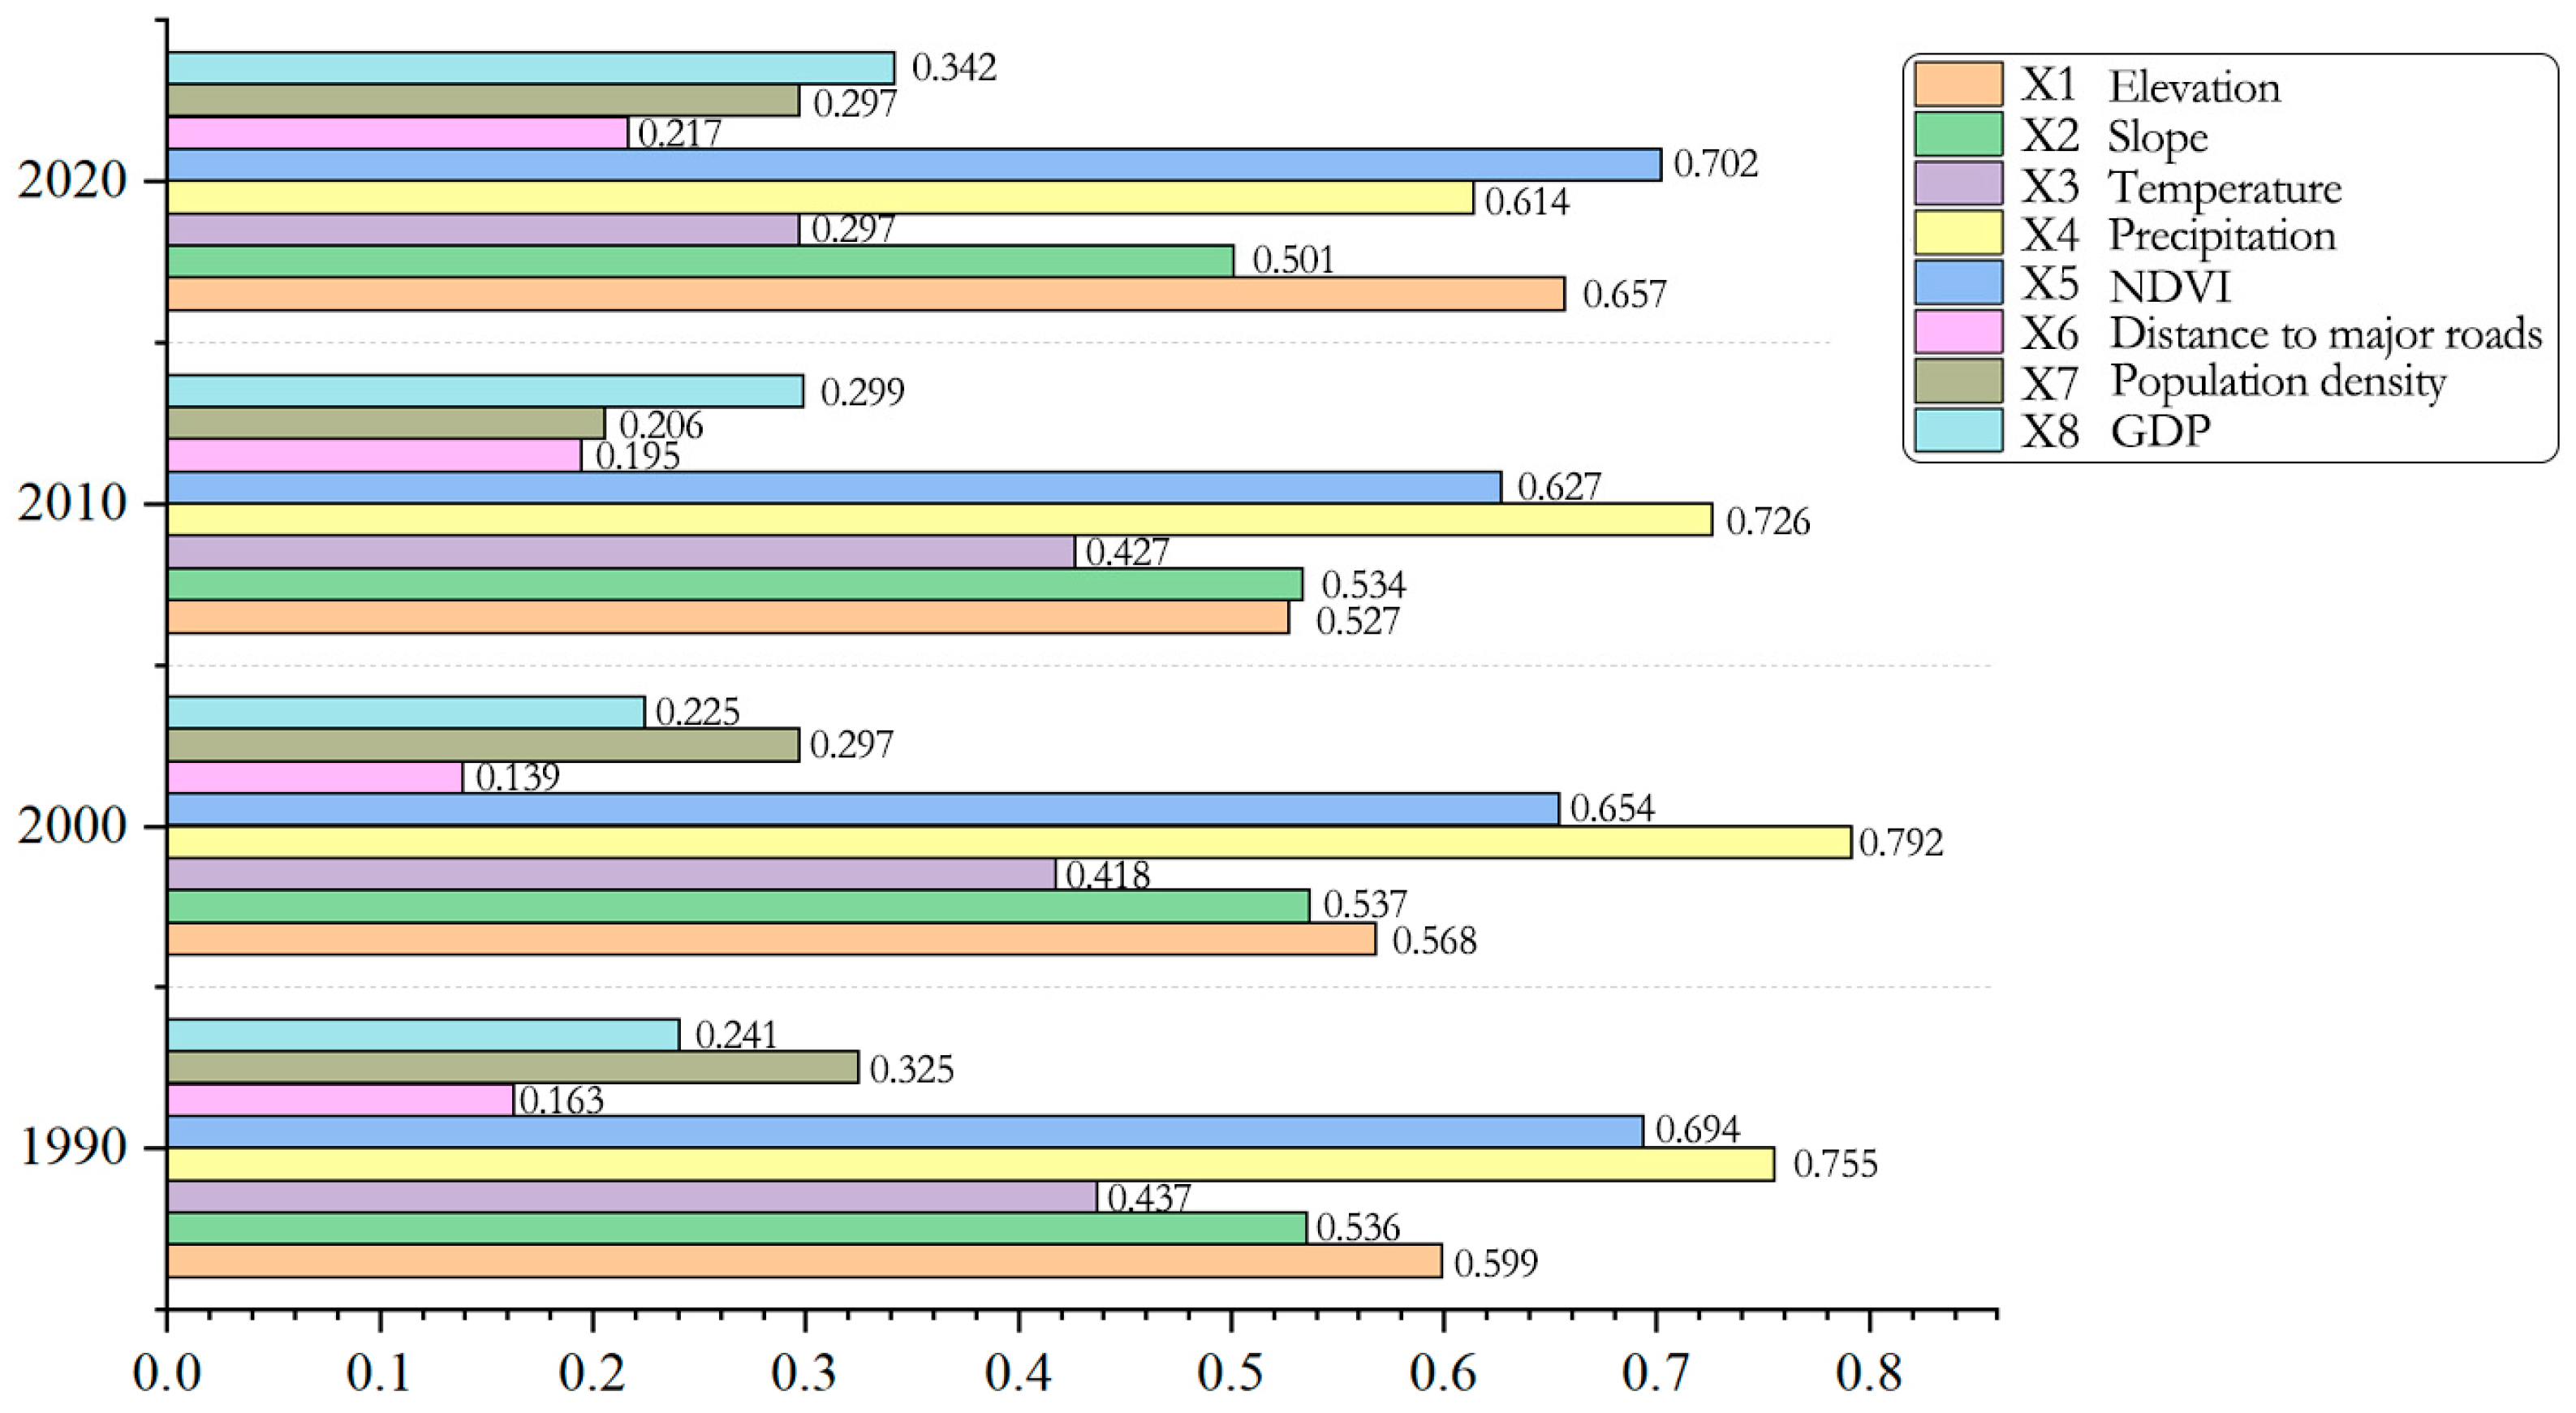
GeoDetector results revealed temporal variations in the explanatory power of factors associated with carbon stock differentiation in Huangling County (Figure 9). Precipitation was the dominant factor in 1990, 2000, and 2010, with q-values of 0.755, 0.792, and 0.726, respectively, whereas NDVI ranked first in 2020, with a q-value of 0.702. Elevation was the second-most influential factor in 2020 (q = 0.657), followed by precipitation (q = 0.614). The explanatory power of precipitation decreased from 2000 to 2020, while that of GDP increased from 2000 onward. Population density showed a declining trend from 1990 to 2010, followed by an increase in 2020. Overall, the spatial differentiation of carbon stocks was closely associated with climatic conditions, vegetation cover, and topographic characteristics, while the explanatory power of socioeconomic factors varied over time.
Figure 9.
Explanatory power of individual factors for the spatial differentiation of carbon stocks in Huangling County in 1990, 2000, 2010, and 2020.
3.3.3. Results of Interaction Detection
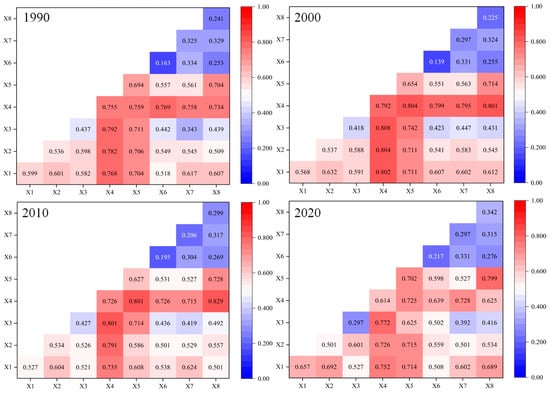
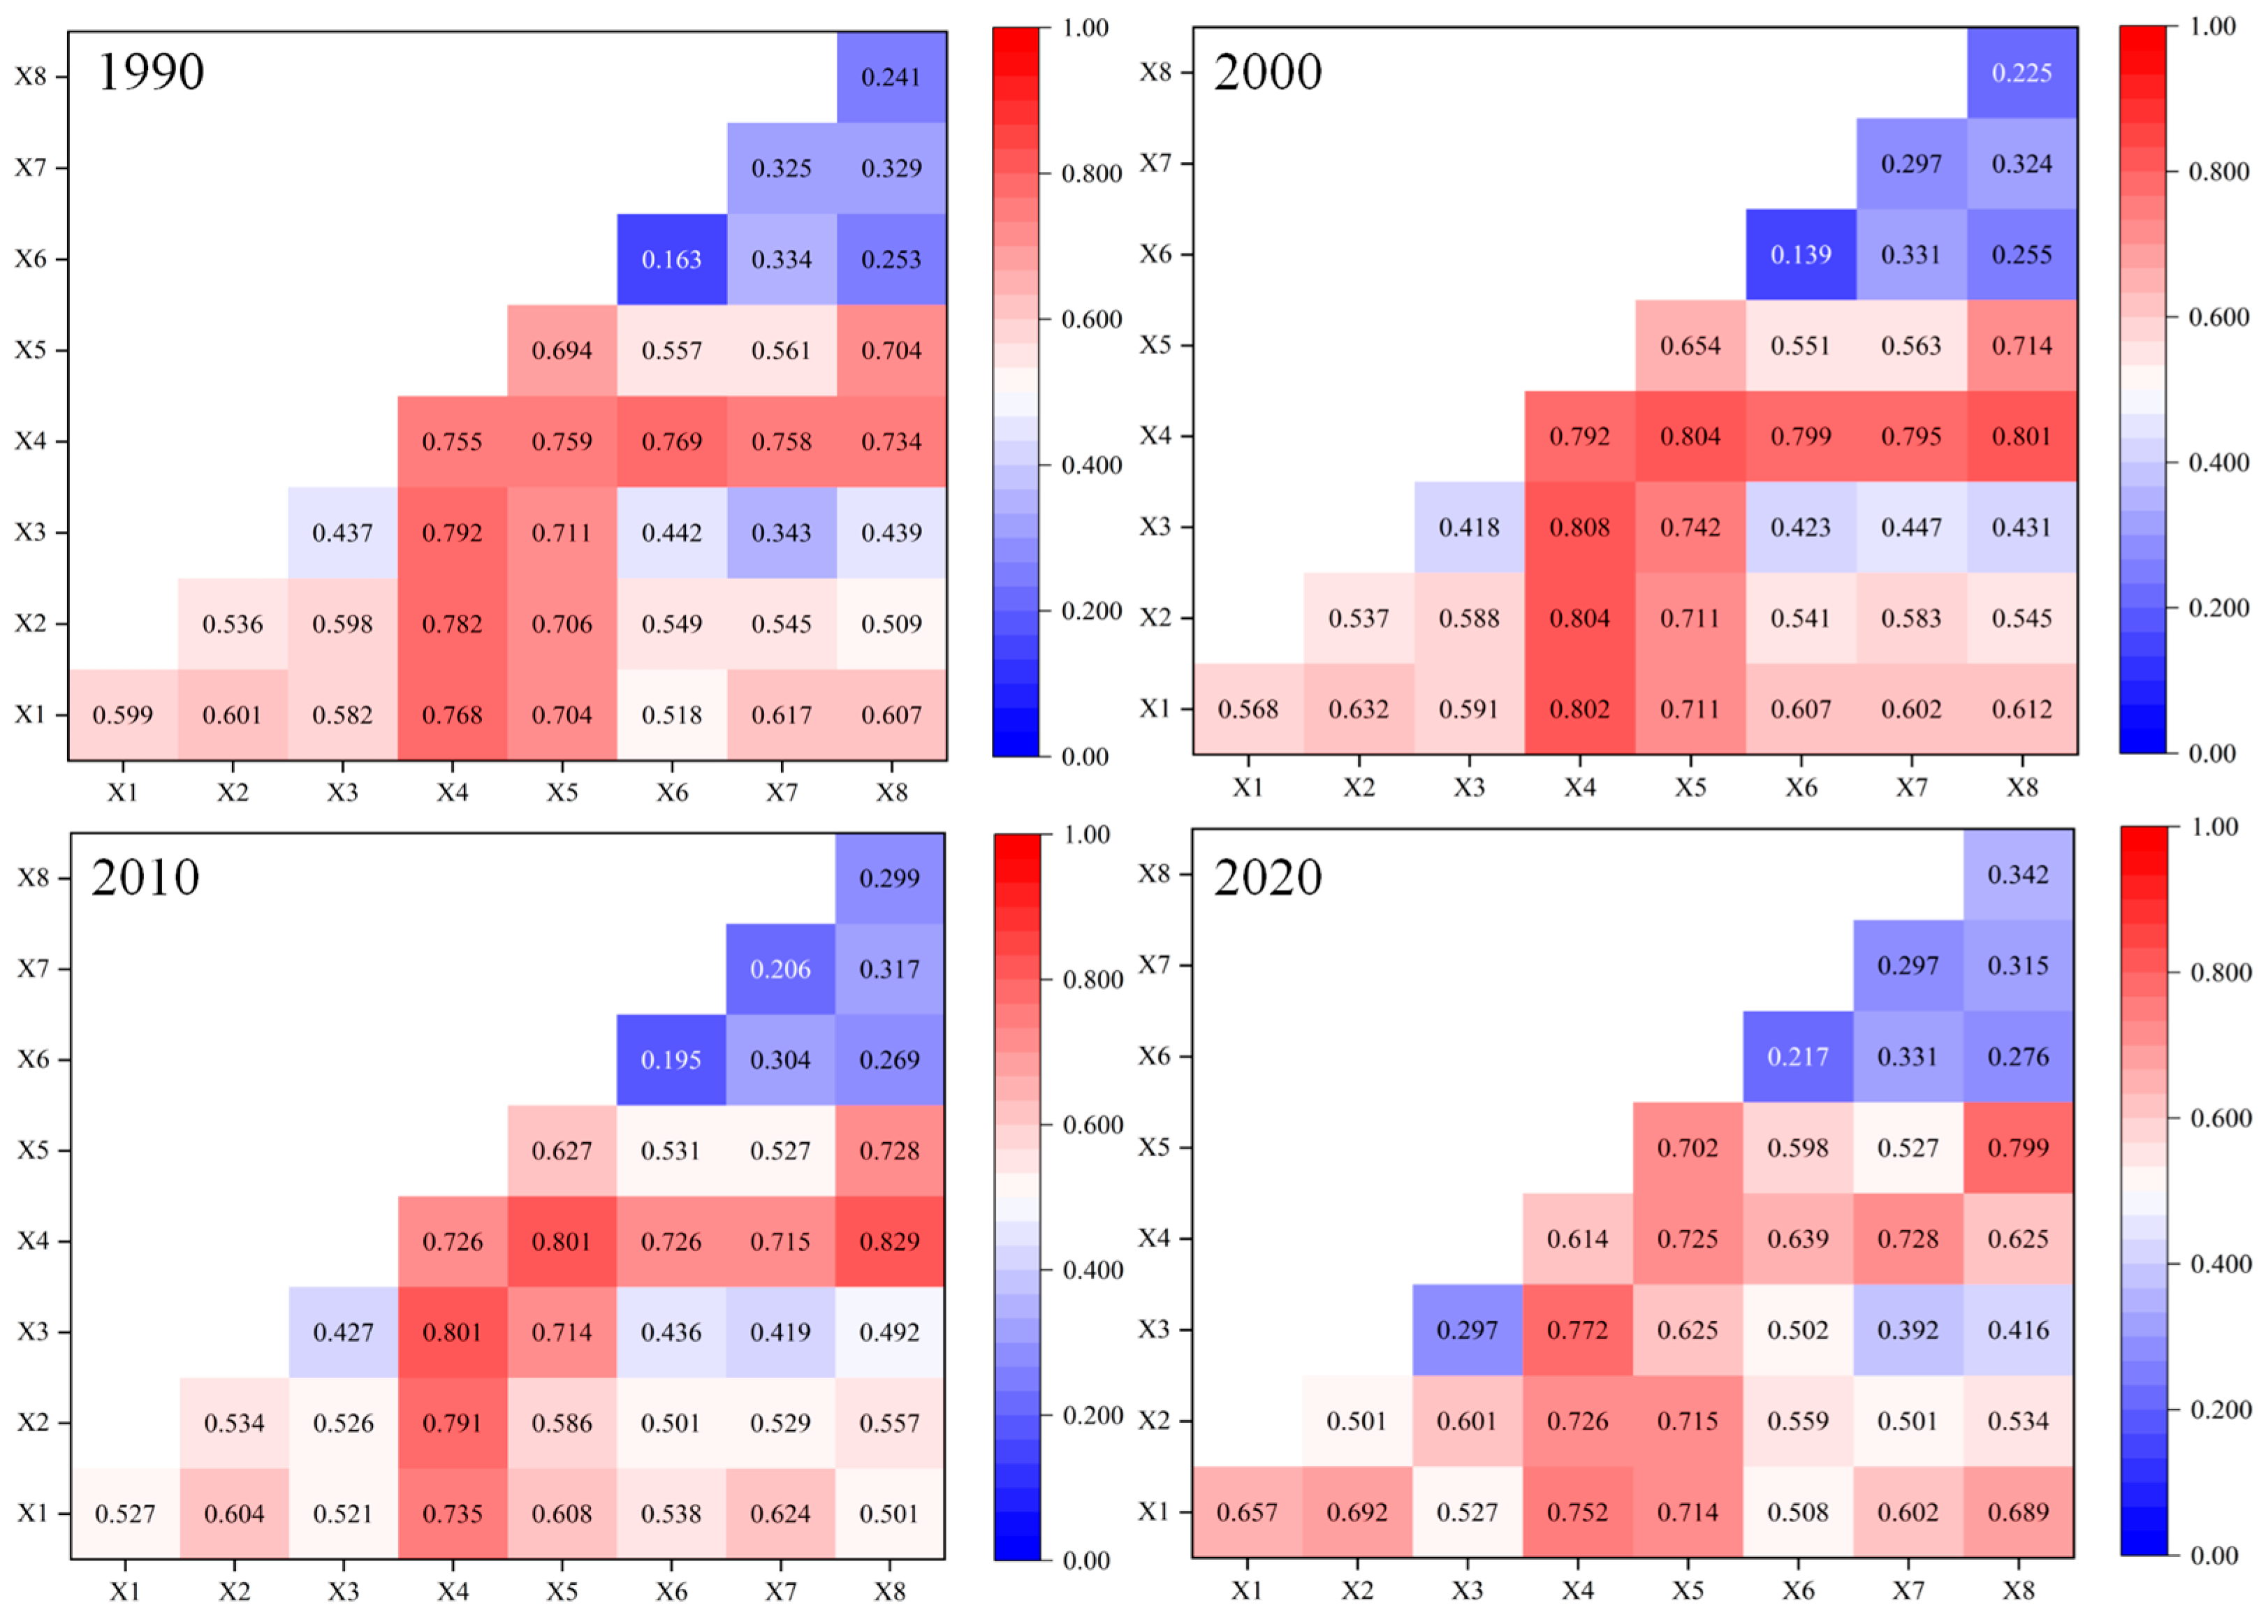
Interaction detection was conducted using the GeoDetector model to examine the explanatory power of pairwise interactions among driving factors for the spatial differentiation of ecosystem carbon stocks in Huangling County (Figure 10). The interaction q-values varied across factor pairs and study years. Among the interactions involving precipitation (X4), the q-values for precipitation and GDP (X8) were 0.734, 0.801, 0.829, and 0.625 in 1990, 2000, 2010, and 2020, respectively. The corresponding q-values for precipitation and population density (X7) were 0.758, 0.795, 0.715, and 0.728, respectively. The interaction between precipitation and elevation (X1) yielded q-values of 0.768, 0.802, 0.735, and 0.752 across the four years. These results indicate that interactions involving precipitation generally exhibited relatively high explanatory power, although their magnitudes varied over time.
Figure 10.
Interactive effects of driving factors on the spatial differentiation of carbon stocks in Huangling County in 1990, 2000, 2010, and 2020.
Compared with the factor detection results (Figure 10), in which precipitation had the highest individual q-value in 1990, 2000, and 2010, whereas NDVI ranked first in 2020, interaction detection revealed higher q-values for several combinations of factors than for the corresponding individual factors. The strongest interaction varied across years and factor combinations, suggesting that the spatial differentiation of carbon stocks was associated with the combined effects of climatic, topographic, vegetation, and socioeconomic factors.
3.4. Land-Use and Carbon Stock Projections Under Different Scenarios in 2030
3.4.1. Validation of PLUS Model Accuracy
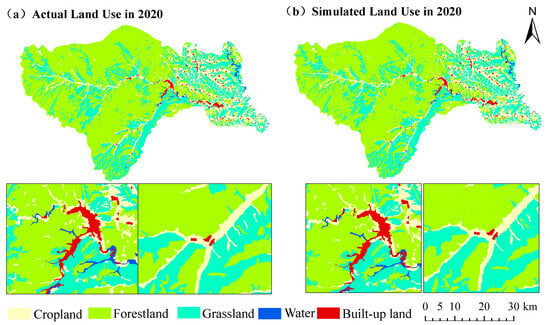
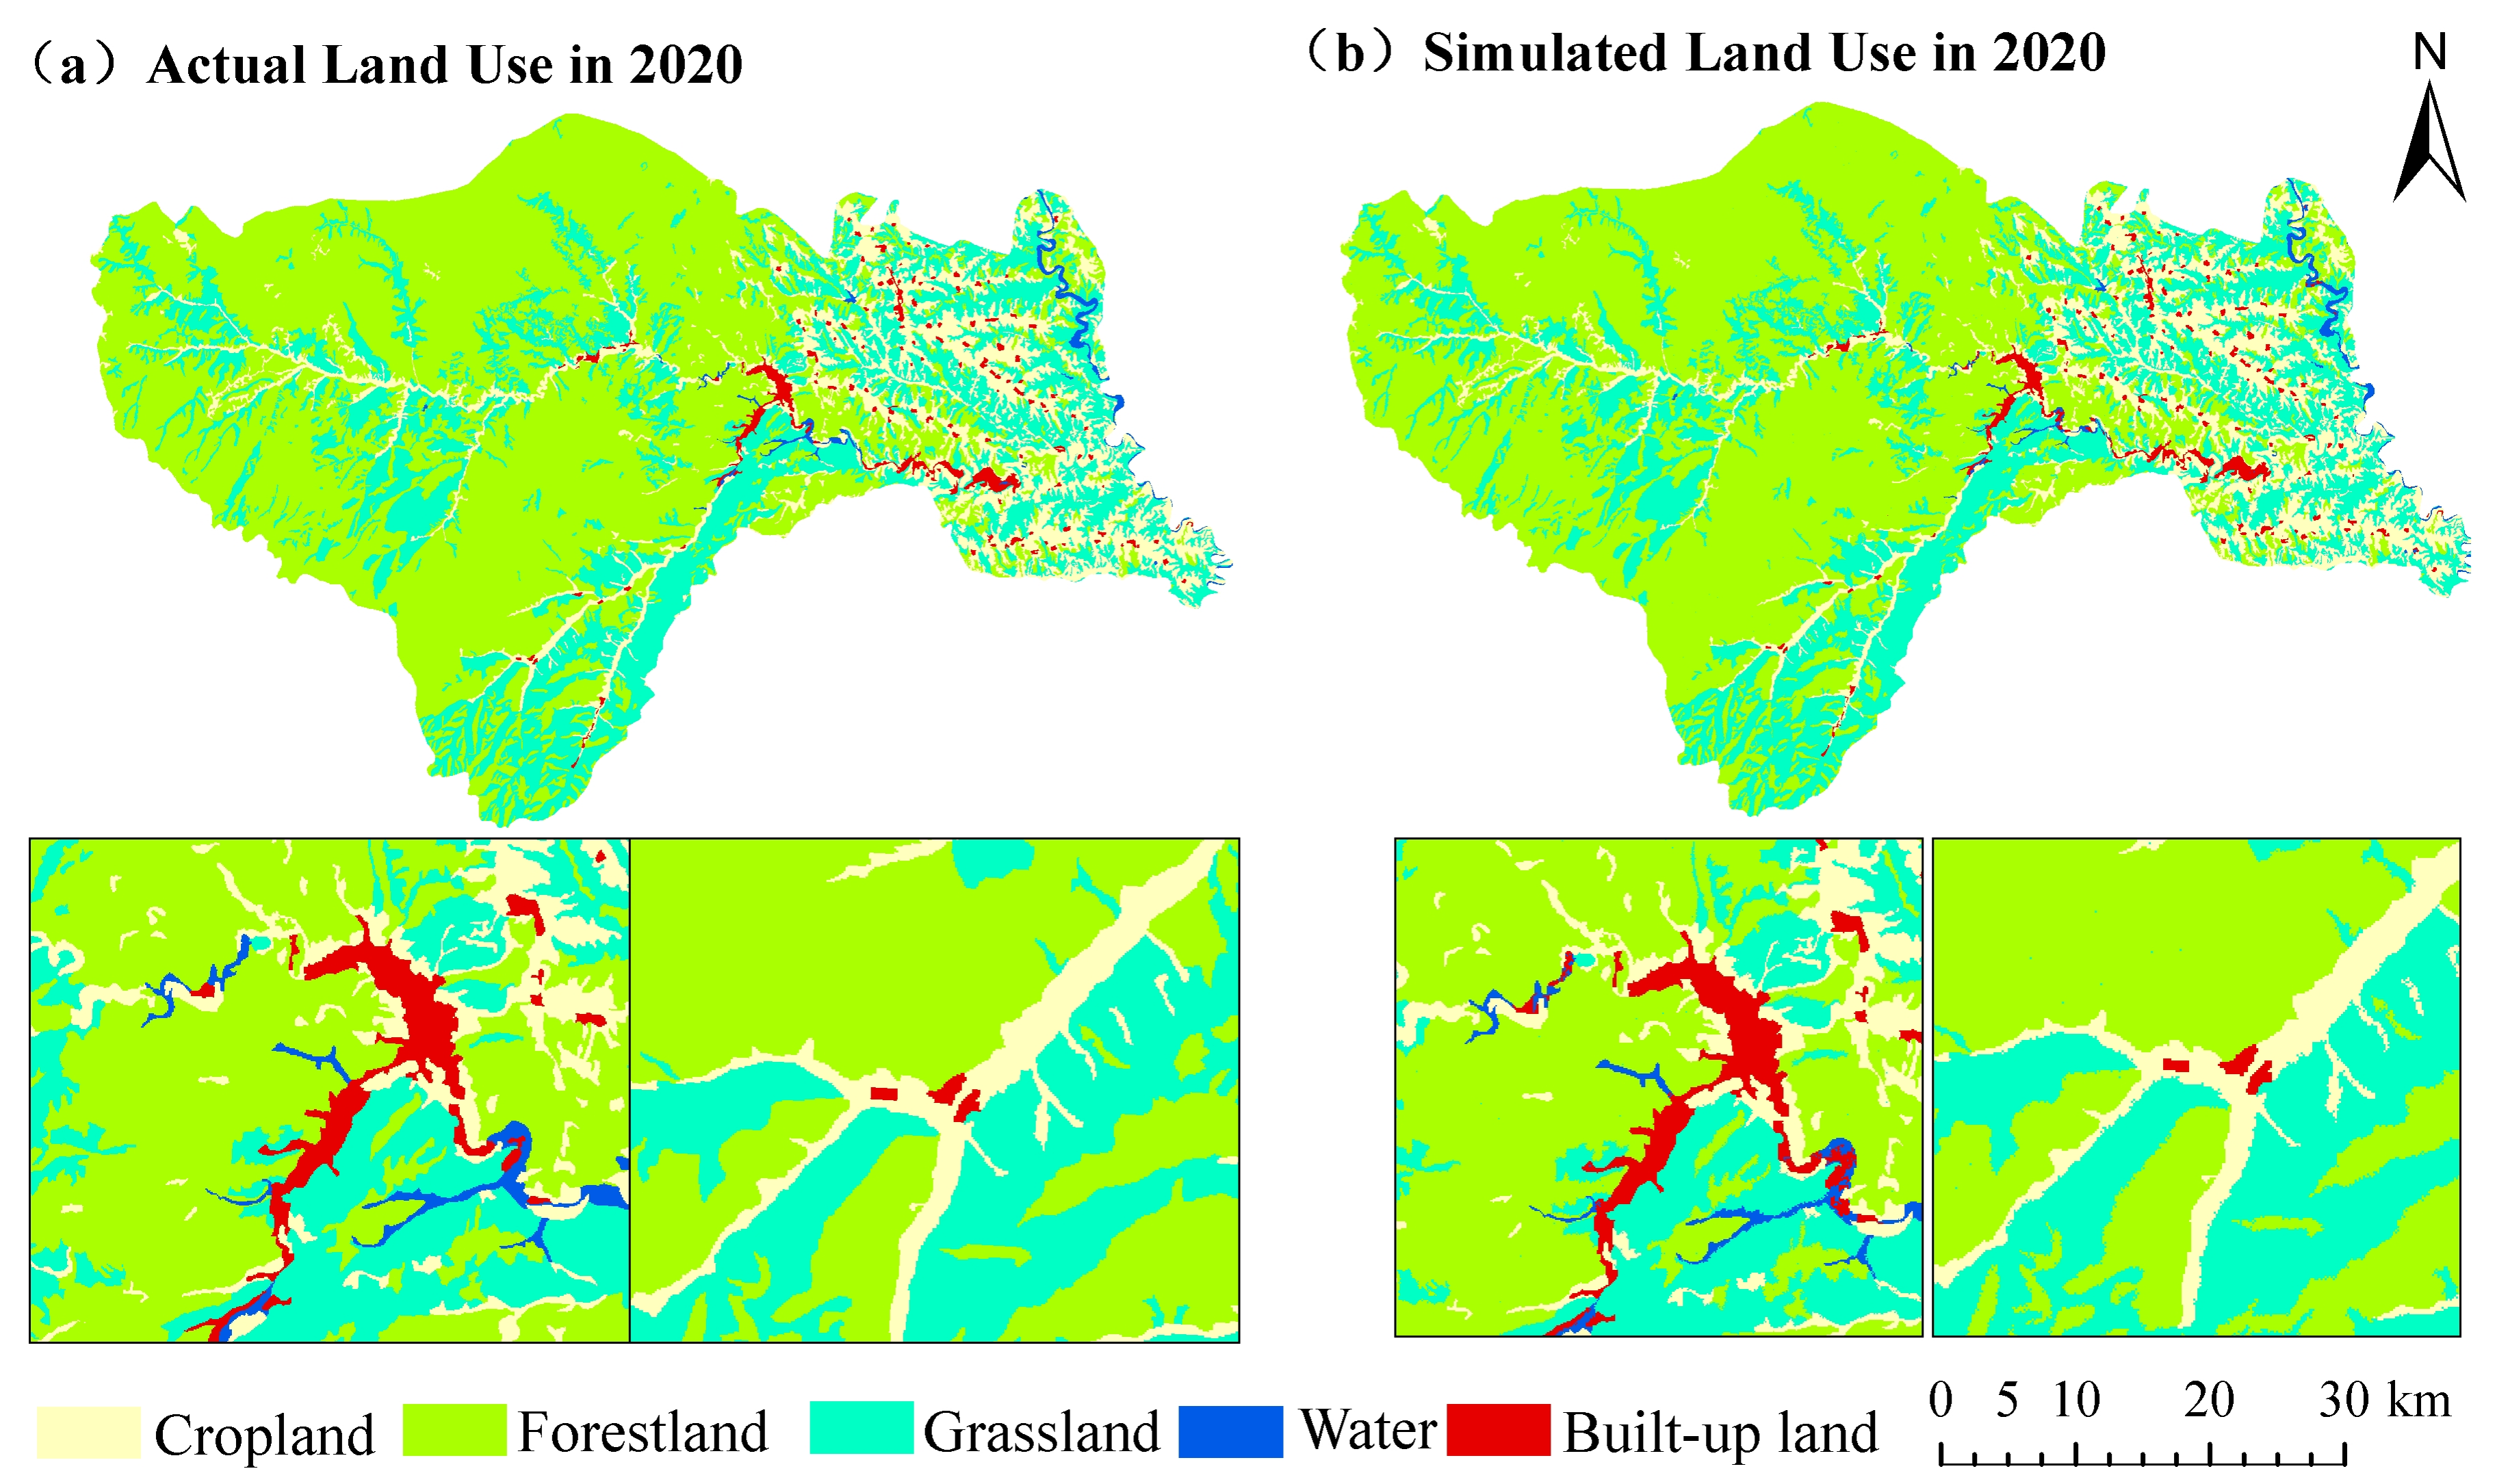
The PLUS model achieved an overall accuracy (OA) of 0.901 and a Kappa coefficient of 0.812, demonstrating satisfactory simulation performance. The simulated land-use distribution in 2020 exhibited strong spatial agreement with the actual land-use pattern in Huangling County (Figure 11), with the major land-use categories being well reproduced. Forestland, grassland, and cropland showed high consistency between simulated and observed distributions, while the spatial expansion of built-up land was also reasonably captured. These results indicate that the PLUS model can effectively characterize the spatial evolution of land-use patterns in Huangling County and provides a reliable basis for future scenario simulations.
Figure 11.
Comparison of simulated and actual land-use distributions in 2020: (a) Actual land use; (b) Simulated land use.
3.4.2. Projected Land-Use Patterns Under Different Scenarios
The PLUS model simulations revealed distinct differences in future land-use patterns among the four scenarios in Huangling County by 2030 (Table 10 and Table 11). Forestland remained the dominant land-use category under all scenarios, accounting for over 59% of the total area, while grassland and cropland represented the other major land-use types. Built-up land expanded under all scenarios, suggesting that future land-use changes would mainly involve adjustments among ecological land types and continued urban expansion.
Table 10.
Areas and proportions of different land-use types under different scenarios in 2030.
Table 11.
Changes in the areas of different land-use types under different scenarios in Huangling County from 2020 to 2030 (km2).
Scenario-specific differences were mainly reflected in cropland conservation and built-up land expansion. Under the FPS, cropland area was maintained at 299.32 km2, decreasing by only 5.07 km2 compared with 2020, indicating the most effective cropland preservation. Under the EDS, built-up land showed the greatest expansion, increasing by 4.06 km2, while cropland also increased slightly by 1.34 km2 to 305.73 km2. Forestland increased under all scenarios, with gains ranging from 22.22 to 47.67 km2, and the largest increase occurring under the NDS. Conversely, grassland decreased across all scenarios, with losses ranging from 16.19 to 36.90 km2.
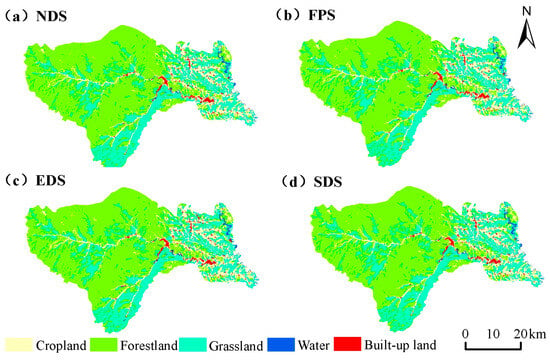
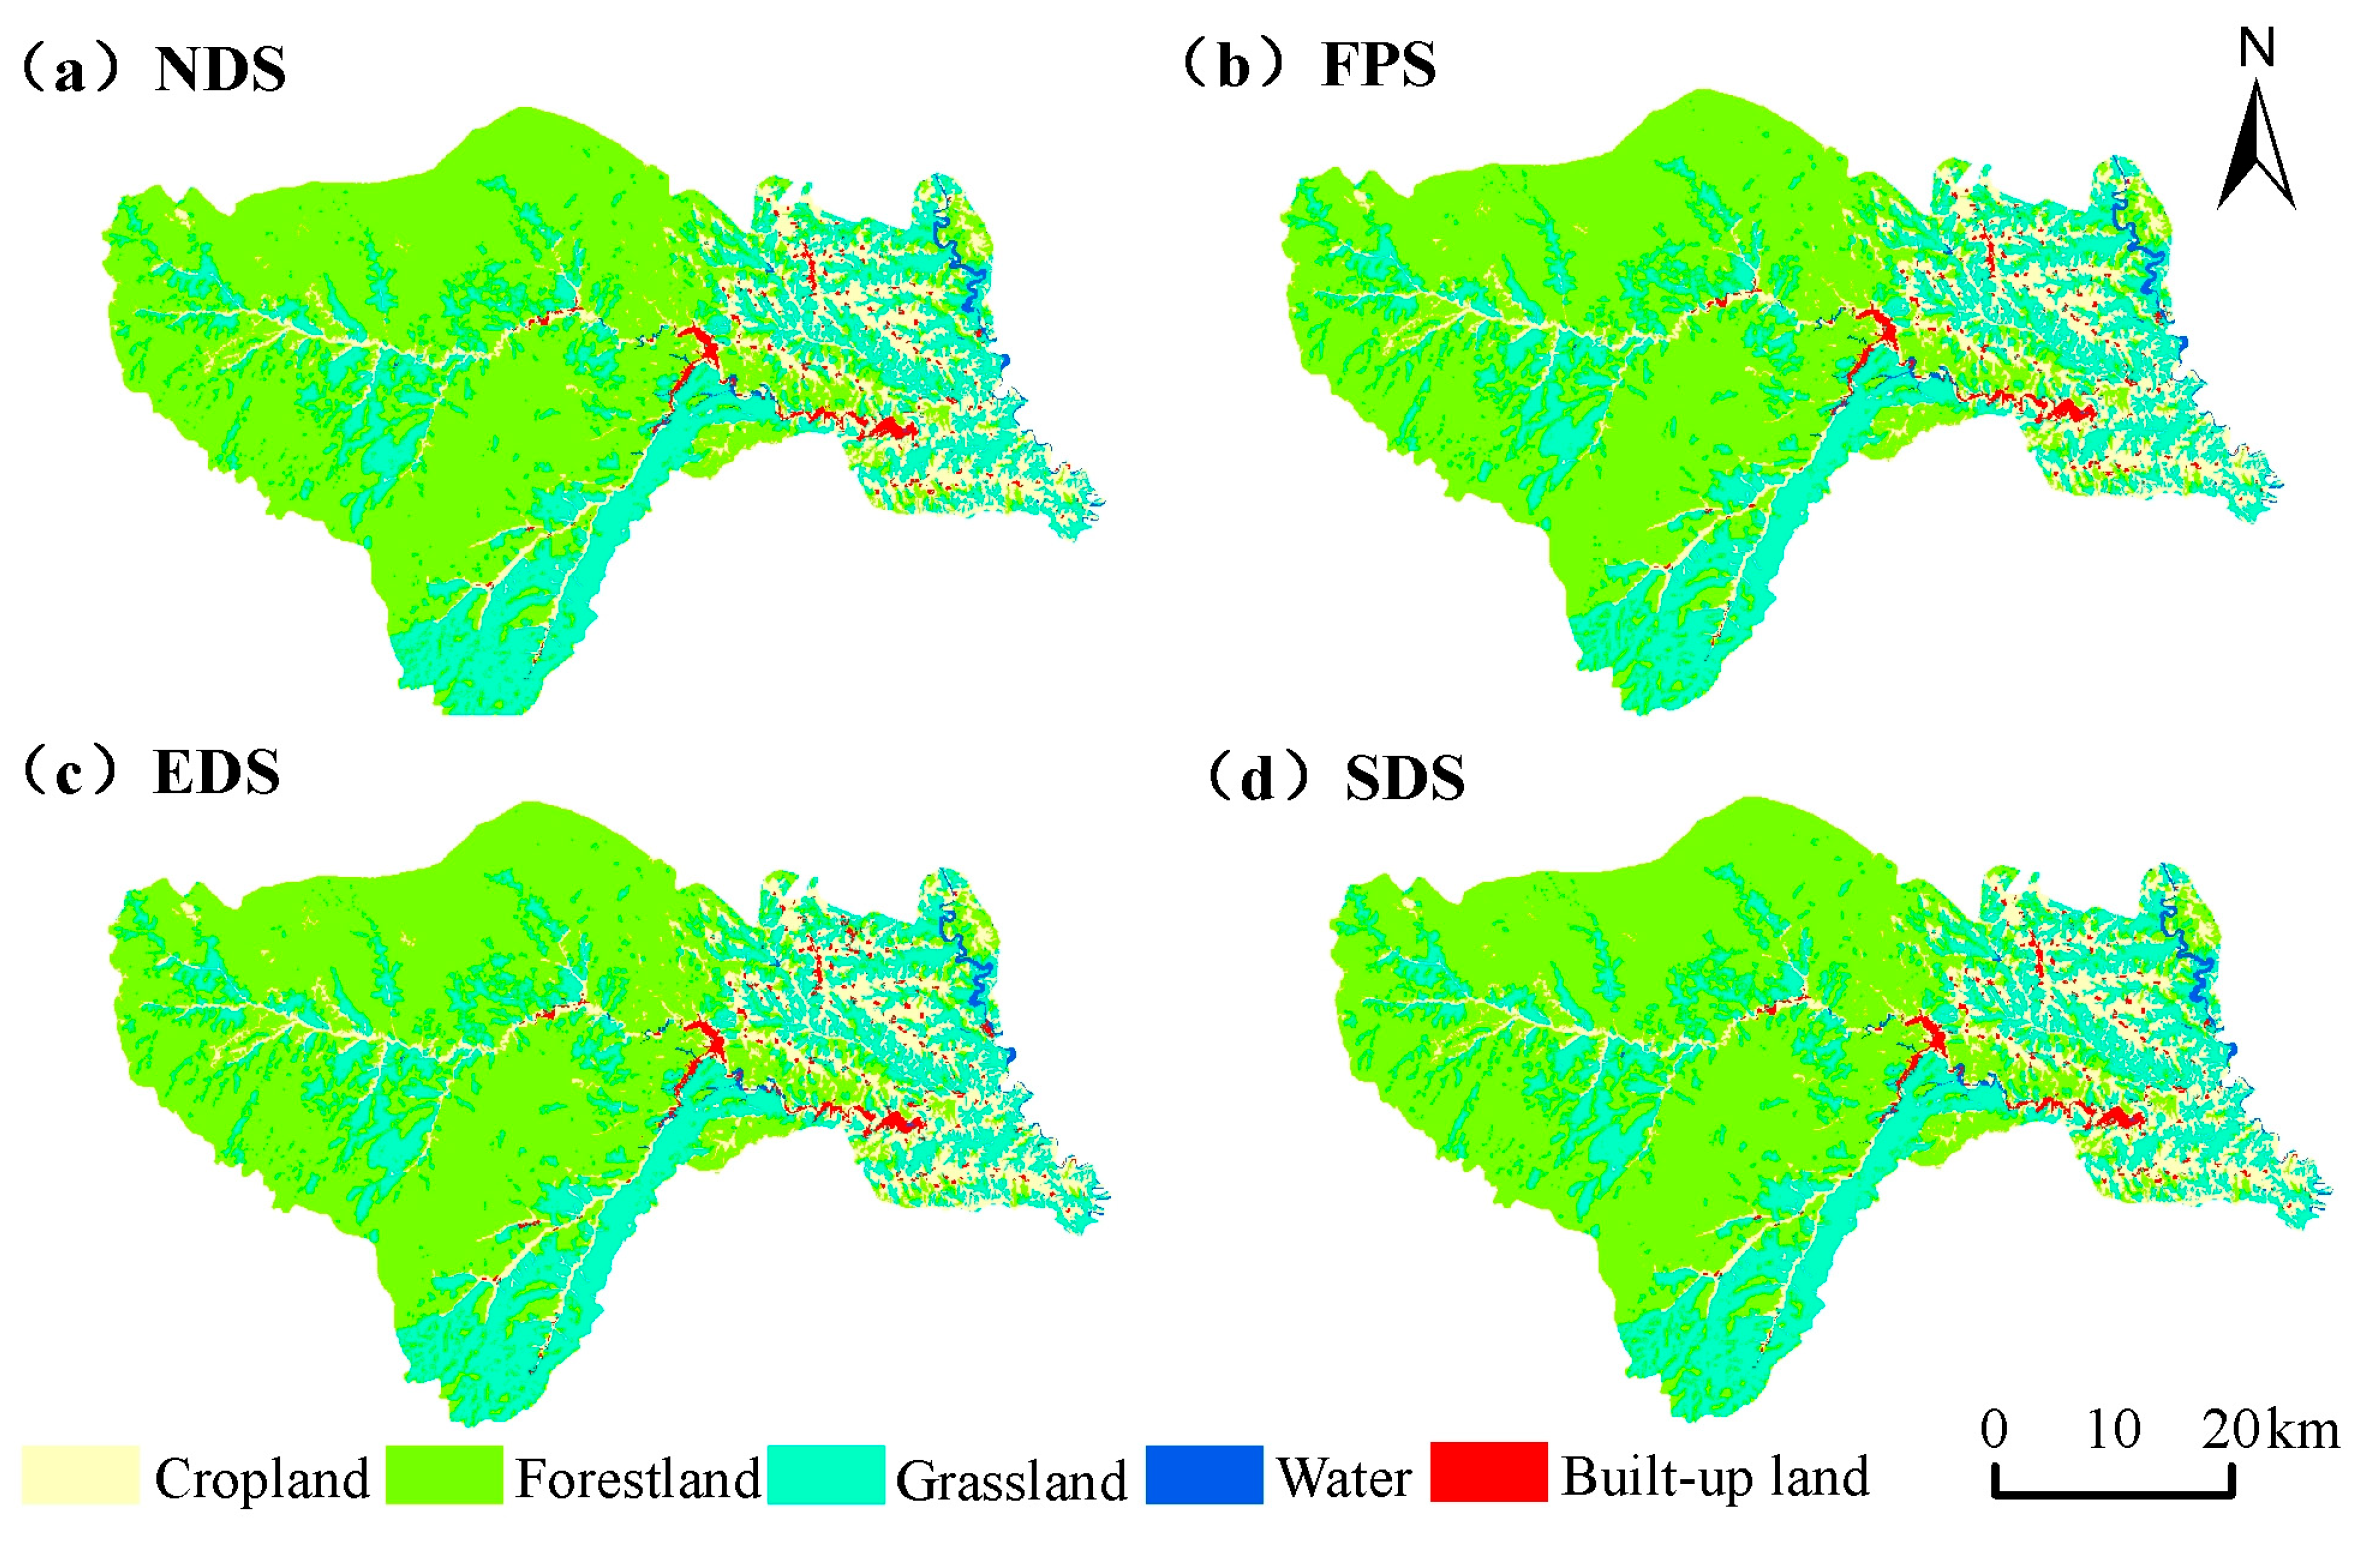
The projected land-use patterns under the four scenarios showed similar spatial configurations, with forestland dominating the landscape, followed by grassland and cropland (Figure 12). Forestland was primarily located in the western and central parts of Huangling County, whereas grassland was extensively distributed along the margins of forested areas and in the eastern region. Cropland was mainly concentrated in areas with relatively favorable topographic conditions, particularly the eastern low-relief zones. Despite its limited area, built-up land was concentrated around the county center and transportation corridors, showing a clear tendency toward spatial agglomeration and outward expansion.
Figure 12.
Simulated spatial distribution of land-use patterns under different scenarios in Huangling County in 2030: (a) NDS; (b) FPS; (c) EDS; (d) SDS.
Scenario-related differences were mainly associated with localized land-use transitions. The EDS resulted in the strongest expansion of built-up land, characterized by increased patch size and spatial spread. The FPS maintained a relatively higher cropland area through stronger restrictions on cropland conversion. In contrast, the SDS better balanced ecological conservation and development demands, with relatively stable distributions of forestland, grassland, and water bodies, thereby maintaining ecological space more effectively.
3.4.3. Projected Carbon Stocks Under Different Scenarios
Based on the simulated land-use patterns in 2030 under different scenarios and the corresponding InVEST model estimates, variations in total carbon stocks were observed among scenarios in Huangling County (Table 12). The NDS yielded the highest total carbon stock (5409.98 × 104 t), followed by EDS (5393.66 × 104 t), FPS (5389.77 × 104 t), and SDS (5387.43 × 104 t). Compared with 2020, total carbon stocks increased under all four scenarios, with gains ranging from 12.80 × 10⁴ to 35.35 × 10⁴ t.
Table 12.
Carbon stocks under different scenarios in 2030 (×104 t).
Forestland was the dominant contributor to total carbon storage under all four scenarios, with carbon stocks exceeding 3597 × 104 t. The NDS had the highest forestland carbon stock (3664.91 × 104 t), consistent with its largest forestland area. Grassland carbon stocks were higher under SDS and FPS, reaching 1065.67 × 104 t and 1061.60 × 104 t, respectively. In contrast, built-up land contributed relatively little to total carbon storage. Although EDS had the highest built-up land carbon stock (24.27 × 10⁴ t), its contribution to total carbon storage remained limited.
A comparison between NDS and SDS further illustrates the relationship between land-use allocation and carbon storage. In 2030, total carbon stock under NDS was 22.55 × 10⁴ t (approximately 0.42%) higher than under SDS. NDS contained 20.00 km2 more forestland than SDS, and its forestland carbon stock was 53.13 × 10⁴ t higher. Conversely, SDS contained 20.71 km2 more grassland, with 37.24 × 10⁴ t more carbon stored in this category. Cropland carbon stock was 7.36 × 10⁴ t higher under NDS, whereas built-up land carbon stock was 0.70 × 10⁴ t higher under SDS. Overall, the higher total carbon stock under NDS was primarily associated with its larger forestland area, while the greater grassland carbon stock under SDS partly offset this difference.
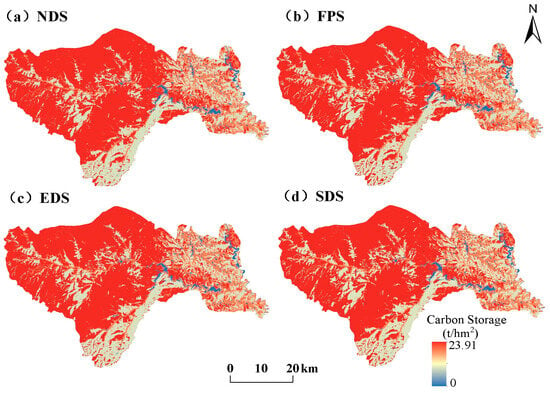
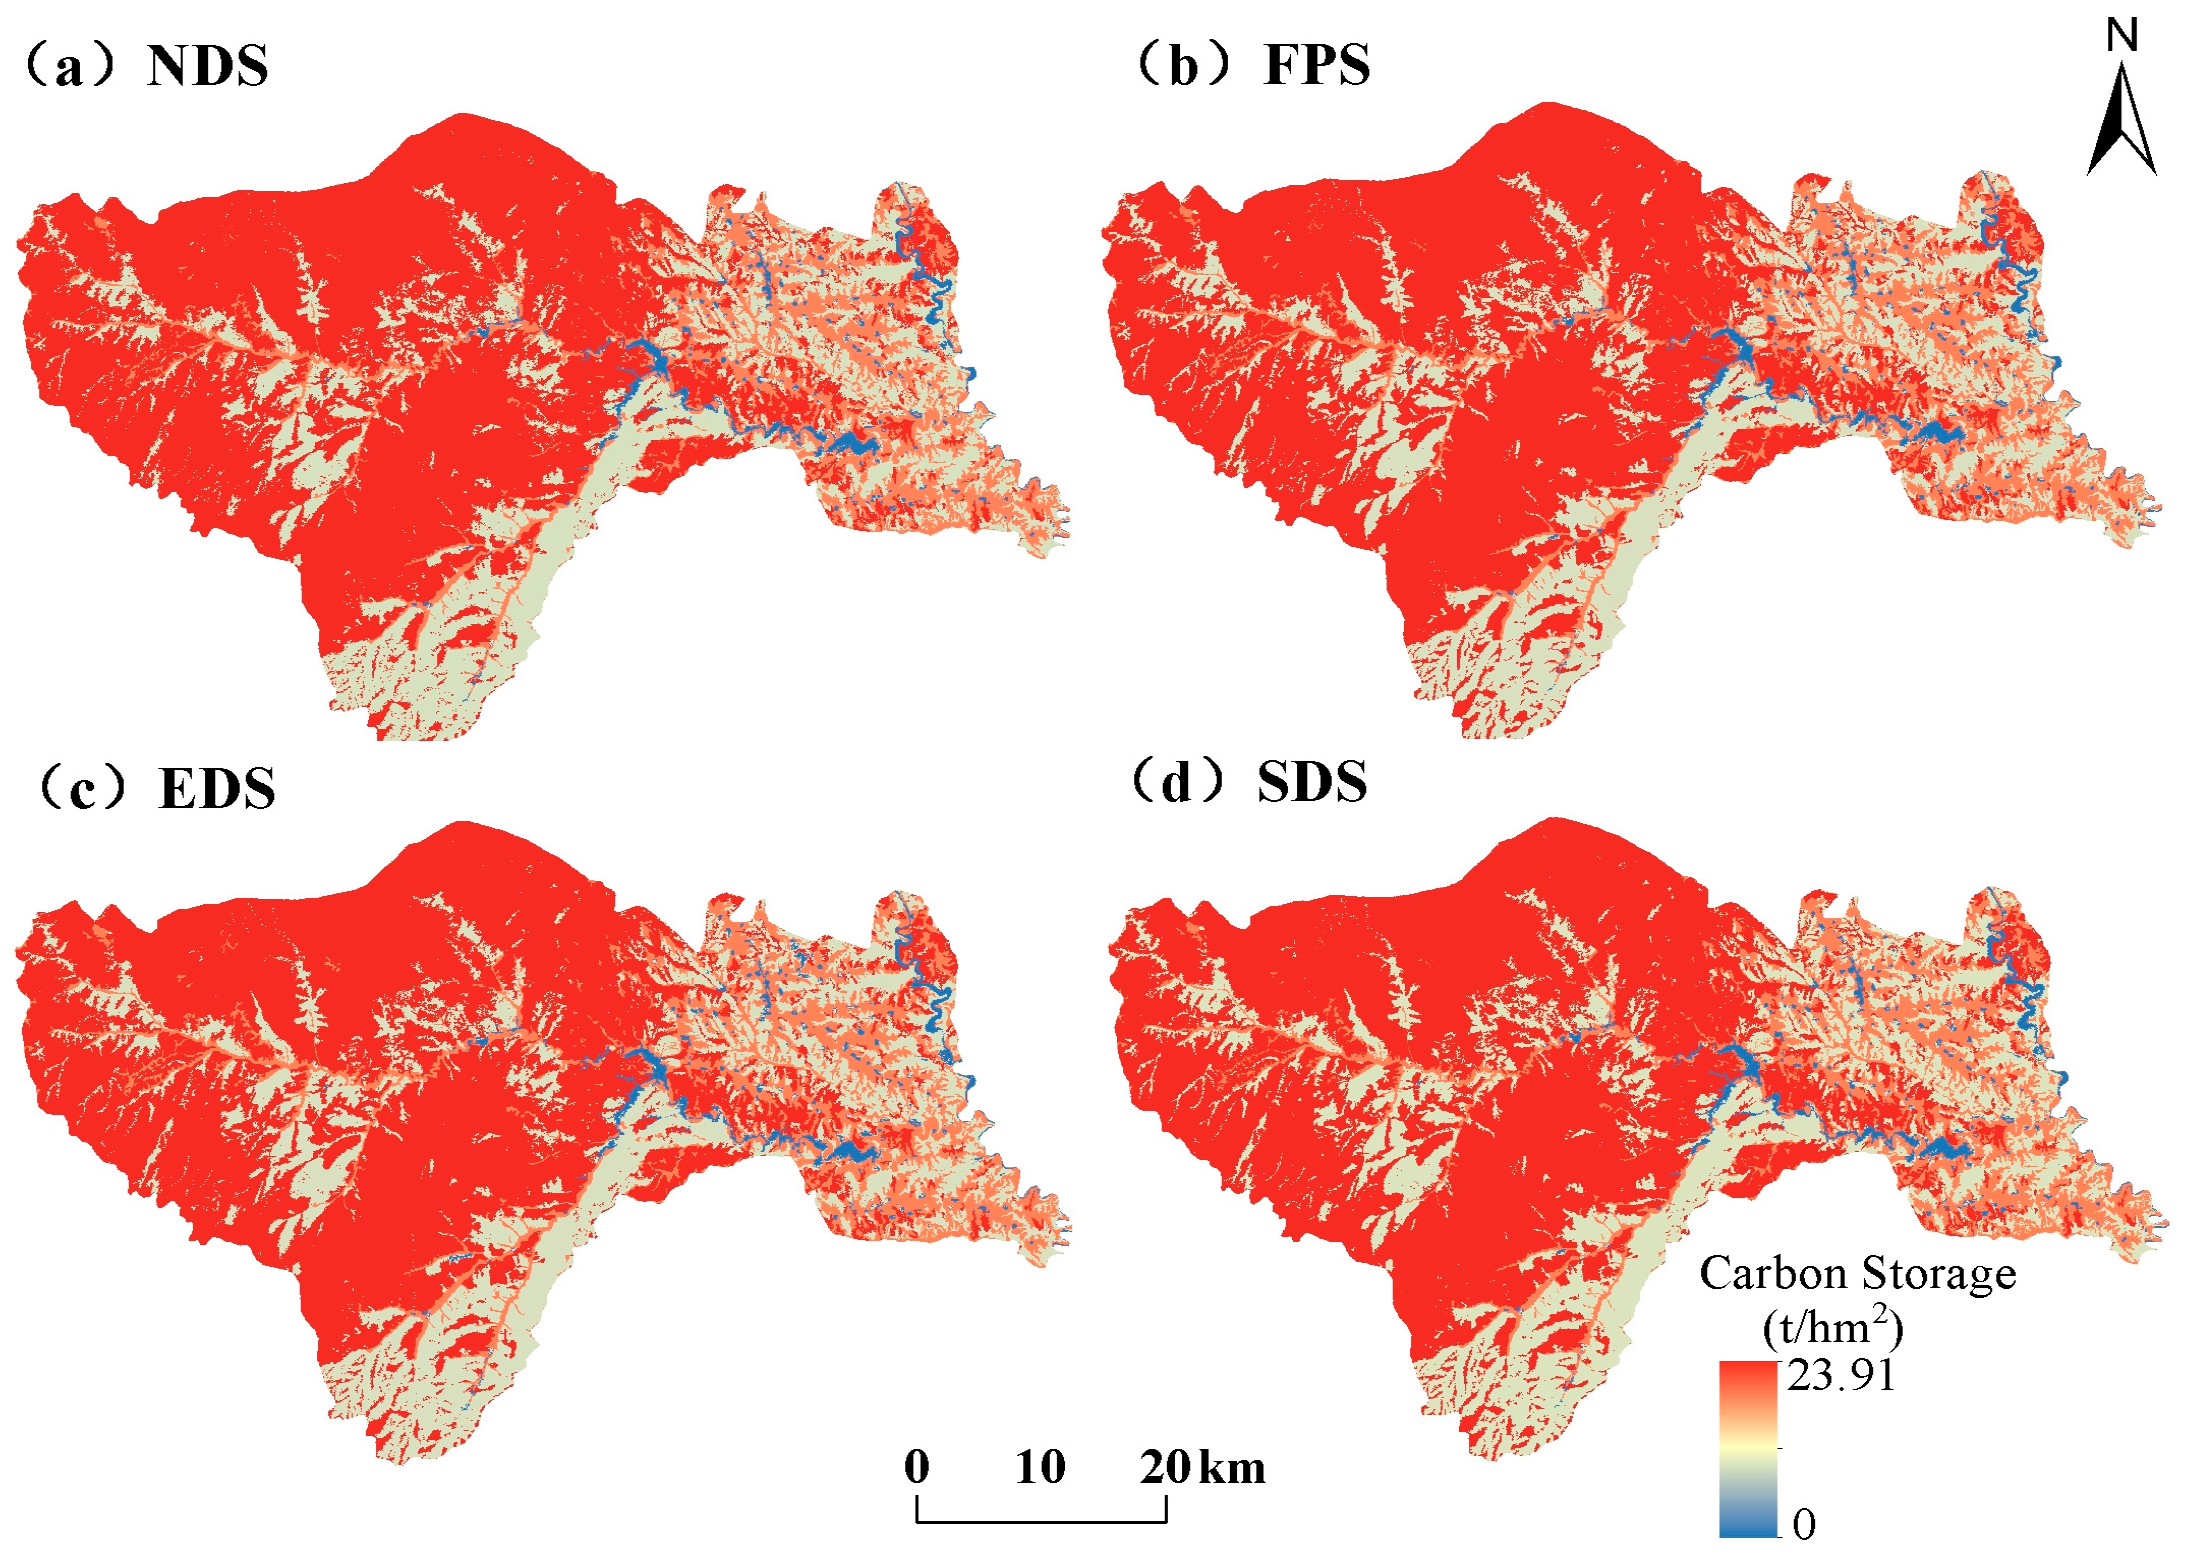
The spatial distribution patterns of carbon stocks under different scenarios were generally consistent (Figure 13). High-carbon-stock areas were mainly located in the western and central parts of Huangling County, while low-carbon-stock areas were concentrated in the eastern region and scattered river valley zones. High-carbon-stock areas remained dominant under all scenarios, and scenario-related differences were mainly associated with localized changes in carbon stock levels. Compared with other scenarios, the EDS exhibited a more concentrated distribution of low-carbon-stock patches in certain areas, reflecting the potential impacts of intensified development activities on regional carbon storage patterns.
Figure 13.
Simulated spatial distribution of ecosystem carbon stocks under different scenarios in Huangling County in 2030.
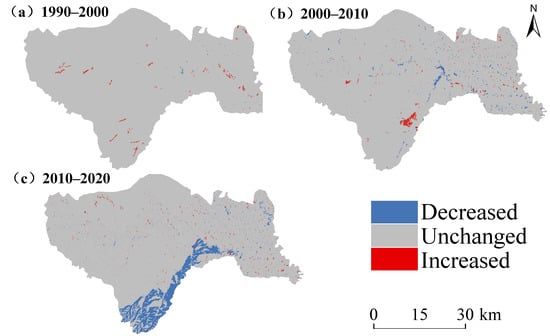
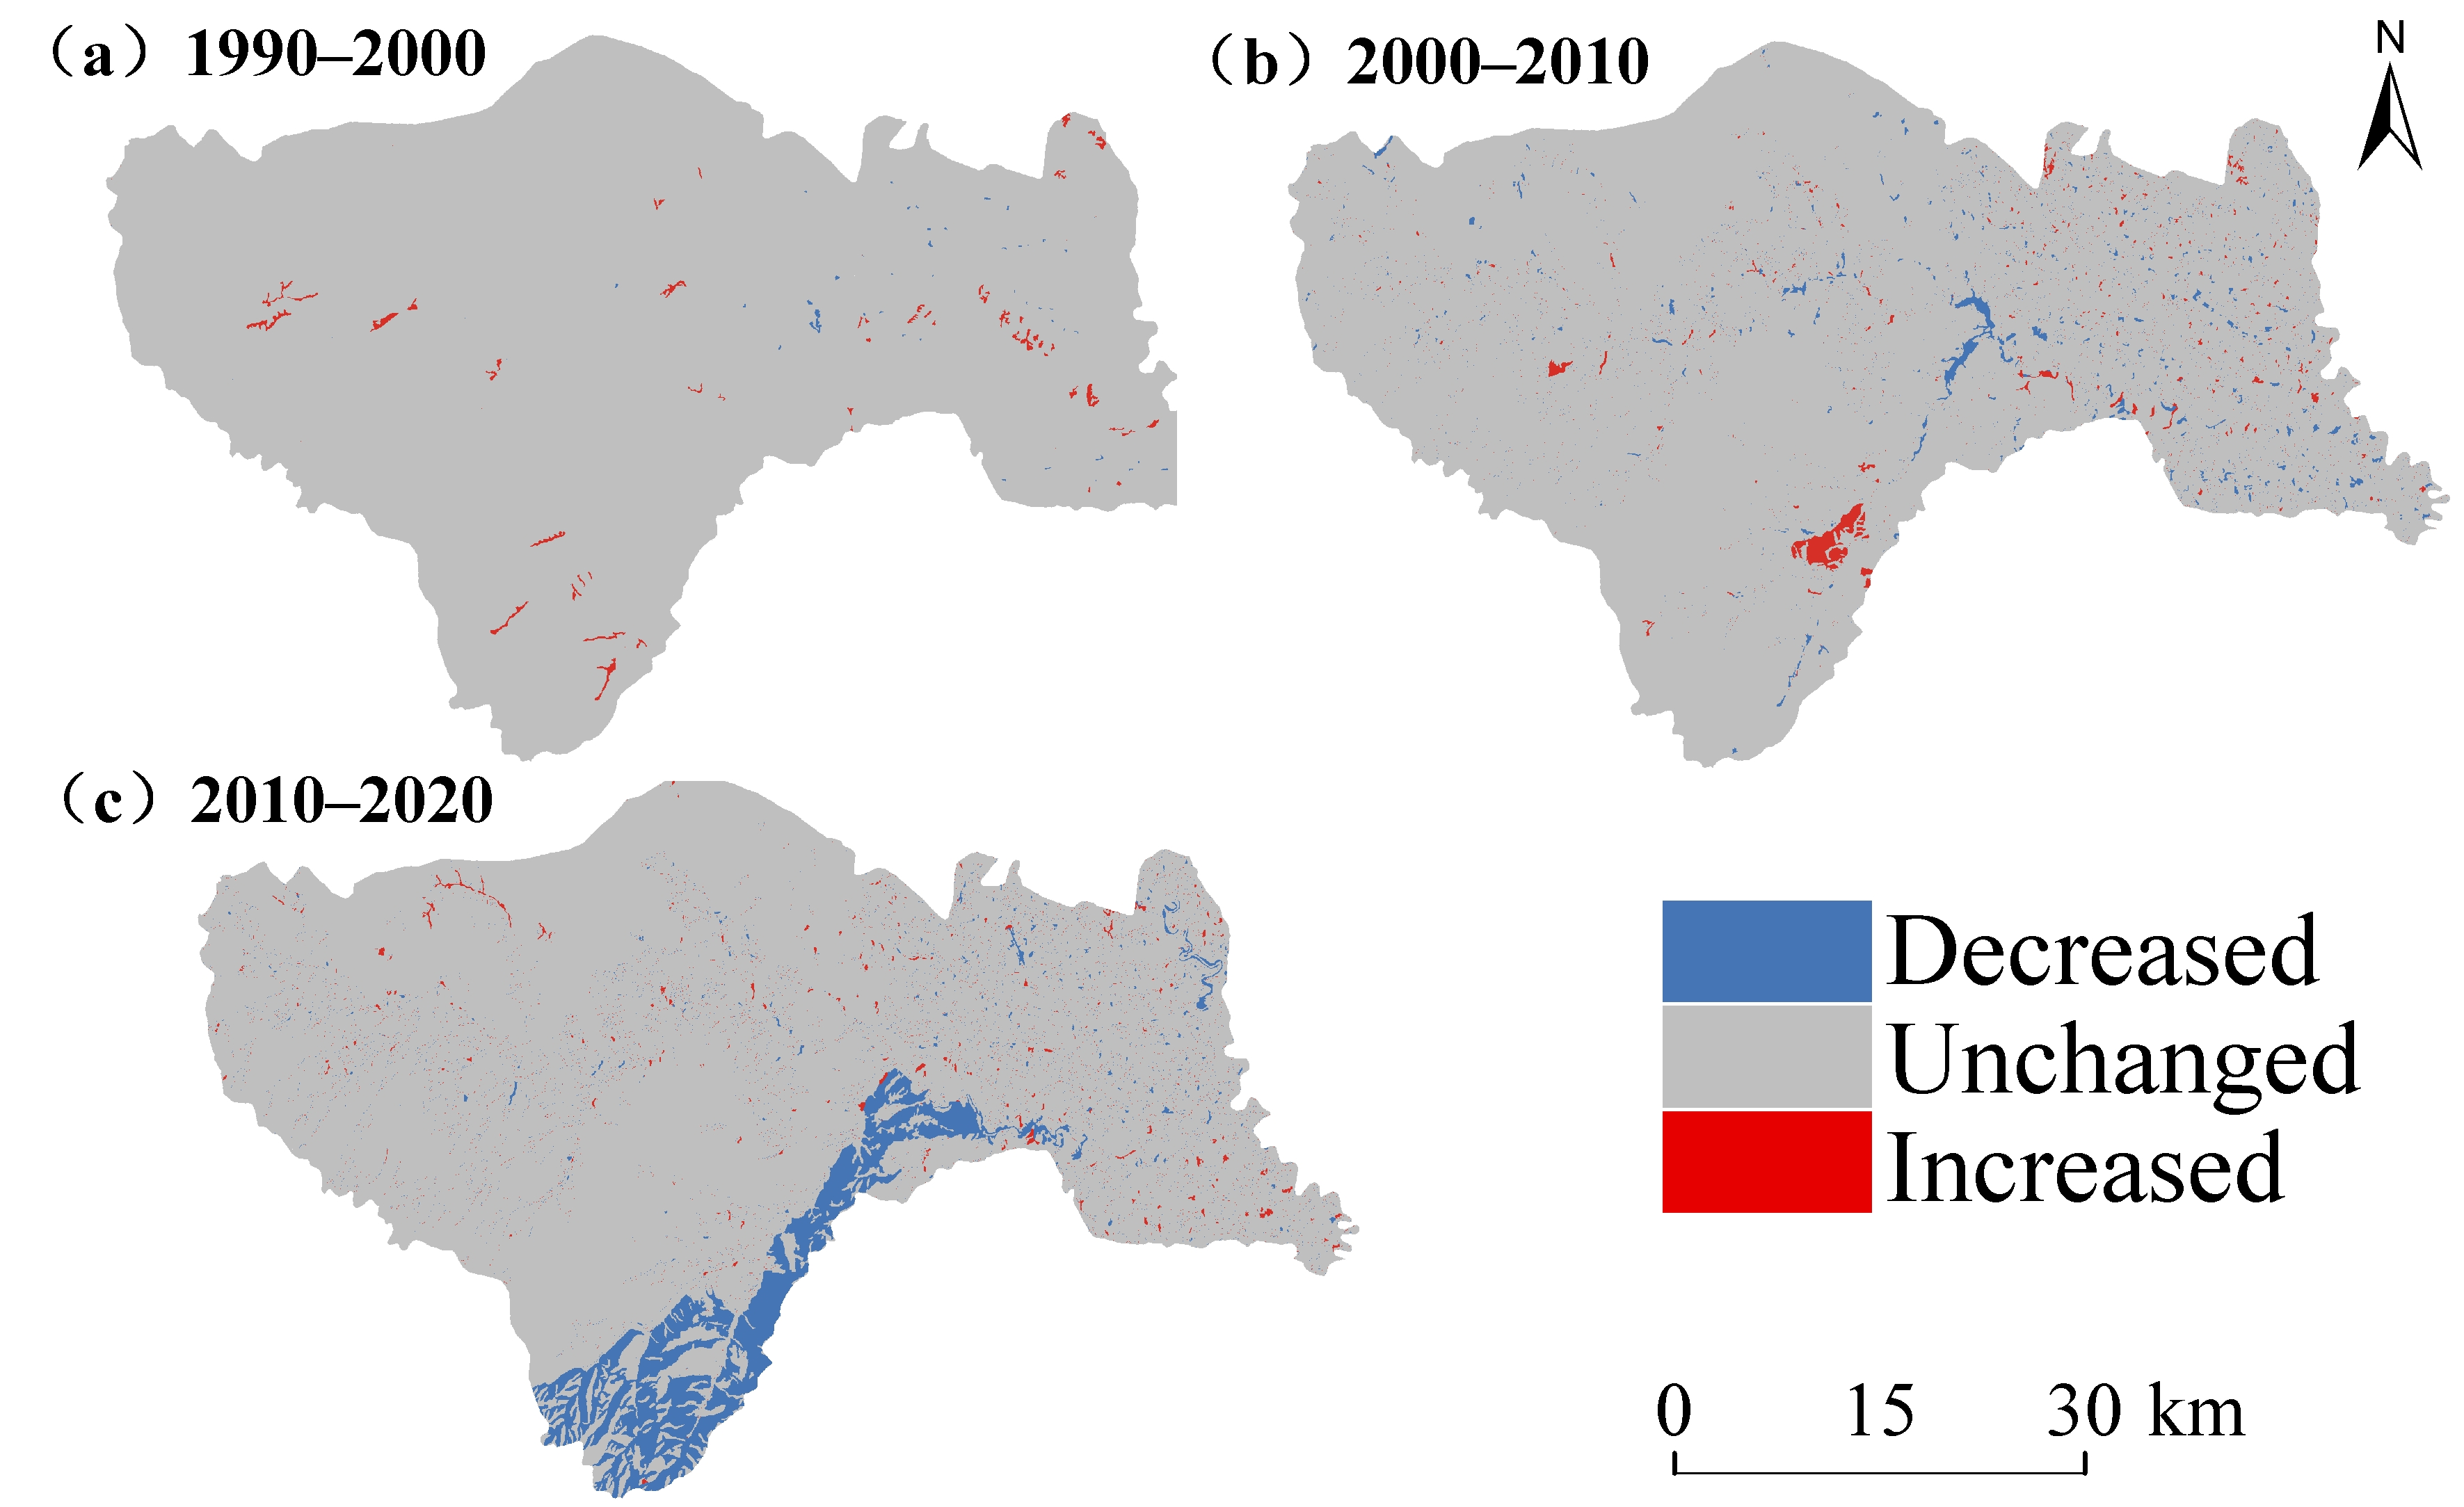
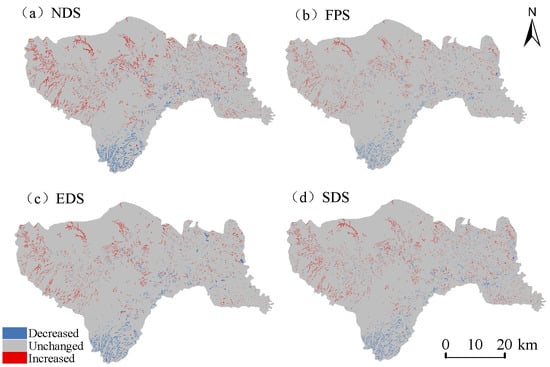
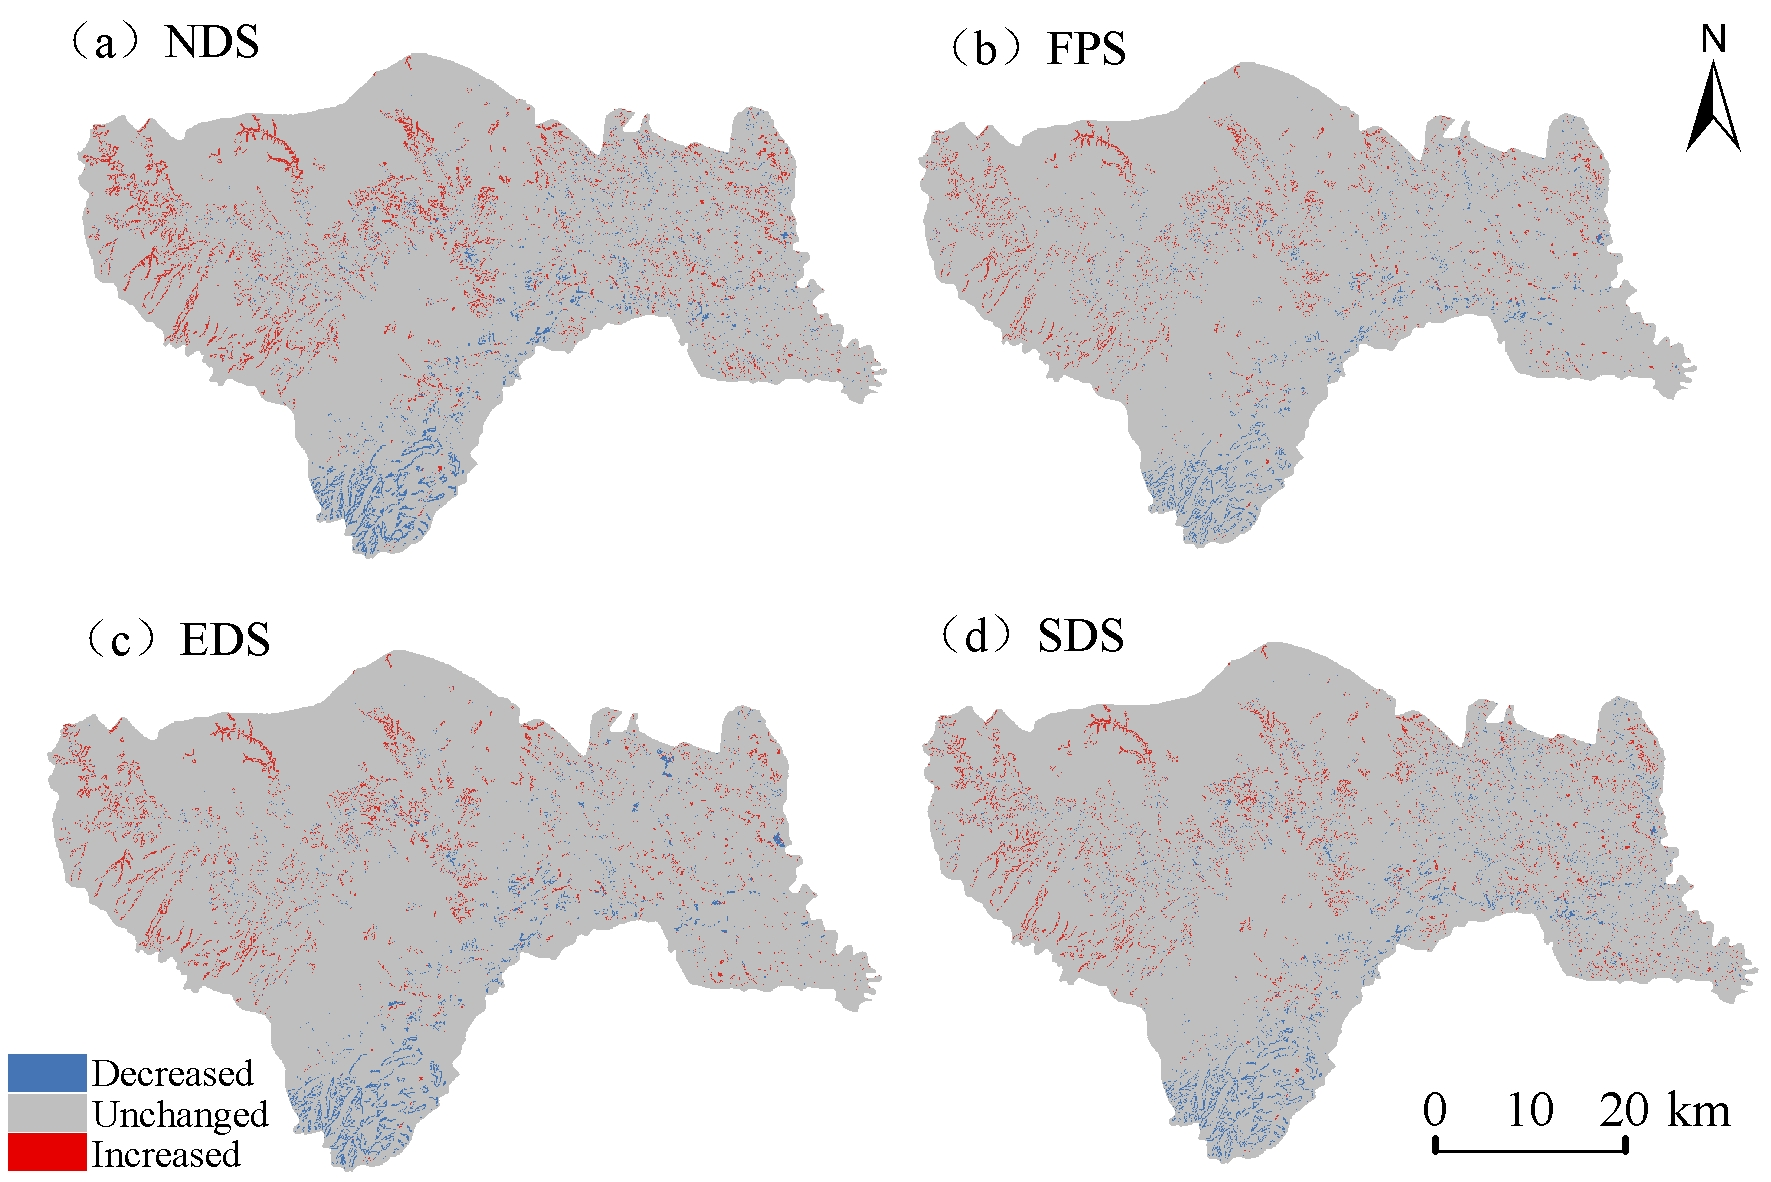
The spatial patterns of carbon stock changes from 2020 to 2030 (Figure 14) showed clear heterogeneity among different scenarios, with carbon gains and losses distributed in a spatially fragmented manner. Carbon stock increases were mainly scattered across the central and western regions, whereas carbon stock decreases were concentrated in the southern part and marginal areas of Huangling County. Overall, carbon stock dynamics under all scenarios were dominated by localized changes, while most regions remained relatively stable.
Figure 14.
Spatial distribution of carbon stock changes under different scenarios in Huangling County from 2020 to 2030.
The NDS and SDS resulted in broader areas of carbon stock increase, primarily associated with forestland expansion and ecological restoration. Conversely, the EDS exhibited relatively concentrated carbon stock losses, corresponding mainly to areas of built-up land expansion. Under the FPS, carbon stock variations were relatively limited in cropland-dominated areas, suggesting that cropland conservation contributed to maintaining regional carbon storage stability.
4. Discussion
4.1. Mechanisms Underlying the Impacts of Land-Use Changes on the Spatiotemporal Dynamics of Carbon Stocks
Land-use changes affect regional carbon storage through changes in land-use area, the direction of land-use transitions, and differences in carbon density among land-use types [5]. From 1990 to 2020, total carbon storage in Huangling County decreased by 142.05 × 10⁴ t, while forestland carbon storage declined by 353.01 × 10⁴ t. Forestland accounted for an average of 69.42% of total carbon storage during the study period, highlighting its dominant role in the regional carbon budget. The reduction in forestland carbon storage exceeded the net regional decline, indicating that carbon gains in other land-use types partially offset forestland losses [19].
The land-use transition matrix further reveals an asymmetric exchange between forestland and grassland. A total of 152.23 km2 of forestland was converted to grassland, whereas only 21.27 km2 of grassland was converted to forestland. Given the estimated carbon densities of 265.66 t for forestland and 179.82 t C/ha for grassland, forestland-to-grassland conversion resulted in a substantial reduction in carbon storage, whereas the reverse transition generated a smaller carbon gain. This asymmetry suggests that the direction and spatial extent of land-use transitions jointly influenced regional carbon storage dynamics [19].
Carbon density differences also explain the carbon consequences of other land-use transitions. For example, cropland-to-built-up land conversion involved a smaller area than forestland-to-grassland conversion but still resulted in a carbon storage loss because the estimated carbon density decreased from 236.6 to 71 t C/ha. These findings demonstrate that the carbon effects of land-use change cannot be evaluated solely on the basis of transition area. Instead, both the area converted and the carbon density contrast between the initial and final land-use types must be considered [5]. Protecting high-carbon-density forestland and limiting the conversion of carbon-rich land to built-up land may therefore help mitigate regional carbon storage losses.
The temporal and spatial resolutions of land-use data may affect the accuracy of carbon storage estimates [16,44]. The decadal intervals used in this study may overlook short-term transitions and seasonal vegetation dynamics, which are particularly relevant to the semi-arid Loess Plateau. Future research could use high-temporal-resolution products such as LP-QLC10 to better capture seasonal land-cover changes [45]. Meanwhile, the 1 m SinoLC-1 land-cover dataset and SinoBF-1 building-function product could help identify fine-scale landscape patterns and functional urban expansion, improving the assessment of localized carbon storage changes [46,47]. Integrating these datasets may reduce uncertainties and improve the temporal and spatial accuracy of regional carbon storage estimates.
4.2. Mechanisms of Spatial Differentiation in Carbon Stocks Under Multi-Factor Interactions
GeoDetector results showed that precipitation, NDVI, and elevation had the highest mean q-values among the eight explanatory variables, at 0.722, 0.669, and 0.588, respectively. The q-value of precipitation declined from 0.755 in 1990 to 0.614 in 2020, whereas that of NDVI increased from 0.627 in 2010 to 0.702 in 2020. These temporal variations indicate changes in the spatial associations between environmental factors and carbon stocks. Precipitation reflects spatial differences in water availability and hydroclimatic conditions, while NDVI characterizes vegetation cover and greenness, which are associated with biomass accumulation [24,27]. However, changes in q-values indicate variations in explanatory power rather than changes in the absolute amount of carbon storage or causal effects.
Interaction detection further revealed high explanatory power for the precipitation–GDP combination in 2010 (q = 0.829) and the NDVI–GDP combination in 2020 (q = 0.799). These results suggest that the spatial differentiation of carbon stocks was associated with the joint patterns of natural and socioeconomic factors.
The high interaction q-values for precipitation–GDP in 2010 and NDVI–GDP in 2020 highlight the joint associations of natural and socioeconomic factors with carbon stock patterns [48]. These findings underscore the importance of considering both ecological conditions and human activities, while recognizing that GeoDetector reveals spatial associations rather than causal relationships.
4.3. Land-Use Optimization and Pathways for Enhancing Carbon Stocks Under Different Scenarios
Among the four scenarios, the Natural Development Scenario (NDS) yielded the highest projected carbon stock in 2030, at 5409.98 × 104 t, exceeding that under the Sustainable Development Scenario (SDS; 5387.43 × 104 t) by 22.55 × 10⁴ t (approximately 0.42% of the NDS total). This difference was primarily associated with variations in land-use composition. The NDS had a larger forestland area (1379.55 km2) than the SDS (1359.55 km2), whereas the SDS had a larger grassland area (592.63 km2 compared with 571.92 km2 under the NDS). Given the higher carbon density of forestland than grassland adopted in this study, the greater forestland area under the NDS contributed to its higher total carbon stock, while the SDS had a higher carbon stock in grassland. These results indicate that differences in the allocation of land among land-use types can influence projected carbon storage. However, the higher carbon stock under the NDS does not necessarily imply superior overall ecological performance. The NDS reflects the continuation of historical land-use trends, whereas the SDS represents an alternative land-use configuration guided by different development priorities. The comparison therefore highlights the potential tradeoff between carbon storage and broader land-use objectives [8,49]. As this study focused on carbon storage and did not comprehensively assess other ecosystem services, the relative performance of the two scenarios in terms of biodiversity conservation, soil retention, and other ecological functions remains uncertain. Future research could incorporate additional ecosystem service indicators to evaluate these tradeoffs more comprehensively. From a territorial spatial planning perspective, carbon storage should be considered alongside farmland protection, socioeconomic development, and other ecological objectives rather than used as the sole criterion for evaluating future land-use scenarios [8,50].
5. Conclusions
This study focused on Huangling County and integrated the PLUS model, InVEST model, and geographical detector to investigate land-use changes, spatiotemporal dynamics of carbon stocks, driving mechanisms of spatial differentiation, and future scenario projections based on land-use data from 1990, 2000, 2010, and 2020. The results revealed the mechanisms underlying the impacts of land-use changes on regional carbon stocks. The main conclusions are summarized as follows:
- (1)
- From 1990 to 2020, the overall land-use structure of Huangling County remained relatively stable, with forestland and grassland consistently dominating the study area and jointly accounting for more than 84% of the total area. Land-use changes exhibited distinct temporal patterns. From 1990 to 2000, changes in the areas of individual land-use types were relatively minor. From 2000 to 2010, the expansion of built-up land became more pronounced. From 2010 to 2020, transitions between forestland and grassland intensified, with forestland decreasing by 137.28 km2 and grassland increasing by 145.31 km2.
- (2)
- Carbon stocks in Huangling County exhibited an overall declining trend during 1990–2020, decreasing from 5516.67 × 104 t to 5374.6 × 104 t, with a net loss of 142.05 × 10⁴ t. Carbon storage declined most sharply during 2010–2020, decreasing by 136.39 × 10⁴ t. Forestland accounted for 69.42% of regional carbon storage on average, but its carbon stock fell by 353.01 × 10⁴ t. In contrast, grassland carbon storage increased by 214.29 × 10⁴ t, partially offsetting forestland losses but not the overall decline.
- (3)
- Carbon storage in Huangling County exhibited marked spatial heterogeneity, with high values concentrated in forest-dominated western and central mountainous areas and low values around the county seat, transportation corridors, river valleys, and loess tablelands. GeoDetector results identified vegetation conditions, precipitation, and topography as important factors, while interaction detection highlighted the combined associations of natural and anthropogenic factors with carbon storage patterns.
- (4)
- By 2030, carbon storage under all four scenarios exceeded the 2020 level, with NDS showing the highest value. These differences were primarily associated with changes in land-use areas and their carbon densities. The results highlight the importance of forestland conservation and ecological restoration in future land-use planning.
Author Contributions
Conceptualization, J.S. and Q.W.; methodology, J.S.; software, J.S.; validation, J.S. and X.C.; formal analysis, J.S.; investigation, J.S. and X.C.; resources, Q.W.; data curation, J.S. and X.C.; writing—original draft preparation, J.S.; writing—review and editing, J.S., X.C. and Q.W.; visualization, J.S.; supervision, Q.W.; project administration, Q.W. All authors have read and agreed to the published version of the manuscript.
Funding
This research was funded by the National Natural Science Foundation of China (Grant No. 52108028).
Data Availability Statement
The datasets analyzed in this study are publicly available from the corresponding data providers. The land-use/land-cover data were obtained from the China Land Use Remote Sensing Monitoring Dataset provided by the Resource and Environmental Science and Data Center (RESDC), Chinese Academy of Sciences (http://www.resdc.cn/DOI, accessed on 12 August 2026; 2026; DOI: 10.12078/2026071401). The elevation data were obtained from the Copernicus Digital Elevation Model (COP-DEM) GLO-30 provided by ESA/Copernicus (https://doi.org/10.5270/ESA-c5d3d65, accessed on 12 August 2026). The GDP data were obtained from the China GDP Spatial Distribution Kilometer Grid Dataset provided by RESDC (http://www.resdc.cn/DOI, accessed on 12 August 2026; 2017; DOI: 10.12078/2017121102). The population data were obtained from the China Population Spatial Distribution Kilometer Grid Dataset provided by RESDC (http://www.resdc.cn/DOI, accessed on 12 August 2026; 2017; DOI: 10.12078/2017121101). Temperature and precipitation data were obtained from the China Meteorological Elements Spatial Interpolation Dataset provided by RESDC (http://www.resdc.cn/DOI, accessed on 12 August 2026; 2023; DOI: 10.12078/2023010405). NDVI data were obtained from the China Annual Vegetation Index Remote Sensing Inversion Dataset provided by RESDC (http://www.resdc.cn/DOI, accessed on 12 August 2026; 2022; DOI: 10.12078/2022030801). Road network data used to derive road density and other road-related variables were obtained from OpenStreetMap (OSM; https://www.openstreetmap.org/, accessed on 16 August 2024). The processed datasets generated during this study are available from the corresponding author upon reasonable request.
Conflicts of Interest
The authors declare no conflicts of interest.
Abbreviations
The following abbreviations are used in this manuscript:
| PLUS | Patch-generating Land Use Simulation |
| InVEST | Integrated Valuation of Ecosystem Services and Tradeoffs |
References
- Friedlingstein, P.; O’sullivan, M.; Jones, M.W.; Andrew, R.M.; Gregor, L.; Hauck, J.; Le Quéré, C.; Luijkx, I.T.; Olsen, A.; Peters, G.P.; et al. Global carbon budget 2022. Earth Syst. Sci. Data 2022, 14, 4811–4900. [Google Scholar] [CrossRef] [Scilit]
- Schimel, D.; Stephens, B.B.; Fisher, J.B. Effect of increasing CO2 on the terrestrial carbon cycle. Proc. Natl. Acad. Sci. USA 2015, 112, 436–441. [Google Scholar] [CrossRef] [Scilit] [PubMed]
- Pan, Y.; Birdsey, R.A.; Fang, J.; Houghton, R.; Kauppi, P.E.; Kurz, W.A.; Phillips, O.L.; Shvidenko, A.; Lewis, S.L.; Canadell, J.G. A large and persistent carbon sink in the world’s forests. Science 2011, 333, 988–993. [Google Scholar] [CrossRef] [Scilit] [PubMed]
- Foley, J.A.; DeFries, R.; Asner, G.P.; Barford, C.; Bonan, G.; Carpenter, S.R.; Chapin, F.S.; Coe, M.T.; Daily, G.C.; Gibbs, H.K. Global consequences of land use. Science 2005, 309, 570–574. [Google Scholar] [CrossRef] [Scilit] [PubMed]
- Guo, L.B.; Gifford, R.M. Soil carbon stocks and land use change: A meta analysis. Glob. Change Biol. 2002, 8, 345–360. [Google Scholar] [CrossRef] [Scilit]
- Lambin, E.F.; Turner, B.L.; Geist, H.J.; Agbola, S.B.; Angelsen, A.; Bruce, J.W.; Coomes, O.T.; Dirzo, R.; Fischer, G.; Folke, C.; et al. The causes of land-use and land-cover change: Moving beyond the myths. Glob. Environ. Change 2001, 11, 261–269. [Google Scholar] [CrossRef] [Scilit]
- Fang, J.; Yu, G.; Liu, L.; Hu, S.; Chapin, F.S., III. Climate change, human impacts, and carbon sequestration in China. Proc. Natl. Acad. Sci. USA 2018, 115, 4015–4020. [Google Scholar] [CrossRef] [Scilit] [PubMed]
- Goldstein, J.H.; Caldarone, G.; Duarte, T.K.; Ennaanay, D.; Hannahs, N.; Mendoza, G.; Polasky, S.; Wolny, S.; Daily, G.C. Integrating ecosystem-service tradeoffs into land-use decisions. Proc. Natl. Acad. Sci. USA 2012, 109, 7565–7570. [Google Scholar] [CrossRef] [Scilit] [PubMed]
- Liang, X.; Guan, Q.; Clarke, K.C.; Liu, S.; Wang, B.; Yao, Y. Understanding the drivers of sustainable land expansion using a patch-generating land use simulation (PLUS) model: A case study in Wuhan, China. Comput. Environ. Urban Syst. 2021, 85, 101569. [Google Scholar] [CrossRef] [Scilit]
- Liu, X.; Liang, X.; Li, X.; Xu, X.; Ou, J.; Chen, Y.; Li, S.; Wang, S.; Pei, F. A future land use simulation model (FLUS) for simulating multiple land use scenarios by coupling human and natural effects. Landsc. Urban Plan. 2017, 168, 94–116. [Google Scholar] [CrossRef] [Scilit]
- Wang, L.; Liu, D.; Wu, X.; Zhang, X.; Liu, Q.; Kong, W.; Luo, P.; Yang, S. Simulation analysis of land use change via the PLUS-GMOP coupling model. Land 2025, 14, 802. [Google Scholar] [CrossRef] [Scilit]
- Wang, H.; Wu, L.; Yue, Y.; Jin, Y.; Zhang, B. Impacts of climate and land use change on terrestrial carbon storage: A multi-scenario case study in the Yellow River Basin (1992–2050). Sci. Total Environ. 2024, 930, 172557. [Google Scholar] [CrossRef] [Scilit] [PubMed]
- Liu, K.; Zhang, C.; Zhang, H.; Xu, H.; Xia, W. Spatiotemporal variation and dynamic simulation of ecosystem carbon storage in the Loess Plateau Based on PLUS and InVEST models. Land 2023, 12, 1065. [Google Scholar] [CrossRef] [Scilit]
- Li, J.; Hu, J.; Kang, J.; Shu, W. Spatio-temporal variation and prediction of land use and carbon storage based on PLUS-InVEST model in Shanxi Province, China. Landsc. Ecol. Eng. 2025, 21, 107–119. [Google Scholar] [CrossRef] [Scilit]
- Fu, B.; Wang, S.; Liu, Y.; Liu, J.; Liang, W.; Miao, C. Hydrogeomorphic ecosystem responses to natural and anthropogenic changes in the Loess Plateau of China. Annu. Rev. Earth Planet. Sci. 2017, 45, 223–243. [Google Scholar] [CrossRef] [Scilit]
- Brown, D.G.; Verburg, P.H.; Pontius, R.G., Jr.; Lange, M.D. Opportunities to improve impact, integration, and evaluation of land change models. Curr. Opin. Environ. Sustain. 2013, 5, 452–457. [Google Scholar] [CrossRef] [Scilit]
- Sohl, T.L.; Wimberly, M.C.; Radeloff, V.C.; Theobald, D.M.; Sleeter, B.M. Divergent projections of future land use in the United States arising from different models and scenarios. Ecol. Model. 2016, 337, 281–297. [Google Scholar] [CrossRef] [Scilit]
- Jiang, C.; Zhang, H.; Tang, Z.; Labzovskii, L. Evaluating the coupling effects of climate variability and vegetation restoration on ecosystems of the Loess Plateau, China. Land Use Policy 2017, 69, 134–148. [Google Scholar] [CrossRef] [Scilit]
- Deng, L.; Liu, G.-b.; Shangguan, Z.-p. Land-use conversion and changing soil carbon stocks in China’s ‘Grain-for-Green’Program: A synthesis. Glob. Change Biol. 2014, 20, 3544–3556. [Google Scholar] [CrossRef] [Scilit] [PubMed]
- Jiao, J.; Zhang, Z.; Bai, W.; Jia, Y.; Wang, N. Assessing the ecological success of restoration by afforestation on the Chinese Loess Plateau. Restor. Ecol. 2012, 20, 240–249. [Google Scholar] [CrossRef] [Scilit]
- Dang, G.; Li, G.; Hu, J. Identification and analysis of driving factors for ecosystem service bundles in Shanxi Province under multiple scenario simulations. Sci. Rep. 2025, 15, 20789. [Google Scholar] [CrossRef] [Scilit] [PubMed]
- Zhou, H.; Tang, M.; Huang, J.; Mei, X.; Zhao, H. Driving mechanisms and multi-scenario simulation of land use change based on National Land Survey Data: A case in Jianghan Plain, China. Front. Environ. Sci. 2024, 12, 1422987. [Google Scholar] [CrossRef] [Scilit]
- Cheng, J.-m.; Cheng, J.; Yang, X.-m. Grassland vegetation and soil carbon sequestration in the Loess Plateau. J. Nat. Resour. 2011, 26, 401–411. [Google Scholar] [CrossRef]
- Liu, G.; Zhao, Z. Analysis of carbon storage and its contributing factors—A case study in the Loess Plateau (China). Energies 2018, 11, 1596. [Google Scholar] [CrossRef] [Scilit]
- Luo, H.; Yuan, D.; Chen, H. Corrosion of limestone in farmland ecosystems and its carbon sink effect in the karst area of southwest China: A case study in Sanquan town, Nanchuan City, Chongqing Municipality. Earth Sci. Front. 2011, 18, 64–71. [Google Scholar] [CrossRef]
- Qing, M.; Zhao, J.; Feng, C.; Huang, Z.; Wen, Y.; Zhang, W. Response of ecosystem carbon storage service to land-use change in Shiyang River Basin from 1980 to 2030. Acta Ecol. Sin. 2022, 42, 9525–9536. [Google Scholar] [CrossRef] [Scilit]
- Tang, X.; Zhao, X.; Bai, Y.; Tang, Z.; Wang, W.; Zhao, Y.; Wan, H.; Xie, Z.; Shi, X.; Wu, B. Carbon pools in China’s terrestrial ecosystems: New estimates based on an intensive field survey. Proc. Natl. Acad. Sci. USA 2018, 115, 4021–4026. [Google Scholar] [CrossRef] [Scilit] [PubMed]
- Wang, T.-f.; Gong, Z.-w.; Deng, Y.-j. Identification of priority areas for improving quality and efficiency of vegetation carbon sinks in Shaanxi province based on land use change. J. Nat. Resour. 2022, 37, 1214–1232. [Google Scholar] [CrossRef] [Scilit]
- Intergovernmental Panel on Climate Change. 2006 IPCC Guidelines for National Greenhouse Gas Inventories; Institute for Global Environmental Strategies: Hayama, Japan, 2006. [Google Scholar]
- Wang, C.; Yang, K.; Yang, W.; Qiang, H.; Xue, H.; Lu, B.; Zhou, P. R-MFNet: Analysis of urban carbon stock change against the background of land-use change based on a residual multi-module fusion network. Remote Sens. 2023, 15, 2823. [Google Scholar] [CrossRef] [Scilit]
- Ma, G.; Li, Q.; Zhang, J.; Zhang, L.; Cheng, H.; Ju, Z.; Sun, G. Simulation and analysis of land-use change based on the PLUS model in the Fuxian Lake Basin (Yunnan–Guizhou Plateau, China). Land 2023, 12, 120. [Google Scholar] [CrossRef] [Scilit]
- Pontius, R.G.; Millones, M. Death to Kappa: Birth of quantity disagreement and allocation disagreement for accuracy assessment. Int. J. Remote Sens. 2011, 32, 4407. [Google Scholar] [CrossRef] [Scilit]
- Liu, J.; Liu, B.; Wu, L.; Miao, H.; Liu, J.; Jiang, K.; Ding, H.; Gao, W.; Liu, T. Prediction of land use for the next 30 years using the PLUS model’s multi-scenario simulation in Guizhou Province, China. Sci. Rep. 2024, 14, 13143. [Google Scholar] [CrossRef] [Scilit] [PubMed]
- Ye, Y.; Lai, M.; Dong, M.; Li, Z.; Yuan, J.; Lyu, J. Coupling the PLUS-InVEST model for multi-scenario land use simulation and carbon storage assessment in Northern Anhui, China. Sustainability 2025, 17, 4185. [Google Scholar] [CrossRef] [Scilit]
- Gao, L.; Tao, F.; Liu, R.; Wang, Z.; Leng, H.; Zhou, T. Multi-scenario simulation and ecological risk analysis of land use based on the PLUS model: A case study of Nanjing. Sustain. Cities Soc. 2022, 85, 104055. [Google Scholar] [CrossRef] [Scilit]
- Hu, N.; Wang, G.; Ma, Z.; Zhao, M.; Yuan, Y.; Zhang, T.; Chen, Q.; Meng, J.; Wang, J. Multi-scenario simulation of land use dynamics and ecological risk: A case study of the liaohe estuary national wetland reserve using PLUS-Markov and PSR models. Front. Environ. Sci. 2024, 12, 1361970. [Google Scholar] [CrossRef] [Scilit]
- Zhou, J.; Johnson, V.C.; Shi, J.; Tan, M.L.; Zhang, F. Multi-scenario land use change simulation and spatial-temporal evolution of carbon storage in the Yangtze River Delta region based on the PLUS-InVEST model. PLoS ONE 2025, 20, e0316255. [Google Scholar] [CrossRef] [Scilit] [PubMed]
- Luo, X.; Luo, X.; Yang, X.; Wang, J.; Liao, J.; He, Y.; Du, Y.; Yang, Y. Optimization of the Loess Plateau of the China Ecological Network Pattern Based on a PLUS Model. Land 2025, 14, 1488. [Google Scholar] [CrossRef] [Scilit]
- Lin, X.; Fu, H. Multi-scenario simulation analysis of cultivated land based on PLUS model—A case study of Haikou, China. Front. Ecol. Evol. 2023, 11, 1197419. [Google Scholar] [CrossRef] [Scilit]
- Gong, J.; Du, H.; Sun, Y.; Zhan, Y. Simulation and prediction of land use in urban agglomerations based on the PLUS model: A case study of the Pearl River Delta, China. Front. Environ. Sci. 2023, 11, 1306187. [Google Scholar] [CrossRef] [Scilit]
- Wang, J.F.; Li, X.H.; Christakos, G.; Liao, Y.L.; Zhang, T.; Gu, X.; Zheng, X.Y. Geographical detectors-based health risk assessment and its application in the neural tube defects study of the Heshun Region, China. Int. J. Geogr. Inf. Sci. 2010, 24, 107–127. [Google Scholar] [CrossRef] [Scilit]
- O’brien, R.M. A caution regarding rules of thumb for variance inflation factors. Qual. Quant. 2007, 41, 673–690. [Google Scholar] [CrossRef] [Scilit]
- Fox, J.; Monette, G. Generalized collinearity diagnostics. J. Am. Stat. Assoc. 1992, 87, 178–183. [Google Scholar] [CrossRef] [Scilit]
- Rosa, I.; Ahmed, S.E.; Ewers, R.M. The transparency, reliability and utility of tropical rainforest land-use and land-cover change models. J. Glob. Change Biol. 2014, 20, 1707–1722. [Google Scholar] [CrossRef] [Scilit] [PubMed]
- Li, Z.; Li, L.; Hu, T.; Cheng, M.; He, W.; Qiu, T.; Zhang, L.; Zhang, H. Satellite mapping of every building’s function in urban China reveals deep built environment disparities. Nat. Commun. 2026, 17, 2827. [Google Scholar] [CrossRef] [Scilit] [PubMed]
- Li, Z.; He, W.; Cheng, M.; Hu, J.; Yang, G.; Zhang, H. SinoLC-1: The first 1 m resolution national-scale land-cover map of China created with a deep learning framework and open-access data. Earth Syst. Sci. Data 2023, 15, 4749–4780. [Google Scholar] [CrossRef] [Scilit]
- Cheng, M.; Li, Z.; Li, L.; He, W.; Zhang, L.; Zhang, H. 25-year, quarterly land change maps of China’s Loess Plateau reveal long-term and substantial water-induced soil erosion mitigation. Earth Syst. Sci. Data 2026, 18, 3303–3340. [Google Scholar] [CrossRef] [Scilit]
- Chen, J.; Gao, P.; Hou, Y. Spatio-temporal evolution and driving force analysis of carbon storage coupled with PLUS-InVEST-GeoDetector in the Fen River Basin of China. Sci. Rep. 2026. [Google Scholar] [CrossRef] [Scilit]
- Xiong, M.; Li, F.; Liu, X.; Liu, J.; Luo, X.; Xing, L.; Wang, R.; Li, H.; Guo, F. Characterization of ecosystem services and their trade-off and synergistic relationships under different land-use scenarios on the loess plateau. Land 2023, 12, 2087. [Google Scholar] [CrossRef] [Scilit]
- Jiang, Y.; Ouyang, B.; Yan, Z. The response of carbon storage to multi-objective land use/cover Spatial optimization and vulnerability assessment. Sustainability 2024, 16, 2235. [Google Scholar] [CrossRef] [Scilit]

Disclaimer/Publisher’s Note: The statements, opinions and data contained in all publications are solely those of the individual author(s) and contributor(s) and not of MDPI and/or the editor(s). MDPI and/or the editor(s) disclaim responsibility for any injury to people or property resulting from any ideas, methods, instructions or products referred to in the content. |
© 2026 by the authors. Licensee MDPI, Basel, Switzerland. This article is an open access article distributed under the terms and conditions of the Creative Commons Attribution (CC BY) license.