


Abstract
Ground-mounted solar parks create new land-use pressures in Europe, particularly where they compete with semi-natural grasslands. In Bulgaria, this remains poorly quantified. We combined national agricultural statistics, Copernicus Grassland Change (GRAC) maps, six Annex I grassland habitats and 704 mapped solar sites. The national estimate of agricultural permanent grassland was 720,339 ha (42.3%) lower in 2025 than in 2010. More than half of this difference followed the 2025 control of survey points and is not an equivalent loss of the semi-natural habitat. Within 198,095.77 ha of the mapped habitat, GRAC classified 2824.88 ha as grassland loss in 2018–2024. A stratified sample of 250 locations, interpreted blind from Sentinel-2 data, confirmed 37% of this area (1056.64 ha), mostly ploughing to arable land. It put total grassland loss at 1313 ha, or 3531 ha if a single influential reference location is classified as loss; neither value is a definitive estimate of habitat loss. Solar sites (4675.13 ha) overlapped 78.98 ha of the habitats, including a 2019–2020 plant extension on 20.16 ha. In the 2016–2018 baseline land cover, 34.81% of the solar-site area was grassland or shrubland; construction dates of 17 large sites gave conditional scenarios of 560.62–1309.08 ha of potential conversion. Solar development should prioritise already modified land and avoid species-rich grasslands.
1. Introduction
Semi-natural grasslands are among the most species-rich habitats in Europe. Their persistence depends largely on low-intensity management, particularly extensive mowing or grazing, and on avoiding major disturbances, such as ploughing or reseeding [1,2]. These habitats also support many wild medicinal plants whose long-term persistence depends on the same relatively stable management conditions [3,4,5].
Despite their ecological importance, semi-natural grasslands continue to decline across Europe. Conversion to cropland and agricultural intensification remain major pressures, while abandonment can also alter the vegetation structure and species composition in marginal areas [1,2,6,7]. Bulgaria is a relevant example of these broader trends. High Nature Value farmland is estimated to have declined by approximately 40% between 2007 and 2019, with permanent grasslands among the most affected land-use types [8]. Changes in agricultural support and management have also been discussed as factors favouring more intensive land use over extensive grassland systems [6,8]. At the same time, the rapid expansion of ground-mounted solar energy is creating a new demand for land. Bulgaria’s installed photovoltaic capacity increased from just over 1 GW in 2020 to almost 3 GW in 2023 [9,10], and recent projects include developments extending over hundreds of hectares [11,12,13]. National rules have also begun to address the use of agricultural land for photovoltaics: the Agricultural Land Conservation Act was amended in December 2023 with provisions on agrivoltaic installations [14], and a 2025 court ruling held that agrivoltaic development should not come at the expense of agriculture [15]. These rules are concerned mainly with keeping agricultural land in agricultural use. The 2023 provisions allowed agrivoltaic installations without a change of land designation based on agricultural land of the seventh to tenth quality categories, that is, land of low agronomic value, and left the conditions for their construction to a separate ordinance [14]. Low agronomic value does not, however, imply low ecological value: semi-natural grasslands depend on low-intensity management and decline under agricultural intensification [1,2], and permanent grassland forms the largest part of High Nature Value farmland in Bulgaria [8]. This expansion is important for the energy transition, but its ecological consequences depend strongly on where solar parks are located and how the land beneath and around them is managed. Where development replaces functioning semi-natural grassland, vegetation clearance, soil disturbance, shading and subsequent management may alter the habitat structure and ecological conditions. Field studies from other countries have reported changes in plant diversity, difficulties in restoring grassland vegetation and reduced activity of some bat species, although effects vary considerably among sites and management regimes [16,17,18,19].
These concerns are particularly relevant in landscapes where grasslands have already undergone substantial long-term decline. Yet the spatial relationship between recent solar development and Bulgaria’s remaining grassland resources has not been assessed systematically at the national scale. Earth-observation datasets provide an opportunity to examine this relationship. The Copernicus High Resolution Layer Grassland Change (GRAC) product maps grassland loss and gain at a 20 m resolution for 2018–2021 and 2021–2024 [20,21], while Dynamic World [22,23] and ESA WorldCover [24] provide complementary information on recent land-cover conditions. Because these products describe land cover rather than the ecological condition of Annex I habitats, their results must be interpreted cautiously and within mapped habitat boundaries [25,26,27,28,29,30,31].
Four related terms need to be kept apart. Permanent grassland is the agricultural land-use category recorded by the national BANSIK area-frame survey (nomenclature codes 45–48) [32,33]. Grassland land cover refers to the herbaceous vegetation classes detected by satellite products such as GRAC, Dynamic World or WorldCover, whatever the management or species composition. Semi-natural grassland is a plant community shaped by long-term extensive mowing or grazing; it can only be identified from information on species composition and management. An Annex I grassland habitat is a habitat type defined in Annex I of the Habitats Directive [26]. A mapped polygon records where such a habitat was identified; it does not guarantee that the habitat was still present, or in the same condition, at later dates. Neither a decrease in the agricultural category nor a satellite grassland-loss signal shows, on its own, that semi-natural grassland or an Annex I habitat has been lost.
This study addresses three related questions. (i) How do the agricultural land-use categories reported by the BANSIK survey differ between 2010 and 2025, and how do the intermediate annual estimates qualify this endpoint comparison? (ii) Where did GRAC record grassland loss and gain events within mapped polygons of six Annex I grassland habitat types between 2018 and 2024, and how much of the mapped loss does a reference sample confirm? (iii) How do mapped ground-mounted solar sites coexist spatially with these habitat polygons and with land classified as grassland or shrubland in a fixed 2016–2018 baseline? Our aim is to describe spatial coexistence and potential exposure and to identify locations that need ecological verification. We do not estimate how much of the national grassland decrease was caused by solar development. When we ask whether the recent expansion of large solar parks adds a potentially important pressure to grassland landscapes in Bulgaria, importance refers to the extent and distribution of potential spatial exposure rather than to a demonstrated magnitude of ecological impact.
2. Materials and Methods
The study combined national agricultural statistics, mapped Annex I grassland habitats, satellite-based grassland change data and mapped ground-mounted solar sites within a common spatial framework. These sources differ in purpose, date, definitions and denominators. The analysis compares agricultural land-use estimates, change signals within selected habitat polygons and the spatial coexistence of habitats and solar sites, but never combines their areas into a single estimate of ecological loss. The overall workflow is summarised in Figure 1.
Figure 1.
Data sources and analytical workflow. The GRAC and Dynamic World strands use different products, definitions and denominators, and each was assessed against its own reference sample (Section 2.3 and Section 2.4). Areas were calculated in ETRS89-LAEA (EPSG:3035); maps were displayed in BGS2005/CCS2005 (EPSG:7801).
2.1. Habitat Framework and Reference Data
Six Annex I grassland habitat types were included in the analysis: 6110*, 6210, 62A0, 6240*, 6430 and 6510. They represent a range of dry, calcareous, steppe, mesic and tall-herb grassland environments and were selected because of their ecological importance and relevance to wild medicinal plant diversity [26]. The selection is purposive. It is neither a statistically representative sample nor a complete set of Bulgarian grassland habitats: alpine and subalpine grasslands, mountain hay meadows, Ponto-Sarmatic steppes and wet meadows, among others, were not analysed. All habitat-specific results, including the solar-site overlaps, apply only to these six types, and ecologically valuable grasslands outside their mapped polygons are not represented.
Official habitat-cover information was obtained from the Natura 2000 Standard Data Forms (SDFs) and used to describe the overall extent of the selected habitat types in Bulgaria [27,28,29]. Article 17 assessments for 2013–2018 were used as additional information based on their conservation status [30]. SDF cover and the mapped polygon area were treated as separate quantities and are compared in Table A3.
For the spatial analysis, polygons of the same six habitat types were obtained from the national habitat mapping provided by the Bulgarian Executive Environment Agency (ExEA) [25]. These polygons formed the spatial reference within which recent grassland loss and gain were assessed and were subsequently compared with the mapped distribution of ground-mounted solar sites. The layer combines records of different dates: the year attribute of the 34,199 selected records ranges from 2012 to 2025, and 33,370 records (97.6%) carry the year 2012. We used it as a fixed spatial reference mask. The mask does not show that the habitat was still present in each polygon when the GRAC period began in 2018. If a habitat had already been lost or degraded before 2018, GRAC cannot register that change. Of the selected records, 3559 are mosaic polygons, in which the habitat occupies a recorded percentage (1–99%) of the polygon. The spatial analyses used whole polygons, so mapped areas include the other components of such mosaics (Section 3.2).
2.2. National Agricultural Statistics
National land-use statistics for 2010 and 2025 were obtained from the BANSIK surveys of the Bulgarian Ministry of Agriculture and Food (MAF) [32,33]. National estimates for the intermediate years were taken from the time-series tables of the 2014 report (2011–2014) [34], the 2024 report (2015) [35] and the 2025 report (2016–2024) [33], as well as district estimates for 2024 from the 2024 report [35]. BANSIK is an area-frame point survey. In both years, the frame comprised approximately 111,000 points in 3123 segments located on a 6 km grid, with 36 points per segment at a 234 m spacing. Each point was assigned to a class of a physical nomenclature introduced in 1998, which, according to both reports, had not been changed, apart from clarifications [32,33]. Permanent grassland comprises codes 45–48 in both years: permanent productive meadows (45), high-mountain pastures (46), grassed surfaces with low productive potential (47) and meadow–orchards (48). The utilised agricultural area (UAA) comprises arable land, permanent grassland, permanent crops and family gardens, together with glasshouses where these are reported separately. The only definitional differences between the two reports concern two small codes: glasshouses (code 82) were reported separately in 2010 but within arable land in 2025, whereas nurseries (code 40) were included in arable land, and thus in UAA, in 2010 but reported separately and outside the UAA in 2025. These two codes covered 7240 ha in 2010 and 3719 ha in 2025, less than 0.2% of the UAA. The correspondence between categories and the national values used is given in Table A4. National comparisons use the published national totals, and district comparisons use the published NUTS-3 estimates.
BANSIK estimates are subject to sampling and non-sampling error. Both reports describe the estimation of random sampling error and note that precision increases with the area of a class, but neither publishes standard errors or confidence intervals for the aggregates used here [32,33], so we do not report confidence intervals. Sampling error is nevertheless unlikely to explain national differences in the size analysed here. Even if the 36 points of each segment were treated as a single observation (3123 segments in a national territory of about 11.1 million ha), the approximate binomial standard errors would be about 71,600 ha in 2010 and 56,400 ha in 2025, or about 91,000 ha for the 2010–2025 difference, against an observed difference of 720,339 ha. The 2024–2025 difference (403,822 ha) is about 4.7 times its approximate standard error. Non-sampling changes are the larger concern: the 2025 report states that the decrease in permanent grassland followed the control of more than two-thirds of the survey points [33]. Because point-level transition data are not published, differences between survey years are interpreted as net differences between published estimates and not as observed transitions between land-use categories. District estimates rest on fewer points and are less precise than national totals.
2.3. Copernicus Grassland Change
Recent grassland change within the six selected Annex I habitat types was assessed using the Copernicus High Resolution Layer Grassland Change (GRAC) products for 2018–2021 and 2021–2024 [20,21]. Both products were obtained from the collection CLMS VLCC Grassland Change (GRAC) Europe 20m 3-yearly V1 (identifier clms_vlcc_grassland-change_europe_20m_3yearly_v1) as 20 m tiles in ETRS89-LAEA (EPSG:3035): 27 tiles for 2018–2021 (file pattern CLMS_HRLVLCC_GRAC_C2018-2021_R20m_[tile]_03035_V01_R01; version V01, revision R01) and 27 tiles for 2021–2024 (CLMS_HRLVLCC_GRAC_C2021-2024_R20m_[tile]_03035_V01_R00; version V01, revision R00). Tile identifiers and checksums are listed in Table S1. All spatial analyses were performed in ETRS89-LAEA (EPSG:3035).
Habitat polygons were repaired, projected to EPSG:3035 and dissolved in two ways. First, polygons were dissolved separately within each habitat code. These within-code unions give the habitat-specific areas (Section 3.3), in which a location where two or more habitat types overlap is counted under each of them. Second, all polygons of the six types were dissolved together. This all-code union (198,095.77 ha) counts each location once and gives the totals for the six types. No overlapping polygons were removed: overlaps within a habitat type were merged, and overlaps between types were counted once only in the all-code union. Habitat-specific areas must therefore not be summed. GRAC loss and gain cells were intersected with both sets of unions and summarised by habitat type and period.
GRAC class 2 (grassland loss) and class 1 (grassland gain) were used as change events. The other classes, including unchanged grassland, non-grassland, unverified gain or loss and areas outside the product, were not counted as change [21]. Within the habitat mask, only classes 0 (non-grassland at both dates), 1, 2 and 10 (unchanged grassland) occurred in either product. Loss and gain were tabulated by period on the native 20 m grid, on which each full cell represents 0.04 ha. The spatially unique loss area for 2018–2024 is the union of cells classified as loss in either period, and unique gain is defined analogously. A cell classified as loss in one period and gain in the other belongs to both sets; such reversible cells were identified separately (Section 3.3). Because each GRAC product describes change within its own three-year period, the two periods were not combined into a net change in grassland stock.
Change percentages were calculated relative to the mapped area of each habitat type. GRAC detections were treated as indicators of grassland-cover change within mapped habitat polygons rather than as direct confirmation of habitat destruction or ecological condition.
The loss and gain classes were assessed against a stratified random reference sample drawn on the 20 m GRAC grid within the all-code union, using the cells whose centre lies inside the union (198,085.72 ha). Seven strata were defined from the two products: loss in 2018–2021 (1785.48 ha); loss in 2021–2024 (1039.40 ha); cells on which the two products disagree about the state in 2021 (1046.16 ha); gain in either period (759.24 ha); unchanged cells within 40 m of a loss cell (3399.72 ha); and the remaining unchanged grassland (130,852.80 ha) and non-grassland (59,202.92 ha). Disagreement cells are those with unchanged grassland followed by non-grassland, non-grassland followed by unchanged grassland or gain followed by non-grassland. Of the 250 locations, 40 were allocated to each loss stratum, 30 to each of the disagreement, buffer and non-grassland strata, 20 to the gain stratum and 60 to the unchanged-grassland stratum. This allocation gives useful precision for the mapped change classes while still sampling the unchanged strata for omitted loss [36,37].
The reference question followed the definition of the GRAC grassland layer [21]: whether the 20 m cell was grassland in 2018, 2021 and 2024, and whether its cover changed in each period. The layer defines grassland as herbaceous vegetation with at least 30% cover dominated by graminoids, at most 10% cover of trees or shrubs and no tillage in the reference year or the five to six preceding years (the manual gives both periods). Grassland loss in a period required grassland at its start and non-grassland at its end; loss in 2018–2024 was loss in either period or grassland in 2018 and non-grassland in 2024; gain was defined analogously. For each location, the evidence comprised Sentinel-2 true-colour composites of 400 m × 400 m around the cell for 2018, 2021 and 2024 and the monthly median normalised difference vegetation index (NDVI) of the cell from January 2017 to December 2024 (to December 2025 for 50 locations). Each composite was the per-pixel median of May–September observations, keeping only pixels that the scene classification labels as vegetation, non-vegetated, water or unclassified. The locations were interpreted blind in a random order under a written protocol, from evidence panels that showed only a neutral identifier, the images and the NDVI series. The strata, the GRAC classes, other land-cover products and the coordinates were not shown. A location was excluded from an estimate if the label needed for that estimate was uncertain. User’s and producer’s accuracies, overall agreement and the area of reference loss were estimated with stratified estimators, weighing each stratum by its mapped area [36,37]. Normal-approximation intervals gave negative lower limits for the areas outside the mapped loss, so 95% confidence intervals (CIs) were obtained from a stratified bootstrap with 20,000 replicates (percentile intervals). The normal-approximation intervals are given in Table S5. As an independent check, the labels were compared with the EU crop-type maps for 2018 and 2022 (EUCROPMAP), which were classified from Sentinel data and trained on LUCAS in-situ observations [38,39]. Each cell took the class of at least three of its four 10 m pixels. The protocol, the NDVI series, the labels and the scripts are provided in Table S5 and File S2. The coordinates of the locations are not published. The interpretation was done by one author (M.T.), who inspected the evidence of every location and decided each label. The evidence panels were presented in batches, and the labels and notes were recorded, in one browser session with an AI assistant (Claude, Anthropic San Francisco, CA, USA), which kept the checks in one place instead of separate Earth Engine tabs; every recorded label was checked by the interpreter (File S2).
2.4. Complementary Land-Cover Change Screening
Complementary land-cover screening was carried out in Google Earth Engine [23] using Dynamic World V1 [22]. Two three-year windows were compared: 2016–2018 as the baseline and 2023–2025 as the recent period. For each year, all Dynamic World images acquired between 1 April and 31 October were composited by averaging the class probabilities of each pixel, and the number of observations was recorded. A pixel-year was valid if it had at least three observations. Pixels with at least two valid years in each window formed the valid temporal coverage.
For each year, grassland and shrub-and-scrub probabilities were summed as grass/shrub support, with cropland, built and bare-ground probabilities as crops/built/bare support. A year supported a group when its summed probability was at least 0.50. Grass/shrub support is a broad land-cover indicator and does not identify semi-natural vegetation. A change candidate required grass/shrub support in at least two baseline years and crops/built/bare support in at least two recent years. Candidate patches were retained if they covered at least 0.10 ha (ten eight-connected 10 m pixels). Table S3 reports a variant that applies the ten-pixel filter on a 20 m grid (0.40 ha). The recent land-cover type of each candidate (crops, built or bare) was assigned from the highest mean probability in 2023–2025.
ESA WorldCover 2021 v200 [24] was used as an additional check: candidates mapped as shrubland (class 20) or grassland (class 30) in 2021 were considered WorldCover-supported. A stricter strongest-consensus subset additionally required group support in all three years of both windows, window-mean probabilities of at least 0.55 for grass/shrub in the baseline and for crops/built/bare in the recent window and WorldCover support. Areas were calculated at 10 m in EPSG:3035 within the mask of each habitat type, so that each location is counted once per type (Section 3.4). The screening used the Earth Engine copy of the ExEA layer, in which polygons were dissolved by habitat type and Natura 2000 site. Records outside Natura 2000 sites were not part of that copy, so the screening results (Section 3.4) refer only to habitat polygons inside the network; the GRAC analysis (Section 2.3) used all mapped records.
To assess the screening, we drew a stratified random sample of 250 locations (50 per stratum) on the 10 m grid within the valid temporal coverage of the six habitat types. Five mutually exclusive map strata were used: (1) no persistent crops/built/bare support in 2023–2025; (2) persistent crops/built/bare support that did not meet the candidate rule; (3) candidate only; (4) WorldCover-supported candidate; and (5) strongest consensus. One author (M.T.) labelled the locations in random order without access to their stratum. Because of time constraints, labelling stopped after the first 70 locations (11–18 per stratum); as the order was random, these form a stratified random subsample. The interpreter used Sentinel-2 May–September median composites for 2016, 2018, 2020, 2022, 2024 and 2025 in true and false colour and as NDVI, the 2016–2025 NDVI series of the pixel from cloud-free Sentinel-2 observations (Cloud Score+ ≥ 0.6) and current and historical very-high-resolution imagery in Google Earth, which was examined for every location (examples in Figure S1). The reference question matched the candidate definition: grass or shrub cover in 2016–2018 followed by cropland, built-up or bare cover in 2023–2025. Changes in grassland management, such as a shift from grazing to mowing, were not counted as change. This criterion was made explicit only after labelling, when one label raised the question of whether such a shift counted as change. The 22 locations labelled as change were then re-read against it in a blinded second reading, from their monthly NDVI series alone and blind to the map strata and the location identifiers: 7 labels were retained, and 12 were revised to no change and 3 to uncertain (Table S4). Locations labelled as no change were not re-read, because the narrower criterion could not turn them into change. Locations that could not be labelled with confidence were recorded as uncertain and excluded. Overall accuracy, user’s and producer’s accuracies of the candidate class and the area of reference change were estimated with stratified estimators and 95% CIs, using the mapped area of each stratum as weight [36,37]. Estimates with the initial labels are reported for comparison. The same sample was used to check the GRAC loss class (loss in 2018–2021 or 2021–2024) with the estimators for strata that differ from the map classes [37]. This check treats GRAC loss as an indicator of conversion to cropland, built-up or bare cover, a narrower definition than that of the GRAC product. Against the GRAC definition itself, loss and gain were assessed with the sample described in Section 2.3. Sensitivity to the decision rules was tested by repeating the screening with probability thresholds of 0.40–0.60, persistence in three of three years, minimum patches of 0, 0.10 and 0.40 ha and a one-observation rule for valid years (Table S3). The second reading of the change labels followed the same browser-based procedure as the GRAC interpretation (Section 2.3): the interpreter (M.T.) inspected the anonymised NDVI series of every location and decided its label, and every label recorded by the assistant was checked by the interpreter.
These outputs were used as screening indicators of persistent land-cover change and were not interpreted as direct evidence of Annex I habitat loss. Agreement between Dynamic World and WorldCover indicates consistency between the products and cannot serve as an independent assessment of accuracy.
2.5. Ground-Mounted Solar Development
Ground-mounted solar sites were mapped from OpenStreetMap (OSM) data retrieved through the Overpass API, using the state of the database at 20:30 UTC on 1 September 2026. Closed ways and multipolygon relations within Bulgaria tagged power=plant with plant:source=solar were extracted. This tag combination targets plant sites rather than rooftop generators. Geometries were repaired where necessary, and overlapping polygons were dissolved so that each location was counted once. The final dataset contained 704 non-overlapping site polygons (PV001–PV704; File S1) covering 4675.13 ha, of which 696 are closed ways (PV001–PV696) and eight are multipolygon relations (PV697–PV704). The Overpass query is provided in File S2. Run with its date setting, it returns the 696 ways and eight relations, which correspond one-to-one to the polygons in File S1.
Because OpenStreetMap is a volunteered geographic database, the dataset was treated as a mapped sample rather than a complete national inventory. The polygon area represents the recorded site boundary and not necessarily the area directly covered by photovoltaic panels.
The solar-site polygons were compared spatially with the six Annex I habitat types, GRAC grassland-loss areas and selected agricultural land-use layers. Bulgarian Cadastre Agency parcels associated with electricity production and Land Parcel Identification System (LPIS) physical blocks (campaign 2025) were used as additional contextual datasets [40]. Blocks coded as permanent grassland, pastures and meadows (usage code 040) and as bare and eroded terrain (code 700) were intersected with the site polygons. These administrative layers were not interpreted as ecological habitat maps.
All datasets were transformed to EPSG:3035 before area calculations, and overlapping features within each administrative layer were dissolved before intersection to prevent duplicate area estimates.
The solar overlays test spatial coincidence, not temporal sequence. The inventory records site boundaries mapped by 1 September 2026, whereas the GRAC change intervals end in 2024. A site can contain construction-related GRAC loss only if clearance occurred within 2018–2024 based on land classified as grassland at the start of the relevant period. Sites built before 2018 or after 2024 cannot register such loss, and a boundary mapped in 2026 may differ from the footprint at the time of construction. The intersection with GRAC loss was computed first for loss cells within the six-habitat mask (Section 2.3) and then, as an additional check, for all GRAC loss and gain cells in Bulgaria, including separately for each dated site (Section 2.6).
2.6. Baseline Land Cover and Construction-Date Screening
Land cover within the mapped solar-site boundaries was assessed using Dynamic World for a fixed baseline window from 1 May 2016 to 30 September 2018. For each pixel, the most frequent Dynamic World label among all observations in this window was taken as the baseline class. Unlike in the habitat screening (Section 2.4), the window was not restricted to April–October, so observations from the intervening winters were included. Class areas were summed for each site on the 10 m grid in EPSG:3035, and the dominant class of a site was the class with the largest area. Grassland and shrub-and-scrub were combined as grass/shrub cover, a broad land-cover group that is not equivalent to semi-natural grassland. Because the window is fixed, it describes baseline land cover within the 2026 boundaries rather than site-specific pre-construction land cover.
Because some solar parks were already present during the 2016–2018 baseline, the 50 sites of at least 20 ha were additionally screened for construction timing. Historical imagery (Sentinel-2 from 2015, Landsat 5/7/8 for earlier years and Google Earth historical imagery) was examined to identify the first year in which panels were clearly visible and the land cover in the preceding year. Panels installed after the summer are not visible in May–September composites, so the first year was also checked against August–December composites. OpenStreetMap start_date tags and published records were used where available: for five sites, the year was taken from start_date tags (four) or published records (one), and their images are consistent with the recorded years. Construction timing could be assigned to 17 sites (Section 3.6), although for PV698, the imagery established only that panels were present by 2016. At one site (PV700), a 35.44 ha extension built after the baseline was dated separately from the original array. The source of each assignment and the GRAC classes recorded within each dated site are listed in Table S2, and images of all 17 sites are shown in Figure S2. The first year with panels marks the completion of at least part of the array and does not necessarily coincide with the start of site clearance.
The dated sites were used to define two accounting scenarios for baseline grass/shrub cover. The lower scenario includes only the baseline grass/shrub area of the seven sites that first showed panels after the baseline and of the PV700 extension (560.62 ha). The upper scenario includes the total baseline grass/shrub area within all site boundaries (1627.09 ha) except that of the ten sites, or parts of sites, already present during the baseline (318.01 ha), giving 1309.08 ha, of which 748.46 ha lies in undated sites. Both values are conditional accounting scenarios. They are neither confidence limits nor bounds on the area actually converted during construction: the lower value is not a minimum converted area, because baseline vegetation may have changed before construction, and the upper value assumes that all undated sites were built after the baseline.
2.7. Spatial Aggregation and Mapping
For national visualisation, grassland-change results were aggregated to a regular 100 km2 hexagonal grid covering Bulgaria. Only hexagons intersecting the mapped habitat polygons were retained.
The maps of GRAC loss for each period show the loss area (ha) summed within each hexagon, using identical class breaks for both periods. The maps of unique 2018–2024 loss express it as a percentage of the mapped Annex I habitat area within the same hexagon.
All area calculations were performed in ETRS89-LAEA (EPSG:3035). Final maps were displayed in BGS2005/CCS2005 (EPSG:7801).
3. Results
3.1. Agricultural Land-Use Change, 2010–2025
Between 2010 and 2025, arable land increased from 62.6% to 75.7% of the utilised agricultural area (UAA), while permanent grassland declined from 33.7% to 21.4% (Figure 2a) [32,33]. Both the numerator and the denominator changed: arable land increased by 305,088 ha (from 3,162,526 to 3,467,614 ha), whereas the UAA decreased by 469,787 ha (from 5,051,866 to 4,582,079 ha). The published national estimate of permanent grassland fell from 1,701,990 to 981,651 ha, a difference of 720,339 ha (42.3%). It is a difference between two survey estimates of an agricultural land-use category and does not measure the area of semi-natural or Annex I habitat destroyed.
Figure 2.
Agricultural land use in Bulgaria according to the BANSIK surveys, 2010–2025. (a) Shares of arable land, permanent grassland and other UAA in 2010 and 2025; (b) annual national estimates of UAA, arable land and permanent grassland (codes 45–48), 2010–2025. Most of the decrease in permanent grassland occurred in two single years, 2012–2013 and 2024–2025 (shaded in panel (b)); the 2025 survey report attributes the latter to the control of more than two-thirds of the survey points [33]. Data sources: Ministry of Agriculture and Food (MAF), BANSIK 2010 (Report No. 165) [32], BANSIK 2014 (Report No. 276, Table 3, for 2011–2014) [34], BANSIK 2024 (Report No. 447, Table 3, for 2015) [35] and BANSIK 2025 (Report No. 465, Table 3, for 2016–2025) [33].
The intermediate national estimates show that this difference did not accumulate gradually (Figure 2b). Permanent grassland decreased by 54,997 ha between 2010 and 2012 and then by 265,944 ha (16.1%) between 2012 and 2013 alone. In that year, arable land increased by 167,432 ha, the UAA decreased by 127,872 ha and the total agricultural area, including uncultivated land, decreased by 222,413 ha [34]. The survey publications give no explanation for this one-year change, and we cannot attribute it either to physical conversion or to a change in the survey procedure. From 2013 to 2024, the estimate varied between 1,363,984 and 1,414,246 ha and ended 4424 ha higher than in 2013. Most of the 2010–2025 difference thus comes from two single-year decreases, of 265,944 ha in 2012–2013 and 403,822 ha in 2024–2025, which together account for 669,766 ha (93.0%). The decrease up to 2013 was accompanied by an increase of 299,591 ha in arable land, which is consistent with, but does not demonstrate, conversion to arable use. In 2025, by contrast, arable land decreased slightly (−11,271 ha) while UAA fell by 431,974 ha. The survey report attributes the decrease in permanent grassland to the control of more than two-thirds of the survey points and notes that it reduced UAA [33]. Code 47, grassed surfaces with low productive potential, accounted for 529,925 ha (73.6%) of the 2010–2025 difference (Table A4). This code covers low-productivity grassland that is never mown and is recorded only where it is regularly grazed [33], so points no longer meeting this criterion leave both permanent grassland and the UAA, irrespective of any change in vegetation. The 2024–2025 step is not comparable with the preceding annual series and cannot be read as one year of physical conversion.
Fallow land also declined, from 6.6% to 2.2% of arable land over the same period [32,33].
The combined area of wheat, sunflower and maize increased from 2.19 million ha in 2010 to 2.72 million ha in 2025, an increase of approximately 530,000 ha. Their combined share of arable land rose from 69.3% to 78.4% (Figure 3) [32,33]. The concurrent increase in these crops does not show that grassland was converted to them. Establishing such transitions would require spatially linked or point-level transition data.
Figure 3.
Composition of arable land in Bulgaria, 2010–2025, showing the relative contribution of wheat, sunflower, maize and other arable land. The combined share of the three dominant crops rose from 69.3% in 2010 to 78.4% in 2025. Data sources: MAF, BANSIK 2010 (Report No. 165); MAF, BANSIK 2025 (Report No. 465). Component shares are rounded to one decimal place, so the values shown may not sum exactly to the combined figure.
The shift was widespread across the country. Arable land increased as a share of the UAA in 26 of 28 NUTS-3 districts. The largest increases were recorded in Sofia City (+35.0 percentage points), Lovech (+26.8), Pernik (+23.6), Pazardzhik (+21.0) and Kyustendil (+19.1); only Smolyan (−6.2) and Kardzhali (−2.7) showed decreases [32,33]. Because these shares also depend on the district UAA, district-level changes in permanent grassland and the UAA are summarised together in Table 1.
Table 1.
Reported change in the permanent-grassland category (BANSIK codes 45–48) and in utilised agricultural area (UAA) by NUTS-3 district in Bulgaria, 2010–2025. Districts are ordered by the reported relative decrease in permanent grassland. Data sources: MAF, BANSIK 2010 (Report No. 165) [32], BANSIK 2024 (Report No. 447) [35] and BANSIK 2025 (Report No. 465) [33].
The UAA decreased in 24 of the 28 districts and was stable or increased in Razgrad, Vidin, Haskovo and Stara Zagora (Table 1). In 15 districts, the decrease in the UAA was at least 70% of the decrease in permanent grassland. In these districts, most of the grassland decrease was matched by a contraction of the recorded agricultural area, not by gains in arable land or other agricultural uses. Silistra illustrates this pattern: its permanent-grassland estimate fell from 17,834 to 694 ha (−17,140 ha; 96.1%), while its UAA fell by 16,766 ha. The 2024 report gives 18,070 ha for Silistra [35], so the whole decrease occurred between 2024 and 2025, when the district’s UAA fell by 19,328 ha and its arable land by only 1052 ha. The 96.1% decrease thus coincides with the 2025 control of survey points. It reflects a change in survey estimates and is no evidence that the district’s grassland was converted to arable land. The same one-year step occurred in most districts: between 2024 and 2025, the grassland estimate decreased in 27 of the 28 districts (it was unchanged in Yambol), and this decrease exceeded half of the 2010–2025 decrease in 16 districts (Table 1). District estimates rest on fewer survey points than national totals.
3.2. Officially Reported Extent and Conservation Status of the Six Habitat Types
Across Natura 2000 Standard Data Forms, the six selected habitat types accounted for 162,810.74 ha of reported cover in records with representativity classes A–C [27] (Table 2). Habitat 6210 was by far the most extensive, with 106,478.17 ha (65.4% of the total), followed by 62A0 (23,789.23 ha) and 6240* (14,389.65 ha).
Table 2.
Officially reported cover of the analysed Annex I grassland habitats within Bulgarian Natura 2000 sites.
Article 17 assessments for 2013–2018 indicated predominantly unfavourable conservation status across the biogeographic regions in which these habitats occur [30].
These values describe officially reported habitat cover within Natura 2000 sites and are separate from the mapped polygon areas used in the spatial analysis. Additional site-level and regional details are provided in Appendix A.
The reported SDF cover and mapped polygon area differ markedly for some habitat types (Table A3). The within-code mapped area exceeded SDF cover by factors of 7.35 for 6110*, 2.01 for 6430 and 1.63 for 6510 and by 1.12–1.26 for the other three types. The polygon attributes account for these differences. First, 3559 records are mosaic polygons in which the habitat occupies only a recorded share of the polygon. Weighting each record by this share reduces the summed record area of 6110* from 12,797.02 to 2139.29 ha (16.7%) and that of 6430 from 13,122.95 to 6528.06 ha (49.7%), but that of the other types by only 6–17% (summed record areas slightly exceed the dissolved areas in Table 3 because some records overlap). Second, records outside Natura 2000 sites account for 32.9% of the polygon area of 6510, against 3.6–6.8% for the other types. The weighted cover inside Natura 2000 sites was within 11% of the SDF value for every type (ratios 0.89–1.04), and the total weighted cover was within about 6% of the national Article 17 area (ratios 0.95–1.06). The differences thus arise mainly from mosaic mapping (6110*, 6430) and from occurrences outside the network (6510), while differences in date play, at most, a minor role. The GRAC percentages in Section 3.3 refer to whole mapped polygons, which, for 6110*, consist mostly of other components of the mosaics.
3.3. Grassland Change Within the Mapped Habitat Polygons, 2018–2024
Within-code dissolved areas of the six habitat types sum to 215,734.96 ha, whereas their unique spatial union is 198,095.77 ha (Table 3). The difference of 17,639.19 ha arises because a location attributed to more than one habitat type is counted in each corresponding row. Where three or more types coincide, this excess exceeds the overlapping area itself. Within the union, GRAC classified 1785.48 ha as grassland loss in 2018–2021 and 1039.40 ha in 2021–2024. No cell was classified as loss in both periods, so the spatially unique loss area for 2018–2024 was 2824.88 ha (1.43% of mapped habitat area), compared with 759.40 ha (0.38%) of unique gain (Table 3).
Reversible events were rare. Only 0.12 ha (three 20 m cells, in habitat 6210) was classified as loss in one period and gain in the other and so belongs to both unique sets. This leaves 2824.76 ha with loss events only, 759.28 ha with gain events only and 3584.16 ha with at least one change event. The unique loss area was 3.72 times the unique gain area, but the ratio compares the extent of change events and says nothing about the net change in grassland stock. A stock balance cannot be obtained by adding the two periods: within the habitat union, the grassland area of the common year 2021 was 135,140.96 ha at the end of the 2018–2021 product but 134,237.12 ha at the start of the 2021–2024 product, a difference of 903.84 ha.
Table 3.
Areas classified by Copernicus GRAC as grassland loss and grassland gain within mapped polygons of the six analysed Annex I habitat types in Bulgaria, 2018–2024.
Habitat 6210 contained the largest loss area (1657.40 ha), reflecting its much larger mapped extent. Proportionally, the strongest loss signal occurred in habitat 6510 (3.17%), followed by 6430 (2.02%); the other habitat types ranged from 0.86% to 1.42%. Figure 4 and Figure 5 show the distribution of these changes across Bulgaria.
Figure 4.
Spatial distribution of areas classified by Copernicus as grassland loss within the mapped polygons of the six analysed Annex I grassland habitat types in Bulgaria: (a) 2018–2021 (1785.48 ha); (b) 2021–2024 (1039.40 ha). Values represent loss area (ha) aggregated within 100 km2 hexagons. Data sources: Copernicus GRAC [20,21]; habitat mapping: Bulgarian Executive Environment Agency [25]; country boundaries: Eurostat GISCO, 2024. Both panels use identical class breaks, so the two periods are visually comparable. Map projection: BGS2005/CCS2005 (EPSG:7801); areas were computed in ETRS89-LAEA (EPSG:3035).
Figure 5.
Spatial distribution of the unique area classified by Copernicus as grassland loss across 2018–2024 within the mapped polygons of the six analysed Annex I grassland habitat types in Bulgaria. Values represent the unique loss area as a percentage of mapped habitat area within each 100 km2 hexagon; overlapping loss cells from the two periods were counted once. Data sources: Copernicus GRAC [20,21]; habitat mapping: Bulgarian Executive Environment Agency [25]; country boundaries: Eurostat GISCO, 2024. Map projection: BGS2005/CCS2005 (EPSG:7801); areas were computed in ETRS89-LAEA (EPSG:3035).
In the GRAC reference sample, 238 of the 250 locations received definite labels for 2018–2024 loss (Table S5). Of the area classified by GRAC as loss in either period, 37.4% (95% CI 26.6–48.9%) was grassland loss in the reference labels, corresponding to 1056.64 ha (751.24–1382.19 ha). Most of the remainder was grassland in all three reference years (an estimated 1153 ha) or arable land throughout (an estimated 462 ha, mostly among the 2018–2021 loss cells, of which 9 of 37 labelled locations were arable throughout). The user’s accuracy was 30.6% (16.7–47.2%) for 2018–2021 loss and 36.1% (22.2–52.8%) for 2021–2024 loss. For comparison, the product’s own validation reports a weighted user’s accuracy of 55.5% for 2018–2021 loss across the EU-27 [21]. Reference loss was mainly conversion to arable land: of the 37 locations with reference loss, 31 were arable after the change, four were bare or disturbed, one was built up and one was covered by solar panels.
Reference loss outside the mapped loss was estimated at 2474.25 ha (144.30–7018.16 ha), giving a total of 3530.89 ha (1039.94–8171.20 ha) and a producer’s accuracy of 29.9% (11.5–89.3%). This total is highly uncertain. About 2218 ha of it rests on a single location among the 59 labelled in the unchanged-grassland stratum. That cell was ploughed in 2020, carried grass-like cover again from 2021, and counts as loss only because the definition excludes recently tilled land. If such cells are treated as grassland, the omitted area is 256.41 ha (108.22–440.66 ha), the total is 1313.04 ha (963.54–1685.60 ha) and the producer’s accuracy is 80.5% (68.5–91.9%). The 2021–2024 estimates, which this location does not affect, were 450.06 ha of reference loss (268.34–643.68 ha) against 1039.40 ha mapped, with a producer’s accuracy of 83.4% (63.0–100.0%). The disagreement stratum contributed about 216 ha of the omitted loss (6 of 29 labelled locations), whereas none of the 27 labelled locations in the buffer stratum and none of the 30 in the unchanged non-grassland stratum showed reference loss. None of the 18 labelled locations in GRAC gain showed a transition to grassland (user’s accuracy 0%; Wilson 95% upper limit 17.6%): 11 were grassland and 4 non-grassland in all three years. The loss-to-gain ratio reported above therefore compares mapped events and does not describe reference change.
The reference labels agreed with EUCROPMAP at 86.4% of the 132 locations at which both sources gave grassland or arable land in 2018 and at 84.1% of the 126 such locations in 2022 (labels unchanged between 2021 and 2024). A further 28 locations in 2018 and 19 in 2022 labelled as grassland in the reference sample were classified by EUCROPMAP as woodland and shrubland (Table S5). Of the 16 locations labelled as converted to arable land in 2018–2021, EUCROPMAP classified 12 as cropland in 2022, and three of the other four show cereal cycles in their NDVI series. The fourth is the tilled location in the unchanged-grassland stratum described above, which EUCROPMAP classified as common wheat in 2018. Its grassland label for 2018 is therefore doubtful, a further reason to regard 1313.04 ha as the more robust estimate of total loss.
3.4. Complementary Screening of Persistent Land-Cover Change
Dynamic World provided complementary screening of persistent change between 2016–2018 and 2023–2025, based on a different product, temporal rules and the denominator from GRAC and limited to habitat polygons inside Natura 2000 sites. Candidate areas represented 0.224–0.822% of valid temporal coverage among the six habitat types, with the highest proportion in 6110* and the lowest in 6240* (Table 4). Applying WorldCover support reduced the candidate areas further, while the strongest-consensus subset ranged from 0.64 to 9.97 ha by habitat type.
Table 4.
Complementary multiyear Dynamic World screening of potential land-cover change within the analysed habitat polygons inside Natura 2000 sites.
Of the 70 interpreted reference locations, 60 received a definite final label and 10 were recorded as uncertain (Table S4). Overall agreement between mapped and reference change was 99.4% (95% CI 98.8–100.0%), which mainly reflects the rarity of change. The user’s accuracy of the candidate class was 22.8% (4.9–40.6%) and 12.5% (0.0–37.0%) for the strongest-consensus subset, and the producer’s accuracy was 19.1% (0.0–51.7%). The stratified estimate of reference change within valid coverage was 704 ha (95% CI 0–1824 ha), compared with 590 ha mapped as candidate (union of the six types). The second reading retained 7 of the 22 initial change labels. With the initial labels, the user’s and producer’s accuracies of the candidate class would have been 53.6% and 1.0% and the reference change about 30,300 ha (95% CI 0–61,000 ha). The higher user’s accuracy reflects the 11 change labels in the candidate strata that the second reading revised. The lower producer’s accuracy and the larger reference change arise mainly from three locations in the largest stratum that had first been labelled as change. Across the ten decision-rule variants, the candidate area of the six types ranged from 26 to 5330 ha (Table S3). Of the labelled locations, 10 fell in GRAC loss, and 4 of these were reference change. For this reference definition, the area-weighted user’s and producer’s accuracies of GRAC loss were 13.0% (0.0–34.1%) and 14.8% (0.0–41.2%) (Table S4). These values refer to the narrower definition; accuracy against the GRAC definition is given in Section 3.3.
3.5. Ground-Mounted Solar Development
The OpenStreetMap inventory contained 704 ground-mounted solar-site polygons covering 4675.13 ha. The median site area was 1.25 ha: 538 sites were smaller than 5 ha, while 17 sites larger than 50 ha accounted for 1877.40 ha, or 40.2% of the mapped total. Solar-site boundaries overlapped 78.98 ha of the six mapped Annex I habitat types (1.69% of site area). Almost half of this overlap (37.87 ha of types 6210 and 6510) lies within one site, the Kazanlak solar farm (PV700), including 20.16 ha in a 35.44 ha extension built in 2019–2020 on land classified as grassland in the 2016–2018 baseline (Table S2). Within the habitat mask, GRAC classified 0.96 ha inside site boundaries as grassland loss, all within this site (0.28 ha in 2018–2021 and 0.68 ha in 2021–2024; Figure 6). Without the habitat mask, GRAC classified 359.04 ha within the site boundaries as grassland loss (174.52 ha in 2018–2021 and 184.52 ha in 2021–2024; 7.68% of site area) and 57.92 ha as gain. Of the seven dated sites that first showed panels in 2022–2024, only three (PV018, PV272 and PV301; 88.08 ha in total) contained GRAC loss for 2021–2024. The other four contained none; at Verila (PV575), 107.48 ha remained classified as unchanged grassland. Nor did GRAC record any 2018–2021 loss in the PV700 extension, where 22.64 ha remained classified as unchanged grassland in both periods. At Karadzhalovo (PV005), by contrast, where panels had been present since 2012, GRAC recorded 56.56 ha of 2021–2024 loss (Table S2). LPIS blocks coded as permanent grassland, and pastures and meadows overlapped with 60.88 ha of the site area, with blocks coded as bare and eroded terrain of 0.30 ha. The broader cadastral category for electricity production covered 17,042.83 ha and is reported only for context because it includes non-solar uses.
Figure 6.
Recorded ground-mounted solar-plant sites in relation to GRAC-classified grassland loss within mapped polygons of six Annex I habitat types. Site boundaries are represented by circles proportional to the polygon area (ha); hexagon colours show unique 2018–2024 GRAC loss as a percentage of the mapped habitat area in each 100 km2 hexagon. A circle and a coloured hexagon can co-occur without polygon intersection; within the habitat mask, GRAC loss cells intersected a recorded site boundary at one site only (PV700; 0.96 ha). The OpenStreetMap (OSM) polygons represent mapped plant-site boundaries, not panel-covered surface. Data sources are detailed in Section 2.5. Map projection: BGS2005/CCS2005 (EPSG:7801); areas calculated in ETRS89-LAEA (EPSG:3035).
3.6. Fixed-Window Baseline Land Cover at Recorded Solar Sites
Within the 4674.79 ha resolved on the Dynamic World grid, cropland was the largest baseline class (1915.04 ha; 40.97%). Shrubland accounted for 822.68 ha (17.60%) and grassland for 804.41 ha (17.21%), giving a combined grassland/shrubland baseline of 1627.09 ha (34.81%) (Table 5; Figure 7). Trees covered 15.28% and built land 8.40%.
Table 5.
Land-cover composition within current mapped solar-site boundaries in the 2016–2018 Dynamic World fixed baseline.
Figure 7.
Recorded ground-mounted solar-plant sites in Bulgaria by dominant Dynamic World land-cover class in the 2016–2018 fixed baseline. (a) National distribution; symbol colour indicates the dominant class and symbol area is proportional to mapped site area. (b) Highest-density cluster near Sliven. (c) Largest mapped site boundary, Apriltsi Solar Park (PV018), based on imagery acquired before construction. (d) GRAC classes at the same extent as (c); cells outside the site are shown lighter. (e) The same extent in 2024; the dashed yellow line marks the approximate extent of panels beyond the mapped boundary. OSM polygons represent recorded plant-site boundaries rather than the panel-covered surface. Country boundaries are from Eurostat GISCO (2024), the imagery in (a–c) is from Esri World Imagery (source: Esri, Vantor, Earthstar Geographics, and the GIS User Community) and the imagery in (e) is from Google (© 2024 Google). Areas were calculated in ETRS89-LAEA (EPSG:3035).
Built land was the dominant baseline class at 250 sites, most of which were small (median 0.36 ha). Excluding these sites increased the grassland/shrubland share only modestly, from 34.81% to 36.72%, so this group does not drive the overall baseline pattern.
Construction timing was established for 17 of the 50 sites at least 20 ha in size (Table 6; evidence in Table S2 and Figure S2). Seven first showed panels after the 2016–2018 baseline and contained 526.91 ha of baseline grassland/shrubland. Ten were already present during the baseline, and their arrays at that time contained 318.01 ha. At one of them, the Kazanlak solar farm (PV700), a 35.44 ha extension with a further 33.71 ha of baseline grassland/shrubland was built in 2019–2020.
Table 6.
Construction timing for the seventeen dated sites, ordered by contribution to the grass/shrub baseline area.
Combining these dates with the fixed baseline gives two accounting scenarios: 560.62 ha of baseline grass/shrub cover at the seven post-baseline sites and the PV700 extension, and 1309.08 ha when only the sites, or parts of sites, already present during the baseline are excluded (1627.09–318.01 ha), equivalent to 11.99–28.00% of the mapped solar-site area. Of the latter, 748.46 ha lies in undated sites. The range depends on the site-date assignments in Table 6 and is conditional in three ways. Most sites have no construction date, land cover may have changed between the baseline and installation and baseline grass/shrub cover within current site boundaries is not the same as the area actually converted during construction.
The Apriltsi plant (PV018), the largest mapped site, shows how these measures relate at a single location (Figure 7c–e). In the 2016–2018 baseline, its 621.76 ha boundary contained 219.16 ha of trees, 192.94 ha of cropland, 122.66 ha of shrubland and 86.82 ha of grassland, and it did not overlap the mapped polygons of the six Annex I habitat types. Google Earth historical imagery from April 2016 and July 2018 shows open grassland with scattered shrubs and gullies in the western part of the site and woodland over much of the eastern part (Figure 8a,b). By June 2020, most of the western part had been tilled (Figure 8c). GRAC classified 139.56 ha of the site as grassland loss in 2018–2021, mostly in the western part; this is 80% of the 174.52 ha classified as 2018–2021 loss within all site boundaries (Section 3.5). A further 43.56 ha was classified as loss in 2021–2024. By March 2024, panel rows covered almost the whole boundary, including the formerly wooded eastern part, and extended beyond it to the east (Figure 7e and Figure 8d). GRAC nevertheless classified 106.56 ha within the boundary as unchanged grassland in both periods.
Figure 8.
Google Earth historical imagery of the Apriltsi site (PV018): (a) 28 April 2016; (b) 14 July 2018; (c) 27 June 2020; (d) 8 March 2024. The western part of the site was open grassland in 2016 and 2018 and had been tilled by June 2020; by March 2024, panel rows covered almost the whole site.
Only 420.46 ha (9.0%) of the mapped site area was classified as built in the 2023–2025 Dynamic World composite; at a 10 m resolution, the built class does not capture ground-mounted photovoltaic arrays consistently.
3.7. Illustrative Site Observations
Field observations near Verinsko documented substantial site disturbance during solar construction in 2024, including the removal of woody vegetation, uprooting of stumps and disturbance of the upper soil layer (Figure 9). By 2026, large areas remained sparsely vegetated and were dominated by annual ruderal species, including the invasive Erigeron canadensis L. The site was wooded rather than one of the six grassland habitat types analysed above, so it is presented only as an example of local construction disturbance.
Figure 9.
Photographic record of site clearance and subsequent solar development near Verinsko, Bulgaria. Upper views: cleared woody vegetation, uprooted stumps and exposed soil. Lower view: the site after panel installation. The sequence illustrates local disturbance; it does not quantify habitat area, vegetation cover or species composition.
An informal account from the owner of a separate solar farm also identified vegetation management as a practical concern, with herbicides and ground-cover materials mentioned as possible alternatives to repeated mowing. These practices were not independently verified and are included only as an indication of potential management pressure. Such practices are relevant because both the panels and the management of the ground layer influence plant biomass, species diversity and the recovery of grassland vegetation beneath and between arrays [16,17].
4. Discussion
4.1. Agricultural Grassland Change, Mapped Habitat Change and the Cost of Further Conversion
The agricultural statistics and the satellite products describe different quantities. The BANSIK estimate of permanent grassland was 720,339 ha lower in 2025 than in 2010 [32,33], but 93% of this difference arose in two single years: 56% between 2024 and 2025, after the control of survey points, and 37% between 2012 and 2013, when arable land increased and the UAA decreased (Section 3.1). The endpoint difference mixes changes in land use with changes in how land was recorded, and it cannot be equated with the destruction of the semi-natural habitat. GRAC, in contrast, classified 2824.88 ha of unique loss events within 198,095.77 ha of mapped Annex I habitat during 2018–2024. The reference sample confirmed 1056.64 ha of this as grassland loss and put total grassland loss at 1313–3531 ha, depending on the classification of a single recently tilled reference location (Section 3.3). Of the 37 reference-loss locations, 31 were arable land after the change and one was covered by solar panels, so conversion to arable land was the most frequent transition among the reference-loss locations. Neither quantity shows how much solar construction contributed. They do show that new land-intensive development occurs in a landscape where the recorded agricultural grassland area has contracted and where Article 17 assessments report a predominantly unfavourable conservation status for the analysed habitat types (Table 2).
The choice of habitat denominator also affects interpretation. For 6110* and, to a lesser extent, 6430, much of the mapped polygon area consists of other components of mosaic polygons (Section 3.2; Table A3). GRAC loss within these polygons may refer to vegetation other than the target habitat. Percentages based on whole polygons, such as the 1.19% unique loss for 6110*, are relative signals within the mapped reference rather than proportions of the habitat’s extent. Re-expressing them relative to SDF cover would be invalid: GRAC was intersected with whole polygons, and the position of the habitat within a mosaic polygon is not mapped. For the same reason, neither area should be rescaled to match the other.
The GRAC loss signal was uneven among habitat types. Habitat 6510 had the highest proportion classified as loss (3.17%), followed by 6430 (2.02%), whereas 6210 had the largest area classified as loss (1657.40 ha) because of its wider mapped extent. Hay meadows and tall-herb fringes can occur as small or narrow patches within agricultural mosaics, but they can also be confused with crops or wooded margins at 20 m resolution. Part of the apparent contrast among habitat types may therefore reflect classification and boundary effects rather than differences in the ecological process.
Changes in crop composition and pesticide use provide broader agricultural context but were not used to attribute individual GRAC cells. Wheat, sunflower and maize accounted for 78.4% of arable land in 2025, and the retention of margins, fallows and remnant grassland is relevant to biodiversity in such landscapes [1,41]. Pesticides can also affect uncultivated vegetation and associated pollinating fauna [42,43,44].
The decline of semi-natural grasslands is widely recognised as a primary driver of ecosystem degradation in Europe, but its local consequences for plant diversity are still under scientific and institutional evaluation [1]. In Bulgaria, site-specific conservation objectives for the Natura 2000 network are being determined, with habitat degradation quantified, under a large national project co-funded by the European Union [45]. The broad trend of grassland loss is clear; the thresholds at which the species richness and community structure respond to land-use change in individual protected sites are not, and identifying them will require continuous monitoring and better baseline data. Published studies have nevertheless documented vegetation change, degradation and the loss of plant diversity in Bulgarian grasslands over the last decade [46,47,48,49].
The land-cover change signals mapped here occur in a context in which negative effects on pollinators have been documented in Bulgaria. In grassland habitats near agricultural fields in the Ihtimanska Sredna Gora Mts. (W Bulgaria), wild bees visited flowers at low rates, a result that argues for permanent monitoring near agricultural areas [50]. In SE Dobrudja (NE Bulgaria), pollinator visitation to Lavandula angustifolia was several times lower at the agrarian study sites than at an ornamental site bordering Natura 2000 Pannonic sand steppes (6260*) [51]. A decline of bumblebees has also been documented in habitats not directly affected by grassland loss. Comparing bumblebee visits to Gentiana asclepiadea and its fruit and seed set between 1990–1994 and 2017–2020, Kozuharova and Simeonov [52] showed that pollination effectiveness has declined even in protected mountain habitats in Vitosha Mts. (SW Bulgaria). In German protected areas, Hallmann et al. [53] recorded a 76% decline in flying-insect biomass between 1989 and 2016. Testing whether the land-cover changes mapped here contribute to such trends would require pollinator observations matched to the mapped locations.
4.2. Ecological Impacts Documented at Solar Sites
Ground-mounted photovoltaic arrays alter light, soil moisture, temperature and vegetation management [16,54]. These changes can reduce habitat quality even where vegetation persists beneath panels and a satellite classifier still records grass or shrub cover. In a twelve-month study at a UK solar park on species-rich grassland, Armstrong et al. [16] found lower above-ground plant biomass and plant diversity under arrays, together with summer cooling and drying relative to gaps and control areas.
Restoration experiments show why retaining some vegetation after construction cannot be equated with conserving the original grassland. In a four-year experiment in a solar park in south-eastern France, Lambert et al. [17] found that panels reduced plant species richness and hindered succession towards a Mediterranean dry-grassland reference community. Survival of the target grass Brachypodium retusum was approximately halved under panels, so the installation itself can limit restoration after construction. For Bulgaria’s dry and calcareous grasslands, the lesson is to avoid clearance instead of assuming that later revegetation will restore the original community.
Effects also extend to the use of sites by mobile fauna. At 19 paired solar developments and control fields in south-west England, Tinsley et al. [18] found lower activity in six of eight bat species or species groups analysed, although overall bat species richness did not differ. In France, Barré et al. [19] compared 16 pairs of sampling locations across nine solar farms and found faster, straighter flights and an 18–39% lower probability of prey-capture attempts for affected taxa or guilds. These studies indicate reduced habitat use or feeding quality, although not equivalent population declines. A grassland-cover map alone would not detect such functional changes.
Positive findings require an equally careful interpretation. Walston et al. [55] documented insect-community gains following native habitat establishment at two Minnesota solar facilities on former row-crop land, while Blaydes et al. [56] linked several pollinator responses to floral resources and surrounding landscape conditions. These findings support specific habitat-management measures, not an intrinsic biodiversity benefit of panels. Jarčuška et al. [57] found higher bird diversity at Slovak solar parks in comparisons that included both arable land and grassland. In a published comment, Valera et al. [58] questioned the causal inference and its wider generalisation. Higher richness of one taxonomic group does not demonstrate retention of the original plant community, specialist fauna or ecosystem functions. Habitat-enhancing approaches [59,60] should be assessed against the site’s actual pre-construction condition, and cannot be presumed to compensate for clearance of species-rich grassland [17].
Renewable energy is needed for climate mitigation, but ground-mounted solar parks placed on species-rich grasslands or other semi-natural ecosystems can create land-use conflicts. Their local environmental impact depends on siting: already degraded or sealed land, such as quarries, mines and parking areas, is preferable to grasslands and forests. It also depends on the engineering methods and panel layout and on how soil and vegetation are managed during operation.
For ground-mounted panels installed in natural, semi-natural or species-rich habitats, reviews, systematic maps and case studies point more strongly to negative than to positive impacts on biodiversity [61,62,63,64,65].
4.3. What the Bulgarian Evidence Establishes and What It Leaves Unresolved
Bulgarian field evidence is limited, but it is not absent. Klimentova-Nikolova et al. [66] reported local measurements of the microclimate, soils and invertebrates. They found that installing photovoltaic plants on agricultural land significantly altered the soil, microclimate and biodiversity through habitat fragmentation, shading and wildlife disruption; their data are meant to inform regulatory decisions and investment proposals. More recently, Popov et al. [67] compared fixed and tracking panels within one power plant. Invertebrate abundance and taxon counts were higher in the control area during May–September but higher beneath panels in the colder months, and fixed panels had more pronounced negative effects than tracking panels. Such season- and design-dependent results strengthen the case for ecological assessments. Neither study, however, is a nationally representative, long-term before–after–control–impact assessment of the newly developed large parks, and neither establishes the consequences of replacing Bulgaria’s different semi-natural grassland communities.
The spatial overlays show why limited mapped overlap cannot establish that solar development has avoided ecologically valuable grassland. The recorded sites intersected 78.98 ha of the six mapped Annex I habitat types. This included 20.16 ha mapped as 6210 and 6510 within the 35.44 ha extension of the Kazanlak solar farm (PV700), built in 2019–2020. GRAC classified only 0.68 ha of this habitat overlap as loss and only in 2021–2024, after construction. Across all site boundaries, GRAC recorded 359.04 ha of loss, but only three of the seven dated sites first showing panels in 2022–2024 contained loss in the corresponding GRAC period. At Verila, 107.48 ha remained classified as unchanged grassland despite panel installation (Table S2). Vegetation persisting or regrowing beneath and between panels may partly explain these results, but a grassland classification does not establish that the original community has survived. The habitat layer also represents only six selected types. The fixed baseline classified 34.81% of present site area as grassland or shrubland, and construction-date screening gave conditional scenarios of 560.62–1309.08 ha of potential conversion. These figures require historical and ecological verification: some arrays were already present during the baseline, most sites remain undated and vegetation may have changed before construction.
The administrative overlays should not be treated as ecological validation. LPIS blocks coded as permanent grassland, pastures and meadows intersected 60.88 ha of mapped site area, and blocks coded as bare and eroded terrain intersected 0.30 ha. These figures show limited correspondence with the two administrative categories, while the satellite baseline classified 11.26 ha as bare ground and 1915.04 ha as cropland. They cannot tell whether the remaining land was degraded, productive or semi-natural or why the sites were placed where they are. Nor can a land parcel’s administrative designation or low agricultural productivity substitute for an assessment of its biodiversity value. The administrative treatment of low-productivity pastures creates a further vulnerability. Grassed surfaces with low productive potential (BANSIK code 47), which accounted for 73.6% of the reported decrease in permanent grassland between 2010 and 2025, are recorded only where they are regularly grazed [33]. About 500,000 ha of pasture reported in national agricultural statistics were not included in the LPIS [8]. When grazing ceases, such land leaves the agricultural statistics irrespective of any change in its vegetation (Section 3.1). At the same time, photovoltaic plants in Bulgaria are being planned and built on agricultural land and pastures and even within Natura 2000 sites [66], and investment has concentrated on agricultural, forest and hunting land in the absence of a clear national strategy [54]. Abandoned pastures are therefore likely to be particularly exposed to such projects. Once they have left the agricultural records, nothing in their administrative status shows whether they still support species-rich dry grassland or vegetation that could be restored, including when they are proposed for electricity production (cadastral code 1700).
The Verinsko photographs (Section 3.7) illustrate why construction and maintenance must be considered alongside site boundaries. Clearance and soil disturbance can remove the pre-existing community, while suppression of the ground layer could prevent recovery. The photographs document one wooded site, and the management account is anecdotal; neither quantifies grassland loss or establishes a general practice among Bulgarian operators. These observations identify construction disturbances and vegetation suppression as priorities for independent assessment. They also point to a limitation of satellite monitoring. Because parts of Verila and the PV700 extension remained classified by GRAC as unchanged grassland after construction (Section 3.5), a park in which the topsoil has been disturbed and the original sward replaced by ruderal vegetation could also remain classified as grassland. Such classes cannot show whether the ground layer has retained its species composition and ecological functions, which have been shown to change beneath panels [16,17,64,66], and they cannot replace field inspections of construction and vegetation management.
4.4. Siting Priorities and Independent Ecological Scrutiny
The principal planning implication is to avoid the conversion of species-rich semi-natural grasslands and other ecologically valuable habitats, including valuable areas outside the mapped Annex I polygons. Rooftops, built surfaces, brownfields and already artificialised land should receive priority, subject to technical feasibility and ecological assessment; their available energy capacity was not estimated here. Screening should assess the full development footprint and cumulative effects of neighbouring parks, roads, fencing and grid connections. Because 40.2% of recorded site area lies in just 17 parks larger than 50 ha, large projects account for a substantial share of the total development footprint, although our data do not establish a relationship between the park size and impact. Climate-mitigation benefits alone do not make a particular site ecologically acceptable. Three further points are relevant to permitting. First, 538 of the 704 recorded sites are smaller than 5 ha, and some form dense clusters, such as the 102 sites near Sliven (Figure 7b). Our data do not show that projects were split, but where adjacent small projects are screened separately, the cumulative effects of habitat loss, fencing and landscape fragmentation may be underestimated. In a Natura 2000 area in Greece, small solar parks increased landscape fragmentation, with a significant cumulative impact [62], and such clusters should therefore be considered together in environmental impact assessments and in appropriate assessments under the Habitats Directive [26,62]. Second, the PV700 extension was built on 20.16 ha, mapped as habitats 6210 and 6510, so mapped habitat polygons did not, by themselves, prevent development; the site-specific conservation objectives now being determined for the Natura 2000 network [45] could give such decisions a clearer basis. Third, the 2023 provisions that allowed agrivoltaic installations without a change in land designation, under conditions left to a ministerial ordinance [14], opened a route by which permanent pastures could have been covered with panels without the usual procedure. The Constitutional Court declared these provisions unconstitutional in 2025, holding that such development should not come at the expense of agricultural land [15]. The ruling protects agricultural land as a resource. Any future rules for agrivoltaics should also protect the vegetation of permanent pastures through binding limits on panel density and shading and the retention of native grassland flora, so that nominal agrivoltaic projects cannot again become a route for converting such pastures [16,17,59].
Permitting and funding criteria should require baseline surveys before clearance, independent researcher access, suitable control sites and regular, long-term monitoring during construction and operation. Monitoring should cover the plant-community composition, soils and relevant fauna, with publicly accessible methods and results. Without these provisions, adverse effects may remain undetected and persist without corrective action. Approval conditions should therefore specify how ecological deterioration will be assessed and what action will follow. The limited evidence on the magnitude of local impacts does not justify treating unmeasured effects as absent.
Construction methods and vegetation management also require enforceable conditions. Klimentova-Nikolova et al. [66] identify vegetation clearance, pesticide application and fire risk among the concerns associated with photovoltaic development, while Popov et al. [67] show that ecological responses also depend on the panel design. Repeated herbicide use could suppress native vegetation and its recovery, while other pesticides may affect pollinators and non-target organisms [41,43,44]. The frequency and extent of these practices in Bulgarian solar parks were not established here and should be included in independent monitoring. Approval conditions for installations on agricultural or semi-natural land should exclude topsoil stripping and large-scale grading and prohibit herbicide use and the replacement of vegetated ground with synthetic coverings or gravel. The routine use of other pesticides should also be prohibited. Management should be adapted to the existing vegetation and conservation objectives, using extensive grazing or rotational mowing where appropriate, with timing that allows native plants to flower and set seed [3,4,16,17,50,56]. Native seed mixtures may assist recovery on disturbed ground, but should not replace the retention of existing species-rich vegetation.
4.5. Limits of Spatial Inference
The spatial analysis has five main limitations. First, GRAC is a 20 m general grassland product and may be less precise in small or heterogeneous habitat patches [20,21]. In this study, it registered construction at only three of seven sites built in 2022–2024 and recorded little loss in a site extension built in 2019–2020, and the reference sample confirmed only 37% of its loss area and none of its sampled gain within the habitat union (Section 3.3). Second, the OSM site inventory may be incomplete, its polygons represent mapped site boundaries rather than panel surface and most records lack reliable construction dates. Third, the small area of GRAC loss within the solar–habitat overlap cannot establish a temporal sequence or causation, particularly because the 2026 inventory extends beyond the 2024 GRAC endpoint. Fourth, the habitat mask combines records of different dates, mostly from 2012, includes mosaic polygons in which the habitat occupies only part of the area and may include polygons in which the habitat had already changed before 2018. According to the GRAC reference sample, an estimated 4.6% of the union (95% CI 0.6–8.6%) was already arable in 2018. Fifth, the datasets differ in purpose, date and denominator; their results should be compared qualitatively rather than combined into a single impact estimate.
The fixed 2016–2018 baseline partly addresses missing construction dates but is not site-specific. Ten of the seventeen dated large contributors already existed, at least in part, during the window, and 748.46 ha of the grass/shrub baseline contribution remained undated after screening. For post-baseline sites, land cover may also have changed during the interval before panels first became visible. A per-site annual series linked to independently verified construction dates would materially narrow the uncertainty.
Classifier accuracy imposes an additional constraint. In an independent global validation of three recent 10 m land-cover products, Xu et al. [68] reported overall accuracies of 73.4–83.8%, with WorldCover performing best and Dynamic World second; accuracy varied by class, country and landscape heterogeneity. For the change within the habitat polygons, our reference sample shows that the constraint is severe. Fewer than one in four Dynamic World candidates was confirmed as conversion (user’s accuracy 23%), most of the estimated reference change was not mapped (producer’s accuracy 19%) and the candidate area varied from 26 to 5330 ha across the decision-rule variants (Section 3.4; Tables S3 and S4). Agreement between products did not single out more reliable candidates. The user’s accuracy was 16.4% for WorldCover-supported candidates and 12.5% for the strongest-consensus subset (Table S4), so agreement between Dynamic World, WorldCover and GRAC is no substitute for reference data. The estimated area of reference change (704 ha) was close to the mapped candidate area only because omission and commission errors offset. About 81% of that estimate rests on a single change label in stratum 2. Its confidence interval understates the uncertainty: none of the 18 locations in stratum 1, which covers 96% of the area, kept a change label after the second reading (Wilson 95% interval for that stratum 0.0–17.6%). The accuracy and area estimates also depend strongly on the second reading of the change labels (Section 3.4). The screening therefore neither locates conversions reliably nor constrains their total area.
The dedicated GRAC sample gives a firmer basis for the GRAC areas, but it has limits of its own. Its labels come from a single blinded reading of 10 m Sentinel-2 composites and NDVI series, without very-high-resolution imagery or field verification. Their 84–86% agreement with EUCROPMAP for grassland versus arable land is in agreement with another map, not with field data. Because the NDVI series begins in 2017, earlier tillage, which the definition would also exclude from grassland in 2018, could not be detected. Finally, the omitted loss, and with it the total, depends on a few locations in the large unchanged strata, as the effect of a single location on the estimated total shows (Section 3.3). The GRAC loss areas in Table 3 should therefore be read together with the reference estimates: about 37% of the mapped loss was confirmed, and total loss was 1313–3531 ha, with the lower value more robust (Section 3.3). For the Dynamic World sample, initial labels were made from medium- and high-resolution imagery, the change labels were re-read blind from NDVI series only, and there was no field verification. All areas are reported to two decimal places for computational traceability rather than as a claim of the equivalent ground-measurement accuracy.
5. Conclusions
The results identify pressures on Bulgaria’s grasslands, but also show why agricultural statistics, land-cover classifications and habitat loss must be distinguished. The recorded permanent grassland area was 720,339 ha lower in 2025 than in 2010, although most of this difference arose in two annual changes and cannot be equated with the destruction of semi-natural habitat. Within the six mapped Annex I habitat types, the reference assessment confirmed 1056.64 ha of GRAC-classified grassland loss, with conversion to arable land the most frequent transition among reference-loss locations. Estimates of total grassland loss remained sensitive to the classification of a single reference location.
The 704 recorded solar sites occupied 4675.13 ha and overlapped 78.98 ha of the selected habitat polygons. This limited overlap does not establish ecological safety. At Kazanlak, 20.16 ha of a solar-farm extension built in 2019–2020 lay within mapped Annex I grassland, yet GRAC classified only 0.68 ha as loss. Only three of the seven dated sites first showing panels in 2022–2024 contained GRAC loss in the corresponding period. Construction-date screening associated 560.62–1309.08 ha of baseline grass or shrub cover with conditional scenarios of potential conversion. These figures indicate areas requiring verification, rather than measured habitat or biodiversity loss.
Published field studies show that ecological effects can extend beyond changes detectable in land-cover maps. Without regular, long-term monitoring, deterioration in plant communities and habitat use by fauna may remain undetected and continue without corrective action. Repeated pesticide use, where practised, could add to these pressures and undermine efforts to retain native vegetation and pollinators. Solar development should also be assessed alongside conversion to arable land, because both can reduce and fragment the remaining grassland habitats.
The further conversion of species-rich grasslands should be avoided, with solar development directed towards suitable, already artificialised land. Low agronomic value and the absence of grazing do not establish low ecological value. Approval conditions should require ecological surveys before clearance, independent access, transparent monitoring and corrective action and should prohibit topsoil stripping, herbicide use and the routine use of other pesticides. Neighbouring projects should be assessed for their cumulative effects, and agrivoltaic rules should protect native grassland vegetation, as well as agricultural use. Habitat-friendly management may reduce some impacts, but cannot be assumed to replace the ecological value of a cleared grassland. The spatial framework presented here is intended to inform site selection before construction, when avoidable conversion can still be prevented.
Supplementary Materials
The following supporting information can be downloaded at: https://www.mdpi.com/article/10.3390/land15112034/s1, Table S1: GRAC input tiles, identifiers, versions and checksums; Table S2: Construction-date evidence and GRAC classes for the 17 dated solar sites; Table S3: Sensitivity of the Dynamic World screening to the decision rules; Table S4: Reference sample, stratum areas and accuracy estimates for the Dynamic World screening and the GRAC loss class; Table S5: Strata, labels and accuracy and area estimates of the GRAC reference sample, and their comparison with EUCROPMAP; Figure S1: Examples of reference interpretation for the Dynamic World screening; Figure S2: Satellite images documenting the construction dates of the 17 dated solar sites; File S1: Solar-site polygons (PV001–PV704) derived from OpenStreetMap (© OpenStreetMap contributors, ODbL); File S2: Google Earth Engine and Python 3.x scripts for the Dynamic World habitat screening, the reference sample and interpretation tool, the sensitivity analysis, the accuracy estimation and GRAC check, the GRAC reference sample, its evidence and the EUCROPMAP comparison, the construction-date images (Figure S2) and the solar-site baseline, together with the Overpass query for the solar-site extraction, the criteria, input and output of the blinded second reading and the protocol, NDVI input and labels of the GRAC interpretation.
Author Contributions
Conceptualisation, M.T., G.S. and E.K.; methodology, M.T.; software, M.T.; validation, M.T., G.S. and E.K.; formal analysis, M.T.; investigation, M.T.; resources, M.T. and E.K.; data curation, M.T.; writing—original draft preparation, M.T.; writing—review and editing, G.S. and E.K.; visualisation, M.T.; supervision, G.S. and E.K.; project administration, E.K. All authors have read and agreed to the published version of the manuscript.
Funding
This research received no external funding.
Institutional Review Board Statement
Not applicable.
Informed Consent Statement
Not applicable.
Data Availability Statement
The Copernicus Grassland Change products, ESA WorldCover, Dynamic World and Eurostat GISCO boundaries are publicly available from the sources cited in Section 2; the GRAC tiles used are listed in Table S1, and the reference samples and sensitivity results are provided in Tables S3–S5; coordinates of the reference locations are available from the corresponding author on reasonable request. National Annex I habitat mapping was provided by the Bulgarian Executive Environment Agency and used under its access conditions. The solar-site polygons are provided in File S1, which is derived from OpenStreetMap data (© OpenStreetMap contributors) and is available under the Open Database License (ODbL 1.0); the Google Earth Engine and Python scripts, the Overpass query that reproduces the OpenStreetMap extraction and the criteria, input and output of the second reading and the protocol, NDVI input and labels of the GRAC interpretation are provided in File S2. Derived tables, the construction-date worksheet and the 100 km2 hexagon layer are available from the corresponding author on reasonable request. The solar baseline (Table 5; Figure 7) used Dynamic World V1 through Google Earth Engine and the OpenStreetMap site polygons in File S1. LPIS files were PHYSICAL_BLOCKS_23012025_BG.shp (campaign 2025) and Physical_blocks_14032025_BG.shp (campaign 2024). Cadastral code 1700 parcels were exported on 10 December 2024. Source URLs and access information are given in the cited references and Section 2.
Acknowledgments
During the preparation of this study, the authors used Claude (Anthropic) to help write the Google Earth Engine code and, in a browser session, to present the evidence for the visual interpretation and to record the interpreter’s labels and notes. The authors have reviewed and edited the output and take full responsibility for the content of this publication.
Conflicts of Interest
The authors declare no conflicts of interest.
Appendix A. Detailed Habitat Reference Tables
Table A1 and Table A2 retain the detailed Natura 2000 site rankings and Article 17 regional assessments used to contextualise the spatial analysis. Table A3 compares SDF cover, national Article 17 area and mapped polygon area for each habitat type.
Table A1.
Five Bulgarian Natura 2000 sites with the largest officially reported cover for each analysed habitat type.
Table A2.
Bulgarian Article 17 habitat assessments by biogeographical region for the 2013–2018 reporting period.
Table A3.
Reported SDF cover, national Article 17 habitat area (2013–2018), mapped polygon area and mosaic-weighted habitat cover for the six analysed habitat types.
Appendix B. BANSIK Categories and National Estimates
Table A4 documents the correspondence between the BANSIK categories used in Section 3.1 and the nomenclature codes reported in the 2010 and 2025 surveys.
Table A4.
BANSIK land-use categories, nomenclature codes and national estimates used in the comparison of 2010 and 2025.
References
- Tscharntke, T.; Klein, A.M.; Kruess, A.; Steffan-Dewenter, I.; Thies, C. Landscape perspectives on agricultural intensification and biodiversity—Ecosystem service management. Ecol. Lett. 2005, 8, 857–874. [Google Scholar] [CrossRef] [Scilit]
- Jeanneret, P.; Lüscher, G.; Schneider, M.K.; Pointereau, P.; Arndorfer, M.; Bailey, D.; Balázs, K.; Báldi, A.; Choisis, J.-P.; Dennis, P.; et al. An increase in food production in Europe could dramatically affect farmland biodiversity. Commun. Earth Environ. 2021, 2, 183. [Google Scholar] [CrossRef] [Scilit]
- Glinos, E.; Condat, E.; Mulieri, P.; Ashworth, L. Essential dependence on wild pollination service: A medicinal plant under threat Minthostachys verticillata (Lamiaceae). Arthropod-Plant Interact. 2019, 13, 865–874. [Google Scholar] [CrossRef] [Scilit]
- Kozuharova, E.; Aneva, I.; Goulson, D. Bees and medicinal plants—Prospective for entomovectoring. In Integrative Biological Control: Ecostacking for Enhanced Ecosystem Services; Progress in Biological Control; Gao, Y., Hokkanen, H.M.T., Menzler-Hokkanen, I., Eds.; Springer: Cham, Switzerland, 2020; Volume 20, pp. 231–248. [Google Scholar] [CrossRef] [Scilit]
- Camina, J.L.; Usseglio, V.; Marquez, V.; Merlo, C.; Dambolena, J.S.; Zygadlo, J.A.; Ashworth, L. Ecological interactions affect the bioactivity of medicinal plants. Sci. Rep. 2023, 13, 12165. [Google Scholar] [CrossRef] [Scilit]
- Pardo, A.; Rolo, V.; Concepción, E.D.; Díaz, M.; Kazakova, Y.; Stefanova, V.; Marsden, K.; Brandt, K.; Jay, M.; Piskol, S.; et al. To what extent does the European Common Agricultural Policy affect key landscape determinants of biodiversity? Environ. Sci. Policy 2020, 114, 595–605. [Google Scholar] [CrossRef] [Scilit]
- Eurostat. Agri-environmental indicator—Cropping patterns. In Statistics Explained; Eurostat: Luxembourg, 2023. [Google Scholar]
- Society for Territorial and Environmental Prosperity (STEP). Support to High-Nature-Value Farming in Bulgaria; Heinrich Böll Foundation: Brussels, Belgium, 2021. [Google Scholar]
- International Renewable Energy Agency (IRENA). Renewable Capacity Statistics 2026; IRENA: Abu Dhabi, United Arab Emirates, 2026; Available online: https://www.irena.org/Publications/2026/Mar/Renewable-capacity-statistics-2026 (accessed on 2 September 2026).
- Todorović, I. Bulgaria boosts renewables capacity by 938 MW in 2024. Balk. Green Energy News, 14 January 2025.
- Enery. Enery Officially Opens its Largest Solar Plant in Bulgaria; Enery: Vienna, Austria, 2025. [Google Scholar]
- Enery. Bulgaria enjoys solar boom as biggest photovoltaic parks come online. Balk. Green Energy News, 31 August 2023.
- Гoтвят ли нoв ‘рекoрд’—сoларен парк на 9500 дка земеделска земя? Kritichno.bg. 2025. (In Bulgarian)
- CMS. Expert Guide to Agrivoltaics and Floating Photovoltaics in Bulgaria. Amendment to the Agricultural Land Conservation Act, December 2023. Available online: https://cms.law/en/int/expert-guides/cms-expert-guide-to-agrivoltaics-and-floating-photovoltaics/bulgaria (accessed on 15 August 2026).
- CMS. Bulgaria High Court Rules Agrivoltaics Development Should Not Be at the Expense of Agriculture; Legal update; CMS: Frankfurt, Germany, 2025. [Google Scholar]
- Armstrong, A.; Ostle, N.J.; Whitaker, J. Solar park microclimate and vegetation management effects on grassland carbon cycling. Environ. Res. Lett. 2016, 11, 074016. [Google Scholar] [CrossRef] [Scilit]
- Lambert, Q.; Gros, R.; Bischoff, A. Ecological restoration of solar park plant communities and the effect of solar panels. Ecol. Eng. 2022, 182, 106722. [Google Scholar] [CrossRef] [Scilit]
- Tinsley, E.; Froidevaux, J.S.P.; Zsebők, S.; Szabadi, K.L.; Jones, G. Renewable energies and biodiversity: Impact of ground-mounted solar photovoltaic sites on bat activity. J. Appl. Ecol. 2023, 60, 1752–1762. [Google Scholar] [CrossRef] [Scilit]
- Barré, K.; Baudouin, A.; Froidevaux, J.S.P.; Chartendrault, V.; Kerbiriou, C. Insectivorous bats alter their flight and feeding behaviour at ground-mounted solar farms. J. Appl. Ecol. 2024, 61, 328–339. [Google Scholar] [CrossRef] [Scilit]
- European Environment Agency (EEA); European Union; Copernicus Land Monitoring Service (CLMS). Grassland Change 2018–2021 (Raster 20 m), Europe, 3-Yearly; Archive with Regular Updates; Official GRAC Rasters for 2018–2021 and 2021–2024 Accessed Through the CLMS/Copernicus Data Space Ecosystem, 2026. Available online: https://land.copernicus.eu/en/products/high-resolution-layer-grasslands/grassland-change-2018-2021-raster-20-m-europe-3-yearly (accessed on 15 August 2026). [CrossRef]
- Copernicus Land Monitoring Service (CLMS); European Environment Agency (EEA). HRL Grasslands—Product User Manual, Version 2.3; EEA: Copenhagen, Denmark, 2025; Available online: https://land.copernicus.eu/en/technical-library/product-user-manual-grasslands-2017-present/@@download/file (accessed on 15 August 2026).
- Brown, C.F.; Brumby, S.P.; Guzder-Williams, B.; Birch, T.; Hyde, S.B.; Mazzariello, J.; Czerwinski, W.; Pasquarella, V.J.; Haertel, R.; Ilyushchenko, S.; et al. Dynamic World, Near real-time global 10 m land use land cover mapping. Sci. Data 2022, 9, 251. [Google Scholar] [CrossRef] [Scilit]
- Gorelick, N.; Hancher, M.; Dixon, M.; Ilyushchenko, S.; Thau, D.; Moore, R. Google Earth Engine: Planetary-scale geospatial analysis for everyone. Remote Sens. Environ. 2017, 202, 18–27. [Google Scholar] [CrossRef] [Scilit]
- Zanaga, D.; Van De Kerchove, R.; Daems, D.; De Keersmaecker, W.; Brockmann, C.; Kirches, G.; Wevers, J.; Cartus, O.; Santoro, M.; Fritz, S.; et al. ESA WorldCover 10 m 2021 v200. 2022. Available online: https://zenodo.org/records/7254221 (accessed on 19 September 2026).
- Executive Environment Agency (ExEA); Ministry of Environment and Water. National Habitat Mapping Data for Annex I Habitat Types in Bulgaria; ExEA: Sofia, Bulgaria, 2025. Available online: https://eea.government.bg/bg/soer/2017/biodiversity-nem/ekosistemi-i-ekosistemni-uslugi.html (accessed on 15 August 2026).
- Council of the European Communities. Council Directive 92/43/EEC of 21 May 1992 on the Conservation of Natural Habitats and of Wild Fauna and Flora, consolidated text of 14 July 2025. Annex I. Off. J. Eur. Community 1992, L 206, 7–50. Available online: https://eur-lex.europa.eu/legal-content/EN/TXT/?uri=CELEX:01992L0043-20250714 (accessed on 14 August 2026).
- European Environment Agency (EEA). Natura 2000 Data—The European Network of Protected Sites: Natura 2000 (Tabular), Version End 2024 Rev. 01, Published 5 March 2026; EEA: Copenhagen, Denmark, 2026; Available online: https://www.eea.europa.eu/en/datahub/datahubitem-view/6fc8ad2d-195d-40f4-bdec-576e7d1268e4 (accessed on 14 August 2026). [CrossRef]
- European Commission. Commission Implementing Decision 2011/484/EU of 11 July 2011 Concerning a Site Information Format for Natura 2000 Sites: Standard Data Form and Explanatory Notes. Off. J. Eur. Union 2011, L198, 39–70. [Google Scholar]
- European Commission. Commission Implementing Decision (EU) 2023/2806 of 15 December 2023 Concerning a Site Information Format for Natura 2000 Sites, Applicable from 1 February 2025. Off. J. Eur. Union 2023, L 2023/2806. Available online: https://eur-lex.europa.eu/legal-content/EN/TXT/?uri=CELEX:32023D2806 (accessed on 14 August 2026).
- European Environment Agency (EEA); European Commission. Conservation Status of Habitat Types and Species: Datasets from Article 17, Habitats Directive 92/43/EEC Reporting (2013–2018), 2020 Tabular Dataset, Public Version, Published 27 August 2020; EEA: Copenhagen, Denmark, 2020; Available online: https://www.eea.europa.eu/en/datahub/datahubitem-view/d8b47719-9213-485a-845b-db1bfe93598d (accessed on 14 August 2026).
- European Environment Agency (EEA); European Commission. Article 17 Web Tool: Biogeographical Assessments of Conservation Status of Species and Habitats, 2019–2024 Reporting Cycle. Available online: https://nature-art17.eionet.europa.eu/ (accessed on 14 August 2026).
- Ministry of Agriculture and Food (MAF). BANSIK 2010: Final Results on the Occupation and Use of the Territory of Bulgaria in 2010 (Results and Analyses No. 165); Agrostatistics Department: Sofia, Bulgaria, 2010.
- Ministry of Agriculture and Food (MAF). BANSIK 2025: Final Results on the Occupation and Use of the Territory of Bulgaria in 2025 (Results and Analyses No. 465); Agrostatistics Department: Sofia, Bulgaria, 2025.
- Ministry of Agriculture and Food (MAF). BANSIK 2014: Final Results on the Occupation and Use of the Territory of Bulgaria in 2014 (Results and Analyses No. 276); Agrostatistics Department: Sofia, Bulgaria, 2014.
- Ministry of Agriculture and Food (MAF). BANSIK 2024: Final Results on the Occupation and Use of the Territory of Bulgaria in 2024 (Results and Analyses No. 447); Agrostatistics Department: Sofia, Bulgaria, 2024.
- Olofsson, P.; Foody, G.M.; Herold, M.; Stehman, S.V.; Woodcock, C.E.; Wulder, M.A. Good practices for estimating area and assessing accuracy of land change. Remote Sens. Environ. 2014, 148, 42–57. [Google Scholar] [CrossRef] [Scilit]
- Stehman, S.V. Estimating area and map accuracy for stratified random sampling when the strata are different from the map classes. Int. J. Remote Sens. 2014, 35, 4923–4939. [Google Scholar] [CrossRef] [Scilit]
- d’Andrimont, R.; Verhegghen, A.; Lemoine, G.; Kempeneers, P.; Meroni, M.; van der Velde, M. From parcel to continental scale—A first European crop type map based on Sentinel-1 and LUCAS Copernicus in-situ observations. Remote Sens. Environ. 2021, 266, 112708. [Google Scholar] [CrossRef] [Scilit]
- Ghassemi, B.; Izquierdo-Verdiguier, E.; Verhegghen, A.; Yordanov, M.; Lemoine, G.; Moreno Martínez, Á.; De Marchi, D.; van der Velde, M.; Vuolo, F.; d’Andrimont, R. European Union crop map 2022: Earth observation’s 10-meter dive into Europe’s crop tapestry. Sci. Data 2024, 11, 1048. [Google Scholar] [CrossRef] [Scilit]
- Ministry of Agriculture and Food (MAF). Land Parcel Identification System (LPIS): Identification of Agricultural Parcels; MAF: Sofia, Bulgaria. Available online: https://www.mzh.government.bg/bg/politiki-i-programi/programi-za-finansirane/direktni-plashaniya/identifikaciya-na-zemedelski-parceli/ (accessed on 1 September 2026). (In Bulgarian)
- Shi, X.; Ma, C.; de Kraker, J.; Gong, S.; Hodgson, J.A.; Luo, S.; van der Steen, J.J.M.; Xiao, H.; Wang, F.; Tie, X.; et al. Influence of agricultural intensification on pollinator pesticide exposure, food acquisition and diversity. J. Appl. Ecol. 2024, 61, 1905–1917. [Google Scholar] [CrossRef] [Scilit]
- FAO. FAOSTAT Pesticides Use Domain. Food and Agriculture Organization of the United Nations. 2026. Available online: https://www.fao.org/faostat/en/#data/RP (accessed on 18 March 2026).
- Liere, H.; Jha, S.; Philpott, S.M. Intersection between biodiversity conservation, agroecology, and ecosystem services. Agroecol. Sustain. Food Syst. 2017, 41, 723–760. [Google Scholar] [CrossRef] [Scilit]
- Brühl, C.A.; Zaller, J.G. Biodiversity decline as a consequence of an inappropriate environmental risk assessment of pesticides. Front. Environ. Sci. 2019, 7, 177. [Google Scholar] [CrossRef] [Scilit]
- Ministry of Environment and Water of Bulgaria. Integration of the Ecosystem Approach and Application of Nature-Based Solutions in the Conservation of Protected Areas from the Natura 2000 Network; Project No. BG16FFPR002-3.023-0001; Co-funded by the European Union (ERDF) via the Environment Programme 2021–2027; Ministry of Environment and Water: Sofia, Bulgaria, 2025. Available online: https://www.dicon-bg.com/en/projects/ (accessed on 8 September 2026).
- Grigorov, B.; Vassilev, K. Mapping of grassland habitats in terms of ecological change—A case study from Svoge Municipality, Western Bulgaria. Bulg. J. Agric. Sci. 2024, 30, 17–22. [Google Scholar]
- Velev, N.; Grigorov, B.; Georgiev, S.; Nazarov, M.; Genova, B.; Vassilev, K. Establishment of Reynoutrietum japonicae Association in Bulgaria: Composition and Distribution. Phytol. Balcan. 2024, 30, 73–84. [Google Scholar] [CrossRef] [Scilit]
- Vassilev, K.; Pedashenko, H.; Nikolov, S.C.; Apostolova, I.; Dengler, J. Drivers of Plant Diversity in Bulgarian Dry Grasslands Vary Across Spatial Scales. Tuexenia 2020, 40, 335–354. [Google Scholar]
- Vassilev, K.; Apostolova, I.; Pedashenko, H. Balkan Vegetation Database (BVD)—Updated Information and Current Status. Veg. Classif. Surv. 2020, 1, 151–155. [Google Scholar] [CrossRef] [Scilit]
- Kozuharova, E.; Ljubomirov, T.; Uzunov, D. Where have the bumblebees and other wild bees gone?—Preliminary results of rapid evaluation in grassland habitats near agricultural fields in Ihtimanska Sredna Gora Mts (Bulgaria). Hist. Nat. Bulg. 2025, 47, 69–84. [Google Scholar] [CrossRef] [Scilit]
- Kozuharova, E.; Vereecken, N.J. Lavender production in SE Dobrudja—Intensive agriculture impacts pollinators’ density and diversity. Euro-Mediterr. J. Environ. Integr. 2024, 9, 937–943. [Google Scholar] [CrossRef] [Scilit]
- Kozuharova, E.; Simeonov, V. Monitoring bumblebee pollinator visits to the medicinal plant Gentiana asclepiadea L. (Gentianacese)—A comparison between the periods 1990–1994 and 2017–2020. BioRisk 2022, 17, 317–327. [Google Scholar] [CrossRef] [Scilit]
- Hallmann, C.A.; Sorg, M.; Jongejans, E.; Siepel, H.; Hofland, N.; Schwan, H.; Stenmans, W.; Müller, A.; Sumser, H.; Hörren, T.; et al. More than 75 percent decline over 27 years in total flying insect biomass in protected areas. PLoS ONE 2017, 12, e0185809. [Google Scholar] [CrossRef] [Scilit]
- Greenpeace Bulgaria. Сoларната енергия в България—къде и как? Greenpeace Bulgaria: Sofia, Bulgaria, 2024. (In Bulgarian) [Google Scholar]
- Walston, L.J.; Hartmann, H.M.; Fox, L.; Macknick, J.; McCall, J.; Janski, J.; Jenkins, L. If you build it, will they come? Insect community responses to habitat establishment at solar energy facilities in Minnesota, USA. Environ. Res. Lett. 2024, 19, 014053. [Google Scholar] [CrossRef] [Scilit]
- Blaydes, H.; Potts, S.G.; Whyatt, J.D.; Armstrong, A. On-site floral resources and surrounding landscape characteristics impact pollinator biodiversity at solar parks. Ecol. Solut. Evid. 2024, 5, e12307. [Google Scholar] [CrossRef] [Scilit]
- Jarčuška, B.; Gálffyová, M.; Schnürmacher, R.; Baláž, M.; Mišík, M.; Repel, M.; Fulín, M.; Kerestúr, D.; Lackovičová, Z.; Mojžiš, M.; et al. Solar parks can enhance bird diversity in agricultural landscape. J. Environ. Manag. 2024, 351, 119902. [Google Scholar] [CrossRef] [Scilit]
- Valera, F.; Šálek, M.; Bolonio, L.; Václav, R. Comment on “Solar parks can enhance bird diversity in agricultural landscape” by Jarčuška et al. J. Environ. Manag. 2024, 366, 121781. [Google Scholar] [CrossRef] [Scilit]
- Ludzuweit, A.; Paterson, J.; Wydra, K.; Pump, C.; Müller, K.; Miller, Y. Enhancing ecosystem services and biodiversity in agrivoltaics through habitat-enhancing strategies. Renew. Sustain. Energy Rev. 2025, 212, 115380, Correction in Renew. Sustain. Energy Rev. 2025, 218, 115775. [Google Scholar] [CrossRef] [Scilit]
- Solar Energy UK. Solar Habitat Report 2024; Keele University: London, UK; Centre for Landscape Regeneration, East Anglia Bird Survey Data: London, UK, 2024. [Google Scholar]
- Lafitte, A.; Sordello, R.; Ouédraogo, D.-Y.; Thierry, C.; Marx, G.; Froidevaux, J.; Schatz, B.; Kerbiriou, C.; Gourdain, P.; Reyjol, Y. Existing Evidence on the Effects of Photovoltaic Panels on Biodiversity: A Systematic Map with Critical Appraisal of Study Validity. Environ. Evid. 2023, 12, 25. [Google Scholar] [CrossRef] [Scilit]
- Faraslis, I.; Margaritopoulou, V.; Christakis, C.; Providas, E. Evaluating Landscape Fragmentation and Consequent Environmental Impact of Solar Parks Installation in Natura 2000 Protected Areas: The Case of the Thessaly Region, Central Greece. Sustainability 2025, 17, 7158. [Google Scholar] [CrossRef] [Scilit]
- Järviö, N.; Uusitalo, V.; Leppäkoski, L.; Breyer, C.; Sahin, H.; Kosonen, A. Known and unknown biodiversity impacts of solar PV: A review of life cycle stages and mitigation opportunities. Appl. Energy 2026, 417, 128008. [Google Scholar] [CrossRef] [Scilit]
- Chen, X.; Chen, B.; Wang, Y.; Zhou, N.; Zhou, Z. Response of Vegetation and Soil Property Changes by Photovoltaic Established Stations Based on a Comprehensive Meta-Analysis. Land 2024, 13, 478. [Google Scholar] [CrossRef] [Scilit]
- Valdez-Hernández, M.; Baeza-Pérez, A.; Nabet, J.; Woo-García, R.M.; López-Huerta, F.; Medina-Velázquez, D.Y.; Rodríguez-Sánchez, A.; Callejas-Jiménez, M.E.; Osorio-de-la-Rosa, E. Techno-Spatial and Economic Assessment of Rooftop Versus Land-Based Photovoltaic Deployment in a Biodiversity-Sensitive Region of the Mexican Caribbean. Eng 2026, 7, 385. [Google Scholar] [CrossRef] [Scilit]
- Klimentova-Nikolova, Y.; Petrova, S.; Nikolov, B.; Popov, R.; Lyubomirov, S.; Asenov, S.; Kanevski, H.; Dakova, M.; Angelov, N.; Kazandzhieva, S.; et al. Photovoltaic power plants on agricultural land—Are they really green? Ecol. Balk. 2025, 17, 85–93. [Google Scholar] [CrossRef]
- Popov, R.; Petrova, S.; Nikolov, B.; Yordanov, E.; Kazandzieva, S.; Klimentova-Nikolova, Y. Stationary versus solar tracked PV systems—Which one has lower impact on biodiversity? Energy 2026, 348, 140478. [Google Scholar] [CrossRef] [Scilit]
- Xu, P.; Tsendbazar, N.-E.; Herold, M.; de Bruin, S.; Koopmans, M.; Birch, T.; Carter, S.; Fritz, S.; Lesiv, M.; Mazur, E.; et al. Comparative validation of recent 10 m-resolution global land cover maps. Remote Sens. Environ. 2024, 311, 114316. [Google Scholar] [CrossRef] [Scilit]
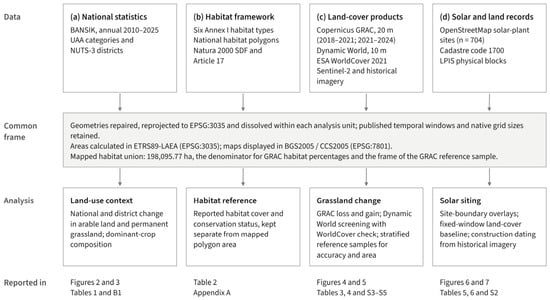
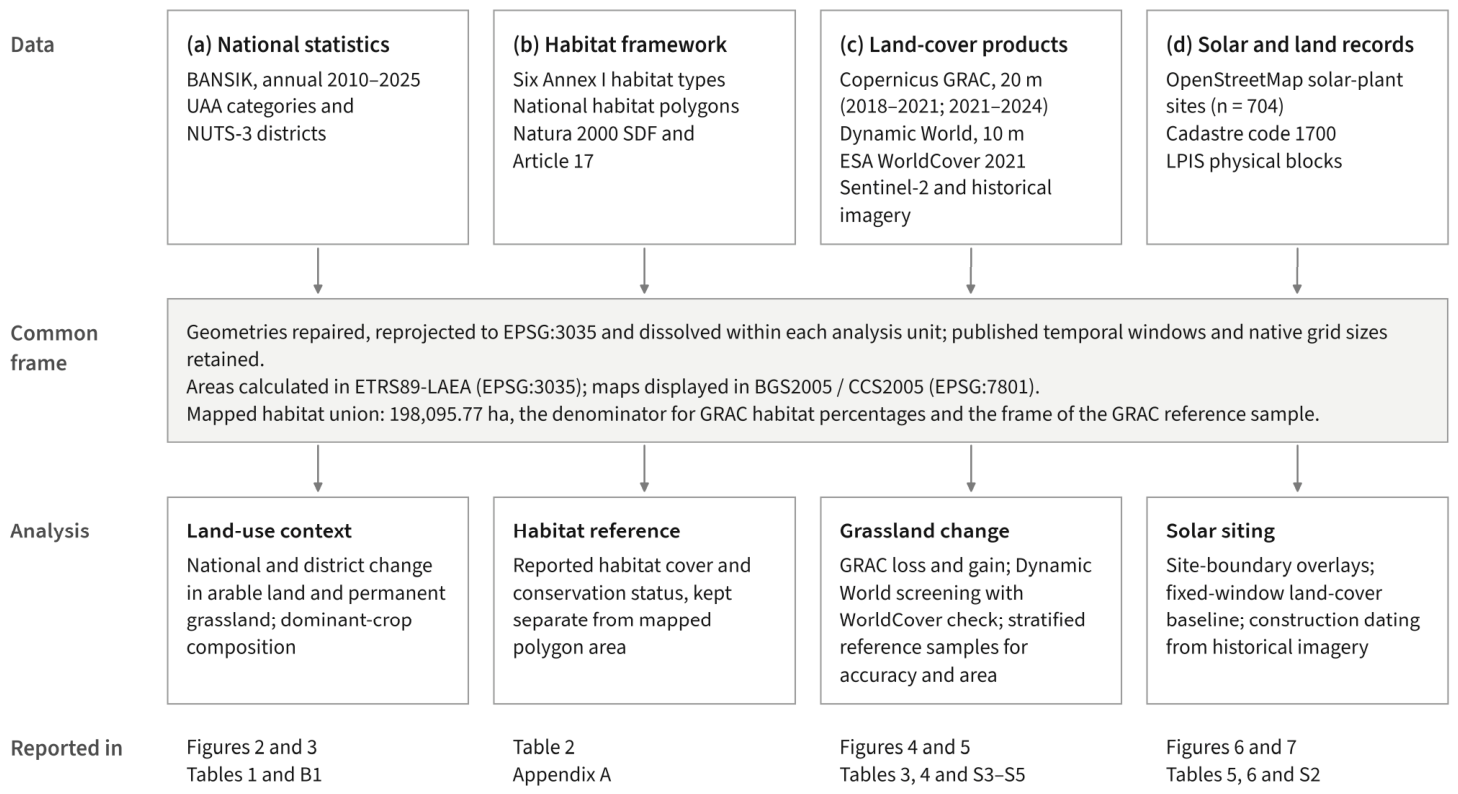
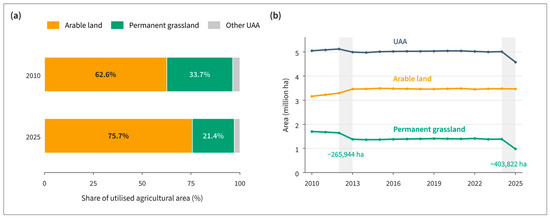
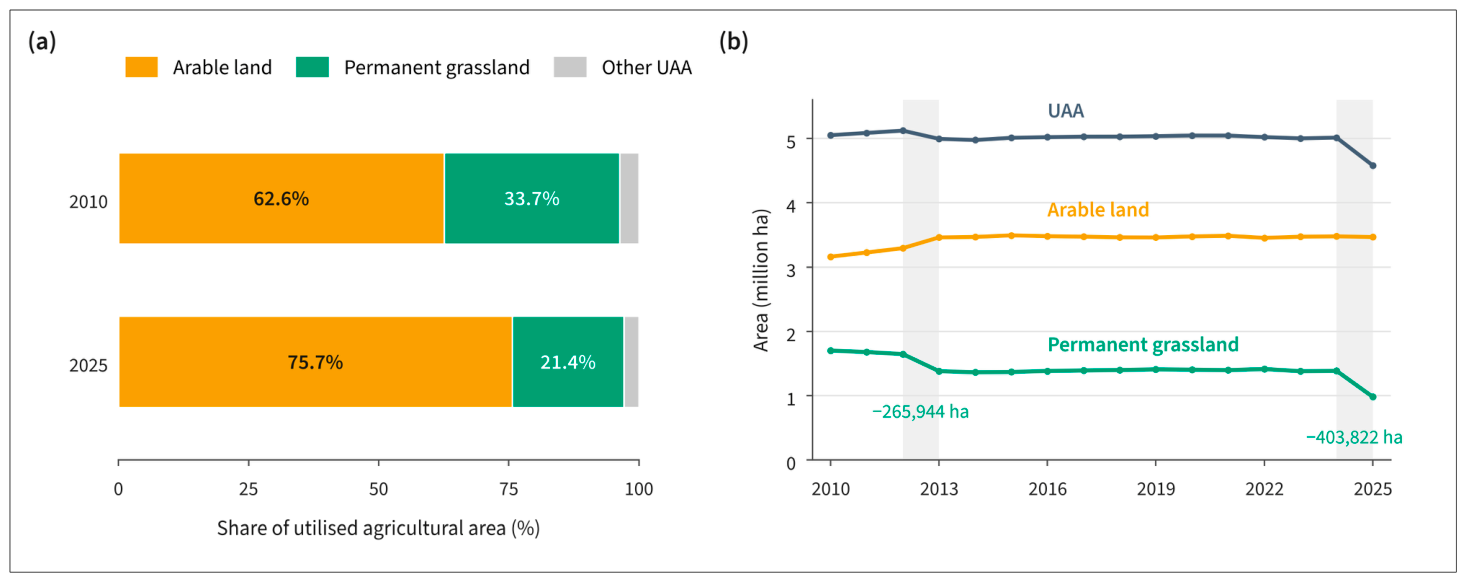
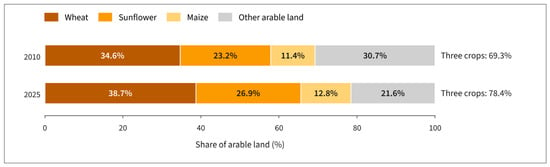
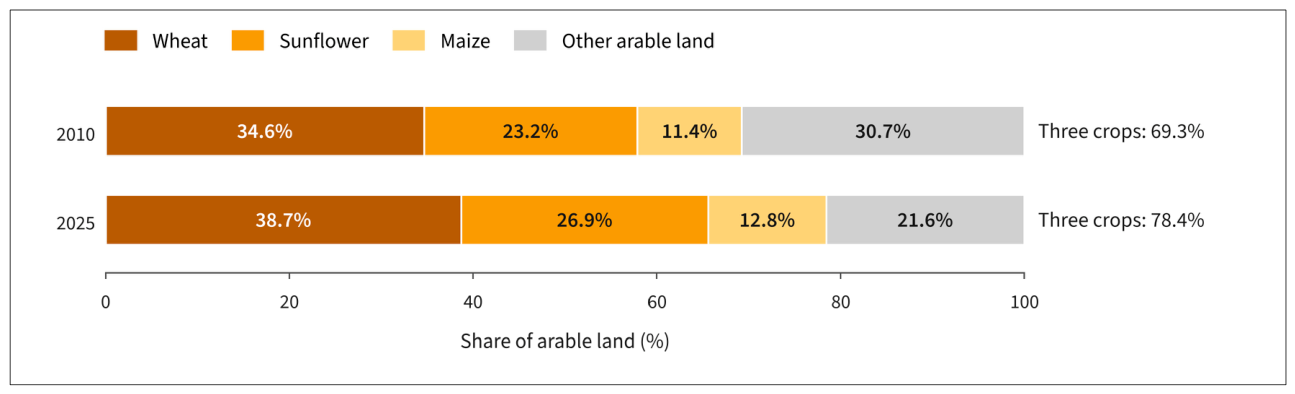
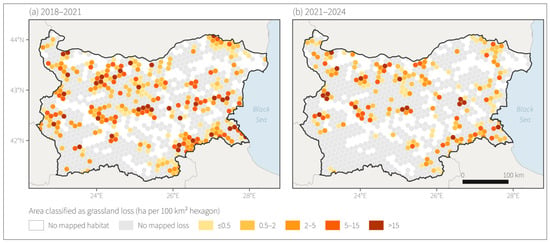
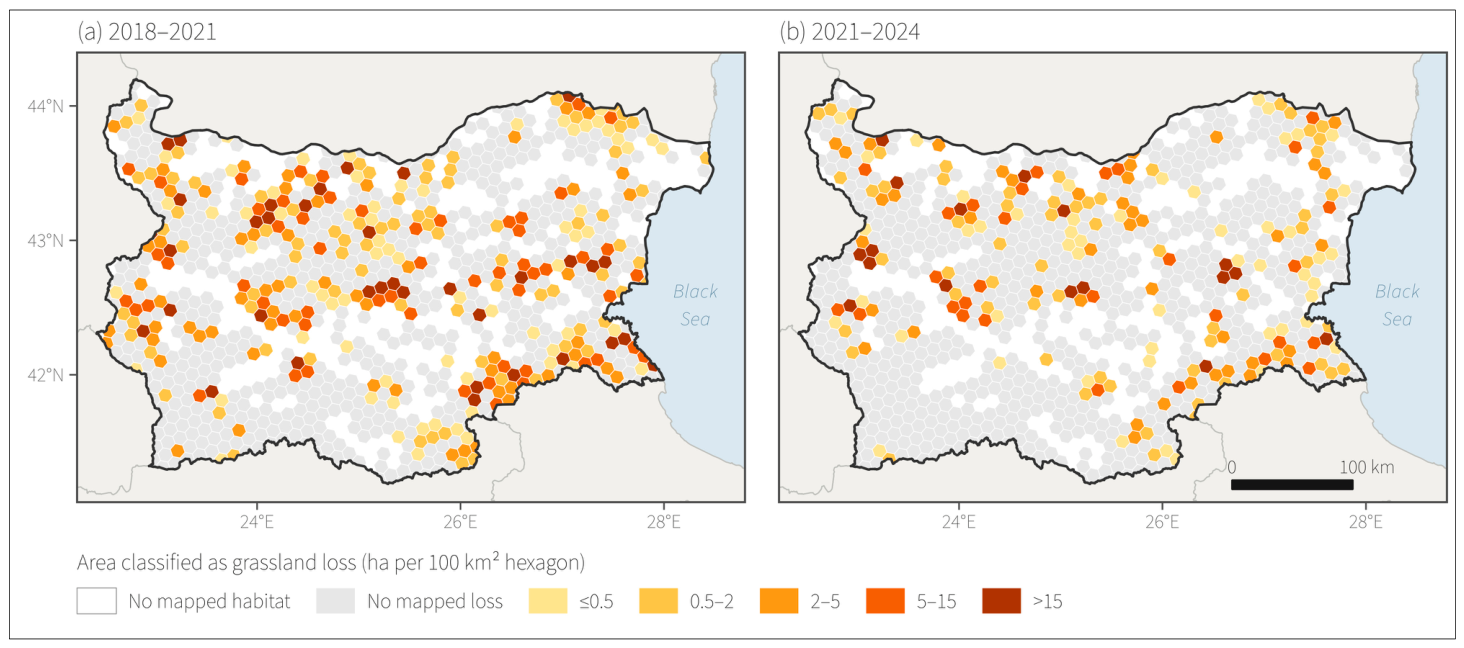
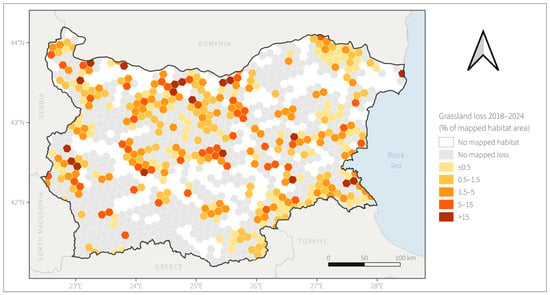
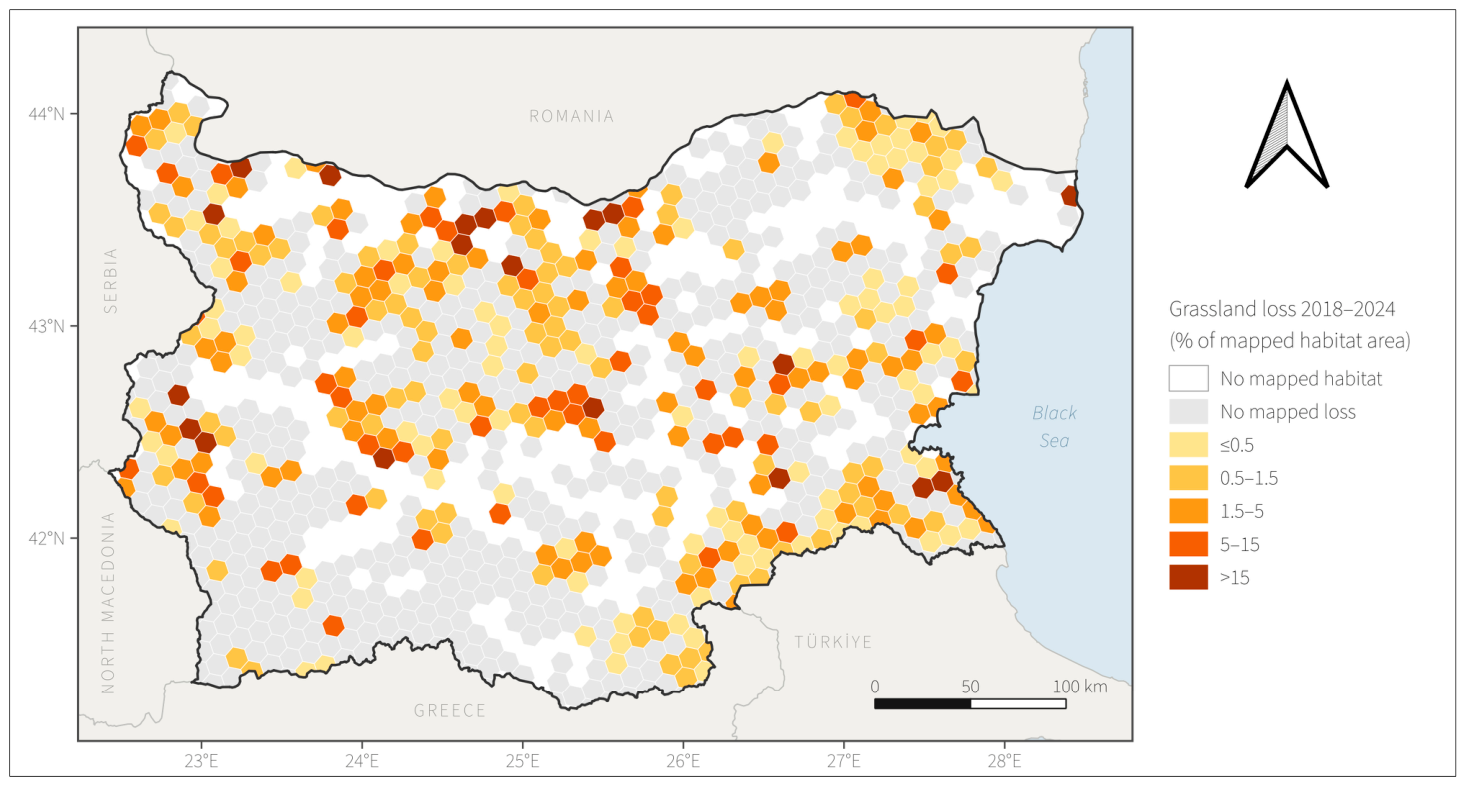
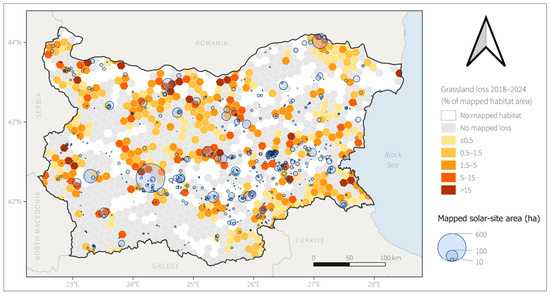
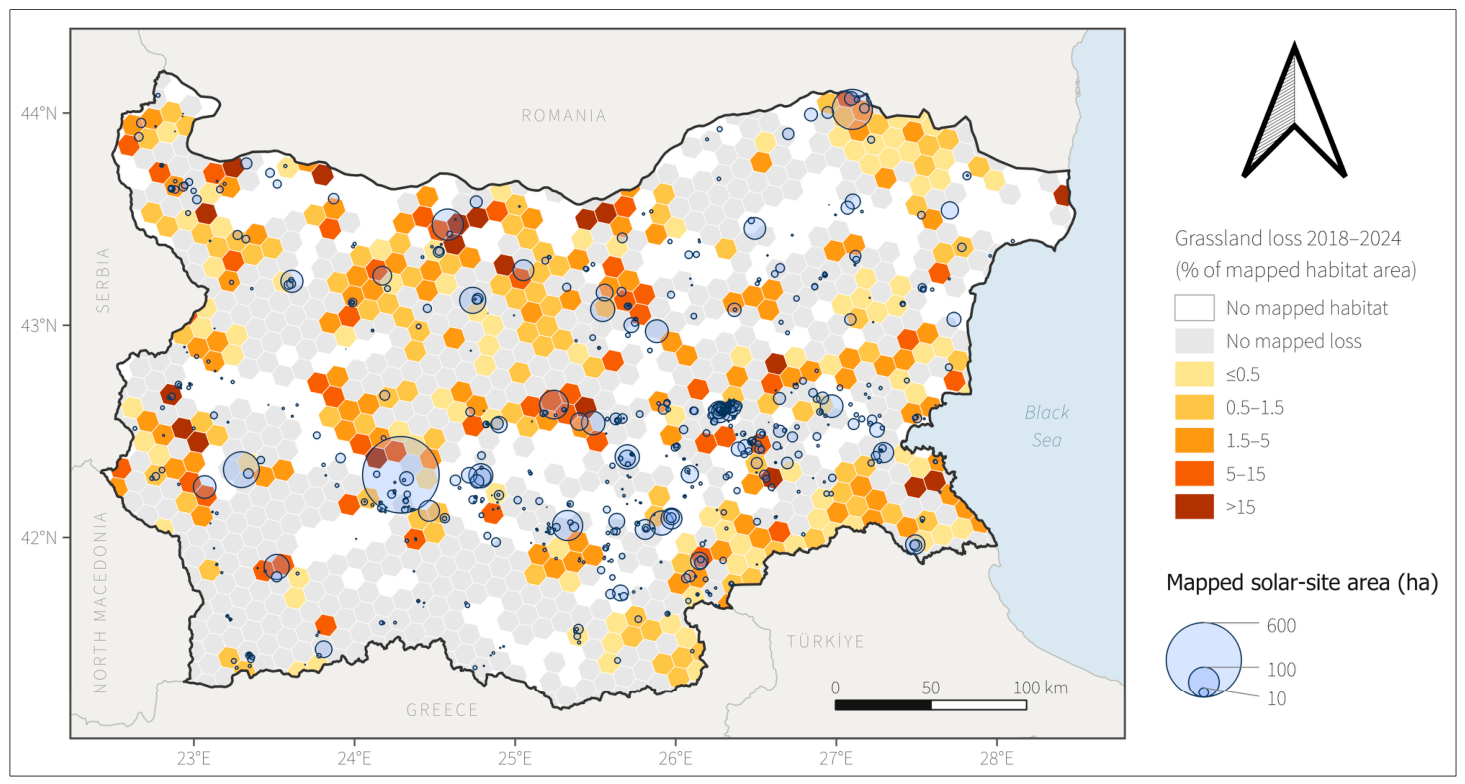
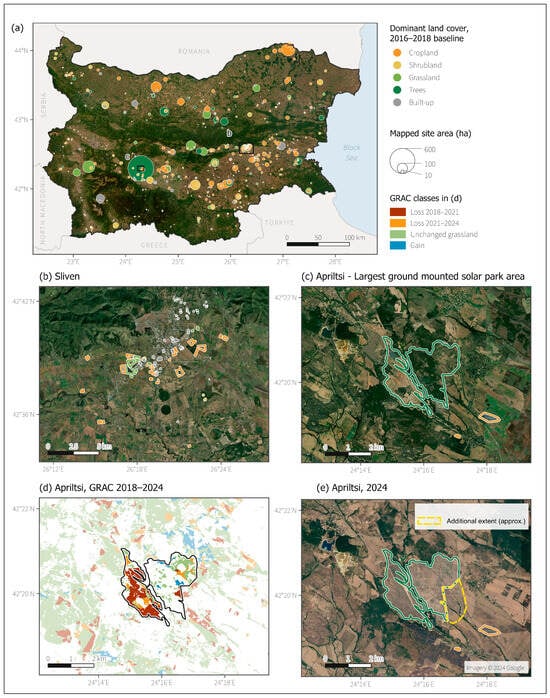
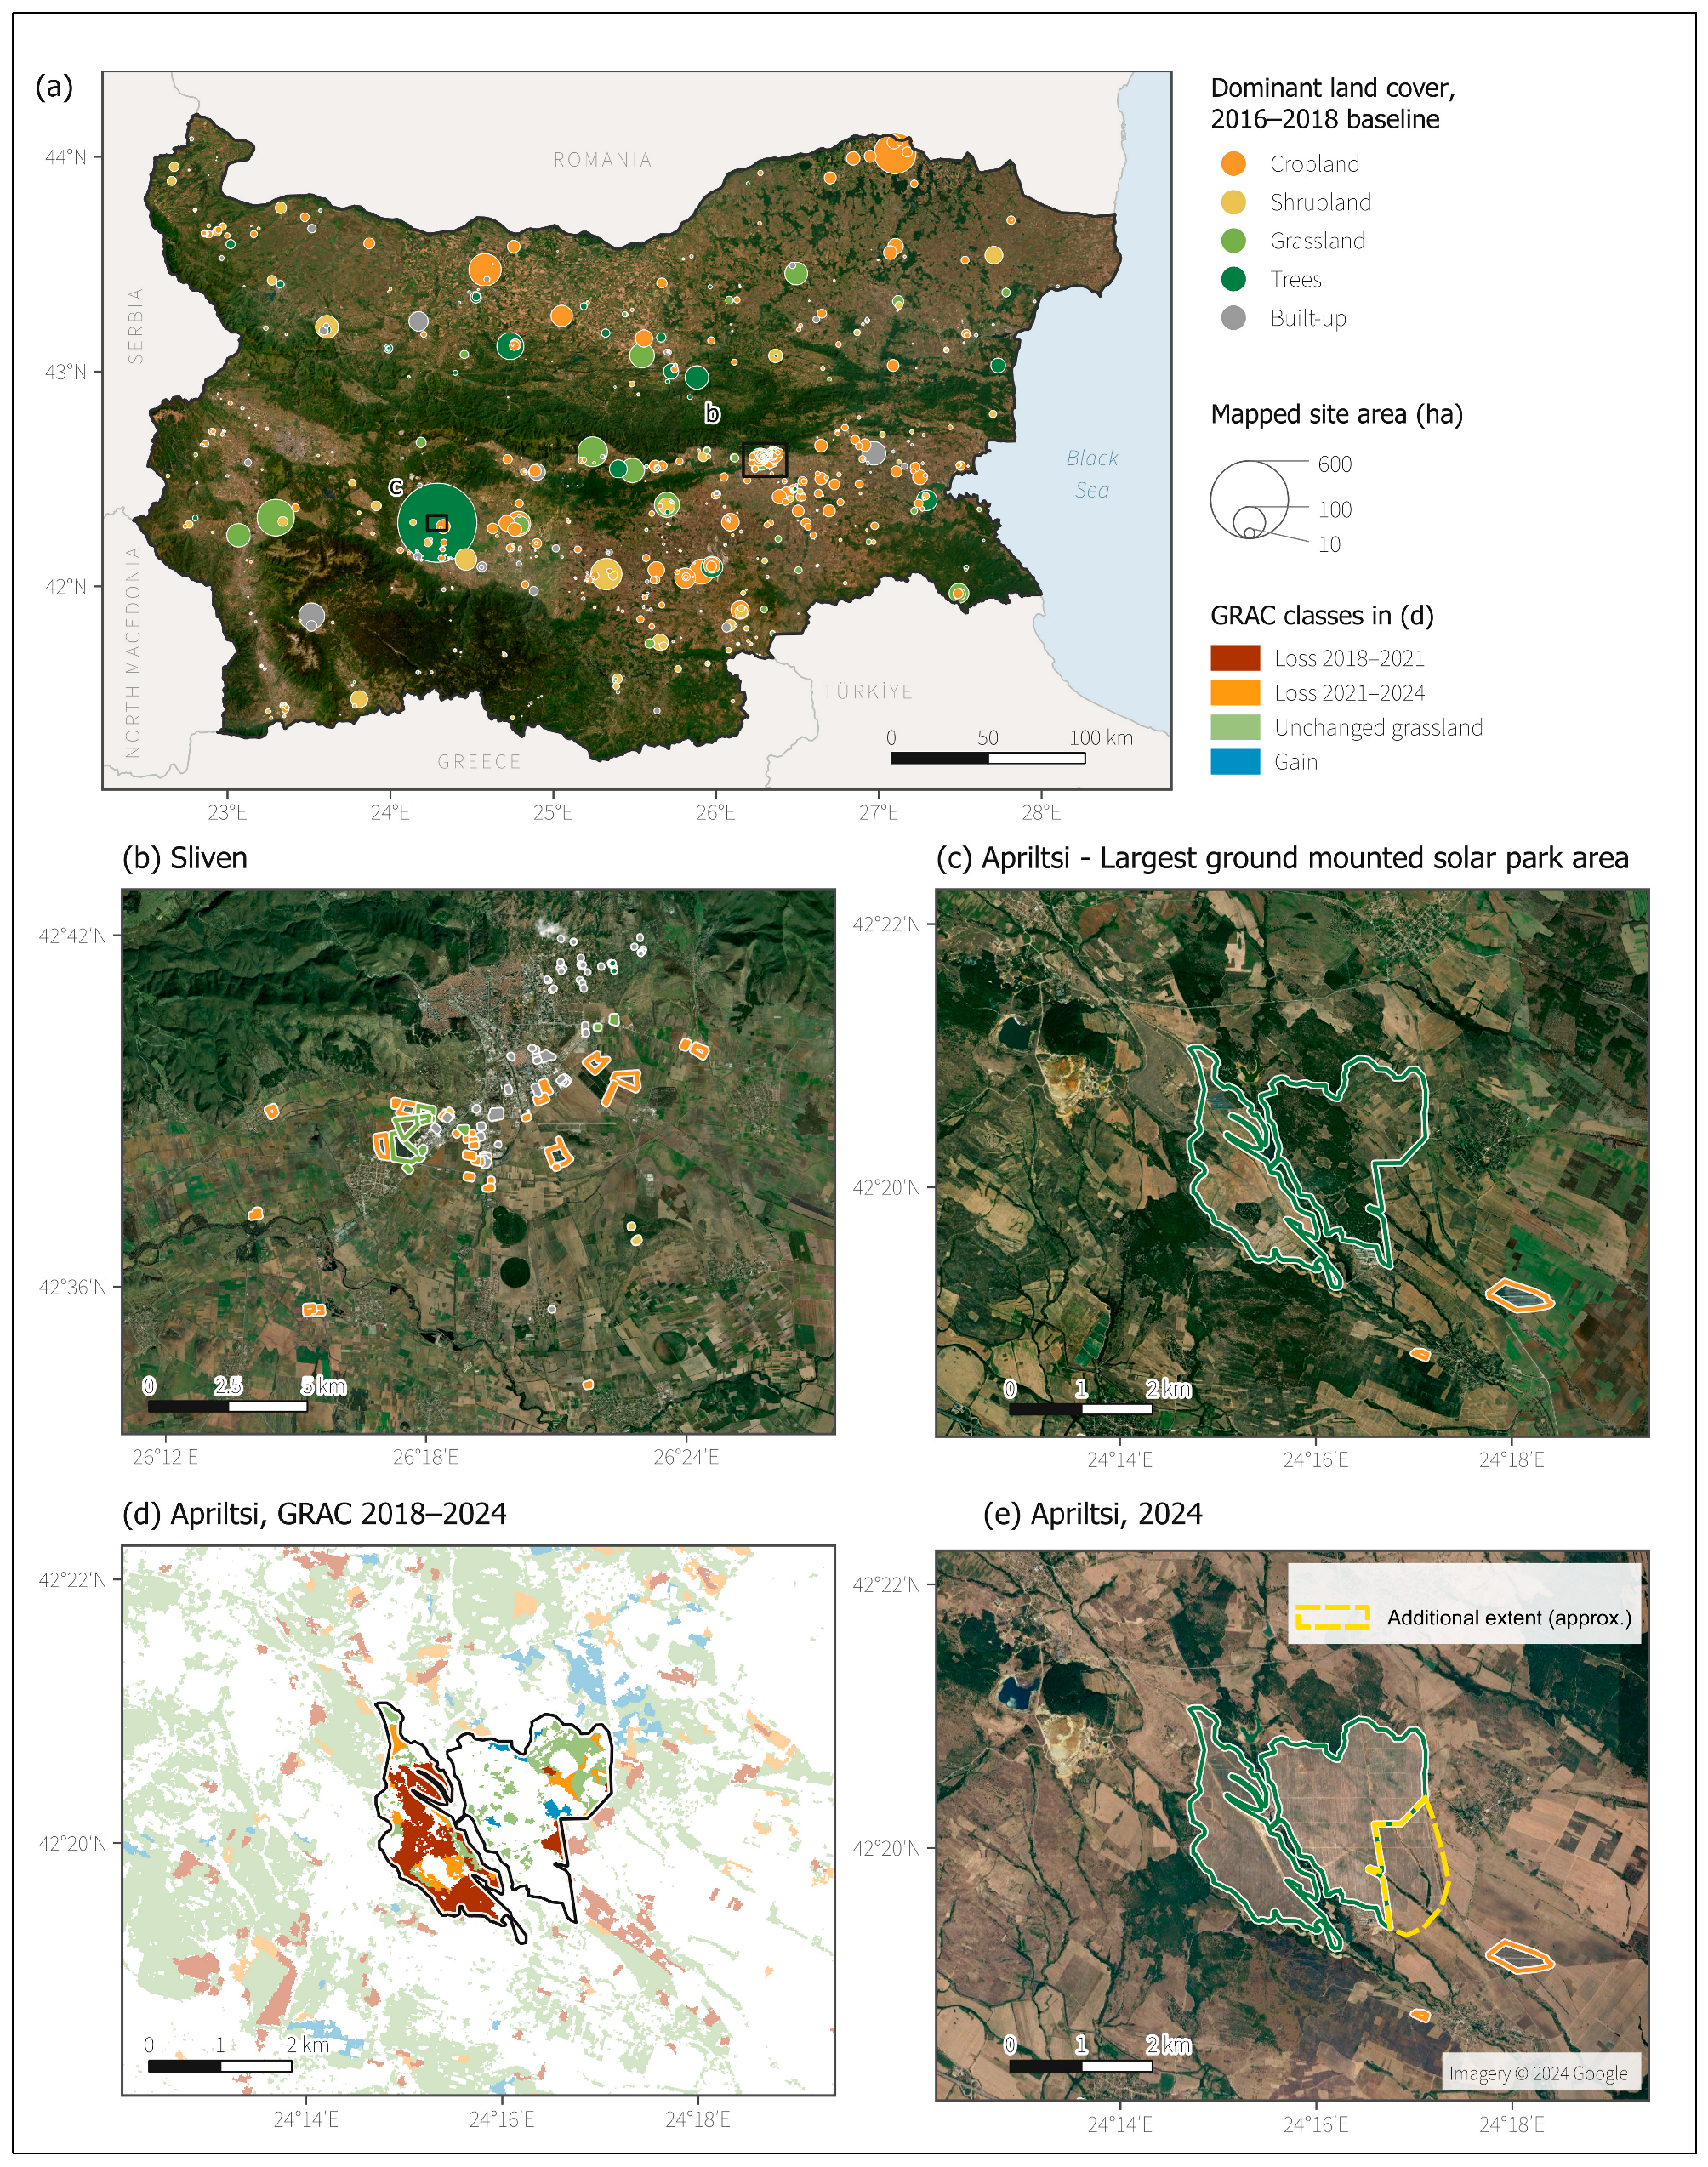
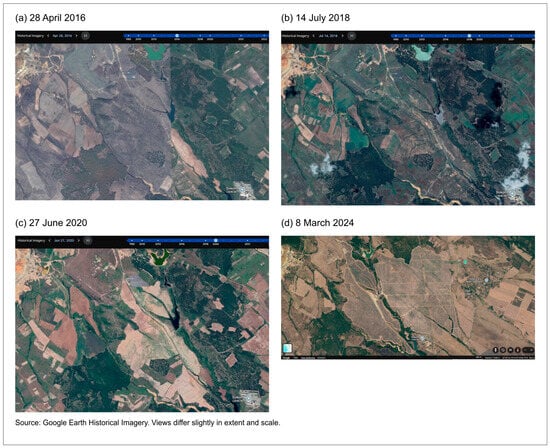
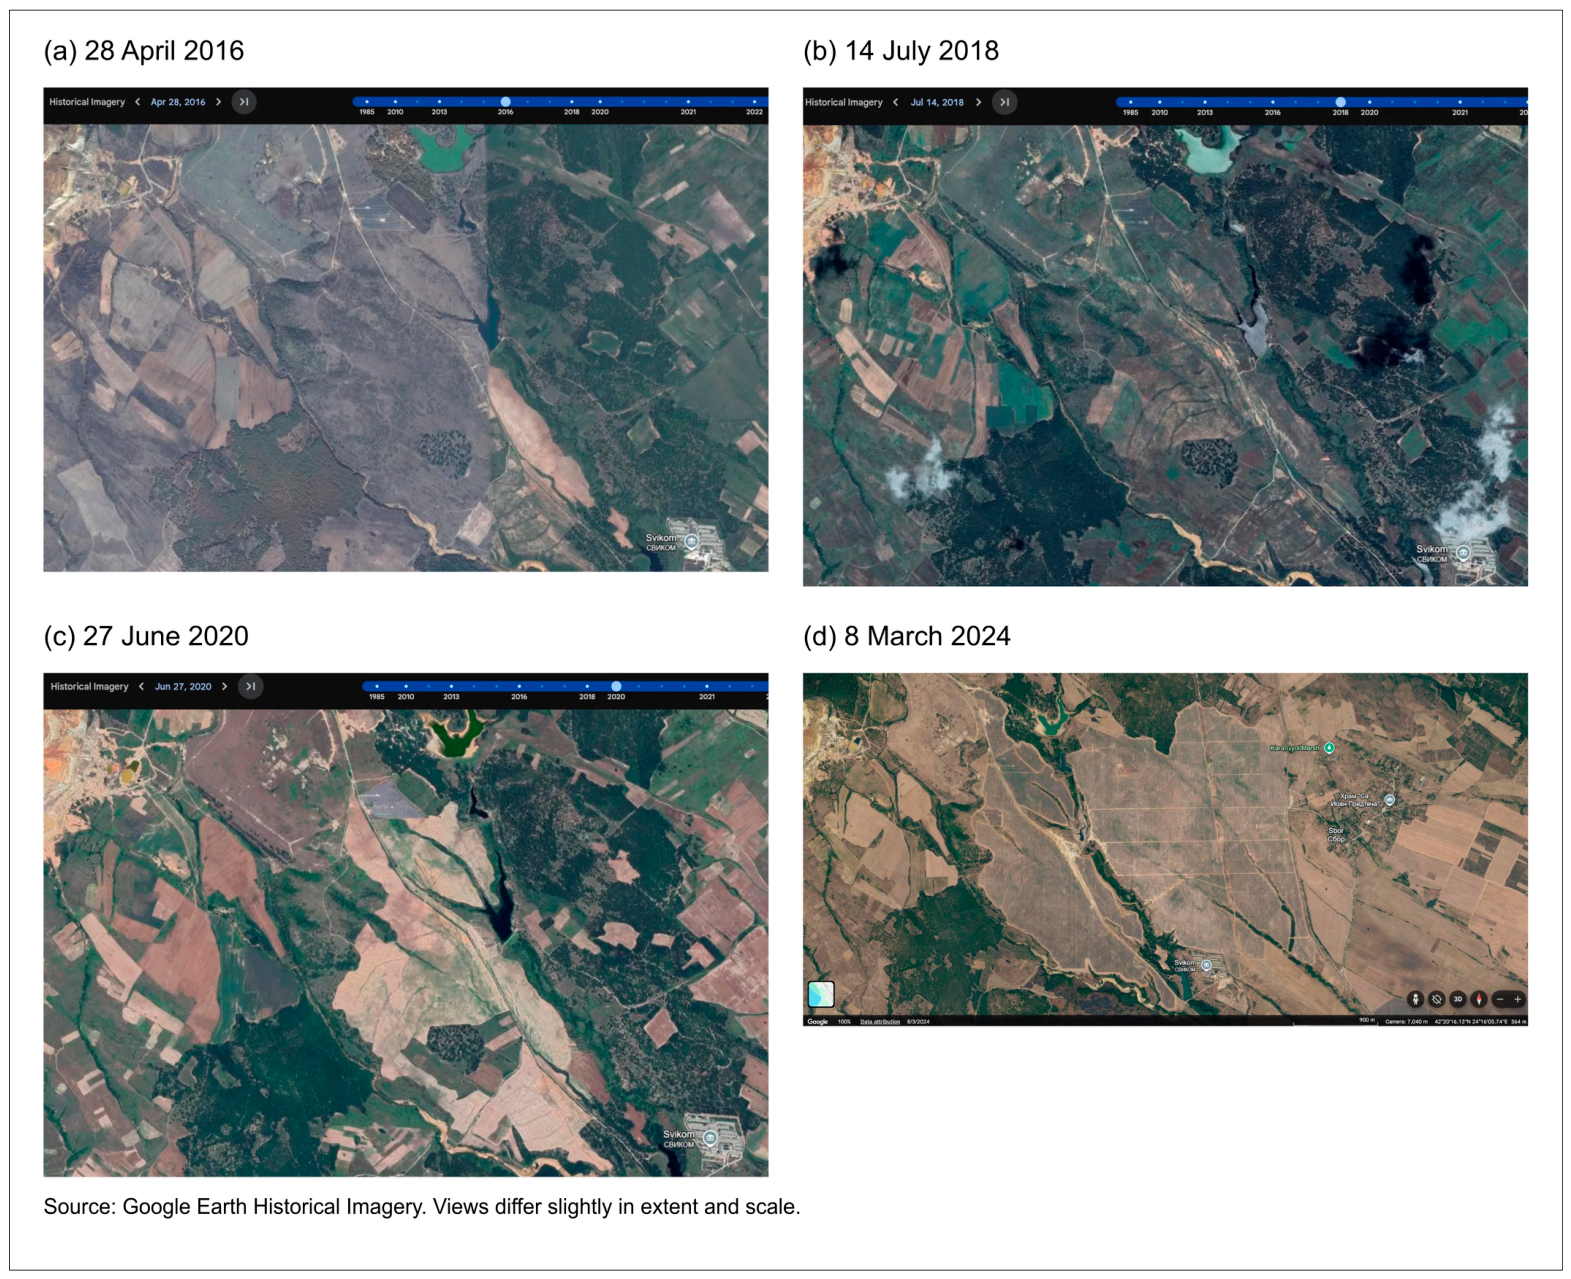
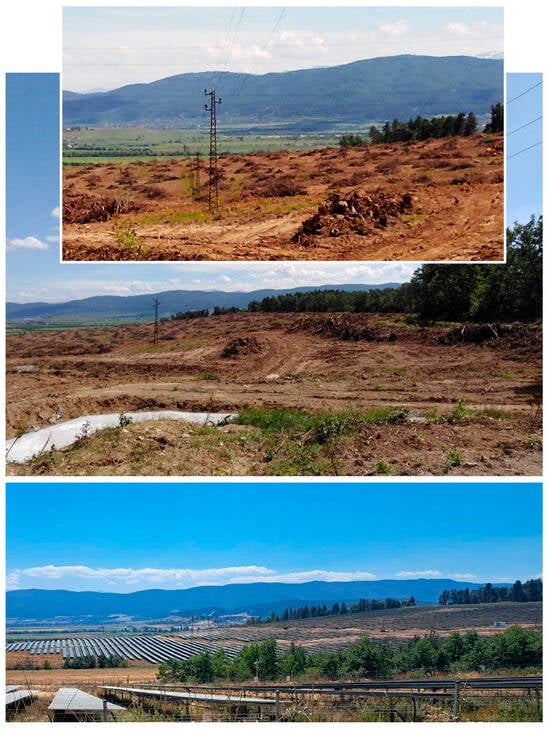
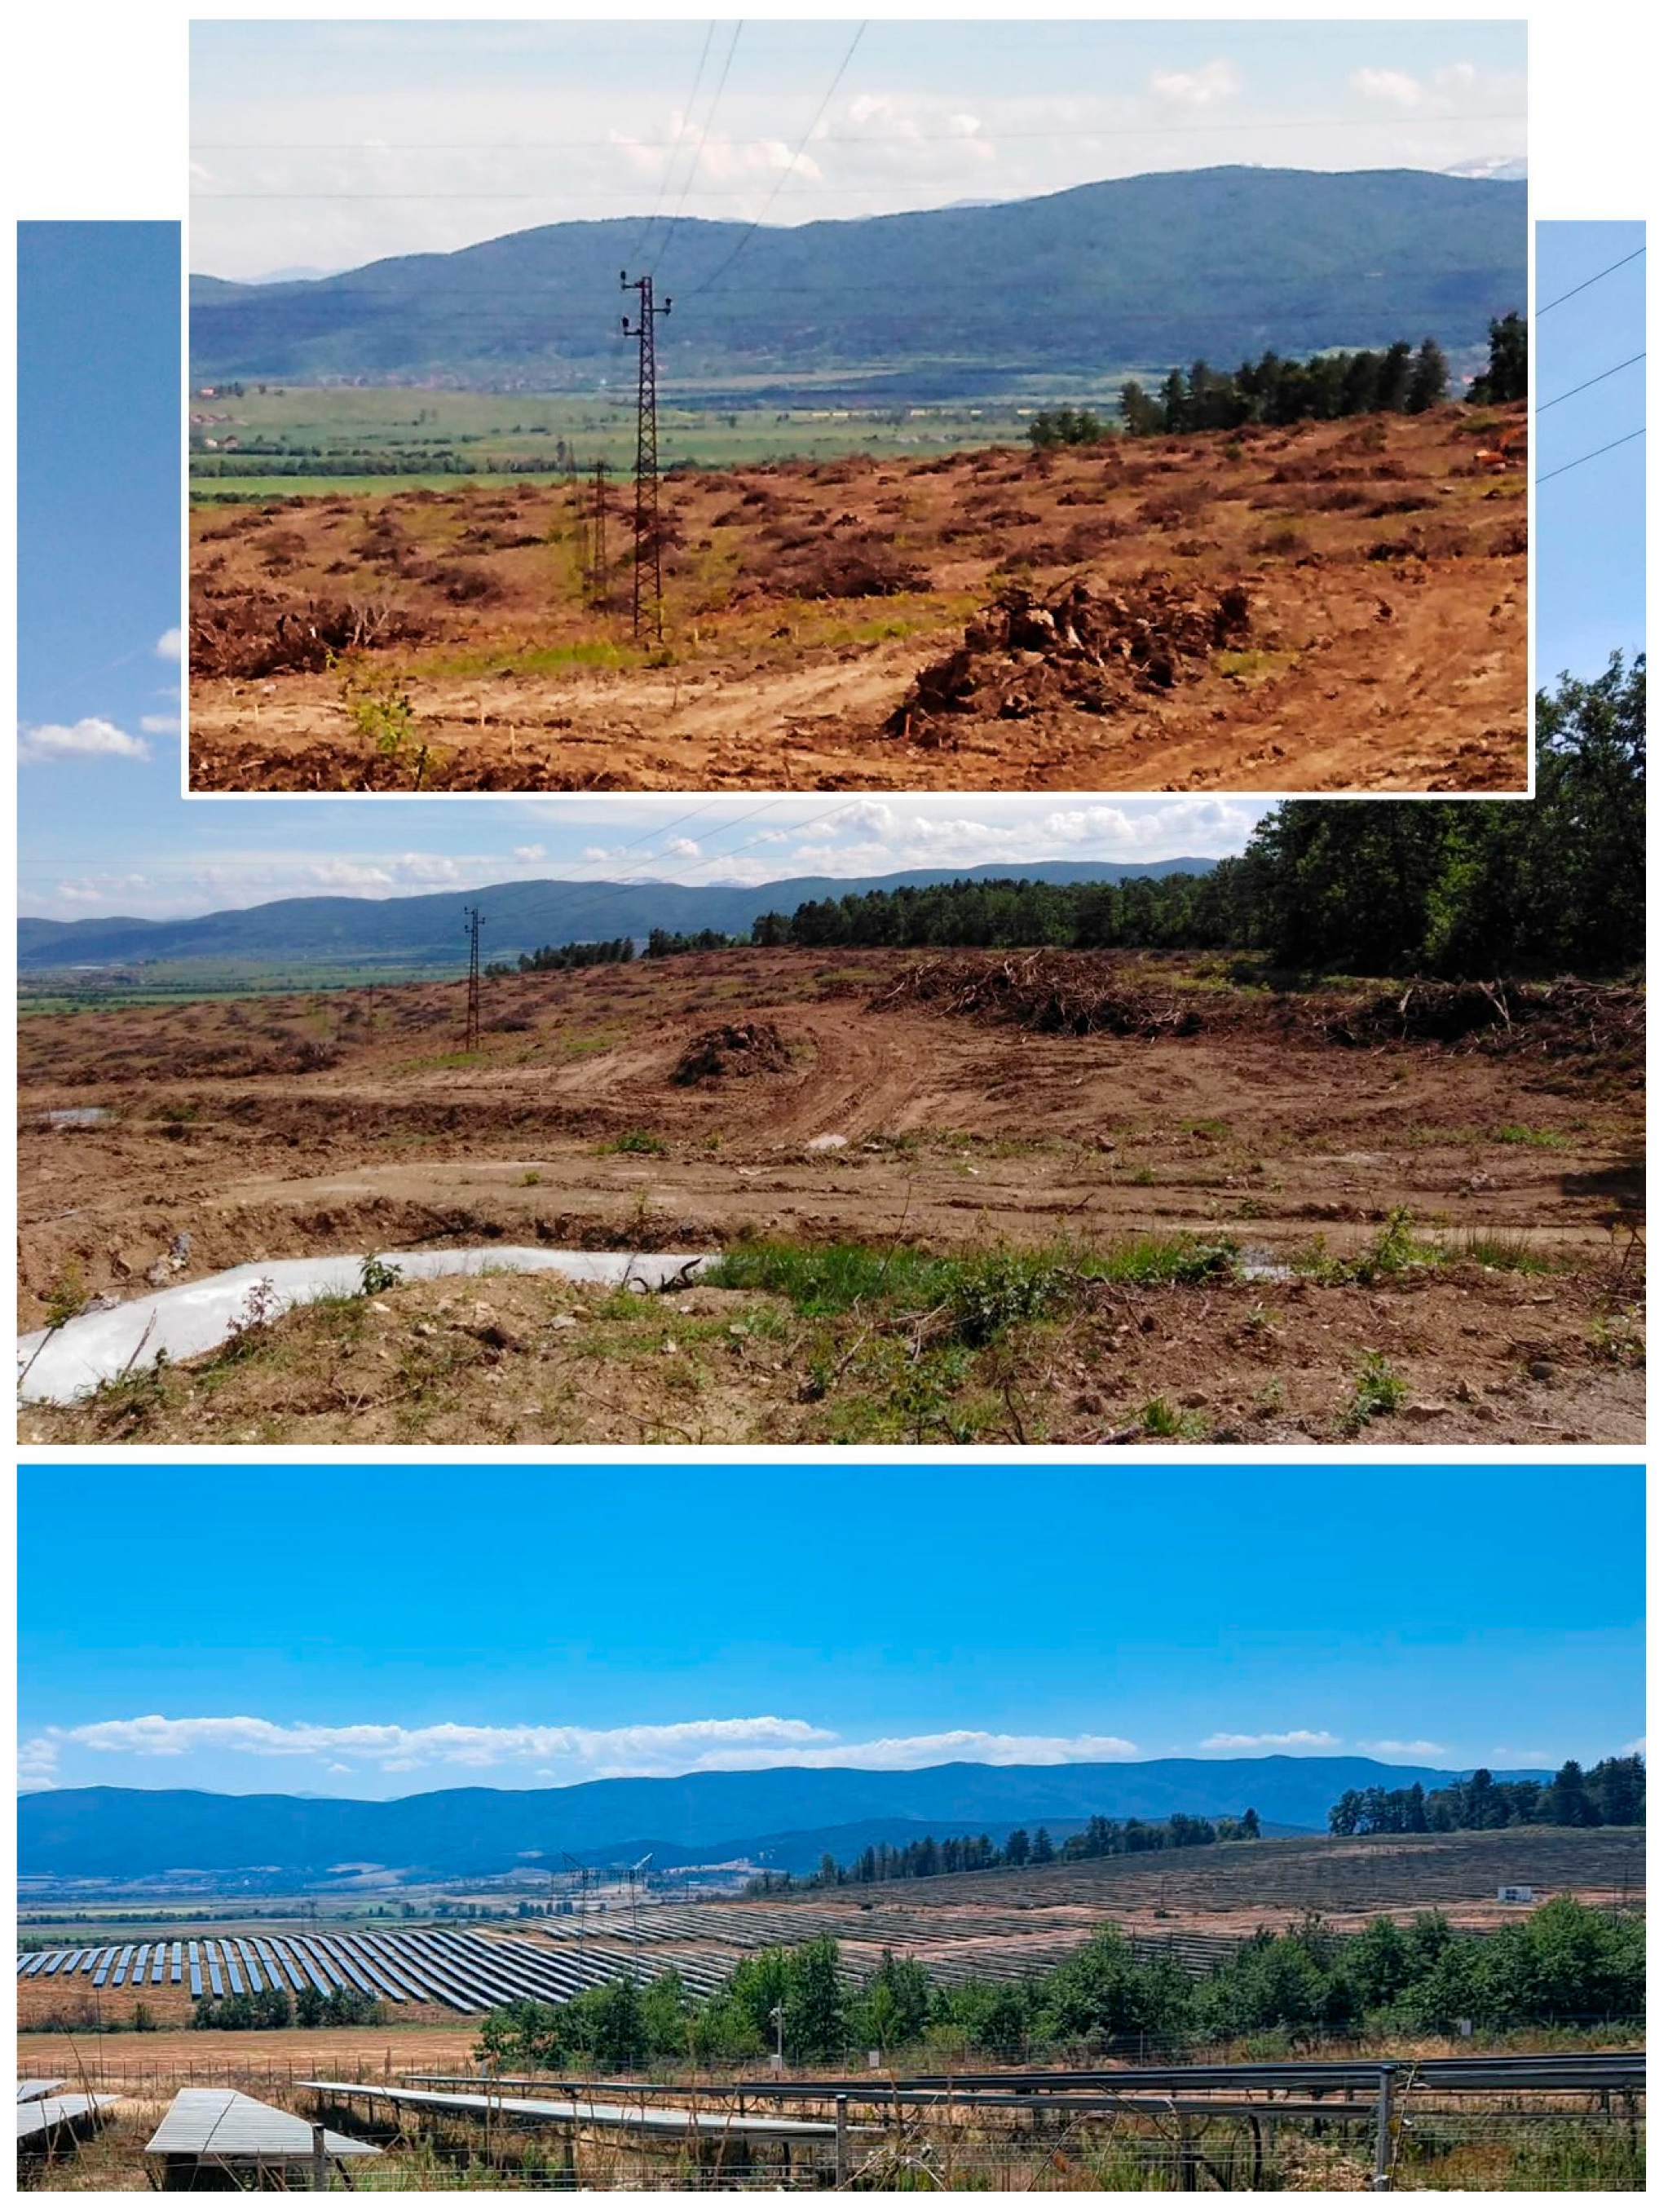

Disclaimer/Publisher’s Note: The statements, opinions and data contained in all publications are solely those of the individual author(s) and contributor(s) and not of MDPI and/or the editor(s). MDPI and/or the editor(s) disclaim responsibility for any injury to people or property resulting from any ideas, methods, instructions or products referred to in the content. |
© 2026 by the authors. Licensee MDPI, Basel, Switzerland. This article is an open access article distributed under the terms and conditions of the Creative Commons Attribution (CC BY) license.