


Abstract
Urban greenways in dense cities face land constraints and changing ecological and social demands. This study develops a process-oriented framework from social–ecological systems (SES) theory and examines it through an explanatory documentary case study of Fukuoka, Japan. Planning and project records and published studies dated 1974–2025 were assessed through theory-guided pattern matching across river corridors, the urban core, and coastal areas. The framework links adaptability, social–ecological coupling, and governance feedback to three proposed mechanisms: spatial resource reorganization, context-dependent value realization, and feedback-enabled adaptation. River-edge reuse, vertical greenery, and phased coastal opening document distinct forms of spatial renewal. Published ACROS studies provide bounded thermal evidence and a later fungal-community observation; comparable service outcomes across the three settings remain unavailable. Public and expert comments can be traced into planning text and indicator design. A supplementary park-design episode also links residents’ requests to a revised scheme for a playground opened in 2025, although individual as-built changes and subsequent benefits are unverified. The case qualifies the framework by distinguishing project change from network completion, service potential from observed outcomes, and design uptake from a completed adaptive cycle.
1. Introduction
Urban growth, climate change, and biodiversity loss place pressure on limited land and existing ecological spaces [1]. In built-up districts, restoration and everyday open space increasingly depend on resources already in place, and green infrastructure (GI) and nature-based solutions (NBS) offer ways to incorporate ecological processes into regeneration and environmental management [2,3]. Greenways connect natural areas, public spaces, and activity nodes through linear landscapes. Research has examined their spatial form and connectivity [4,5], ecological functions [6,7], and recreational use [5,6]. Building on this work, a related question is how existing spaces are reorganized over successive planning periods and how evidence from use and management informs later decisions.
In dense cities, ownership, infrastructure, and competing uses constrain the creation of new corridors. Riversides, roads, parks, and buildings may enter a green network at different times and under different management arrangements, so renewal entails both physical interventions and decisions that respond to changing ecological conditions and public demands. These relationships are especially visible in coastal cities, where river corridors, urban districts, wetlands, and shorelines bring different ecological sensitivities together with flood-risk, access, and development pressures. Such settings offer useful contrasts for examining greenway renewal, although the framework developed here also applies beyond coastal environments.
SES theory offers a way to understand interactions among resources, actors, and institutions, with particular attention to adaptation and feedback [8,9,10]. Work on adaptive and collaborative governance examines coordination and learning [11,12], while urban frameworks show how ecological processes, technologies, social practices, and institutions shape GI outcomes [13,14]. Within these related fields, greenway research addresses network form and multifunctionality [4,5]; Huang et al.’s direct SES application to the Huangyan–Taizhou waterfront greenway shows that planned ecological functions may diverge from everyday use [15]. Urban ES research likewise explains why physical provision does not guarantee benefits, as service realization depends on social, ecological, technological, and institutional conditions [13,16,17]. Governance studies examine collaboration and adaptation [11,12], including an SES application to stormwater GI adoption [18] and a review linking GI governance modes to services and disservices [19]. Because the latter studies focus on related infrastructure rather than greenway renewal itself, the literature supports examining spatial change, outcomes, and decisions together without implying a single sequence common to all greenways.
Taken together, these studies leave open how spatial reorganization, service realization, and governance responses can be traced in relation to one another across planning periods. Ecosystem-service (ES) research distinguishes potential functions from realized benefits: regulating and habitat functions need not depend on visitors, whereas recreational benefits also require access and use [7,13]. SES theory helps explain the conditions that shape these outcomes and how evidence about them may enter later decisions. The contribution here is to bring these established strands into a framework for tracing such links and identifying where the evidence remains incomplete. Fukuoka offers a suitable explanatory setting because its river corridors, dense urban core, and Hakata Bay coast have a long green-space planning record [20,21,22], and its Tenth Basic Plan identifies forest belts, river axes, and coastal green spaces [22]. These contrasting contexts and the long planning record make it possible to trace how renewal unfolds across settings with different spatial and institutional conditions.
Against this background, the study addresses three questions:
How can adaptability, social–ecological coupling, and multi-actor governance in SES theory be translated into analytical dimensions for urban greenway planning?
What changes in spatial organization, ecological and social functions, and governance arrangements can be traced in Fukuoka’s green-space planning and selected projects between 1974 and 2025?
To what extent does the Fukuoka evidence support, qualify, or leave unresolved the proposed mechanisms and their relationships, and what limits can be identified for their application elsewhere?
To answer them, the analysis evaluates three theory-derived propositions against the Fukuoka record. It offers a process-oriented account of greenway renewal and distinguishes the implications of spatial scale, service evidence, and the extent to which feedback enters decisions.
2. Materials and Methods
2.1. Case Selection
An explanatory single-case design is used to trace sequences and assess plausible relationships between propositions and documentary observations [23,24]. Fukuoka offers long-term records and contrasting river, urban, and coastal settings within one municipality. This permits embedded comparison, but cannot isolate governance effects from alternative explanations or establish representativeness across compact cities.
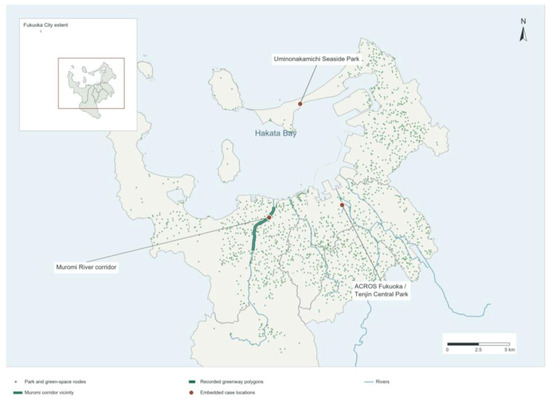
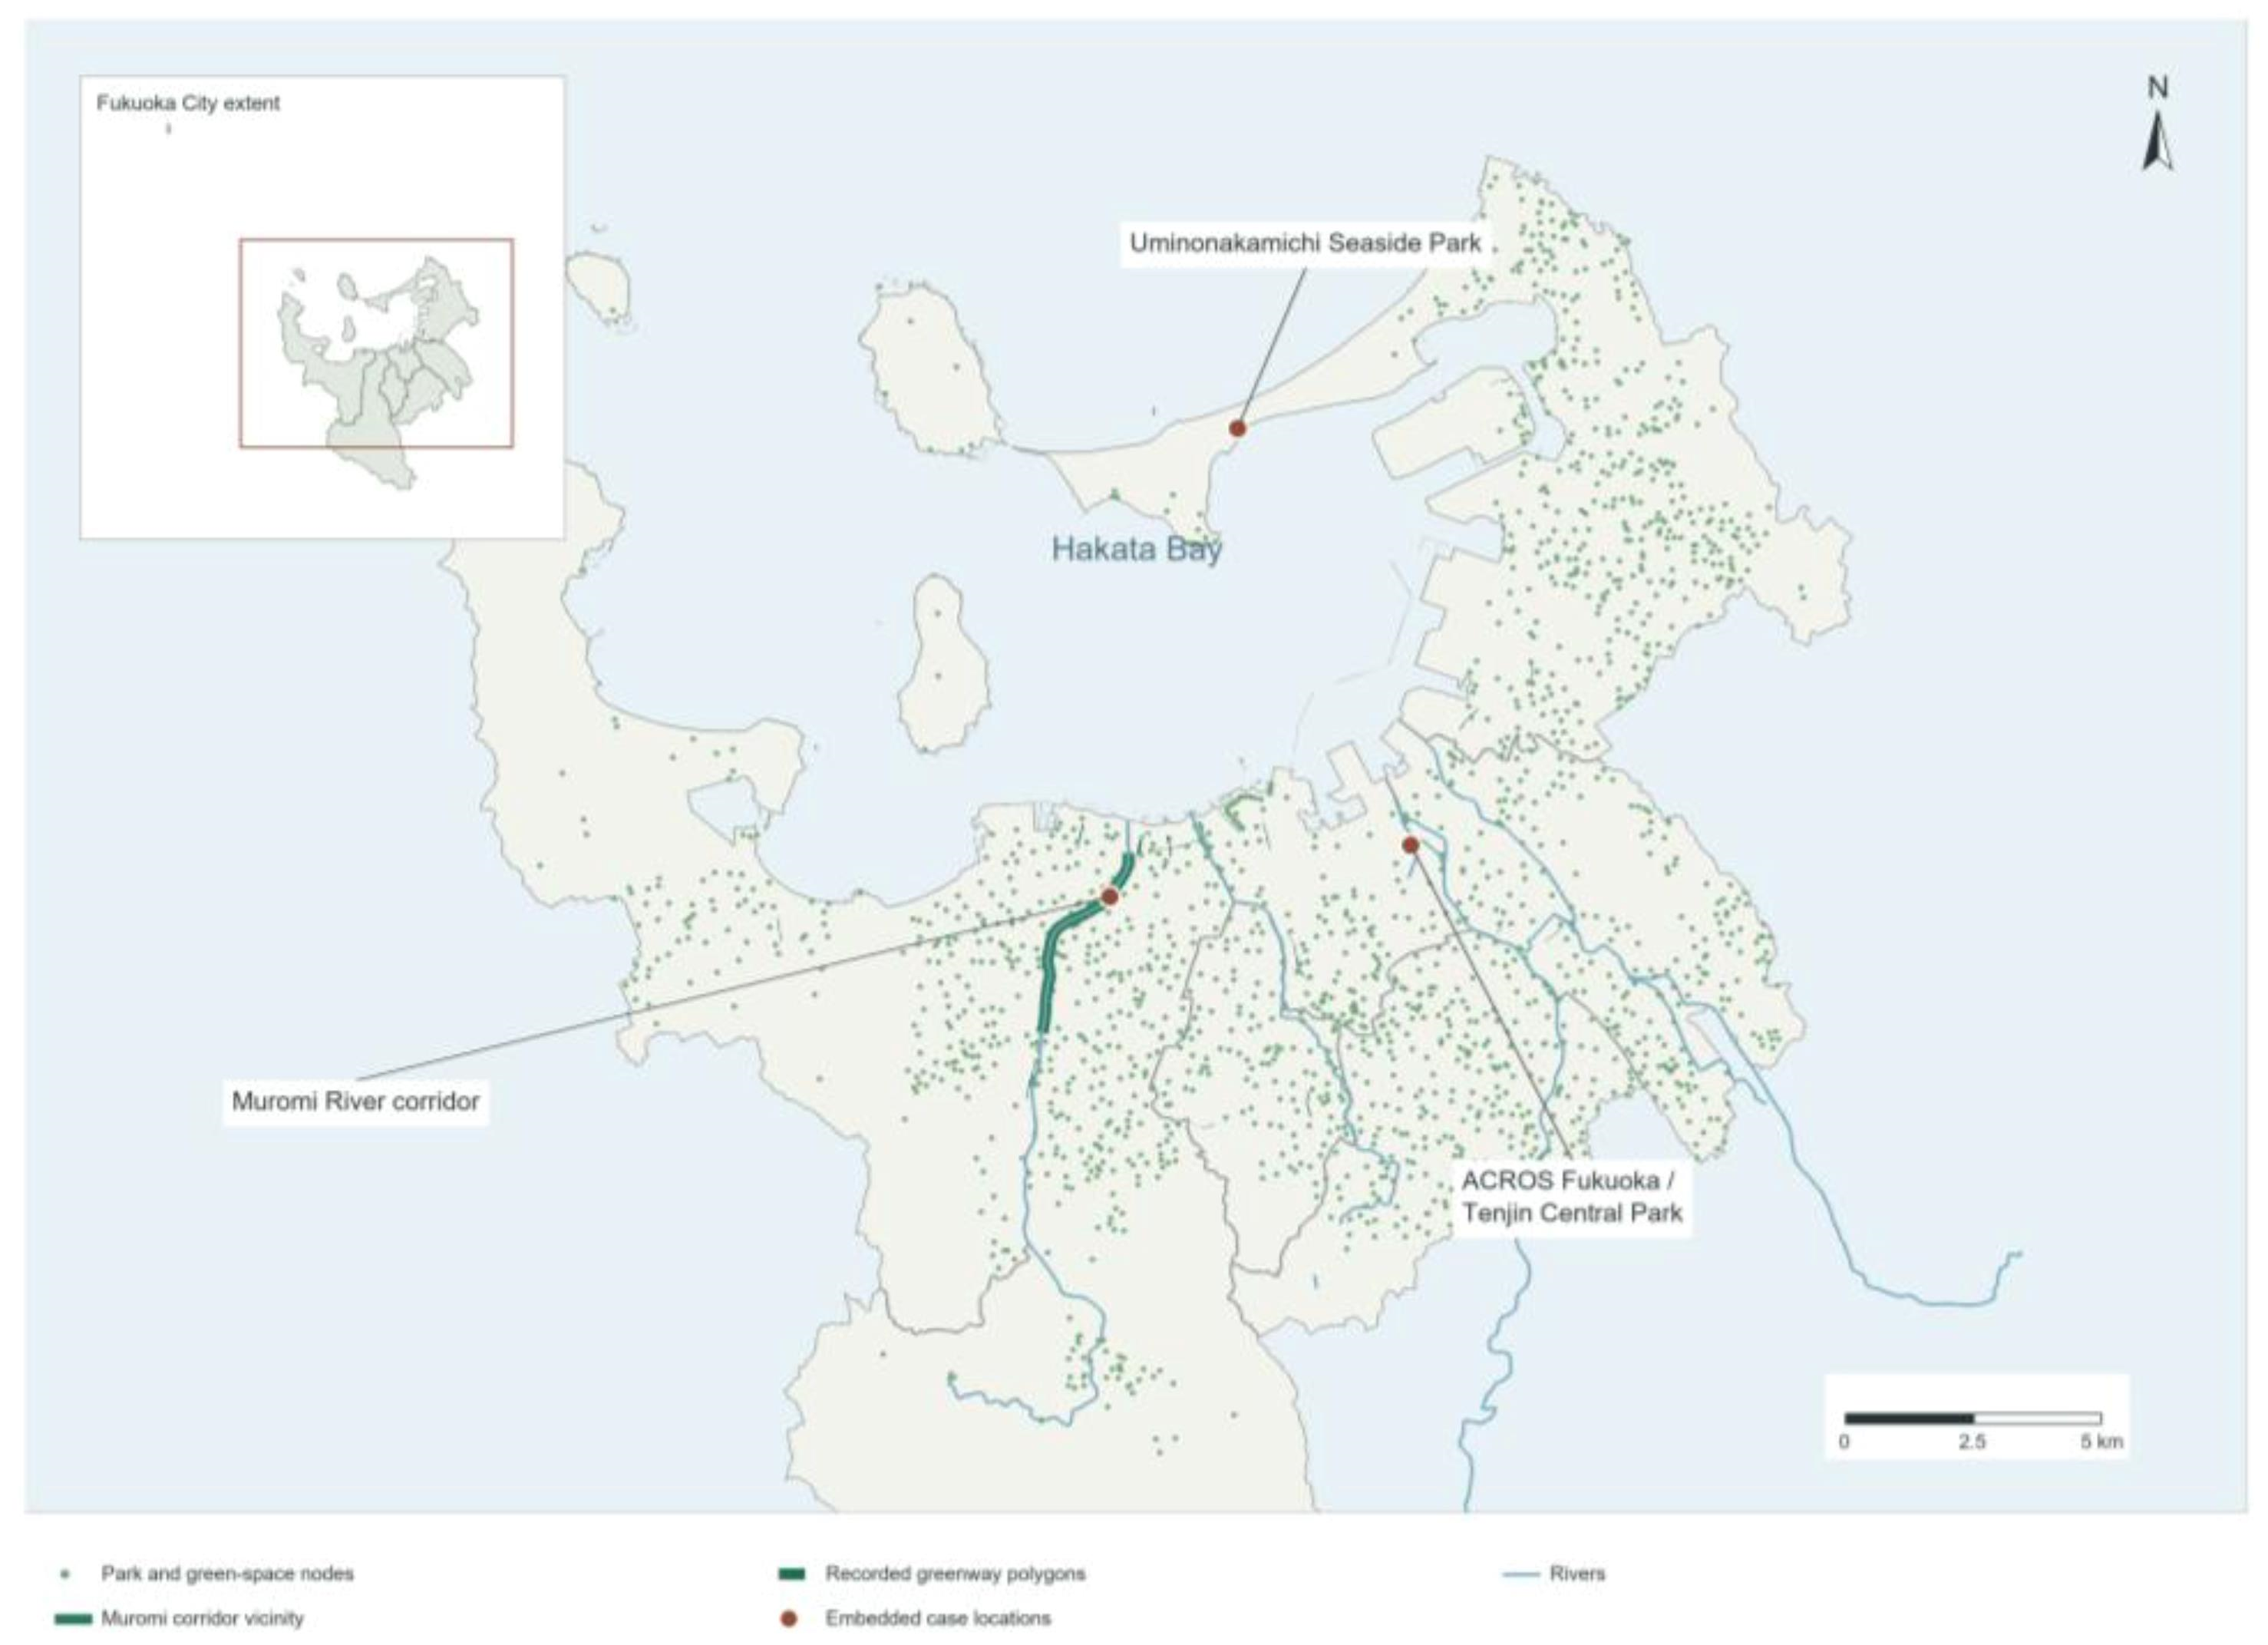
Fukuoka lies in northern Kyushu facing Hakata Bay. Its municipal green structure includes forested uplands, river axes, urban nodes, and the waterfront [21,22]. Figure 1 locates the selected settings within that planning context; it does not establish a continuous route linking them.
Figure 1.
Geographic context, park nodes, and embedded settings of the Fukuoka greenway analysis. Source: Authors’ illustration based on [21,22,25,26,27,28,29,30]. Map provenance and limits are described in Supplementary Section S5.
Selection was informed by the policy sequence beginning with the 1974 ordinance, the contrasting spatial settings, and documented roles for authorities, operators, community groups, and residents. These features allow relationships among intervention, services, and governance to be examined. The predominance of official records nevertheless limits conclusions about actor influence and unreported conflicts. During revision, Seinan Mori-no-Kohan Park was selected as a supplementary governance episode because official records allow residents’ requests, managerial responses, and design decisions to be traced (Table S4; Section 4.4.3). It tests feedback uptake rather than adding a fourth embedded spatial setting. Its evidence does not establish the same feedback chain in the river, ACROS, or coastal settings.
“Fukuoka greenway system” denotes an analytical assemblage of green and blue infrastructure within the city’s planning context. Figure 1 maps 1658 representative park and green-space locations and 26 polygons classified as greenways in the official GIS dataset [28]. The embedded settings are the Muromi River corridor, ACROS Fukuoka adjoining Tenjin Central Park, and Uminonakamichi Seaside Park. ACROS is a green node; the coastal marker locates a park reference point. Rivers represent spatial axes, and the Muromi band indicates corridor vicinity rather than a surveyed path. Distributed park nodes do not establish continuous walking routes or ecological connectivity. The available data do not provide a verified inventory distinguishing all existing links, planned alignments, and gaps; unknown continuity is retained as a data limitation.
2.2. Methodological Framework
The study combines documentary analysis with theory-guided pattern matching. P1–P3 supply questions rather than predetermined findings. During revision, the source register, observable components, and claim-level judgments were made explicit through targeted source verification; this did not retrospectively create a formal coding study.
The assessment identifies relevant sources, extracts dated observations and their locations, compares municipal, project, and governance evidence, and assesses the support for each proposition component. Contrary observations and missing links are retained. The three levels are summarized in Table 1.
Table 1.
Multi-level Case Analysis Framework.
Links between levels require separate evidence. A policy may guide a project, but ecological or social effects require observation, and consultation requires a linked decision before it counts as adaptation. Incomplete sequences are identified rather than filled by inference.
Pattern matching distinguishes planned axes from built segments (P1), design potential from observed or modeled services and perceptions (P2), and feedback receipt from changes to text, design, implementation, and outcomes (P3). Evidence is classified as documented, qualified, or insufficient at the component level (Section 2.4), not as proof of an entire causal mechanism [23,31].
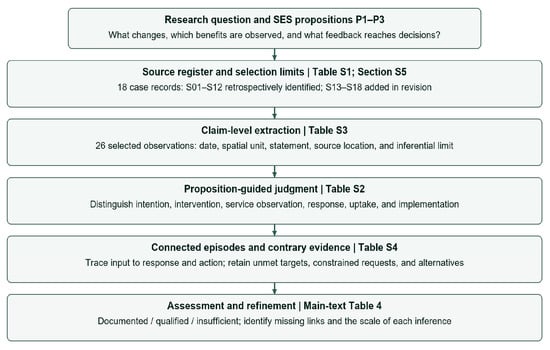
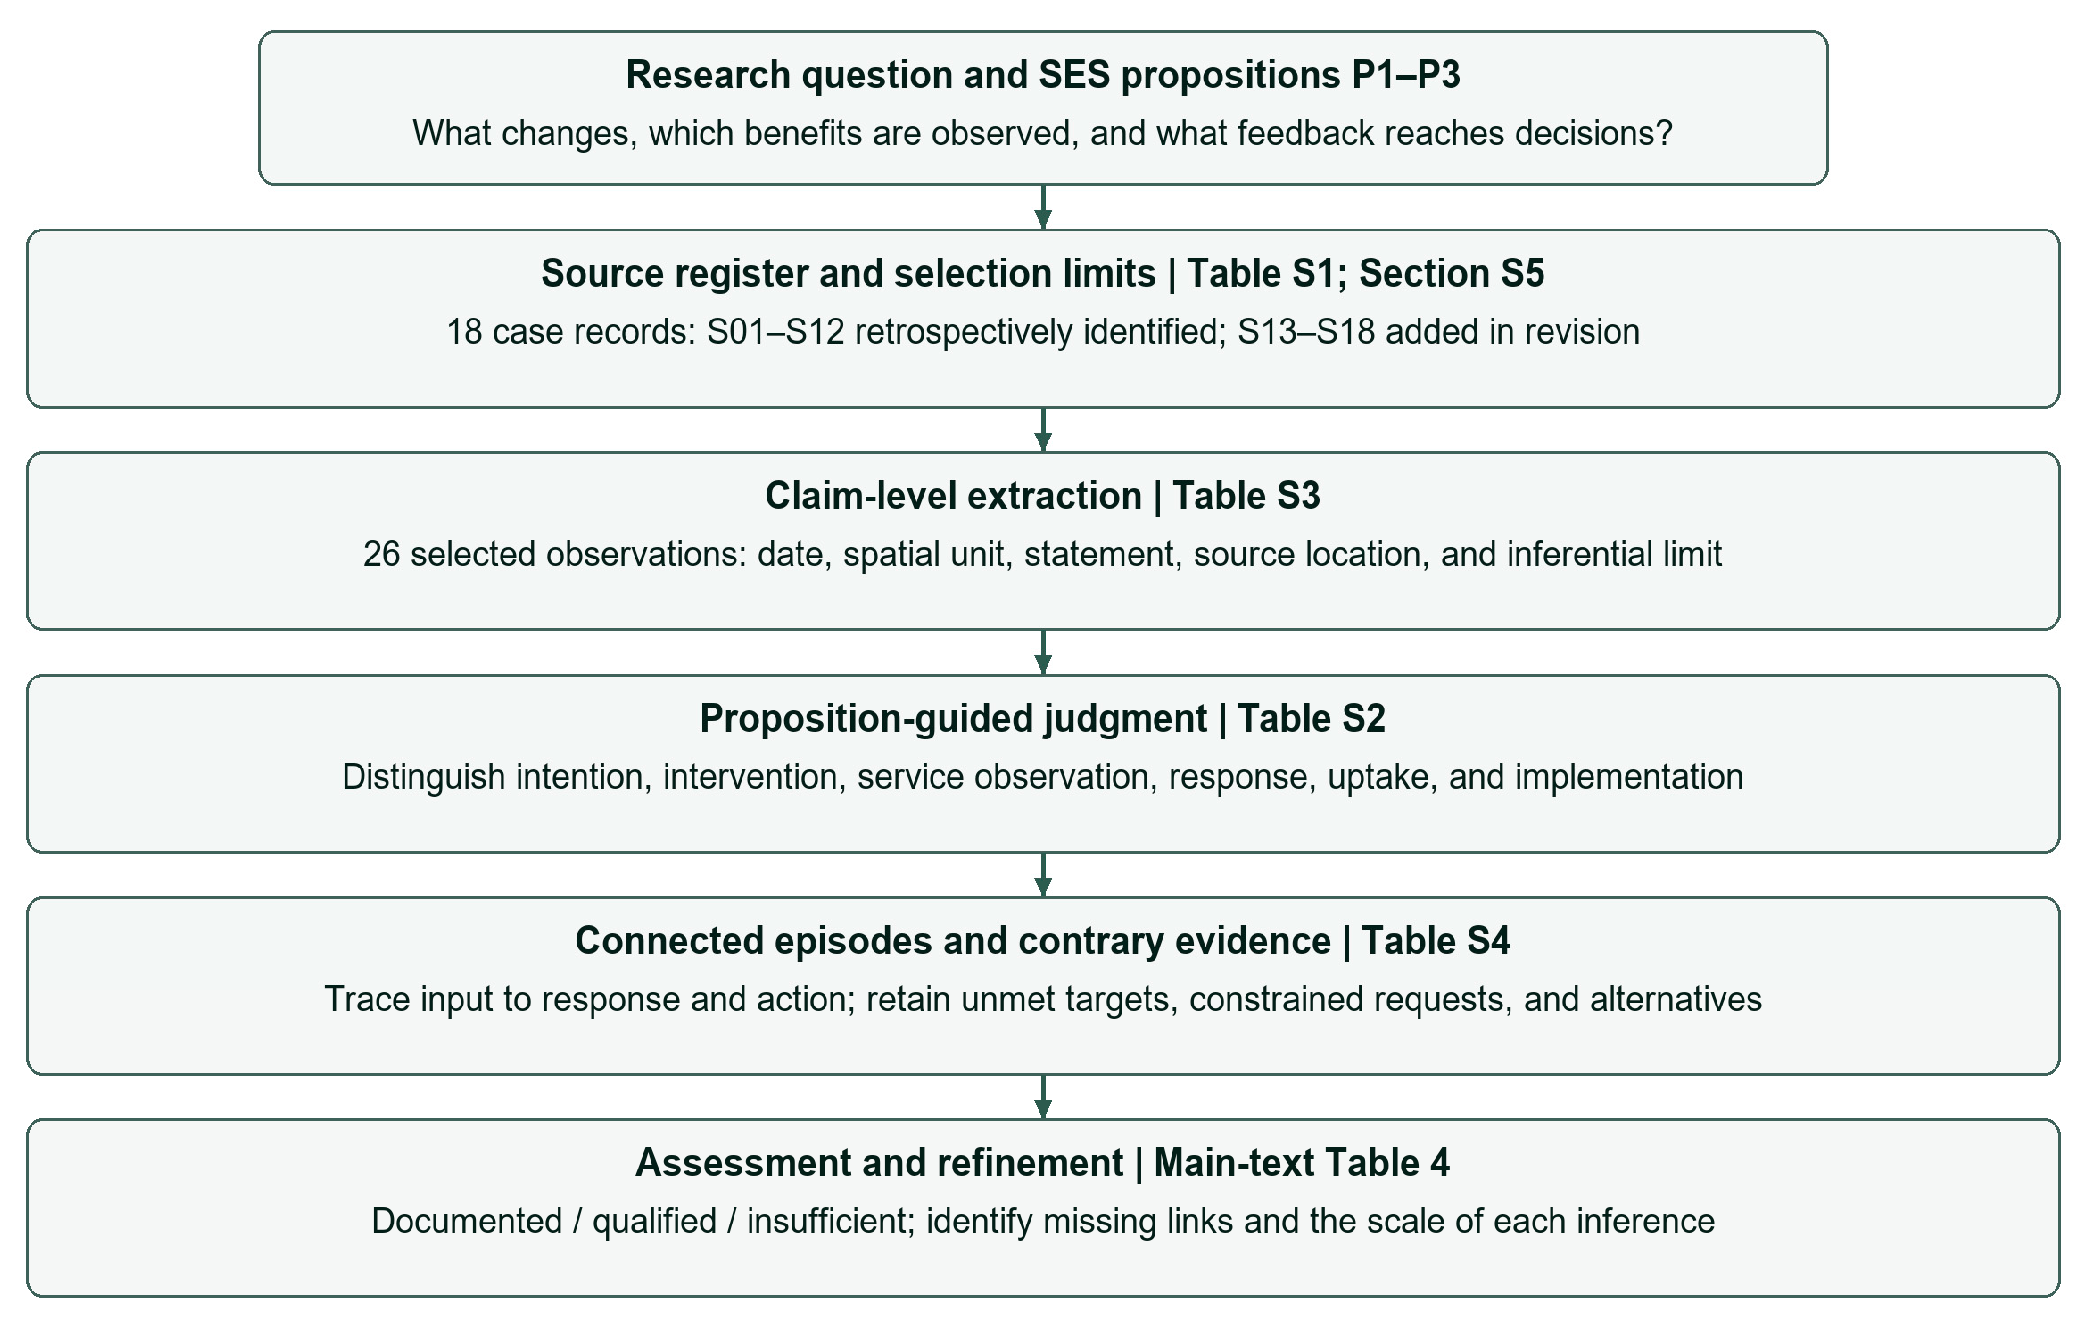
Figure 2 links the source register, observation records, and judgment rules to the proposition-guided assessment.
Figure 2.
Evidence pathway for the theory-guided case analysis. Supplementary Tables S1–S4 disclose the sources, decision rules, selected observations, and connected episodes used to assess P1–P3. Source: Authors’ illustration.
2.3. Data Sources
The authors retrospectively identify S1–S12, together with the literature cited in the original submission, as the material base used in the original study. The same 12 case records were retained in the preceding revision check; their presence in that register is not itself evidence of when they were first obtained or analyzed. Original bibliography membership and retrospective author identification are distinguished in the Source register worksheet of Supplementary_Research_Records.xlsx. No contemporaneous search log, exclusion tally, formal coding protocol, or document-level analyst record is available to reconstruct acquisition and use. The present revision adds six focused case records (S13–S18): two ACROS studies and four municipal inclusive-playground records. Table S1 lists all 18 case records by title, issuer, version, link, and evidentiary role. The inventory covers all 58 final numbered references and identifies overlap with Table S1. Case records and bibliography entries are not added together as independent counts (Table 2).
Table 2.
Research Materials and Their Analytical Uses.
The case chronology covers 1974–2025. Revision verification followed supplied plans, cited URLs, official site navigation, and journal DOI routes; Section S5 and the accompanying logs record the actual queries, access dates, candidates, and inclusion or exclusion decisions from this check. These records describe revision work in October 2026, not an original search history. A case record was retained if its issuer and version or access date were identifiable, its relevant statement could be located, and it informed spatial intervention, service observation, or governance response. Duplicate and metadata pages were not treated as independent evidence. The 1999 and 2009 planning stages are reported through the 2025 plan; their full texts were not compared.
For each retained record, the register records provenance, date, location, spatial setting, observation, and inferential limit. Statements are compared against P1–P3 as intentions, interventions, service observations, perceptions, or decision responses. Tables S1–S4 and the retrieval logs allow readers to repeat this revision-stage check. They cannot recreate undocumented original screening or establish independent coding reliability.
Institutional origin is recorded to assess dependence. The municipal plans, committee responses, public-comment register, and park-workshop records belong to related city processes [21,22,32,33,34,35,36,37]. Operator pages are likewise related accounts. Journal studies use different methods but are not presumed institutionally independent. Repeated official statements do not count as separate outcome measurements; conflicting or missing evidence is retained.
2.4. Evidence Extraction and Proposition-Guided Assessment
Table S3 contains 26 selected observations (E01–E26) drawn from 18 case records (S01–S18). An entry may be a dated intervention, indicator, service observation, or response. These entries target disputed claims and contrary evidence; they are not exhaustive passage counts or the product of line-by-line coding. The literature and cartographic datasets are identified separately in the corpus inventory.
“Documented” means an event or indicator can be located in a dated source. “Qualified” means relevant evidence is limited by scale, dependence, conflicting information, or an incomplete sequence. “Insufficient” means the observation needed for a proposed link was not located. These are reading rules, not numerical confidence levels. Unmet targets and rejected comments are retained as observations against an assumption of consistent improvement; no preregistered negative-test procedure is claimed.
Selected Ostrom SES variables [9] guide extraction: size and location (RS3, RS9), facilities (RS4), organizations (GS1, GS2), operational and collective-choice rules (GS5, GS6), monitoring (GS8), deliberation (I3), and social/ecological performance (O1, O2). IAD adds attention to who can decide, under which rules, and with what information [38]. Adaptation research distinguishes operational adjustment from reconsideration of goals or governance arrangements [39]. These concepts inform documentary questions, not a complete measurement of either framework. A reply establishes response; a matching amendment establishes text or design uptake. Implementation needs dated work evidence, and outcome improvement requires further observation. Intervention thresholds were neither measured nor negotiated with stakeholders in this study.
Connected episodes are traced only within a shared site or decision process. Table S4 compares their observed endpoints with competing explanations. For example, the city’s perceived-greenery shortfall and committee discussions can be followed into monitoring design [21,33]; park-workshop inputs can be followed into a revised design and a later opening record [35,36,37]. Neither sequence is treated as proof that measured ecological benefits drove a subsequent intervention.
3. SES-Based Theoretical and Analytical Framework
3.1. Core Concepts of Social–Ecological Systems
SES theory treats societies and ecosystems as interacting components [8,9,40]. Land use, institutions, and behavior alter ecological conditions, while environmental risks and changing needs may prompt social responses. For greenway renewal, three concepts provide the basis for the propositions below.
The central concern of SES theory is not simply to classify social and ecological elements, but to explain how their coupling, feedback, and adaptation generate long-term evolutionary processes. In the context of urban GI research, the core ideas of SES theory are summarized here in three dimensions.
Adaptability concerns actors’ capacity to adjust resources, institutions, and actions under change; resilience concerns maintenance of core functions through disturbance [10,41]. Adjustment can span site design, management, and longer planning periods. Incremental construction alone therefore does not establish adaptation or resilience.
Social–ecological coupling concerns the interactions through which ecological conditions, technologies, institutions, and activities shape functions and benefits [8,13,14]. Similar resources can yield different values under different access and management conditions.
Governance feedback concerns whether information from monitoring, use, or conflict enters a subsequent decision [11,12]. Multiple participants may contribute information or maintenance without sharing authority. The analysis therefore distinguishes collaboration arrangements, response, and demonstrated adjustment.
3.2. Linking SES Theory with Greenway Planning
Greenways are considered here as social–ecological infrastructure whose development depends on four interacting groups of elements.
These are ecological and spatial resources (rivers, forests, coasts, roads, parks, and buildings); institutions governing planning, investment, and maintenance; public, private, and community actors; and their interactions and outcomes, including use, conflict, services, and learning.
ES provides a way to describe regulating, habitat, and cultural functions, while SES explains the conditions under which services may be realized and inform later action [7,16,42].
Potential functions do not guarantee benefits. Habitat condition, access, suitable facilities, and conservation–use trade-offs must be examined at an appropriate scale [16,17]. Service provision, beneficiaries, and governance response are therefore assessed separately.
3.3. Analytical Framework: Three Interrelated Mechanisms
The framework translates SES concepts into three proposed mechanisms: spatial resource reorganization, context-dependent value realization, and feedback-enabled adaptation. Developed from theory, these relationships are assessed and refined through the Fukuoka case.
3.3.1. Adaptive Reorganization and Incremental Renewal
Adaptive reorganization means reconfiguring existing resources in response to land constraints and changing demands. Riverbanks, parks, buildings, and coastal land may be renewed through successive interventions. Incremental renewal describes spatial change over time, not project size alone.
Proposition 1.
Under constrained land supply, the reorganization of existing social–ecological resources can sustain greenway renewal through successive interventions. Its importance relative to new expansion requires separate evidence.
3.3.2. Social–Ecological Coupling and Ecological Integration
Social–ecological coupling concerns how ecological processes, urban functions, and activities shape the value of reorganized spaces. Physical connection can contribute, but benefits depend on habitat quality, flood safety, access, and accommodated uses.
Ecological integration denotes the coordination of dispersed resources and functions to support ecological processes and social needs. Priorities differ across rivers, the urban core, and the coast; integration does not require maximizing every function at every site.
Regulating and habitat functions may operate without recreational visits. Cultural benefits also depend on access and experience. For either pathway, suitable design conditions must be distinguished from service observations and demonstrated benefits.
Proposition 2.
The integrated value of greenways does not arise solely from physical spatial connectivity, but from the continuous coupling of ecological processes, urban functions, and social use.
3.3.3. Multi-Actor Collaboration and Feedback-Enabled Adaptation
Collaboration provides arrangements for coordinating responsibilities, goals, and information across agencies, operators, and communities [12,19]. Feedback-enabled adaptation requires evidence that information enters a subsequent decision; participation counts alone cannot establish it.
Proposition 3.
Multi-actor participation can provide an institutional basis for the long-term operation of greenways only when stable coordination mechanisms and feedback learning enable participation to be translated into adaptive adjustment.
Responsiveness and shared authority are assessed separately. A government-led process may adopt feedback without distributing decision rights equally.
3.4. Integrated Framework and Analytical Logic
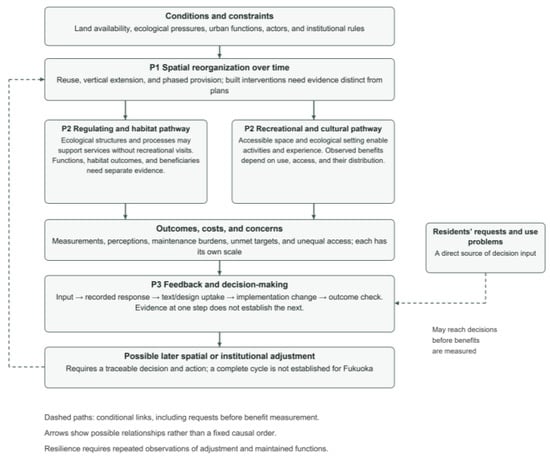
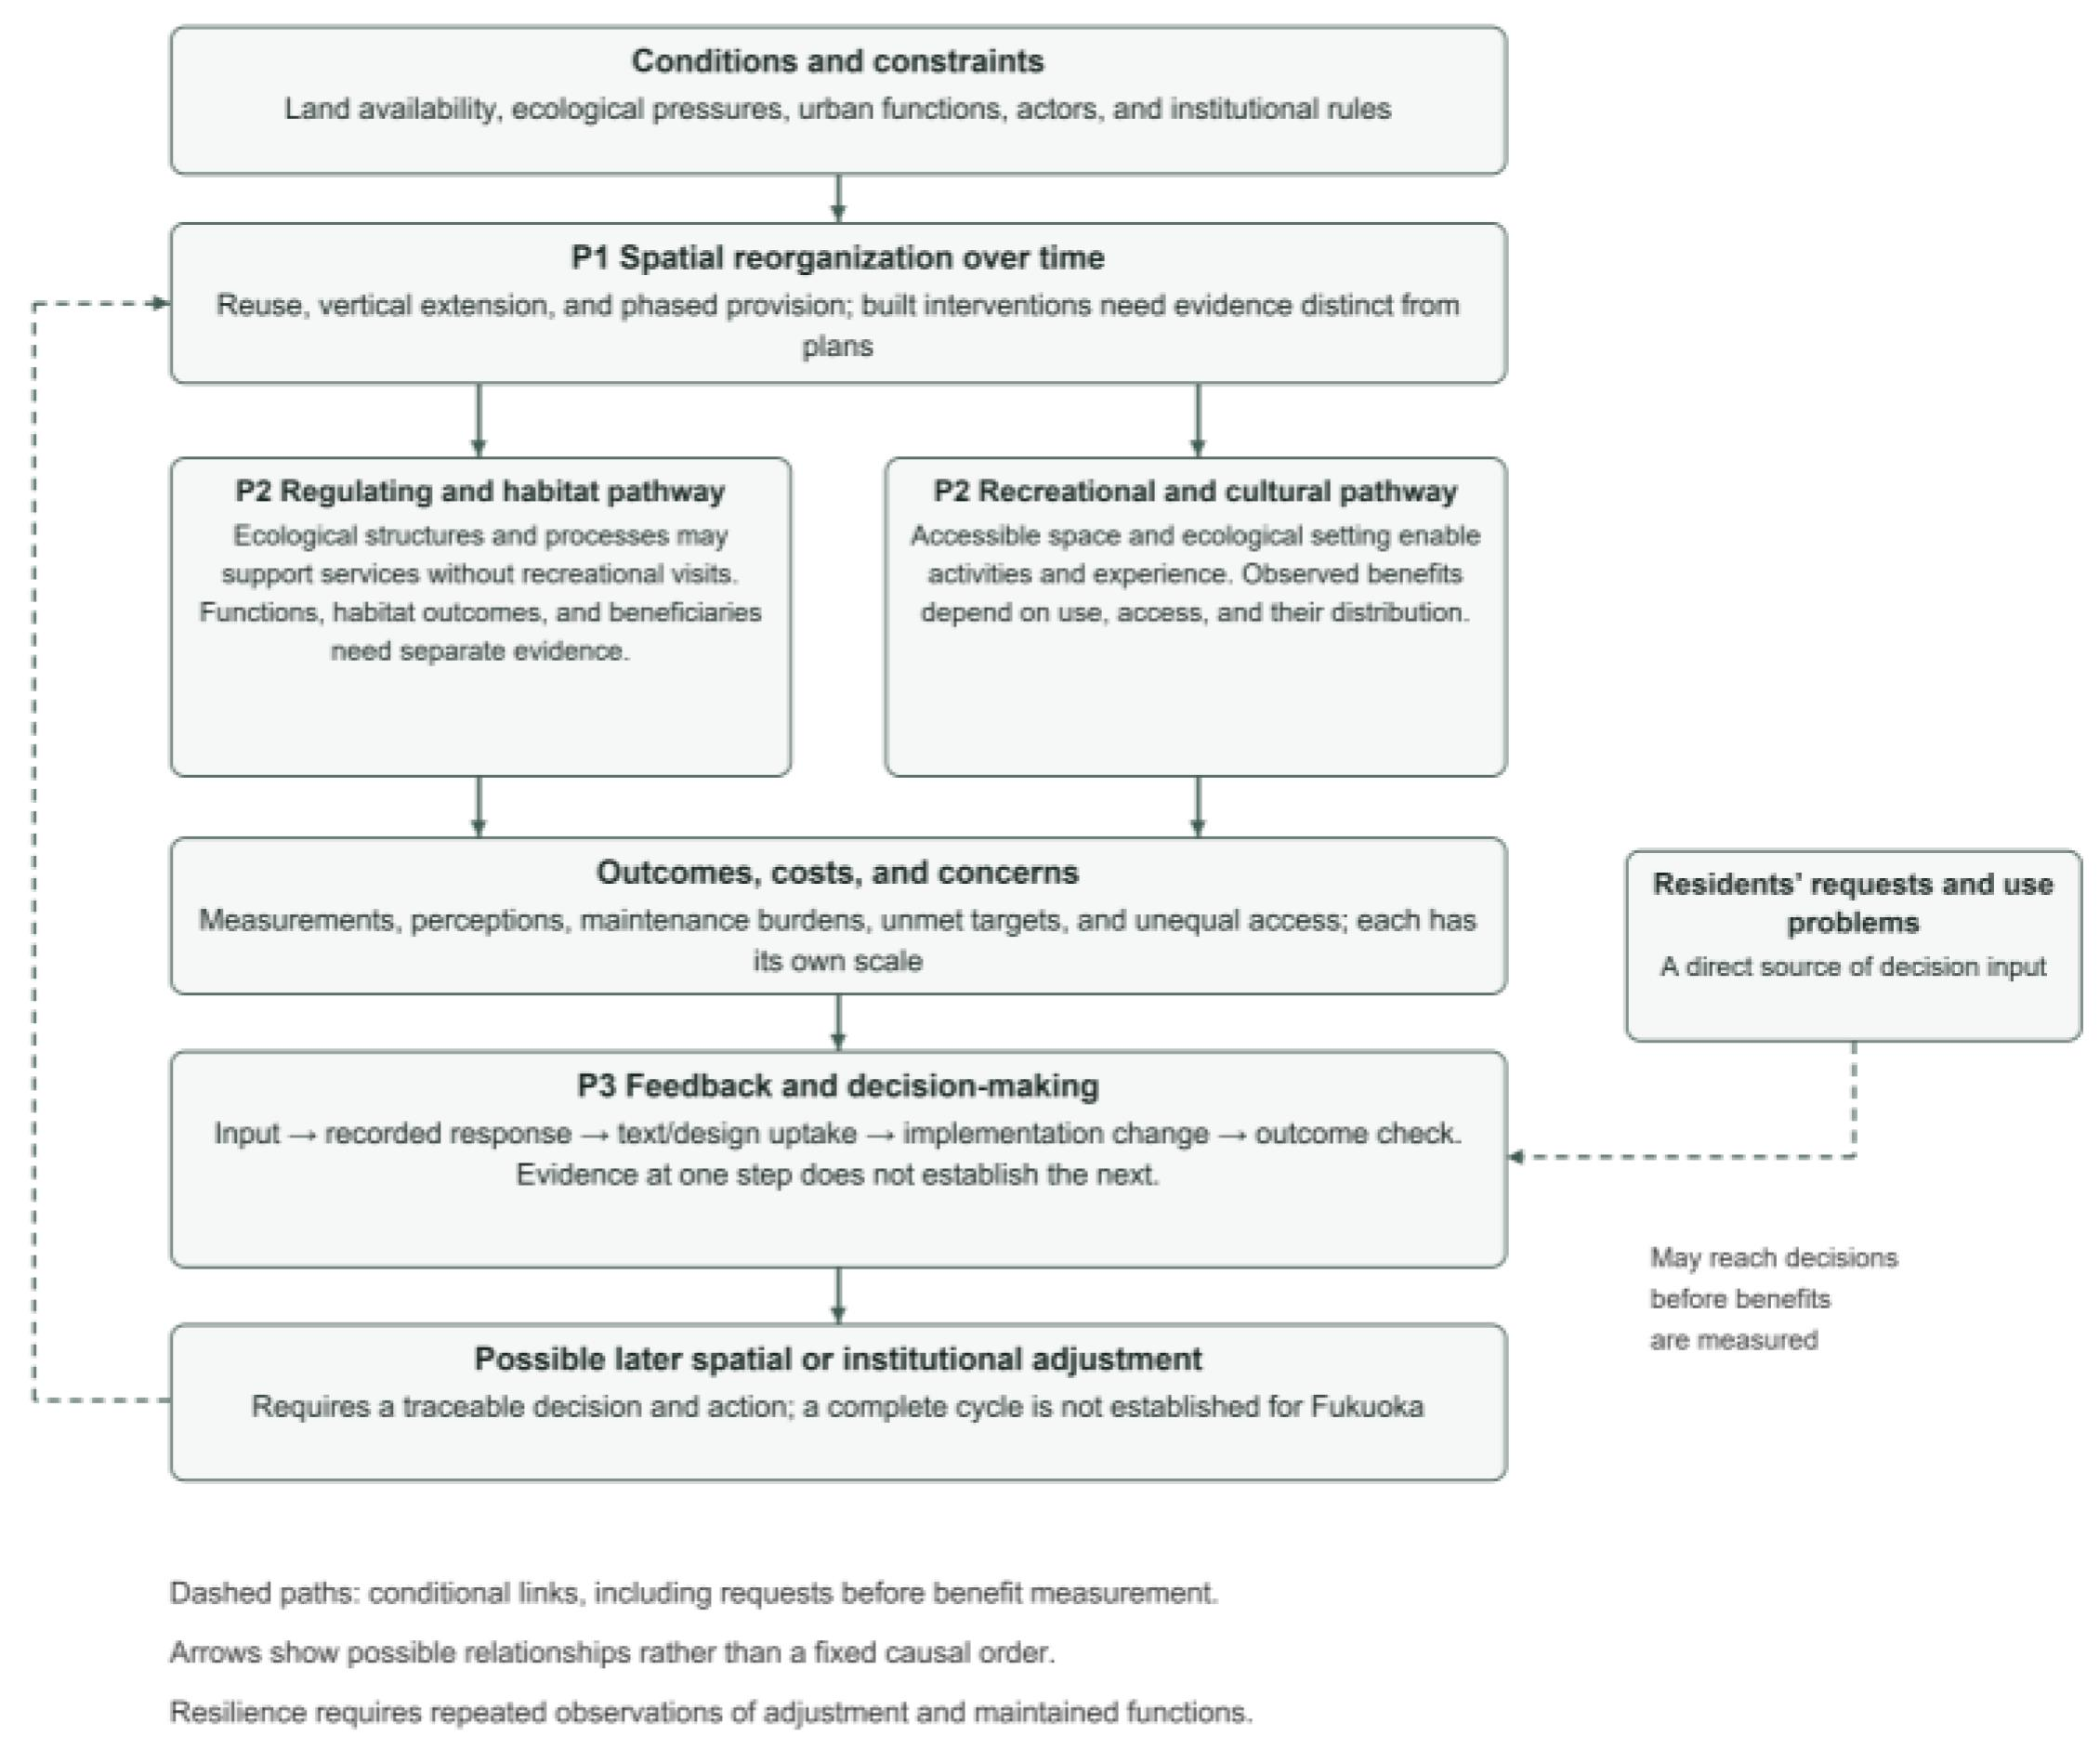
The mechanisms operate at different levels: reorganization alters spatial conditions; ecological processes and use shape service realization; and governance may translate observations or conflicts into decisions. Feedback can return to spatial change, but only where decision and action records establish that link. This is a conditional relationship rather than a compulsory sequence. A request may precede redesign before benefits are measured, and an intervention may produce a service without generating later adjustment. The assessment tests these partial links rather than assuming a completed cycle; Supplementary Table S4 records the relevant episodes.
Figure 3 summarizes these relationships and separates the pathways through which regulating, habitat, and cultural services may be realized.
Figure 3.
Proposed relationships among spatial reorganization, service realization, and feedback-enabled adaptation. Regulating and habitat functions may occur without recreational use; realized benefits require appropriate evidence. Residents’ requests or use problems may enter decisions before benefits are measured and lead to text/design uptake. Dashed paths indicate conditional relationships; the case establishes partial links, not a fixed sequence or a complete renewal cycle. Source: Authors’ illustration.
Repeated adjustment may contribute to resilience, but demonstrating this capacity requires observations of core functions across disturbances and responses. The framework itself does not establish a resilient outcome (Table 3).
Table 3.
Analytical Framework for Continuous Greenway Renewal Based on SES Theory.
The Results section assesses the propositions in sequence and then examines the available links among them, considering documented observations, qualifications, and missing steps. Supplementary Table S4 records the connected episodes and competing explanations.
4. Results: Case-Based Assessment of the Analytical Framework
4.1. Long-Term Evolution and Spatial Foundation of Fukuoka’s Greenway System
Fukuoka’s planning term midori covers forests, farmland, water edges, parks, and planting on public and private land. The selected corridors and nodes are examined as elements of this broader structure [21,22]; “greenway system” is the article’s analytical term, as defined in Section 2.1.
The greening ordinance took effect on 1 April 1974. Its consolidated text assigns responsibilities to the city, residents, and businesses [43]. The adoption date establishes an institutional starting point, but current provisions cannot all be assigned to 1974 without historical versions.
Green Basic Plans were adopted in 1999 and 2009 and replaced by the 2025–2034 plan, which incorporates climate adaptation, biodiversity, well-being, and GI [21].
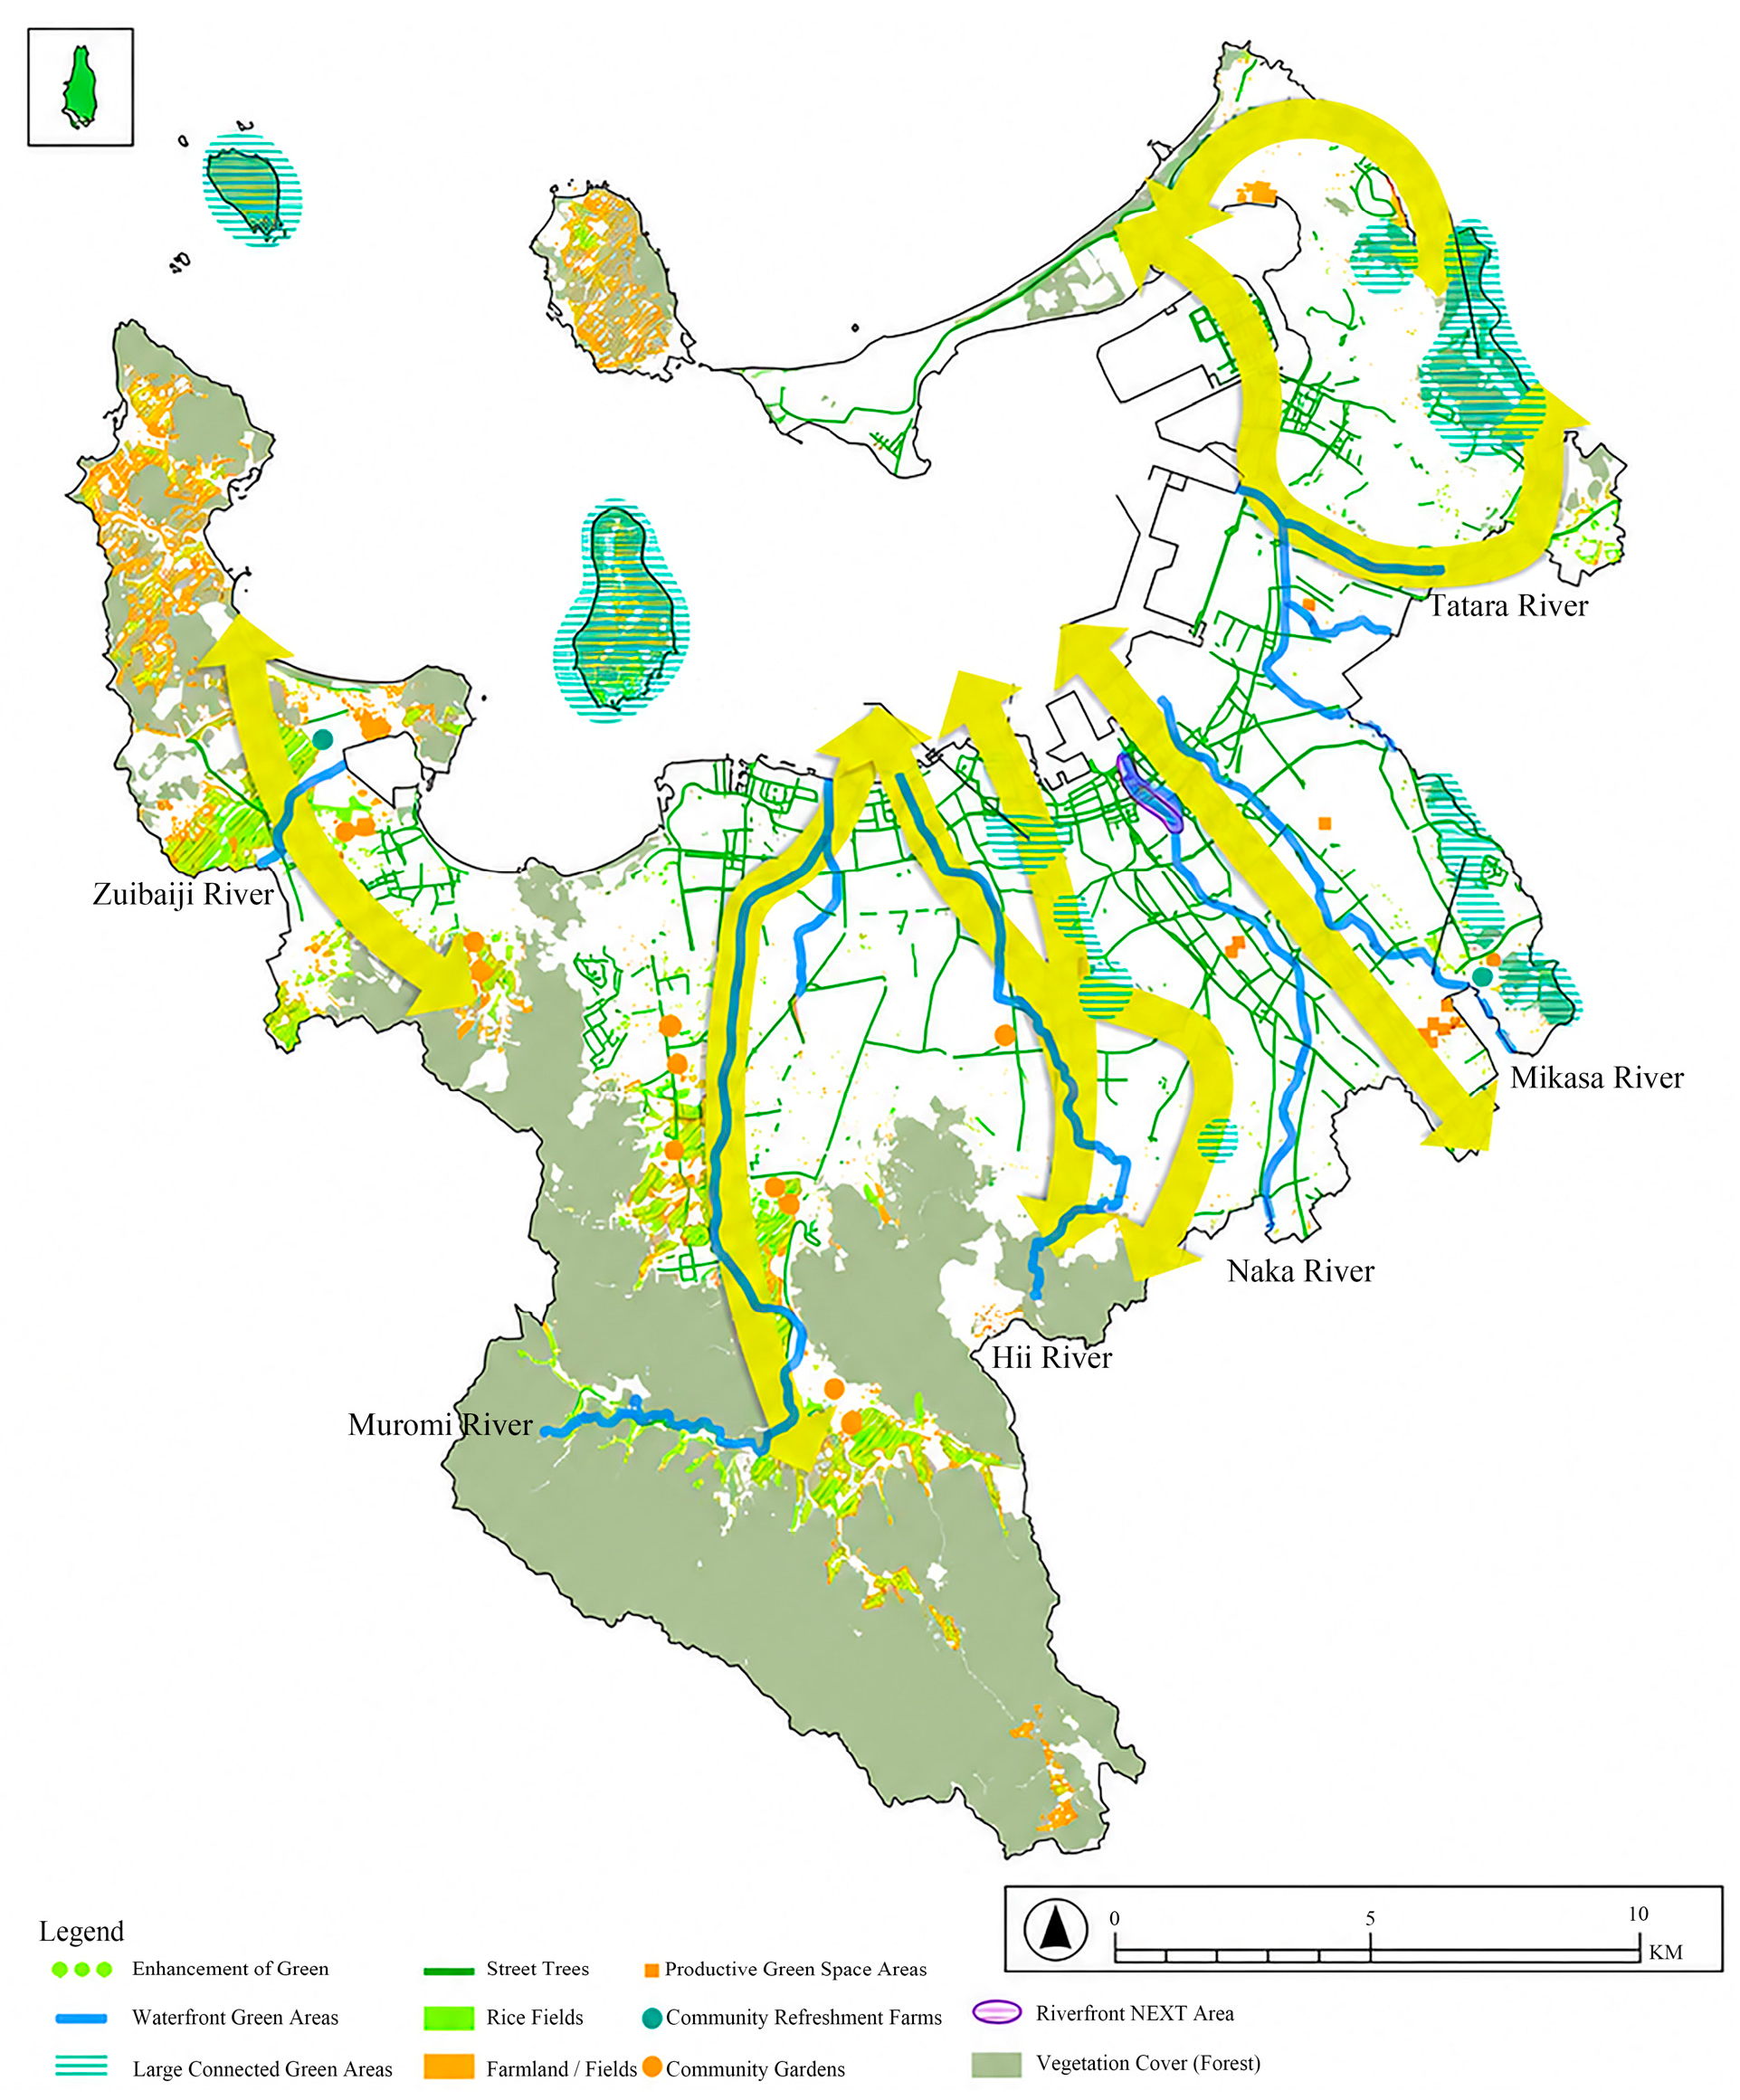
The Tenth Basic Plan identifies forest belts, river axes, and a Hakata Bay waterfront zone [22]. The 2025 Green Basic Plan proposes mountain-to-sea green routes through rivers, street trees, and other spaces [21]. These are network intentions, not a complete inventory of built links.
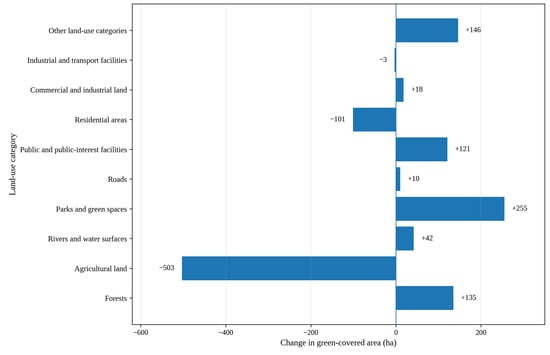
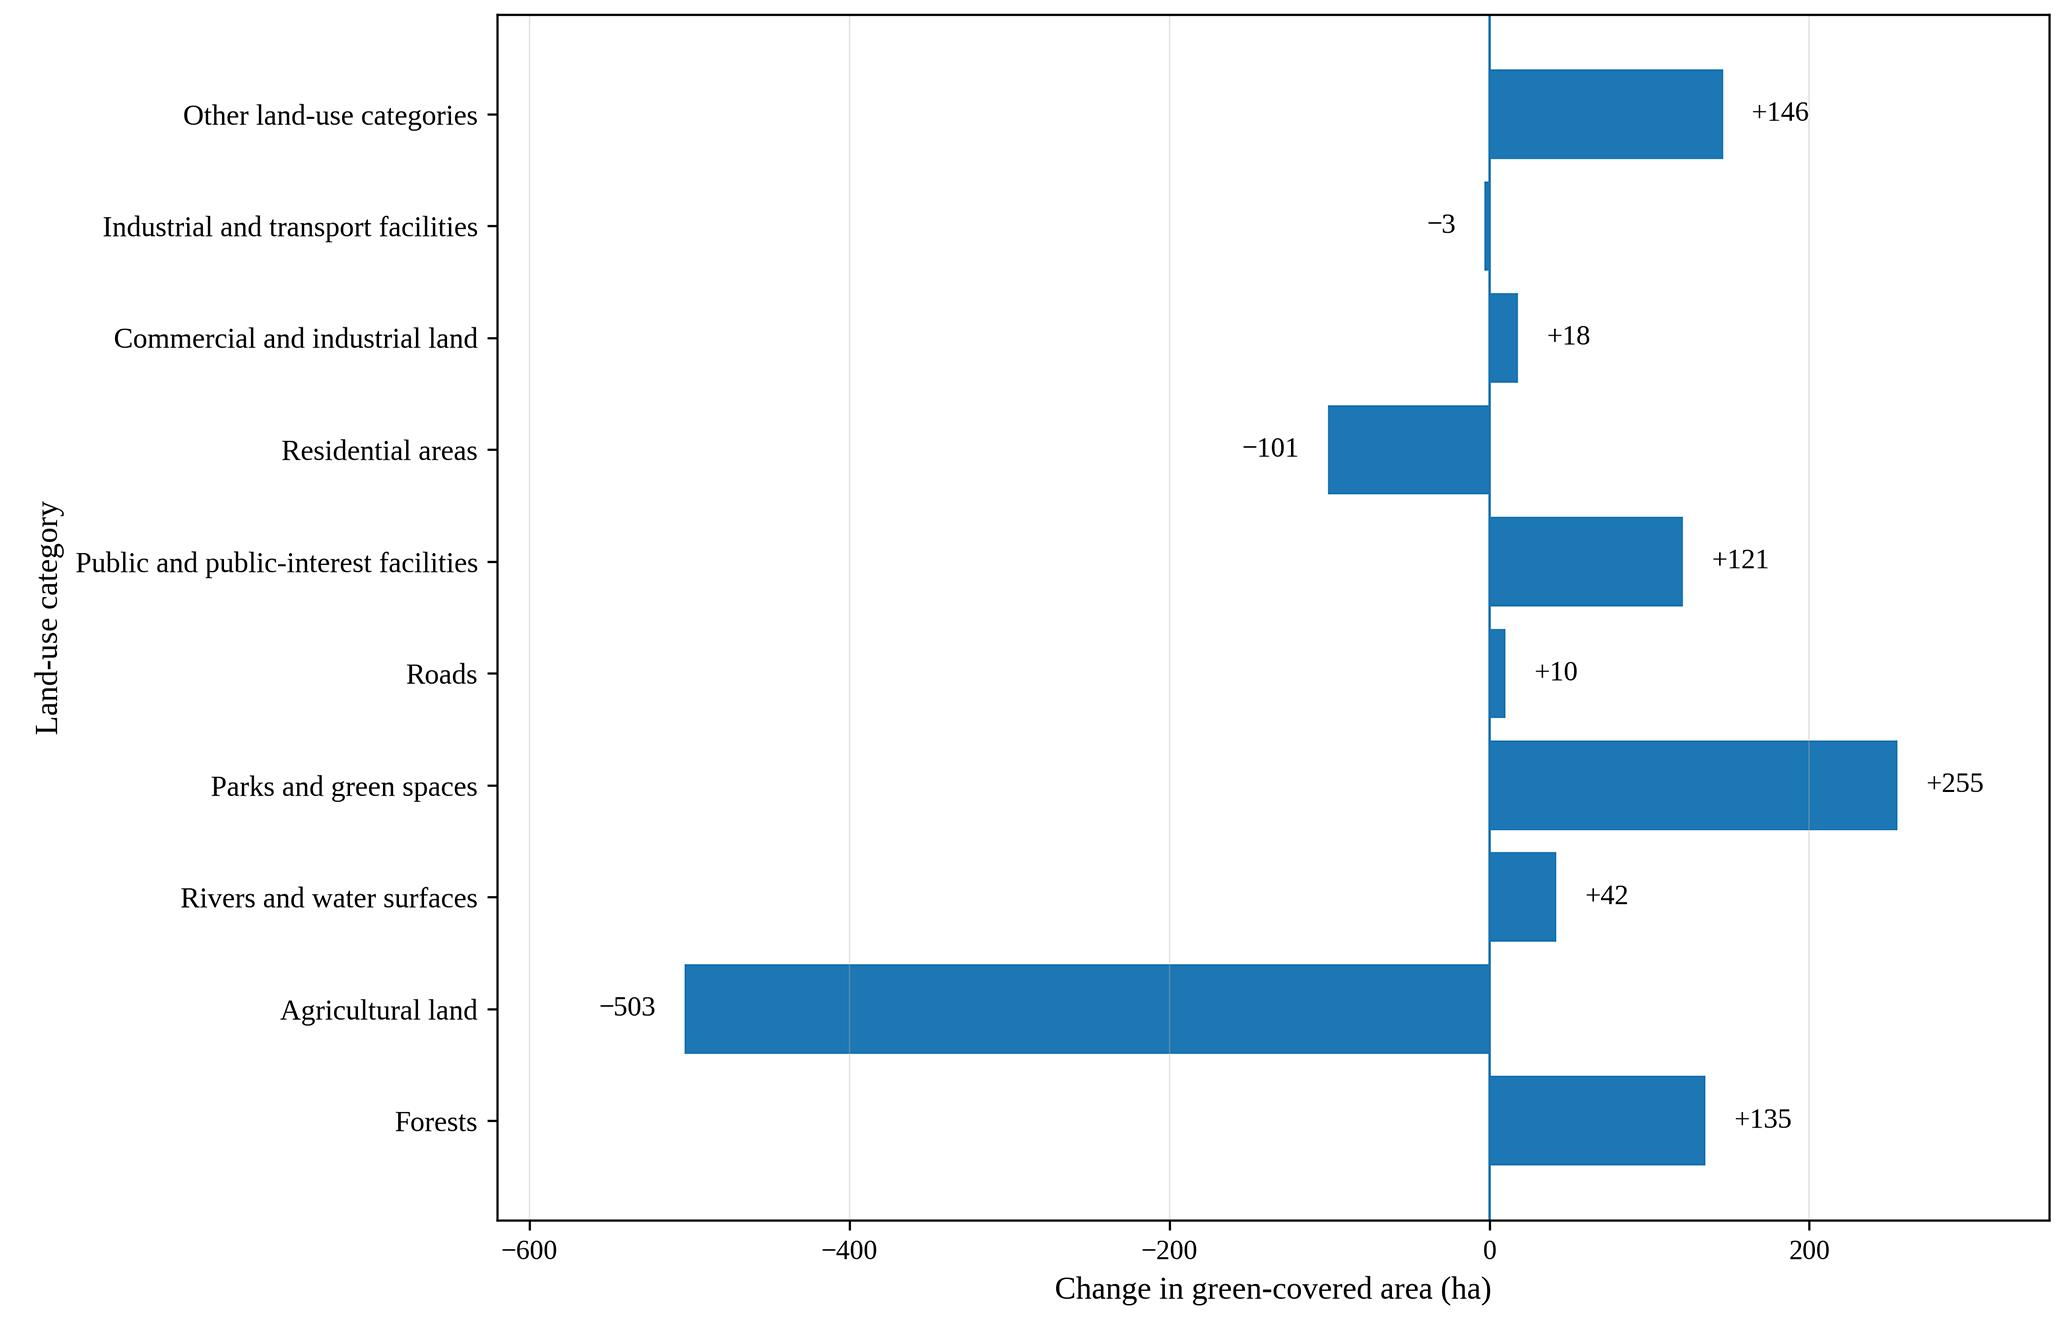
Green cover reached approximately 18,984 ha, or 55.4% of city land, in 2022, about 120 ha above 2007 [21]. Parks and other green spaces gained area, while farmland and residential greenery declined (Figure 4). This aggregate differs from the 56-ha increase in the narrower green-space-area target [21]; neither measures completed greenway connections.
Figure 4.
Changes in Green-Covered Area by Land-Use Category in Fukuoka City (2007–2022). Source: Authors’ illustration based on [21].
4.2. Mechanism I: Adaptive Reorganization and Incremental Renewal
Green cover is unevenly distributed. In 2022, Sawara and Nishi Wards recorded rates of 79.3% and 68.5%, compared with 22.3% in Chuo and 23.1% in Hakata. Many neighborhood blocks in the urban core had less than 10% green cover [21]. This difference helps explain the interest in using existing riverbanks and built structures, but does not by itself demonstrate that such interventions closed the gaps.
4.2.1. Reuse of River Corridors
Municipal plans identify rivers as green-space axes (Figure 5) [21,22]. Their continuous watercourses offer land for greening and access, but do not establish continuous pedestrian routes.
Figure 5.
Spatial Configuration of Green Corridors Connecting the Mountains and Hakata Bay in Fukuoka. Source: Authors’ illustration based on [21].
A recreational path of approximately 4 km follows the Muromi River, supporting walking and running. Riparian birds and aquatic organisms, including shirouo, kingfishers, and black-headed gulls, have also been reported [25]. These observations establish coexisting use and habitat features, not a measured biodiversity gain attributable to the path.
The Naka River, Hakata River, and Yakuin Shinkawa have been opened to activities including cafés, festivals, water-bus trips, paddleboarding, and canoeing [44]. Their public-space role has expanded beyond hydraulic management, although the documents reviewed do not provide before-and-after measures of river ecology or of the effects of increased use.
The river record documents local access and new uses [25,44]. Stage-specific feedback, later management decisions, and before/after ecological conditions could not be traced. The evidence therefore supports spatial reuse without establishing feedback-driven river renewal.
4.2.2. Vertical Extension of Green Space in the Urban Core
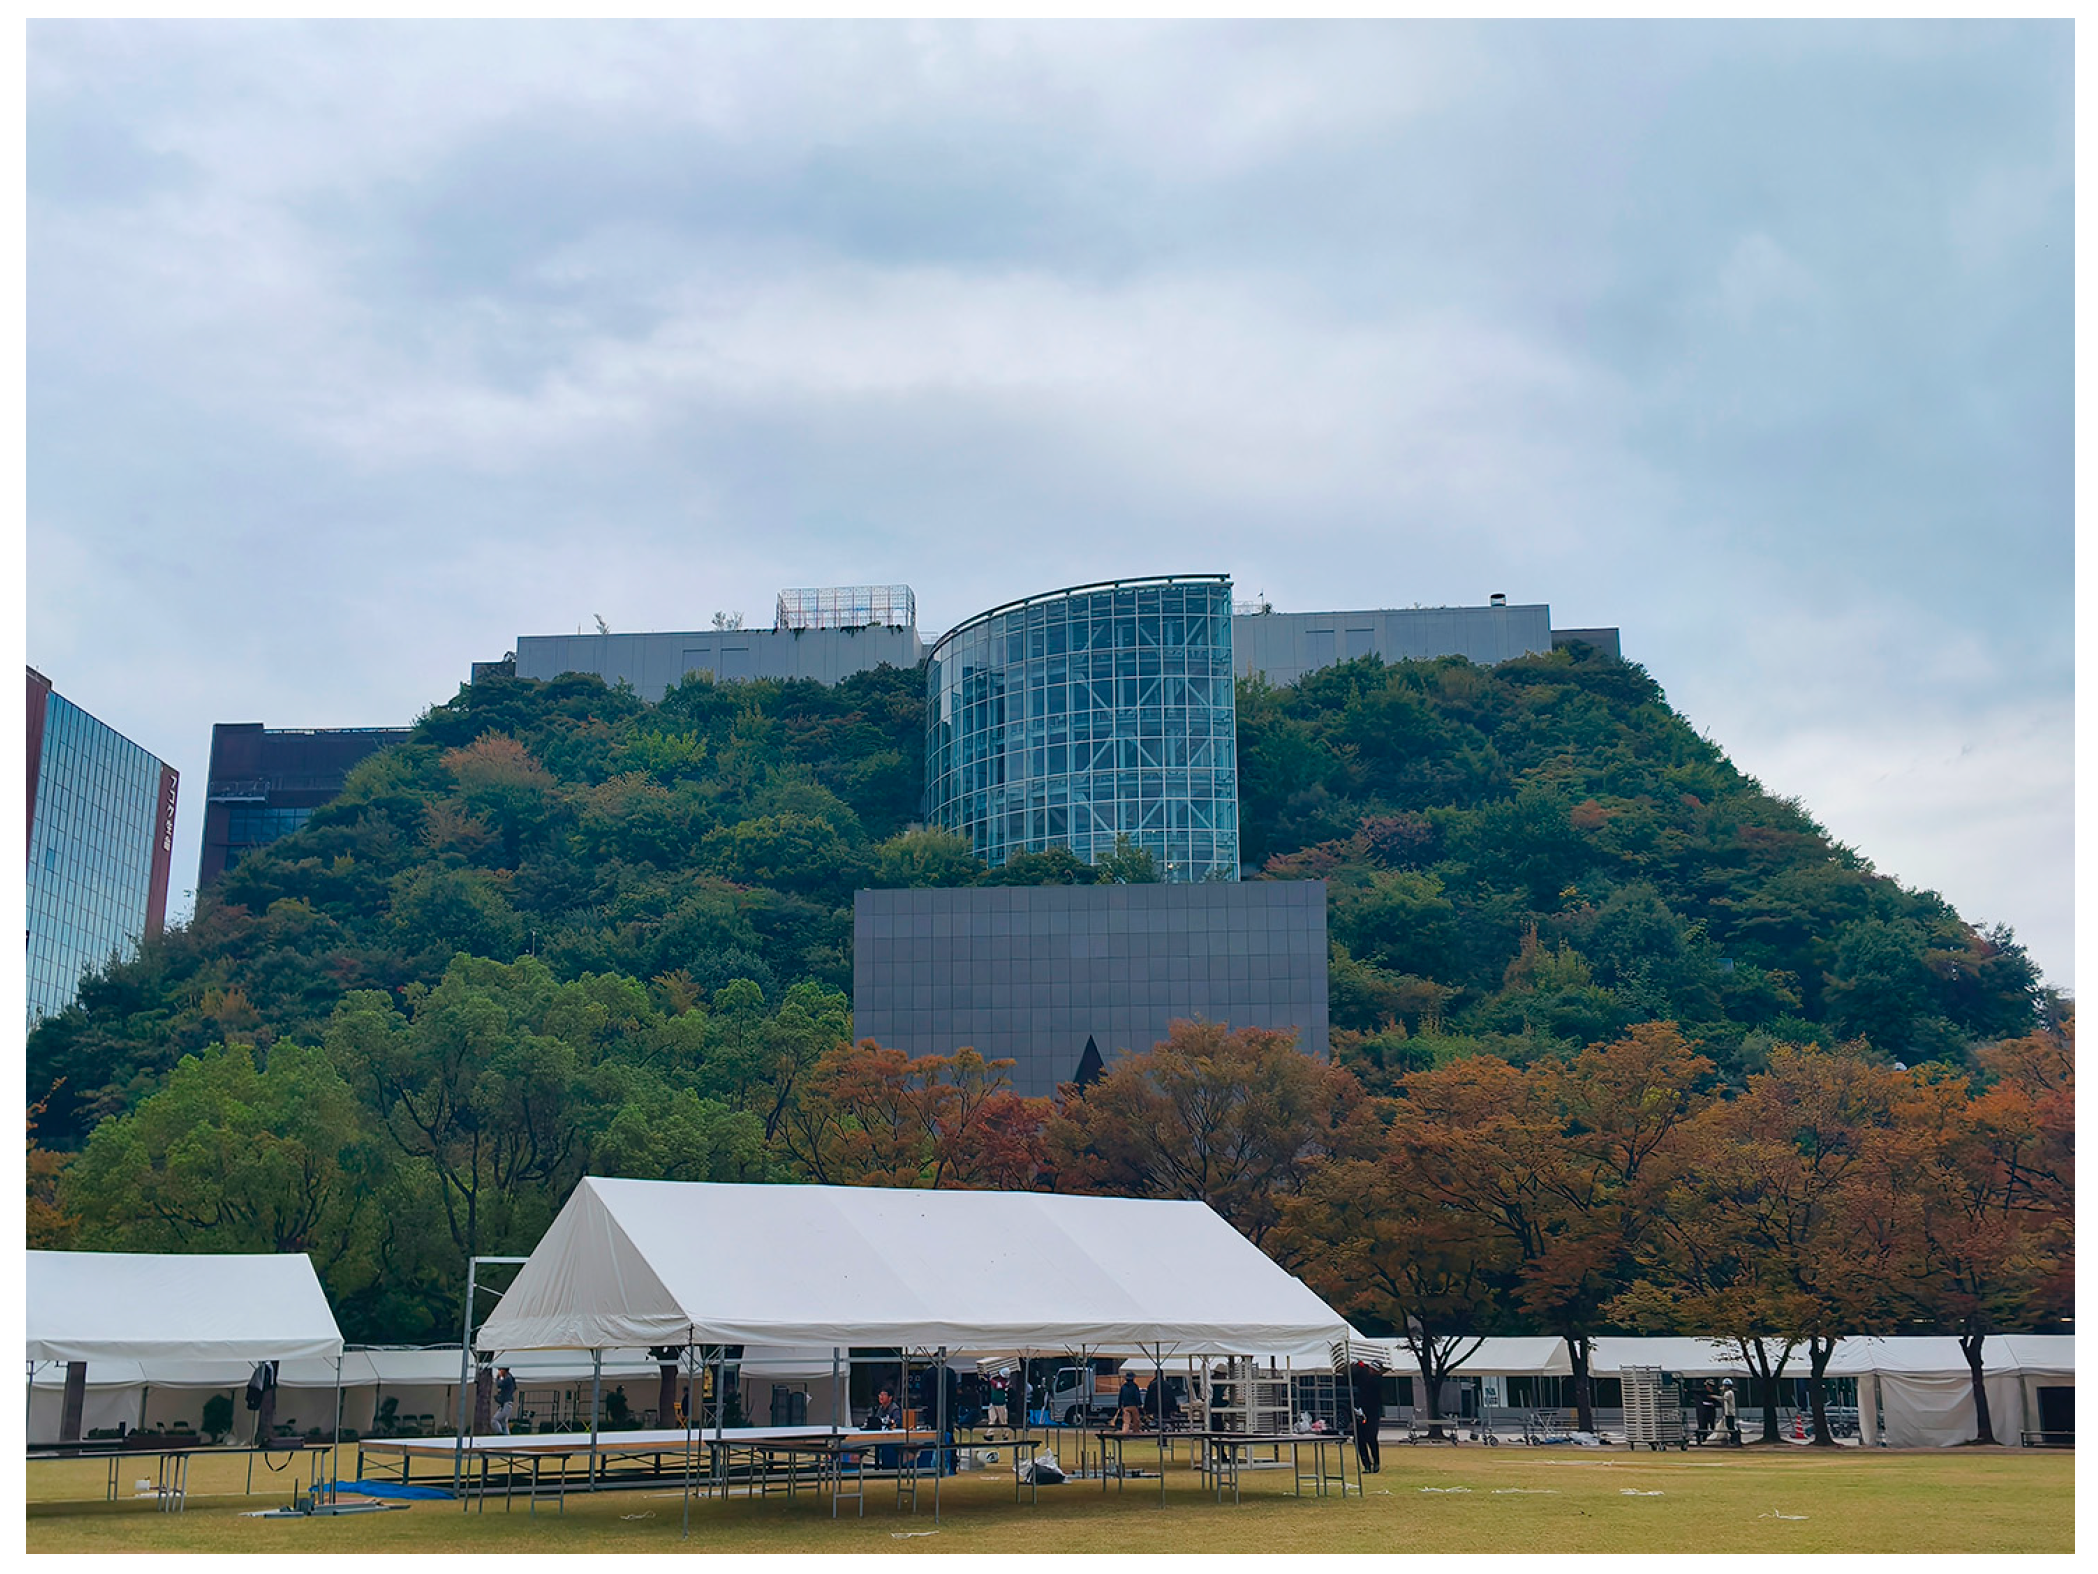
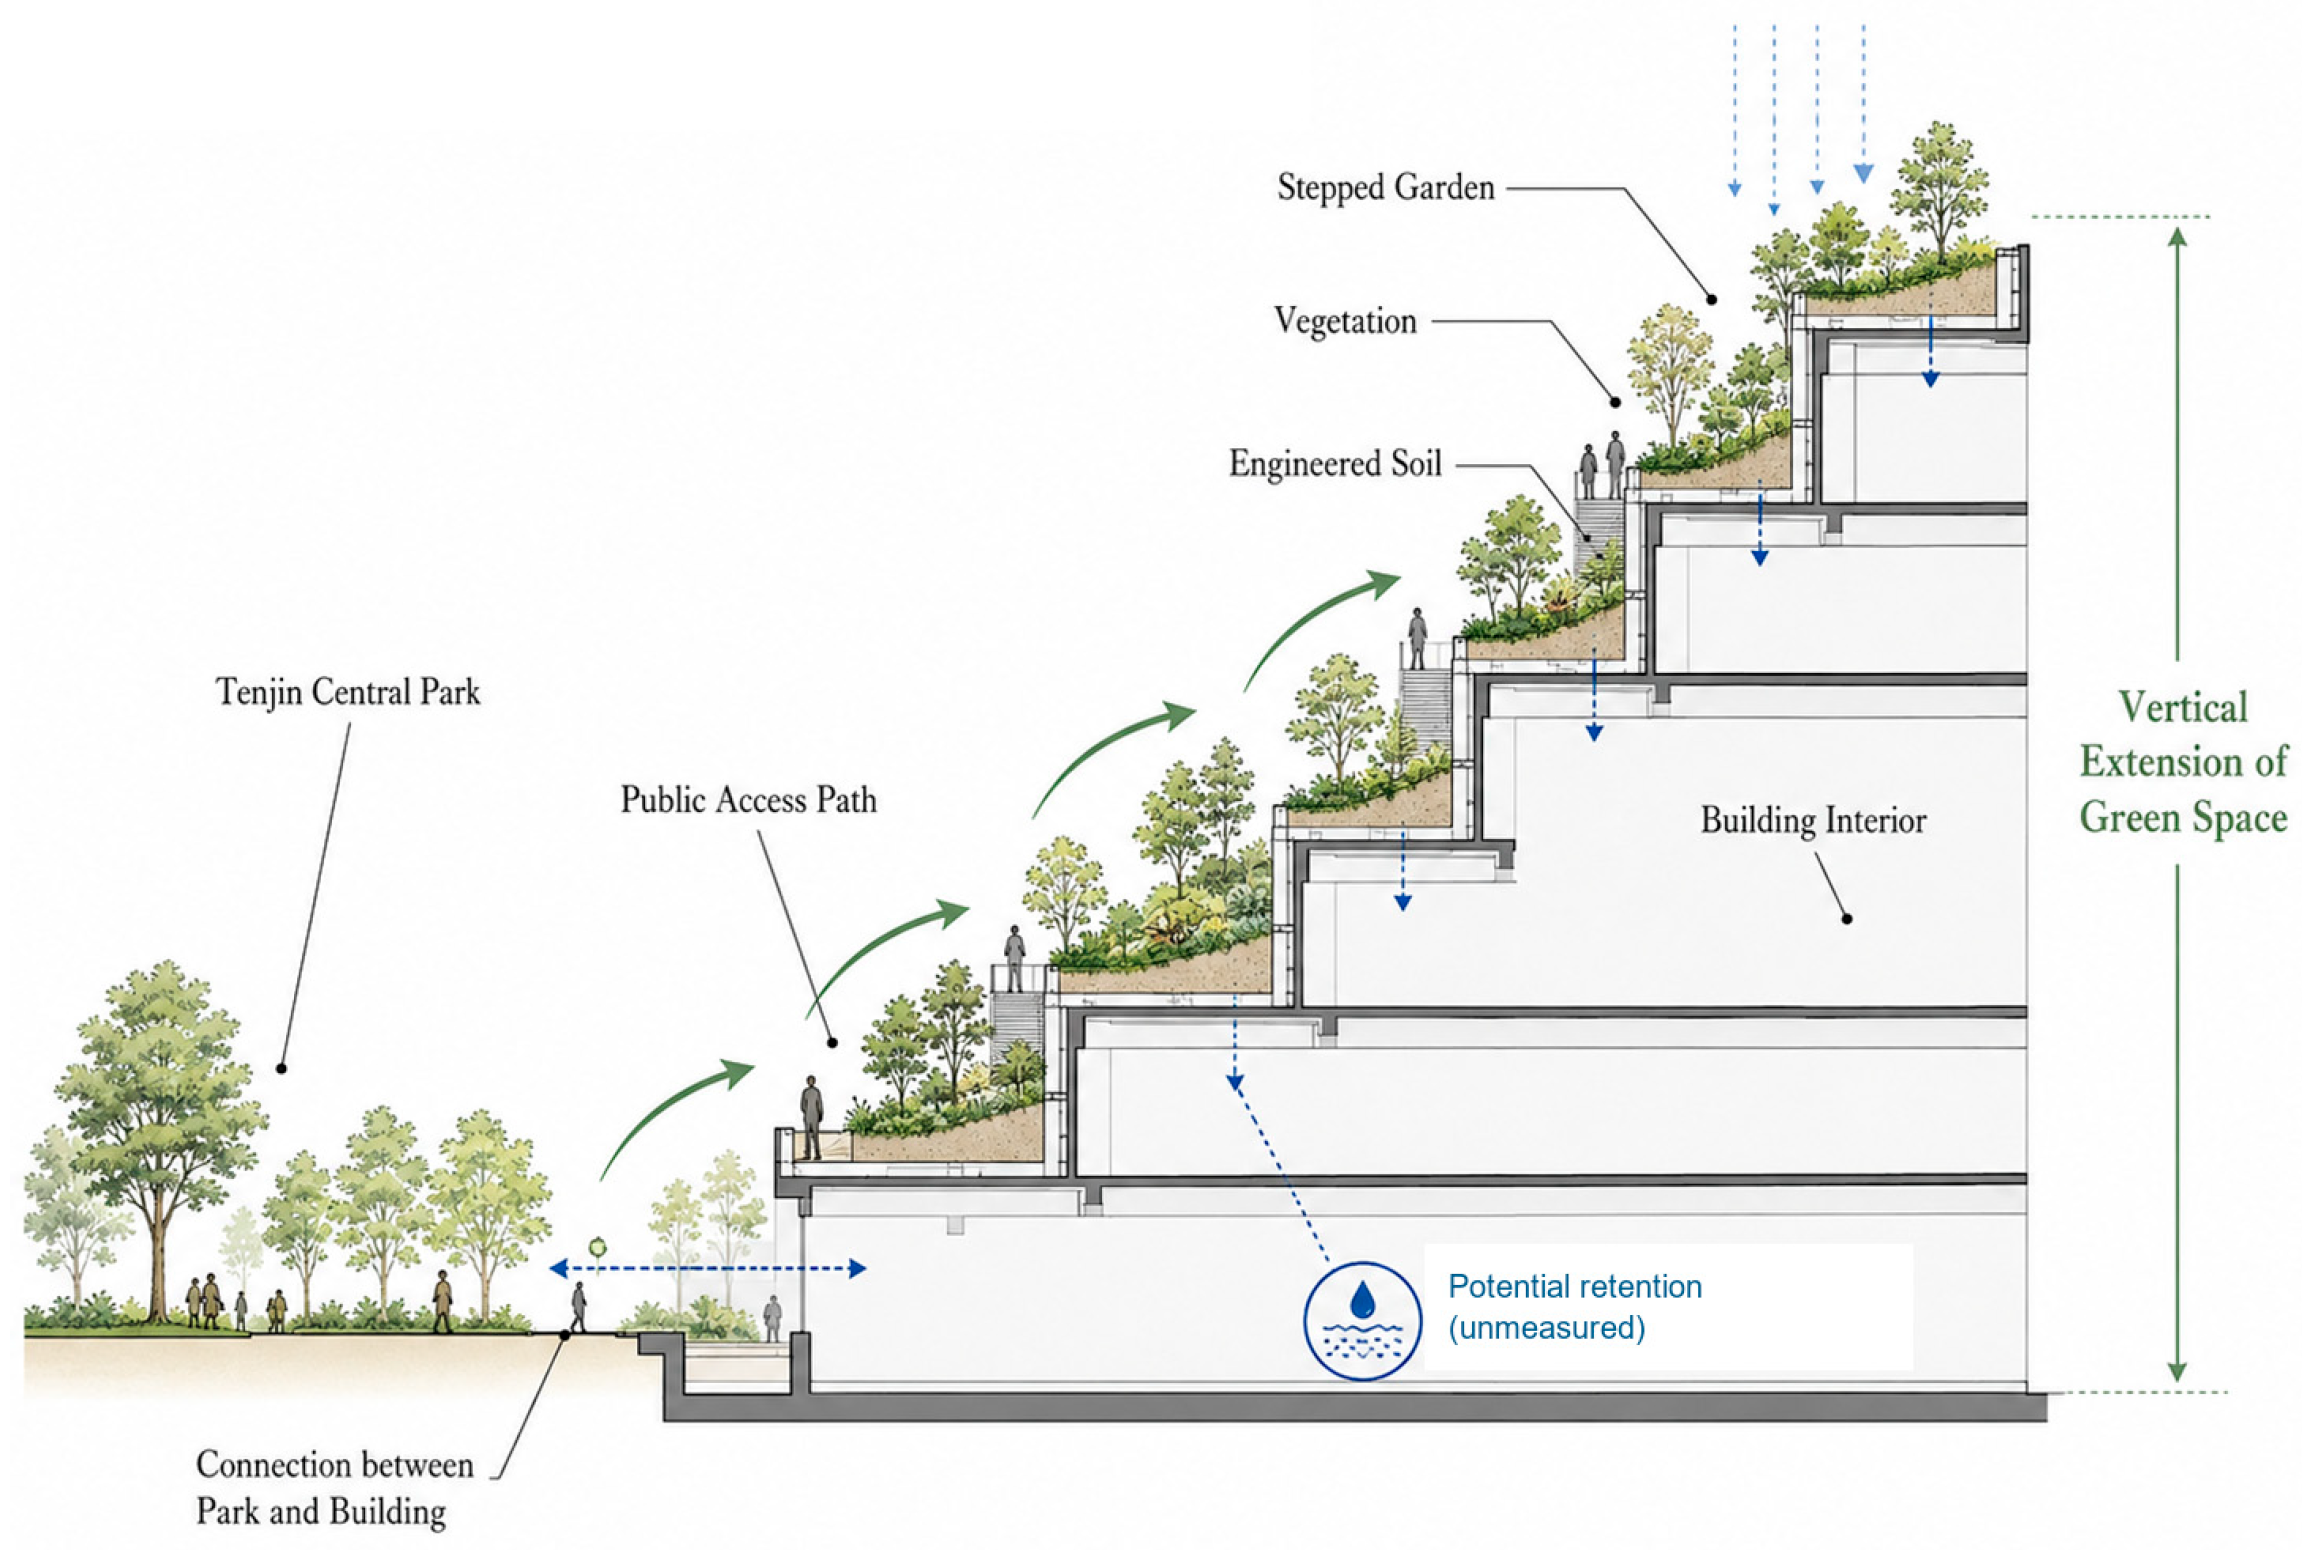
ACROS Fukuoka opened in 1995 on the former prefectural government site. Its terraced southern façade extends planted space from the edge of Tenjin Central Park onto the building, creating a vertical green node in a built-up district (Figure 6) [26].
Figure 6.
Photos of the facade of Fukuoka ACROS. Source: Photographed by the author.
The stepped garden provides approximately 5400 m2 of greenery on floors 2–14, with free public access subject to opening conditions. The operator reports 76 plant species at completion and about 200 subsequently, through planting and dispersal [45]. These figures describe provision and a plant assemblage, not net biodiversity gain.
The vegetated slope adjoining Tenjin Central Park demonstrates the use of building surfaces to supplement ground-level greenery. Broader ecological connectivity remains unmeasured [45].
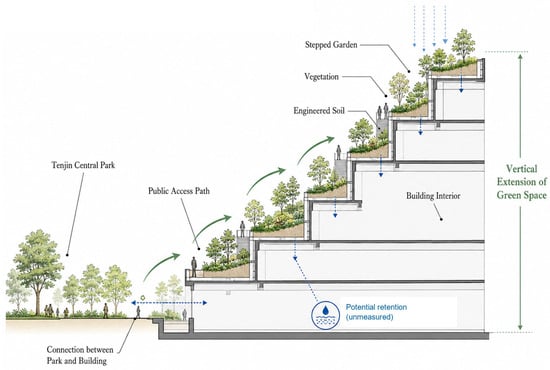
The terraces offer potential water retention (Figure 7), but no project-specific rainfall–runoff measurements or verified rainwater-use systems were found in the sources checked [45]. Thermal and fungal observations are assessed separately in Section 4.3.2.
Figure 7.
Schematic section of the ACROS Fukuoka Step Garden illustrating the vertical extension of green space from Tenjin Central Park. Water retention is shown only as a potential function and has not been measured in this study. Source: Authors’ illustration based on [45].
4.2.3. Phased Conservation and Use of Coastal Space
The coastal park developed on land returned from military use in 1972. Cumulative opened area rose from 59 ha in 1981 to 206 ha in 1999, 265 ha in 2009, and 349.7 ha in 2020; the latter remained reported on 31 March 2025 within a planned 539.4 ha [27]. These stages measure provision. Area cannot determine phase-specific ecological effects, use, or governance feedback without comparable observations. Land release and construction progress remain alternative explanations for expansion.
The park management material describes coastal vegetation and Japanese black pine stands, habitat associated with loggerhead sea turtles, and restoration work directed at degraded coastal vegetation [46]. These activities indicate conservation objectives and interventions. The records reviewed do not quantify changes in turtle nesting success or other habitat outcomes attributable to that work.
The 1998 Environmental Coexistence Plan coordinates conservation, education, volunteering, and reuse of plant waste [46]. It differentiates sensitive areas from recreation spaces, but the reviewed records do not link a particular feedback report to a later opening stage.
4.2.4. Assessment of Mechanism I
P1 is supported for local river-edge reuse, vertical greenery, and phased coastal provision [25,26,27,44,45,46]. Their importance relative to redevelopment, land release, or construction schedules remains unresolved, as does citywide network completion.
4.3. Mechanism II: Social–Ecological Coupling and Ecological Integration
P2 is assessed by separating design opportunity, service observation, and benefits. The documentary evidence varies substantially across the three settings.
4.3.1. Coupling of River Ecology and Everyday Use
On the Muromi River, the path provides opportunities for walking and direct contact with the river environment, while the river corridor retains aquatic and riparian habitats [25]. Recreational access is documented. No site-specific study cited here measures changes in flood regulation, habitat quality, or health attributable to the path.
The Naka and Hakata riverfronts accommodate organized activity, water transport, and recreation [44]. These uses demonstrate opportunities for cultural services, while flood safety, water quality, and disturbance of riparian habitats remain distinct questions. The available reports do not resolve the trade-offs associated with more intensive use.
4.3.2. Integration of Architecture, Vegetation, and Public Space
ACROS provides a specific link between vertical reorganization and a regulating function. Hagishima et al. measured the stepped garden during short campaigns in September 2000 and August 2001 and monitored it from mid-July to late November 2002 [47]. Under calm nighttime conditions, intermittent downslope cool-air flows lasted 20–80 min; reported maximum velocity near the slope foot was about 0.5 m/s and the maximum top-to-bottom temperature difference about 1 °C. These observations concern local conditions, not citywide cooling. Separately, Takayama et al. combined summer 2007 observations with a modeled non-greened-building comparison, estimating increases of 4.2–6.9% in operative temperature and 7.6–11.8% in a heat-stress index under the comparison [48]. The percentages are exposure estimates, not measured air-temperature reductions.
Osawa et al. sampled ACROS planting substrate in July 2022, 27 years after construction [49]. Environmental DNA from depths of 10, 30, and 50 cm identified fungal assemblages; Basidiomycota and Ascomycota each accounted for roughly 40% of detections. Terrace-location differences were more pronounced than depth differences. Comparisons with two ground-level sites showed similar phylum-level proportions but different genus-level communities. This establishes a mature substrate community and spatial variation, not 27 years of continuous monitoring or a net biodiversity increase. Together, these studies support the ecological-function component relevant to P2 at ACROS. Sustained coupling with social use, runoff, longitudinal ecological change, and beneficiary outcomes remain unverified.
4.3.3. Coordination of Coastal Conservation and Public Functions
At Uminonakamichi, conservation work on coastal vegetation coexists with nature observation, environmental education, and recreational facilities [46]. The spatial separation of sensitive habitats from more accessible areas is documented, but the ecological effect of this arrangement has not been measured against an alternative design.
4.3.4. Residents’ Perceptions of Green Space
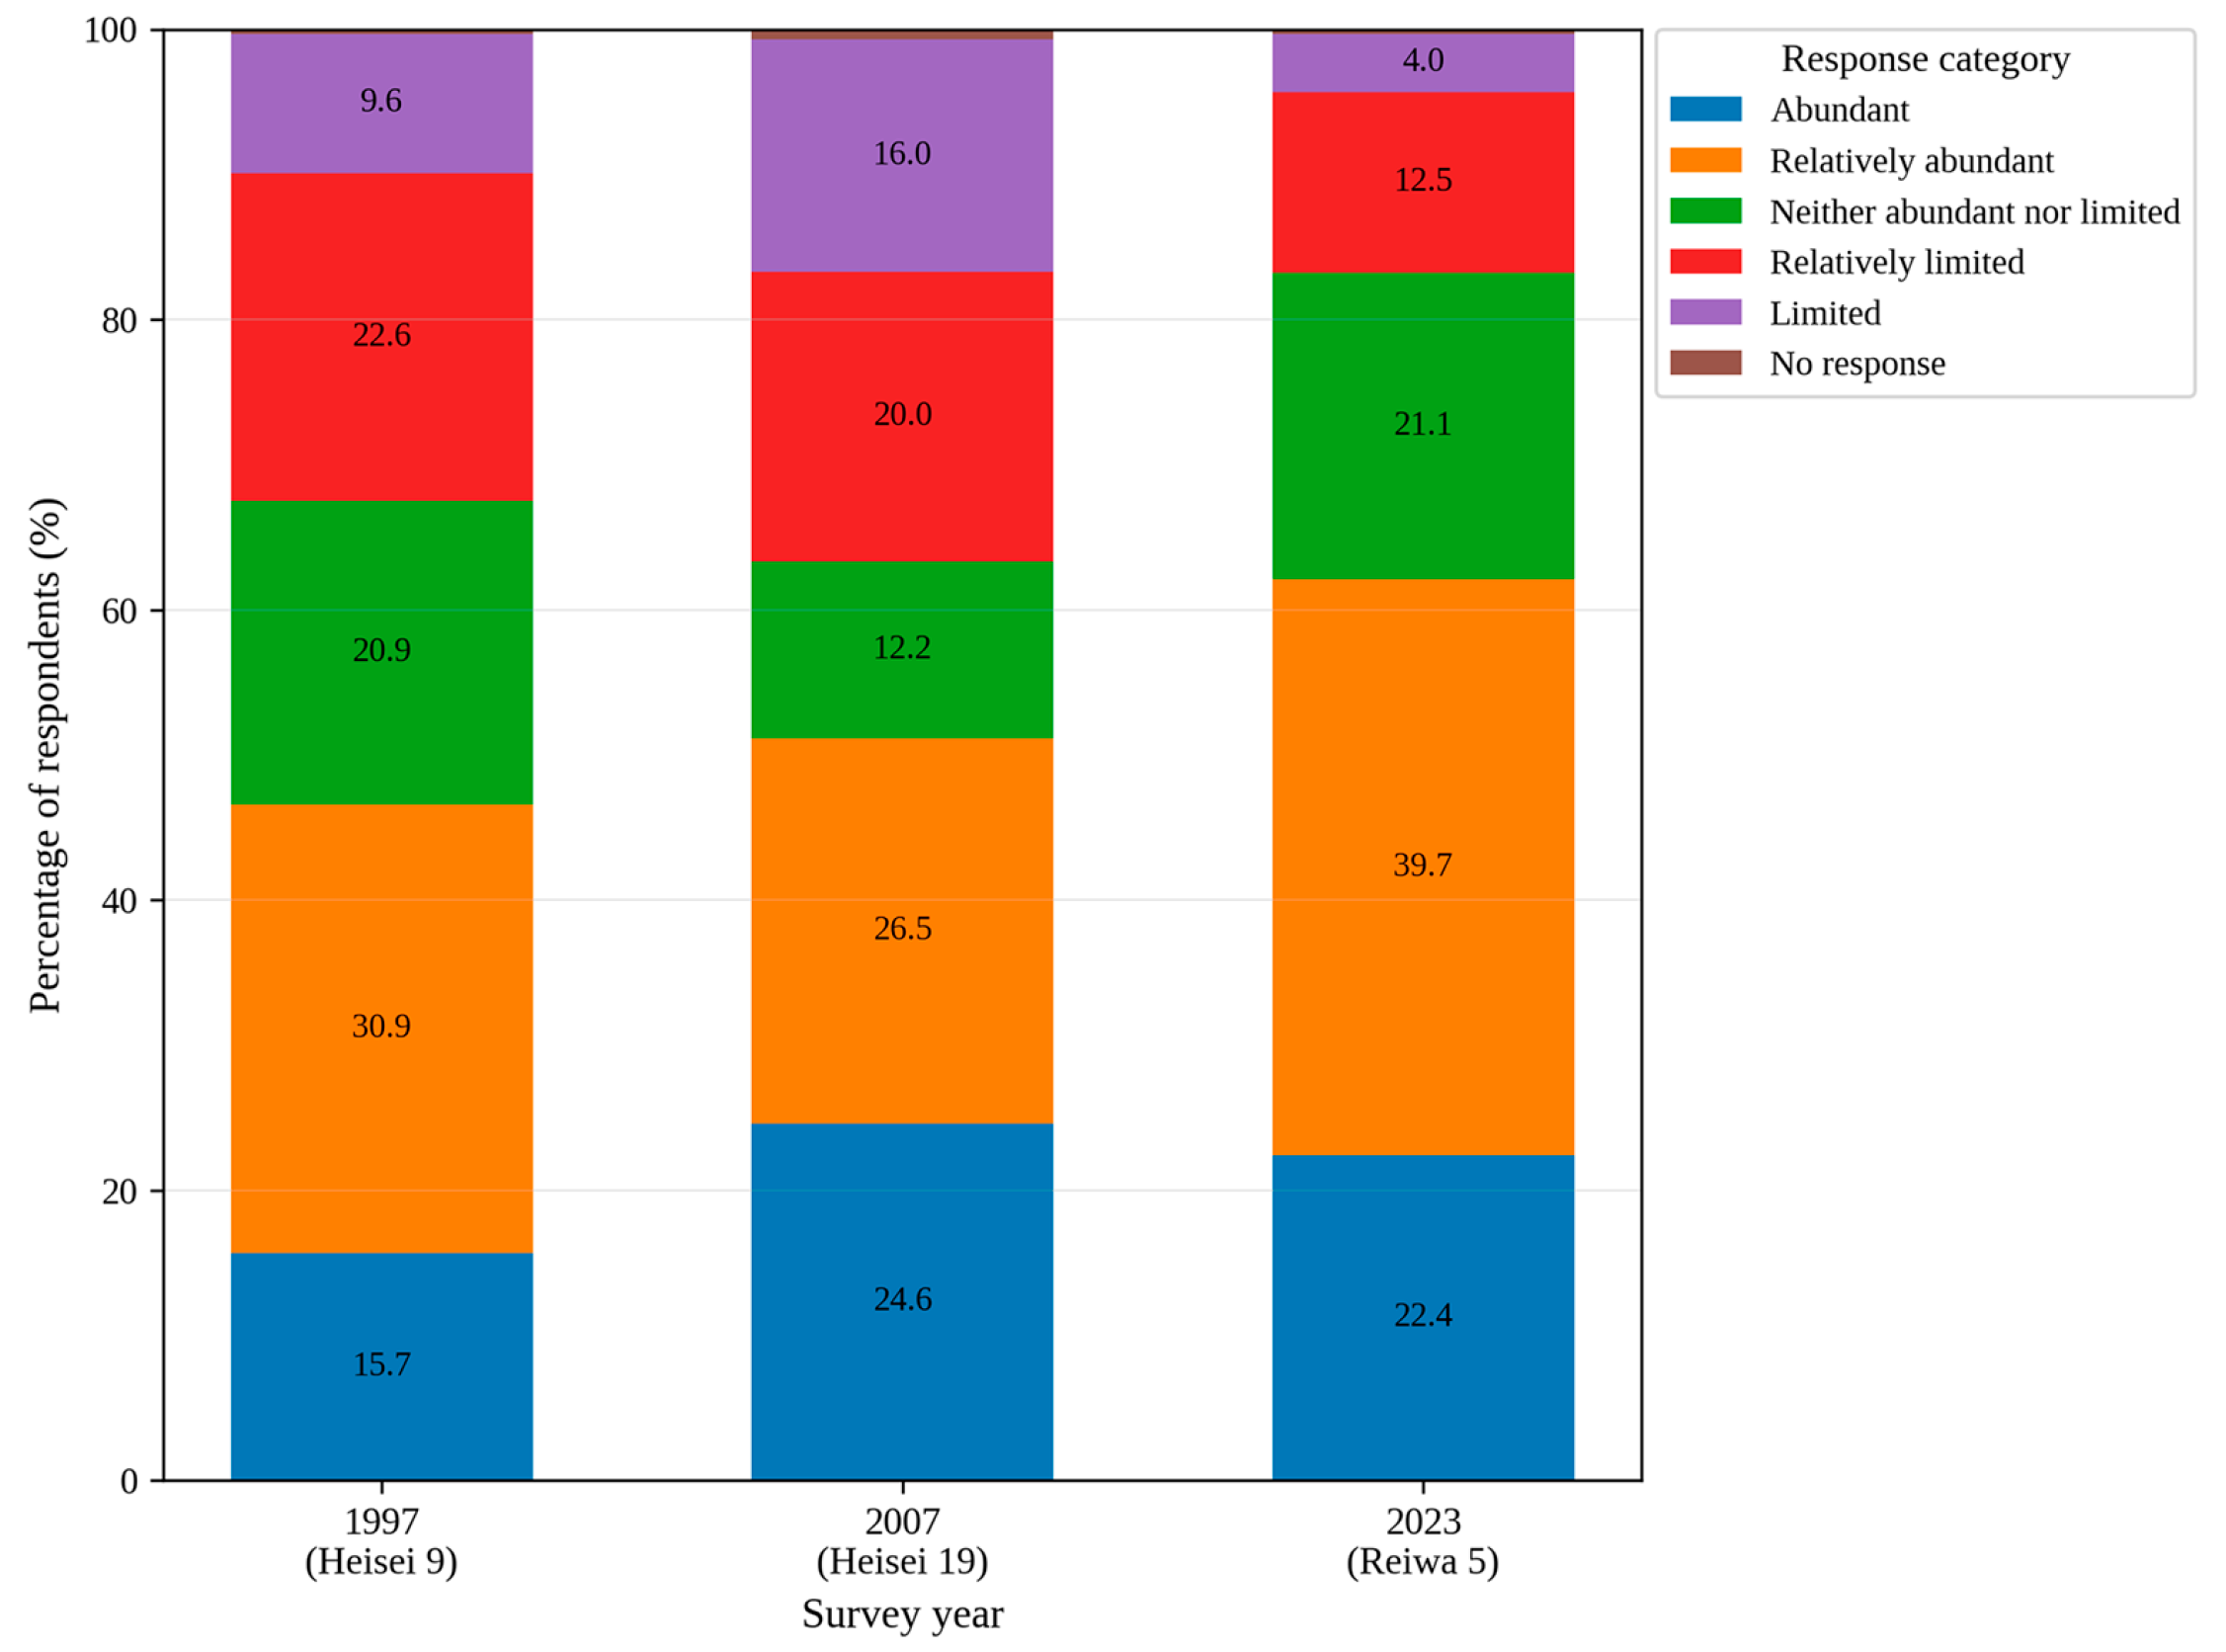
The 2023 municipal questionnaire received 544 valid responses from 638 surveyed residents [21]. Of respondents, 62.1% described nearby greenery as abundant or relatively abundant, while 16.5% described it as limited or relatively limited, compared with over 30% in 1997 and 2007 (Figure 8).
Figure 8.
Changes in Residents’ Perceptions of Neighborhood Greenery in Fukuoka City. Source: Authors’ illustration based on [21].
These survey results describe perceptions at the city scale, where parks, roads, rivers, private greening, and other changes may all affect residents’ responses [21]. They cannot identify the effect of the river, ACROS, or coastal projects separately.
A different performance measure in the same plan—the share of residents who felt greenery was abundant in their immediate neighborhood—remained near 30%, below the previous 55% target [21]. It is not the same question as the 2023 survey shown in Figure 8 and cannot be treated as a directly comparable series. Together, the indicators warn against inferring universally realized benefits from citywide gains in green cover.
4.3.5. Assessment of Mechanism II
The ACROS thermal measurements, modeled exposure comparison, and fungal survey provide partial support for the ecological-function component relevant to P2 [47,48,49]. They do not establish the proposition’s broader claim of sustained coupling among ecological processes, urban functions, and social use. River and coastal accounts document ecological features and opportunities for use, without comparable outcome assessments. Municipal green-space gains and unmet targets [21] qualify an assumption of uniform improvement but cannot establish effects of the embedded projects.
4.4. Mechanism III: Multi-Actor Collaboration and Feedback-Enabled Adaptation
P3 is assessed through responsibilities, public input, recorded decisions, and subsequent action. Planning, design, implementation, and outcome evidence are kept distinct.
4.4.1. Institutional Allocation of Responsibilities
The current consolidated ordinance assigns roles in conservation and greening to municipal authorities, residents, and business operators and addresses greenery in public facilities, roads, and rivers [43]. These provisions show an institutional basis for coordinated activity, not a record of how a particular decision was negotiated or when each provision first entered the ordinance.
4.4.2. Participation in Plan Formulation
The 2025 Green Basic Plan describes consultations with experts and stakeholders, questionnaires for residents and children, interviews, and a formal public-comment period [21]. These are documented input channels; the published response register allows a narrower assessment of which inputs were incorporated into the draft.
The public-comment period ran from 11 September to 14 October 2025: 69 participants submitted 246 comments, classified as 13 changes, 49 unchanged, 69 already reflected, and 115 other requests [32]. Comment 14 prompted wording on the spatial distribution of green-cover changes; comment 6 clarified carbon absorption and corrected an indicator target [32]. These establish text uptake, not changes to work on site.
Non-adoption is also recorded. A challenge to the green-cover definition (comment 12) and a concern about weeding and maintenance (comment 1) did not produce corresponding draft amendments [32]. These entries show that consultation did not consistently result in acceptance or observed management change.
4.4.3. Project-Level Collaboration
ACROS combined public-sector objectives and private-sector development and operation in a mixed civic complex [26]. This establishes organizational collaboration for that project; it does not show that local residents shared decision authority or that project operation changed in response to feedback.
At Uminonakamichi, conservation, environmental education, volunteer activities, and park management are organized under the Environmental Coexistence Plan [46]. This document outlines opportunities for cooperation, but not yet a traceable response-to-adjustment episode.
The river-use webpage identifies activities and organizations [44], but does not verify post-activity reporting requirements or a report that changed a permit. It supports organized use, not a management feedback loop.
A supplementary municipal park episode, outside the three embedded settings, offers more direct design evidence. Evaluations and questionnaires in 2021–2023 informed inclusive-playground guidance [21,34]. At Seinan Mori-no-Kohan Park, four workshops were held in October–December 2023. The third newsletter records site-based limits: an on-site parking request would reduce play and supervision space, so improved access from the nearby second car park was proposed; use of adjacent steep woodland was redirected toward existing lawn and planting on the park side [35]. The fourth newsletter explicitly links residents’ request for rain shelters to discussion with the park manager and a decision to include about two compact roofed rest places [36]; its final scheme records revised planting and rest arrangements [36]. The city subsequently records the playground opening on 29 April 2025 [37]. The input–design link is explicit, and the project reached opening, but the reviewed record does not verify each shelter as built or measure later use, comfort, or ecological effects.
4.4.4. Social Evaluation and Public Feedback
Fukuoka’s Urban Landscape Award, established in 1987, accepts residents’ nominations of urban spaces and activities [50]. It is an avenue for recognition and social evaluation, although it does not record changes to greenway maintenance decisions.
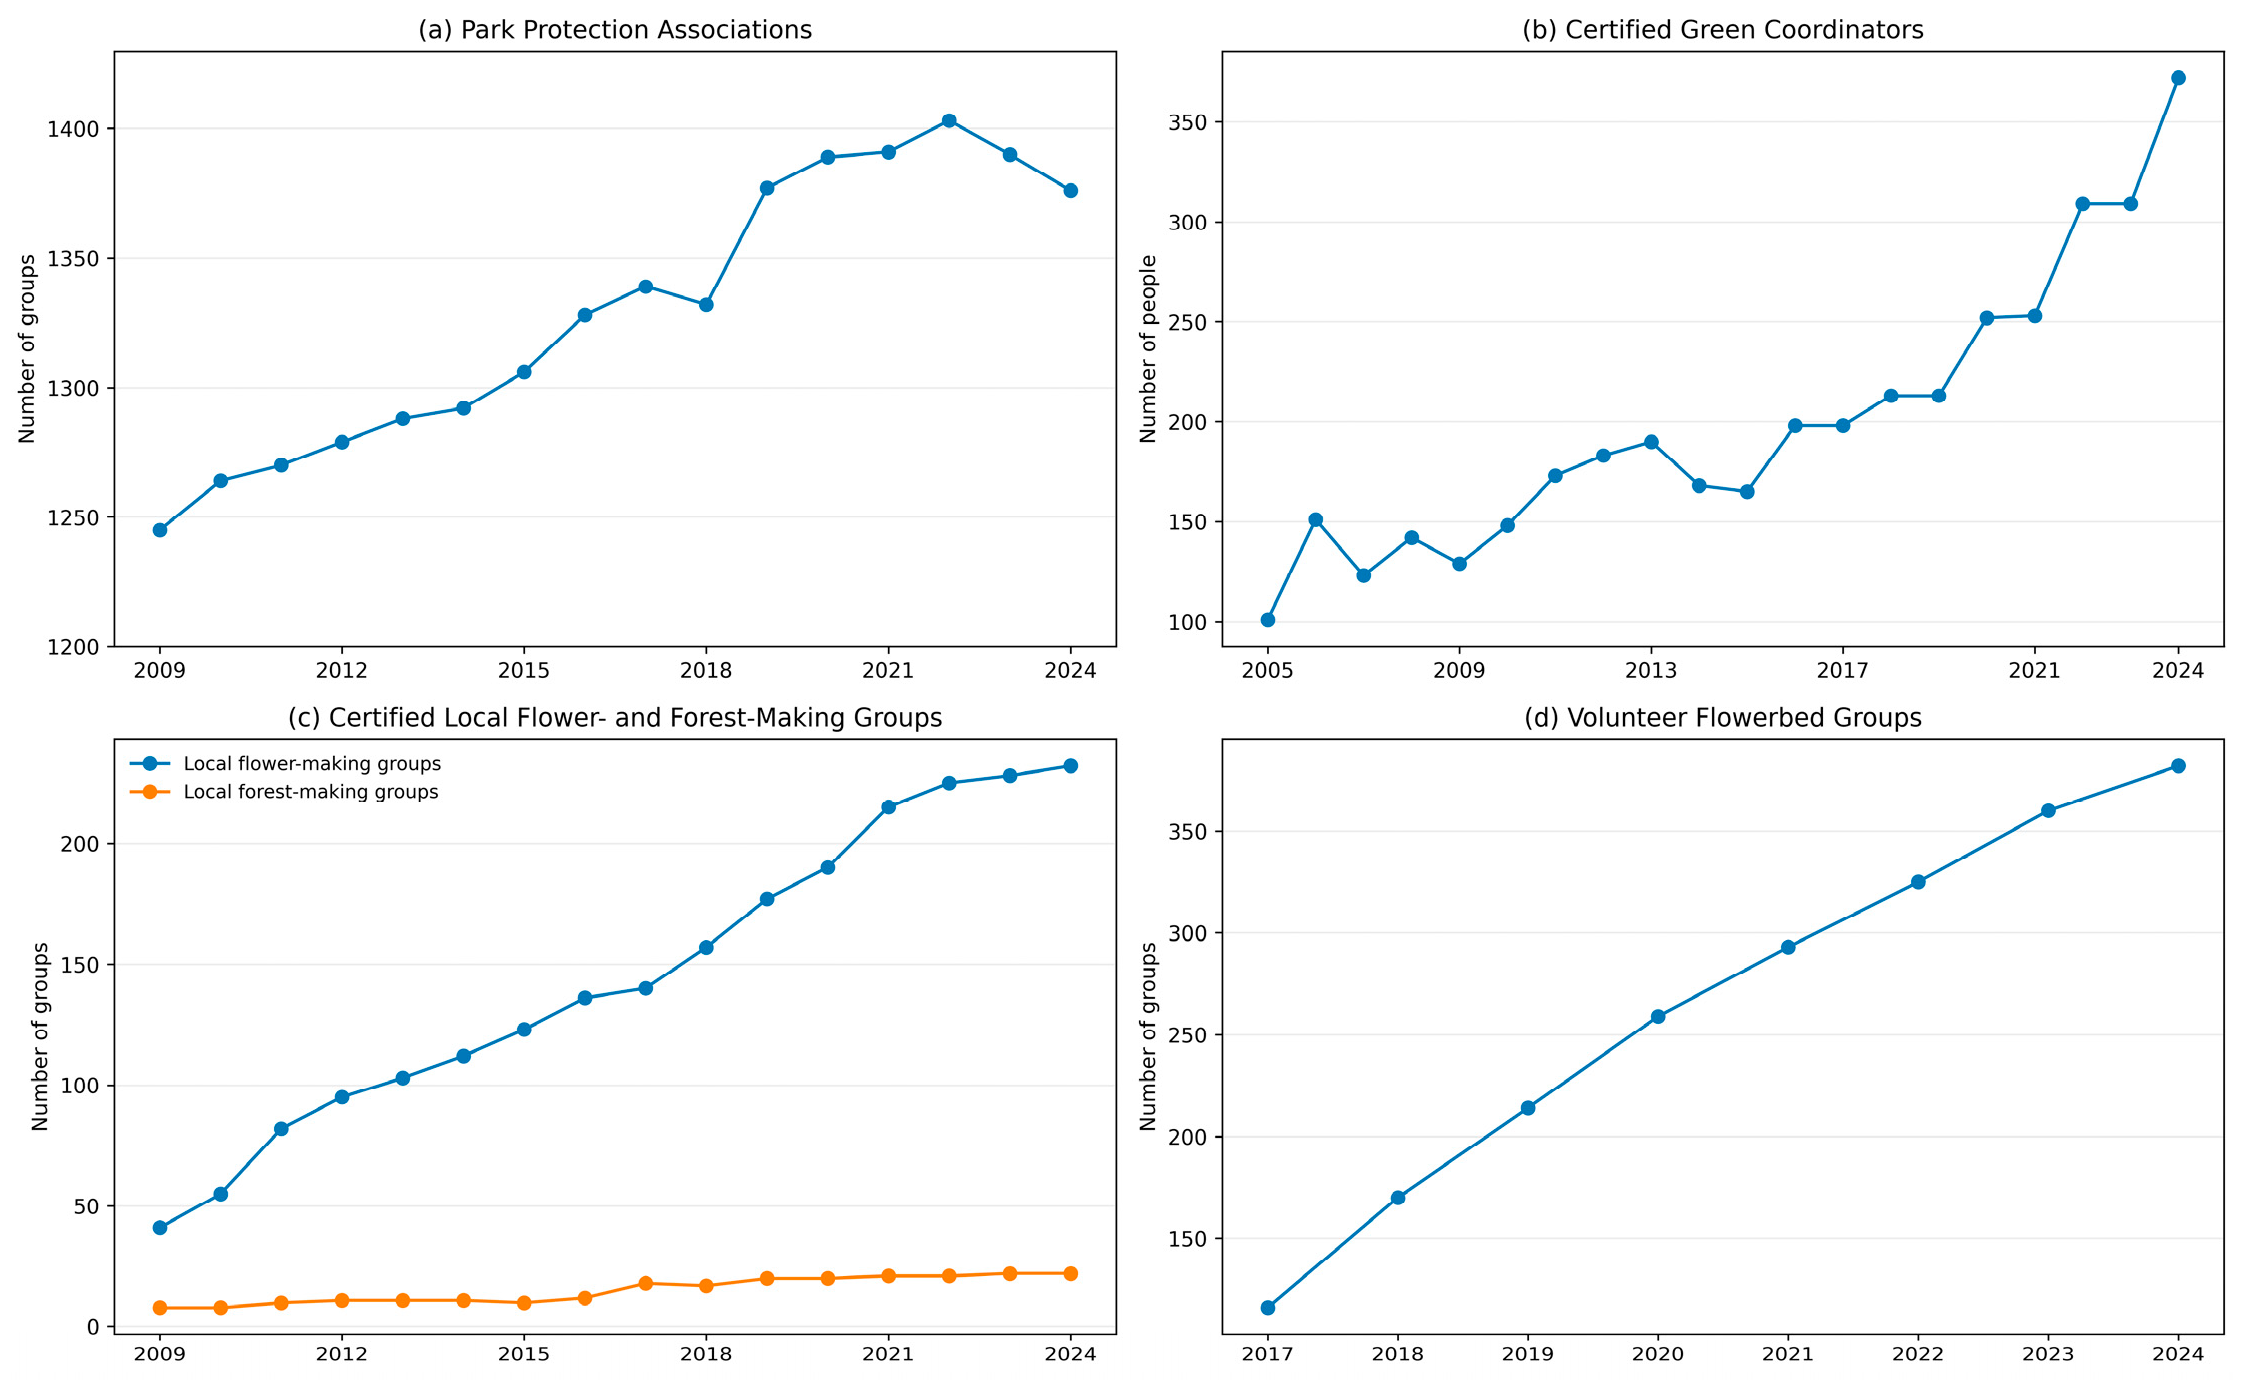
Park-care associations declined from 1403 in 2022 to 1376 in 2024; the plan identifies aging members and succession difficulties [21] (Figure 9). This qualifies an assumption of expanding participation. Organization counts do not measure effort, representativeness, or decision influence.
Figure 9.
Reported participation and registration trends in green-space management programmes in Fukuoka. The programmes use different counting units and periods; registrations do not measure decision-making authority. Source: Authors’ illustration based on [21].
4.4.5. Monitoring and Adaptive Management
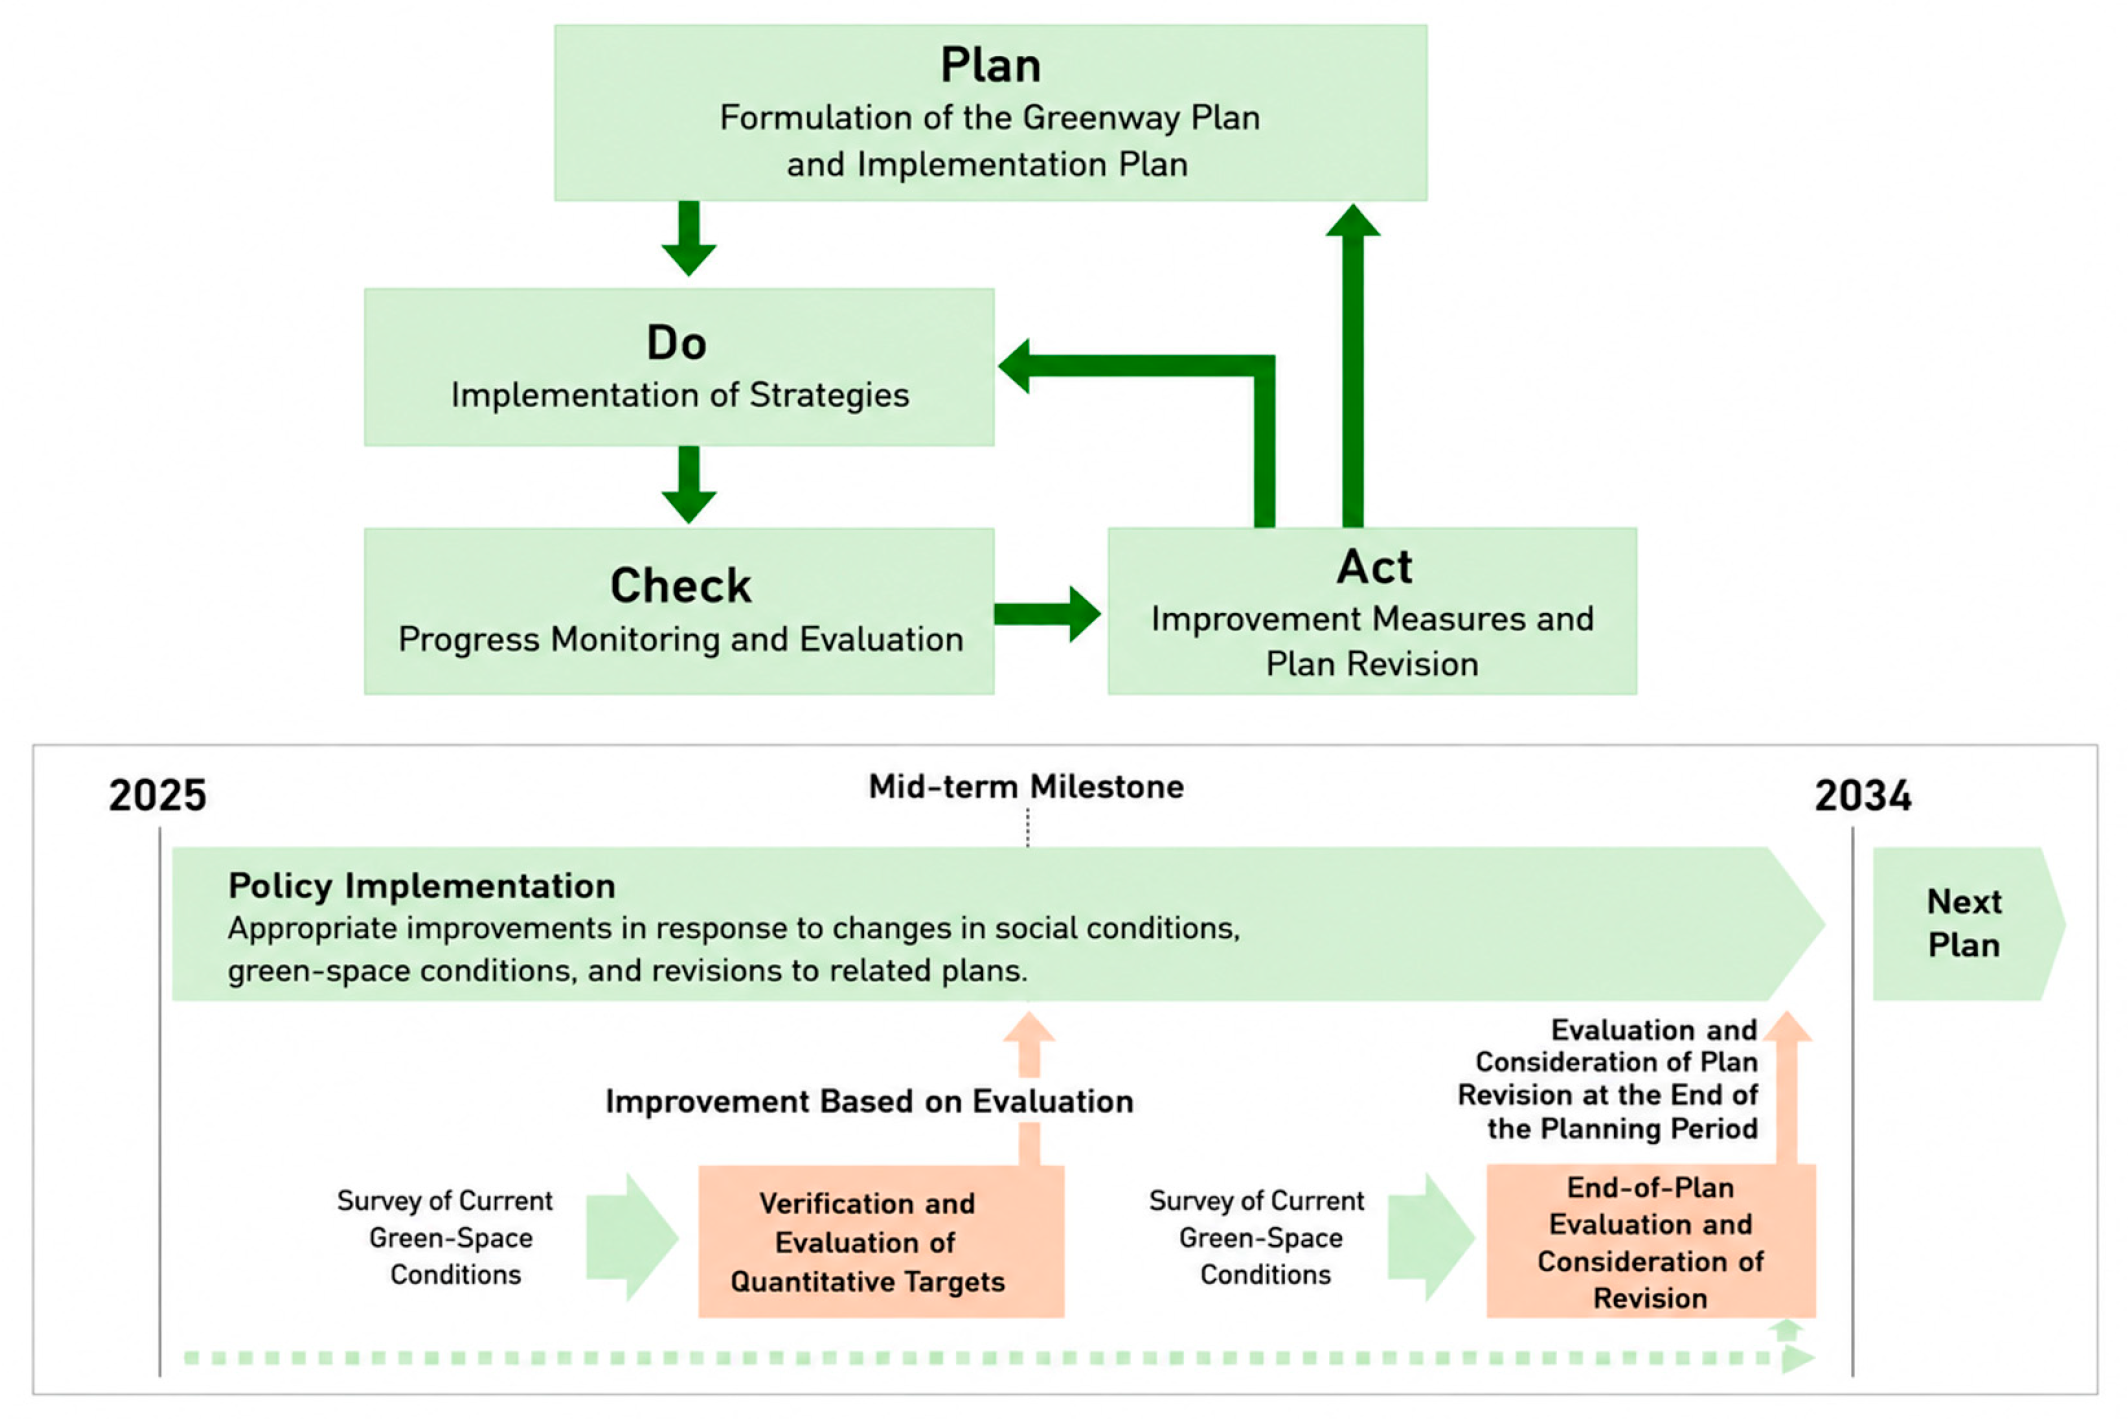
The 2025 Green Basic Plan adopts PDCA as a management cycle and describes flexible use of OODA, with mid-term and final evaluations during its 2025–2034 term [21] (Figure 10). These are prescribed procedures for review and possible adjustment, not evidence that an evaluation has already resulted in a revised project.
Figure 10.
PDCA–OODA cycles for monitoring and adaptive management in the 2025 Fukuoka City Green Basic Plan. Source: Authors’ illustration based on [21].
The same plan proposes a green-view index based on street-level images in the Tenjin and Hakata Station areas. It relates this monitoring proposal to the continuing gap between expanding green area and residents’ limited perception of nearby greenery [21]. The indicator will be evaluated during the plan period; the current source does not report an outcome attributable to its use.
In December 2024, the city’s reply to committee members placed green view as a monitoring indicator rather than an overarching target (items 6–1/6–2); this role appears in the final plan [21,33]. A response concerning carbon absorption is likewise reflected in its retained overarching role [21,33]. The paired records show indicator-design uptake without establishing implementation effects or shared authority.
4.4.6. Assessment of Mechanism III
Selected planning-text and indicator revisions support the feedback-uptake component of P3 [21,32,33]. The supplementary park episode adds an explicit input-to-design decision and a later opening record [35,36,37], alongside requests constrained by site conditions. Item-level construction, altered management, and subsequent ecological or use outcomes remain unverified. These records provide partial support for uptake, but do not test its contribution to long-term operation or the proposition’s necessary-condition claim. The evidence extends beyond participation and stops short of a complete adaptive cycle.
4.5. Integrated Assessment and Framework Refinement
Three partial sequences can be traced. ACROS connects a spatial intervention (P1) to later thermal and fungal observations (P2), but not to a decision responding to those observations (P3) [26,45,47,48,49]. The city’s perceived-greenery shortfall informs monitoring design, and committee input alters indicator roles (P2–P3), without a completed spatial adjustment [21,33]. At Seinan Mori-no-Kohan Park, residents’ requests precede a revised design within a subsequently opened project (P3–P1); the changed shelter and planting arrangements create opportunities for comfort and use, but realized benefits (P2) are unmeasured [35,36,37]. These are site- or process-specific links, not one chain assembled across unrelated examples.
The park episode shows that the mechanisms need not occur in a fixed order: a user request can shape reorganization before service outcomes are assessed. ACROS shows the reverse evidentiary boundary: a documented intervention and later service observations need not lead to traceable adjustment. The two patterns qualify the initial linear presentation without proving a recurring cycle.
Alternative explanations remain plausible. River uses may follow recreation demand and permission; ACROS formed part of redevelopment; coastal opening followed land availability and works [26,27,44]. Indicator amendments may be routine plan preparation, and the playground forms part of a citywide programme. Table S4 records these alternatives. The single-case evidence cannot isolate their effects or the independent contribution of governance.
The case adds three qualifications: project-level renewal need not establish network completion; service evidence varies by setting and observation method; and feedback has distinct endpoints in text, design, implementation, and outcomes. Unmet municipal targets and constrained or rejected requests show where the proposed process is limited. These are refinements to the interpretation of the framework, not new causal mechanisms.
Table 4 summarizes supported components and missing steps. The record supports partial links among the propositions, without independently verifying an uninterrupted cycle or its effect on long-term performance.
Table 4.
Proposition–Evidence Assessment of Fukuoka’s Greenway Renewal.
5. Discussion
5.1. What the Fukuoka Case Adds to the SES Framework
The Fukuoka case refines the framework by showing why scale and evidence type need to be assessed separately. River paths, vertical greenery, and coastal phases are local interventions; their accumulation does not by itself establish completion of a municipal network, so P1 requires separate project- and route-level assessment. Evidence for P2 is similarly setting- and service-specific [47,48,49]. At ACROS, seasonal thermal observations and a late-stage fungal sample provide evidence beyond design description but address different questions and do not demonstrate whole-system improvement. Municipal gains alongside unmet targets further caution against treating physical provision as uniform service realization [21].
Evidence for P3 also varies by endpoint. Plan comments and park workshops show different levels of uptake [32,35,36]: a corrected target, a revised scheme, and an opened playground are distinct outcomes, none of which alone demonstrates improved subsequent outcomes or equal decision rights. Building on earlier work on planned space and everyday use [15], the framework specifies what records are needed to trace a later response. Its incremental contribution is to read partial process relationships across time—spatial change, context-dependent value evidence, and graded feedback endpoints—while recognizing that feedback can initiate redesign before benefits are measured. This conditional order and the remaining gaps make the proposed relationships testable without treating the three mechanisms as a verified cycle.
5.2. Comparison with International Greenway Practices
The international examples below offer literature-based contrasts in spatial unit, implementation organization, and outcome evidence. They help situate Fukuoka against different planning arrangements, but were not selected as controls or for a common-sample comparison.
5.2.1. Comparison with Singapore’s Park Connector Network
Singapore’s formally identified Park Connector Network reached a reported 393 km in 2024 [51], providing an island-wide programme against which Fukuoka’s analytical assemblage of corridors and nodes can be understood. Singapore’s consolidated National Parks Board also contrasts with the varied river, building, park, and coastal authorities in Fukuoka. These differences make network definition and coordination relevant points of comparison, although the reported network length has no directly comparable Fukuoka measure and does not establish the superiority of either governance arrangement.
5.2.2. Comparison with the Cheonggyecheon Restoration in Seoul
Cheonggyecheon provides a contrasting intervention scale: from 2003 to 2005, restoration replaced elevated transport infrastructure with approximately 5.84 km of urban stream corridor [52], while Fukuoka’s examples are dispersed and phased. A review of 86 studies found uneven treatment of Cheonggyecheon’s sustainability dimensions [53], and inclusion research identifies relocation costs and limits on participation [54]. These findings cannot be transferred to Fukuoka, but they underscore why physical improvement and visitor activity are incomplete evaluation criteria. A related distributional question appears in Fukuoka comment 25, which raised maintenance costs for privately owned, publicly accessible greenery; the official reply added a definition and area information but no cost-sharing measure [32]. Together with inclusive-playground design and access targets [21], this indicates that such concerns entered policy discussion, while leaving the distribution of burdens and benefits unresolved.
5.2.3. Comparison with Natural Infrastructure Planning in the San Francisco Bay Area
San Francisco Bay Area natural-infrastructure research combines ES and resilience assessment under coastal adaptation scenarios [42]. Its broader infrastructure scope and scenario methods differ from Fukuoka’s documentary design, but point to the data needed for assessing benefits and trade-offs. Across the examples, network definition, coordination, intervention scale, and outcome methods emerge as conditions relevant to applying the framework. Since the cases differ in scope and evidence, these contrasts situate the questions but do not validate transferability or provide counterfactual controls.
5.3. Transferability and Contextual Boundaries
The framework offers questions for application elsewhere rather than a model whose effectiveness has been established across cities. Local geography, available infrastructure, institutions, and data will shape which resources can be reorganized, which benefits can be observed, and which feedback reaches decisions. Application therefore begins by defining the network or sites under study: Fukuoka’s planning axes should remain distinct from verified public routes, and where responsibilities span agencies, project and maintenance records need to be followed across sectors to connect observations with action.
Equity remains a boundary of the present analysis. A distributional assessment would require evidence about access, inclusion in decisions, beneficiaries, and costs; this study reports related concerns and design responses but does not compare neighborhoods or demographic groups. Context also matters: inland cities may work with canals, rail corridors, vacant land, or street edges, and renewal processes may stop at different stages or follow another sequence. Comparative research should test these relationships rather than assume they recur.
5.4. Planning Implications
These contextual boundaries also shape the practical implications of the framework. The points below extend assessment beyond what this case can establish. First, map operational segments separately from network intentions so that a verified route inventory can establish whether local interventions add up to accessible connections, a question Figure 1 cannot resolve. Second, select performance measures for each setting: ACROS thermal and fungal evidence cannot substitute for river habitat, coastal conservation, or runoff observations. Any comparison should specify its scale, period, reference conditions, and uncertainty before benefits are attributed.
Third, follow consultation through decisions and subsequent work by recording accepted and rejected requests, reasons, design changes, as-built conditions, and later observations. The playground episode illustrates the value of this chain while also showing what cannot be concluded when outcome data are missing. Measures should also distinguish area, perceived greenery, ecological performance, and distribution; none can stand in for the others. Table S6 proposes a monitoring extension, but its indicators were not measured here, and the intervention thresholds have not been negotiated with stakeholders.
Future assessment could combine paired thermal observations, event-based runoff measurements, repeated habitat surveys, access and use records, and life-cycle costs. Budgets and contracts would help distinguish capital work, routine care, replacement, and unpaid labor. GI assessment also requires attention to uncertainty: Liu et al. examine how parameter choices and climate scenarios affect cost-effectiveness estimates [55], while Oluk et al. show that economic and environmental comparisons depend on functional units and life-cycle boundaries [56]. InVEST Urban Cooling and Urban Flood Risk Mitigation could complement field observations if locally validated [57,58]; the latter estimates retention, not inundation depth or verified avoided damage, and a two-dimensional land-cover model requires care when representing ACROS’s terraced form. Repeated ES mapping may locate change, but area-based values alone cannot establish realized benefits or who receives them. These methods are proposed for future work and were not applied in this study.
5.5. Research Limitations and Future Directions
The single-case design cannot isolate the effect of Fukuoka’s governance against a matched city, and international cases with different scope and measurements do not supply that comparison. The documentary record also has limits: government and operator sources may reproduce an administrative account and omit conflict, while selecting well-documented projects may introduce success bias. Cost–benefit distribution and social equity effects were not systematically analyzed.
No new interviews, systematic field investigation, or ecological monitoring were undertaken. Author photographs illustrate form. Published ACROS thermal campaigns and one 2022 fungal sampling exercise improve the evidence but do not supply continuous long-term monitoring [47,48,49]. Project-specific runoff, maintenance costs, biodiversity change, health, and comparable river/coastal outcomes remain unavailable in the checked sources.
Planning and design uptake can be traced, but item-level as-built and post-occupancy records are missing for the park episode [35,36,37]. PDCA/OODA and green-view monitoring remain prescribed procedures [21]. The original search and interpretive history cannot be fully reproduced because original retrieval logs were not kept and no formal coding protocol was used; the disclosed audit was compiled during revision. The supplementary park was selected during revision for its traceable design response and cannot establish feedback cycles across the three embedded settings. The contribution of feedback to long-term operation and its status as a necessary condition remain untested. Future work should connect route mapping, repeated ecological and use observations, project decisions, and maintenance records. Interviews and matched comparisons could clarify why feedback was adopted or constrained and test alternative explanations, including distributional effects.
6. Conclusions
This study constructs an SES framework and examines it through a documentary Fukuoka case across river, urban-core, and coastal settings. The propositions are theory-derived; the case supplies partial support and qualifications rather than empirical validation of a complete renewal cycle.
Local reuse, vertical greenery, and coastal stages support spatial reorganization without proving citywide connectivity. ACROS studies provide partial ecological-function evidence relevant to P2, while sustained social-use coupling and comparable service outcomes remain unverified [47,48,49]. Public and expert input enters planning text and indicator design [32,33]; the supplementary playground episode extends the record to a revised scheme and later opening, without verifying each as-built change or subsequent benefits [35,36,37]. These records support the uptake component of P3, without testing its long-term operational contribution or necessary-condition relationship.
The contribution relates spatial change, setting-specific value evidence, and graded feedback endpoints. Observed links can run from intervention to service evidence or from user requests to redesign, without completing a recurring cycle. Resilience remains a capacity to be tested through repeated responses, not an outcome established here.
For practice, the framework supports separate checks of built connections, ecological and social outcomes, and the decisions made in response to information. Future monitoring and comparative research are needed to assess effectiveness, maintenance burdens, and distributional consequences under different institutional conditions.
Supplementary Materials
The following supporting information can be downloaded at: https://www.mdpi.com/article/10.3390/land15112025/s1.
Author Contributions
Conceptualization, Y.Z. and H.Y.; Formal analysis, Y.Z., H.Y., Q.S., X.W., L.W. and C.S.; Funding acquisition, Y.Z., Q.S. and X.W.; Investigation, Y.Z., H.Y., Q.S., X.W., L.W. and C.S.; Methodology, Y.Z., H.Y. and Q.S.; Supervision, Y.Z. and Q.S.; Visualisation, Y.Z., H.Y. and Q.S.; Writing—original draft, Y.Z., H.Y. and Q.S. All authors have read and agreed to the published version of the manuscript.
Funding
This research was funded by Shandong Provincial Natural Science Foundation, grant number ZR2024QE422.
Institutional Review Board Statement
Not applicable.
Informed Consent Statement
Not applicable.
Data Availability Statement
Supplementary Tables S1–S4 disclose 18 case records, judgment rules, 26 selected observations, and episode assessments. Section S5 gives retrieval routes, actual revision-stage queries and decisions, and map provenance; Table S6 proposes future measurements. Supplementary_Research_Records.xlsx contains the Source register, Search record, Access record, and Selection record worksheets. Figure1_Geographic_Data.xlsx provides the park nodes and ward statistics; the GeoJSON and figure exports also accompany the supplement. These records make the revision-stage check traceable but do not replace missing original search or coding records. No new interviews or independent ecological monitoring were undertaken.
Acknowledgments
The authors thank governmental agencies and public institutions in Fukuoka for providing public planning documents, reports, and project materials. This study was partly conducted through a collaborative project involving Agencysoft Co. Ltd. and The University of Kitakyushu.
Conflicts of Interest
The authors declare no conflicts of interest.
References
- Seto, K.C.; Güneralp, B.; Hutyra, L.R. Global forecasts of urban expansion to 2030 and direct impacts on biodiversity and carbon pools. Proc. Natl. Acad. Sci. USA 2012, 109, 16083–16088. [Google Scholar] [CrossRef] [Scilit]
- Benedict, M.A.; McMahon, E.T. Green Infrastructure: Linking Landscapes and Communities; Island Press: Washington, DC, USA, 2006. [Google Scholar]
- Eggermont, H.; Balian, E.; Azevedo, J.M.N.; Beumer, V.; Brodin, T.; Claudet, J.; Fady, B.; Grube, M.; Keune, H.; Lamarque, P.; et al. Nature-based solutions: New influence for environmental management and research in Europe. GAIA 2015, 24, 243–248. [Google Scholar] [CrossRef] [Scilit]
- Ahern, J. Greenways as a planning strategy. Landsc. Urban Plan. 1995, 33, 131–155. [Google Scholar] [CrossRef] [Scilit]
- Horte, O.S.; Eisenman, T.S. Urban greenways: A systematic review and typology. Land 2020, 9, 40. [Google Scholar] [CrossRef] [Scilit]
- Tzoulas, K.; Korpela, K.; Venn, S.; Yli-Pelkonen, V.; Kaźmierczak, A.; Niemelä, J.; James, P. Promoting ecosystem and human health in urban areas using green infrastructure: A literature review. Landsc. Urban Plan. 2007, 81, 167–178. [Google Scholar] [CrossRef] [Scilit]
- Hansen, R.; Pauleit, S. From multifunctionality to multiple ecosystem services? A conceptual framework for multifunctionality in green infrastructure planning for urban areas. Ambio 2014, 43, 516–529. [Google Scholar] [CrossRef] [Scilit]
- Berkes, F.; Folke, C. (Eds.) Linking Social and Ecological Systems: Management Practices and Social Mechanisms for Building Resilience; Cambridge University Press: Cambridge, UK, 1998. [Google Scholar]
- Ostrom, E. A general framework for analyzing sustainability of social–ecological systems. Science 2009, 325, 419–422. [Google Scholar] [CrossRef] [Scilit]
- Walker, B.; Holling, C.S.; Carpenter, S.R.; Kinzig, A. Resilience, adaptability and transformability in social–ecological systems. Ecol. Soc. 2004, 9, 5. [Google Scholar] [CrossRef] [Scilit]
- Folke, C.; Hahn, T.; Olsson, P.; Norberg, J. Adaptive governance of social–ecological systems. Annu. Rev. Environ. Resour. 2005, 30, 441–473. [Google Scholar] [CrossRef] [Scilit]
- Bodin, Ö. Collaborative environmental governance: Achieving collective action in social–ecological systems. Science 2017, 357, eaan1114. [Google Scholar] [CrossRef] [Scilit]
- McPhearson, T.; Cook, E.M.; Berbés-Blázquez, M.; Cheng, C.; Grimm, N.B.; Andersson, E.; Barbosa, O.; Chandler, D.G.; Chang, H.; Chester, M.V.; et al. A social–ecological–technological systems framework for urban ecosystem services. One Earth 2022, 5, 505–518. [Google Scholar] [CrossRef] [Scilit]
- Tzoulas, K.; Galan, J.; Venn, S.; Dennis, M.; Pedroli, B.; Mishra, H.; Haase, D.; Pauleit, S.; Niemelä, J.; James, P. A conceptual model of the social–ecological system of nature-based solutions in urban environments. Ambio 2021, 50, 335–345. [Google Scholar] [CrossRef] [Scilit]
- Huang, H.; Qi, J.; Xiao, S.; Wende, W.; Xin, Y. A reflection on the implementation of a waterfront greenway from a social–ecological perspective: A case study of Huangyan-Taizhou in China. Land 2024, 13, 989. [Google Scholar] [CrossRef] [Scilit]
- Andersson, E.; Borgström, S.; Haase, D.; Langemeyer, J.; Mascarenhas, A.; McPhearson, T.; Wolff, M.; Łaszkiewicz, E.; Kronenberg, J.; Barton, D.N.; et al. A context-sensitive systems approach for understanding and enabling ecosystem service realization in cities. Ecol. Soc. 2021, 26, 35. [Google Scholar] [CrossRef] [Scilit]
- Keeler, B.L.; Hamel, P.; McPhearson, T.; Hamann, M.H.; Donahue, M.L.; Meza Prado, K.A.; Arkema, K.K.; Bratman, G.N.; Brauman, K.A.; Finlay, J.C.; et al. Social–ecological and technological factors moderate the value of urban nature. Nat. Sustain. 2019, 2, 29–38. [Google Scholar] [CrossRef] [Scilit]
- Flynn, C.D.; Davidson, C.I. Adapting the social–ecological system framework for urban stormwater management: The case of green infrastructure adoption. Ecol. Soc. 2016, 21, 19. [Google Scholar] [CrossRef] [Scilit]
- Razzaghi Asl, S.; Pearsall, H. How do different modes of governance support ecosystem services/disservices in small-scale urban green infrastructure? A systematic review. Land 2022, 11, 1247. [Google Scholar] [CrossRef] [Scilit]
- Mabon, L.; Kondo, K.; Kanekiyo, H.; Hayabuchi, Y.; Yamaguchi, A. Fukuoka: Adapting to climate change through urban green space and the built environment? Cities 2019, 93, 273–285. [Google Scholar] [CrossRef] [Scilit]
- Fukuoka City. Fukuoka City Green Basic Plan; Fukuoka City Government: Fukuoka, Japan, 2025. Available online: https://www.city.fukuoka.lg.jp/jutaku-toshi/koenkeikaku/midori/midorinokihonkeikaku.html (accessed on 24 August 2026). (In Japanese)
- Fukuoka City. The Tenth Fukuoka City Basic Plan (Dai-jūji Fukuoka-shi Kihon Keikaku); Fukuoka City Government: Fukuoka, Japan, 2024. Available online: https://gikai.city.fukuoka.lg.jp/wp-content/uploads/2024/12/gian254.pdf (accessed on 8 October 2026). (In Japanese)
- Yin, R.K. Case Study Research and Applications: Design and Methods, 6th ed.; SAGE Publications: Thousand Oaks, CA, USA, 2018. [Google Scholar]
- George, A.L.; Bennett, A. Case Studies and Theory Development in the Social Sciences; MIT Press: Cambridge, MA, USA, 2005. [Google Scholar]
- Fukuoka City Biodiversity Web Center. Walking Along the Muromi River Promenade. Available online: https://seibutsutayousei.city.fukuoka.lg.jp/learning/1353/ (accessed on 24 August 2026). (In Japanese)
- ACROS Fukuoka. About ACROS Fukuoka. Available online: https://www.acros.or.jp/english/floor/about.html (accessed on 24 August 2026).
- Kyushu Regional Development Bureau; Ministry of Land, Infrastructure, Transport and Tourism. Overview of Uminonakamichi Seaside Park. Available online: https://www.qsr.mlit.go.jp/uminaka/profile/gaiyou.html (accessed on 24 August 2026). (In Japanese)
- Fukuoka City. Fukuoka City Urban Parks (Shape File; Source File 20231013_fukuoka_park.shp); Fukuoka City Open Data Catalogue (BODIK). Available online: https://data.bodik.jp/dataset/8e2dc913-3fe9-4c4f-8687-9456ed76dfc8 (accessed on 11 October 2026). (In Japanese)
- Center for Open Data in the Humanities. Geoshape Historical Administrative Areas Dataset: Administrative Boundaries for Fukuoka City, 1 January 2023; Derived from MLIT National Land Numerical Information. Available online: https://geoshape.ex.nii.ac.jp/city/resource/40130A1972.html (accessed on 10 October 2026).
- OpenStreetMap Contributors. OpenStreetMap Geographic Data for Fukuoka: Watercourses and Reference Locations; Geographic Extract. 10 October 2026. Available online: https://tile.openstreetmap.jp/styles/openmaptiles#10/33.590/130.402 (accessed on 10 October 2026).
- Collier, D. Understanding process tracing. PS Political Sci. Politics 2011, 44, 823–830. [Google Scholar] [CrossRef] [Scilit]
- Fukuoka City. Results of Public Comments on the Draft Fukuoka City Green Basic Plan (Fukuoka-shi Midori no Kihon Keikaku: Public Comment Results); Fukuoka City Government: Fukuoka, Japan, 2025; Available online: https://www.city.fukuoka.lg.jp/jutaku-toshi/koenkeikaku/midori/documents/shiminken.pdf (accessed on 8 October 2026). (In Japanese)
- Fukuoka City. Responses to Opinions from the Third Green Basic Plan Review Committee (Materials for the Fourth Committee Meeting, 3 December 2024); Fukuoka City Government: Fukuoka, Japan, 2024; Available online: https://www.city.fukuoka.lg.jp/jutaku-toshi/koenkeikaku/midori/documents/04shiryo.pdf (accessed on 9 October 2026). (In Japanese)
- Fukuoka City. Guidance for Developing Inclusive Children’s Playgrounds; Fukuoka City Government: Fukuoka, Japan, 2023; Available online: https://www.city.fukuoka.lg.jp/jutaku-toshi/koenkensetsu/midori/inclusive/documents/seibisisinn.pdf (accessed on 12 October 2026). (In Japanese)
- Fukuoka City. Seinan Mori-no-Kohan Park Inclusive Playground Workshop News, Vol. 3: Workshop Held on 18 November 2023; Fukuoka City Government: Fukuoka, Japan, 2023; Available online: https://www.city.fukuoka.lg.jp/jutaku-toshi/koenkensetsu/midori/inclusive/documents/seinanmori_wsnews_03.pdf (accessed on 12 October 2026). (In Japanese)
- Fukuoka City. Seinan Mori-no-Kohan Park Inclusive Playground Workshop News, Vol. 4: Workshop Held on 23 December 2023; Fukuoka City Government: Fukuoka, Japan, 2023; Available online: https://www.city.fukuoka.lg.jp/jutaku-toshi/koenkensetsu/midori/inclusive/documents/seinanmori_wsnews_04.pdf (accessed on 12 October 2026). (In Japanese)
- Fukuoka City. Inclusive Children’s Playgrounds in Fukuoka City. Available online: https://www.city.fukuoka.lg.jp/jutaku-toshi/koenkensetsu/midori/inclusive/inclusive_park_in_FukuokaCity.html (accessed on 12 October 2026). (In Japanese)
- Ostrom, E. Background on the institutional analysis and development framework. Policy Stud. J. 2011, 39, 7–27. [Google Scholar] [CrossRef] [Scilit]
- Pahl-Wostl, C. A conceptual framework for analysing adaptive capacity and multi-level learning processes in resource governance regimes. Glob. Environ. Change 2009, 19, 354–365. [Google Scholar] [CrossRef] [Scilit]
- Berkes, F.; Colding, J.; Folke, C. (Eds.) Navigating Social–Ecological Systems: Building Resilience for Complexity and Change; Cambridge University Press: Cambridge, UK, 2003. [Google Scholar]
- Folke, C.; Biggs, R.; Norström, A.V.; Reyers, B.; Rockström, J. Social–ecological resilience and biosphere-based sustainability science. Ecol. Soc. 2016, 21, 41. [Google Scholar] [CrossRef] [Scilit]
- Hamel, P.; Hamann, M.; Kuiper, J.J.; Andersson, E.; Arkema, K.K.; Silver, J.M.; Daily, G.C.; Guerry, A.D. Blending ecosystem service and resilience perspectives in planning of natural infrastructure: Lessons from the San Francisco Bay Area. Front. Environ. Sci. 2021, 9, 601136. [Google Scholar] [CrossRef] [Scilit]
- Fukuoka City. Ordinance on Green Space Conservation and Greening Promotion; Ordinance No. 32, Adopted 1974; Current Consolidated Text; Fukuoka City Government: Fukuoka, Japan; Available online: https://www.city.fukuoka.lg.jp/d1w_reiki/reiki_honbun/q003RG00000670.html (accessed on 24 August 2026). (In Japanese)
- Fukuoka City. Utilization of River Spaces. Available online: https://www.city.fukuoka.lg.jp/doro-gesuido/kasenkanri/hp/citizen/ri-katsuyo/utilization.html (accessed on 11 October 2026). (In Japanese)
- ACROS Fukuoka. Step Garden. Available online: https://www.acros.or.jp/r_facilities/stepgarden.html (accessed on 24 August 2026). (In Japanese)
- Uminonakamichi Seaside Park. Environmental Initiatives. Available online: https://uminaka-park.jp/other/environment/ (accessed on 24 August 2026). (In Japanese)
- Hagishima, A.; Narita, K.-i.; Tanimoto, J.; Misaka, I.; Matsushima, A.; Onoue, M. Field measurement on the micro climate around the building with the large stepped roof garden. J. Environ. Eng. (Trans. AIJ) 2004, 69, 47–54, (In Japanese with English abstract). [Google Scholar] [CrossRef] [Scilit]
- Takayama, N.; Yamamoto, H.; Iwaya, K.; Wang, F.; Harada, Y.; Higashiyama, M.; Tsuchiya, Y.; Kaneishi, A.; Shirozu, T. Quantitative Evaluation of Urban Heat Island Mitigation Effect and Reduction Human Heat Stress by Large Greening of Roof. J. Agric. Meteorol. 2008, 64, 257–270, (In Japanese with English abstract). [Google Scholar] [CrossRef] [Scilit]
- Osawa, S.; Yoshioka, T.; Nose, A.; Higo, M. Fungal fauna in the planting substrate of rooftop greenery at ACROS Fukuoka, 27 years after construction. J. Jpn. Soc. Reveget. Technol. 2024, 49, 320–325, (In Japanese with English abstract). [Google Scholar] [CrossRef] [Scilit]
- Fukuoka City. Fukuoka Urban Landscape Award. Available online: https://www.city.fukuoka.lg.jp/jutaku-toshi/toshikeikan/fukuoka_keikan/prize.html (accessed on 24 August 2026). (In Japanese)
- National Parks Board. Our Growth, for Nature: NParks Annual Report 2024/2025; National Parks Board: Singapore, 2025. Available online: https://www.nparks.gov.sg/docs/default-source/resources/annual-report/ar-2024-25/nparks-ar-2025_6-oct_no-fs_pdf-a.pdf (accessed on 24 August 2026).
- Seoul Metropolitan Government. Cheonggyecheon Stream. Available online: https://english.seoul.go.kr/service/amusement/stream/1-cheonggyecheon/ (accessed on 24 August 2026).
- Kim, H.; Jung, Y. Is Cheonggyecheon sustainable? A systematic literature review of a stream restoration in Seoul, South Korea. Sustain. Cities Soc. 2019, 45, 59–69. [Google Scholar] [CrossRef] [Scilit]
- Kim, Y.J.; Yang, H.J. Rethinking Cheonggye Stream Restoration Project: Is urban greening strategy socially inclusive? Land Use Policy 2023, 131, 106742. [Google Scholar] [CrossRef] [Scilit]
- Liu, K.; Kinouchi, T.; Zhao, G.; Johnson, F.; Zhang, K. Cost-effectiveness of green infrastructure under climate change: Model parameterization, uncertainty, and sensitivity. J. Hydrol. 2025, 661, 133796. [Google Scholar] [CrossRef] [Scilit]
- Oluk, I.; Del Rey, S.; Foltz, M.E.; Schussler, J.C.; Byrne, D.M. Characterizing sustainability of green stormwater infrastructure technologies using life cycle assessment and life cycle costing: A systematic review. Water Res. 2026, 288, 124586. [Google Scholar] [CrossRef] [Scilit]
- Natural Capital Project. Urban Cooling. InVEST User Guide. Available online: https://storage.googleapis.com/releases.naturalcapitalproject.org/invest-userguide/latest/en/urban_cooling_model.html (accessed on 11 October 2026).
- Natural Capital Project. Urban Flood Risk Mitigation. InVEST User Guide. Available online: https://storage.googleapis.com/releases.naturalcapitalproject.org/invest-userguide/latest/en/urban_flood_mitigation.html (accessed on 11 October 2026).

Disclaimer/Publisher’s Note: The statements, opinions and data contained in all publications are solely those of the individual author(s) and contributor(s) and not of MDPI and/or the editor(s). MDPI and/or the editor(s) disclaim responsibility for any injury to people or property resulting from any ideas, methods, instructions or products referred to in the content. |
© 2026 by the authors. Licensee MDPI, Basel, Switzerland. This article is an open access article distributed under the terms and conditions of the Creative Commons Attribution (CC BY) license.