


Abstract
Cultural heritage is widely recognized as a critical resource for urban regeneration and sustainable regional development, yet its value realization depends on adequate supporting conditions. While existing studies have examined the spatial distribution of heritage resources, frameworks that jointly address resource endowments and regional support capacities remain scarce. This study constructs a two-dimensional evaluation system comprising Cultural Heritage Value (CHV) and Heritage Regeneration Support Capacity (HRSC), and proposes a two-stage CRITIC method. An empirical analysis is conducted across 84 county-level units in Fujian Province, integrating five categories of cultural heritage data and POI-based urban functional data. The CRITIC method is applied separately within CHV and HRSC, followed by a second-stage weighting to calculate the Cultural Heritage-led Urban Regeneration Potential Index (CHURPI). Spatial patterns are examined through kernel density estimation, typology classification, and spatial autocorrelation analysis. Four key findings emerge. First, the five heritage categories exhibited differentiated spatial clustering, supporting the need for multi-type integrated assessment. Second, high-CHV counties were widely distributed across coastal and mountainous areas, whereas high-HRSC counties were concentrated in core metropolitan areas such as Fuzhou and Xiamen, indicating a notable spatial mismatch between heritage endowment and support capacity. Third, only 8.3% of counties were classified as high-potential, mainly clustered in the northeast, with a global Moran’s I of 0.161 (p < 0.001) indicating a weak-to-moderate but statistically significant positive spatial autocorrelation. Fourth, traditional village density (0.386) and functional diversity (0.509) received the highest weights within CHV and HRSC, respectively. These weights indicate that the two indicators are the most information-rich and least redundant within the selected indicator system, rather than universally the most important drivers of heritage-led regeneration. With this caveat, the results are consistent with the interpretation that traditional settlements serve as primary heritage carriers in Fujian and that diversified functional environments may be more conducive to heritage value translation than single-type facility provision. The framework offers an operational pathway for identifying heritage-led regeneration potential and supporting differentiated cultural resource allocation.
1. Introduction
1.1. Background
Rapid urbanization and land spatial transformation are driving urban development from greenfield expansion towards stock renewal and sustainable utilization. In this process, the objectives of urban regeneration are no longer confined to physical improvement, but increasingly emphasize local distinctiveness, socio-cultural continuity, and the reuse of existing spatial resources [1,2]. Cultural heritage has thus gradually shifted from a traditionally protected object to an important resource for urban regeneration and sustainable regional development [3,4]. Cultural heritage carries historical information and place memory. It also supports local economic and social development through cultural tourism, spatial reuse, cultural industries, and community activities [5].
This recognition is closely related to the recent paradigm shift in cultural heritage conservation. The Historic Urban Landscape (HUL) approach proposed by UNESCO emphasizes that historic urban environments should be managed within broader social, economic, and spatial contexts, rather than treating heritage as isolated conservation objects [6,7]. Consequently, cultural heritage conservation has gradually evolved from a narrow focus on physical preservation towards an integrated coordination of conservation, utilization, planning, and development [8]. Related studies have also demonstrated that historic environments and cultural heritage can provide unique endogenous resources for urban regeneration, contributing to economic vitality, social identity, and spatial quality enhancement [9].
However, cultural heritage does not automatically translate into regeneration outcomes. The presence of heritage resources forms only the basis of potential value; their actual contribution depends on whether regions possess adequate conditions for utilization and support [10,11]. Research on cultural tourism indicates that heritage tourism development relies not only on attractive cultural resources, but is also influenced by transport accessibility, tourism facilities, service capacity, and the local economic environment [12]. Similarly, the adaptive reuse of historic buildings and industrial heritage can achieve functional renewal of existing spaces, yet its implementation outcomes are equally affected by location, market demand, public services, and governance conditions [13].
Therefore, the relationship between cultural heritage and urban regeneration is not a simple “resource quantity—development outcome” nexus, but rather a value transformation process co-determined by the heritage resource base and regional support conditions [14]. Mountainous counties with abundant resources may possess numerous traditional villages and cultural heritage sites, yet their regeneration potential may not necessarily be high due to constraints in transportation, public services, and tourism utilization conditions. Conversely, urban core areas, despite having relatively limited heritage resource density, may exhibit stronger capacity for heritage value transformation by virtue of well-developed cultural services, tourism facilities, and urban functions. Hence, identifying the spatial relationship between cultural heritage resource endowments and regional support conditions is of critical importance for understanding heritage-led urban regeneration potential. This study uses “urban regeneration” in a broad sense, referring to heritage-led regeneration beyond urban built-up areas, including county-level territorial units and their rural and regional heritage resources.
1.2. Literature Review
1.2.1. Cultural Heritage and Sustainable Urban Regeneration
The relationship between cultural heritage and urban regeneration has become a prominent topic in heritage conservation, urban planning, and sustainable development studies [15]. Early research primarily focused on reconciling heritage preservation with economic development, whereas recent studies have increasingly treated cultural heritage as a comprehensive resource for local development and urban regeneration [16,17]. Cultural heritage generates economic value through cultural tourism, commercial activities, and cultural industries, while simultaneously strengthening local identity, community participation, and social cohesion, thereby producing social effects that extend beyond physical conservation [1,18].
In terms of spatial renewal, the adaptive reuse of historic buildings, historic districts, and industrial heritage is widely regarded as a crucial pathway linking heritage conservation and urban regeneration [19]. By introducing new functions such as commerce, culture, public services, and leisure, existing heritage spaces can meet contemporary societal needs while retaining historic character, thus avoiding marginalization due to functional obsolescence [20]. Meanwhile, cultural heritage also serves as a symbolic resource for local development, enhancing regional attractiveness by shaping distinctive urban images and place brands [21].
Nevertheless, the value of cultural heritage is not entirely predetermined by its material attributes. Recent research has increasingly emphasized the socially constructed nature of heritage value, whereby heritage significance is continuously reinterpreted through social use, cultural identity, community participation, and interactions among diverse stakeholders [22,23]. This implies that there is no fixed causal relationship between heritage conservation and urban regeneration; heritage resources can only realize their developmental value when embedded in specific socio-economic and spatial contexts [24].
Therefore, from the perspective of sustainable urban regeneration, heritage research needs to shift from asking how much value heritage resources possess towards examining under what regional conditions heritage value can be effectively translated. This recognition provides a theoretical foundation for understanding heritage-led regeneration potential from both resource endowment and external support dimensions.
1.2.2. Spatial Assessment of Cultural Heritage Resources
The advancement of GIS and spatial analysis techniques has provided new methodological tools for regional assessment of cultural heritage resources. Existing studies have widely employed GIS, kernel density estimation, spatial autocorrelation, and hotspot analysis to identify the spatial distribution of historic buildings, historic districts, traditional villages, cultural landscapes, and intangible cultural heritage, and further analyzed their spatial clustering, regional disparities, and evolutionary characteristics [25,26,27]. These studies are of significant value for heritage conservation zoning, cultural resource integration, and regional spatial planning [28].
With the increasing availability of multi-source spatial data, heritage spatial research has also expanded from single-type analysis towards integrated assessment of multiple heritage categories. Different heritage types exhibit notable variations in their formation mechanisms and spatial manifestations [29]. For instance, traditional villages are often closely associated with physiographic environments and historical settlement patterns, whereas historic cultural towns, historic buildings, and intangible cultural heritage tend to display distinct spatial clustering modes [30,31]. Therefore, synthesizing multiple heritage types contributes to a more comprehensive understanding of regional cultural heritage endowments.
However, existing spatial assessment studies primarily address where heritage resources are located and how they are distributed, while paying insufficient attention to whether these resources possess the conditions for further translation into regional regeneration dynamics [32]. Higher resource density does not necessarily imply superior utilization conditions. Mountainous traditional villages, for instance, may have high heritage density. Their capacity to transform heritage value, however, may be limited by poor transport, weak public services, and few tourism facilities. Conversely, urban core areas, despite possessing relatively limited heritage resources, may leverage well-established commercial, cultural, and public service systems to achieve stronger resource utilization capacity [33].
Consequently, heritage spatial assessment should not be confined to resource distribution mapping, but must further attend to the spatial relationship between the resource base and external environments [34]. This shift links traditional heritage resource evaluation with regional development conditions, and opens up research space for further assessing heritage-led urban regeneration potential.
1.2.3. Multi-Criteria Evaluation of Heritage-Led Regeneration Potential
This shift from resource mapping to resource–context matching calls for evaluation methods that can handle multiple dimensions simultaneously. Multi-criteria evaluation provides an effective approach for analyzing regional development issues with multidimensional attributes [35]. Studies on urban sustainability, eco-environmental quality, land use efficiency, and regional development potential have widely adopted multi-criteria decision-making methods to integrate diverse resource, environmental, and socio-economic factors into unified evaluation frameworks [36,37]. Among these, Criteria Importance Through Inter-criteria Correlation (CRITIC) is an objective weighting method that determines indicator weights based on the degree of variation and conflict among indicators, whereas Technique for Order Preference by Similarity to an Ideal Solution (TOPSIS) is primarily a ranking method that evaluates and ranks alternatives according to their distance to an ideal solution. In practice, the two are often combined: weights derived from CRITIC (or other weighting methods) are fed into TOPSIS to rank spatial units. This combination makes them suitable for regional evaluation problems involving multiple dimensions and indicators [38,39].
In cultural heritage research, the advantages of multi-criteria evaluation are mainly reflected in two aspects. First, cultural heritage itself is inherently multidimensional. Historic buildings, traditional villages, historic cultural towns, intangible cultural heritage, and religious cultural spaces each reflect different dimensions of historical, social, and cultural value. Relying solely on a single heritage type is insufficient to fully characterize the regional cultural resource base. Incorporating diverse heritage types into comprehensive evaluation can reduce the bias caused by single-indicator assessment [39,40].
Second, heritage-led regeneration essentially involves the alignment between resource value and regional development conditions. The utilization of heritage resources is influenced by multiple factors, including infrastructure, public services, tourism functions, and the local economic environment [41]. Therefore, evaluating cultural heritage resources and regional support conditions separately, and further examining their spatial matching relationship, is more conducive to explaining potential differences across regions than simply aggregating all indicators directly [18,42].
Thus, multi-criteria evaluation provides a methodological foundation for identifying heritage-led urban regeneration potential from multiple dimensions. However, how to distinguish cultural heritage resource endowments from external support conditions at the regional scale, and further identify their spatial matching relationships, remains an open question requiring further investigation.
While previous studies have applied GIS, multi-criteria decision-making (MCDM), and indicator-based approaches to heritage assessment, they have mainly focused on identifying heritage values, prioritizing adaptive reuse options, or evaluating cultural tourism potential within individual sites or districts. For example, GIS-based studies have mapped the spatial distribution and tourism potential of intangible cultural heritage resources [43], while MCDM studies have developed frameworks for prioritizing adaptive reuse alternatives using methods such as Stepwise Weight Assessment Ratio Analysis–Weighted Aggregated Sum Product Assessment [44]. Similarly, adaptive reuse evaluation frameworks have been developed to assess post-reuse performance of heritage buildings, and cultural tourism potential assessments have been conducted in traditional villages [45,46,47]. These studies have substantially advanced the operationalization of heritage evaluation, but they generally treat heritage resources and their supporting conditions as a single evaluative object, or assess them at the site or project scale. As a result, they do not systematically examine whether the spatial distribution of heritage resources aligns with the regional conditions required to translate heritage value into regeneration outcomes. The present study addresses this gap by separating heritage endowment from regeneration-support capacity at the county scale and by explicitly assessing the spatial mismatch between the two.
1.3. Research Objectives and Contributions
This study constructs two evaluation dimensions—Cultural Heritage Value (CHV) and Heritage Regeneration Support Capacity (HRSC)—and employs a two-stage CRITIC method to evaluate both dimensions and their combined regeneration potential. Furthermore, through CHV–HRSC typology classification and spatial autocorrelation analysis, this study identifies the resource–support relationships across counties and their spatial clustering characteristics. The research focuses on three questions: (1) What spatial distribution patterns do different types of cultural heritage resources exhibit in Fujian Province? (2) What matching relationships exist between cultural heritage value and regional regeneration support capacity in spatial terms? (3) What spatial differentiation and clustering characteristics does county-level cultural heritage-led urban regeneration potential display?
The main contribution of this study is not the application of CRITIC or GIS techniques per se, but the conceptual and analytical distinction between cultural heritage endowment (CHV) and the regional support conditions (HRSC) that jointly determine whether heritage value can be translated into urban regeneration potential. This distinction reframes heritage-led regeneration as a matching problem between resource endowments and support capacities, rather than a simple function of resource quantity. The two-stage CRITIC method, the CHURPI index, the CHV–HRSC typology, and the spatial clustering analysis are presented as operational tools that support this argument, rather than as ends in themselves. By making this distinction explicit, the study provides a transferable framework for identifying where heritage resources are most likely to be translated into regeneration outcomes, and where support conditions must first be strengthened.
2. Materials and Methods
2.1. Research Framework
Based on this understanding, this study constructs an analytical framework of “CHV—HRSC—Cultural Heritage-led Urban Regeneration Potential Index (CHURPI)” to assess the potential capacity of converting cultural heritage resources into urban regeneration momentum across different counties. CHV characterizes county-level cultural heritage resource endowments, HRSC reflects the regional functional support conditions on which the dissemination, utilization, and continuous revitalization of heritage resources depend, and CHURPI comprehensively measures the potential regeneration capacity formed under their joint effects. This study evaluates the potential regeneration capacity based on cultural heritage resource endowments and regional support conditions, rather than the current level of urban renewal or existing regeneration outcomes.
As shown in Figure 1, the research workflow consists of five main steps. First, multi-source cultural heritage data and urban functional data are integrated to construct a county-level spatial database. Second, the indicator systems for CHV and HRSC are established. Third, the two-stage CRITIC method is applied to calculate CHV, HRSC, and the final CHURPI. Fourth, the resource–support matching types across counties are identified based on the combined relationship between CHV and HRSC. Finally, kernel density estimation (KDE), the Jenks natural breaks classification, and spatial autocorrelation analysis are employed to reveal the spatial patterns of cultural heritage resources and CHURPI.
Figure 1.
Analytical workflow of the study.
2.2. Study Area and Spatial Evaluation Unit
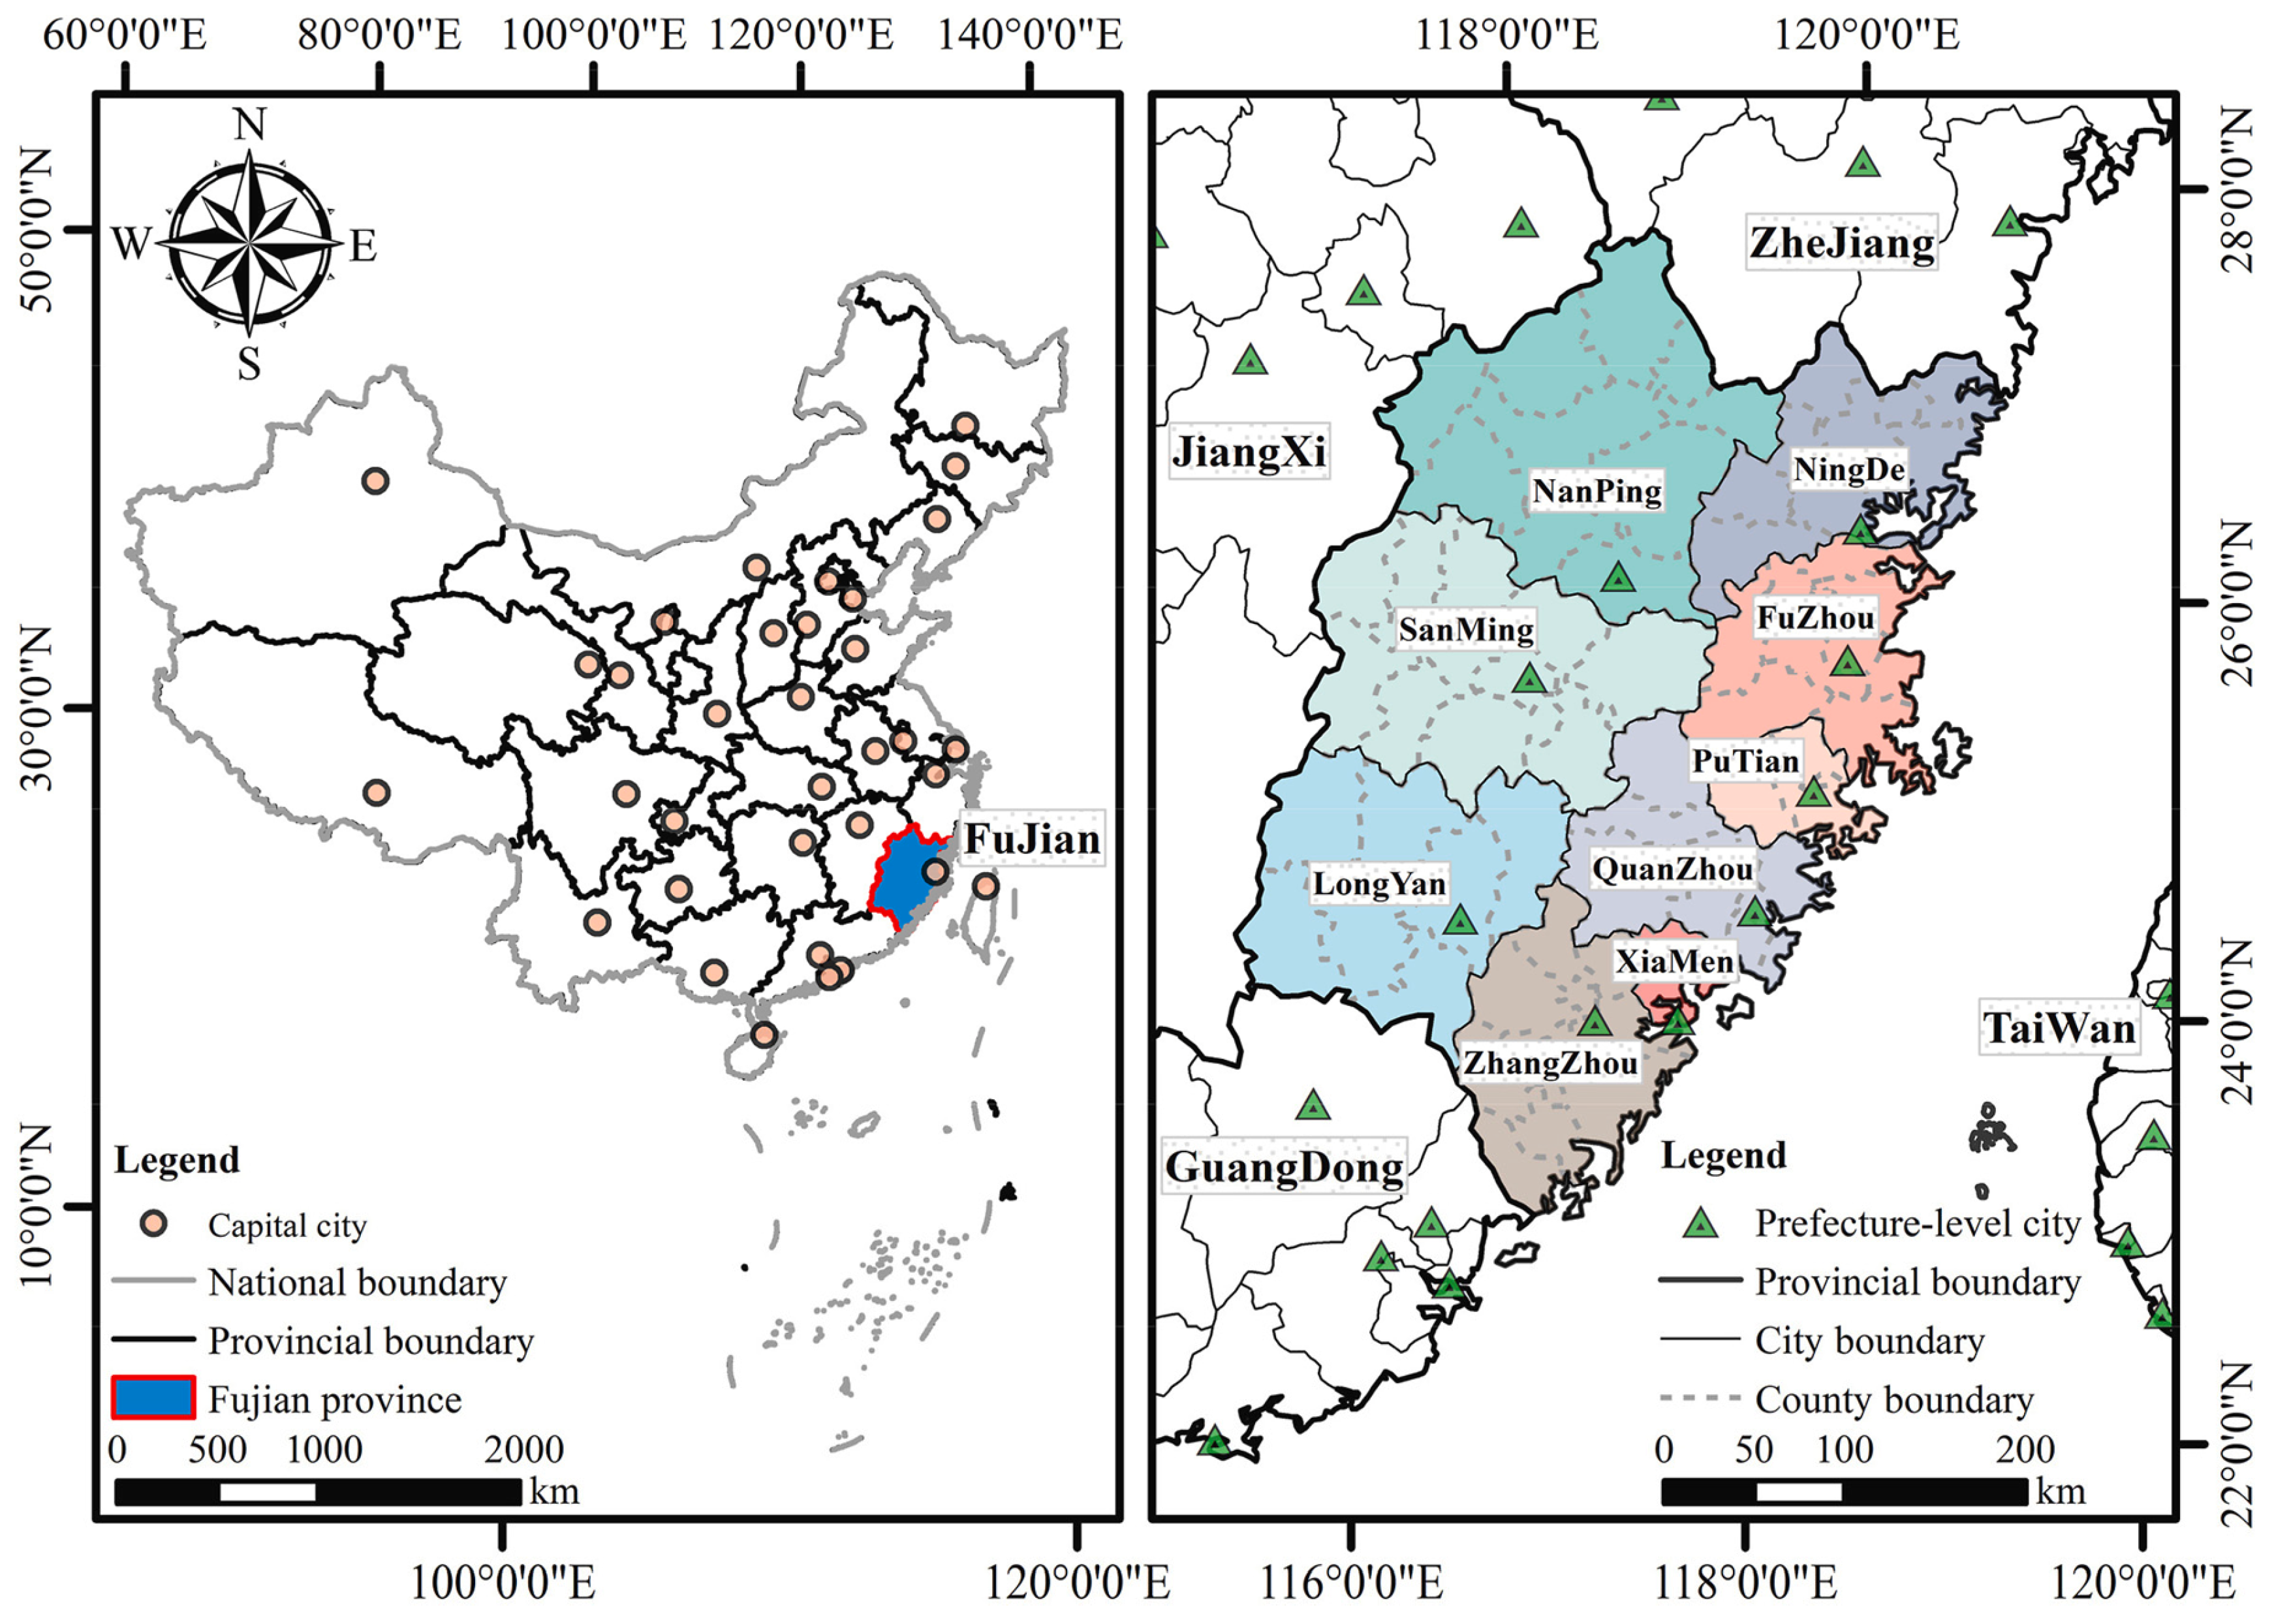
This study selects Fujian Province as the research area, as shown in Figure 2. Fujian is located in the southeastern coastal region of China (23°12′–28°35′ N, 115°40′–120°55′ E) and possesses a long history of development and a diverse cultural background. The province administers nine prefecture-level cities: Fuzhou, Xiamen, Zhangzhou, Quanzhou, Sanming, Putian, Nanping, Longyan, and Ningde. Shaped by long-term maritime trade, population migration, regional exchanges, and multicultural interactions, Fujian has developed a culturally significant heritage system with distinctive regional characteristics, giving rise to diverse tangible and intangible cultural heritage carriers [48].
Meanwhile, notable regional development disparities exist within Fujian. Coastal areas, represented by Fuzhou, Xiamen, and Quanzhou, exhibit higher urbanization levels, more complete public service facilities, and stronger tourism and consumption capacity. In contrast, certain mountainous and traditional settlement areas possess abundant historical and cultural resources, yet face constraints in realizing the value of these heritage resources due to population loss, relatively lower economic development levels, and limited public services and tourism utilization capacity [49]. This spatial condition—where heritage resource endowments and regional development support conditions are not fully aligned—provides a strategic test case for analyzing the matching relationship between the heritage resource base and support capacity.
Fujian is therefore selected not as a statistically representative coastal province, but as a strategic test case in which cultural heritage resources and regional support conditions are spatially mismatched. The province combines a heritage-rich but unevenly developed coastal–mountain gradient, with abundant traditional settlements, intangible heritage, and religious cultural landscapes in inland and mountainous counties, alongside well-developed urban functions and tourism facilities in coastal metropolitan cores such as Fuzhou and Xiamen. This configuration allows the CHV–HRSC framework to be tested precisely where the distinction between heritage endowment and regeneration-support capacity matters most. The framework itself is transferable to other regional contexts, including other Chinese provinces and heritage-rich regions in other countries, provided that indicator selection, weighting, and spatial units are recalibrated to local data availability, governance scale, and heritage composition.
Given that heritage conservation, territorial spatial planning, public service allocation, and regional governance are all conducted within the administrative system, this study adopts county-level administrative units as the spatial evaluation units. The county level is adopted because it is the basic administrative unit through which heritage conservation, territorial spatial planning, public service allocation, and regional governance are implemented in China. It also accommodates both urban and rural heritage resources within a single spatial framework, allowing the relationship between heritage endowment and regional support conditions to be examined in a policy-relevant manner. The county level serves as a critical governance scale connecting regional development strategies and local planning implementation, while also effectively accommodating the relationship between heritage resource distribution and regional development conditions. Furthermore, the county scale enables the integration of heritage and Point of Interest (POI) data from different sources and spatial scales into a unified spatial framework, thereby enhancing the consistency of multi-source data analysis. Ultimately, this study takes 84 county-level administrative units in Fujian Province as the basic spatial evaluation units, and matches all cultural heritage resources and POI data to their corresponding counties.
Figure 2.
Geographical location of Fujian Province and boundary (adapted from [50] and map approval number: GS (2024) 0650).
2.3. Data Sources and Preprocessing
To ensure spatial consistency among multi-source spatial data, this study first unifies all data from different sources into the WGS84 coordinate reference system, followed by spatial calibration and data matching. For spatial metric analyses involving county areas, point distances, and kernel density estimation, the data were transformed into the Krasovsky 1940 Albers equal-area projection to ensure accuracy in spatial distance and area calculations. All spatial overlay operations, spatial joins, and county-level statistical aggregations were performed in ArcGIS Pro 3.5.4.
2.3.1. Cultural Heritage Resource Data
Given that cultural heritage exhibits characteristics of multiple types, scales, and carriers, this study constructs a cultural heritage resource database from five aspects: tangible heritage, traditional settlements, historic towns, intangible heritage, and cultural landscapes.
- (1)
- National Key Cultural Relics Protection Units. These represent nationally significant immovable cultural heritage categories in China, possessing high historical, artistic, and scientific value. This study adopts the spatial distribution dataset of national key protected cultural relic units of China compiled by Ye et al. [51]. This dataset is constructed based on the eight batches of national key cultural relic protection units announced by the State Council from 1961 to 2019, comprising 5058 cultural heritage sites with spatial location information.
- (2)
- Traditional Villages. These serve as important spatial carriers of traditional Chinese cultural landscapes, rural historical spaces, and local social memory. This study adopts the list of Chinese traditional villages announced by the Ministry of Housing and Urban-Rural Development and relevant authorities, covering six batches published from 2012 to 2023, with a total of 8155 samples.
- (3)
- Historical and Cultural Towns. These are important carriers of regional historical spatial structures and local cultural memory, collectively forming a historically continuous settlement-type heritage system together with traditional villages. This study adopts the spatial dataset of historical and cultural towns and scenic spots in China published by Yu et al. [52]. This dataset is primarily constructed based on the lists of Chinese historical and cultural towns announced by the Ministry of Housing and Urban-Rural Development and the National Cultural Heritage Administration, including town names, geographic locations, and related spatial attributes.
- (4)
- National Intangible Cultural Heritage. Intangible cultural heritage embodies local cultural traditions, knowledge systems, craftsmanship transmission, and cultural identity, serving as an important social and cultural carrier within the heritage system. This study adopts the spatial dataset of national intangible cultural heritage of China published by Guo et al. [53]. This dataset is constructed based on the five batches of national intangible cultural heritage items announced by the State Council in 2006, 2008, 2011, 2014, and 2021, including item names, categories, and spatial location information.
- (5)
- Religious Cultural Spaces. These are important components of local historical and cultural landscapes, having long carried local belief systems, social memory, cultural activities, and historical spatial continuity. This study adopts the spatial dataset of Chinese religious sites published by Liu et al. [54], which includes site names, religious types, addresses, and geographic locations. Unlike heritage resources with clear national-level designations, religious sites do not possess uniform heritage grades. Therefore, this study does not treat religious sites as equivalent to national-level heritage resources, but rather as supplementary data reflecting the continuity of regional historical and cultural landscapes and the cultural space base. For the purposes of this study, religious cultural landscapes are operationally defined as spatially fixed religious sites and their associated cultural spaces, including temples, churches, mosques, ancestral halls, and other recognized religious or belief-related sites recorded in the dataset. Density is measured as the number of recorded religious sites per unit county area, consistent with the other four CHV indicators.
2.3.2. Urban Functional Support Data
The translation of cultural heritage resources into social value, tourism value, and spatial vitality depends not only on the resource endowment of the heritage itself, but is also influenced by regional cultural dissemination, tourism utilization, and the comprehensive urban service environment. Therefore, this study adopts Baidu Maps POI data to construct the HRSC evaluation system. The POI data were collected from August to October 2025. The raw data include 14 categories of urban functions: catering, shopping, commercial residential, leisure and entertainment, healthcare, sports and fitness, science and education culture, tourist attractions, hotel accommodation, life services, corporate enterprises, transportation facilities, financial institutions, and automobile-related services.
Considering the differential roles of various urban functions in the dissemination of heritage value, tourism utilization, and spatial revitalization, this study reclassifies the 14 original POI categories into three functional categories based on their attributes: cultural service, tourism utilization, and urban service. Cultural service includes science and education culture-related POIs, representing spatial facilities associated with cultural dissemination, cultural exhibition, educational exchange, and public participation. Tourism utilization includes four POI categories—tourist attractions, hotel accommodation, catering, and leisure and entertainment—representing spatial facilities related to tourist visitation, visitor stays, recreational experiences, and associated consumption activities. Urban service includes the remaining POI categories outside cultural service and tourism utilization, representing the comprehensive urban functions and social service environment of the region.
2.4. Indicator System Construction
Given the notable variations in spatial area across different counties, directly using the counts of cultural heritage resources or POI facilities may be subject to the scale effect of county area. Therefore, this study converts all count-based indicators into area-normalized spatial density indicators, calculated as the ratio of the number of corresponding resources or facilities within a county to the county’s administrative area. Through area normalization, the influence of county area differences on indicator outcomes can be reduced, and the comparability of resource and functional intensity across different spatial evaluation units can be enhanced. Based on this, this study constructs a two-dimensional indicator system comprising CHV and HRSC. CHV is used to measure county-level cultural heritage resource endowments, while HRSC is used to measure the regional functional support conditions required for the dissemination, utilization, and continuous revitalization of heritage value.
2.4.1. Cultural Heritage Value
CHV is used to evaluate county-level cultural heritage resource endowments. CHV in this study is operationalized as the spatial concentration and endowment of cultural heritage resources, rather than as a direct measurement of the intrinsic historical, artistic, or social value of individual heritage assets. Cultural heritage value is inherently multidimensional and context-dependent, and cannot be fully quantified through any single indicator at the regional scale. Following established regional heritage assessment studies, we therefore use the spatial density of five heritage categories as a proxy for the stock and diversity of heritage value available for conservation and regeneration. Accordingly, CHV should be interpreted as a regional-scale proxy for heritage value endowment, not as a direct evaluation of heritage significance.
It is further acknowledged that the five heritage categories differ substantially in designation level, visibility, protection status, historical importance, and public accessibility. For instance, National Key Cultural Relics Protection Units are nationally designated and legally protected, whereas religious cultural spaces are not uniformly graded and may vary widely in heritage status and public accessibility. Intangible cultural heritage items differ from tangible heritage in that they are carried by practitioners and communities rather than by fixed spatial assets, while traditional villages and historical cultural towns represent settlement-based heritage with distinct historical and social trajectories. These differences mean that simple density measures cannot fully represent the qualitative significance of individual heritage assets. In this study, CHV is therefore intended to capture the density and diversity of recognized heritage carriers across a county, rather than heritage value in a fuller qualitative sense. This operationalization is deliberate: at the regional scale, the number, type, and spatial concentration of recognized heritage carriers provide a comparable and policy-relevant proxy for the heritage resource base, while fine-grained qualitative attributes such as designation level, visibility, and protection status are more appropriately assessed at the site or project scale.
Considering that cultural heritage possesses multiple attributes, including materiality, settlement patterns, historical continuity, and cultural transmission, this study constructs the CHV indicator system from five complementary categories of cultural heritage resources, namely National Cultural Relic Density, Traditional Village Density, Historical Cultural Town Density, Intangible Cultural Heritage Density, and Religious Cultural Landscape Density. Among these, Traditional Village Density and Historical Cultural Town Density are treated as complementary indicators. The former primarily reflects rural traditional cultural landscapes and their settlement carriers, while the latter mainly represents historic urban spaces and regional historical development trajectories. Together, they reflect the continuity of regional historical settlement systems. Religious Cultural Landscape Density serves as a supplementary indicator reflecting local historical and cultural landscapes and cultural spatial continuity. All five indicators are measured using county-level spatial density.
2.4.2. Heritage Regeneration Support Capacity
HRSC is used to evaluate the regional functional conditions required for the dissemination, utilization, and continuous revitalization of cultural heritage resources. Unlike CHV, which emphasizes regional cultural heritage endowments, HRSC focuses on whether regions possess the functional and spatial conditions to support the translation of heritage value. This study constructs the HRSC indicator system from four aspects: Cultural Service Density, Tourism Utilization Density, Urban Service Density, and Functional Diversity. The first three indicators are obtained by dividing the corresponding POI counts within a county by the county area. Cultural Service Density reflects the spatial supply of facilities related to cultural dissemination, cultural exhibition, and public cultural services. Tourism Utilization Density reflects the spatial support of facilities related to tourist visitation, visitor stays, recreational experiences, and consumption activities. Urban Service Density reflects the comprehensive urban functions and social service environment on which the continuous utilization of heritage depends.
In addition to facility quantity, the diversity of regional functional structure is also an important factor affecting the sustained spatial utilization of heritage. The richer and more balanced the distribution of functional types, the more diverse the consumption, leisure, cultural, and social activities that a region can typically provide. Therefore, this study adopts the Shannon entropy index to measure county-level functional diversity
where FDi denotes the functional diversity of county i; pij denotes the proportion of POIs of category j to the total POI count in county i; and m denotes the number of POI functional categories.
HRSC is measured through the presence and diversity of urban functional facilities, rather than through their quality, accessibility, affordability, heritage relevance, governance capacity, or actual usage. POI data capture the spatial existence and category of facilities, but they cannot fully represent whether these facilities are effectively used for heritage dissemination, whether they are accessible to local residents and visitors, or whether they are supported by adequate governance and management. A county with many facilities may still lack strong regeneration capacity. Its facilities may be poorly connected to heritage resources, unevenly distributed, or unrelated to heritage activities. HRSC should therefore be read as a facility-based proxy, not as a measure of realized regeneration capacity.
2.5. Two-Stage CRITIC-Based Evaluation
To comprehensively evaluate the potential capacity of converting cultural heritage resources into urban regeneration momentum across different counties, this study proposes a two-stage CRITIC-based evaluation framework. This method performs hierarchical evaluation of the heritage resource base and the regional support conditions required for value realization, thereby avoiding information confusion caused by directly mixing indicators at different theoretical levels. In the first stage, the CRITIC objective weighting method is applied separately to indicators within CHV and HRSC to obtain county-level CHV and HRSC indices. In the second stage, CHV and HRSC are treated as two higher-order evaluation dimensions, and the CRITIC method is reapplied to determine their relative weights and calculate the final CHURPI.
2.5.1. Indicator Normalization
Since different indicators have different dimensions and value ranges, dimensionless normalization is required prior to comprehensive evaluation. All indicators in this study are positive indicators, meaning that higher values indicate greater heritage resource value or regeneration support capacity. The Min–Max normalization method is therefore adopted
where Xij denotes the original value of the j-th indicator for the i-th county; and denote the maximum and minimum values of the j-th indicator, respectively; and Zij denotes the normalized indicator value. After normalization, Zij ranges within [0, 1], ensuring that different indicators can participate in subsequent objective weighting and comprehensive evaluation on a unified scale.
2.5.2. CRITIC-Based Weighting Method
This study adopts the CRITIC method for objective weighting. CRITIC simultaneously considers the degree of variation in indicators and the degree of information conflict among indicators, thereby determining their information contribution based on the data characteristics of the indicators themselves. First, the standard deviation of the j-th indicator is calculated
where σj denotes the standard deviation of the j-th indicator; n denotes the number of counties; and denotes the mean value of the j-th indicator.
Subsequently, the Pearson correlation coefficient rjk between different indicators is calculated. If two indicators have a high positive correlation, the information they contain is highly redundant; conversely, if the correlation is low, the indicators are highly informationally independent. Therefore, the amount of information conflict for the j-th indicator is defined as
where m denotes the number of evaluation indicators, and rjk denotes the Pearson correlation coefficient between indicator j and indicator k.
Considering both the degree of indicator variation and the degree of indicator conflict, the information content of the j-th indicator is defined as
Cj = σjRJ
The final indicator weight is calculated as
where wj denotes the objective weight of the j-th indicator, satisfying . Consequently, indicators with greater spatial variability and higher informational independence from other indicators receive higher weights.
It is important that CRITIC weights reflect the degree of statistical variation and information conflict among indicators within a given dataset, rather than their theoretical or substantive importance. An indicator may receive a high weight because it varies substantially across spatial units or because it carries information not captured by other indicators, without necessarily being the most important driver of the phenomenon under study. CRITIC weights are therefore dataset-dependent and context-specific, and should be interpreted as reflecting the statistical contribution of each indicator within the selected indicator system, not as universal measures of causal or theoretical importance.
2.5.3. Calculation of CHV and HRSC
In the first stage, CRITIC weighting is applied separately to the indicators within CHV and HRSC. For CHV, the five indicators include National Cultural Relic Density, Traditional Village Density, Historical Cultural Town Density, Intangible Cultural Heritage Density, and Religious Cultural Landscape Density. The CHV for county i is calculated as
where denotes the CRITIC weight of the j-th indicator in the CHV indicator system, and Zij denotes the corresponding normalized indicator value. A higher CHV value indicates that the county possesses richer, more diverse cultural heritage resources with a stronger spatial clustering foundation.
For HRSC, the four indicators include Cultural Service Density, Tourism Utilization Density, Urban Service Density, and Functional Diversity. The HRSC for county i is calculated as
where denotes the CRITIC weight of the j-th indicator in the HRSC indicator system. A higher HRSC value indicates that the county possesses more developed conditions for cultural dissemination, tourism utilization, comprehensive urban services, and functional diversity.
2.5.4. Calculation of CHURPI
In the second stage, CHV and HRSC are treated as two higher-order evaluation dimensions for comprehensive assessment. First, the CHV and HRSC obtained from the first stage are normalized using Min–Max normalization
When CRITIC is applied to only two higher-order dimensions, the conflict term becomes mathematically identical across the two dimensions, so the relative weights of CHV and HRSC are effectively determined by their relative dispersion. This is an inherent property of CRITIC when the number of indicators is small, rather than a methodological flaw. We retain the second-stage CRITIC because it provides an objective, data-driven basis for dimension weighting and avoids arbitrary equal weighting. Nevertheless, to test whether the final CHURPI is sensitive to this weighting choice, we conduct a sensitivity analysis comparing the two-stage CRITIC weighting with equal weighting and entropy weighting.
A single-stage CRITIC application, in which all nine indicators are pooled into one weighting process, was also considered but not adopted, because pooling indicators across two theoretical levels would reintroduce the information confusion that the two-stage design is intended to avoid.
Subsequently, the normalized CHV and HRSC are treated as two evaluation indicators, and the CRITIC method is reapplied to calculate their relative weights, denoted as wCHV and wHRSC, respectively. Finally, the CHURPI for county i is calculated as
where wCHV and wHRSC sum to 1. A higher CHURPI value indicates that the county simultaneously possesses a robust cultural heritage resource base and strong regional regeneration support conditions, and therefore exhibits higher cultural heritage-led urban regeneration potential.
2.6. Spatial Pattern Analysis
2.6.1. Kernel Density Estimation of Cultural Heritage Resources
Cultural heritage resources typically exhibit pronounced spatial clustering characteristics, and county-level statistical values alone are insufficient to fully reveal the clustering areas of different heritage types across continuous geographic space. Therefore, this study employs KDE to identify the spatial clustering characteristics of cultural heritage resources. KDE generates a continuous spatial surface for point-based cultural heritage resources by considering the distance between heritage points and target locations [29,55]
where F(d) denotes the kernel density estimate at spatial location d; n denotes the number of heritage resource points; k(⋅) denotes the kernel function; h denotes the bandwidth parameter; di denotes the location of the i-th cultural heritage point; and di − d denotes the spatial distance between the target location and the heritage point.
This study performs KDE analysis separately for National Key Cultural Relics Protection Units, Traditional Villages, Historical and Cultural Towns, Intangible Cultural Heritage, and Religious Cultural Spaces, to identify the major spatial clustering areas of different cultural heritage types in Fujian Province and their spatial overlap characteristics.
The KDE was performed in the Krasovsky 1940 Albers equal-area projection using the Kernel Density tool in ArcGIS Pro 3.5.4. The search radius was set to 50 km, the output cell size was 1 km, and the quartic kernel function was used.
2.6.2. CHV-HRSC Typology and CHURPI Classification
To further reveal the combinatorial relationships between the cultural heritage resource base and regional support conditions, this study uses the mean values of CHV and HRSC across the 84 counties as thresholds to construct a two-dimensional classification matrix, dividing counties into four types. High CHV–High HRSC represents counties with favorable matching between heritage resource endowments and regional support conditions, constituting priority advantage areas for heritage-led urban regeneration. High CHV–Low HRSC indicates counties with abundant heritage resources but limited value translation due to constraints in regional services and functional conditions. Low CHV–High HRSC represents counties with relatively favorable development environments but insufficient heritage resource bases, suitable for enhancing regeneration potential through resource identification and cultural identity cultivation. Low CHV–Low HRSC reflects counties with dual constraints in both resource endowments and support conditions.
On this basis, the Jenks natural breaks classification method is employed to classify CHURPI into grades. This method determines classification boundaries based on the distribution characteristics of the data themselves, minimizing within-class variance while maximizing between-class variance. County-level CHURPI is divided into four grades: High potential, Medium-high potential, Medium-low potential, and Low potential. This classification is used to identify the spatial hierarchy of cultural heritage-led urban regeneration potential across counties in Fujian Province.
Both the CHV–HRSC typology and the CHURPI classification are partly data-dependent. The high/low categories in the typology are defined relative to the mean values of CHV and HRSC across the 84 counties, while the CHURPI classes are derived from Jenks natural breaks, which minimize within-class variance for this particular dataset. These thresholds are therefore relative rather than absolute, and the resulting categories should be interpreted as relative positions within the study area, rather than as universally applicable cut-offs. Alternative thresholds or classification methods could shift the boundaries between categories, although the overall spatial pattern is expected to remain broadly stable.
2.6.3. Spatial Autocorrelation Analysis
Both Global and Local Moran’s I were computed using the Spatial Autocorrelation and Cluster and Outlier Analysis tools, based on the county-level CHURPI values. The spatial weights matrix was defined by K nearest neighbors (K = 8) with Euclidean distance and row standardization. The number of permutations was set to 499. Statistical significance was assessed at p < 0.05, and results with p < 0.001 were considered strong evidence against spatial randomness. No FDR correction was applied in the Local Moran’s I analysis.
To test the spatial dependence of CHURPI, this study employs Global Moran’s I for global spatial autocorrelation analysis. A positive Moran’s I indicates that similar high or low values tend to cluster spatially; a negative value indicates that high and low values tend to be adjacent, and a value close to zero suggests a random spatial distribution.
Local Moran’s I is further applied to identify local spatial association patterns of CHURPI, including four types: High–High (HH), Low–Low (LL), High–Low (HL), and Low–High (LH), thereby identifying high-value clusters, low-value clusters, and local spatial outliers. This analysis serves to further reveal the spatial clustering and local differentiation characteristics of heritage-led urban regeneration potential.
Through Global Moran’s I and Local Moran’s I analyses, this study can further determine whether heritage-led urban regeneration potential exhibits spatial clustering characteristics, and identify high-value clusters, low-value clusters, and local spatial outliers, thereby providing spatial evidence for differentiated regional planning and heritage revitalization strategies.
3. Results
3.1. Spatial Distribution of Cultural Heritage Resources
Figure 3 presents the KDE results for the five categories of cultural heritage resources in Fujian Province. The results indicate that different heritage types exhibit differentiated spatial distribution patterns. National Key Cultural Relics Protection Units display a multi-core clustering pattern, with high-density hotspots mainly located in the eastern coastal areas, concentrated around Fuzhou and the Quanzhou-Xiamen metropolitan area, while densities are lower in the western and northern inland regions (Nanping, Sanming, Longyan). Traditional Villages show a strong tendency to concentrate in inland mountainous areas. The highest-density areas are mainly located in central and northern Fujian (the border area between Ningde and Nanping) and southwestern mountainous Fujian (the border area between Longyan and Zhangzhou), while densities are relatively low in coastal metropolitan areas. Historical and Cultural Towns exhibit a belt-like clustering pattern along the coast and major river corridors, with high-density clusters mainly distributed along the Ningde coast and surrounding Fuzhou. Intangible Cultural Heritage displays a highly concentrated distribution, with the highest-density points concentrated in Fuzhou and Quanzhou, while other areas are relatively sparse. Religious Cultural Spaces show a clear gradient pattern decreasing from the coast to the interior. High-density areas are mainly concentrated in the southeastern coast (Quanzhou, Xiamen, Zhangzhou) and the eastern coast (Fuzhou, Putian), with densities declining significantly towards the western interior. Overall, the five heritage types show distinct spatial clustering patterns at the provincial scale.
Figure 3.
Spatial density distribution of cultural heritage resources in Fujian Province: (a) National Key Cultural Relics Protection Units; (b) Traditional Villages; (c) Historical and Cultural Towns; (d) Intangible Cultural Heritage; (e) Religious Cultural Spaces.
3.2. Spatial Distribution of CHV, HRSC, and CHURPI
Figure 4 presents the spatial distribution of CHV and HRSC across the 84 county-level units in Fujian Province, classified using the Jenks natural breaks method. CHV exhibits significant spatial heterogeneity. High-value counties (dark purple, CHV > 0.225) are mainly clustered in the eastern coastal and northeastern areas, particularly in Ningde, Fuzhou, and parts of Zhangzhou. These areas possess abundant and diverse cultural heritage resources. In contrast, the central-western inland regions (Nanping, Sanming, Longyan) are predominantly characterized by low-to-medium CHV levels. HRSC displays a markedly different spatial pattern (Figure 4b). High-value areas (dark purple, HRSC > 0.509) are heavily concentrated in a few core metropolitan areas, primarily the central urban districts of Fuzhou and Xiamen, which possess well-developed urban services and tourism facilities. The vast majority of counties across the province, particularly those in inland areas, fall into the lower HRSC categories. CHV and HRSC show a clear spatial mismatch. High-CHV areas are widely distributed across coastal-inland transitional zones and mountainous areas, whereas high-HRSC values are highly confined to a limited number of urban core areas.
Figure 4.
Spatial distribution of cultural heritage value and regeneration support capacity: (a) CHV distribution; (b) HRSC distribution.
Based on the combined relationship between CHV and HRSC, Figure 5 presents the spatial distribution of the four CHV-HRSC matching types across the 84 county-level units in Fujian Province. The four types show considerable spatial heterogeneity and mismatch between heritage resources and regional support capacity. The High CHV–High HRSC type (red) represents priority advantage areas. This type is mainly concentrated in the northeastern coastal areas (dominated by Ningde), with a notable cluster in the southwest (western Zhangzhou), and a significant isolated cluster in the central-western inland area (central Sanming). The High CHV–Low HRSC type (light orange) is mainly distributed in specific transitional zones and coastal areas. This type is concentrated at the border between Quanzhou and Sanming, along the coasts of Putian and Quanzhou, and in the inland areas of Ningde and Nanping. This relatively dispersed distribution pattern reflects that these areas possess abundant heritage resources but lack corresponding regional support capacity. The Low CHV–High HRSC type (gray) is the least distributed. This type does not appear as contiguous patches but rather as isolated clusters, mainly concentrated in the core urban districts of Fuzhou and Xiamen, as well as a few counties in the northern inland (northern Nanping) and western (western Sanming) areas. The Low CHV–Low HRSC type (blue) occupies the largest spatial extent across the province. This type covers large contiguous areas across the central and western inland regions (encompassing most of Nanping, Sanming, and Longyan), extends to the northern fringe (parts of Ningde), and includes inland fringe areas of the southeastern coast (parts of Quanzhou). Within the thresholds adopted here, high-potential areas appear relatively limited and locally concentrated, while mismatched areas (High-Low type) and disadvantaged areas (Low-Low type) constitute the predominant spatial pattern across the province.
Figure 5.
Spatial distribution of CHV-HRSC typology.
The typology describes the spatial configuration of CHV and HRSC. The next step is to examine how the two dimensions are weighted. Table 1 presents the objective weights of dimensions and indicators derived from the two-stage CRITIC method. At the dimension level, CHV (0.538) receives a slightly higher weight than HRSC (0.462), indicating that CHV carries slightly more statistical information within the selected indicator system and therefore contributes marginally more to the overall CHURPI in a weighting sense. CRITIC weights reflect the degree of variation and information conflict among indicators, rather than their substantive or causal importance. Within the CHV dimension, Traditional Village Density exhibits the highest indicator weight at 0.386, followed by Historical Cultural Town Density (0.217) and Religious Cultural Landscape Density (0.160). In contrast, National Cultural Relic Density and Intangible Cultural Heritage Density both receive the lowest weights at 0.118. Within the HRSC dimension, Functional Diversity receives the highest weight (0.509), indicating that it is the most information-rich and least redundant indicator within this dimension, rather than that it is substantively more important than the other three indicators. The remaining three indicators—Cultural Service Density (0.173), Tourism Utilization Density (0.160), and Urban Support Density (0.158)—receive similar and relatively lower weights.
Table 1.
CRITIC-derived weights of dimensions and indicators for cultural heritage-led urban regeneration potential assessment.
In particular, the high weights of Traditional Village Density within CHV (0.386) and Functional Diversity within HRSC (0.509) should be interpreted with caution. These weights indicate that the two indicators exhibit relatively high statistical variation and low redundancy within the selected indicator system in Fujian, rather than that they are universally the most important drivers of heritage-led regeneration. Traditional village density may receive a high weight because traditional settlements are unevenly distributed across Fujian’s counties, while functional diversity may receive a high weight because it summarizes the overall balance of urban functions and is less correlated with single-category facility densities. In other contexts or with different indicator sets, these relative weights could differ.
Table 2 presents the CHURPI classification results for the 84 county-level units in Fujian Province. The classification shows a hierarchical pattern. The High potential category includes 7 counties (8.3% of the total), with CHURPI values ranging from 0.488 to 0.824. The Medium-high potential category includes 18 counties (21.4%), with values ranging from 0.297 to 0.487. The Medium-low potential category constitutes the largest group, comprising 36 counties (42.9%), with values between 0.179 and 0.296. Finally, the Low potential category includes 23 counties (27.4%), with CHURPI values ranging from 0.055 to 0.178. Overall, this classification indicates that the distribution of regeneration potential is uneven. Specifically, the Medium-low potential grade accounts for the largest proportion of spatial units, while the High potential grade is relatively limited, representing less than 10% of county-level units. Among all county-level units, Gulou District of Fuzhou exhibits the highest CHURPI value (0.824), while Xianyou County of Putian exhibits the lowest (0.055), indicating a substantial gap between the highest and lowest potential levels.
Table 2.
Classification of county-level cultural heritage-led urban regeneration potential.
To examine whether the CHURPI results are sensitive to the second-stage weighting scheme, we compared the proposed two-stage CRITIC weighting with two alternative schemes: equal weighting (0.5 for CHV and 0.5 for HRSC) and entropy weighting. The county-level CHURPI rankings under the two alternative schemes are highly consistent with the two-stage CRITIC results, with Spearman rank correlation coefficients of 0.996 (equal weighting) and 0.926 (entropy weighting). The top-quartile counties identified as high-potential overlap by 100% under equal weighting and 90.5% under entropy weighting. The mean rank shift is 1.40 for equal weighting and 6.69 for entropy weighting, while the maximum rank shift is 9 and 27, respectively. The spatial pattern of high-potential counties remains stable, with high-potential counties still concentrated in northeastern Fujian. Under both alternative schemes, the CHV-HRSC quadrant assignment remains unchanged, because the CHV and HRSC values themselves are not affected by the second-stage weighting choice. The identification of high-potential counties is therefore robust to the choice of second-stage weighting scheme.
It is also worth noting that the second-stage weights of CHV (0.538) and HRSC (0.462) are nearly equal, indicating that heritage endowment and regeneration-support capacity contribute comparably to the overall CHURPI in a weighting sense. This is consistent with the conceptual premise of the study, since heritage-led regeneration potential is jointly determined by resource endowment and support conditions rather than being dominated by either dimension.
Figure 6 presents the spatial distribution of CHURPI grades, which integrate the two evaluation dimensions. The Medium-low potential grade (blue) constitutes the largest spatial share, mainly covering the central, western, and northern inland areas (encompassing most of Nanping, Sanming, and Longyan). The High potential grade (red) is highly localized, forming a contiguous core in northeastern Ningde, with isolated counties appearing along the coast in Fuzhou, Xiamen, and Quanzhou. Notably, the Low potential grade (orange) exhibits a strong southern and coastal predominance, covering large areas of the southeastern coastal corridor (extensive parts of Quanzhou, Zhangzhou, and Putian), with scattered distribution in the western inland areas and contiguous patches in northern Nanping. The Medium-high potential grade (gray) serves as a transitional zone, mainly distributed in Fuzhou, parts of Ningde, and the border area between Zhangzhou and Longyan. Overall, the spatial pattern of CHURPI indicates that high regeneration potential is mainly concentrated in the northeastern region, while low regeneration potential exhibits pronounced clustering in the southern inland and coastal areas.
Figure 6.
Spatial distribution of CHURPI levels.
3.3. Spatial Autocorrelation of CHURPI
Global spatial autocorrelation analysis reveals significant positive spatial autocorrelation of CHURPI across counties in Fujian Province (Moran’s I = 0.161, Z = 3.603, p < 0.001), indicating that heritage-led urban regeneration potential is not randomly distributed but exhibits a modest yet statistically significant tendency toward clustering of High-High and Low-Low values.
To further identify local spatial association patterns, this study conducted Local Moran’s I analysis (Figure 7). Four types of local spatial association emerge. High-High (HH) clusters (pink) are mainly located in the northeastern region, spanning Ningde and northern Fuzhou, indicating that high-potential counties form contiguous core clusters of regeneration potential with their high-potential neighbors. Low-Low (LL) clusters (light blue) are primarily situated in the south-central inland areas, covering extensive parts of multiple counties in Quanzhou, indicating a continuous trough of regeneration potential in this region. Low-High (LH) outliers (dark blue) are highly localized, mainly covering the core urban districts of Fuzhou, manifesting as isolated low-value patches surrounded by high-value areas. High-Low (HL) outliers (red) are sparsely distributed, with distinct patches along the coast of Putian and the southernmost tip of Zhangzhou, appearing as isolated high-potential nodes surrounded by low-potential areas. The majority of counties exhibit non-significant (white) spatial autocorrelation, suggesting that CHURPI distribution in the central and western inland areas is relatively random.
Figure 7.
Local spatial clusters of CHURPI.
4. Discussion
4.1. Spatial Differentiation of Cultural Heritage Value and Regeneration Support Capacity
CHV and HRSC show clear spatial differentiation. CHV is relatively widespread, with higher values occurring in both coastal and mountainous areas, reflecting the diverse distribution of historical settlements, traditional villages, intangible cultural heritage, and religious cultural spaces. In contrast, HRSC is more concentrated in major urban centers, particularly Fuzhou and Xiamen, where cultural services, tourism-related facilities, urban services, and diverse urban functions are more developed. This difference indicates that areas with rich cultural heritage resources do not necessarily possess equally strong conditions for heritage-based regeneration.
The distinction between CHV and HRSC is important for understanding the spatial potential of heritage-led regeneration. Heritage resources provide the underlying base. Supporting functions determine how far these resources can be accessed, interpreted, used, and integrated into contemporary urban and regional activities. Therefore, the relatively high HRSC of major urban areas should not be interpreted as indicating high heritage value, but rather as reflecting their stronger capacity to support the utilization and regeneration of heritage resources. This finding is consistent with previous studies emphasizing that heritage should be understood as part of interconnected cultural landscapes rather than as isolated heritage sites [56]. It also echoes research identifying insufficient recognition of overall heritage value, imprecise protection boundaries, and fragmented governance as important constraints on integrated heritage conservation and development in China [57].
The CHV–HRSC typology further shows that the relationship between heritage resources and supporting conditions varies substantially among counties. High CHV–High HRSC areas represent relatively favorable combinations of resource endowment and supporting conditions, whereas High CHV–Low HRSC areas indicate that substantial heritage resources exist without corresponding functional support. Low CHV–High HRSC areas, mainly found in major urban centers and some other developed areas, suggest that strong urban functions do not automatically translate into high heritage regeneration potential.
One counterintuitive result is the concentration of low potential counties in the southeastern coastal corridor (Quanzhou, Zhangzhou, and Putian), which are among the most heritage-rich areas in Fujian. This result may reflect three different mechanisms: a genuine mismatch between abundant heritage resources and insufficient support conditions, particularly functional diversity; a measurement artifact arising from the relative nature of the CHURPI, since these counties are compared with highly urbanized cores such as Fuzhou and Xiamen; or a limitation of the indicator system, which does not capture heritage quality, community preferences, ownership constraints, conservation risk, investment feasibility, or governance capacity. We therefore interpret this classification as an indication that heritage-led regeneration in these counties is not straightforwardly supported by the current configuration of facilities and functions, rather than as evidence that they lack regeneration potential altogether. Further case-based and qualitative research would be needed to distinguish among these mechanisms.
4.2. Importance of Functional Diversity for Heritage Regeneration
The CRITIC weights clarify the composition of regeneration support capacity. Functional diversity received the highest weight within the HRSC dimension (0.509), substantially exceeding the weights of cultural service density, tourism utilization density, and urban support density. Since CRITIC weights reflect the degree of variation and information conflict among indicators, this result indicates that functional diversity is the most information-rich and least redundant indicator within the HRSC dimension, rather than that it is substantively more important than facility quantity. With this caveat in mind, the result is nonetheless consistent with the interpretation that the regeneration potential of heritage areas may not depend solely on the quantity of individual facilities, but may also be related to the diversity of functions available within the surrounding area. This interpretation is correlational rather than causal, and should be further tested with longitudinal or case-based evidence.
In addition, the high weight of functional diversity does not imply that it is universally more important than facility quantity for heritage-led regeneration; rather, it reflects the statistical properties of this indicator within the present dataset, where it captures variation that single-category densities do not.
A diversified functional environment can provide complementary activities and services that support different stages of heritage utilization, including cultural participation, tourism, leisure, consumption, and everyday activities. This pattern is consistent with previous research showing that functional diversity and heritage openness can contribute to spatial vitality in heritage-led regeneration projects, while relying on a single type of infrastructure or tourism function may be insufficient to maintain long-term vitality [58]. Related studies on adaptive reuse have also emphasized the integration of cultural, commercial, leisure, and residential functions in creating more sustainable “living heritage” environments [59].
The relatively high weight of traditional village density within the CHV dimension (0.386) indicates that traditional village density is the most information-rich indicator within the CHV dimension in Fujian. This weighting result is consistent with, but does not by itself prove, the interpretation that traditional settlements occupy a central position in Fujian’s heritage resource structure. Rather than treating traditional villages as isolated protected sites, regional planning could strengthen their connections with surrounding cultural landscapes, settlements, and tourism networks. Such an approach is consistent with integrated heritage conservation frameworks that emphasize heritage corridors and associated cultural landscapes as ways of overcoming fragmented administrative boundaries [57]. As with functional diversity, this high weight should be understood as reflecting the statistical contribution of traditional village density within the selected indicator system, rather than as a universal measure of its substantive importance.
The facility-based measurement of HRSC captures the presence and diversity of urban functions, but not their quality, accessibility, affordability, heritage relevance, governance capacity, or actual usage. The interpretation of functional diversity as a support condition for heritage regeneration should therefore be treated as indicative rather than definitive, and should be complemented by qualitative evidence in future applications.
4.3. Spatial Clustering and Differentiated Regeneration Planning Strategies
CHURPI shows significant positive spatial autocorrelation (Moran’s I = 0.161, p < 0.001), with HH and LL clusters concentrated in different parts of Fujian. The HH cluster in the northeastern part of the province indicates a relatively favorable spatial concentration of regeneration potential, whereas LL clusters identify areas where both heritage resources and supporting conditions remain comparatively weak. These spatial clusters suggest that regeneration potential is influenced not only by conditions within individual counties but also by the characteristics of neighboring areas.
The planning implications presented below should be understood as a cautious planning-support framework, rather than as direct intervention prescriptions. The CHURPI index and the CHV–HRSC typology identify relative spatial patterns of heritage endowment and regeneration-support capacity, but they do not directly measure community preferences, ownership constraints, conservation risk, investment feasibility, governance capacity, or actual regeneration outcomes. The four pathways should therefore be treated as initial guidance for differentiated planning and further investigation, and should be combined with site-level assessment, stakeholder consultation, and local governance analysis before any specific intervention is designed.
The four CHV–HRSC types therefore provide a useful basis for differentiated planning. High CHV–High HRSC areas may consider prioritizing the quality and sustainability of heritage utilization, while remaining alert to the risks of excessive commercialization and loss of heritage authenticity. High CHV–Low HRSC areas are likely to benefit first from improvements in basic supporting functions, accessibility, cultural services, and appropriate adaptive reuse, rather than from simply increasing development intensity. Low CHV–High HRSC areas may consider emphasizing the identification and interpretation of local cultural resources, using existing urban functions to strengthen cultural identity and diversify regeneration opportunities. Low CHV–Low HRSC areas may require more gradual interventions, with initial priority given to essential public services, accessibility, and basic cultural infrastructure. These pathways are intended to support differentiated planning thinking, not to prescribe specific interventions. Their application in practice would require additional evidence on community preferences, ownership and land-use constraints, conservation risk, investment feasibility, and local governance capacity, none of which are directly captured by the CHURPI index.
The strength of spatial clustering should be interpreted with caution. The Global Moran’s I of 0.161 is statistically significant but relatively modest in magnitude, indicating a weak-to-moderate spatial dependence rather than strong clustering. Likewise, the CHV–HRSC typology and the CHURPI classes depend on the mean-based thresholds and Jenks natural breaks adopted in this study; these classifications are useful for identifying relative spatial patterns within Fujian, but their boundaries should not be treated as fixed or universally applicable.
These differentiated strategies also highlight the importance of governance in heritage-led regeneration. Previous research has shown that conflicts among governments, developers, and local communities can influence the implementation and outcomes of heritage regeneration. Greater coordination among public authorities, market actors, and local communities can therefore help align heritage conservation with local development needs [18]. The CHV-HRSC framework can thus help identify where different interventions are appropriate, instead of applying uniform strategies across all heritage areas.
4.4. Implications and Limitations
Two implications follow for regional spatial planning. First, heritage-led regeneration should not be planned solely according to the spatial distribution of heritage resources. Areas with high CHV but insufficient HRSC may require improvements in supporting functions before large-scale heritage utilization can be considered. Second, areas with strong HRSC but relatively low CHV should not automatically be regarded as heritage-led regeneration hotspots. Their existing urban functions can instead provide a basis for identifying, connecting, and developing locally distinctive cultural resources.
Several limitations should nevertheless be acknowledged. First, the county-level spatial unit may conceal substantial intra-county variation in heritage resources and supporting conditions. Second, POI data capture facility presence rather than service quality, accessibility, or actual usage, as discussed in Section 4.2. Third, CHURPI measures potential rather than actual regeneration outcomes; therefore, high-potential areas may not necessarily achieve successful regeneration without appropriate policies, investment, and governance. Fourth, the cross-sectional design does not capture temporal changes in heritage value or supporting capacity. Future research could use finer spatial units, longitudinal data, and case-based or spatial econometric methods to examine how heritage resources are translated into regeneration outcomes. Finally, the spatial autocorrelation analysis was based on a K nearest neighbors weight matrix (K = 8). Alternative weight matrices, such as Queen contiguity, were not tested in this study. Because the Global Moran’s I is statistically significant but modest in magnitude (0.161), the spatial dependence should be interpreted as weak-to-moderate, and the results should not be read as evidence of strong clustering.
5. Conclusions
This study constructed a two-dimensional evaluation framework comprising CHV and HRSC, and proposed a two-stage CRITIC method to systematically assess heritage-led urban regeneration potential across 84 county-level units in Fujian Province. The main conclusions are as follows:
- (1)
- Cultural heritage resources exhibit type-specific differentiation and spatial clustering, confirming the necessity of multi-type integrated assessment. National Key Cultural Relics Protection Units and intangible cultural heritage are highly concentrated in eastern coastal core cities such as Fuzhou and Quanzhou; traditional villages are predominantly distributed in central and northern Fujian mountainous areas; and religious cultural spaces display a gradient pattern decreasing from the coast to the interior. Spatial analysis based on single heritage types cannot fully capture the regional cultural resource base, whereas multi-type integrated assessment helps overcome such partiality.
- (2)
- A significant spatial mismatch exists between CHV and HRSC. High-CHV counties are widely distributed across coastal and mountainous areas, whereas high-HRSC counties are heavily concentrated in a few core metropolitan areas such as Fuzhou and Xiamen. This pattern validates the core hypothesis of this study: cultural heritage resource endowments and regional regeneration support conditions are not naturally aligned, and heritage resource abundance does not necessarily equate to higher regeneration potential.
- (3)
- CHURPI exhibits uneven spatial differentiation with significant spatial clustering. High-potential counties account for only 8.3%, mainly concentrated in the Ningde area of the northeast; Medium-low and Low-potential counties together account for over 70%, extensively covering inland areas and the southeastern coastal corridor. Global spatial autocorrelation analysis confirms significant positive spatial clustering of CHURPI (Moran’s I = 0.161, p < 0.001), with High-High clusters in the northeast and Low-Low clusters in the south-central inland areas.
- (4)
- Traditional village density and functional diversity are the highest-weighted indicators within CHV and HRSC, respectively. CRITIC weights reflect the degree of variation and information conflict among indicators rather than their substantive or causal importance. With this caveat, the highest weight of traditional village density (0.386) suggests that traditional settlement density is the most information-rich indicator within CHV in Fujian, which is consistent with the interpretation that traditional settlements play a central role in the regional heritage resource structure. Similarly, the highest weight of functional diversity (0.509) suggests that functional diversity is the most information-rich indicator within HRSC, which is consistent with the interpretation that diversified functional environments may be more conducive to heritage value translation than single-type facility provision. These interpretations are correlational and require further causal testing. High CHV-High HRSC counties may consider prioritizing utilization quality and sustainability; High CHV-Low HRSC counties are likely to benefit first from improving basic support functions; Low CHV-High HRSC counties may consider emphasizing local cultural resource identification; and Low CHV-Low HRSC counties may require gradual interventions with initial priority given to basic public cultural services. These directions should be treated as initial planning guidance and complemented by site-level and governance-related evidence.
The two-stage multi-criteria spatial evaluation framework proposed in this study offers an operational methodological pathway for identifying regional heritage-led urban regeneration potential, and provides decision-making references for the differentiated allocation of cultural resources and the spatial planning of heritage revitalization strategies in territorial spatial planning.
Author Contributions
Conceptualization, Z.L., B.F. and K.C.; methodology, Z.L., Y.L. and X.H.; software, Z.L. and X.H.; validation, Z.L., Y.L. and B.F.; formal analysis, Z.L. and X.H.; investigation, Z.L. and Y.L.; resources, B.F. and K.C.; data curation, Z.L. and X.H.; writing—original draft preparation, Z.L. and Y.L.; writing—review and editing, X.H., B.F. and K.C.; visualization, Z.L. and X.H.; supervision, B.F. and K.C.; project administration, B.F. and K.C. All authors have read and agreed to the published version of the manuscript.
Funding
This research received no external funding.
Data Availability Statement
The data sources are described in Section 2.3. The datasets presented in this study are available from the corresponding author upon reasonable request.
Acknowledgments
During the preparation of this manuscript, the authors used ChatGPT (OpenAI, GPT-5.5) for the purposes of language polishing. The authors have reviewed and edited the output and take full responsibility for the content of this publication.
Conflicts of Interest
The authors declare no conflicts of interest.
References
- Liu, S.; Zhao, Z.; Huang, X. Cultural Sustainability Through Heritage-Led Underground Development: The Case Study. Heritage 2025, 8, 449. [Google Scholar] [CrossRef] [Scilit]
- Aldossary, M.J.; Alqahtany, A.M.; Alshammari, M.S. Cultural Heritage as a Catalyst for Sustainable Urban Regeneration: The Case of Tarout Island, Saudi Arabia. Sustainability 2025, 17, 4431. [Google Scholar] [CrossRef] [Scilit]
- Grazuleviciute-Vileniske, I.; Zmejauskaite, D. ‘Archeology’ of Hidden Values of Underutilized Historic Industrial Sites in Context of Urban Regeneration and Nature-Based Solutions. Buildings 2025, 15, 205. [Google Scholar] [CrossRef] [Scilit]
- Ripp, M.; Gustafsson, C.; Jones, Z.; Majumdar, S.; Ginzarly, M. Historic Urban Landscapes and Heritage Systems as the Basis for Sustainable Urban Development. Land 2025, 14, 1783. [Google Scholar] [CrossRef] [Scilit]
- Al-Saffar, M. Smart Sustainable Urban Heritage: Regenerating Baghdad’s Historic Centre. Architecture 2026, 6, 56. [Google Scholar] [CrossRef] [Scilit]
- Bandarin, F.; Van Oers, R. The Historic Urban Landscape: Managing Heritage in an Urban Century; John Wiley & Sons: Hoboken, NJ, USA, 2012. [Google Scholar]
- Makhzoumi, J.; Al-Harithy, H.; Bazzi, M. Contextualizing UNESCO’s Historic Urban Landscape Approach: A Framework for Identifying Modern Heritage in Post-Blast Beirut. Land 2024, 13, 2241. [Google Scholar] [CrossRef] [Scilit]
- Valibeig, N.; Jahangard, N. Documentary-Based Urban Digital Twins and the Historic Urban Landscape Approach: Parametric and Geospatial Modeling for Sustainable Urban Regeneration and Cultural Heritage Conservation. Sustainability 2026, 18, 8532. [Google Scholar] [CrossRef] [Scilit]
- Yang, Y.; Azmi, N.F.; Hakimi, H.A.; Pan, L. Unpacking the Dynamics of Heritage-Led Regeneration: A Structural Equation Modeling Approach for Traditional Villages of Hebei, China. Land 2025, 14, 1925. [Google Scholar] [CrossRef] [Scilit]
- Della Spina, L. Multidimensional Assessment for “Culture-Led” and “Community-Driven” Urban Regeneration as Driver for Trigger Economic Vitality in Urban Historic Centers. Sustainability 2019, 11, 7237. [Google Scholar] [CrossRef] [Scilit]
- Della Spina, L. Adaptive Sustainable Reuse for Cultural Heritage: A Multiple Criteria Decision Aiding Approach Supporting Urban Development Processes. Sustainability 2020, 12, 1363. [Google Scholar] [CrossRef] [Scilit]
- Deng, Z. High-speed rail opening, financial facilitation, and the spatial spillover effects of cultural–tourism integration: An empirical test based on a “Quasi-Natural Experiment”. Financ. Res. Lett. 2026, 110, 110633. [Google Scholar] [CrossRef] [Scilit]
- Yang, X.; Chen, Q. From mining parks to heritage tourism: Governance dynamics and local innovation in China’s post-industrial transition. Extr. Ind. Soc. 2026, 28, 102006. [Google Scholar] [CrossRef] [Scilit]
- Yang, Y.; Hakimi, H.A.; Azmi, N.F.; Li, K.; Duan, B. A Framework for Heritage-Led Regeneration in Chinese Traditional Villages: Systematic Literature Review and Experts’ Interview. Heritage 2025, 8, 219. [Google Scholar] [CrossRef] [Scilit]
- Balaya, N.S.; Huang, L.; Shrestha, D.S. Cultural assets as catalysts for community-led urban revitalization: A case study of Pimbahal Pond Area, Patan Nepal. Cities 2026, 171, 106763. [Google Scholar] [CrossRef] [Scilit]
- Boussaa, D.; Madandola, M. Cultural heritage tourism and urban regeneration: The case of Fez Medina in Morocco. Front. Archit. Res. 2024, 13, 1228–1248. [Google Scholar] [CrossRef] [Scilit]
- Barnes, S.J. Heritage protection and tourism income: The tourism heritage Kuznets curve. Tour. Rev. 2022, 77, 1455–1471. [Google Scholar] [CrossRef] [Scilit]
- Scaffidi, F.; Micelli, E.; Nash, M. The role of the social entrepreneur for sustainable heritage-led urban regeneration. Cities 2025, 158, 105670. [Google Scholar] [CrossRef] [Scilit]
- Arbab, P.; Alborzi, G. Toward developing a sustainable regeneration framework for urban industrial heritage. J. Cult. Herit. Manag. Sustain. Dev. 2021, 12, 263–274. [Google Scholar] [CrossRef] [Scilit]
- Iversen, L. Cultural entrepreneurship, mobilisation and co-creation for a regenerative city centre development and visitor management. Cities 2026, 174, 107022. [Google Scholar] [CrossRef] [Scilit]
- Ranjbar, E.; Ebrahimighorbani, F.; Motalaei, N. New evidence of contribution of culture to urban regeneration in the Global South, a comprehensive research on 170 projects in 34 cities of Iran. Cities 2026, 175, 107181. [Google Scholar] [CrossRef] [Scilit]
- Chahardowli, M.; Sajadzadeh, H. A strategic development model for regeneration of urban historical cores: A case study of the historical fabric of Hamedan City. Land Use Policy 2022, 114, 105993. [Google Scholar] [CrossRef] [Scilit]
- Smith, L. Uses of Heritage; Routledge: London, UK, 2006. [Google Scholar]
- Kim, H.; Kim, H.; Woosnam, K.M. Considering urban regeneration policy support: Perceived collaborative governance in cultural heritage-led regeneration projects of Korea. Habitat Int. 2023, 140, 102921. [Google Scholar] [CrossRef] [Scilit]
- Wang, X.; Zhang, T.; Duan, L.; Liritzis, I.; Li, J. Spatial distribution characteristics and influencing factors of intangible cultural heritage in the Yellow River Basin. J. Cult. Herit. 2024, 66, 254–264. [Google Scholar] [CrossRef] [Scilit]
- Campiani, A.; Lingle, A.; Lercari, N. Spatial analysis and heritage conservation: Leveraging 3-D data and GIS for monitoring earthen architecture. J. Cult. Herit. 2019, 39, 166–176. [Google Scholar] [CrossRef] [Scilit]
- Romero-Ojeda, J.-M.; Sánchez-Montañés, B.; Lorusso, F.M. ‘TourGIStized’: A tool for assessing the physical impacts of overtourism on heritage areas. Its application to Seville. J. Cult. Herit. 2025, 72, 91–103. [Google Scholar] [CrossRef] [Scilit]
- Gao, H.; Wang, Y.; Zhang, H.o.; Huang, J.; Yue, X.; Chen, F. Spatial Distribution and Typological Classification of Heritage Buildings in Southern China. Buildings 2023, 13, 2025. [Google Scholar] [CrossRef] [Scilit]
- Ge, Y.; Liu, Y.; Ma, Y.; Wang, Y.; Guo, Y.; He, J.; Mao, Y. Spatial identification and corridor network analysis of cultural heritage based on multi-model fusion: A case study of western Henan. Ecol. Indic. 2025, 178, 113859. [Google Scholar] [CrossRef] [Scilit]
- Bi, S.; Du, J.; Tian, Z.; Zhang, Y. Investigating the spatial distribution mechanisms of traditional villages from the human geography region: A case study of Jiangnan, China. Ecol. Inform. 2024, 81, 102649. [Google Scholar] [CrossRef] [Scilit]
- Cai, H.; Yu, J.; Guo, Y. Spatial and temporal distribution and evolution of traditional villages in Xin ’an River Basin of China based on geographic detection and remote sensing technology. Ecol. Indic. 2025, 171, 113239. [Google Scholar] [CrossRef] [Scilit]
- Li, X.; Yang, Q.; Lyu, X.; Ye, Y.; Zhang, B. Multidimensional framework for analyzing the distribution patterns of traditional villages in the karst landscape regions of China. Ecol. Inform. 2023, 77, 102184. [Google Scholar] [CrossRef] [Scilit]
- Hosseini, S.; Sadeghloo, T.; Moeini, A. Tourism and the commodification of rural space: A grounded theory study of peri-urban villages. Cities 2026, 178, 107356. [Google Scholar] [CrossRef] [Scilit]
- Meng, S.; Zhang, J.; Xiong, L. Economic Feasibility Assessment of Industrial Heritage Reuse Under Multi-Attribute Decision-Based Urban Renewal Design. Urban Sci. 2025, 9, 456. [Google Scholar] [CrossRef] [Scilit]
- Mosadeghi, R.; Warnken, J.; Tomlinson, R.; Mirfenderesk, H. Comparison of Fuzzy-AHP and AHP in a spatial multi-criteria decision making model for urban land-use planning. Comput. Environ. Urban Syst. 2015, 49, 54–65. [Google Scholar] [CrossRef] [Scilit]
- Zhao, P.; Md Ali, Z.; Ahmad, Y. Developing indicators for sustainable urban regeneration in historic urban areas: Delphi method and Analytic Hierarchy Process (AHP). Sustain. Cities Soc. 2023, 99, 104990. [Google Scholar] [CrossRef] [Scilit]
- Ghandehariun, S.; Faghihi, S.V. Dynamic decision-support for heritage-sensitive urban regeneration: An AI-driven framework integrating socio-cultural sustainability. Results Eng. 2025, 28, 108189. [Google Scholar] [CrossRef] [Scilit]
- Cucco, P.; Maselli, G.; Nesticò, A.; Ribera, F. An evaluation model for adaptive reuse of cultural heritage in accordance with 2030 SDGs and European Quality Principles. J. Cult. Herit. 2023, 59, 202–216. [Google Scholar] [CrossRef] [Scilit]
- Della Spina, L. Cultural Heritage: A Hybrid Framework for Ranking Adaptive Reuse Strategies. Buildings 2021, 11, 132. [Google Scholar] [CrossRef] [Scilit]
- Zhao, X.; Chen, J.; Li, J.; Wang, H.; Zhang, X.; Yu, F. Unraveling the renewal priority of urban heritage communities via macro-micro dimensional assessment- A case study of Nanjing City, China. Sustain. Cities Soc. 2025, 124, 106317. [Google Scholar] [CrossRef] [Scilit]
- Fayez, H.; Johansen, D.; Schneider-Marin, P. Resource efficiency in abandoned heritage buildings A review of reuse strategies and decision support methods. J. Build. Eng. 2026, 123, 115645. [Google Scholar] [CrossRef] [Scilit]
- Ferretti, V.; Bottero, M.; Mondini, G. Decision making and cultural heritage: An application of the Multi-Attribute Value Theory for the reuse of historical buildings. J. Cult. Herit. 2014, 15, 644–655. [Google Scholar] [CrossRef] [Scilit]
- Feizizadeh, B.; Fathi, S.; Ghasmeizad Gonbad, Z.; Ghasmei, M.; Makki, M. A Multiple Geospatial Approach for Intangible Cultural Heritage Tourism Potentiality Mapping in Iran. Sustainability 2023, 15, 16659. [Google Scholar] [CrossRef] [Scilit]
- Prabodani, M.K.M.; Danilina, N.; Halwatura, R.U. A hybrid SWARA-WASPAS approach to enhancing decision-making in adaptive reuse of historic buildings. Urban Transit. 2026, 5, 100029. [Google Scholar] [CrossRef] [Scilit]
- Li, P.; Sho, K.; Monica Chien, P.; Zhao, S. Exploring the spatial impact of China’s government-led tourism development model on vernacular architecture in a traditional village: The case of Yaodong in Lijiashan Village in Shanxi Province, China. J. Rural Stud. 2026, 126, 104318. [Google Scholar] [CrossRef] [Scilit]
- Tang, C.; Yang, Y.; Liu, Y.; Xiao, X. Comprehensive evaluation of the cultural inheritance level of tourism-oriented traditional villages: The example of Beijing. Tour. Manag. Perspect. 2023, 48, 101166. [Google Scholar] [CrossRef] [Scilit]
- Meydan Yıldız, S.G.; Kepenek, E.; Temur, H.; Gençel, Z. Spatial Thresholds and Conservation Priorities in a Rural Architectural Heritage Landscape: A GIS–AHP Model from Akşahap, Türkiye. Heritage 2026, 9, 374. [Google Scholar] [CrossRef] [Scilit]
- Lin, Y.; Zhang, F.; Cai, G.; Jin, Y.; Zhang, L.; Ge, Y. Spatio-temporal pattern and driving factors of tourism ecological security in Fujian Province. Ecol. Indic. 2023, 157, 111255. [Google Scholar] [CrossRef] [Scilit]
- Chen, Z.; Yu, S.; You, X.; Yang, C.; Wang, C.; Lin, J.; Wu, W.; Yu, B. New nighttime light landscape metrics for analyzing urban-rural differentiation in economic development at township: A case study of Fujian province, China. Appl. Geogr. 2023, 150, 102841. [Google Scholar] [CrossRef] [Scilit]
- Zhao, Z.; Peng, L.; Cao, W.; Guo, X.; Chen, X. Regional industrial low-carbon synergy: A dual track for carbon reduction and economic development-empirical evidence from Fujian Province, China. Energy Strategy Rev. 2026, 66, 102295. [Google Scholar] [CrossRef] [Scilit]
- Ye, P.; Wang, S.; Chen, P.; Jia, Z.; Lu, Y. Spatial Distribution Dataset of 5058 National Key Protected Cultural Relic Units in Eight Batches of China. Digit. J. Glob. Change Data Repos. 2024. [Google Scholar] [CrossRef] [Scilit]
- Yu, L.; Qiu, Y.; Tang, M.; Han, S.; Fu, M.; Liu, Z. Spatial Dataset of 312 Historical and Cultural Towns and Scenic Spots in China. Digit. J. Glob. Change Data Repos. 2022. [Google Scholar] [CrossRef] [Scilit]
- Guo, Y.; Yan, J.; Wang, Z.; Li, J. Spatial Dataset of 3610 National Intangible Cultural Heritages of China in Five Packages. Digit. J. Glob. Change Data Repos. 2021. [Google Scholar] [CrossRef] [Scilit]
- Liu, T.; Yu, L.; Liu, J.; Xu, Z.; Chen, X.; Wu, H.; Zheng, S.; Zhao, Q.; Gong, P. Unveiling interprovincial geographic patterns of 5A-level tourism cultural ecosystem service flows and tourist preferences in China’s metacoupled systems. Appl. Geogr. 2024, 172, 103432. [Google Scholar] [CrossRef] [Scilit]
- Cai, S.; Gou, Z. Are Green Spaces More Available and Accessible to Green Building Users? A Comparative Study in Texas. Land 2023, 12, 226. [Google Scholar] [CrossRef] [Scilit]
- Kim, B.; Shon, D. Spatial Distribution of Historical and Cultural Resources and Regional Revitalization Strategies in Chungcheong Province, South Korea. Land 2025, 14, 1167. [Google Scholar] [CrossRef] [Scilit]
- Hu, L.; Shao, Y.; Chen, H. Exploration of the Holistic Protection Plan of Cultural and Natural Heritage at the Provincial Level: A Case Study of Hunan Province. Landsc. Archit. 2026, 33, 29–38. [Google Scholar] [CrossRef] [Scilit]
- Li, R.; Liu, X.; Li, M. Spatial Vitality Assessment of Urban Post-Industrial Landscapes Using Multi-Source Data: A Case Study of Beijing Shougang Park. Land 2025, 14, 1859. [Google Scholar] [CrossRef] [Scilit]
- Akbar, S.H.; Shaker, M.; Mahar, W.A.; Iqbal, N. Integrating Heritage Conservation, Adaptive Reuse, and Sustainable Tourism: A Value-Based Framework for Historic Urban Quarters. Heritage 2026, 9, 159. [Google Scholar] [CrossRef] [Scilit]
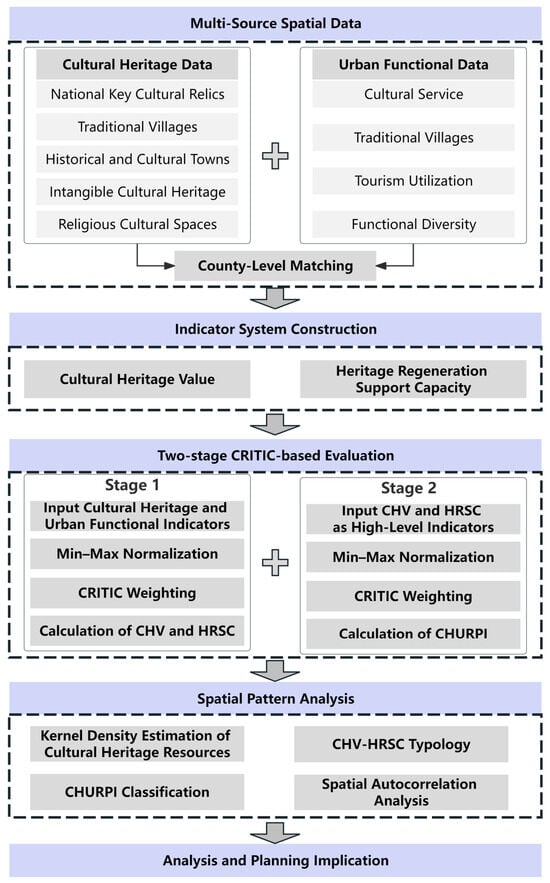
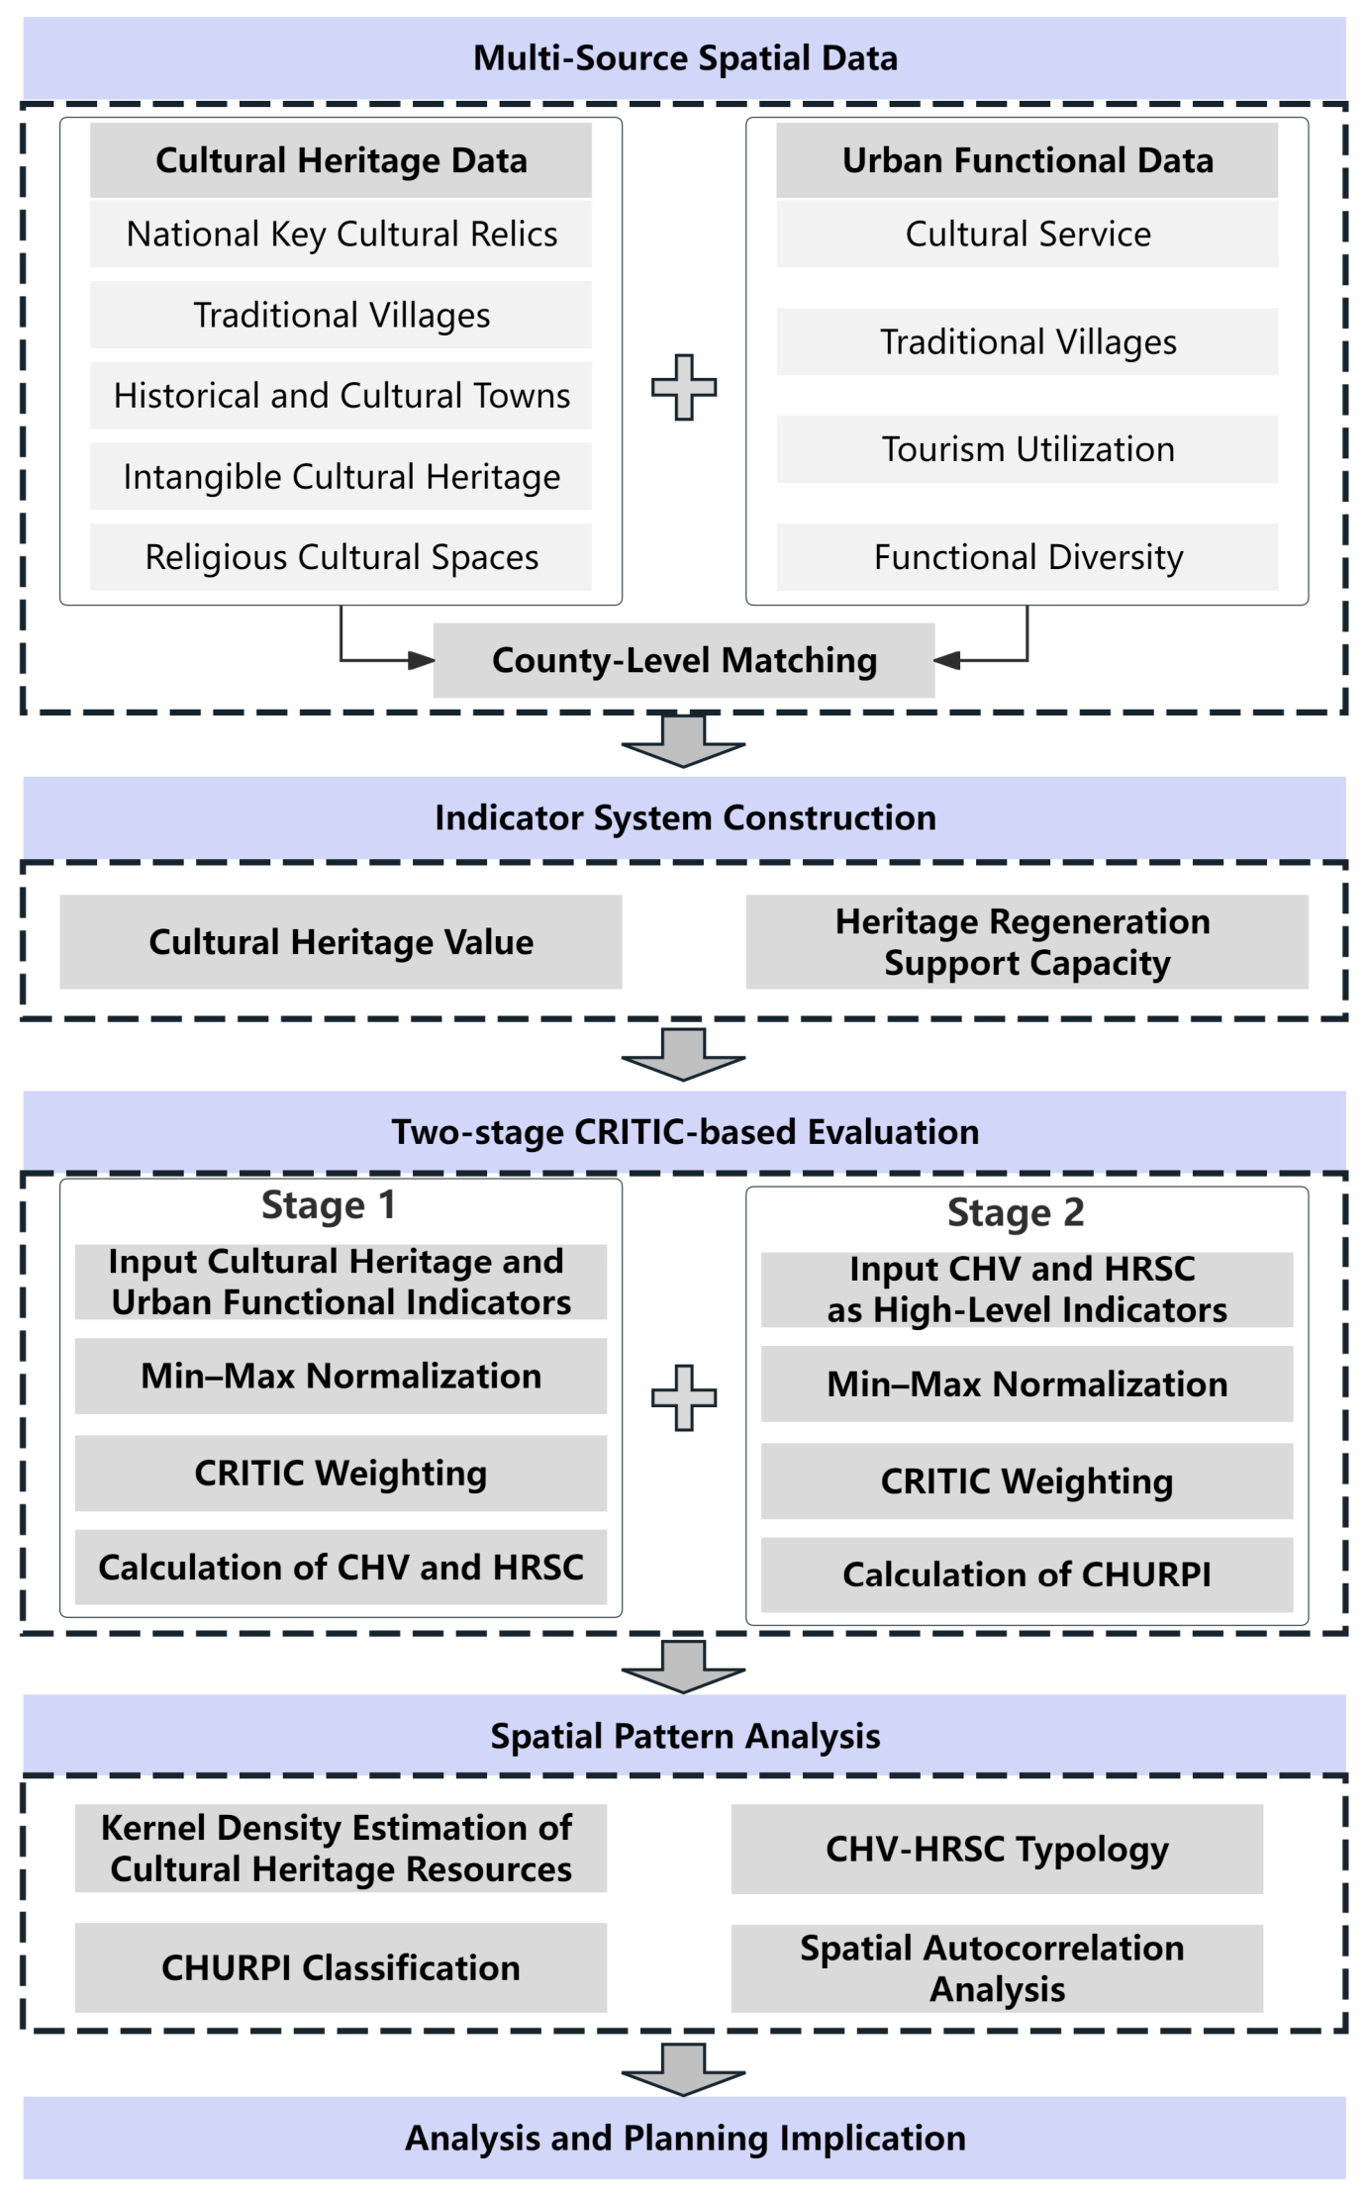
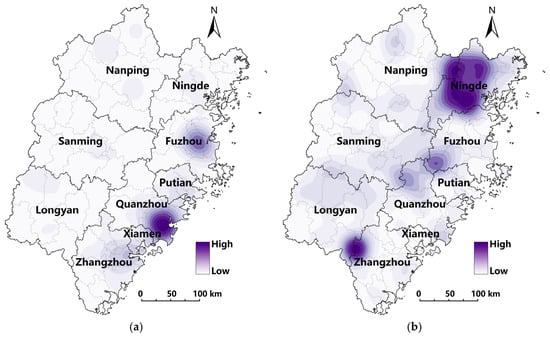
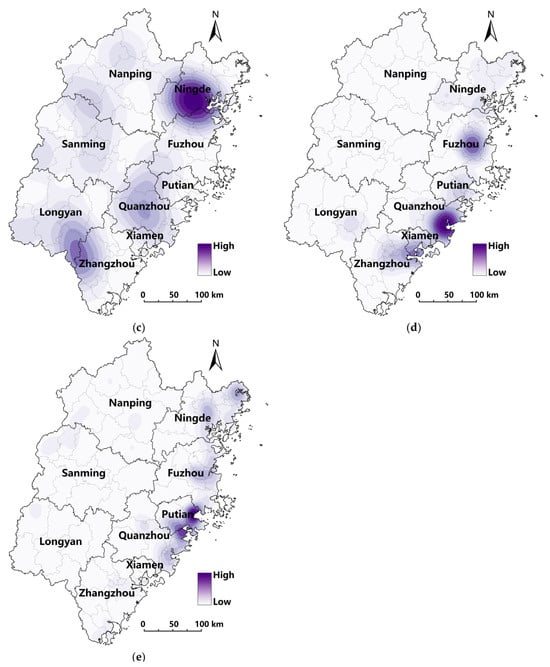
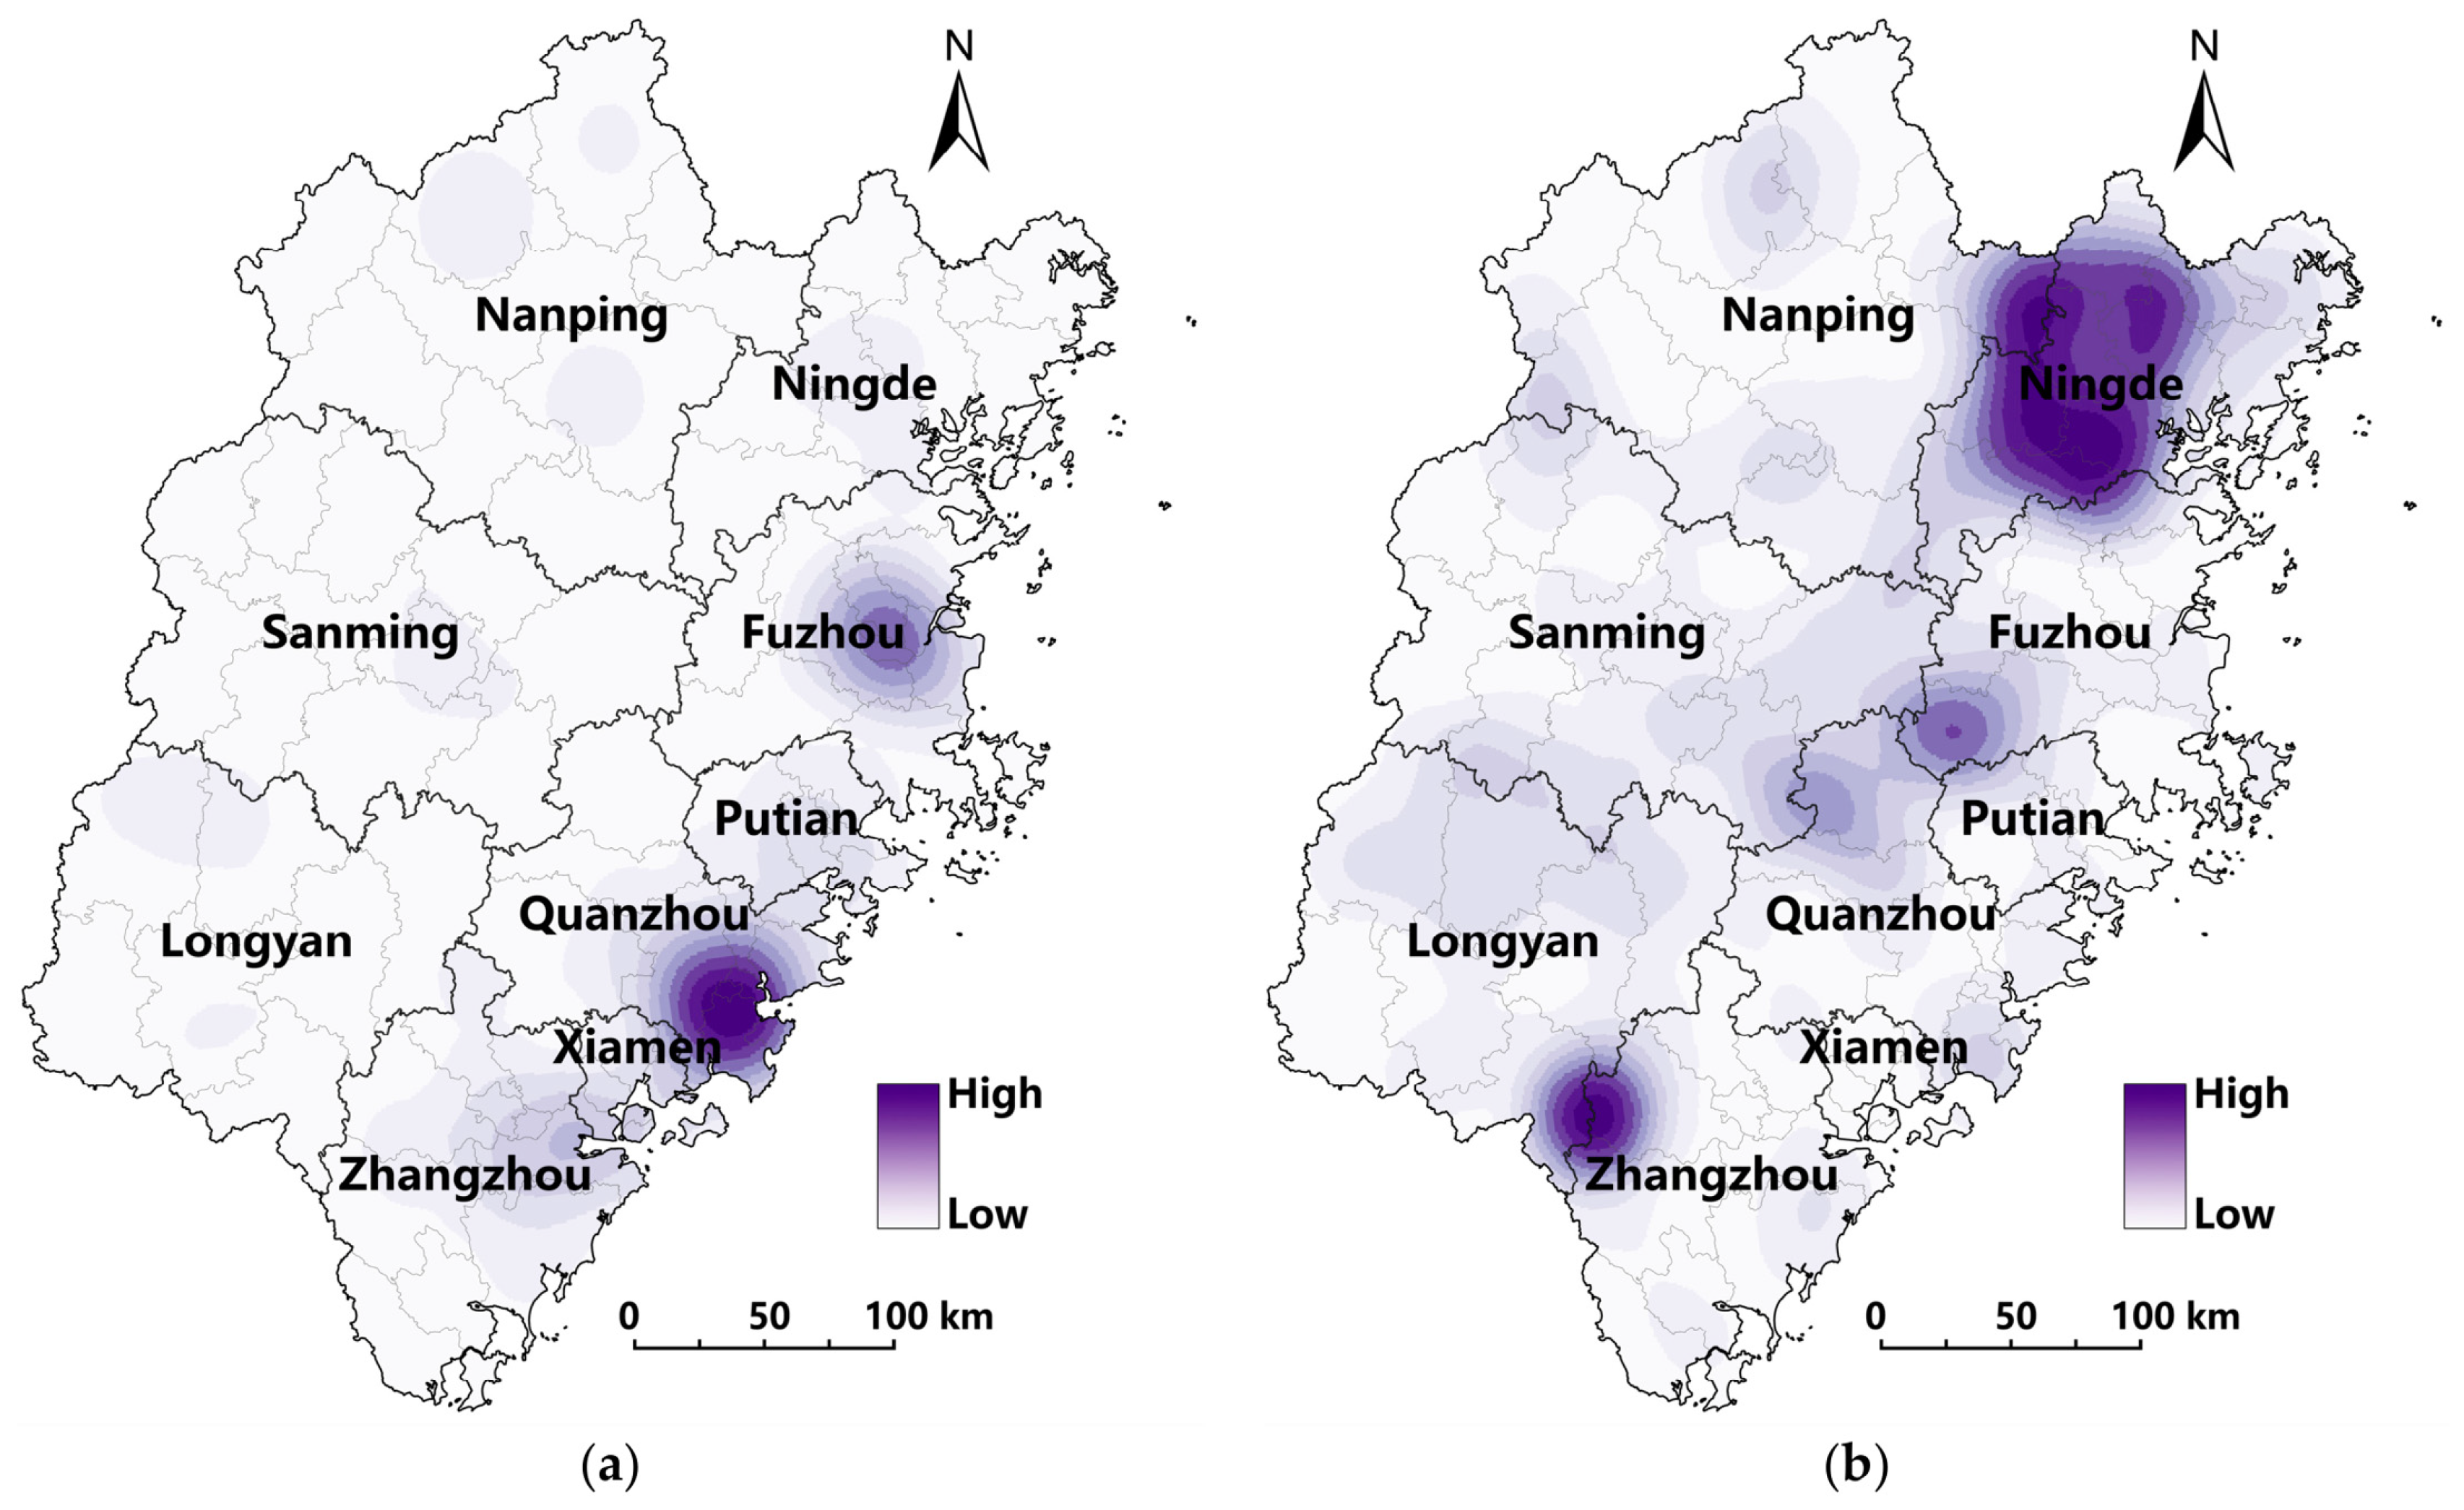
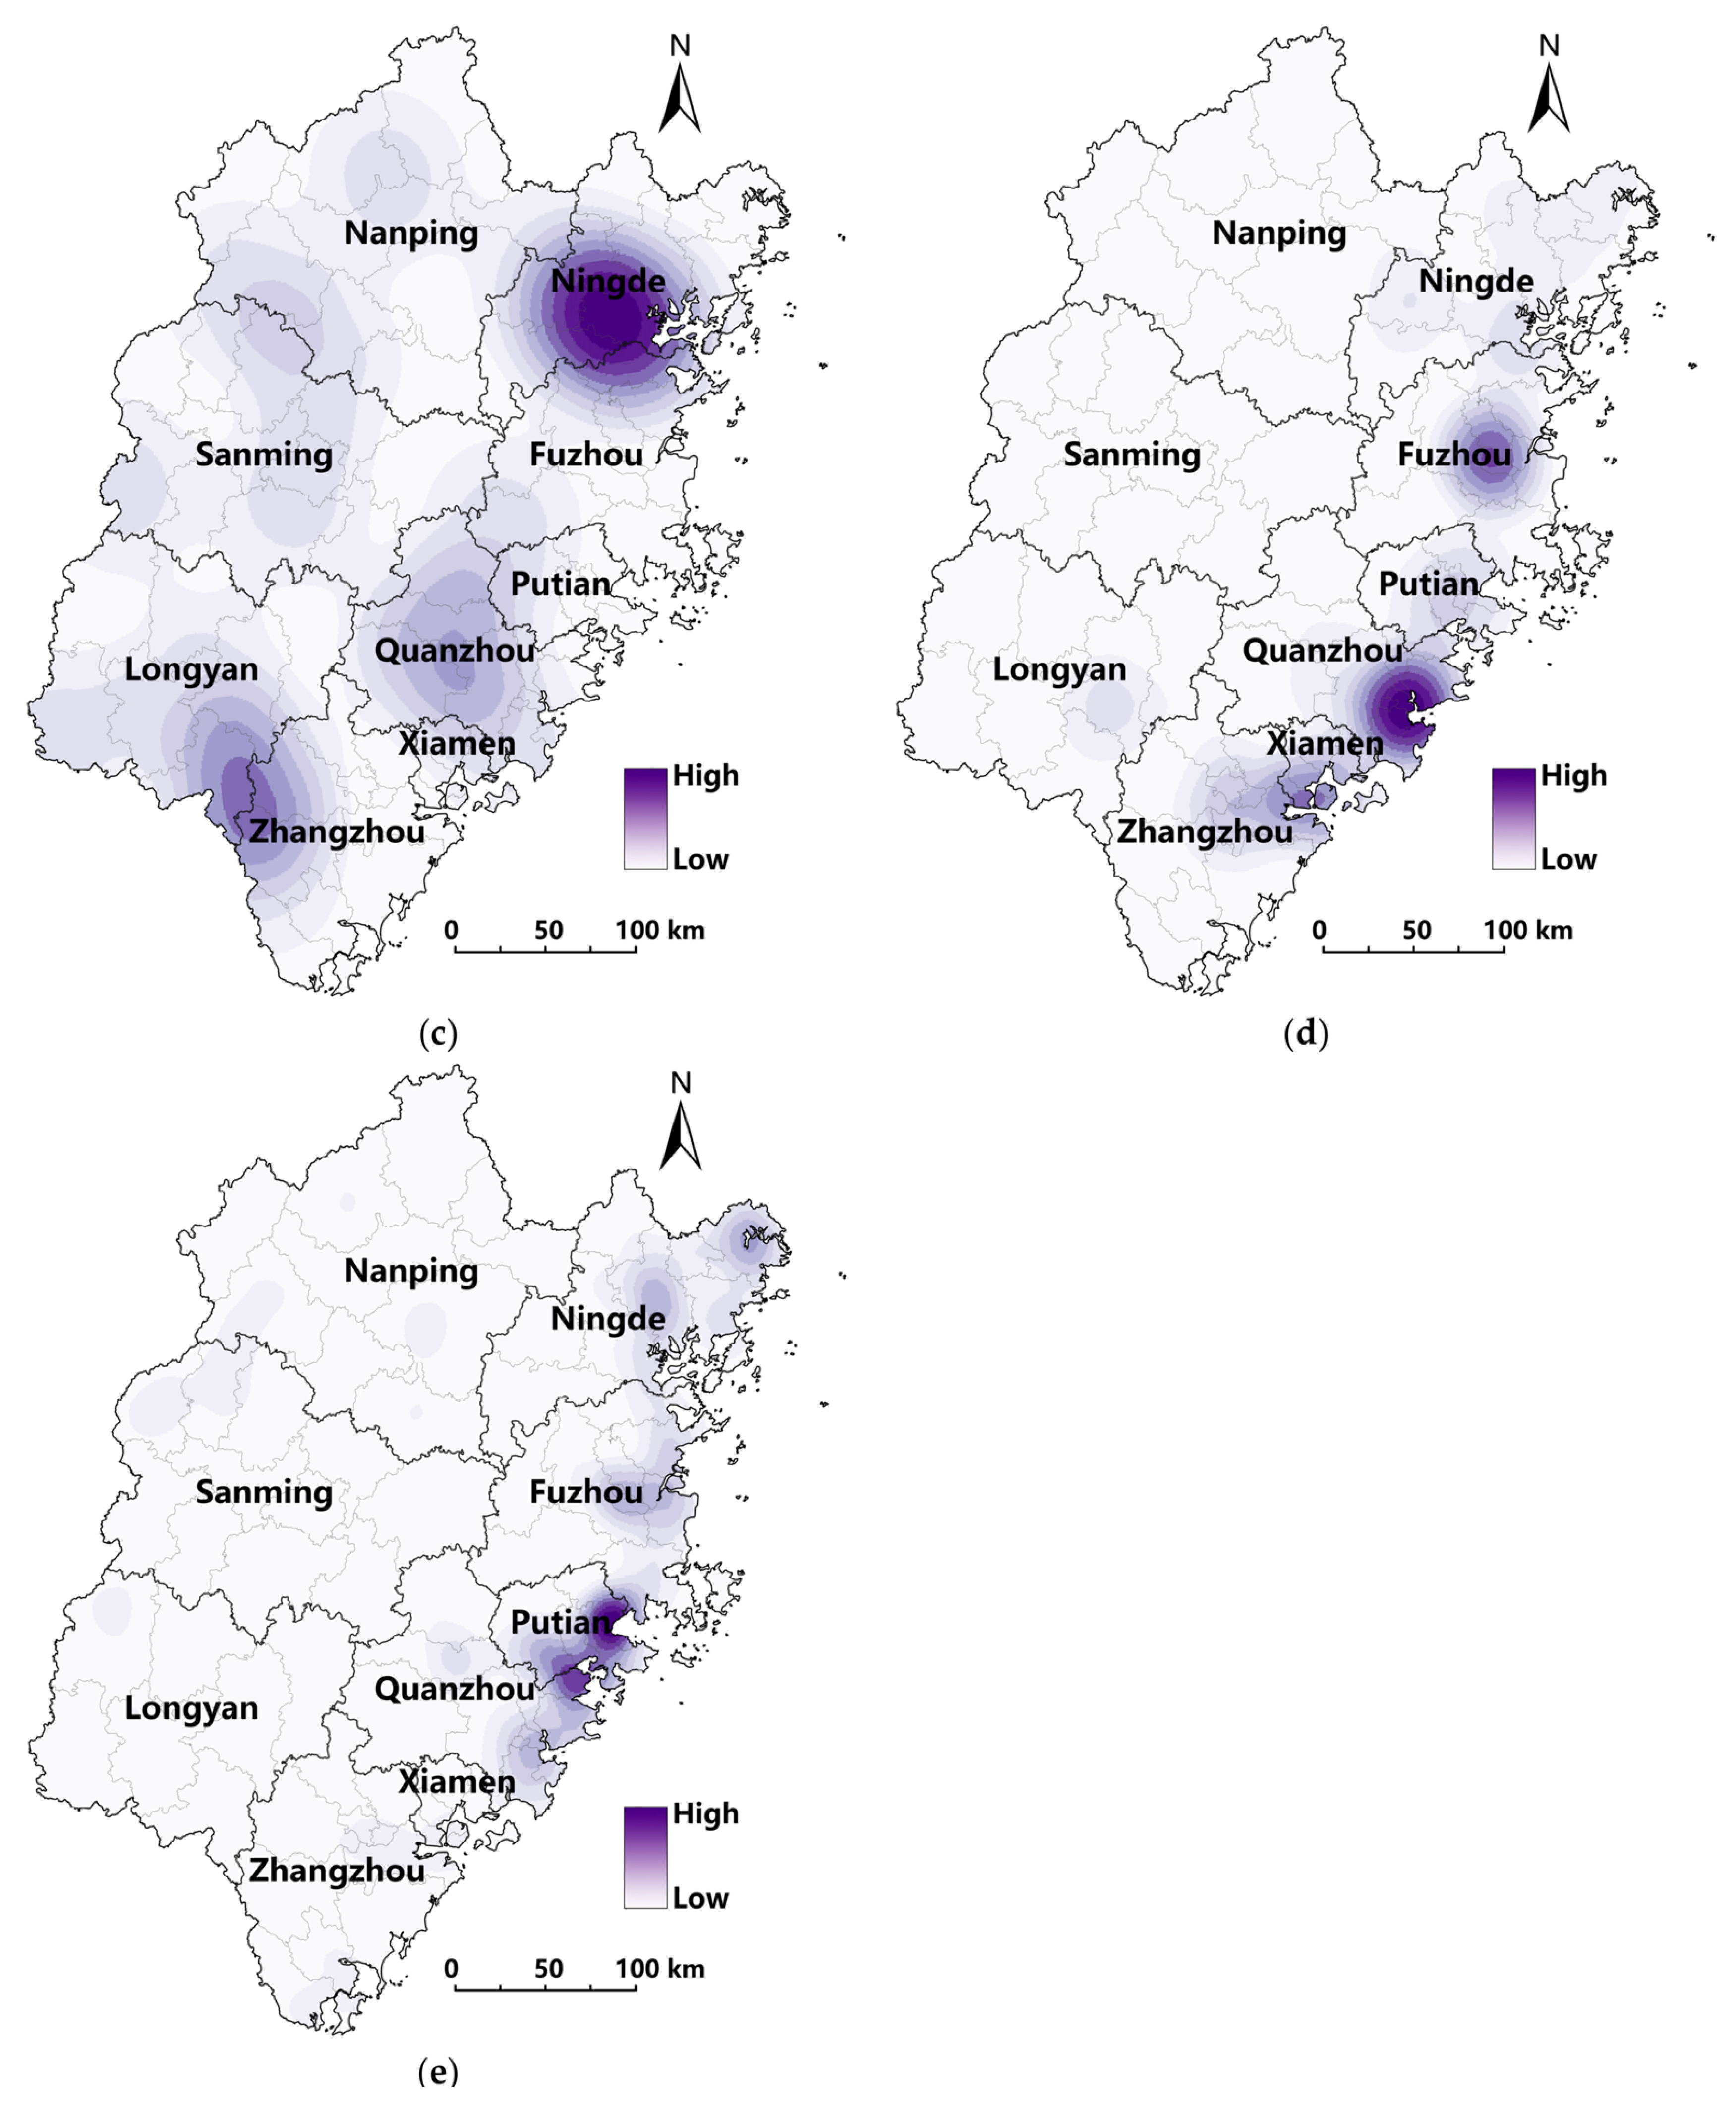
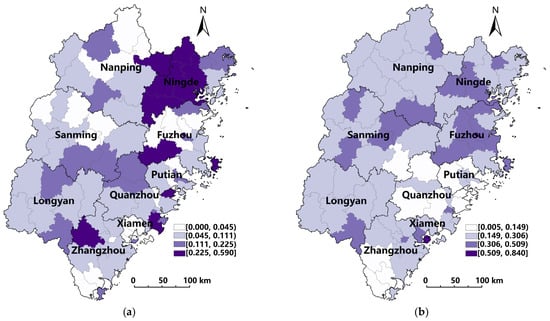
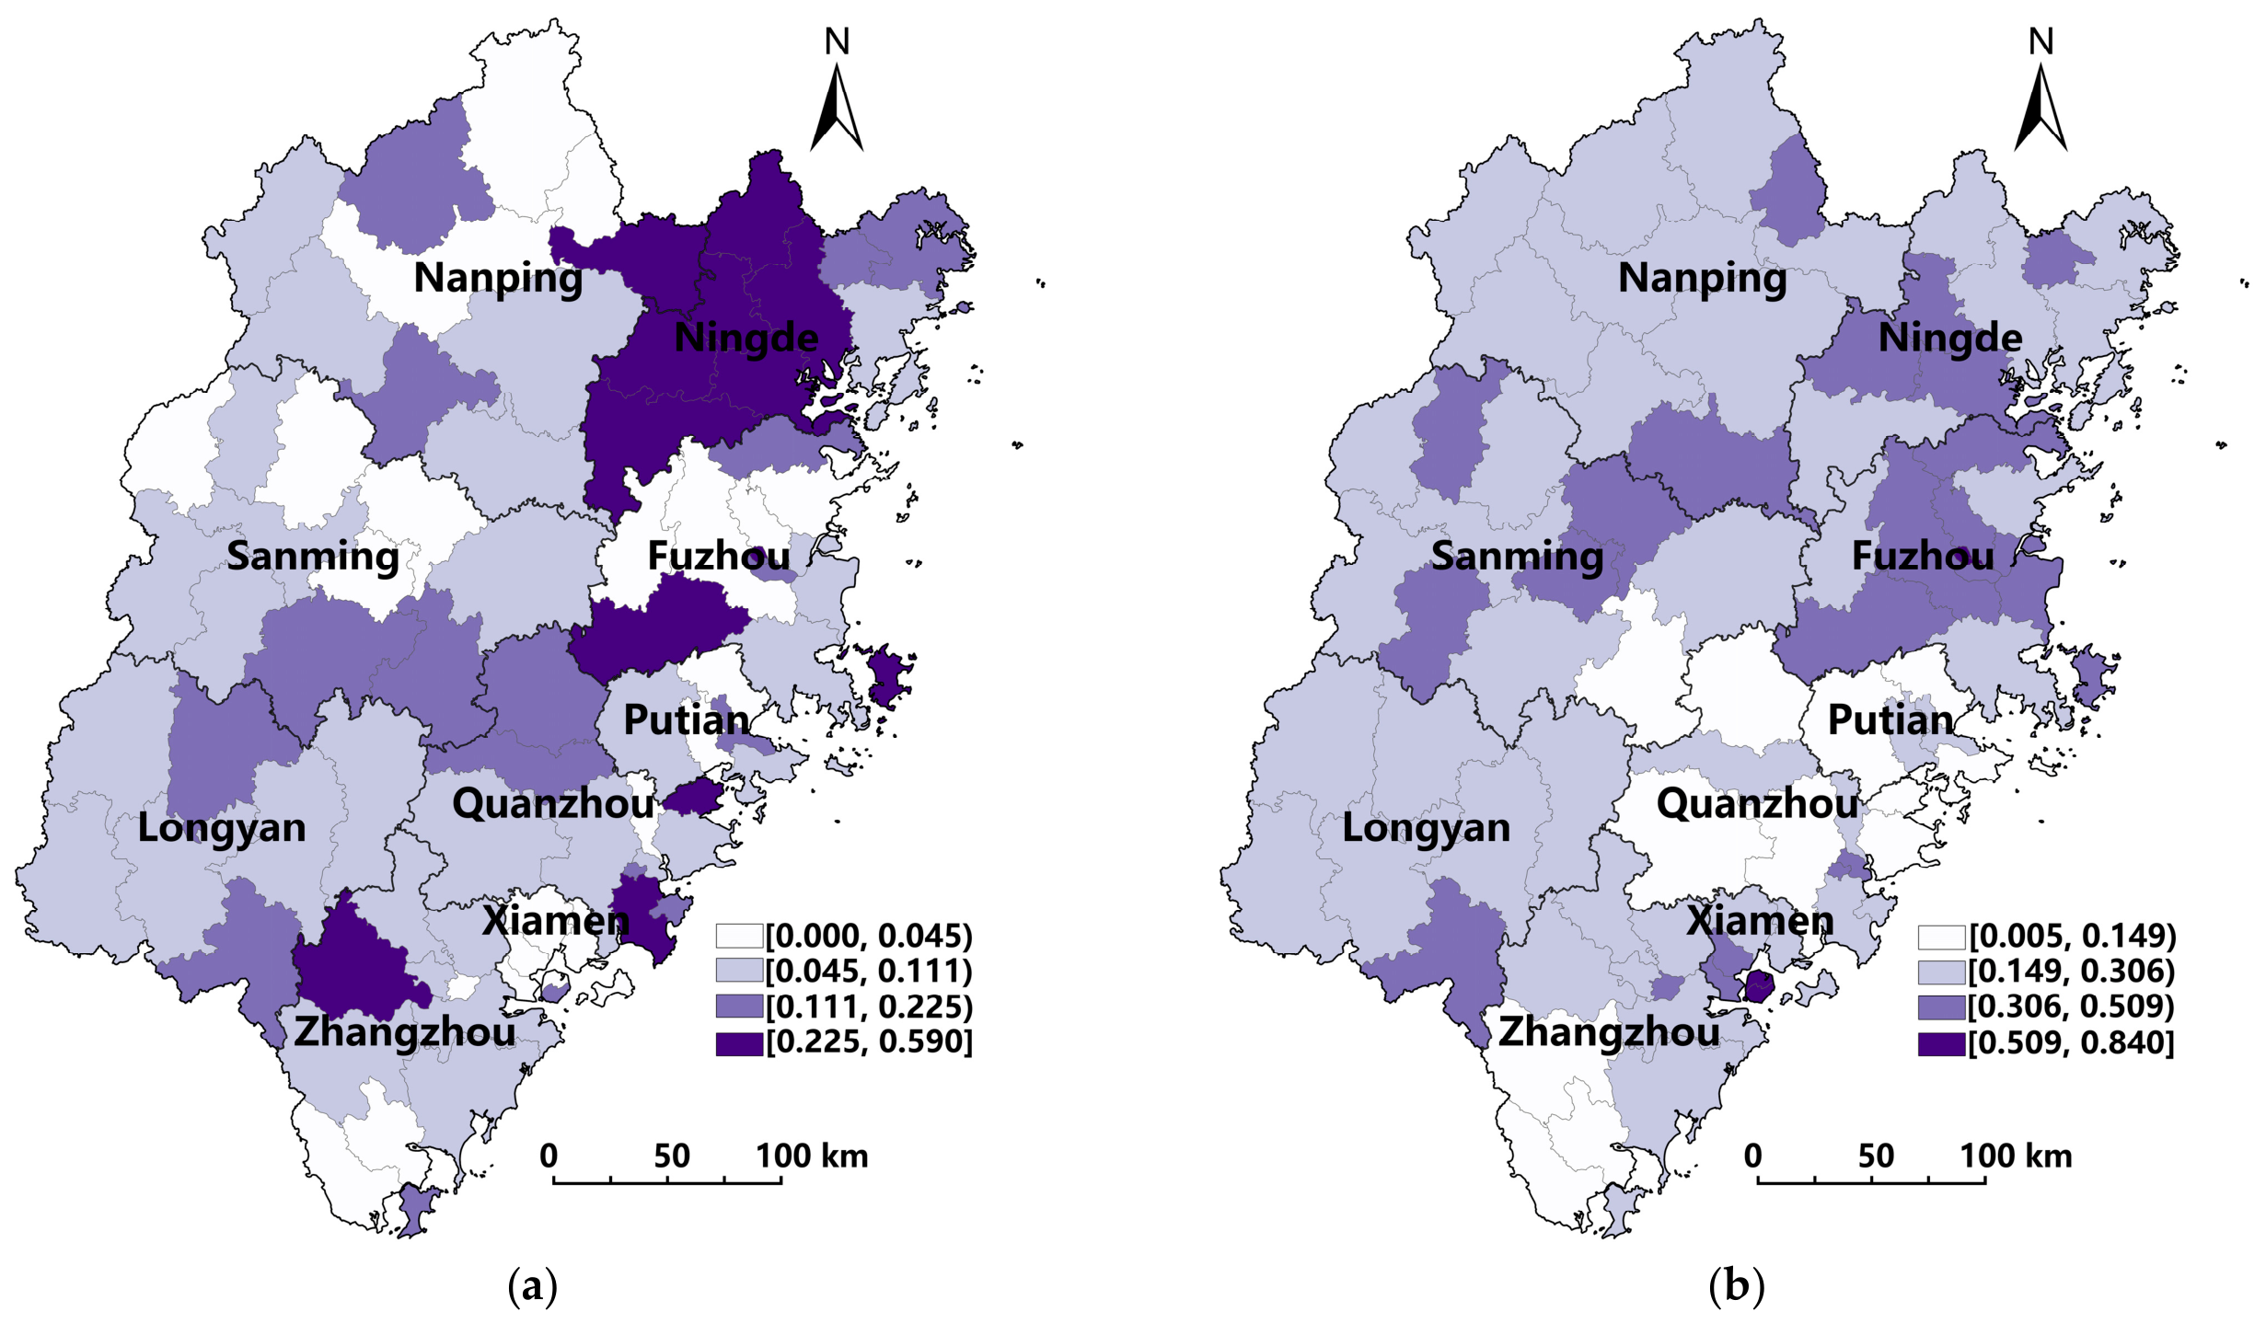
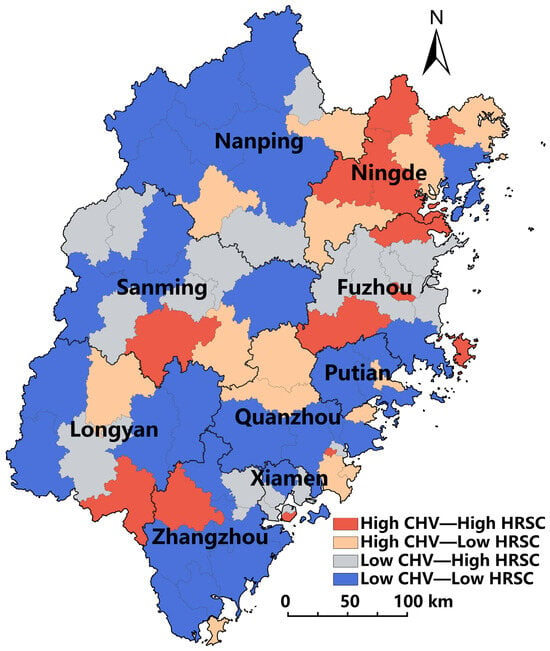
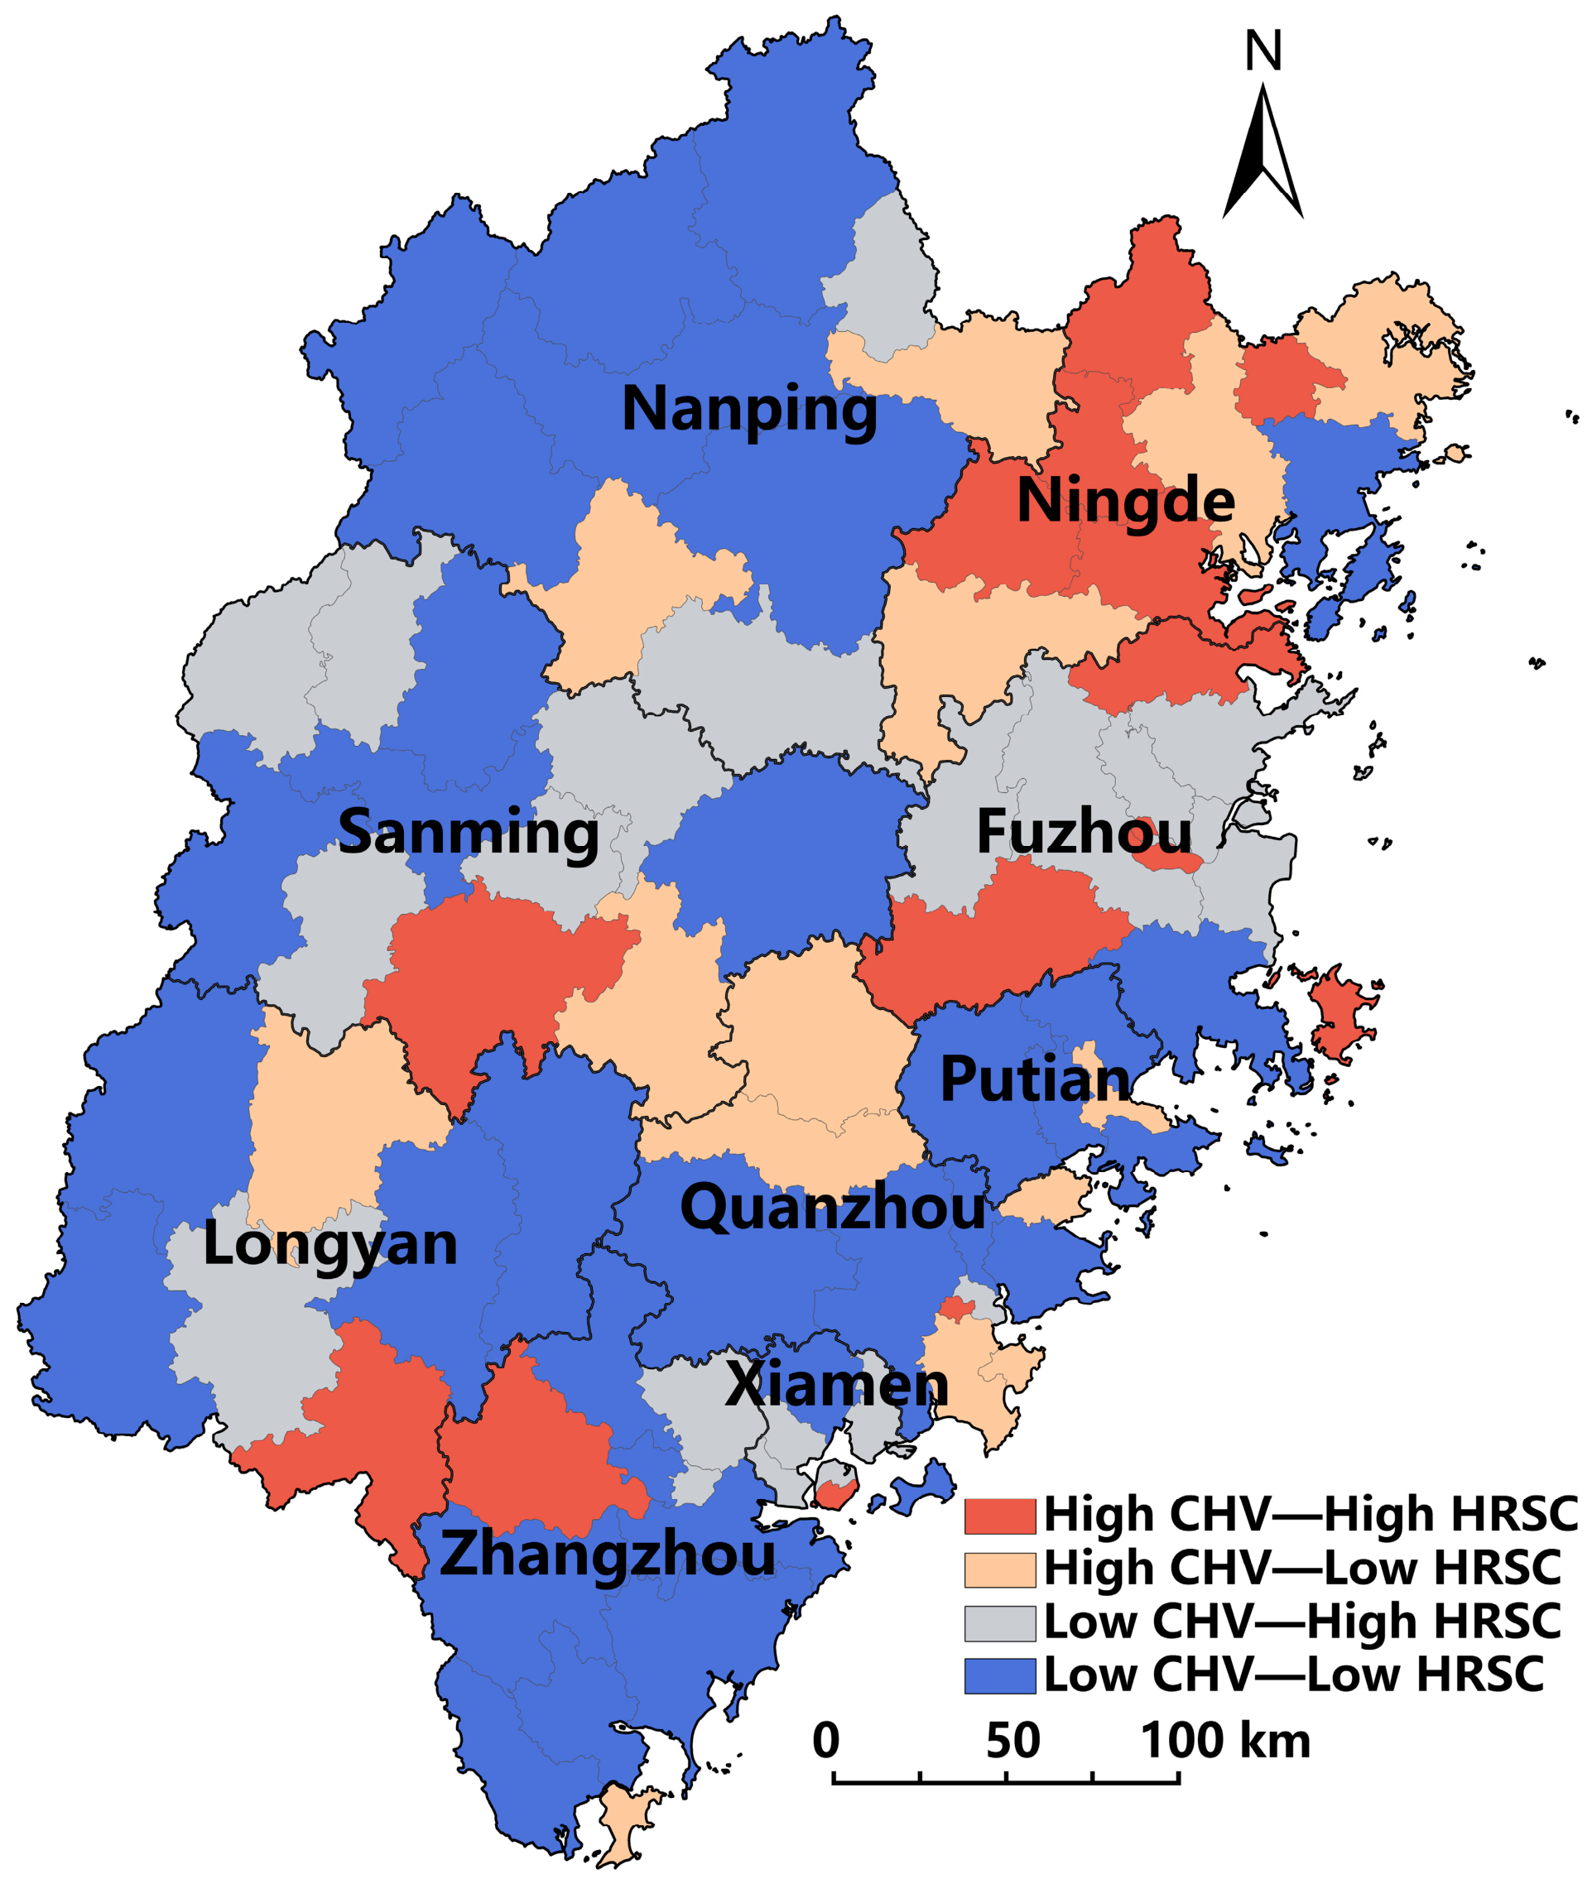
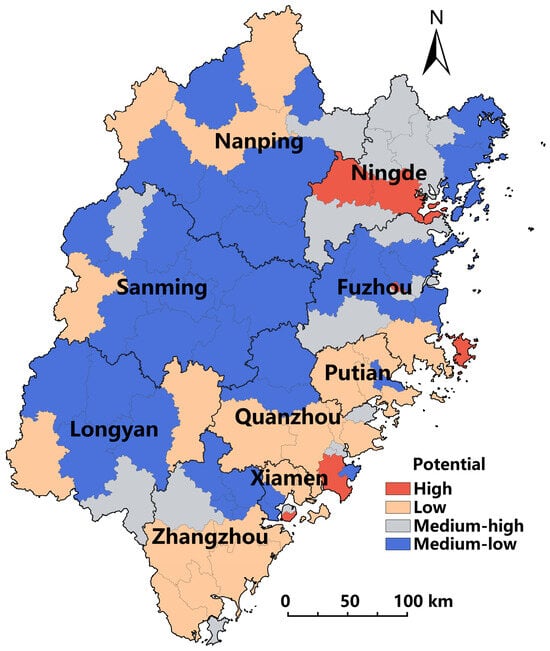
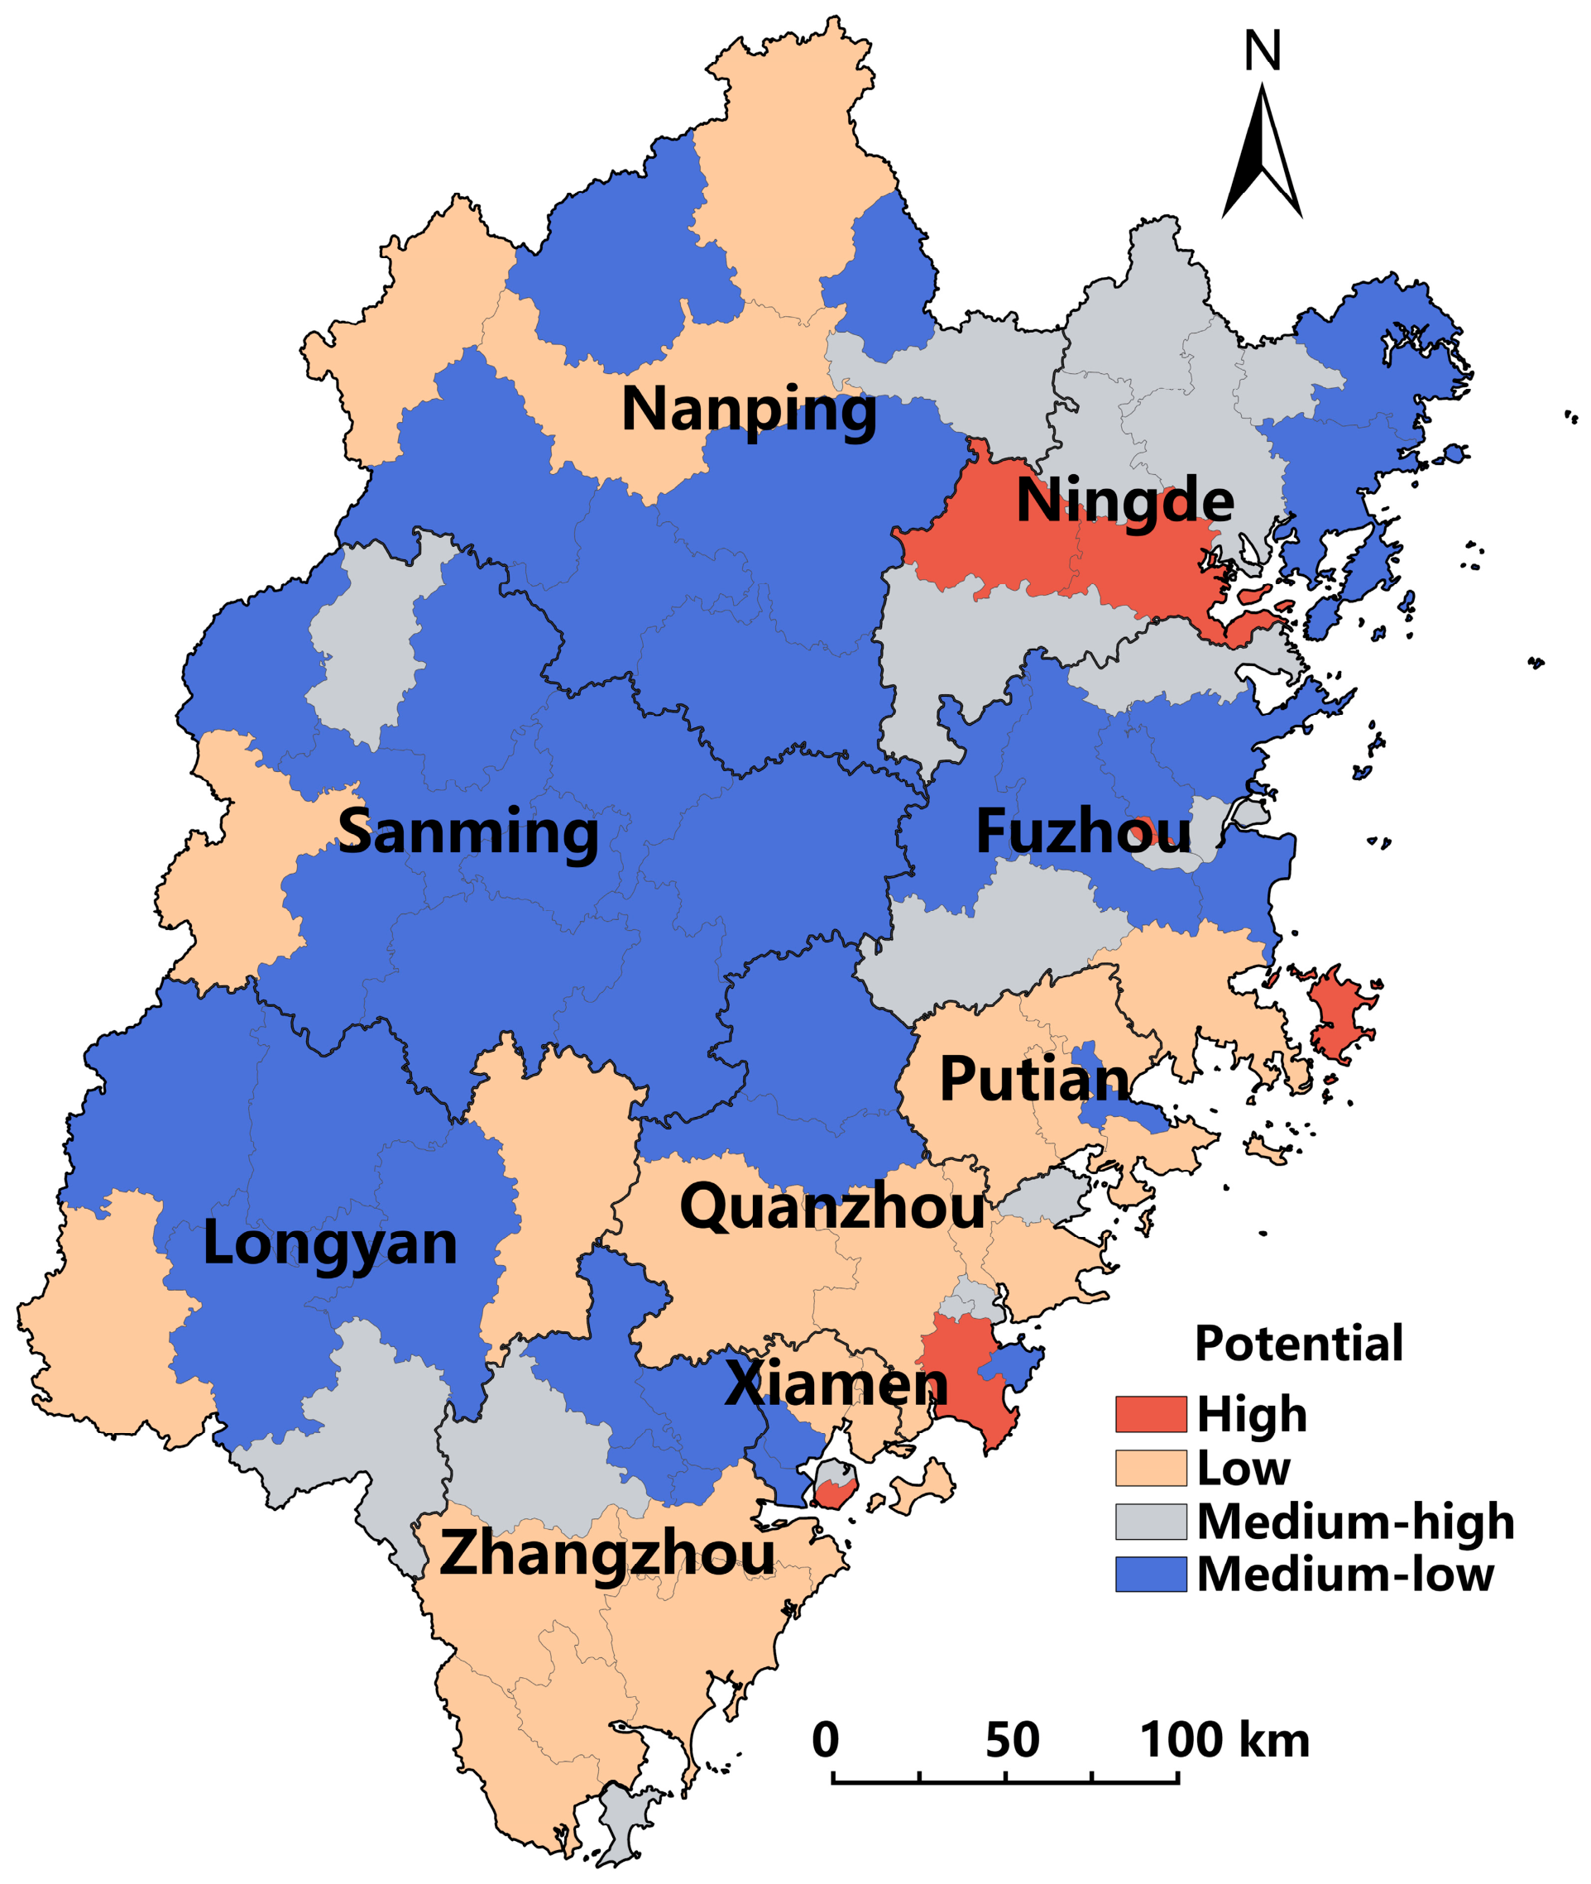
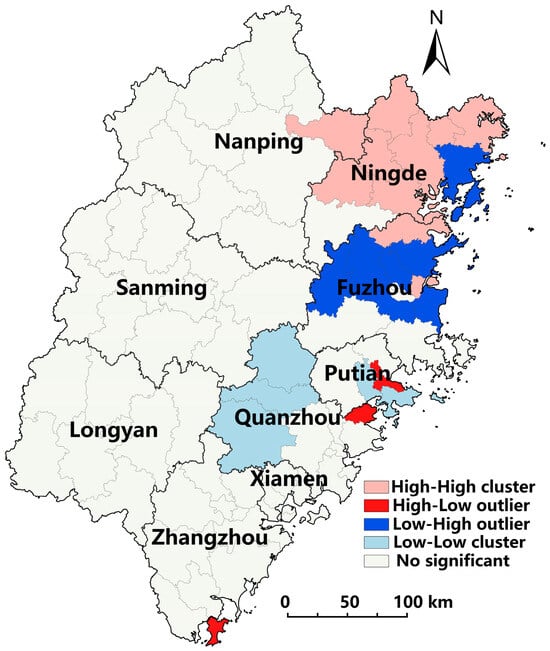
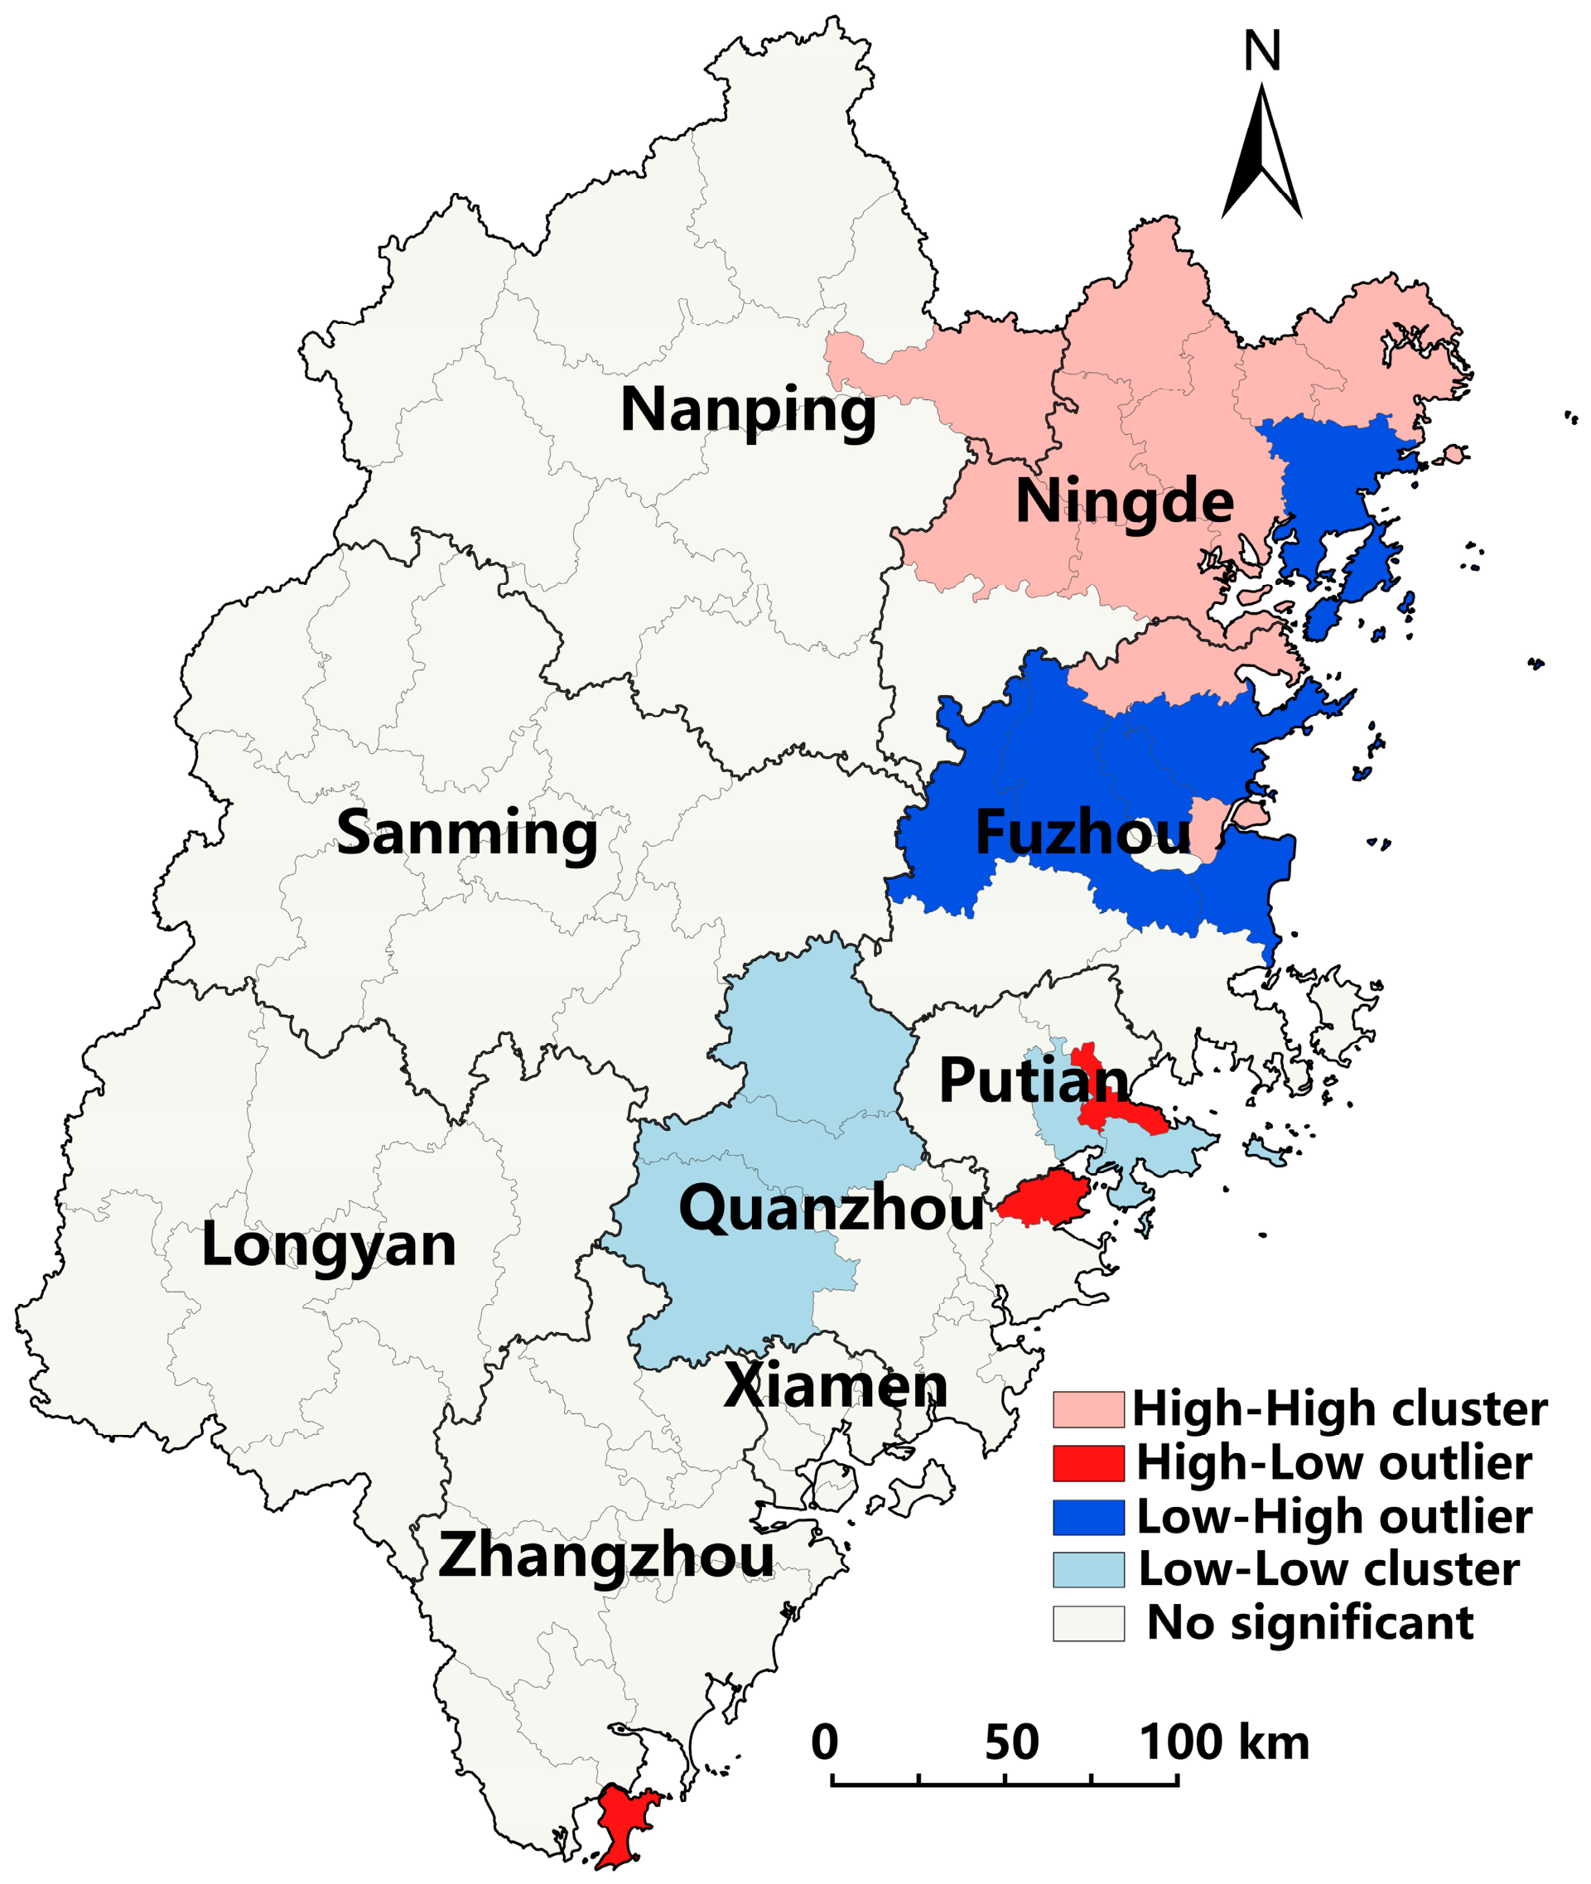

Disclaimer/Publisher’s Note: The statements, opinions and data contained in all publications are solely those of the individual author(s) and contributor(s) and not of MDPI and/or the editor(s). MDPI and/or the editor(s) disclaim responsibility for any injury to people or property resulting from any ideas, methods, instructions or products referred to in the content. |
© 2026 by the authors. Licensee MDPI, Basel, Switzerland. This article is an open access article distributed under the terms and conditions of the Creative Commons Attribution (CC BY) license.