


Abstract
The spatial differentiation of street-block vitality and its built-environment correlates provide an empirical basis for implementing refined street-block governance in the context of the renewal of existing urban areas. Based on the human–environment relationship theory, this study constructs an analytical framework of “built environment condition–street-block vitality response” and establishes a built environment indicator system based on a five-dimensional (5D) framework encompassing density, diversity, design, destination accessibility, and distance to transit. Empirically, street-block vitality is measured by the block-level average heat value derived from Baidu Huiyan data, representing the relative intensity of population activity within each street block. By integrating objective data—such as point-of-interest (POI) data and road networks—with residents’ subjective perceptions, this study employs spatial autocorrelation analysis, hot spot analysis, and multiscale geographically weighted regression (MGWR) models to identify the spatial patterns of street-block vitality in Baoding during the observation week of 8–14 April 2024 and their local associations with built environment factors. Model performance was evaluated through model comparison, sensitivity analysis, and spatial holdout validation. The results indicated that street-block vitality exhibited significant spatial clustering. High–high clusters were primarily distributed in urban development zones and their adjacent areas in the central-eastern, northeastern, and southwestern parts of the city, whereas low–low clusters were mainly concentrated in ecological protection and ecological control zones in the western, northwestern, and northern parts of the city. The density of scenic facilities (Den_sce), facility-density principal component (PC_FAC), road network density (Den_road), and distance to the nearest public transit stop (Dist_transit) generally showed a positive association with street-block vitality, whereas satisfaction with public transit stop placement (Convenience_sat) showed a negative association. The direction of the association between satisfaction with traditional cityscape design (Style_sat) and street-block vitality varied across locations, and spatial differences were evident in the local coefficients, the spatial extent of statistical significance, and optimal bandwidths for each variable. The research findings provide empirical evidence for formulating differentiated street-block renewal strategies based on territorial spatial functional zoning, street-block vitality types, and local association patterns.
1. Introduction
1.1. Background
The United Nations 2030 Agenda for Sustainable Development sets out the Sustainable Development Goals (SDGs) to guide global sustainable development. Among these, Goal 11—“Build inclusive, safe, resilient, and sustainable cities and human settlements”—elevates the improvement of urban spatial quality to a strategic level critical to human well-being and the future of civilization [1]. At the same time, stimulating and fostering urban vitality has become a clear strategic orientation at the national level in China. The 2025 Central Urban Work Conference emphasized “focusing on building vibrant, innovative cities,” placing the development of urban vitality at the forefront of urban development; the “Opinions on Continuously Advancing Urban Renewal Initiatives” (2025) further proposed “promoting the functional transformation, business model upgrading, and revitalization of older blocks, and creating a number of street blocks with vitality, tailored to local conditions,” providing specific policy guidance for enhancing street-block vitality at the micro-scale. As the fundamental spatial units of urban planning and design, urban blocks not only accommodate diverse urban functions but also serve as vital settings for residents’ daily lives. Urban vitality provides the structural conditions for street blocks, while street-block vitality, through sustained human activity, in turn nourishes and shapes the city’s overall vitality. Therefore, this paper defines street-block vitality as the intensity of aggregation and flow of people’s daily activities within the street-block space over a specific observation period, which serves to characterize the level of activity among the street block’s population [2].
However, China’s urbanization has entered its latter phase. Rapid urbanization has given rise to practical problems such as the separation of work and residence, traffic congestion, insufficient resources and environmental carrying capacity, and population decline, which to some extent constrain the generation and maintenance of street-block vitality [3,4]. Against this backdrop, cities face pressure from the outflow of talent and capital in the competition for regional resources, and the maintenance of street-block vitality is highly dependent on the refined allocation of street-block space. On the one hand, population loss leads to shrinking consumption, reduced spatial livability, and the erosion of local identity, resulting in a continuous decline in street-block vitality [5,6]. On the other hand, in areas with high vitality, the rapid influx of capital can easily trigger the phenomenon of commercial gentrification, leading to the implicit displacement of long-term residents and the disruption of the community’s cultural fabric [7]. Even when new facilities are added or road networks are densified, the stimulatory effect on vitality in some street blocks tends to weaken [8]. The traditional model of universal investment is no longer sustainable, and the imbalance between “cold” and “hot” zones has become a deep-seated problem constraining urban spatial quality and sustainable development.
Behind these issues lies the combined effect of urban spatial structure and resource allocation methods. First, public investment and market resources are often concentrated in a few areas, resulting in systemic disparities in the basic conditions of street blocks in different locations; second, in the process of compact urbanization, various existing spaces—such as old city centers, industrial zones, and outlying new districts—coexist in an intertwined manner, and the constraints faced by street-block spaces vary significantly. Third, constrained by financial resources and institutional limitations, the trial-and-error costs of large-scale demolition and reconstruction are high, making it essential to rely on precise diagnostics of existing spaces to enhance the efficiency of urban renewal. The aforementioned characteristics of spatial structure and resource allocation shape the fundamental attributes of street-block vitality. Limited resource supply makes it difficult to support a polycentric network of vitality; street blocks in different locations exhibit distinct logic of vitality generation due to varying spatial constraints, and homogenized renewal strategies struggle to address these differentiated spatial needs. This implies that research on the spatial differentiation of urban street-block vitality must shift its focus from aggregate investment to the precise identification of spatial heterogeneity within street blocks.
Guided by the philosophy that “people’s cities are built by the people and for the people,” optimizing the built environment to enhance street-block vitality constitutes a practical pathway for responding to people-centered needs and putting the people-centered city philosophy into practice. This provides the empirical basis for this study to explore the spatial differentiation of street-block vitality, examine the spatial relationships and local variations between built environment factors and street-block vitality, and offer evidence-based insights for street-block renewal, spatial optimization, and urban governance.
The structure of this paper is as follows:
- Introduction: This section outlines the background and significance of the study, reviews existing research on the concept, assessment methods, and influencing factors of street-block vitality, summarizes the progress and limitations of current research, and formulates the research questions for this study.
- Theoretical Framework and Indicator System: This section constructs a theoretical framework linking street-block vitality to the built environment based on the theory of human–environment relations and establishes a corresponding indicator system.
- Materials and Methods: This section first introduces the study area, then describes the data sources and data processing procedures, and finally presents the research methods employed in this study.
- Results: First, the spatial distribution patterns and differentiation characteristics of street-block vitality are analyzed. Second, the model’s fit, spatial heterogeneity, and out-of-sample predictive ability are evaluated using variable diagnostics, bandwidth selection, model comparison, GWR-based Monte Carlo tests of coefficient spatial variation, and spatial holdout validation. Finally, multiscale geographically weighted regression (MGWR) is used to analyze the spatial association between street-block vitality and the built environment, as well as their local variations.
- Discussion: Based on the empirical results, the findings of the model analysis are discussed in detail.
- Conclusions: The main findings of the study are summarized, and targeted policy recommendations are proposed based on these findings.
1.2. Literature Review
The concept of “vitality” was initially widely applied in the fields of biology and physics and was subsequently introduced into urban planning and development. In The Death and Life of Great American Cities, Jane Jacobs explicitly argued that urban vitality arises from the interaction between human activities and urban space and is closely associated with urban diversity [2]. In Good City Form, Kevin Lynch defined urban vitality as the degree to which the spatial form of a city sustains vital functions, meets ecological requirements, and supports the capabilities of its residents [9]. Early studies primarily approached vitality from biological and anthropological perspectives, emphasizing the role of social interaction and diverse activities in shaping vitality and focusing on the interactions between people and their environment [9]. Previous studies have gradually developed three main perspectives. The first defines vitality in terms of the breadth and depth of human activities, emphasizing the diversity of urban life as the essence of vitality [10]. The second focuses on the spatial capacity of street blocks, including their ability to attract external resources and stimulate internal social life, as well as the cultural viability and place-based appeal of historic spaces [11]. The third adopts an integrative perspective, regarding vitality as the outcome of interactions between environmental systems and user behavior. Together, these perspectives reflect a conceptual progression from “behavioral manifestations” to “spatial capacity” and ultimately to “human–environment synergy” [12,13]. Although existing studies differ in emphasis, they generally regard the concentration and movement of people as the primary characteristic of vitality.
Regarding the assessment of street-block vitality, traditional approaches rely on data from government statistical yearbooks and employ methods such as factor analysis, the entropy weighting method, and the Technique for Order Preference by Similarity to an Ideal Solution (TOPSIS) to determine indicator weights and composite scores [12,14]. These approaches benefit from standardized data and facilitate longitudinal comparisons and intercity benchmarking. However, their limited spatial resolution makes it difficult to capture variations in vitality within street blocks, and the data are subject to considerable time lags. To overcome these limitations, big-data-based assessment has become the predominant paradigm, primarily drawing on remote sensing and social sensing data. Remote sensing data, particularly nighttime light data, reflect the intensity of local economic activity, and their spatial resolution enables analysis at the street and even community scales [15]. Nevertheless, these data are associated with high acquisition and processing costs and potential user selection bias. Social sensing data, including mobile phone signaling data [16], social media check-ins [17], points of interest (POIs) [18], and Baidu Huiyan data [19], can directly and dynamically reflect the spatial density of population flows and types of human activity, thereby providing a measure of vitality within an area. Existing studies have been conducted at multiple spatial scales, including urban agglomerations [20], cities [17], and streets [21]. In addition, scholars have increasingly employed space syntax to examine the relationship between street-block spatial form and vitality [22], or applied geographically weighted regression (GWR) and multiscale geographically weighted regression (MGWR) to investigate the spatial heterogeneity of vitality [23,24]. These methods reveal how the effect magnitudes of influencing factors on street-block vitality vary across geographical locations, identify vitality “hot spots” and “cold spots,” and characterize the spatial patterns and driving factors of street-block vitality.
Research has confirmed that the factors influencing street-block vitality are interdependent with socioeconomic conditions, external events, and the built environment, with the magnitude and orientation of their effects varying significantly across diverse contexts. Regarding socioeconomic and environmental factors, the positive impact of permanent resident population size is reflected in daytime social activities and basic consumer vitality [19]. The provision level of urban amenities—specifically the density of retail, dining, and cultural-entertainment facilities—serves as the direct spatial carrier for diverse human activities, thereby exerting a positive driving effect on street-block vitality [25]. Air pollution levels have been shown to significantly suppress street-block vitality by reducing residents’ willingness to engage in outdoor activities [26]. Public emergencies, by restricting the movement of people, cause a severe short-term negative impact on vitality, and the recovery process is influenced by multiple factors, including the city’s administrative level and the intensity of control policies [27]. The mechanisms driving nighttime vitality diverge from those operating during the day; specifically, nighttime vitality relies more heavily on the spatial concentration and accessibility of nighttime amenities—such as specialty dining, bars, and lighting infrastructure—while exhibiting a lower sensitivity to overall land-use mix and road network density [28,29]. The mechanisms influencing block-level vitality exhibit a high degree of context-dependence and spatial heterogeneity; specifically, key influencing factors vary significantly across blocks with different dominant functions and spatial configurations [30].
The built environment is considered a core factor influencing street-block vitality. Relevant studies widely adopt the five-dimensional (5D) framework, comprising density, diversity, design, destination accessibility, and distance to transit [31] to systematically characterize the built environment, specifically covering variables such as facility density, land-use mix, spatial perception, road network conditions, and public transportation accessibility [32,33,34,35]. In terms of density, the spatial clustering of various types of facilities typically supports more frequent interpersonal interactions and commercial activities [25], while an increase in scenic facilities and park green spaces provides residents with spaces for leisure and recreation [36,37]. In terms of diversity, functional mix has a positive impact on vitality by promoting diverse activities among people, but excessive functional mix in settings such as historic districts may undermine cultural distinctiveness [38]. In terms of design, greenway environments and street character influence street-block vitality by shaping spatial perception, environmental quality, and the experience of lingering [39,40]; in terms of destination accessibility, the ease of access to facilities affects residents’ opportunities and scope for activities [41]; in terms of distance to transit, road network density, density of transport facilities, and proximity to public transit stops collectively characterize travel accessibility conditions and influence street-block vitality by promoting population mobility [35,41].
However, the aforementioned positive associations do not hold under all conditions. In highly compact or maturely developed blocks, the marginal contribution of new facility density to vitality may diminish, and the development stage of a block can significantly alter the strength of the impact of the same built environment factor [32]. The strength of the association between density factors and vitality varies across cities at different stages of development [42]. An empirical analysis of Hangzhou, China, indicates that there is a nonlinear relationship and a threshold effect between the built environment and vitality and that the response patterns of social vitality and economic vitality differ [8]. Building density and park accessibility exhibit a nonlinear response to vitality, initially increasing and then decreasing [43]; while floor area ratio and mixed land use are important factors associated with the built environment, the marginal effect of mixed land use shows a decreasing trend [44]; and the direction and strength of the relationship between density of transport facilities and vitality also vary spatially [45]. These findings indicate that the direction and strength of the relationship between the built environment and street-block vitality vary with the block’s stage of development, spatial context, and specific built-environment elements.
In summary, existing research has accumulated a wealth of findings on the conceptual framework, measurement methods, and factors influencing street-block vitality and has gradually revealed spatial variations in the effects of the built environment. However, current research still has two shortcomings: First, most existing studies focus on the overall impact of the total volume of facilities or the morphology of the road network on street-block vitality, and further investigation is needed into the differences in the effects of influencing factors across different spatial locations within the same city. Second, existing research primarily relies on objective spatial data, with limited capture of residents’ micro-spatial experiences. Furthermore, it often employs a uniform spatial scale of influence, making it difficult to identify differences in the influence ranges of various variables; consequently, it is challenging to meticulously characterize the spatial non-stationarity of the relationship between built environment factors and street-block vitality.
To address the aforementioned shortcomings, this study uses urban blocks as the unit of analysis and, based on human–environment relationship theory, constructs an analytical framework titled “Built Environment Condition–Street-Block Vitality Response.” Drawing on the “5D” framework for the built environment, the study selects explanatory variables from five dimensions: density, diversity, design, destination accessibility, and distance to transit. Objective indicators are primarily quantified using data such as Points of Interest (POIs), road networks, and public transportation, while subjective indicators are derived from bottom-up Urban Physical Examination (UPE) survey. This approach combines objective characteristics of the built environment with residents’ subjective perceptions of it, thereby characterizing the factors associated with street-block vitality from both physical space and perceptual experience perspectives. Building on this, a multiscale geographically weighted regression model was employed to identify the scale of influence of different factors, the strength of local associations, and their spatial variations, thereby revealing the positive and negative associations between built environment factors and street-block vitality under different spatial contexts. The study aims to provide evidence-based decision-making guidance for street-block renewal and planning optimization, as well as theoretical support and practical foundations for understanding the spatial differentiation of street-block vitality, promoting coordinated land-use and transportation planning, and implementing United Nations Sustainable Development Goal 11 (SDG 11).
Based on the above literature review, this study makes three contributions. First, it combines objective characteristics of the built environment with residents’ subjective perceptions of it to characterize the factors associated with street-block vitality from both physical-space and perceptual-experience perspectives. Second, it employs MGWR to identify spatial non-stationarity in the relationships between factors such as density, road networks, and public transportation accessibility and street-block vitality, thereby characterizing local variations within spatial contexts such as transportation infrastructure, historical fabric, and functional homogeneity. Third, this study translates the spatial differentiation characteristics of street-block vitality and the findings on local associations into differentiated renewal recommendations, providing a basis for coordinated land-use and transportation planning in the context of sustainable urban development.
2. Theoretical Framework and Indicator System
2.1. Theoretical Framework
Existing studies indicate that the built environment is a key factor closely related to street-block vitality, with its direction and intensity of influence highly dependent on the street block’s spatial location and the configuration of built environment elements. To deepen the theoretical understanding of this complex relationship, this study introduces human–environment relationship theory as its analytical foundation.
The human–environment relationship summarizes the relationship between human activities and the geographical environment. Yang Qingshan and Mei Lin point out two interpretive approaches to the human–environment relationship. The classical interpretation equates the geographical environment with the natural environment and focuses on the relationship between human society and the natural environment, whereas the non-classical interpretation views the geographical environment as a holistic entity interwoven with natural and cultural elements, focusing on the interaction between human activities and the geographical environment in a broader sense [46]. Wu Chuanjun further proposed the concept of the territorial system of human–environment interaction, emphasizing that research on human–environment relationships must be grounded in a specific territory and investigate the connections and interactions between people and the environment within a particular geographical space [47]. Within the theoretical lineage of the non-classical interpretation, Barrows argued that the central concern should be to reveal the process through which humans adapt to their environment [48]. Roxby further elaborated this idea through adaptation theory, maintaining that human activities represent active adjustments to geographical environmental conditions [49]. The core tenet of these ideas is that the geographical environment is a key condition for human activity; humans form specific activity patterns through continuous adaptation to the environment, and spatial variations in environmental conditions may be important factors in explaining the spatial differentiation of human activity.
This study adopts the non-classical interpretation and incorporates the urban built environment into the analytical scope of the geographical environment, with the aforementioned concepts of adaptation and constraint serving as its theoretical core. By applying this principle to the study of street-block vitality, the built environment can be viewed as a key spatial condition influencing the organization of residents’ activities, while street-block vitality represents the spatial behavioral response of residents as they adapt to these conditions. In natural geographical environments, factors such as topography, climate, and hydrology are closely related to human settlement and mobility patterns; at the urban street-block scale, these constraints are manifested in the five dimensions of the built environment proposed by Ewing and Cervero: density, diversity, design, destination accessibility, and distance to transit, which jointly influence residents’ activities [31].
Among these, density determines the degree of spatial concentration of facilities and activities, influencing the range of accessible places and choices available to residents; diversity reflects the degree of functional mix, affecting residents’ ability to carry out a variety of activities through their trips; design influences the continuity of interfaces and the quality of the pedestrian experience, providing appropriate spatial conditions for residents to linger and pass through; destination accessibility measures the ease with which residents can reach service facilities, affecting the scope of their activity space; and distance to transit characterizes road network connectivity, public transit supply, and proximity to stops and is related to the spatiotemporal costs of resident concentration and mobility.
Within this framework, street-block vitality represents a spatial response to the constraints of the built environment. Residents form different levels of agglomeration and activity patterns based on the spatial conditions of their street block’s built environment; the spatial accumulation of these behavioral differences manifests as spatial differentiation in street-block vitality. The relationship between the two exhibits systematic variations in response to spatial differences in environmental conditions. The direction and intensity of the association between a given built environment factor and street-block vitality may vary depending on the street block’s location and spatial conditions; this spatial heterogeneity provides a crucial basis for understanding the spatial differentiation of street-block vitality.
Based on the above theoretical understanding, this study constructs an analytical framework linking built environment condition to street-block vitality response (Figure 1). This framework views the built environment as a key spatial condition for the unfolding of resident activities and street-block vitality as the spatial manifestation of resident activities shaped by specific built-environment conditions. This study focuses on the potential direction and strength of associations, as well as their spatial variations, between various dimensions of the built environment and street-block vitality. At the operational level, five dimensions—density, diversity, design, destination accessibility, and distance to transit—are quantified as explanatory variables, while street-block vitality is quantified as the dependent variable. By examining the spatial associations between different dimensions of the built environment and street-block vitality, this study constructs a theoretical analytical pathway to explain the spatial heterogeneity of street-block vitality.
Figure 1.
An analytical framework of built environment condition–street-block vitality response from a human–environment relationship perspective.
2.2. Indicator System
This study takes the concepts of adaptation and constraint in human–environment relationship theory as its theoretical foundation. According to this perspective, the geographical environment imposes constraints on human activities, while people develop specific activity patterns by adapting to their environment. When this principle is applied to the study of street-block vitality, the built environment constitutes the spatial constraints of street blocks, whereas street-block vitality represents the spatial behavioral response of residents adapting to these constraints. Based on this theoretical proposition, this study establishes a measurement system comprising two first-level indicators: street-block vitality response and built environment condition. These correspond, respectively, to the response outcomes of human activities and the constraints imposed by the geographical environment in human–environment relationship theory.
- (1)
- Street-Block Vitality Response Indicator
The first-level indicator, “street-block vitality response,” uses “population aggregation and flow” as its second-level indicator and selects the “average heat index” () as its third-level measurement indicator. Based on Jacobs’ view that urban vitality stems from the continuous interaction between human activity and urban space, this paper defines street-block vitality as the intensity of aggregation and flow formed by people’s daily activities within the street-block space over a specific observation period, which is used to characterize the level of activity among the street block’s population [2,38,50].
The average heat index is calculated based on population location data from Baidu Huiyan. These data are derived from aggregated spatiotemporal records captured by location-tracking devices; each data point includes latitude, longitude, a timestamp, and a heat index value. The heat index value is an attribute representing the intensity of human activity, derived by Baidu Huiyan from aggregated location service records, and reflects the relative intensity of human activity at a specific point in time and space [51,52]. This paper performs kernel density estimation (KDE) on population location points at each observation time point and calculates the average of the block-level kernel density estimates for each time point between 6:00 a.m. and 10:00 p.m. on each day within the observation week to obtain the average heat value. A higher value indicates a higher level of human activity concentration in the corresponding block during the observation period. Mobile location data, Baidu population location data, and the kernel density estimation method are used to characterize the intensity of human activity and spatial vitality at the street block, street, and historic urban district levels [38,51,52,53].
- (2)
- Built Environment Condition Indicators
For the first-level indicator of built environment condition, this study follows the built environment dimensional framework proposed by Ewing and Cervero and decomposes the built environment into five dimensions: density, diversity, design, destination accessibility, and distance to transit [31]. The objective data supporting this indicator system include point-of-interest (POI) data, road-network data, and street-block vector data. The POI data were obtained through the Place Search application programming interface (API) of the Baidu Maps Open Platform and comprised 14 primary categories. Drawing on previous studies [54,55], the Guidelines for the Classification of Land and Marine Use for Land and Space Survey, Planning, and Use Control issued in November 2023, and the actual conditions of street blocks in large cities, the original POIs were reclassified.
For the density dimension, the third-level indicators comprise density of public service facilities (Den_pub), density of residential facilities (Den_res), density of commercial facilities (Den_com), density of leisure facilities (Den_lei), and density of scenic facilities (Den_sce). These indicators are calculated using spatial statistics of POIs and reflect the quantity and concentration of built environment elements within each street block [56]. The diversity dimension uses land-use mix, measured using the Shannon–Wiener diversity index (SWDI), to characterize the mixture of different functions within each street block [57].
The distance to transit dimension is used to measure the spatial connectivity between the block and the public transportation system, which is composed of road connectivity infrastructure, the supply of transportation facilities, and proximity to public transit stops. In the traditional 5D framework, road network density is primarily classified under the design dimension from the perspective of street form [31], but at the block scale, the road network serves as the spatial medium through which residents reach public transit stops and move within and outside the block; its density reflects the coverage of accessible roads and the conditions for the movement of people.
Therefore, this study incorporates road network density (Den_road), density of transport facilities (Den_trans), and distance to the nearest public transit stop (Dist_transit) into the distance to transit dimension, representing road connectivity infrastructure, transportation service provision, and proximity to public transit stops, respectively [35,41]. Specifically, road network density is calculated as the ratio of the total length of roads within a block to the block’s area; density of transport facilities is derived from spatial statistics based on the locations of transportation facilities in POI data; and the distance to the nearest public transit stop is determined by calculating the Euclidean distance from the center of the block unit to all surrounding public transportation POIs and selecting the minimum value.
The design and destination accessibility dimensions concern residents’ subjective experiences of spatial quality. Integrating objective built environment characteristics with subjective perceptions has been shown to significantly improve the accuracy with which vitality is explained [58]. Although objective indicators can describe the presence and distribution of facilities, they have limited ability to capture how spaces are perceived and used [59,60]. As street blocks are important places for population movement, temporary stays, and everyday activities, the quality of their walking environment directly affects their ability to attract people [61]. Therefore, the design dimension uses residents’ satisfaction with greenway design (Green_sat) and satisfaction with traditional cityscape design (Style_sat) as third-level indicators. Greenways support pedestrian accessibility and the quality of everyday leisure activities, while traditional cityscape design embodies residents’ cultural attachment to and place identity with street-block space. Together, these factors shape the spatial conditions under which residents stay in and move through street blocks. For the destination accessibility dimension, residents’ satisfaction with public transit stop placement (Convenience_sat) is selected as the third-level indicator. The convenience and rationality of transit stop placement directly influence residents’ willingness to use public transit and their travel experience. Public transit stops also function as critical nodes connecting the internal pedestrian network of a street block with the wider urban transportation system.
In summary, the indicator system integrates objective data with subjective perception data and establishes a comprehensive explanatory framework encompassing built environment condition and street-block vitality response. All indicators were calculated using ArcGIS Pro 3.6, and their calculation methods are presented in Table 1.
Table 1.
Indicator system development.
3. Materials and Methods
3.1. Study Area
This paper uses Baoding City in Hebei Province as an empirical case study. Baoding is located in the west-central part of Hebei Province, at the eastern foot of the Taihang Mountains and in the western part of the Central Hebei Plain. Its geographic coordinates range from 38°10′ to 40°00′ north latitude and 113°40′ to 116°20′ east longitude, as shown in Figure 2. According to data from the Seventh National Population Census, Baoding’s permanent urban population has exceeded 1 million. As a hub city in the Beijing-Tianjin-Hebei urban agglomeration, connecting the capital with Hebei Province, Baoding is currently undergoing a transition from scale expansion to the renewal of existing stock and the enhancement of quality.
Figure 2.
Study area. Note: Base map data were obtained from the National Platform for Common Geospatial Information Services, Tianditu (https://www.tianditu.gov.cn/; map approval number: GS(2024)0650). (a) Elevation and spatial distribution of street blocks in Baoding; (b) territorial spatial functional zones, road network, river system, and street-block boundaries in Baoding.
In accordance with the national territorial spatial planning system established by the “Several Opinions of the Central Committee of the Communist Party of China and the State Council on Establishing a Territorial Spatial Planning System and Supervising Its Implementation,” and in reference to the planning zoning requirements outlined in the “Guidelines for the Preparation of Municipal-Level Territorial Spatial Master Plans (Trial)” and the “Baoding City Territorial Spatial Master Plan (2021–2035),” the study area has been divided into five categories of territorial spatial functional zones—ecological protection zones, ecological control zones, urban development zones, farmland protection zones, and rural development zones. These five functional zones are interlaced within the study area and exhibit distinct characteristics in spatial control, development intensity, facility allocation, and activity capacity, providing suitable case studies for identifying local variations in street-block vitality and their association with the built environment across different functional spaces.
The aforementioned urban development stages and functional zoning characteristics result in marked differences in built-environment conditions and the concentration of human activities across street blocks in Baoding. Therefore, conducting research using Baoding as a case study enables the identification of spatial differentiation in street-block vitality and its local associations with the built environment from a functional zoning perspective and provides empirical references for cities with similar spatial structures and functional zoning characteristics [62,63].
3.2. Data Sources and Processing
The data used in this study include Baidu Huiyan data, Point-of-Interest (POI) data, urban transportation network data, street-block vector data, and data from the Urban Physical Examination (UPE) survey conducted in Hebei Province, China.
- (1)
- Baidu Huiyan Data
Baidu Huiyan data were used to measure street-block vitality. Data collection took place over a consecutive week in Baoding City, with clear weather, moderate temperatures, and no Chinese statutory holidays. The collection period was from 8 April 2024 (Monday) to 14 April 2024 (Sunday), with data captured at one-hour intervals daily from 6:00 a.m. to 10:00 p.m. These data were stored in comma-separated values (CSV) format and included latitude and longitude coordinates, timestamps, and heat index values.
The observation periods were determined based on the rhythms of human activity. Previous studies have classified 6:00–10:00 as the morning commute period, 10:00–18:00 as the daytime work and public service period, and 18:00–22:00 as the evening consumption and leisure period; the period from 22:00 to 6:00 the following day primarily corresponds to nighttime rest activities [64,65]. Related studies on street-block vitality have utilized hourly Baidu heatmap data from 6:00 to 22:00 daily, covering a total of 17 consecutive time points [64]. Therefore, this paper selects 6:00–22:00 as the intraday observation period, covering major activity phases such as residents’ morning commutes, daytime work and public services, and evening consumption and leisure, to characterize the level of crowd aggregation during the street block’s primary daily activity periods.
The observation period was set to one consecutive week. By combining repeated observations across multiple dates and time points, this approach comprehensively characterizes the activity levels during the observation week of street blocks while reducing fluctuations caused by single time points, specific dates, or short-term events. Although long-term data are more conducive to detecting more complex changes in vitality, a one-week time span is typically used to analyze human activity and daily vitality changes under typical urban rhythm cycles [54,66,67]. Therefore, this study selected a consecutive week with relatively consistent meteorological conditions and no statutory holidays to ensure uniform observation conditions across all blocks and focused on the cross-sectional spatial relationship between the average level of street-block vitality and the built environment within a unified temporal context.
Regarding data processing, we first used ArcGIS Pro 3.6 to perform coordinate transformation and projection correction on the population location points from Baidu Huiyan. Subsequently, we conducted kernel density estimation of population locations at each observation time point, using the heat value field as a weight. Baidu Huiyan data record crowd activity heat as discrete points, whereas measuring street-block vitality requires accounting for the degree of crowd aggregation within and around areal units. Therefore, this study employs kernel density estimation for spatial smoothing to transform population location points from a discrete representation into a continuous density surface. The kernel density analysis uses a quartic kernel function [68], with a search radius set to 300 m, an output pixel size of 30 m, an area unit of square kilometers, and output pixel values representing density, calculated using planar distance. For each observation time point, the study area boundary layer was used to define a uniform processing extent, and the same projected coordinate system, weight field, search radius, and output cell size were applied to ensure consistency in the spatial extent and resolution of the hourly kernel density grids. The fourth-order kernel function assigns heat values based on the distance between a point and a grid cell; its spatial contribution gradually decreases with increasing distance and drops to 0 at a search radius of 300 m, forming a continuous surface of human activity density to characterize the concentration of human activity at a point and within its street block.
After completing the hourly kernel density estimates, the raster calculator was used to perform pixel-by-pixel averaging of the kernel density grids across all time points within the observation week, yielding the average kernel density grid for the week. Edge processing involved a unified-range calculation followed by clipping to the study area boundaries: hourly kernel density estimates and temporal averaging were performed within a unified range defined by the study area boundary layer, and the averaged kernel density grid was subsequently clipped to the study area boundaries. Furthermore, zonal statistics were used to compute the average heat index for each block by averaging valid pixels within each block. This index was then categorized into levels 1–5 using the natural breaks method, followed by spatial connectivity analysis and visualization. The average heat values characterize the average intensity of human activity aggregation within each block during the daily observation period from 6:00 to 22:00; higher values indicate a higher overall level of human activity aggregation in the corresponding block during that period.
- (2)
- POI data
Point-of-interest (POI) data were retrieved through the Place Search API of the Baidu Maps Open Platform. As shown in Table 2, a total of 311,403 POIs were extracted within the study area and initially classified into 14 major categories. These data establish a robust spatial foundation for quantifying functional mix and facility agglomeration density at the block level. Drawing upon the existing literature on urban functional zoning and vitality [54,55], and in accordance with the Guidelines for the Classification of Land and Marine Use for Land and Space Survey, Planning, and Use Control (November 2023), this study reclassifies the raw POI records into five consolidated categories tailored to the specific local context of Baoding.
Table 2.
Reclassification of Baidu Maps POI data.
- (3)
- Urban Transportation Network Data
Urban transportation network data, comprising vector road geometries and public transit points, were retrieved from the OpenStreetMap (OSM) platform in May 2024. To ensure accurate spatial connectivity at intersections, comprehensive topological corrections were applied to the raw road network in ArcGIS Pro 3.6. This process involved repairing intersecting lines and eliminating dangles and duplicate segments. Additionally, dual-carriage infrastructure, such as elevated highways and arterial roads, was converted to single-centerline configurations. Finally, the processed dataset was uniformly projected to Universal Transverse Mercator (UTM) Zone 50N using the World Geodetic System 1984 (WGS 1984) datum and clipped to the administrative boundaries of the study area, establishing a robust foundational road network for subsequent density calculations.
- (4)
- Block Vector Data
The block vector data were sourced from the Multi-level Street-block Divisions of 985 Cities Worldwide (MSDCW) dataset, which is derived from OpenStreetMap and structured into five hierarchical levels, from Level 1 to Level 5 (L1–L5) [69,70].
This dataset is constructed from the OpenStreetMap road network, covering 985 cities across 142 countries and regions worldwide, and it divides urban space into five levels (L1–L5) according to the road hierarchy. Level L1 is primarily bounded by highways, urban expressways, and their connecting roads. Existing research generally treats the enclosed areas formed by the road network as the basic spatial units of city blocks. This is because the road network framework determines the physical boundaries and functional organization of urban blocks, and the enclosed areas effectively reflect the built environment and spaces for socioeconomic activities at the block scale [71,72]. The scope of this study covers the Baoding study area, focusing on the spatial differentiation of street-block vitality and the role of the built environment at the citywide scale. Compared to the further subdivided L2–L5 units, L1 blocks are bounded primarily by high-grade roads, enabling them to maintain relatively intact urban functional zones, reduce excessive spatial fragmentation caused by low-grade roads, and align with the spatial scales of Baidu Huiyan population activity data, the Urban Physical Examination (UPE) survey data, and built environment indicators. Therefore, this study selects L1 blocks as the basic spatial analysis unit.
The original MSDCW L1 data retain the strip-like intervals formed by road spaces. To construct topologically continuous block units suitable for spatial statistics, this study processed the L1 data within the study area using ArcGIS Pro 3.6. First, the centerlines of the road spaces between L1 street blocks were extracted, converting the double-line road boundaries into a single-line road network; subsequently, topological issues such as dangling, broken, and unclosed road centerlines were inspected and repaired, and closed block polygons were regenerated based on the repaired road network; finally, the data were clipped to the study area boundaries, invalid fragment polygons resulting from boundary clipping and topological processing were removed, and each block was assigned a unique identifier. Following these steps, 77 non-overlapping L1 street blocks were ultimately formed.
- (5)
- River Network Data
River network data were sourced from OpenStreetMap (OSM) and collected in June 2024. Major rivers and tributary systems with continuous spatial structures were retained, while features such as ditches and drainage channels—which had weak associations with the city’s primary water systems—were removed. Subsequently, the river data underwent duplicate-segment removal, geometric repair, broken-segment checks, and topological-consistency checks. The river dataset was then clipped according to the study area boundaries and uniformly converted to the WGS 1984/UTM Zone 50N coordinate system. The processed river network data were overlaid on the key spatial distribution maps as a spatial reference layer.
- (6)
- Functional Zoning Data
The functional zoning boundary data were derived from the outcomes of the Hebei Provincial Major Science and Technology Support Program and were classified and verified based on the municipal territorial spatial planning zones outlined in the Baoding City Territorial Spatial Master Plan (2021–2035). After acquiring the data, spatial registration and coordinate system verification were first performed, and the data were uniformly converted to the WGS 1984/UTM Zone 50N coordinate system. Subsequently, attribute coding was performed based on the types of planning zones, and the data were cropped according to Baoding’s administrative boundaries. The functional zoning boundaries were primarily divided into five categories: ecological protection zones, ecological control zones, urban development zones, farmland protection zones, and rural development zones. The processed data were used to overlay functional zones on spatial distribution maps and to interpret the results.
- (7)
- Subjective Data
The subjective data were derived from the Hebei Province Urban Physical Examination (UPE) survey. This survey was conducted by the Hebei Academy of Building Research Co Ltd. through the Hebei Province Unified Urban Physical Examination (UPE) survey Platform, with data collected in June 2024. The survey used communities as the basic sampling units, with community organizations facilitating resident participation via online channels. In this paper, based on the spatial location information of the valid survey data, the data were matched to corresponding L1 blocks and aggregated at the block scale to form subjective perception indicators, thereby establishing a correspondence between the survey data and subsequent spatial analysis units.
The survey questionnaire comprised two parts: demographic and socioeconomic characteristics and subjective evaluations of the urban environment. Demographic and socioeconomic characteristics included respondents’ gender, age, and educational attainment; subjective evaluations covered residents’ perceptions of the built environment, public services, transportation, and environmental quality. Each evaluation item was measured using a five-point Likert scale, where 1–5 represent, in order, “very dissatisfied,” “dissatisfied,” “neutral,” “satisfied,” and “very satisfied.” A higher score on an item indicates greater satisfaction among respondents with the corresponding urban environmental factor.
A total of 30,428 questionnaires were collected. Data processing was conducted in accordance with the quality control rules established for the UPE Survey. Records were sequentially excluded based on the following criteria: missing responses to key items, incomplete submissions, abnormal response times, selection of the same option for all evaluation items, and missing or abnormal spatial coordinates. Ultimately, 29,719 valid questionnaires were obtained. Among the valid samples, 49.02% were male and 50.98% were female. The demographic composition of the sample is shown in Table 3. This information is used to present the sample’s demographic structure and its coverage of different resident groups.
Table 3.
Demographic characteristics of respondents (N = 29,719).
During questionnaire completion, the mobile response system automatically recorded Global Positioning System (GPS) coordinates to determine the spatial location of each response. The data provider did not collect direct personal identifiers, such as respondents’ names, contact numbers, or device identifiers; this paper uses only anonymized evaluation data and spatial coordinates. The coordinates of the survey locations form the original spatial basis for the subjective data, and L1 blocks constitute the basic units for determining the spatial affiliation of the sample and for the statistical analysis of subjective indicators. This study used ArcGIS Pro 3.6 to perform coordinate transformations and projection corrections on the questionnaire location coordinates, standardizing them to the WGS 1984/UTM Zone 50N coordinate system. While preserving individual evaluation information, point-to-area spatial linking was employed to match each questionnaire to the L1 block in which its location coordinates fell, thereby achieving an accurate spatial association between individual survey data and the block analysis unit.
Prior to spatial matching, the coordinates of the survey locations were checked for validity, primarily focusing on the completeness of coordinate fields, the range of latitude and longitude values, the presence of anomalous or duplicate records, and consistency with the study area boundaries. Upon verification, all 29,719 valid questionnaires were successfully matched to 77 L1 blocks within the study area, resulting in a spatial matching rate of 100%. All L1 blocks were covered by valid questionnaires, with the number of valid questionnaires per block ranging from 54 to 1362, averaging 385.96, and with a median of 301. See Table A1 for specific sample sizes.
After completing data verification, coordinate correction, and spatial matching, this paper aggregates resident evaluations at the L1 block level, calculates the arithmetic mean of each evaluation item within each block, and establishes subjective evaluation indicators at the block scale. This process, based on the direct spatial correspondence between questionnaire locations and L1 blocks, converts individual resident evaluations into subjective evaluation data at the L1 street-block scale, providing a unified spatial foundation for subsequent analyses of the built environment at the block scale.
Therefore, L1 block vector data were selected as the unified spatial analysis unit. ArcGIS Pro 3.6 was used to perform projection transformations, georeferencing, and spatial aggregation of various data types, thereby establishing block-scale dependent and independent variables. To eliminate differences in units and value ranges among the variables, the dependent and independent variables were standardized using the Z-score method prior to modeling, with the calculation formula as follows:
where denotes the standardized value of variable for the th L1 street block, denotes the corresponding raw value, and and denote the mean and standard deviation, respectively, of variable across the 77 L1 street blocks. After standardization, each variable has a mean of 0 and a standard deviation of 1. All subsequent model tests and parameter estimates are based on the standardized data. The specific data sources are presented in Table 4.
Table 4.
Data sources.
3.3. Spatial Autocorrelation
To characterize the spatial associations of street-block vitality at the global and local scales, this study employed global and local spatial autocorrelation analyses [73].
3.3.1. Global Spatial Autocorrelation
Spatial autocorrelation analysis is divided into global and local autocorrelation. Global autocorrelation, measured by Moran’s I, is used to analyze the spatial correlation characteristics of street-block vitality at the global scale and to determine whether street-block vitality is spatially correlated with street-block layout. In this study, 77 L1 blocks were used as the basic spatial units, with the average heat value of each block serving as the test variable. Calculations were performed using the Global Moran’s I tool in ArcGIS Pro 3.6.
Spatial relationships were modeled using first-order Rook adjacency to construct an initial binary spatial weight matrix. When two L1 street blocks share a common boundary, ; when two street blocks share only a vertex or have no boundary contact, . In addition, . The spatial weight matrix was row-normalized so that the sum of the weights of all adjacent street blocks for each street block was equal to 1. The formula for calculating global Moran’s I is as follows:
where is the number of spatial units; and are the average heat values of street blocks and , respectively; is the mean of the average heat values across all street blocks; and s an element of the spatial weights matrix. The statistical significance of Global Moran’s I was assessed using the standardized z-score and p-value generated by ArcGIS Pro 3.6, with the significance level set at 0.05. Moran’s I ranges from −1 to 1. A statistically significant I > 0 indicates that street blocks with similar vitality levels tend to cluster spatially, whereas a statistically significant I < 0 indicates that street blocks with dissimilar vitality levels tend to be spatially adjacent. A nonsignificant result indicates that the observed overall spatial pattern does not differ significantly from a random spatial distribution.
3.3.2. Local Spatial Autocorrelation
Building on the global autocorrelation analysis, we further employed Local Indicators of Spatial Association (LISAs), specifically local Moran’s I, to identify local clusters and spatial outliers in street-block vitality. The analysis covered 77 blocks, with the average heat value of each block serving as the test variable. The local analysis adopted the first-order Rook adjacency matrix and row-standardization method used in the global spatial autocorrelation analysis to ensure consistency in spatial units, street-block structures, and weight settings between the global and local spatial association analyses. The calculation formula is
where denotes the Local Moran’s I statistic for street-block i; n is the total number of spatial units; and are the average heat values of street blocks i and j, respectively; is the average heat value across all street blocks; is the population variance of the observed vitality values; and is an element of the spatial weights matrix representing the spatial adjacency between street blocks i and j.
The statistical significance of the local statistics was assessed using 499 random permutations. To account for the multiple local tests simultaneously conducted across the 77 street blocks, the false discovery rate (FDR) correction was applied. An FDR-adjusted p < 0.05 was used as the criterion for identifying significant local spatial associations.
Following the significance test, local spatial association types were determined only for street blocks that remained significant after the FDR correction; street blocks that did not reach the significance threshold were classified as nonsignificant. Specifically, significant street blocks were classified into four types according to the signs of their mean-centered observed values, , and spatial lag terms, . A street-block was classified as a high–high (HH) cluster when and , indicating that a high-vitality street-block was surrounded by other high-vitality street blocks. A low–low (LL) cluster was identified when and , indicating a contiguous concentration of low-vitality street blocks. A high–low (HL) spatial outlier was identified when and indicating that a high-vitality street-block was surrounded by low-vitality street blocks. A low–high (LH) spatial outlier was identified when and indicating that a low-vitality street-block was surrounded by high-vitality street blocks.
3.4. Kernel Density Estimation (KDE)
To characterize the spatial clustering of human activity associated with street-block vitality, this study employs a point kernel density estimation method to convert discrete population location points at each observation time into a continuous surface of human activity density [68]. The kernel density estimation uses the heat value of each point as a weight and calculates local density based on the planar distance between the point and the center of the output raster pixel, thereby characterizing the relative intensity of human activity clustering at the corresponding location and within its neighborhood. This study uses the Kernel Density tool in ArcGIS Pro 3.6 to perform kernel density estimation. The kernel density estimate at location s is expressed as follows:
where is the kernel density estimate at location s, namely, the output raster cell value; n is the total number of point features; is the heat-value weight of the ith point; is the Euclidean distance from the ith point to location s; h is the search radius; and is an indicator function that equals 1 when and 0 otherwise.
The kernel density analysis employed a two-dimensional quartic kernel function, under which the contribution of each point to the surrounding space gradually decreases with distance and becomes zero beyond the search radius. Point-level heat values were used as the weighting field. The search radius was set to 300 m, the output cell size to 30 m, the output type to density, and the area unit to square kilometers. Distances were calculated using the planar method. The same projected coordinate system, processing extent, snap raster, and raster parameters were applied to all observation times. No barrier features were specified, and the temporally averaged raster was clipped to the study-area boundary. The 300 m search radius served as a uniform neighborhood smoothing scale to ensure the spatial comparability of vitality measurements across observation times.
To assess bandwidth sensitivity, the average heat value for each street block was recalculated using search radii of 200 m, 300 m, and 400 m while all other parameters were held constant. Using the 300 m results as the baseline, the root mean square error (RMSE) was calculated to compare numerical differences, and Spearman’s rank correlation coefficient was used to examine the consistency of spatial rankings. After hourly kernel density estimation, the rasters for all observation times between 06:00 and 22:00 on each day of the observation week were averaged on a cell-by-cell basis. Zonal statistics were then used to extract the average heat value for each L1 street block, representing the average intensity of population activity concentration during the observation period.
3.5. Getis–Ord Hot Spot Analysis
Based on the analyses of global and local spatial autocorrelation, this study employs the coefficient proposed by Getis and Ord to conduct hot spot analysis and identify areas with high and low concentrations of street-block vitality [74]. Global Moran’s I was used to assess overall spatial autocorrelation. LISA was used to identify local spatial association types, including HH and LL clusters and HL and LH spatial outliers. The Getis–Ord Gi* statistic was used to identify significant clusters of high or low street-block vitality values.
This study uses 77 L1 street blocks as the units of analysis, with the average heat value of each street block as the input variable. The spatial weight matrix follows the settings used in the global Moran’s I and LISA analyses, employing a first-order Rook adjacency matrix to construct adjacency relationships. If two L1 street blocks share a boundary, ; if two street blocks share only a vertex or have no boundary contact, . The spatial weight matrix is row-normalized to minimize the impact of differences in the number of adjacent blocks across different street blocks on the statistical results.
The formula for calculating the standardized statistic of the Getis–Ord coefficient is
where is the average heat value of street-block j; is an element of the spatial weights matrix that represents the spatial proximity between street blocks i and j; n is the total number of street-block units; is the mean of the average heat values across all street blocks; is the standardized hot spot statistic; and S is the standard deviation of the average heat values.
Statistical significance was determined using the standardized values and their corresponding p-values generated by ArcGIS Pro 3.6. A significantly positive indicates that street-block i and its neighboring street blocks exhibit generally high activity-intensity values, forming a hot spot. A significantly negative indicates that street-block i and its neighboring street blocks exhibit generally low activity-intensity values, forming a cold spot. Because local statistical tests were conducted simultaneously for 77 street blocks, the false discovery rate (FDR) correction was applied to control false discoveries arising from multiple local tests. Based on the FDR-adjusted significance levels, hot and cold spots were classified at the 90%, 95%, and 99% confidence levels, while street blocks that did not reach statistical significance were classified as nonsignificant areas.
3.6. Multiscale Geographically Weighted Regression
Regression models can be broadly classified into global and local regression models. Global regression models, such as multiple linear regression, characterize relationships between variables only in an average sense and therefore overlook spatial location and spatial heterogeneity. To address this limitation, Brunsdon et al. incorporated spatial location into the regression framework and proposed geographically weighted regression (GWR). Based on the assumptions of spatial nonstationarity and locational interdependence, GWR estimates local regression coefficients using distance-based weights between street blocks, thereby revealing spatial heterogeneity [75]. However, GWR assumes that all explanatory variables operate at the same spatial scale, represented by a common bandwidth, which may produce nonrobust estimates.
Multiscale geographically weighted regression (MGWR) allows each explanatory variable to have an independent bandwidth, thereby more accurately representing the spatial scale at which each factor operates [76]. This study employed MGWR and compared its results with those of GWR to select the better-performing model and investigate differences in the spatial scales of the factors associated with street-block vitality. Street-block vitality was specified as the dependent variable, while the 5D indicators of density, design, diversity, distance to transit, and destination accessibility were specified as explanatory variables. The GWR and MGWR models were constructed in ArcGIS Pro 3.6. The explanatory variables ultimately included in the models were determined based on the results of the collinearity diagnostics and principal component analysis (PCA).
The geometric centroids of the 77 L1 street blocks were used as the regression locations. All spatial data were projected to the WGS 1984/UTM Zone 50N coordinate system, and planar distances were used to calculate the spatial distances between street blocks. Before model estimation, all variables were standardized using Z-scores.
The GWR and MGWR models are specified as follows:
where is the street-block vitality value of the th L1 street block; denotes its spatial coordinates; is the value of the th explanatory variable or principal component score for that street block; is the number of explanatory variables; and is the random error term. In the GWR model, is the common bandwidth used to estimate the local intercept and coefficients . In the MGWR model, is the bandwidth for the intercept , while is the variable-specific bandwidth for the local coefficient . These variable-specific bandwidths characterize differences in the spatial scales of the associations between built-environment factors and street-block vitality.
Both GWR and MGWR employed an adaptive neighborhood, with the bandwidth expressed as the number of neighboring street blocks. A bisquare kernel function was used to calculate local spatial weights. The weights decreased as the distance between the target street-block and neighboring street blocks increased, and street blocks outside the bandwidth were assigned a weight of zero. GWR estimated a common bandwidth for all explanatory variables, whereas MGWR estimated an independent bandwidth for each explanatory variable. The neighborhood size was determined using the Golden Search method, with minimization of the corrected Akaike information criterion (AICc) as the optimization objective. The search range was set to 30–77 neighbors. The “Reliable Predictions” option was enabled during model estimation. The final bandwidth corresponded to the neighborhood size that produced the minimum AICc value during the search process.
4. Empirical Results
4.1. Spatial Distribution Patterns of Street-Block Vitality
4.1.1. Overall Spatial Pattern of Street-Block Vitality
The kernel density analysis shows that street-block vitality in Baoding exhibits a spatial pattern characterized predominantly by low values in the western and northwestern areas and a concentration of high values in the central and eastern areas. A large and relatively continuous high-value area occurs in the urban development zone in the central-eastern part of the study area. The highest value in the city is concentrated at its core, while medium- and low-value street blocks are distributed around its periphery. Several medium-to-high-value nodes occur to the north, east, and south of this high-value area, some of which form linear patterns along major roads. A relatively concentrated high-value area is located in the northeastern urban development zone; several adjacent medium-to-high-value areas occur in the eastern urban development zone; and multiple smaller high-value nodes are distributed across the southeastern and southern urban development zones. Several localized high-value areas also occur in the central-western and southwestern urban development zones.
The farmland protection and rural development zones are dominated by extensive low-value areas, with scattered or small patches of medium-to-high values occurring near urban development zones and major roads. The ecological protection and ecological control zones in the west and northwest exhibit contiguous low-value areas, while localized high values occur within the western urban development zone, rural development zone, and areas where major roads intersect. The ecological protection and ecological control zones in the north are likewise dominated by low values, whereas several localized medium-to-high-value areas occur in the urban development zone to their east. Low-value street blocks are distributed between the continuous high-value area in the central-eastern part of the study area and the localized high-value areas in the northeast, east, southeast, and south. Overall, street-block vitality in Baoding exhibits a spatial pattern characterized by a concentration of high values in the central-eastern area, localized concentrations around peripheral urban nodes, and contiguous low-value areas in the west and northwest (Figure 3).
Figure 3.
Spatial distribution of street-block vitality and territorial spatial functional zones in Baoding. Note: Base map data were obtained from the National Platform for Common Geospatial Information Services, Tianditu (https://www.tianditu.gov.cn/; map approval number: GS(2024)0650). (a) Spatial distribution of street-block vitality; (b) territorial spatial functional zones, road network, and river system.
4.1.2. Global and Local Spatial Associations of Street-Block Vitality
The global Moran’s I test showed that the Moran’s I value for street-block vitality, the dependent variable, was 0.242941, with a standardized z-score of 3.403525 and a p-value of 0.000665, indicating statistical significance at the 1% level. This result demonstrates significant positive spatial autocorrelation in street-block vitality across the study area; that is, L1 street blocks with similar vitality levels tend to be spatially concentrated (Figure 4).
Figure 4.
Results of global spatial autocorrelation analysis.
Global Moran’s I characterizes the overall spatial autocorrelation of street-block vitality, while LISA further identifies four types of local spatial association: high–high (HH), low–low (LL), high–low (HL), and low–high (LH) (Figure 5).
Figure 5.
Local spatial association patterns of street-block vitality and territorial spatial functional zones in Baoding. Note: Base map data were obtained from the National Platform for Common Geospatial Information Services, Tianditu (https://www.tianditu.gov.cn/; map approval number: GS(2024)0650). (a) LISA cluster map of street-block vitality; (b) territorial spatial functional zones, road network, and river system.
HH clusters are mainly distributed in the central-eastern, northeastern, and southwestern areas. The central-eastern HH cluster is relatively extensive and spatially continuous. It is located primarily within the urban development zone, with some portions extending into the surrounding farmland protection and rural development zones. The northeastern HH cluster covers parts of the urban development, farmland protection, and rural development zones. The southwestern HH cluster is smaller and occurs within the urban development zone and the adjacent farmland protection and rural development zones. LL clusters are concentrated in the western, northwestern, and northern areas, primarily within the ecological protection and ecological control zones, with some portions extending into the adjacent rural development and farmland protection zones.
LH outliers occur mainly as scattered points within and along the edges of the HH clusters in the central-eastern, northeastern, and southwestern areas, involving the urban development, farmland protection, and rural development zones. HL outliers are less numerous and are scattered within and along the edges of the LL clusters in the western, northwestern, and northern areas. They are located primarily within the ecological protection, ecological control, and rural development zones. Areas that did not reach statistical significance in the LISA analysis are widely distributed across the central, eastern, and southwestern areas, covering the urban development, farmland protection, and rural development zones. Overall, the study area exhibits a local spatial association pattern characterized by contiguous LL clusters in the west, northwest, and north; patch-like HH clusters in the central-eastern, northeastern, and southwestern areas; and scattered HL and LH outliers.
4.1.3. Hot and Cold Spot Clustering Patterns of Street-Block Vitality
Hot Spot Analysis identifies statistically significant clusters of high street-block vitality values (hot spots) and low values (cold spots). Its principal value lies in transforming the visually interpreted distribution of high and low values into statistically significant spatial cluster identification. The analysis identified hot and cold spot clusters at the 90%, 95%, and 99% confidence levels within the study area (Figure 6).
Figure 6.
Hot and cold spot patterns of street-block vitality and territorial spatial functional zones in Baoding. Note: Base map data were obtained from the National Platform for Common Geospatial Information Services, Tianditu (https://www.tianditu.gov.cn/; map approval number: GS(2024)0650). (a) Getis–Ord Gi* hot and cold spot map of street-block vitality; (b) territorial spatial functional zones, road network, and river system.
Hot spots are mainly distributed in the central-eastern, northeastern, eastern, and southwestern areas. The central-eastern area contains a large and continuous hot spot cluster dominated by hot spots at the 99% confidence level. This cluster covers the urban development zone and parts of the surrounding farmland protection and rural development zones. The northeastern hot spots form contiguous patches involving the urban development, farmland protection, and rural development zones. The eastern hot spots are connected to the central-eastern cluster and are located primarily within the urban development and farmland protection zones. A hot spot cluster also occurs in the southwest, covering parts of the urban development, rural development, and farmland protection zones. Hot spots at the 95% and 90% confidence levels are distributed mainly around those identified at the 99% confidence level.
Cold spots are concentrated primarily in the western, northwestern, and northern areas, where they form extensive and continuous distributions. Cold spots at the 99% confidence level are concentrated in the northwest and west, mainly within the ecological protection and ecological control zones, with some portions extending into the rural development zone. Cold spots at the 95% confidence level are widely distributed across the western, northwestern, and northern areas. Cold spots at the 90% confidence level form small patches involving the ecological control and rural development zones and a limited portion of the farmland protection zone. Statistically nonsignificant areas are distributed mainly across the central, southwestern, southern, and southeastern areas, covering the urban development, farmland protection, and rural development zones.
Overall, the general distribution of high and low street-block vitality values is broadly consistent with the statistically identified hot and cold spots. In particular, street blocks exhibiting significant high-value clustering show a high degree of spatial correspondence with Baoding’s territorial spatial functional zones (Figure 6).
4.2. Spatial Associations Between Street-Block Vitality and the Built Environment
4.2.1. Multicollinearity Diagnostics and Principal Component Analysis
To eliminate dimensional differences, this study first performs Z-score standardization on continuous variables. On this basis, the variance inflation factor (VIF) and tolerance are used to diagnose multicollinearity of the explanatory variables [77]. VIF values greater than 5.0 and tolerance values below 0.20 were taken as indicating strong multicollinearity [78].
The initial diagnosis results show that the VIFs of Den_res, Den_pub, Den_com, Den_lei and Den_trans are 21.9191, 46.5121, 11.4283, 22.4144 and 20.3080 respectively, and the tolerances are all lower than 0.20, indicating that there is an obvious linear dependence between these variables and other explanatory variables (Table 5).
Table 5.
Results of the variable collinearity test (1).
Den_res, Den_pub, Den_com, and Den_lei are all street-block facility density indicators, which jointly represent the degree of spatial concentration of different types of facilities within a street block, and there is obvious multicollinearity between variables. Dormann et al. (2013) pointed out that for collinear variable groups with a common conceptual basis, comprehensive components can be extracted through principal component analysis to retain the main information of the variable group and reduce the dimensionality [79]. Therefore, this study conducts principal component analysis on the above four facility density indicators and integrates them into a facility-density principal component (PC_FAC). Although Den_trans also has a high VIF, its measurement content belongs to the transportation environment dimension, which is different from the conceptual attributes of the above four general facility density indicators, so it is not included in the same principal component.
The Kaiser–Meyer–Olkin measure (KMO) and Bartlett’s test of sphericity indicated that the KMO value is 0.8234, and Bartlett’s sphericity test was statistically significant (χ2 = 507.9433, degrees of freedom (df) = 6, p < 0.001), indicating that the four facility density indicators have a correlation structure suitable for principal component extraction (Table 6).
Table 6.
Results of the KMO and Bartlett’s tests.
Based on the principle that the eigenvalue is greater than 1, this study retains the first principal component (PC1). The eigenvalue of the first principal component is 3.7700, and the variance contribution rate is 94.2493%; the eigenvalues of the remaining three principal components are all less than 1. Therefore, the first principal component can reflect the main information of the four facility density indicators (Table 7).
Table 7.
Principal component eigenvalues and variance contribution rate.
As shown in Table 8, the loadings of the first principal component on Den_pub, Den_res, Den_com, and Den_lei were 0.9848, 0.9677, 0.9579 and 0.9727 respectively. These high positive loadings indicate that the component captures the concentration of the four facility types. Therefore, the first principal component was defined as the facility-density principal component (PC_FAC).
Table 8.
Loadings and score coefficients for the first principal component.
The calculation formula of the first principal component score is
To keep the principal component score consistent with the scale of other explanatory variables, this study further standardizes the PC1 scores using the Z-score method and records the standardized variable as Z_PC_FAC.
The four facility density indicators were replaced with Z_PC_FAC, and the multicollinearity diagnostics were repeated. With Den_trans retained, the VIFs of Z_PC_FAC and Z_Den_trans are 8.3930 and 8.2492 respectively, and the tolerances are 0.1191 and 0.1212 respectively, while the VIFs of the remaining explanatory variables are all lower than 5, indicating that multicollinearity in the variable set after replacement is mainly concentrated in PC_FAC and Den_trans (Table 9).
Table 9.
Results of the variable collinearity test (2).
Dormann et al. (2013) pointed out that explanatory variables with collinearity should be processed through principal component extraction or deletion of variables with repeated information based on the conceptual attributes and research purposes of the variables [79]; O’Brien (2007) further emphasized that variable processing should not only be based on VIF thresholds, but should also examine the theoretical significance of the variables and their role in model interpretation [80].
From the perspective of indicator composition, Z_PC_FAC combines information on Den_res, Den_pub, Den_com, and Den_lei. The first principal component explains 94.2493% of the variance of the original four indicators and can characterize the general facility concentration level of the street block. Den_trans is also measured by facility number density, and its statistical information has a large overlap with PC_FAC. At the same time, this study has used Den_road, Dist_transit and Convenience_sat to characterize the transportation network distribution, public transportation spatial proximity and residents’ subjective evaluation respectively.
Therefore, eliminating Den_trans can reduce repeated measurements of density indicators while retaining the objective spatial characteristics and subjective perception information of the transportation environment. Based on the above statistical tests and indicator meanings, the final model retains Z_PC_FAC and eliminates Z_Den_trans. After excluding this variable, the VIF and tolerance of each explanatory variable meet the multicollinearity test standard (Table 10).
Table 10.
Results of the variable collinearity test (3).
4.2.2. Comparison and Diagnosis of OLS, GWR and MGWR Models
First, an ordinary least squares model (OLS) is constructed, and the global Moran’s I is used to test the spatial autocorrelation characteristics of the standardized residuals [81]. The spatial weight matrix is consistent with the street-block vitality global spatial autocorrelation and LISA analysis. The first-order rook contiguity relationship is used to define street blocks sharing common boundaries as neighbors, and the spatial weights are row-normalized. The test results show that the Moran’s I of the OLS residual is 0.0810, the z-score is 2.0210, and the p-value is 0.0433. The residuals showed weak but statistically significant positive spatial autocorrelation. Blocks with similar residual values show certain clustering pattern in space (Table 11).
Table 11.
Global spatial autocorrelation test of OLS residuals.
Global Moran’s I was used to assess spatial autocorrelation in the OLS residuals, whereas a Monte Carlo spatial variation test based on a GWR model with a common bandwidth was used to assess spatial non-stationarity in the regression coefficients [75]. The null hypothesis was that each coefficient was spatially stationary across the study area. The GWR model used an adaptive bisquare kernel and an AICc-selected bandwidth of 56 neighboring street blocks. The observed spatial variation in each coefficient surface was compared with the results of 999 random permutations of spatial locations.
The GWR-based Monte Carlo test yielded p-values below 0.05 for Den_sce, Style_sat, Dist_transit, Den_road, Convenience_sat, and PC_FAC, indicating statistically significant spatial variation in their regression coefficients. The p-values for SWDI and Green_sat were 0.0941 and 0.1251, respectively; therefore, the null hypothesis of spatial stationarity was not rejected for these two variables (Table 12).
Table 12.
Monte Carlo tests of spatial variation in GWR coefficients.
On this basis, this study constructs OLS, GWR and MGWR models, respectively, and evaluates the model performance through R2, adjusted R2, AICc, residual variance and effective degrees of freedom [82]. R2 and adjusted R2 reflect the degree to which the model explains the differences in street-block vitality. AICc comprehensively measures the degree of model fitting and complexity, and the residual variance reflects the degree of dispersion between model estimates and observed values.
As shown in Table 13, the R2 values of OLS, GWR and MGWR were 0.8381, 0.9259 and 0.9645, respectively, and the adjusted R2 values were 0.8191, 0.8780 and 0.9391, respectively. The AICc values of the three models were 100.6414, 94.6470 and 76.8695, respectively, and the residual variances are 0.1809, 0.1194 and 0.0595, respectively. MGWR has the highest R2 and adjusted R2, as well as the lowest AICc and residual variance, showing a good balance between model fit and complexity. Therefore, this study uses MGWR to analyze the spatial association between built environment variables and street-block vitality.
Table 13.
Comparison of OLS, GWR and MGWR model performance.
GWR uses an adaptive bisquare kernel function and uses the Golden Search method to determine the common bandwidth that minimizes AICc in the range of 30–77 neighbors. The final optimal number of neighbors is 56. MGWR uses an adaptive bisquare kernel function to express the bandwidth by the number of neighboring street blocks and uses the Golden Search method to determine the optimal bandwidth for each variable to minimize the AICc within the range of 30–77 neighbors. Each explanatory variable is Z-score standardized before modeling, and the standardized input variables are used during MGWR operation.
After the model is completed, the Kolmogorov–Smirnov (K-S) normality test and global Moran’s I test are performed on the MGWR residuals [83], as shown in Table 14. The K-S statistic is 0.1339, the p-value is 0.1153, and the residuals were consistent with a normal distribution. The first-order rook contiguity relationship was used to construct the spatial weight matrix and perform row standardization. The Moran’s I of the MGWR residual was −0.1429, the p-value was 0.1027, and the residuals showed no statistically significant spatial autocorrelation. The above results and the model fitting index jointly show that MGWR can better characterize the spatial association between street-block vitality and built environment variables.
Table 14.
Normality and spatial autocorrelation tests of MGWR residuals.
4.2.3. Spatial Holdout Validation of MGWR
Before model estimation, 15 consecutive neighboring street blocks in the eastern part of the study area were predefined as a holdout set, and the remaining 62 street blocks were used for MGWR model fitting. The holdout set was excluded from variable screening, parameter determination, bandwidth optimization, and model adjustment. After model fitting, estimates from the training set were used to predict street-block vitality in the holdout set. Prediction performance was evaluated using mean absolute error (MAE), RMSE, and out-of-sample R2, with the training-set mean serving as the benchmark [84].
The results in Table 15 show that the MAE of the holdout set is 0.4721, the RMSE is 0.7800, and the out-of-sample R2 is 0.8910. Compared with the training set mean benchmark, the squared prediction error is reduced by 89.10%. These results indicate good predictive performance for the eastern holdout street blocks under the validation setting used in this study.
Table 15.
Spatial holdout validation results.
4.2.4. Analysis of MGWR Local Coefficients
Based on model comparison and residual diagnosis, this study uses MGWR local regression coefficients to analyze the direction, strength and spatial differences in the association between built environment variables and street-block vitality. Since each variable has been standardized by Z-score, its local regression coefficient can be used to compare the relative strength of association of different variables. This study counts the average, maximum, minimum, lower quartile, median and upper quartile of local coefficients and calculates the proportion of samples with significant local coefficients [85,86]. The results are shown in Table 16.
Table 16.
MGWR variable-specific bandwidths and local significance.
MGWR estimates local regression coefficients in 77 street blocks respectively based on the optimal bandwidth and adaptive bisquare kernel weight of each variable [82]. The model forms the local hat matrix of each variable through the backfitting procedure and calculates the covariance and standard error of the local coefficients accordingly. The standard error of the local coefficient is obtained by the square root of the diagonal element of the corresponding coefficient covariance matrix, which is used to measure the estimation accuracy of the local coefficient of each street block [87]. The ratio of the local coefficient to its standard error constitutes the pseudo-t statistic. The corresponding two-sided pseudo-p-value is determined by the two-sided cumulative probability of the t distribution based on the pseudo-t statistic and the effective degrees of freedom of the model. The significance of the local coefficient is determined by the variable-specific two-sided pseudo-t test [88].
Since the same variable requires multiple local coefficient tests in 77 street blocks, this study uses a significance correction method based on the number of effective parameters to control the family-wise error rate caused by multiple inferences [89]. ArcGIS Pro 3.6 takes 0.05 as the initial significance level, divides 0.05 by the effective number of parameters (ENP) of the corresponding variable to obtain the adjusted alpha, and determines the corresponding corrected pseudo-t critical value based on the effective degrees of freedom of the model [87,88]. When the local pseudo-p-value is less than the adjusted alpha of the corresponding variable, that is, when the absolute value of the pseudo-t statistic exceeds the corrected pseudo-t critical value, the local coefficient of the street-block was statistically significant, and the local coefficient significance indication field (SG_variable name) takes the value 1. The number of effective parameters, significance correction parameters and local coefficient standard error statistics of each variable are shown in Table 17.
Table 17.
Statistics of effective parameters and local coefficient standard errors of MGWR.
Table 16 shows that the optimal bandwidth of each variable is 30–68 neighboring street blocks, reflecting differences in their spatial association scales. Den_sce, Green_sat, Style_sat, and PC_FAC had bandwidths of 30 neighboring street blocks, while the intercept had a bandwidth of 33, and the street-block range used is relatively small; the bandwidths of Den_road and Convenience_sat are 40 and 50, respectively, and these variables were estimated at intermediate spatial scales; the bandwidths of Dist_transit and SWDI are 66 and 68, respectively, close to the overall sample size of 77 street blocks.
Smaller bandwidths capture more localized variation, whereas larger bandwidths incorporate information from a wider range of street blocks, and the spatial distribution of coefficients is relatively flat. The difference in bandwidth of different variables reflects MGWR’s identification of the specific spatial scale of the variable. The bandwidth reflects the estimation scale of the local coefficient. The Monte Carlo results in Table 12 assess spatial variation in GWR coefficients, whereas the variable-specific bandwidths and local coefficient significance reported here are based on the MGWR results in Table 16 and Table 17.
From the perspective of local significance, Convenience_sat has the highest proportion of significant samples, which is 93.51%; PC_FAC is 77.92%, Den_road and Dist_transit are both 71.43%, and Den_sce is 63.64%. The significant correlations of the above variables cover many street blocks in Baoding City. The significant sample proportion of Style_sat is 23.38%, and the significant correlation is distributed in some street blocks; the significant sample proportions of SWDI and Green_sat are both 0.
From the perspective of direction of association and strength, the local coefficients of Den_sce, PC_FAC, Den_road, Dist_transit and SWDI are all positive, the local coefficients of Convenience_sat are all negative, and the local coefficients of Green_sat and Style_sat contain both positive and negative values. According to the absolute value of the average coefficient, the strength of association of each variable is: Den_sce (0.3941) > PC_FAC (0.3276) > Convenience_sat (0.3111) > Den_road (0.2972) > Dist_transit (0.1788) > SWDI (0.0798) > Green_sat (0.0636) > Style_sat (0.0068).
Among them, Den_sce, PC_FAC and Den_road show a strong positive association, Convenience_sat shows a strong negative association; Dist_transit shows a positive association, the coefficient distribution of SWDI is relatively concentrated, and the direction of association of Green_sat and Style_sat changes with the street-block location.
For the six variables showing statistically significant spatial variation in the GWR-based Monte Carlo test—Den_sce, Den_road, Dist_transit, Convenience_sat, Style_sat, and PC_FAC—the local coefficients estimated by MGWR are visualized in Figure 7. Colors represent the direction and magnitude of the MGWR local coefficients, while hatching distinguishes statistically significant and nonsignificant coefficients according to the adjusted pseudo-t thresholds reported in Table 17. The spatial distribution, coefficient ranges, and spatial extent of statistical significance are examined in relation to territorial spatial functional zoning, including urban development zones, ecological protection zones, ecological control zones, farmland protection zones, and rural development zones.
Figure 7.
Spatial distribution of MGWR local regression coefficients and their statistical significance. Note: Base map data were obtained from the National Platform for Common Geospatial Information Services, Tianditu (https://www.tianditu.gov.cn/; map approval number: GS(2024)0650). Street-block vitality is calculated based on the daily observation data from 06:00 to 22:00 from 8 to 14 April 2024. The spatial analysis units were 77 L1 street blocks. MGWR uses the adaptive bisquare kernel function and the AICc Golden Search method to determine the bandwidth. Color represents local regression coefficients, and textured mesh represents local coefficients that do not meet the corrected significance criterion. (a) Den_sce; (b) Den_road; (c) Dist_transit; (d) Convenience_sat; (e) Style_sat; (f) PC_FAC; (g) territorial spatial functional zones, road network, and river system.
Figure 7a shows that the local coefficients of Den_sce are all positive, showing a spatial pattern of higher values in the northwest, lower values in the northeast and southwest, and higher values extending from the northwest to the southeast. Higher coefficients were mainly observed in the northwestern ecological protection and ecological control zones and extended into the central urban development zone and the southeastern farmland protection and rural development zones. Significant street blocks are mainly distributed in the northwest, central and southeast, while nonsignificant street blocks are concentrated in the northeast and southwest. This variable uses the bandwidth of 30 neighboring street blocks, and the level of the coefficient forms obvious local differences between different functional zones.
The local coefficients of Den_road are all positive, showing a spatial pattern of lower values in the northwest and higher in the east and southeast. The higher coefficients are mainly distributed in the urban development zone in the east and southeast, and cover the surrounding farmland protection zone and rural development zone; the lower coefficients are mainly distributed in the ecological protection zone and ecological control zone in the west and north. Significant street blocks are concentrated in the central, east, and southeast, while nonsignificant street blocks are mainly distributed in the west, northwest, and north. With a bandwidth of 40 neighboring street blocks, the local coefficient estimates showed spatial variation across the western ecological zones and the central and eastern urban and agricultural zones (Figure 7b).
The local coefficients of the distance to the nearest public transit stop are all positive, showing a spatial pattern of lower values in the west and northwest and higher values in the east and southeast. Higher coefficients are mainly distributed in the eastern urban development zone and its surrounding farmland protection zone and rural development zone, while lower coefficients are mainly distributed in the western ecological protection zone and ecological control zone. Significant street blocks are distributed in the west, south and east, while nonsignificant street blocks are mainly concentrated in the north, northwest and central street blocks. The optimal bandwidth of this variable is 66 neighboring street blocks, indicating that its association with street-block vitality has a large spatial scale, and the local coefficient exhibits regional differences across multiple types of functional zones (Figure 7c).
The local coefficients of Convenience_sat are all negative, showing a spatial pattern of smaller absolute values in the northwest and larger absolute values in the east and southeast. The coefficients with larger absolute values are mainly distributed in the urban development zone, farmland protection zone and rural development zone in the east and southeast, while the coefficients with smaller absolute values are mainly distributed in the ecological protection zone and ecological control zone in the west and north. Significant street blocks cover most of the study area, and a small number of nonsignificant street blocks are distributed in the northwest. The bandwidth of this variable is 50, and its coefficient shows regional differences between the western ecological space and the central and eastern urban and agricultural space (Figure 7d).
The local coefficients of Style_sat contain both positive and negative values, with a spatial pattern of higher values in the southwest and south and lower values in the northeast and east. Higher coefficients are mainly distributed in the farmland protection zone and rural development zone in the southwest and southern parts, while lower coefficients are mainly distributed in the urban development zone and surrounding areas in the east and northeast. Significant street blocks are mainly distributed in the east and south, while nonsignificant street blocks are widely distributed in the west, north and center. The bandwidth of this variable is 30, and its coefficient direction and size show fine spatial differentiation between neighboring street blocks and different functional zones (Figure 7e).
The local coefficients of PC_FAC are all positive, showing a spatial pattern of lower values in the west and southwest and higher values in the north, northeast, and east. Higher coefficients are distributed in the ecological protection zone and ecological control zone in the north, urban development zone in the northeast, and adjacent farmland protection zone and rural development zone in the east; lower coefficients are mainly distributed in the west, southwest, and south. Significant street blocks are concentrated in the north, central, northeast, and east, while street blocks with nonsignificant local coefficients are mainly distributed in the west, southwest, and southern parts of the city. The bandwidth of this variable is 30, and the level of its coefficient forms local differences between ecological space, urban development space, and agricultural and rural space (Figure 7f).
Adaptive bandwidth is expressed as the number of neighboring street blocks, and its actual geographical coverage is affected by street-block area and spatial density. Blocks in the western and northern ecological protection zone and ecological control zone are larger and sparsely distributed, and the same number of neighbors corresponds to a wider actual coverage area; the central and eastern urban development zones and their surrounding street blocks are denser, and the same number of neighbors corresponds to a smaller actual coverage area. Therefore, Den_sce, Style_sat and PC_FAC with a bandwidth of 30 show finer spatial differences in dense street blocks in the central and eastern parts, and correspond to a larger actual geographical range in the ecological space of the northwest; Den_road and Convenience_sat with a bandwidth of 40 and 50 show regional differences across adjacent functional zones; the distance to the nearest public transit stop with a bandwidth of 66 mainly shows a regional scale pattern covering most street blocks in the study area. The above results specifically present the geographical range corresponding to the optimal bandwidth of different variables and its relationship with the spatial structure of the street block.
4.2.5. Sensitivity Analysis
- (1)
- KDE search radius sensitivity analysis
The KDE search radius determines the spatial smoothing scale of population activity heat, and its changes may affect the street-block vitality value and its spatial distribution. Referring to Rajha et al.’s idea of testing the stability of analysis results under different KDE bandwidths [90], this study sets the search radius of 200 m and 400 m respectively to recalculate the average heat value of the street-block while keeping the projection coordinate system, quartic kernel function, weight field, output pixel size, processing range, snap raster, time filtering and zonal statistics method consistent and uses the 300 m result as the benchmark for comparison.
Sensitivity analysis uses RMSE to evaluate the numerical differences in the average heat value of street blocks under different search radii and uses Spearman rank correlation coefficient to evaluate the consistency of the spatial ranking of 77 L1 street-block vitality values. The results are shown in Table 18. The smaller the RMSE, the closer the vitality value under the alternative search radius is to the 300 m benchmark result; the closer the Spearman rank correlation coefficient is to 1, the more stable the relative spatial ranking of street-block vitality under different search radii is.
Table 18.
Consistency test of street-block vitality measure under different KDE search radii.
The results indicate that the street-block vitality results under the search radius of 200 m and 400 m are consistent with the 300 m benchmark results. The Spearman rank correlation coefficient of the 200 m and 300 m results is 0.9780, and the RMSE is 3.1017; the Spearman rank correlation coefficient of the 400 m and 300 m results is 0.9466, and the RMSE is 5.0044. Both sets of correlation coefficients are close to 1, indicating that changes in search radius have little impact on the overall spatial ranking of street-block vitality. The RMSE of 200 m is lower than that of 400 m, indicating that the difference between its numerical results and the 300 m benchmark value is relatively small.
Therefore, within the search radius range of 200–400 m, the main spatial differentiation pattern of street-block vitality remains stable, and the research conclusions are relatively robust to the KDE search radius. The 300 m search radius is used as the benchmark parameter in this study to unify the spatial measurement scale of population activities at different dates and time points.
To test the sensitivity of the street-block vitality measure to the kernel density estimation (KDE) search radius, this study recalculates and standardizes the street-block vitality index using 200 m and 400 m search radii respectively. Both sets of models use 77 street blocks and keep the explanatory variables, kernel function, and MGWR bandwidth search settings consistent. The results of the 300 m benchmark model are shown in Table 16, and the local coefficient statistics of the 200 m and 400 m alternative models are shown in Table 19 and Table 20 respectively.
Table 19.
MGWR sensitivity analysis results under 200 m KDE search radius.
Table 20.
MGWR sensitivity analysis results under 400 m KDE search radius.
Compared with the baseline model, under the two alternative search radii, the local coefficients of Den_sce, Den_road, Dist_transit and PC_FAC are all positive, and the local coefficients of Convenience_sat are all negative. The proportion of samples with significant local coefficients of Dist_transit changed from 71.43% to 88.31% and 100.00%, and the Convenience_sat changed from 93.51% to 90.91% and 76.62%; the proportions of street blocks with significant local coefficients for the remaining variables also changed to varying degrees. The lower quartiles of Style_sat in the three groups of models are all negative, the median and upper quartiles are both positive, and the proportion of locally significant samples remains at 20.78–23.38%. Overall, the local coefficient directions and significance characteristics of the main variables are basically stable under different search radii.
- (2)
- Sensitivity analysis of collinear variable processing methods
To test the sensitivity of MGWR results to the processing method of collinear variables, this study uses the PCA-based integration model as the baseline model and constructs an alternative model based on a VIF threshold to eliminate collinear variables. The two models use the same samples, variable standardization methods, kernel functions and bandwidth search methods. The results are shown in Table 16 and Table 21 respectively.
Table 21.
Sensitivity analysis results of MGWR based on VIF threshold elimination.
The directions of the mean coefficients of the main variables in the two models are consistent: Den_sce, Den_road, and Dist_transit are positively associated with street-block vitality, whereas Convenience_sat is negatively associated with street-block vitality. In the alternative model, the proportions of street blocks with significant local coefficients for these variables are 72.73%, 64.94%, 88.31%, and 100.00%, respectively. The optimal bandwidths and spatial extents of statistical significance of some variables differ from those in the baseline model. Overall, the treatment of collinear variables affects the spatial scales and extents of statistical significance of some associations, while their main directions remain stable. The counterintuitive associations of Dist_transit and Convenience_sat are also retained in the alternative model.
- (3)
- Sensitivity analysis of potential omitted variables
To test the sensitivity of the main associations to street-block area, the standardized logarithmic street-block area was added to the original 77 street-block samples and explanatory variables to construct an alternative MGWR model. This model uses the same sample, variable standardization method, kernel function and bandwidth search method. The results are shown in Table 16 and Table 22 respectively.
Table 22.
Sensitivity analysis of potential omitted variables.
After adding street-block area, the direction of the average coefficient of the original variables remains consistent. The average coefficient of Dist_transit changed from 0.1788 to 0.1276, and the proportion of locally significant samples dropped from 71.43% to 48.05%; the average coefficient of Convenience_sat changed from −0.3111 to −0.2719, and the significant proportion changed from 93.51% to 85.71%. The significant proportion of Den_road dropped from 71.43% to 63.64%, and the significant proportion of street-block area was 0%. The direction of association between the two public transportation variables remains stable, and the locally significant extent of public transportation distance is sensitive to alternative model specifications.
5. Discussion
Based on the street-block vitality observation data from 8 to 14 April 2024, this study uses the MGWR model to analyze the spatial association between built environment variables and street-block vitality in Baoding City. The Monte Carlo spatial variation test based on a GWR model with a common bandwidth indicated statistically significant spatial variation in the coefficients of Den_sce, PC_FAC, Den_road, Dist_transit, Convenience_sat and Style_sat (Table 12). Statistical summaries and spatial visualizations of the MGWR local regression coefficients revealed spatial differences in the direction and strength of the associations and in their spatial extent of statistical significance. Differences in bandwidth across variables further suggest that the association between street-block vitality and the built environment has variable-specific spatial scales. The spatial differentiation of each variable is discussed below based on territorial spatial functional zoning, the spatial extent of statistical significance, and urban development conditions established before April 2024.
In the density dimension, Den_sce is positively associated with street-block vitality, and the strength of association weakens from the northwest through the central to the northeast. The coefficients drop from 0.9117 and 0.4909 to 0.0256 (Figure 7a). The overall pattern is “Northwest > Central > Northeast”. The northwest is dominated by ecological protection zone and ecological control zone, and the concentrated natural landscape resources provide a spatial carrier for leisure, recreation and outdoor communication. The higher coefficient extends from northwest to southeast, which is consistent with the distribution of ecological space, water system around the city and public activity space along the line. In 2022, Baoding City connected the East Third Ring Greenway and promoted the construction of parks along the water system around the city; the “two rings, four corridors, five lakes and ten gardens” landscape pattern established in 2023 provided spaces for leisure and fitness activities. The farmland protection zone and rural development zone in the southeastern part contain open spaces, waterfront landscapes, and village living spaces, thus maintaining high strength of association. Commercial, transportation and public service facilities are relatively concentrated in the urban development zone in the northeast, and the strength of association between Den_sce and street-block vitality is relatively weak. Significant street blocks are mainly distributed in the northwest, central and southeast, while street blocks with nonsignificant local coefficients are mainly distributed in the northeast and southwest. The above differences show that the association between Den_sce and street-block vitality has obvious location differences: areas with relatively concentrated landscape resources and close connections with waterfront spaces, park green spaces and outdoor activity venues have higher strength of association and wider significance. Overall, the positive association between Den_sce and street-block vitality may be related to the spatial concentration of landscape resources and the degree to which they are integrated into waterfront spaces, park green spaces, and daily activity venues. Existing research shows that park green space and urban vitality are generally positively correlated; waterfront space vitality is also jointly affected by factors such as park green space, commercial activities, and spatial accessibility; park location, internal facilities, and commercial services will also affect the use intensity and vitality level of public space [91,92,93].
PC_FAC has a positive association with street-block vitality, and the strength of association increases from the west and southwest through the central part to the north, northeast, and east. The coefficient increases from 0.0027, 0.2877 to 0.6552 (Figure 7f). The overall pattern is “north, northeast, and east > central > west and southwest”. The northeastern and eastern urban development zones have concentrated residential, commercial, public services and leisure facilities. Multiple types of facilities are close to each other, which facilitates residents’ consumption, leisure and social interaction within a small space, thus showing a strong association. By 2023, Baoding City had built 71 academies, 10 24-h self-service libraries and 16 community libraries in the central urban area. It also planned to promote the construction of a “15-min quality cultural life circle” and farmers’ market to further improve the daily service and cultural activity network. Although facility density is low in the northern ecological protection and ecological control zones, PC_FAC exhibits a relatively strong positive association with street-block vitality in these areas. The west and southwest are dominated by ecological space, rural space and low-density construction land. The distribution of facilities and resident activity nodes is relatively scattered, and the local coefficient is correspondingly low. Significant street blocks are mainly distributed in the north, central, northeast and east, while parts of the west, southwest and south are dominated by street blocks with nonsignificant local coefficients. The above differences show that the association between PC_FAC and street-block vitality has obvious location differences. In the urban development zone where multiple types of facilities are concentrated and the spatial proximity is high, and in the northern street-block where the base of facilities is low but the role of service nodes is more prominent, the strength of association is greater and the significance range is wider. Overall, the relationship between PC_FAC and street-block vitality is closely related to the agglomeration degree of multiple types of facilities, functional complementarity, and spatial proximity of public services. Existing research shows that compared with simply increasing the number of facilities, the richness and complementary configuration of different types of facilities are more conducive to improving street-block vitality; higher facility density, functional mix, and proximity to public facilities are also significantly positively related to urban vitality [32,50,94].
In the distance to transit dimension, Den_road has a positive association with street-block vitality, and the strength of association increases from the northwest through the middle to the east and southeast. The coefficient increases from 0.0396 and 0.3398 to 0.6022 (Figure 7b). The overall pattern is “southeast > central > northwest”. The east and southeast are mainly urban development zones. The road network is closely connected with residential, commercial, public services and transportation nodes. The road network enhances the spatial linkage within the street blocks and between neighboring street blocks and forms a relatively continuous activity space along the street. In 2023, Baoding City opened 10 previously disconnected road sections, totaling 8.08 km, further improving road connections and traffic microcirculation in the central urban area. The central street-block area has formed a relatively complete road network structure, and Den_road maintains a moderately strong relationship with street-block vitality. The west, northwest and north are mainly ecological protection zone, ecological control zone and rural development zone. Roads mainly serve regional traffic and connection functions. Facilities and activity nodes along the streets are relatively scattered, and the local coefficients are correspondingly low. Significant street blocks are mainly distributed in the central, eastern and southeastern parts, while street blocks with nonsignificant local coefficients are mainly distributed in the west, northwest and north. The above differences show that the association between Den_road and street-block vitality has obvious location differences: urban development zones where the road network is closely connected with residential, commercial, public services and transportation nodes have higher strength of association and a wider significant extent; ecological protection zones, ecological control zones and rural development zones are the main areas where roads mainly bear the functions of regional traffic and urban-rural connection. The strength of association between Den_road and street-block vitality is low and the significance range is smaller. Overall, the positive association between Den_road and street-block vitality is closely related to road connectivity, path selection and the degree of functional agglomeration along the street. Existing research shows that compact street blocks, convenient transportation and higher road network accessibility usually correspond to higher urban vitality; road connectivity, pedestrian friendliness and network centrality are also positively related to population activity agglomeration [91,95,96].
Also within the distance to transit dimension, Dist_transit was positively associated with street-block vitality, and the strength of association increases from the north and northwest to the east and southeast through the west, with the coefficient increasing from 0.1381 and 0.1877 to 0.2247 (Figure 7c). The overall pattern is “east and southeast > west > north and northwest”. The east and southeast are dominated by urban development zones, where industrial space, jobs, commercial outlets and public service facilities are relatively concentrated, forming relatively intensive commuting, consumption and public service activities. By 2023, Baoding Eastern Digital Industry Cluster had developed 400,000 square meters of space for industrial activities, gathering more than 290 companies and nearly 10,000 practitioners, further strengthening the industrial, employment and service functions of the eastern street block. In the same year, Baoding City Public Transport Company extended the last departure time of routes related to Baoding East Station such as Route 33, Route 39, Route 70 and Route 107, thereby enhancing nighttime and cross-regional transportation connections in the eastern street blocks. The agglomeration of industrial and service functions continues to attract commuting, consumption and public service activities. Coverage by multiple transit routes and extended operating hours further expand the activity connections between street blocks. Some street blocks that are far away from the nearest station maintain a high activity intensity. The farmland protection zone and rural development zone in the west are staggered with some ecological functional zones. The concentration of industries and public service facilities is relatively low, and the local coefficient is at an intermediate level. The north and northwest are dominated by ecological protection zone, ecological control zone and some rural development zones. The construction intensity is low, the distribution of related facilities and population activities is relatively scattered, and the local coefficient is correspondingly low. Significant street blocks are mainly distributed in the west, south and east, while nonsignificant street blocks are mainly distributed in the north, northwest and central part, indicating that this positive association has obvious spatial differences in the study area. Overall, this positive association may reflects the spatial differences in urban functional agglomeration, road access, and bus network organization among different functional zones. To enhance vitality, we should combine the activity characteristics of different functional zones, coordinate the layout of industry, employment and public service facilities and bus line coverage, operating hours and active-travel connection conditions, and improve the alignment between public transit provision and street-block activity needs. Existing research shows that site spatial layout and walking access conditions are closely related to residents’ bus travel experience, and bus coverage and operating frequency jointly affect bus use [97,98].
In the destination accessibility dimension, Convenience_sat has a negative association with street-block vitality. The strength of the negative association increases from the northwest through the central to the east and southeast. The coefficients decrease from −0.1855 and −0.2985 to −0.5028 (Figure 7d). The overall coefficient absolute value distribution pattern is “east and southeast > central > northwest”. The east and southeast are dominated by urban development zones, and are adjacent to parts of farmland protection zones and rural development zones. Industry, employment, commercial and public service destinations are relatively concentrated. Residents’ travel demand is relatively high. Travel purposes and spatial flows are diverse, which places greater demands on public transit stop coverage, spatial layout and line connection. When transit configuration fails to fully adapt to high-intensity and diverse travel demands, higher street-block vitality may coexist with lower satisfaction. The northwest mainly covers ecological protection zone, ecological control zone and part of rural development zone. Activity destinations and travel demand are relatively scattered, and the negative association is relatively weak. In 2023, Baoding City included the construction of 100 new bus stops in the central urban area into people’s livelihood matters, indicating that station setting and supporting services have become an important part of local public transportation improvement. Significant street blocks are widely distributed in most areas of the study area, and only a few street blocks in the northwest do not reach the level of statistical significance. The above differences show that the strength of the association between satisfaction with public transit stop placement and street-block vitality is closely related to the degree of adaptation between bus space supply and actual activity demand. The simultaneous occurrence of higher vitality and lower satisfaction in the east and southeast reflects the spatial differences between urban functional agglomeration and public transit stop configuration. Existing research has shown that station spatial location, pedestrian access conditions, and the degree of matching between nodes and surrounding functions are closely related to traffic satisfaction. Station service areas with highly concentrated functions may also have problems with insufficient adaptation of station coverage and route connections to actual travel needs [97,99,100].
In the design dimension, the direction of association between Style_sat and street-block vitality changes with the spatial location. The local coefficient changes from higher values in the southwest and south to lower values in the east and northeast. The value range is −0.2817, 0.0059 to 0.2231 (Figure 7e), and the overall pattern is “southwest and south > central > east and northeast”. The higher coefficients are mainly distributed in the farmland protection zone and rural development zone in the southwest and south, where traditional character is closely related to village living spaces and local activities; the lower coefficients are mainly distributed in the urban development zones in the east and northeast, where modern residential, commercial and public service spaces dominate, and the connection between traditional character and daily activities is relatively weak. The Baoding West Street Historical and Cultural Block underwent conservation and renewal and opened in 2022, and entered operation in 2023. By integrating historical building renovation, cultural interpretation and commercial formats, it provides a practical case for integrating traditional character into public space use and daily activities. Significant street blocks are mainly distributed in the east and south, while nonsignificant street blocks are concentrated in the west, north, and center, indicating that the association between Style_sat and street-block vitality is obviously local. The above differences indicate that traditional character needs to be combined with accessible streets, usable public spaces and ongoing activities to more fully integrate into residents’ daily activities and form a close connection with street-block vitality. Therefore, the conservation and renewal of traditional cityscapes should not only protect the characteristics of the space, but also improve the use conditions of public space and provide commercial functions suited to daily needs. Overall, the association between Style_sat and street-block vitality is related to the accessibility of traditional spatial forms, space usage patterns and the continuity of activity content, which is consistent with the conclusion that spatial form, functional configuration and daily activities in historical district research are jointly related to street vitality [101,102,103].
To further explain the spatial concentration characteristics of high-vitality street blocks, the local spatial association pattern and regression results were analyzed. Street blocks within HH clusters were mainly distributed in the central-eastern, northeastern, and southwestern areas. These clusters overlapped with areas where Den_road and PC_FAC each showed strong positive associations with street-block vitality. The “Baoding City Territorial Spatial Master Plan (2021–2035)” proposes a spatial orientation of “expansion in the north to connect with the east, expansion in the west and optimization in the south”, as well as measures such as improving the traffic skeleton, connecting street-block roads and constructing convenient service facilities, which provide the planning and construction background for the above-mentioned spatial pattern. On the other hand, roads, public service facilities and activity destinations in street blocks within LL clusters are relatively scattered. Overall, the spatial concentration of high-vitality street blocks in Baoding City is closely related to urban spatial development orientation, road network connectivity, and centralized configuration of service facilities, showing the spatial characteristics of intertwined distribution of multiple types of built environment elements.
Existing MGWR-based studies of street-block vitality in China have shown that the associations between built-environment factors and street-block vitality exhibit spatial heterogeneity and scale differences. Studies in Beijing, Wuhan, and Qingdao have identified spatial variations in the associations of functional density, road networks, public transport, and landscape environments with street-block vitality [104,105,106]. Consistent with these studies, this study further integrates objective built-environment characteristics and residents’ subjective perceptions within a single analytical framework and identifies the local associations and spatial scales of different variables across territorial spatial functional zones. The results show that the associations of facilities and road conditions vary across functional zones, while distance to the nearest public transit stop and satisfaction with public transit stop placement exhibit different directions of association. Satisfaction with traditional cityscape design also displays local variation. These findings provide new empirical evidence for understanding differences in street-block vitality across functional zones.
Taken together, these empirical findings allow the local associations of different built-environment factors to be synthesized from the perspective of human–environment relationship theory. Within the theoretical framework developed in this study, the built environment constitutes a spatial constraint on human activities within street blocks, while street-block vitality represents the spatial behavioral response arising from residents’ adaptation to the built environment. The empirical results show that the strength and spatial extent of statistical significance of the associations between street-block vitality and density of scenic facilities, facility-density principal component, road network density, distance to the nearest public transit stop, and satisfaction with public transit stop placement vary across locations. The direction, strength, and spatial extent of statistical significance of the association between satisfaction with traditional cityscape design and street-block vitality also exhibit marked local variation. Differences in the optimal bandwidths further indicate that the associations between built-environment factors and street-block vitality operate at variable-specific spatial scales. When considered in relation to territorial spatial functional zoning, objective built-environment characteristics and residents’ subjective perceptions of the built environment correspond to different patterns of street-block vitality across locations and functional zones. These findings operationalize the “built environment condition–street-block vitality response” framework in terms of specific built-environment factors, territorial spatial functional zoning, and spatial scales, demonstrating that the relationship between built environment condition and street-block vitality response takes the form of local associations that vary with location, functional zone, and variable-specific scale. By integrating objective built-environment characteristics and residents’ subjective perceptions within a single analytical framework and incorporating functional zoning and multiscale characteristics into street-block-scale human–environment relationship analysis, this study provides additional empirical evidence for understanding the spatial heterogeneity of the associations between built-environment factors and street-block vitality.
6. Conclusions
This study uses 77 L1 street blocks in Baoding City as the analysis unit. Based on the daily population activity data from 6:00 to 22:00 from 8 to 14 April 2024, combined with objective indicators of the built environment and subjective evaluations of residents, spatial autocorrelation analysis, kernel density analysis, hot spot analysis and MGWR are used to identify the spatial pattern of street-block vitality and its associations with the built environment during the observation week. The study results present the spatial differences in street-block vitality and its associated factors in different functional zones during the observation week.
6.1. Main Conclusions
- (1)
- Street-block vitality presents spatial concentration characteristics associated with territorial spatial functional zones, and there are obvious intra-regional differences. During the observation week, clusters of high-vitality street blocks were mainly distributed in the central-eastern, northeastern, and southwestern areas, involving the urban development zone and its adjacent farmland protection zone and rural development zone; clusters of low-vitality street blocks were mainly concentrated in the west, northwest, and north, mainly in the ecological protection zone, ecological control zone, and some rural development zones. Different vitality types are distributed simultaneously within the farmland protection zone and rural development zone, indicating that functional zoning provides a spatial background for street-block vitality differentiation, while street-block location, road connections, and activity destination configurations further form differences within similar functional spaces.
- (2)
- Den_sce and PC_FAC are both positively associated with street-block vitality, but there are differences in spatial association patterns. Den_sce has stronger association with street-block vitality in the northwest, and significant street blocks are mainly distributed in the northwest, central, and southeast; PC_FAC has a strong correlation in the north, northeast, and east, and significant street blocks cover many areas in the north, middle, and east. Some street blocks in the northwest have both high Den_sce local coefficients and low vitality levels, indicating that the local strength of association and the actual vitality level of the street blocks present different spatial patterns. The association between Den_sce and street-block vitality mainly reflects the spatial linkage between landscape resources and waterfront space, park green space and daily activity places, while the association between PC_FAC and street-block vitality mainly reflects the agglomeration and adjacent configuration of multiple types of facilities.
- (3)
- The positive association between Den_road and street-block vitality is more prominent in the central, eastern and southeastern areas. These areas are mainly urban development zones and their adjacent farmland protection zones and rural development zones. Roads are closely connected with residential, commercial, public services and transportation nodes. The west, northwest and north are mainly responsible for ecological protection, ecological control and urban-rural connection functions. Facilities and activity destinations along the streets are relatively scattered, and local associations are relatively weak. The association between Den_road and street-block vitality is not only reflected in road network density, but also closely related to the functional spaces and activity destinations connected by the roads.
- (4)
- Dist_transit and Convenience_sat exhibited opposite directions of association with street-block vitality, with stronger associations in the eastern and southeastern areas. Dist_transit has a positive association with street-block vitality, while Convenience_sat has a negative association. Sensitivity analysis shows that the average direction of association of the two variables remains consistent and the significant extent changes with the model setting. Bus stop distance and setting satisfaction respectively represent the objective spatial conditions of public transportation and the subjective evaluation of residents; activity destinations are more concentrated in the east and southeast, and higher street-block vitality coexists with lower Convenience_sat, indicating that there are regional differences in the degree of adaptation of bus stop configuration to the actual travel needs of the street blocks.
- (5)
- The association between Style_sat and street-block vitality has obvious directional differences and spatial specificity. Its local coefficient is higher in the southwest and south, lower in the east and northeast, and significant street blocks are mainly distributed in the east and south. The traditional space of the farmland protection zone and rural development zone in the southern part is closely related to local activities, while the urban development zone in the east and northeast is dominated by modern residential, commercial and public service functions. The association between Style_sat and street-block vitality is weaker or negative. The local association between satisfaction with traditional cityscape design and street-block vitality is related to traditional spatial form, public-space use, and the configuration of daily functions.
Overall, the associations between built environment factors and street-block vitality have variable-specific spatial scales. Den_sce, PC_FAC and Style_sat present finer local differences, and Den_road and Convenience_sat show regional differences across functional zones, while Dist_transit corresponds to a larger spatial range. Street-block renewal should combine functional zoning and related scales to determine governance priorities and implementation scope.
6.2. Policy Recommendations
The results reflect the spatial pattern of street-block vitality and its local associations with built-environment factors in Baoding City during the observation period from 8 to 14 April 2024. Based on the empirical results and discussion, the policy recommendations first propose differentiated implementation measures for Baoding and then summarize their implications and scope of applicability for comparable cities.
6.2.1. Differentiated Renewal Measures for Baoding City
Street-block vitality in Baoding City showed obvious spatial differentiation during the observation week, and there were also differences in the built-environment correlates and their spatial extent of association in different functional zones. In the context of regeneration of existing urban areas and urban quality improvement, it is necessary to implement differentiated governance based on the street-block vitality pattern and local association characteristics. Based on the empirical results and discussions, the following place-specific policy recommendations are put forward:
- (1)
- Establish a zone-specific and category-based street-block renewal mechanism. Taking L1 street blocks as the basic governance unit, three categories of street-block renewal should be established: priority improvement, consolidation and enhancement, and continuous observation. Priority-improvement street blocks should focus on addressing deficiencies in roads, facilities, and public transport; consolidation-and-enhancement street blocks should focus on maintaining existing spatial quality and service capacity; and continuously observed street blocks should be evaluated using subsequent activity data to determine their renewal priorities. Incorporate street-block renewal types into project establishment and construction schedules to improve the correspondence between renewal measures and specific spatial issues.
- (2)
- Coordinate landscape space improvement and comprehensive facility configuration. The ecological functional street blocks in the northwest should, on the basis of protecting ecological space, optimize the entrances and exits, walking paths and public spaces of parks, waterfront spaces and landscape places, and improve the convenience of using existing landscape resources. The northern street blocks can rely on existing construction space to supplement basic daily services, while the northeastern and eastern urban development street blocks can improve the configuration of residential, commercial, public services and leisure functions through the renewal of existing buildings, facility integration and space sharing.
- (3)
- Promote improvement of street-block road networks by category. Urban development street blocks in the central, eastern and southeastern parts of the study area should give priority to connecting missing road links, improving local streets, pedestrian routes and street-crossing facilities, and strengthening connections between roads, commercial and public service facilities, and transportation nodes. The ecological functional street blocks in the west, northwest and north should focus on maintaining existing roads and improving necessary connecting routes to ensure basic accessibility, urban-rural connections and ecological space management needs.
- (4)
- Optimize the spatial linkage between public transit stops and activity destinations. The east and southeast should focus on employment, commerce and public service facilities, and coordinate stop locations, route planning, operating hours and walking access conditions. For street blocks with low resident evaluations, stop locations and route connections can be adjusted to address specific problems. Waiting spaces and pedestrian access around stops can also be improved to better meet street-block activity needs.
- (5)
- Promote the integration of conservation of traditional character and daily functions. In the southern street blocks, the renovation of traditional buildings and streets should be implemented simultaneously with the improvement of public space, cultural interpretation and daily service configuration to enhance the daily use of traditional spaces. Urban development street blocks in the east and northeast can coordinate traditional character with modern residential, commercial and public service functions through adaptive use of buildings, integration of public spaces and functional renewal.
The above suggestions correspond to the street-block vitality pattern within the observation week. During implementation, activity data in subsequent periods can be combined to dynamically adjust street-block classification and project priorities.
6.2.2. Implications for Other Cities and Scope of Applicability
Building on the differentiated implementation measures for Baoding, this study further summarizes the governance implications for comparable cities. The Baoding case shows that street-block vitality management should comprehensively consider territorial spatial functional zoning, street-block vitality types, and the local associations of built-environment factors. The direction, intensity, and spatial extent of significance of the same built-environment factor in different functional spaces may change with location. Therefore, other cities can delineate functional spaces according to their local planning systems, integrate population activities, roads, facilities, public transportation and residents’ subjective evaluation data into unified street-block units, identify the vitality differences and local associations within each functional zone, and determine the renewal focus of specific street blocks accordingly.
This analytical approach is suitable for cities where urban construction space is intertwined with ecological and agricultural space and that simultaneously face the tasks of regeneration of existing urban areas, ecological protection and urban-rural connection. In urban development street blocks, analysis can focus on roads, facilities and public transportation conditions; ecological functional street blocks can focus on landscape resources, basic services and spatial linkages; farmland protection zones and rural development zones can combine their adjacency with urban development space to analyze the configuration of roads, public services and local spaces, thereby forming renewal strategies consistent with functional zoning and empirically identified associations.
The analytical framework of this study can provide a methodological reference for cities with similar functional zoning and spatial structures. When applied to other cities, the spatial bandwidth, local association and significant areas of each variable should be re-identified based on the local street-block scale, spatial structure, transportation mode and existing facility provision. The association directions, spatial extent of statistical significance, and zone-specific measures identified in Baoding are specific to the study context and observation period and should be reassessed before application elsewhere. Cross-city comparisons should unify indicator definitions, spatial-unit delineations and observation periods, and focus on comparing street blocks with similar functional types to identify common characteristics and contextual differences related to the built environment, and provide a basis for different cities to formulate street-block renewal strategies with clearly defined conditions of applicability.
6.3. Limitations and Future Research
This study is based on Baidu Huiyan data from 8 to 14 April 2024, and analyzes the spatial differentiation of street-block vitality in Baoding City and its association with the built environment. The study results provide empirical evidence for understanding the activity characteristics of street blocks in different functional zones, but there are still certain limitations and scope for further research in terms of temporal representativeness, vitality measurement and transportation mechanism identification.
- (1)
- Study results have clear temporal boundaries. This study uses single-week data and sets the observation period to 06:00–22:00, which actually reflects a cross-sectional snapshot of the intensity of population activity in the street-block during the selected observation week. Street-block vitality is seasonal and cyclical, and its spatial distribution may change with seasons, holidays, weekdays and weekends, and times of day; late-night consumption, entertainment, transportation, and service activities are not fully covered. Therefore, the term “street-block vitality” in this study mainly refers to the intensity of population activity during the observation period at the empirical level, and the temporal scope of relevant conclusions is limited to this observation period. Follow-up research can add observation data in different quarters, months, weekdays and holidays and expand the observation range to the whole day to construct a continuous time series and further reveal the seasonal changes, diurnal rhythms and nighttime characteristics of street-block activities.
- (2)
- The measurement of street-block vitality mainly relies on Baidu Huiyan data. These data reflect the spatial concentration and flow of mobile-device users, but differences in platform user coverage and mobile-device usage may cause sampling bias, and the activity representation of groups such as older adults and children is relatively limited. At the same time, street blocks with relatively concentrated roads, facilities, and public transportation usually have higher population activity intensity and mobile-device data coverage levels. The observed associations may be affected by the built environment, population activity agglomeration, and the spatial distribution of data coverage. Therefore, this study interprets the results as spatial associations between built environment factors and street-block vitality. Baidu Huiyan data mainly depict the intensity of population activities, and their representation of broader dimensions of economic exchanges, social participation, cultural activities and spatial experience is relatively limited. In the future, cross-validation can be carried out by combining mobile phone signaling data, social media check-ins and other multi-source data to improve the completeness and group representativeness of the street-block vitality measurement.
- (3)
- Dist_transit is positively associated with street-block vitality, whereas satisfaction with public transit stop placement is negatively associated with street-block vitality. These counterintuitive findings require further investigation of the underlying mechanisms. Variable-direction checks and sensitivity analyses confirmed that the directions of these associations remained stable. However, individual-level travel survey data were unavailable in this study. The available data support interpretation primarily at the street-block level by revealing spatial associations among activity intensity, transit-stop distance, and resident satisfaction. A mechanism-oriented analysis of typical street blocks would require additional individual-level data on transit-stop use, route choice, walking connections, and complete travel chains. Accordingly, the present findings are interpreted as spatial associations at the street-block level, and the proposed mechanisms require further empirical examination, while case studies of typical street blocks are identified as an important direction for future research. Future studies could select typical street blocks with different public transit conditions and activity intensities, integrate resident travel surveys, bus boarding and alighting data, and origin–destination (OD) trajectory data, and further examine spatial centrality, distance to commercial centers, population density, and socioeconomic composition to better understand the underlying mechanisms.
Author Contributions
Conceptualization, B.Z., W.Z. and B.G.; methodology, W.Z.; software, B.Z.; validation, W.Z., B.Z. and B.G.; formal analysis, B.Z.; investigation, W.Z.; resources, B.Y., Y.S. and S.F.; data curation, B.Z.; writing—original draft preparation, W.Z. and B.Z.; writing—review and editing, B.G.; visualization, B.Z.; supervision, B.G.; project administration, B.Y., Y.S. and S.F.; funding acquisition, W.Z. All authors have read and agreed to the published version of the manuscript.
Funding
This research was funded by the Department of Science and Technology of Hebei Province under the Hebei Provincial Major Science and Technology Support Program, grant number 252D6101D, and by the Department of Housing and Urban–Rural Development of Hebei Province under its Construction Science and Technology Research Program, grant number 2025-2097.
Institutional Review Board Statement
This study was reviewed and approved by the Institutional Review Board of the School of Public Administration, Xi’an University of Architecture and Technology, on 24 July 2026. The review covered the research reported in this manuscript, including the use and secondary analysis of existing data from the 2024 Hebei Province Urban Physical Examination survey. This study used survey data provided by Hebei Academy of Building Research Co., Ltd., geospatial data obtained through the Hebei Provincial Major Science and Technology Support Program (No. 252D6101D), and data from public platforms. According to the data provider, the original survey did not collect names, telephone numbers, or other direct personal identifiers. The research methods complied with relevant ethical requirements and did not involve animal experiments or human clinical trials. The Institutional Review Board did not assign a separate ethics approval number.
Informed Consent Statement
As verified by the Institutional Review Board of the School of Public Administration, Xi’an University of Architecture and Technology, informed consent was obtained from all participants in the original 2024 Hebei Province Urban Physical Examination survey, and participation was voluntary. The present study used the existing survey data for secondary analysis; no participants were newly recruited or surveyed.
Data Availability Statement
The Baidu Maps POI data, OpenStreetMap road network and river system data, and MSDCW street-block vector data are publicly available from the sources listed in Table 4. The Baidu Huiyan population activity data, Urban Physical Examination resident perception survey data, and territorial spatial functional zoning data were obtained through the Hebei Provincial Major Science and Technology Support Program (No. 252D6101D). These data are subject to the project confidentiality agreement, and the authors are not authorized to redistribute them. Non-restricted street-block-level derived data, variable definitions, data-processing documentation, and MGWR analysis settings are available from the corresponding author upon reasonable request.
Acknowledgments
We gratefully acknowledge the grant from the Hebei Provincial Major Science and Technology Support Program (No. 252D6101D) and the Construction Science and Technology Research Program Project of the Department of Housing and Urban-Rural Development of Hebei Province (No. 2025-2097).
Conflicts of Interest
No potential conflict of interest was reported by the author.
Abbreviations
The following abbreviations are used in this manuscript:
| Den_res | density of residential facilities |
| Den_pub | density of public service facilities |
| Den_com | density of commercial facilities |
| Den_lei | density of leisure facilities |
| Den_sce | density of scenic facilities |
| SWDI | Shannon–Wiener diversity index |
| Den_road | road network density |
| Den_trans | density of transport facilities |
| Dist_transit | distance to the nearest public transit stop |
| Convenience_sat | satisfaction with public transit stop placement |
| Green_sat | satisfaction with greenway design |
| Style_sat | satisfaction with traditional cityscape design |
| PC_FAC | facility-density principal component |
| API | application programming interface |
| CSV | comma-separated values |
| GPS | Global Positioning System |
| MSDCW | Multi-level Street-block Divisions of 985 Cities Worldwide |
| OSM | OpenStreetMap |
| POI | point of interest |
| UPE | Urban Physical Examination |
| WGS | World Geodetic System |
| UTM | Universal Transverse Mercator |
| SDG | Sustainable Development Goal |
| AICc | corrected Akaike information criterion |
| ENP | effective number of parameters |
| FDR | false discovery rate |
| GWR | geographically weighted regression |
| KDE | kernel density estimation |
| KMO | Kaiser–Meyer–Olkin measure |
| K–S | Kolmogorov–Smirnov |
| LISAs | Local Indicators of Spatial Association |
| MAE | mean absolute error |
| MGWR | multiscale geographically weighted regression |
| OLS | ordinary least squares |
| PCA | principal component analysis |
| RMSE | root mean square error |
| TOPSIS | technique for order preference by similarity to an ideal solution |
| VIF | variance inflation factor |
| HH | high–high cluster |
| HL | high–low spatial outlier |
| LH | low–high spatial outlier |
| LL | low–low cluster |
| 5D | density, diversity, design, destination accessibility, and distance to transit |
| L1–L5 | Level 1 to Level 5 |
| PC1–PC4 | the first to fourth principal components |
| Z_ | prefix denoting a variable standardized using the Z-score method |
| OD | origin–destination |
Appendix A
Table A1.
Number of valid questionnaires by L1 street block.
References
- Caprotti, F.; Cowley, R.; Datta, A.; Broto, V.C.; Gao, E.; Georgeson, L.; Herrick, C.; Odendaal, N.; Joss, S. The New Urban Agenda: Key opportunities and challenges for policy and practice. Urban Res. Pract. 2017, 10, 367–378. [Google Scholar] [CrossRef] [Scilit]
- Jacobs, J. The Death and Life of Great American Cities; Vintage Books: New York, NY, USA, 1992. [Google Scholar]
- Zhang, M.; Liu, Y.; Wu, J.; Wang, T. Index system of urban resource and environment carrying capacity based on ecological civilization. Environ. Impact Assess. Rev. 2018, 68, 90–97. [Google Scholar] [CrossRef] [Scilit]
- Chen, D.; Fang, C.; Liu, Z. Progress and major themes of research on urban shrinkage and its eco-environmental impacts. J. Geogr. Sci. 2023, 33, 1113–1138. [Google Scholar] [CrossRef] [Scilit]
- Wang, Z.; Wang, K.; Fu, K.; Pan, L. Research on the evaluation method and evolutionary characteristics of urban spatial quality by integrating multi-source data: Taking the old town of Qingdao as an example. Urban Dev. Stud. 2025, 32, 30–38. (In Chinese) [Google Scholar]
- Wang, K. Green transformation and development of China’s urbanization. City Plan. Rev. 2021, 45, 9–16+66. (In Chinese) [Google Scholar]
- Wang, H.; Liu, C. Gentrification empowered by cultural tourism resources in “southern old city” in Nanjing, China. Econ. Geogr. 2025, 45, 234–244. (In Chinese) [Google Scholar]
- Zhan, D.; Wang, Y.; Wu, Q.; Zhang, W. Nonlinear effects of the urban built environment on urban vitality: A case study of Hangzhou, China. J. Geogr. Sci. 2025, 35, 1183–1203. [Google Scholar] [CrossRef] [Scilit]
- Lynch, K. Good City Form; MIT Press: Cambridge, MA, USA, 1984. [Google Scholar]
- Long, Y.; Zhou, Y. Quantitative evaluation on street vibrancy and its impact factors: A case study of Chengdu. New Archit. 2016, 1, 52–57. (In Chinese) [Google Scholar]
- Xiao, J.; Lu, S.; Huang, Y.; Qian, X.; Cao, K. Heritage value equivalents multi-modal evaluation of historic districts and its preservation and renewal application. Planners 2024, 40, 48–57. (In Chinese) [Google Scholar]
- Guo, J.; Zheng, Y.; Dong, M.; Jin, X.; Tian, S. Evaluation of urban development vitality and its interactive relationship in coastal provinces: A case study of sub-provincial cities. Areal Res. Dev. 2024, 43, 64–71. (In Chinese) [Google Scholar]
- Feng, Y.; Li, J. Research on the index construction and application of historic district impact assessment from the human space synergic perspective: Yuehe historical district, Jiaxing. Planners 2023, 39, 64–72. (In Chinese) [Google Scholar]
- Huang, B.; Zhou, Y.; Li, Z.; Song, Y.; Cai, J.; Tu, W. Evaluating and characterizing urban vibrancy using spatial big data: Shanghai as a case study. Environ. Plan. B Urban Anal. City Sci. 2020, 47, 1543–1559. [Google Scholar] [CrossRef] [Scilit]
- Hu, T.; Shao, W. Spatiotemporal analysis of urban nighttime light after China lifted 3-year-old COVID-19 restrictions. IEEE J. Sel. Top. Appl. Earth Obs. Remote Sens. 2023, 16, 9038–9050. [Google Scholar] [CrossRef] [Scilit]
- Luo, S.; Zhen, F. How to evaluate public space vitality based on mobile phone data: An empirical analysis of Nanjing’s parks. Geogr. Res. 2019, 38, 1594–1608. (In Chinese) [Google Scholar]
- Yu, L.; Sheng, Y.; Liu, X. A method for evaluating urban vitality using the RAGA-PPM model: A case study of central Nanjing. J. Geo-Inf. Sci. 2024, 26, 2567–2582. (In Chinese) [Google Scholar]
- Wang, B.; Lei, Y.; Wang, C.; Wang, L. The spatio-temporal impacts of the built environment on urban vitality: A study based on big data. Sci. Geogr. Sin. 2022, 42, 274–283. (In Chinese) [Google Scholar]
- Liu, B.; Hu, X.; He, H. Effect mechanism of built environment on urban vitality based on CatBoost-SHAP model: A case study of the main urban area of Xi’an City. Geogr. Geo-Inf. Sci. 2025, 41, 7–15. (In Chinese) [Google Scholar]
- Lei, Y.; Lu, C.; Su, Y.; Huang, Y. Research on the coupling relationship between urban vitality and urban sprawl based on the multi-source nighttime light data: A case study of the West Taiwan Strait urban agglomeration. Hum. Geogr. 2022, 37, 119–131. (In Chinese) [Google Scholar]
- Wang, E.; Zhou, J.; Yang, J.; Wang, Y.; Yang, P.; Wang, X. Impact of built environment on spatial differentiation of urban vitality at the subdistrict level based on MGWR: A case study of Shenyang central urban area. Sci. Geogr. Sin. 2024, 44, 1322–1331. (In Chinese) [Google Scholar]
- Jian, K.; Lu, D.; Wang, S. Examining the linkage effect of urban development intensity, integration and urban vitality: Taking the central city of Shishi, Fujian Province as an example. Areal Res. Dev. 2023, 42, 94–101. (In Chinese) [Google Scholar]
- Chen, Y.; Yu, B.; Shu, B.; Yang, L.; Wang, R. Exploring the spatiotemporal patterns and correlates of urban vitality: Temporal and spatial heterogeneity. Sustain. Cities Soc. 2023, 91, 104440. [Google Scholar] [CrossRef] [Scilit]
- Zhang, T.; Liu, Y. Spatial patterns and influence factors of urban vitality based on multisource data and MGWR model: A case study of China’s coastal regions. Sustainability 2026, 18, 1907. [Google Scholar] [CrossRef] [Scilit]
- Wang, J.; Liu, Y.; Liu, Y. Impact of built environment on urban vitality and its spatial heterogeneity based on OPGD and MGWR: A case study of Guangzhou. Geogr. Res. 2025, 44, 3304–3321. (In Chinese) [Google Scholar]
- Wang, B.; Loo, B.P.; Liu, J.; Lei, Y.; Zhou, L. Urban vibrancy and air pollution: Avoidance behaviour and the built environment. Int. J. Urban Sci. 2024, 28, 611–630. [Google Scholar] [CrossRef] [Scilit]
- Chen, Y.; Li, B.; Liu, S.; Cai, Z. Exploring the impact of public health emergencies on urban vitality using a difference-in-difference model. Remote Sens. 2024, 16, 1697. [Google Scholar] [CrossRef] [Scilit]
- Wu, C.; Zhao, M.; Ye, Y. Measuring urban nighttime vitality and its relationship with urban spatial structure: A data-driven approach. Environ. Plan. B Urban Anal. City Sci. 2023, 50, 130–145. [Google Scholar] [CrossRef] [Scilit]
- Zhang, J.; Liu, X.; Tan, X.; Jia, T.; Senousi, A.M.; Huang, J.; Yin, L.; Zhang, F. Nighttime vitality and its relationship to urban diversity: An exploratory analysis in Shenzhen, China. IEEE J. Sel. Top. Appl. Earth Obs. Remote Sens. 2022, 15, 309–322. [Google Scholar] [CrossRef] [Scilit]
- Huang, G.; Sun, Z.; Liu, Y.; Liang, L.; Fu, D. Dilemma and path of urban renewal in the market-based historical and cultural block from the perspective of spatial justice: The case study of Guangzhou Thirteen Hongs historical block. J. Nat. Resour. 2025, 40, 3201–3224. (In Chinese) [Google Scholar] [CrossRef] [Scilit]
- Ewing, R.; Cervero, R. Travel and the built environment: A meta-analysis. J. Am. Plan. Assoc. 2010, 76, 265–294. [Google Scholar] [CrossRef] [Scilit]
- Wu, J.; Ta, N.; Song, Y.; Lin, J.; Chai, Y. Urban form breeds neighborhood vibrancy: A case study using a GPS-based activity survey in suburban Beijing. Cities 2018, 74, 100–108. [Google Scholar] [CrossRef] [Scilit]
- Ning, Y.; Wang, E. How does the built environment shape urban vitality across multiple scales? A nonlinear comparative analysis of Chengdu and Chongqing in China. Land 2026, 15, 844. [Google Scholar] [CrossRef] [Scilit]
- Xia, C.; Yeh, A.G.-O.; Zhang, A. Analyzing spatial relationships between urban land use intensity and urban vitality at street block level: A case study of five Chinese megacities. Landsc. Urban Plan. 2020, 193, 103669. [Google Scholar] [CrossRef] [Scilit]
- Lyu, G.; Angkawisittpan, N.; Fu, X.; Sonasang, S. Investigating the relationship between built environment and urban vitality using big data. Sci. Rep. 2025, 15, 579. [Google Scholar] [CrossRef] [Scilit]
- Wu, G.; Yang, D.; Niu, X.; Mi, Z. The impact of park green space areas on urban vitality: A case study of 35 large and medium-sized cities in China. Land 2024, 13, 1560. [Google Scholar] [CrossRef] [Scilit]
- Dong, Q.; Cai, J.; Chen, S.; He, P.; Chen, X. Spatiotemporal analysis of urban green spatial vitality and the corresponding influencing factors: A case study of Chengdu, China. Land 2022, 11, 1820. [Google Scholar] [CrossRef] [Scilit]
- Duan, G.; Liu, W.; Xing, H. Nonlinear relationship between multidimensional street vitality and built environment based on multi-source geographic data: A case study of Futian District, Shenzhen City. Geogr. Sci. 2025, 45, 975–987. (In Chinese) [Google Scholar]
- Peng, Y.; Cui, X.; Yu, B.; Liu, R.; Li, H. How 2D and 3D built environment impact urban vitality: Evidence from overhead-level to eye-level urban form metrics. Land 2025, 14, 1026. [Google Scholar] [CrossRef] [Scilit]
- Shan, Z.; Zhang, X.; Yuan, M.; Chen, Y. Research on the matching relationship between street space quality and urban vitality and influencing factors: Taking Wuhan City center as an example. J. Hum. Settl. West China 2025, 40, 126–134. (In Chinese) [Google Scholar]
- Sun, F.; Wang, E. Unveiling the spatial heterogeneity of urban vitality using machine learning methods: A case study of Tianjin, China. Land 2025, 14, 1316. [Google Scholar] [CrossRef] [Scilit]
- Lu, S.; Shi, C.; Yang, X. Impacts of built environment on urban vitality: Regression analyses of Beijing and Chengdu, China. Int. J. Environ. Res. Public Health 2019, 16, 4592. [Google Scholar] [CrossRef] [Scilit]
- Yang, J.; Wang, E. Exploring the nonlinear impacts of built environment on urban vitality from a spatiotemporal perspective at the block scale in Chongqing. ISPRS Int. J. Geo-Inf. 2025, 14, 225. [Google Scholar] [CrossRef] [Scilit]
- Li, J.; Zhai, J.; Shen, L.; Zhao, D. How the built environment affects urban vitality at the block scale: Empirical evidence from Xi’an’s central urban area. Environ. Plan. B Urban Anal. City Sci. 2026, 23998083261432337. [Google Scholar] [CrossRef] [Scilit]
- Lu, X.; Huang, S.; Xie, W.; Sun, Y. The impact of built environment on urban vitality—A multi-scale geographically weighted regression analysis in the case of Shenyang, China. Buildings 2025, 15, 2989. [Google Scholar] [CrossRef] [Scilit]
- Yang, Q.; Mei, L. Human–activity–geographical–environment relationship, its system and its regional system. Econ. Geogr. 2001, 21, 532–537. (In Chinese) [Google Scholar]
- Wu, C. Theoretical research and regulation of the territorial system of human–environment interaction. J. Yunnan Norm. Univ. (Philos. Soc. Sci. Ed.) 2008, 40, 1–3. (In Chinese) [Google Scholar]
- Barrows, H.H. Geography as human ecology. Ann. Assoc. Am. Geogr. 1923, 13, 1–14. [Google Scholar] [CrossRef]
- Roxby, P.M. The scope and aims of human geography. Scott. Geogr. Mag. 1930, 46, 276–290. [Google Scholar] [CrossRef] [Scilit]
- Yue, Y.; Zhuang, Y.; Yeh, A.G.; Xie, J.-Y.; Ma, C.-L.; Li, Q.-Q. Measurements of POI-based mixed use and their relationships with neighbourhood vibrancy. Int. J. Geogr. Inf. Sci. 2017, 31, 658–675. [Google Scholar] [CrossRef] [Scilit]
- Zhang, J.; Shen, Y. Model modeling the spatiotemporal vitality of a historic urban area: The CatBoost-SHAP analysis of built environment effects in Kaifeng. Buildings 2025, 15, 4499. [Google Scholar] [CrossRef] [Scilit]
- Zhao, X.; Zhou, Y.; Chen, W.; Li, X.; Li, X.; Li, D. Mapping hourly population dynamics using remotely sensed and geospatial data: A case study in Beijing, China. GISci. Remote Sens. 2021, 58, 717–732. [Google Scholar] [CrossRef] [Scilit]
- Wang, L. Spatial-temporal characteristics of urban population aggregation based on Baidu heat map in central areas of Wuhan City. J. Hum. Settl. West China 2018, 33, 52–56. (In Chinese) [Google Scholar]
- Tang, S.; Ta, N. How the built environment affects the spatiotemporal pattern of urban vitality: A comparison among different urban functional areas. Comput. Urban Sci. 2022, 2, 39. [Google Scholar] [CrossRef] [Scilit]
- Jin, A.; Ge, Y.; Zhang, S. Spatial characteristics of multidimensional urban vitality and its impact mechanisms by the built environment. Land 2024, 13, 991. [Google Scholar] [CrossRef] [Scilit]
- Ta, N.; Zeng, Y.; Zhu, Q.; Wu, J. Relationship between built environment and urban vitality in Shanghai downtown area based on big data. Sci. Geogr. Sin. 2020, 40, 60–68. (In Chinese) [Google Scholar]
- Tang, L.; Xu, H.; Ding, Y. Comprehensive vitality evaluation of urban blocks based on multi-source geographic big data. J. Geo-Inf. Sci. 2022, 24, 1575–1588. (In Chinese) [Google Scholar]
- Liu, S.; Long, Y.; Zhang, L.; Yang, J.; Dong, W. Quantitative measurement of urban spatial vitality by integrating physical built environment and subjective perception dimensions. Environ. Plan. B Urban Anal. City Sci. 2025, 52, 131–149. [Google Scholar] [CrossRef] [Scilit]
- Dong, W.; Liu, Y.; Dong, Y.; Wu, W.; Chen, Y. How the perceived built environment affects pedestrian well-being: Evidence from three types of neighborhoods in Harbin, China. China City Plan. Rev. 2024, 33, 65–76. [Google Scholar]
- Lei, Y.; Zhang, X.; Xiong, S.; Tan, G.; Wang, H.; Du, S. Towards livable communities: Perceptual scale optimized urban human settlement evaluation at community levels. Geogr. Sustain. 2026, 7, 100458. [Google Scholar] [CrossRef] [Scilit]
- Zhang, M.; Jiang, H.; Huang, Z.; Liu, J.; Yang, H. Built environment and walking commute satisfaction: A route-level analysis. Transp. B Transp. Dyn. 2025, 13, 2586109. [Google Scholar] [CrossRef] [Scilit]
- Liu, K. Research on the protection and renovation strategies of historical urban areas from the perspective of value reconstruction: A case study of the ancient city of Baoding. Urban Dev. Stud. 2024, 31, 55–65. (In Chinese) [Google Scholar]
- Jiang, C.; Nie, L.; Li, K. Study on the development trend and integration effectiveness of Beijing-Tianjin-Hebei industrial chain and innovation chain. Reg. Econ. Rev. 2025, 3, 85–97. (In Chinese) [Google Scholar]
- Guo, Z.; Luo, K.; Yan, Z.; Hu, A.; Wang, C.; Mao, Y.; Niu, S. Assessment of the street space quality in the metro station areas at different spatial scales and its impact on the urban vitality. Front. Archit. Res. 2024, 13, 1270–1287. [Google Scholar] [CrossRef] [Scilit]
- Han, D.; Fan, D.; Zhang, J.; Zhao, X.; Wang, H. Investigating the spatiotemporal response of urban functions to fine-grained resident activities with a novel analytical framework and Baidu Heatmap. Land 2025, 14, 2235. [Google Scholar] [CrossRef] [Scilit]
- Guo, X.; Chen, H.; Yang, X. An evaluation of street dynamic vitality and its influential factors based on multi-source big data. ISPRS Int. J. Geo-Inf. 2021, 10, 143. [Google Scholar] [CrossRef] [Scilit]
- Liu, S.; Zhang, L.; Long, Y. Urban vitality area identification and pattern analysis from the perspective of time and space fusion. Sustainability 2019, 11, 4032. [Google Scholar] [CrossRef] [Scilit]
- Silverman, B.W. Density Estimation for Statistics and Data Analysis; Routledge: New York, NY, USA, 2018. [Google Scholar]
- Tang, J.; Xu, L.; Yu, H.; Jiang, H.; He, D.; Li, T.; Xiao, W.; Zheng, X.; Liu, K.; Li, Y.; et al. A dataset of multi-level street-block divisions of 985 cities worldwide. Sci. Data 2025, 12, 456. [Google Scholar] [CrossRef] [Scilit]
- Xu, L.; Tang, J.; Yu, H.; Liu, Y.; Li, Y. MSDCW Dataset and Code. 2024. Available online: https://figshare.com/articles/dataset/MSDCW_Dataset_and_Code/26021314/1 (accessed on 30 September 2024). [CrossRef]
- Zhu, Q.; Li, D.; Ran, L.; Xu, Y.; Zhang, Y.; Guan, Q. RURBAN-Map: A knowledge-guided framework for nationwide fine-scale urban-rural land use mapping in China. Remote Sens. Environ. 2026, 338, 115352. [Google Scholar] [CrossRef] [Scilit]
- Liu, M.; Li, R.; Li, Y.; Al-Mowallad, E.A.M.S.; Wu, C.; Wang, W. Nighttime light intensity and brightness suitability in urban functional zones. Sci. Rep. 2025, 15, 25113. [Google Scholar] [CrossRef] [Scilit]
- Anselin, L. Spatial Econometrics: Methods and Models; Kluwer Academic Publishers: Dordrecht, The Netherlands, 1988. [Google Scholar]
- Getis, A.; Ord, J.K. The analysis of spatial association by use of distance statistics. Geogr. Anal. 1992, 24, 189–206. [Google Scholar] [CrossRef] [Scilit]
- Brunsdon, C.; Fotheringham, A.S.; Charlton, M.E. Geographically weighted regression: A method for exploring spatial nonstationarity. Geogr. Anal. 1996, 28, 281–298. [Google Scholar] [CrossRef] [Scilit]
- Shen, T.; Yu, H.; Zhou, L.; Gu, H.; He, H. On hedonic price of second-hand houses in Beijing based on multi-scale geographically weighted regression: Scale law of spatial heterogeneity. Econ. Geogr. 2020, 40, 75–83. (In Chinese) [Google Scholar]
- Wei, H.; Wang, G. Investigating the spatiotemporal pattern between street vitality in historic cities and built environments using multisource data in Chaozhou, China. J. Urban Plan. Dev. 2024, 150, 05024027. [Google Scholar] [CrossRef] [Scilit]
- Marcoulides, K.M.; Raykov, T. Evaluation of variance inflation factors in regression models using latent variable modeling methods. Educ. Psychol. Meas. 2019, 79, 874–882. [Google Scholar] [CrossRef] [Scilit]
- Dormann, C.F.; Elith, J.; Bacher, S.; Buchmann, C.; Carl, G.; Carré, G.; Marquéz, J.R.G.; Gruber, B.; Lafourcade, B.; Leitão, P.J.; et al. Collinearity: A review of methods to deal with it and a simulation study evaluating their performance. Ecography 2013, 36, 27–46. [Google Scholar] [CrossRef] [Scilit]
- O’brien, R.M. A caution regarding rules of thumb for variance inflation factors. Qual. Quant. 2007, 41, 673–690. [Google Scholar] [CrossRef] [Scilit]
- Kupfer, J.A.; Farris, C.A. Incorporating spatial non-stationarity of regression coefficients into predictive vegetation models. Landsc. Ecol. 2007, 22, 837–852. [Google Scholar] [CrossRef] [Scilit]
- Fotheringham, A.S.; Yang, W.; Kang, W. Multiscale geographically weighted regression (MGWR). Ann. Am. Assoc. Geogr. 2017, 107, 1247–1265. [Google Scholar] [CrossRef] [Scilit]
- Cudlin, P.; Muolo, A.; Rontos, K.; Salvati, L. Von Thunen revisited? An econometric analysis of metropolitan expansion and land-use change in Greece. J. Agric. Biol. Environ. Stat. 2025, 30, 491–516. [Google Scholar] [CrossRef] [Scilit]
- Roy, P.P.; Leonard, J.T.; Roy, K. Exploring the impact of size of training sets for the development of predictive QSAR models. Chemom. Intell. Lab. Syst. 2008, 90, 31–42. [Google Scholar] [CrossRef] [Scilit]
- Tao, Z.; Chen, J.; Wu, W.; Ding, J.; Wang, L.; Zhu, Z.; Chen, D. Spatiotemporal association of urban park characteristics and physical activity levels based on GTWR: A serial cross-sectional observational study. J. Urban Manag. 2024, 13, 398–409. [Google Scholar] [CrossRef] [Scilit]
- Huang, H.; Liu, X.; Ren, L. Analysis of the spatiotemporal mechanism of high temperature on residents’ irritability in Beijing based on multiscale geographically weighted regression model. Front. Ecol. Evol. 2022, 10, 973365. [Google Scholar] [CrossRef] [Scilit]
- Yu, H.; Fotheringham, A.S.; Li, Z.; Oshan, T.; Kang, W.; Wolf, L.J. Inference in multiscale geographically weighted regression. Geogr. Anal. 2020, 52, 87–106. [Google Scholar] [CrossRef] [Scilit]
- Oshan, T.M.; Li, Z.; Kang, W.; Wolf, L.J.; Fotheringham, A.S. mgwr: A Python implementation of multiscale geographically weighted regression for investigating process spatial heterogeneity and scale. ISPRS Int. J. Geo-Inf. 2019, 8, 269. [Google Scholar] [CrossRef] [Scilit]
- da Silva, A.R.; Fotheringham, A.S. The multiple testing issue in geographically weighted regression. Geogr. Anal. 2016, 48, 233–247. [Google Scholar] [CrossRef] [Scilit]
- Rajha, R.; Shiode, S.; Shiode, N. Improving traffic-flow prediction using proximity to urban features and public space. Sustainability 2025, 17, 68. [Google Scholar] [CrossRef] [Scilit]
- Chen, Z.; Huang, B. Achieving urban vibrancy through effective city planning: A spatial and temporal perspective. Cities 2024, 152, 105230. [Google Scholar] [CrossRef] [Scilit]
- Kang, M.; Kwon, Y. What brings people to riverfronts? Revealing key factors from mobility patterns using de facto population data. Land 2024, 13, 2188. [Google Scholar] [CrossRef] [Scilit]
- Qin, L.; Zong, W.; Peng, K.; Zhang, R. Assessing spatial heterogeneity in urban park vitality for a sustainable built environment: A case study of Changsha. Land 2024, 13, 480. [Google Scholar] [CrossRef] [Scilit]
- Wu, W.; Niu, X. Influence of built environment on urban vitality: Case study of Shanghai using mobile phone location data. J. Urban Plan. Dev. 2019, 145, 04019007. [Google Scholar] [CrossRef] [Scilit]
- Zhang, A.; Li, W.; Wu, J.; Lin, J.; Chu, J.; Xia, C. How can the urban landscape affect urban vitality at the street block level? A case study of 15 metropolises in China. Environ. Plan. B Urban Anal. City Sci. 2021, 48, 1245–1262. [Google Scholar] [CrossRef] [Scilit]
- Li, X.; Qian, Y.; Zeng, J.; Wei, X.; Guang, X. The influence of Strip-City street network structure on spatial vitality: Case studies in Lanzhou, China. Land 2021, 10, 1107. [Google Scholar] [CrossRef] [Scilit]
- Wu, W.; Cao, M.; Wang, F.; Wang, R. Nonlinear influences of landscape configurations and walking access to transit services on travel satisfaction. Transp. Res. Part A Policy Pract. 2024, 189, 104232. [Google Scholar] [CrossRef] [Scilit]
- Lyons, T.; Ewing, R.; Tian, G. Coverage vs frequency: Is spatial coverage or temporal frequency more impactful on transit ridership? J. Transp. Geogr. 2025, 122, 104058. [Google Scholar] [CrossRef] [Scilit]
- Cui, N.; Yang, H.; Mwetuhafifa, N.M. Evaluating TOD performance through node-place model: Evidence from bus stop areas in Windhoek, Namibia. Front. Public Health 2025, 13, 1697702. [Google Scholar] [CrossRef] [Scilit]
- Gao, X.; Li, T.; Wei, D. Accessibility and satisfaction with daily commute: Does subjective perception in accordance with objective measurement? Appl. Geogr. 2024, 172, 103417. [Google Scholar] [CrossRef] [Scilit]
- Zou, H.; Liu, R.; Cheng, W.; Lei, J.; Ge, J. The association between street built environment and street vitality based on quantitative analysis in historic areas: A case study of Wuhan, China. Sustainability 2023, 15, 1732. [Google Scholar] [CrossRef] [Scilit]
- Wu, J.; Lu, Y.; Gao, H.; Wang, M. Cultivating historical heritage area vitality using urban morphology approach based on big data and machine learning. Comput. Environ. Urban Syst. 2022, 91, 101716. [Google Scholar] [CrossRef] [Scilit]
- Han, C.; Zhang, Z. Nonlinear effects of built environment perception and objective features on street vitality in historic districts. Front. Archit. Res. 2026, 15, 1075–1091. [Google Scholar] [CrossRef] [Scilit]
- Long, Y.; Hu, S.; Lu, Z.; Cheng, L.; Zhen, C.; Shao, J.; Zheng, Y.; Zhou, X.; Li, J.; Lin, Y. A study on the influence mechanisms of neighborhood vitality and the characteristics of spatial and temporal differentiation in the urban fringe areas of Wuhan city. Land 2024, 13, 1771. [Google Scholar] [CrossRef] [Scilit]
- Fan, L.; Zhang, D. Research on the influence mechanism and spatial heterogeneity characteristics of block vitality in Beijing: Based on multi-scale geographically weighted regression. City Plan. Rev. 2022, 46, 27–37. (In Chinese) [Google Scholar]
- Li, M.; Liu, R.; Cheng, R. Study on the factors influencing the vitality of historical districts based on MGWR: A case of Sifang Road Historical and Cultural Block in Qingdao. Urban. Archit. 2025, 22, 109–113. (In Chinese) [Google Scholar]
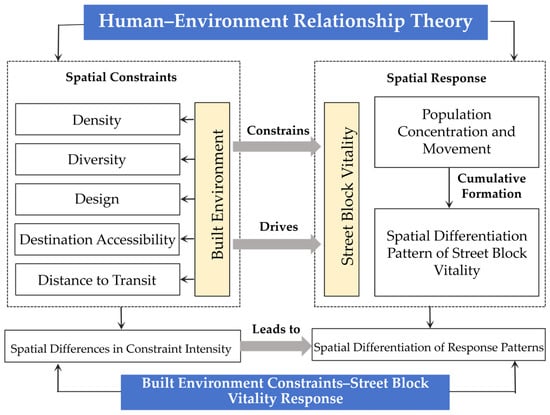
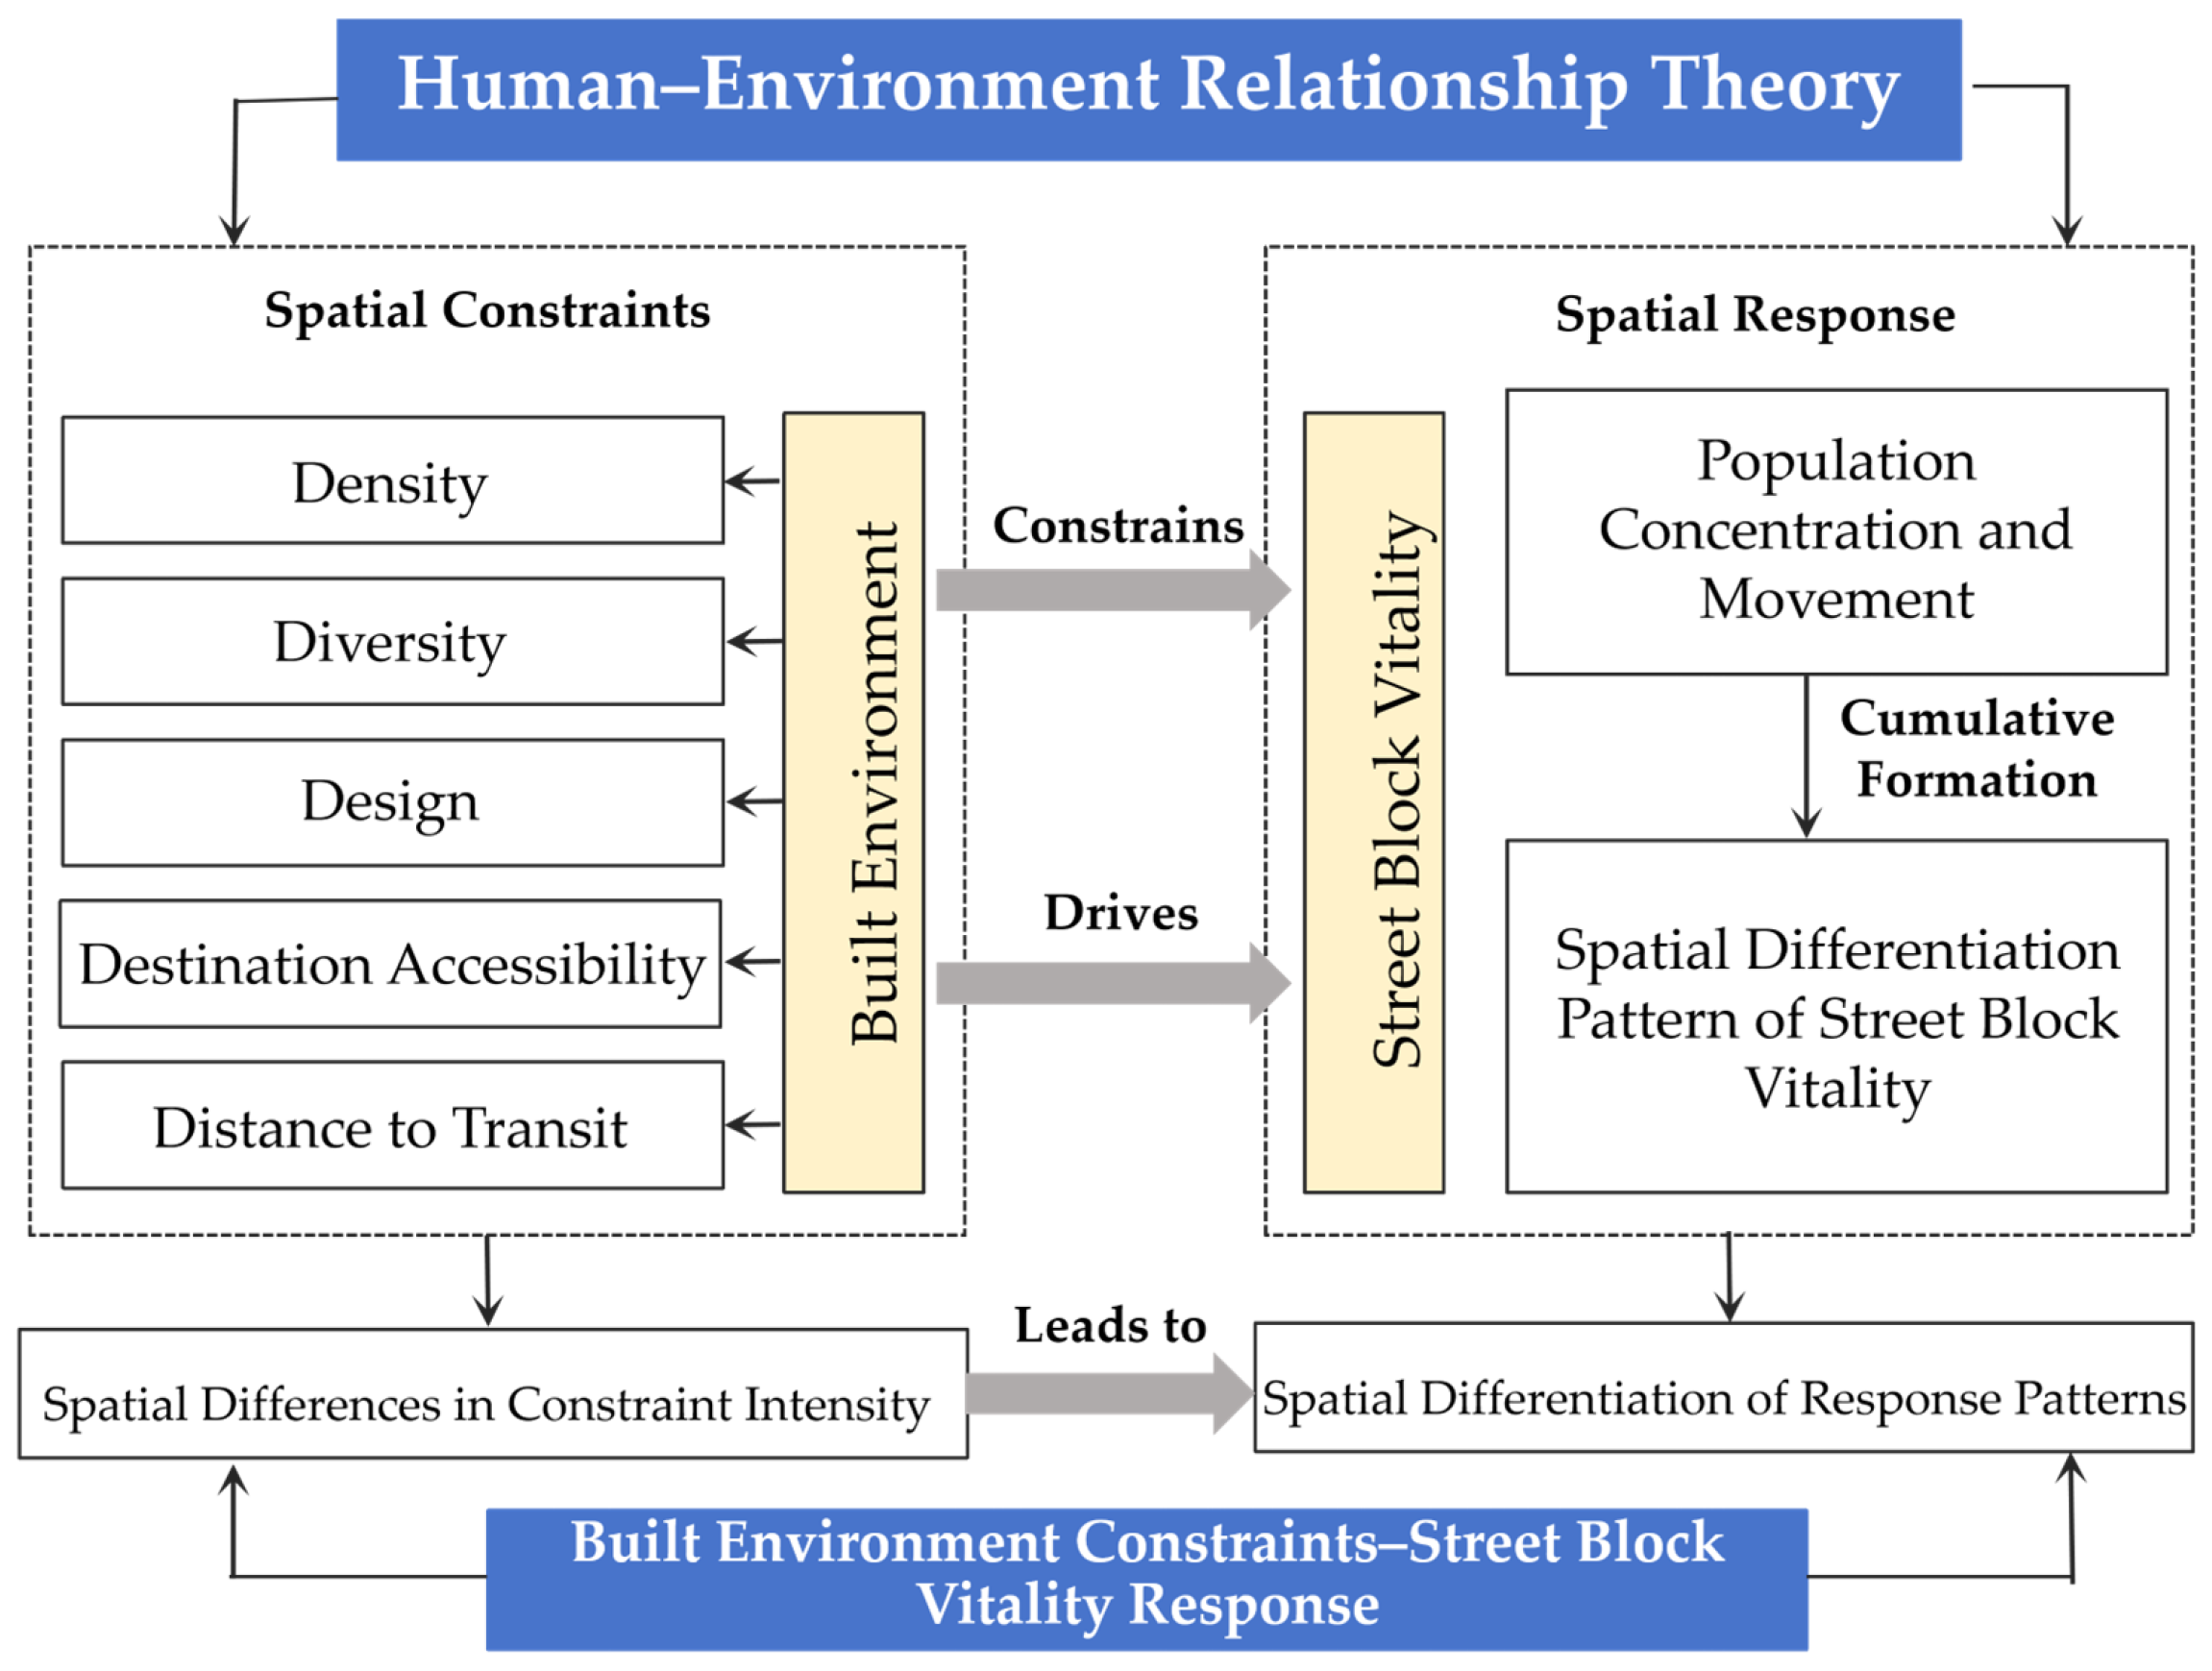
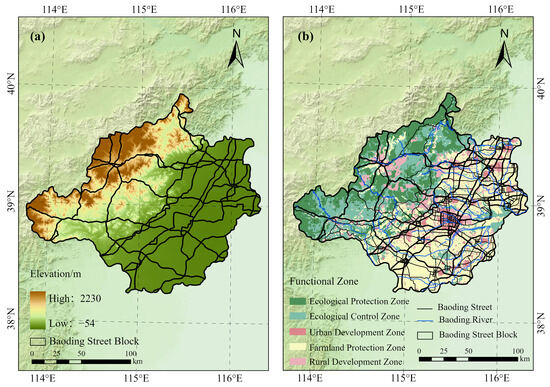
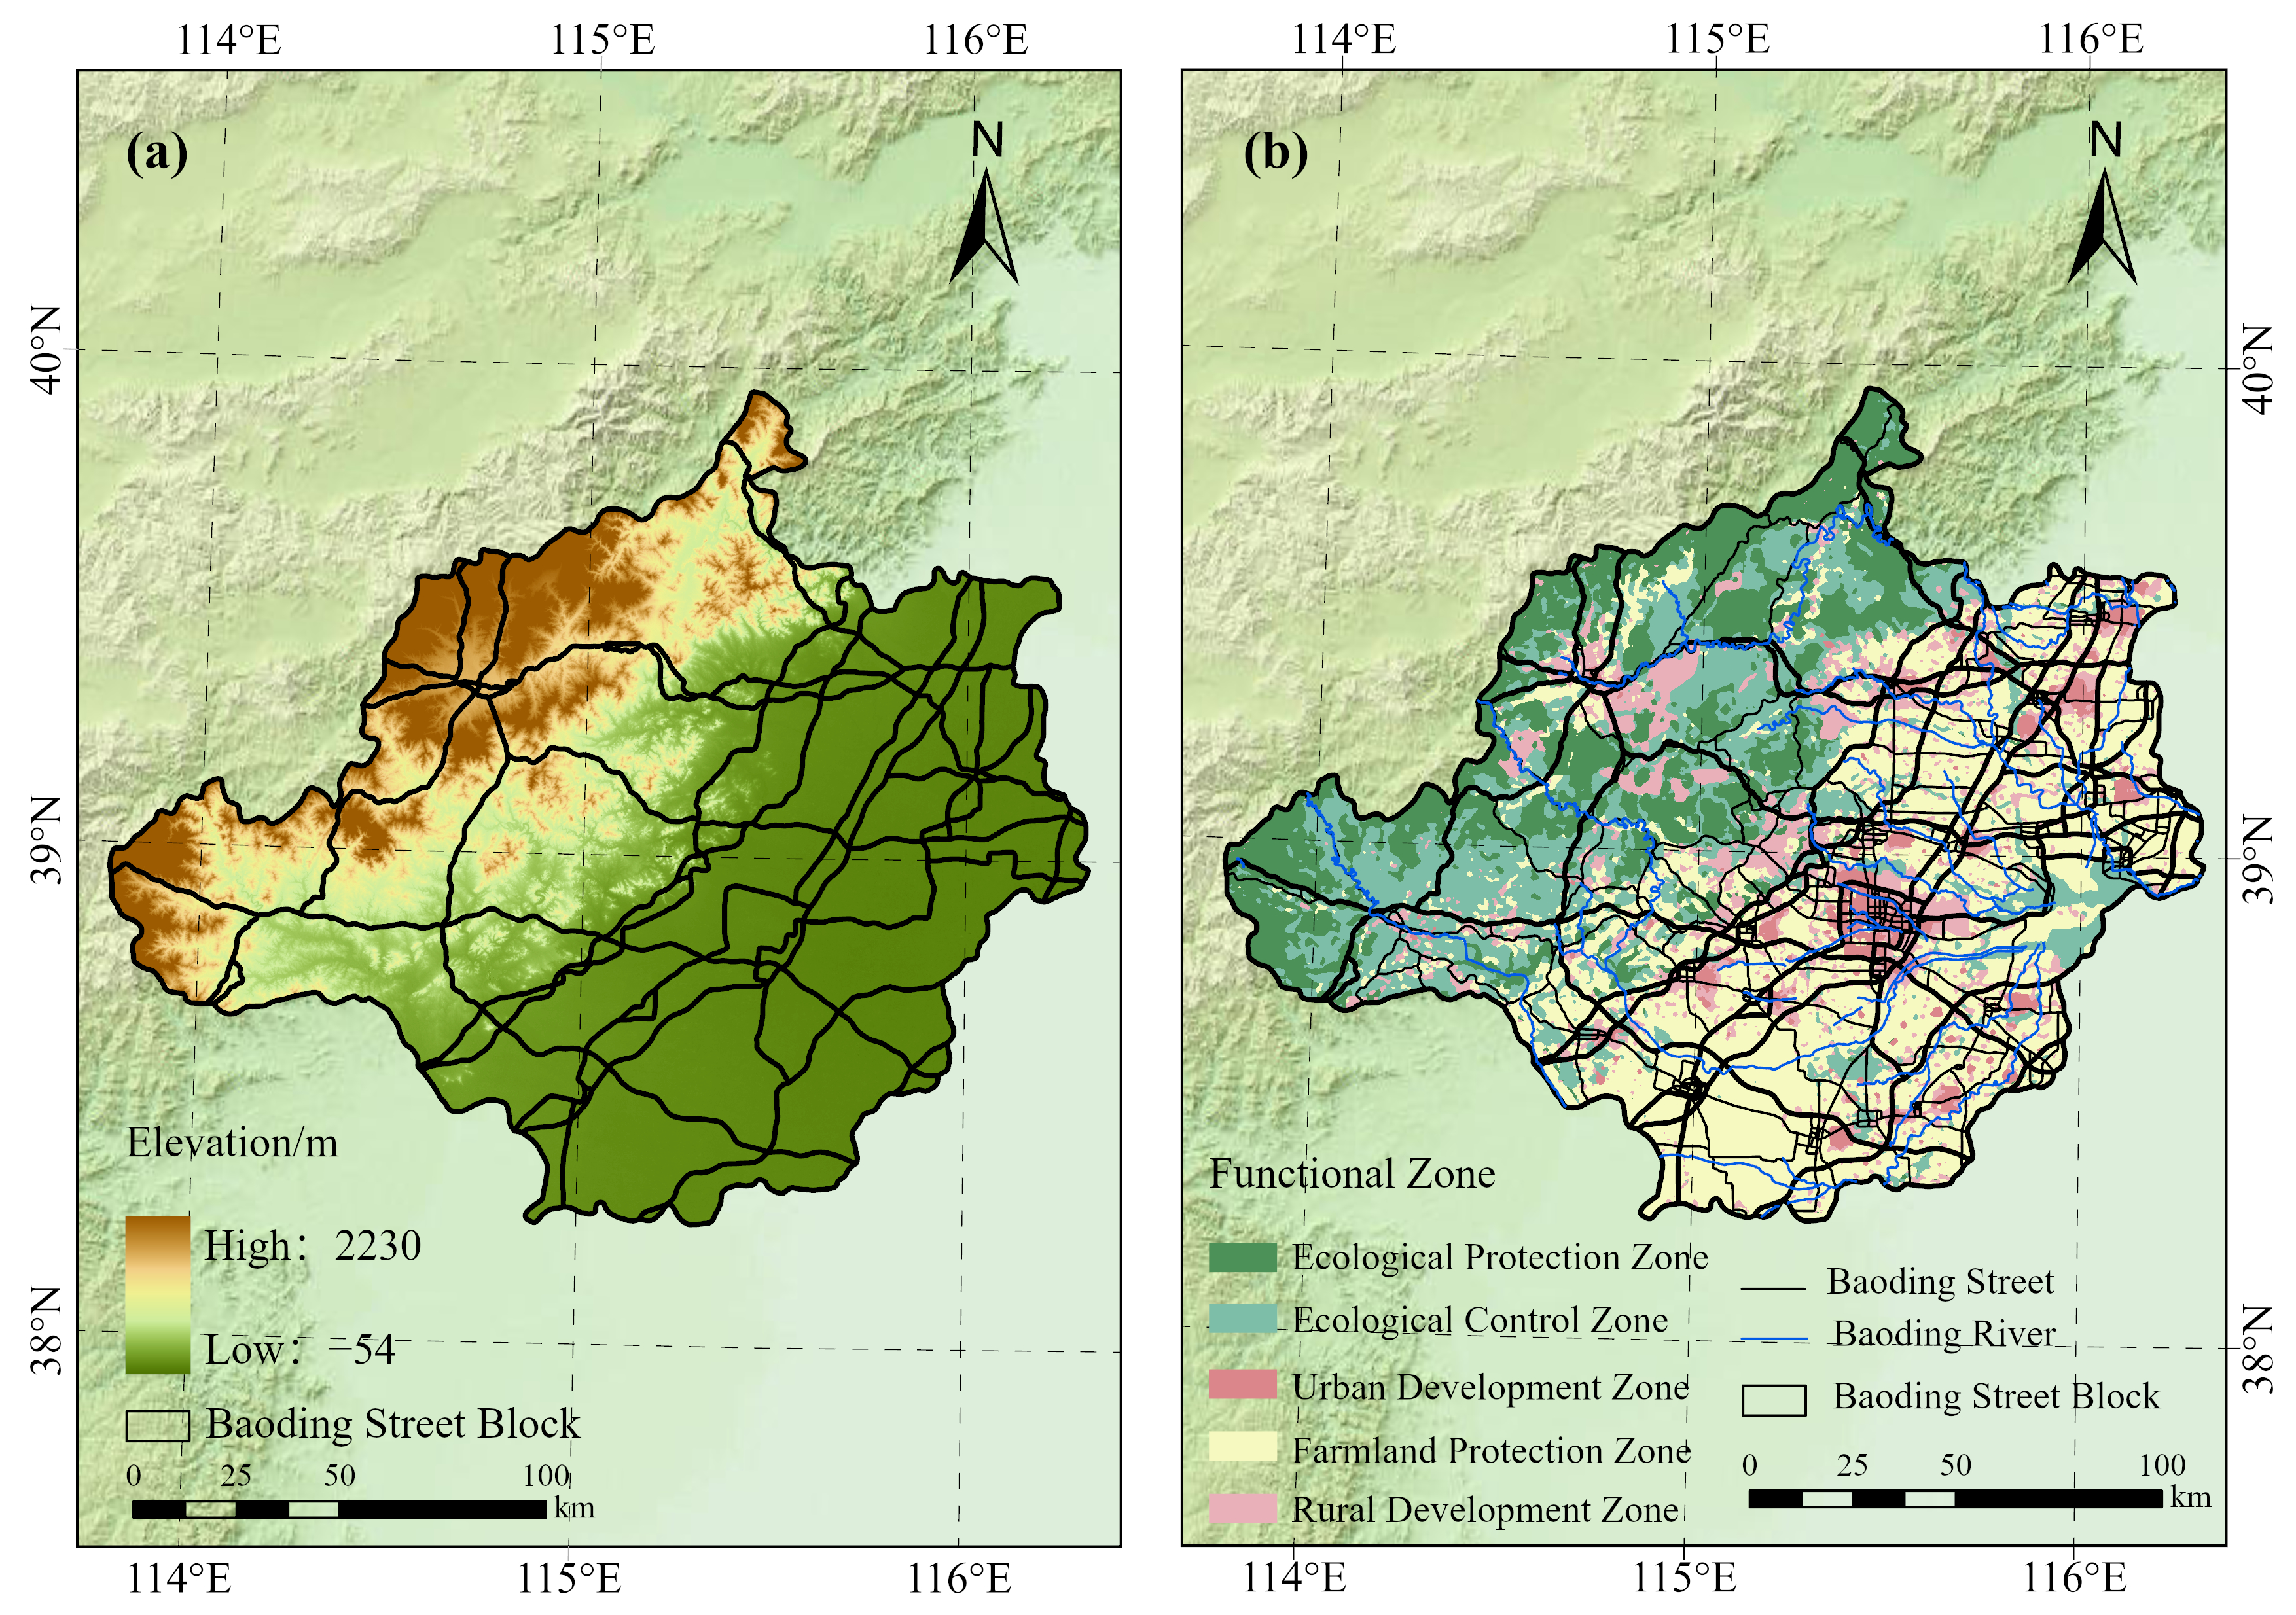
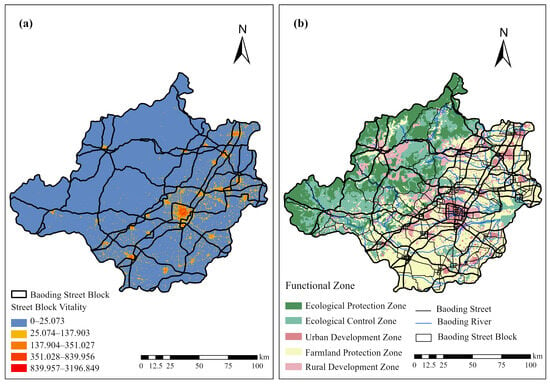
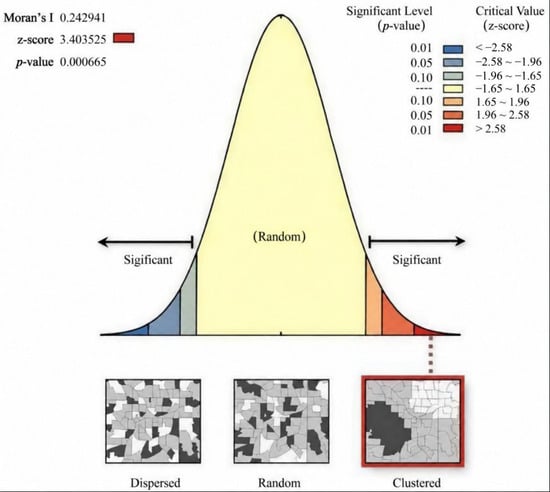
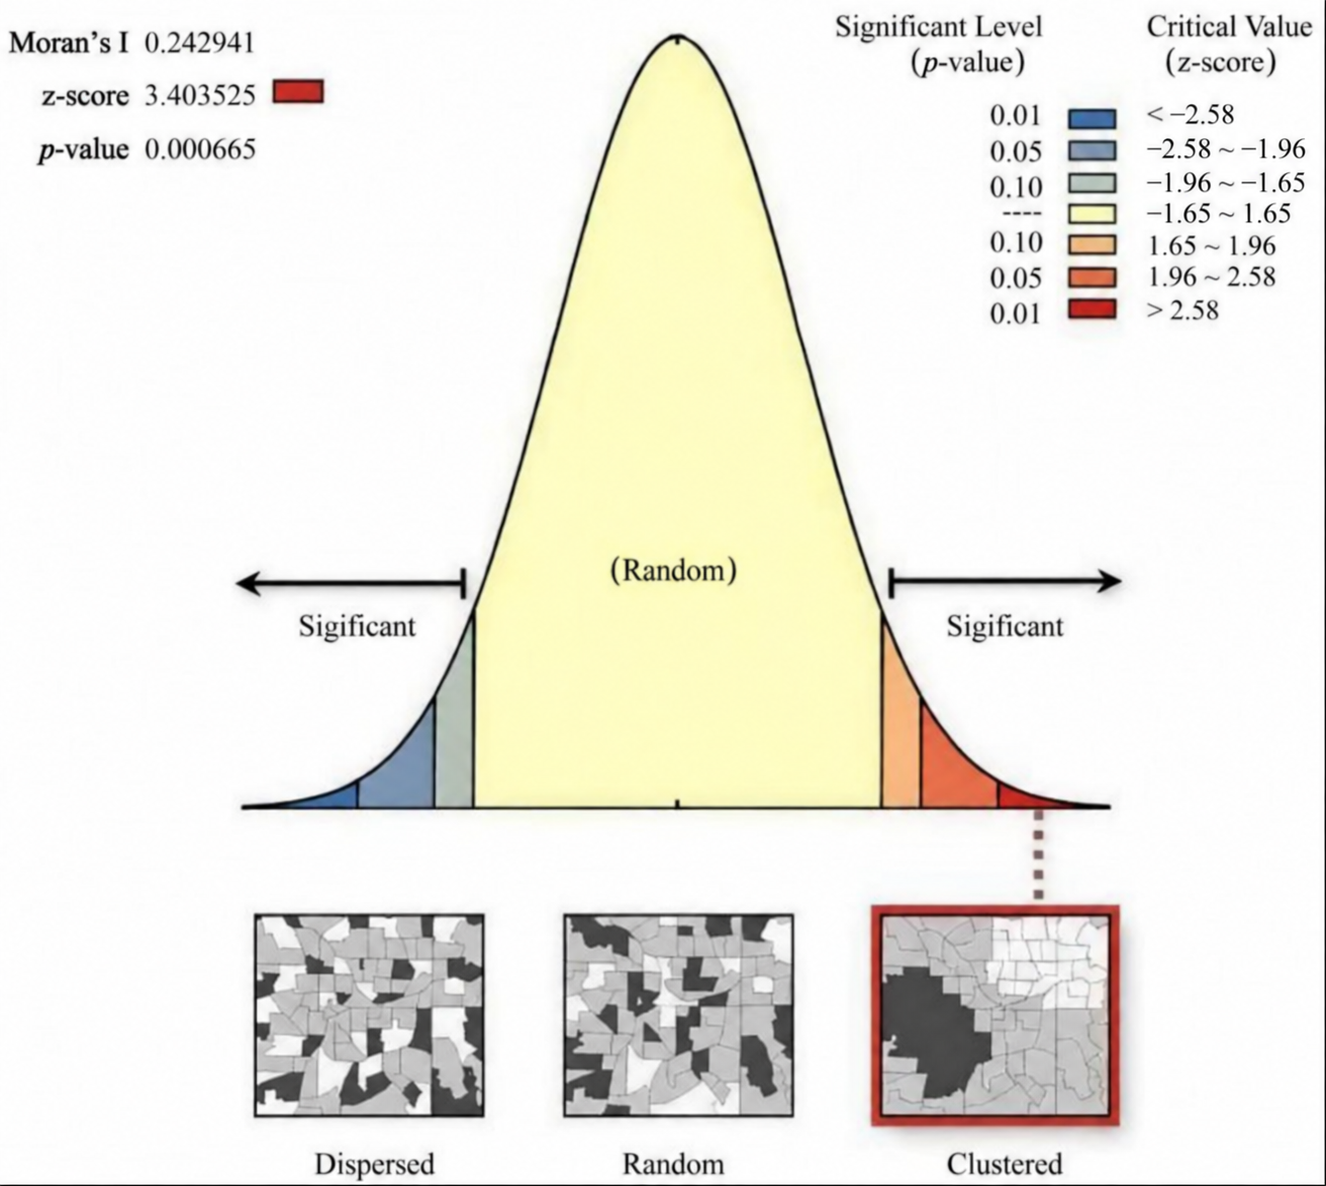
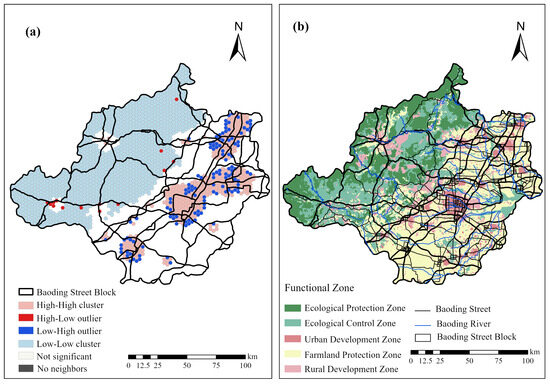
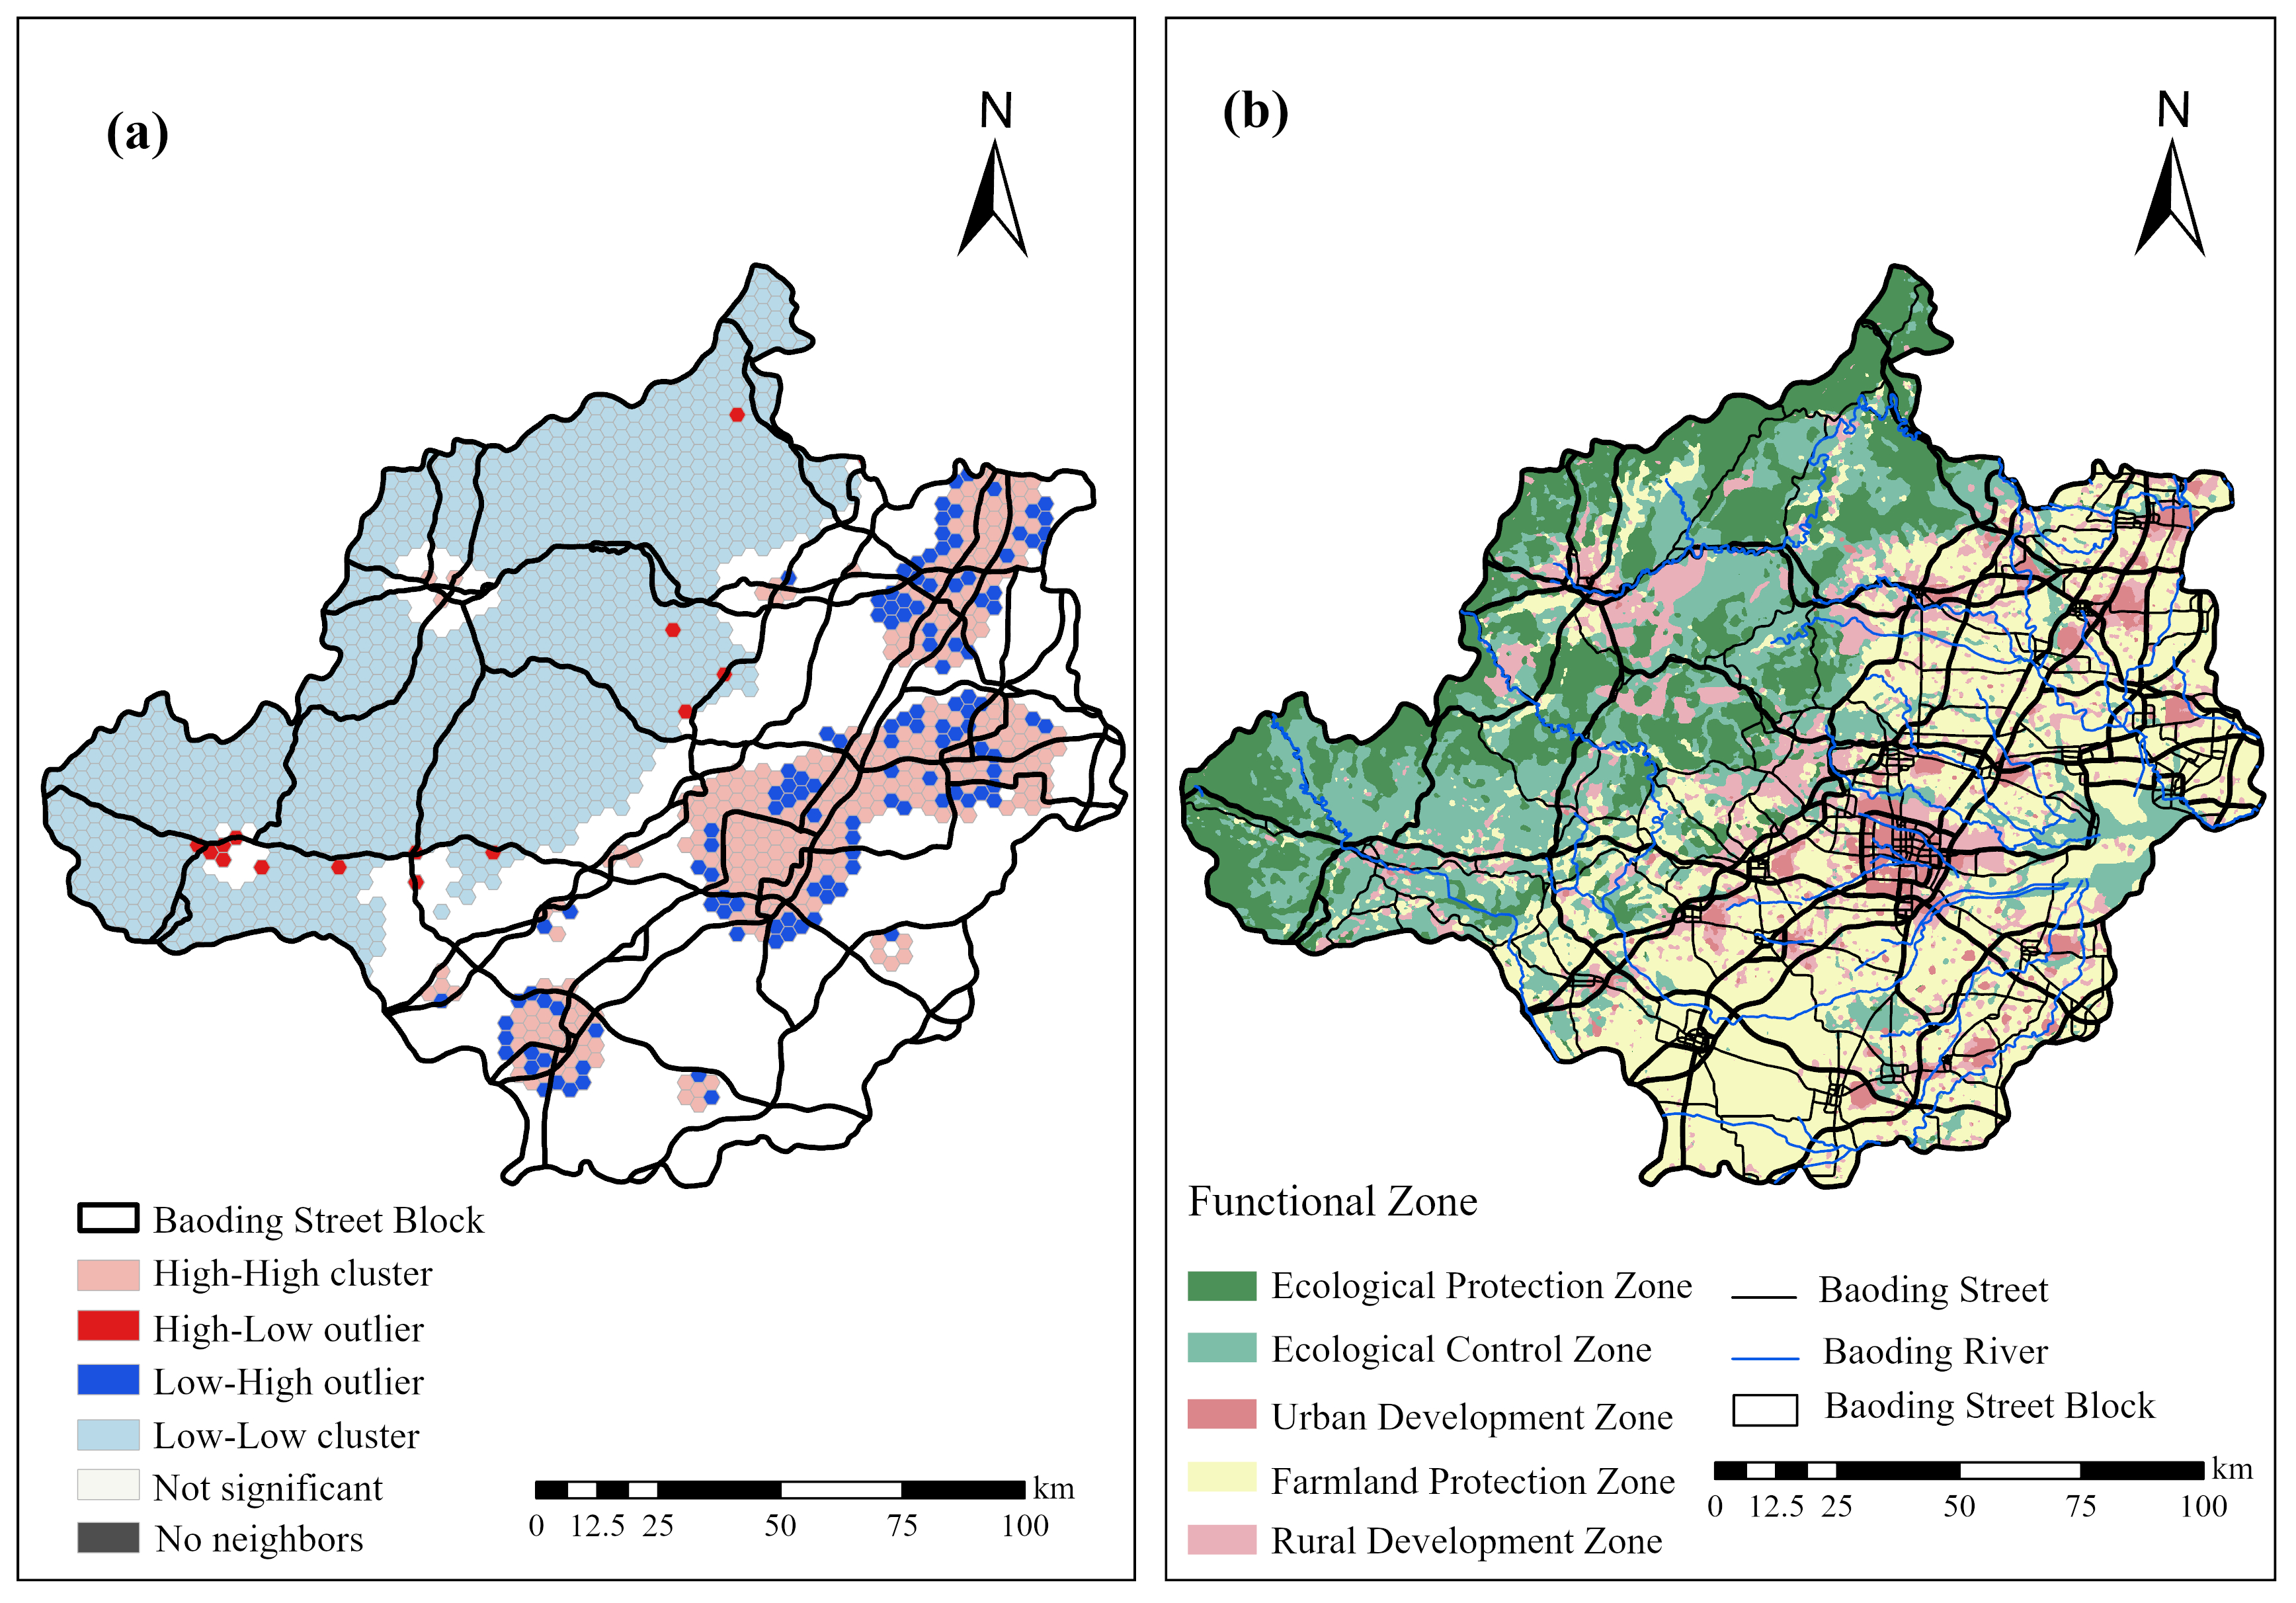
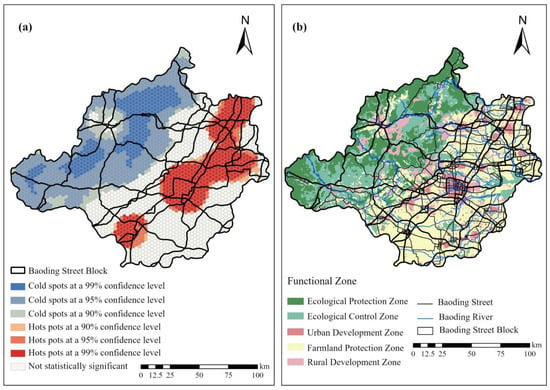
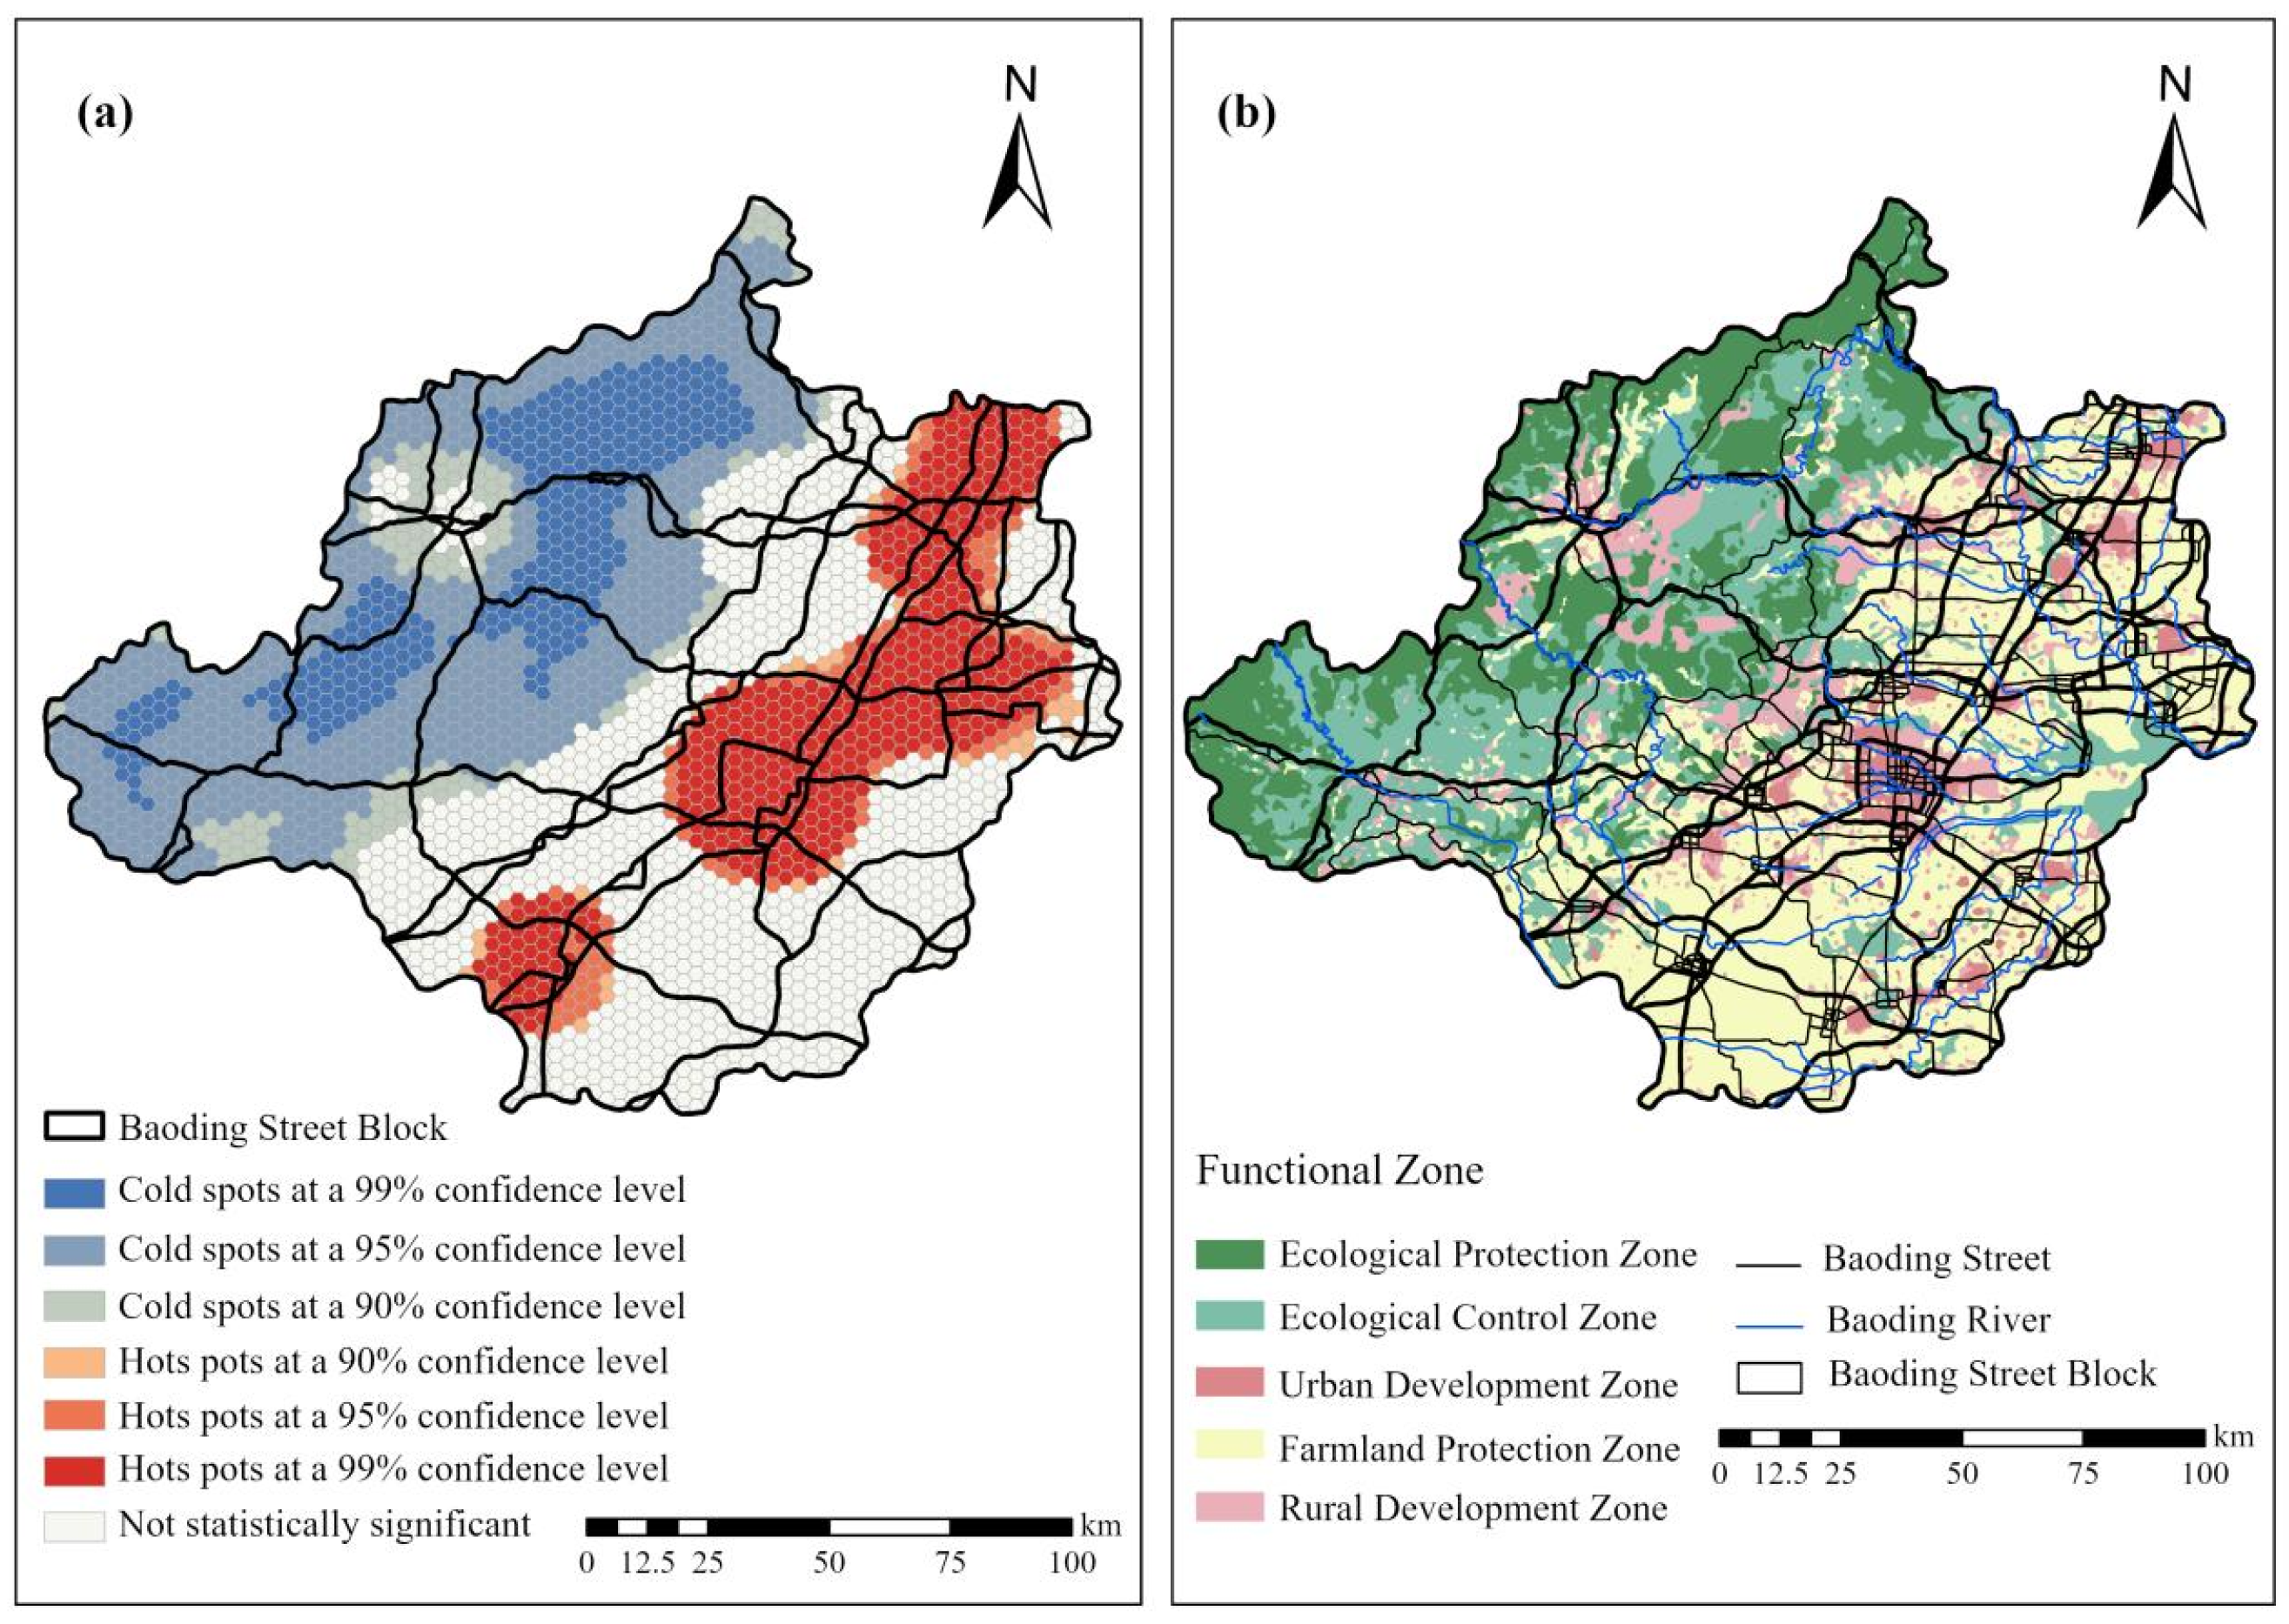
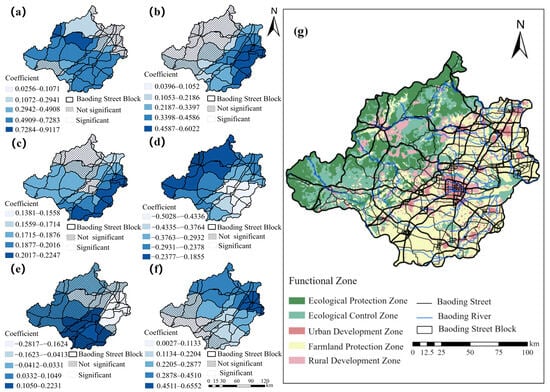
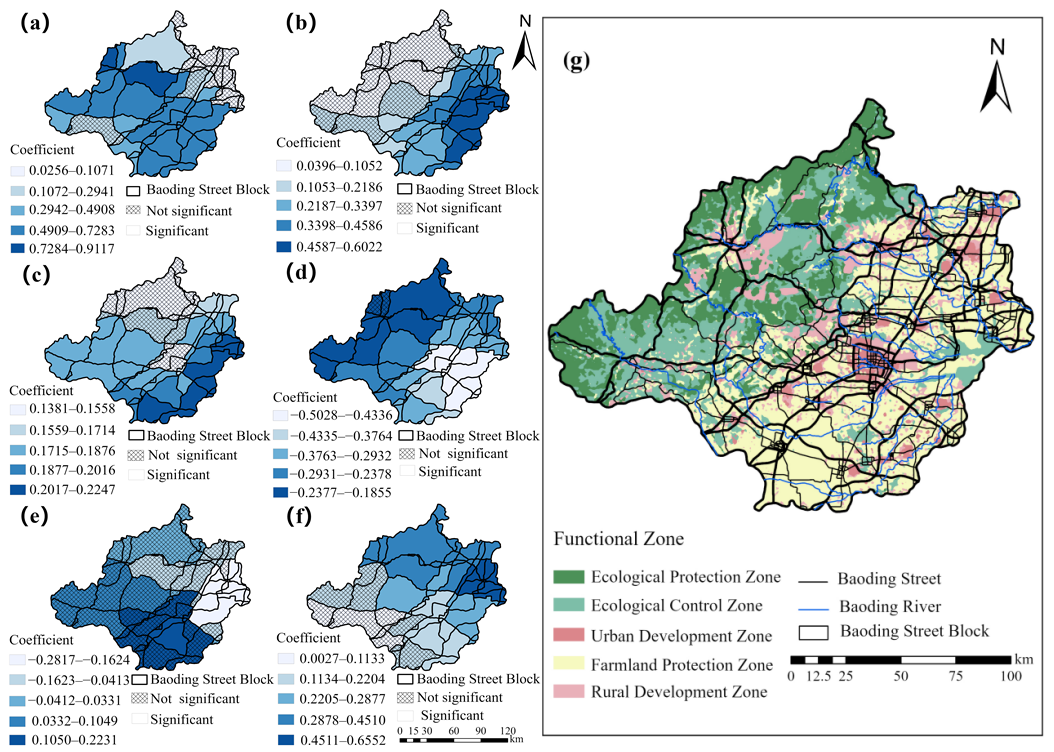

Disclaimer/Publisher’s Note: The statements, opinions and data contained in all publications are solely those of the individual author(s) and contributor(s) and not of MDPI and/or the editor(s). MDPI and/or the editor(s) disclaim responsibility for any injury to people or property resulting from any ideas, methods, instructions or products referred to in the content. |
© 2026 by the authors. Licensee MDPI, Basel, Switzerland. This article is an open access article distributed under the terms and conditions of the Creative Commons Attribution (CC BY) license.