


Abstract
Large-scale ecological restoration initiatives are increasingly central to global conservation agendas, yet their macroeconomic consequences on regional development remain scarcely debated. Exploiting China’s Shan-Shui Initiative as a quasi-natural experiment, this study systematically evaluates the causal impact of systemic environmental interventions on county-level economic growth. Using a comprehensive county-level panel dataset spanning 2005 to 2022 and a staggered difference-in-differences (DID) design with consideration of heterogeneous treatment effects, we find a significant economic dividend: the implementation of the project increases the GDP of pilot counties by approximately 6.72%. This growth premium is robust to propensity score matching, heterogeneity-robust estimators, and inference under approximately exogenous instruments. Mechanism analysis provides evidence consistent with two potential transmission channels: inter-sectoral factor reallocation—contraction in primary sector activities and expansion in secondary sector output—combined with intra-sectoral ecological development; namely, pollution reduction and the exit of heavily polluting firms. Notably, we find no evidence of significant tertiary sector upgrading and green technological innovation, suggesting that the initial phase relies on fiscal multipliers and regulatory mandates rather than innovation-driven transformation. Heterogeneity analysis further shows that economic benefits are weaker in the northeastern region and poverty-stricken counties, positively moderated by financial development, and dampened by government intervention. Our findings highlight the potential for joint optimization of environmental conservation and economic development while emphasizing the critical role of market-based financial allocation and institutional capacity-building in realizing the value of natural capital.
1. Introduction
Coordinating ecological conservation and economic development has emerged as one of the most profound and universal governance challenges worldwide [1,2,3,4,5]. For decades, ecological protection has been widely perceived as a constraint on economic growth, primarily because the institutional mechanisms to internalize ecological externalities and transform natural capital into productive assets remain underdeveloped. Thus, local governments face weak incentives to prioritize restoration, and private actors lack clear price signals to invest in green sectors, hindering progress toward the Sustainable Development Goals (SDGs) and the transition to a green economy.
As a large developing country, China has also experienced a particularly acute trade-off between economic growth and environmental protection. The country’s extensive development model, which has historically been reliant on ecological overexploitation, has generated substantial economic returns at the cost of severe environmental degradation, manifesting in carbon emissions, water pollution, and habitat loss [6,7]. In response, China has elevated ecological civilization to a national strategic priority and explicitly committed to a development pathway that harmonizes human activities with natural systems. Within this overarching framework, the Shan-Shui Initiative (integrated protection and restoration of mountains, rivers, forests, farmlands, lakes, grasslands, and deserts) stands out as a large-scale, systemic policy instrument designed specifically to bridge the gap between ecological governance and economic dynamism. Launched in 2016 and expanded through six successive batches, the project mobilizes over RMB 260 billion in public investment and covers more than 60,000 square kilometers of ecologically critical terrain.
Unlike conventional single-sector interventions, the Shan-Shui Project adopts a holistic, nature-based approach that integrates spatial planning, fiscal transfers, performance evaluation, and market-based mechanisms. Its core innovation lies in treating ecological restoration not as a fiscal burden but as a strategic investment that reshapes local comparative advantages, thus simultaneously improving environmental quality, attracting green industries, fostering eco-tourism, and enabling the monetization of ecosystem services through emerging carbon and water markets. By aligning central fiscal incentives with local ecological outcomes, the project attempts to internalize the positive externalities of conservation and to convert “lucid waters and lush mountains” into tangible economic returns. However, the specific macroeconomic impacts of the Shan-Shui Project on economic performance have not yet been systemically evaluated. Important empirical questions remain unanswered: Does implementing the Shan-Shui Project expand or constrain economic output? More importantly, if a growth premium is present, what are the primary causal channels and transmission mechanisms through which this environmental intervention operates? Answering these questions is essential to informing sustainable development policies and constitutes the core empirical objective of this study.
Our study contributes to the growing literature on large-scale ecological restoration and place-based environmental policies. Recent studies can be synthesized according to the ecological and economic impacts that they have focused on. Many scholars have explored the ecological effect of restoration or place-based environmental policies, and found they generally improve carbon sequestration, land use and ecosystem service values [8,9,10]. Other scholars have focused on the economic effects of these policies, they found that NKEFZ can significantly boost economic development [11], enhance economic resilience [12], and promote rural incomes [13].
A second stream of the literature related to our study focuses on the effects of environmental regulation on productivity and economic growth. Porter-supporting studies find that stricter regulation can raise green total factor productivity and green economic efficiency by stimulating innovation and industrial upgrading [14,15], while other studies have found environmental regulation improves productivity but depresses technology progress [16]. Some also explored different types of environmental regulations and environmental performance, and found that the relationship between command–control environmental regulations and green investment by heavily polluting enterprises presents an inverted “U” shape, and market incentive-based environmental regulations have no effect [17].
The literature most relevant to our study focuses on quantifying the outcomes of the Shan-Shui Project. The existing literature has largely focused on the ecological effects of this project. For example, Jiang et al. and Wang et al. [18,19] quantitatively evaluated the effectiveness of Shan-Shui Initiative and show that, after the implementation of Shan-Shui Initiative, ecosystem services improved significantly. Ren et al. [20] assessed the effectiveness of Shan-Shui Initiative through spatio-temporal analysis, and found a significant increase in ecological efficiency since 2015, with notable disparities among provinces. Shibo and Gui [21] estimated the impact of the Shan-Shui Project on land values, and found a significant negative impact on overall land transfer value.
A review of this literature reveals three primary research gaps. First, existing evaluations of large-scale ecological restoration and the Shan-Shui Initiative have focused on ecological outcomes (e.g., vegetation cover, carbon sequestration, soil conservation, water yield, habitat quality, and ecosystem service values) or economic effects (e.g., economic resilience, poverty reduction, and rural income), leaving the causal relationship between the Shan-Shui Initiative and county-level economic development underexplored. Second, the existing literature has not adequately opened the “black box” showing how ecological restoration affects regional economic performance. Although some studies on environmental regulation identify potential channels such as innovation, industrial upgrading, compliance costs, and crowding-out investment, few Shan-Shui studies have systematically examined the intermediate economic pathways through which restoration may influence economic performance. Third, prior research has paid insufficient attention to the institutional and spatial heterogeneities that condition the effectiveness of ecological restoration, particularly the roles of government–market relationships and financial development. This limits the external validity of existing findings and provides limited guidance for context-sensitive policy design.
This paper makes three main marginal contributions. First, compared to the existing literature, this study moves from ecological performance evaluation to macroeconomic effect identification. By referring to the recent econometric studies applying staggered policy evaluation in environmental taxes and outsourcing [22], innovative industrial clusters [23], and ESG ratings [24], we exploit the staggered rollout of the Shan-Shui Project across counties as a quasi-natural experiment and employ a rigorous staggered difference-in-differences design in an attempt to identify a causal relationship between the Shan-Shui Project and county-level GDP growth with multiple robustness checks (IV, PSM-DID, heterogeneous treatment effect estimators).
Second, compared with the environmental regulation literature, this study highlights that the Shan-Shui Project’s mechanisms may differ from those of traditional environmental regulation. We explore the potential transmission mechanisms through which the Shan-Shui Project affects economic performance, distinguishing between inter-sectoral factor reallocation, ecological industrial development, and green technological innovation. Our findings suggest that economic gains may arise from sectoral reallocation and compliance-driven pollution reduction, rather than structural productivity effects and innovation-driven green growth.
Third, we uncover institutional boundary conditions that moderate the effectiveness of ecological restoration, offering novel insights into the government–market nexus in green transition. We show that the policy’s economic returns are not uniform but are systematically amplified by financial depth and dampened by excessive government intervention. By interacting treatment effects with regional heterogeneity, poverty status, and institutional variables, we provide context-specific evidence that challenges the “one-size-fits-all” assumption prevailing in most ecological policy evaluations and highlights the critical importance of institutional complementarities in realizing the value of natural capital and sustainable economic development.
2. Policy Background and Theoretical Analysis
2.1. Policy Background
Decades of intensive industrialization and rapid urbanization across China have delivered substantial macroeconomic returns but have accumulated severe ecological deficits, manifesting as localized habitat fragmentation, systemic watershed degradation, and sharp declines in regional biodiversity. Historical environmental governance strategies predominantly relied on isolated, single-element conservation tools, such as the National Key Ecological Function Zone framework or the Natural Forest Protection Programme, targeting specific resource domains. However, these independent regulatory regimes frequently suffered from horizontal enforcement silos and structural coordination failures when addressing large-scale, cross-jurisdictional environmental degradation.
In response to these coordination failures, the central administration implemented an institutional paradigm shift based on the “community of life” framework. This conceptual reorientation led to the launch of the Shan-Shui Project in 2016, jointly managed by the Ministry of Finance, the Ministry of Natural Resources, and the Ministry of Ecology and Environment. The policy framework shifted from traditional, single-element remediation to an integrated governance network designed to manage multiple natural assets simultaneously. The initiative scaled up through successive planning phases. During the initial pilot phase from 2016 to 2018, the central government approved three successive batches comprising 25 large-scale projects. These operations targeted core ecological nodes, river basins, and mountain ranges across national strategic security zones, specifically the “Three Eco-zones and Four Belts.” The policy expanded further during the 14th Five-Year Plan period, moving from an experimental pilot phase to a mature, programmatic policy apparatus. By the mid-2020s, the program grew to encompass six distinct policy batches totaling 52 comprehensive construction projects. The cumulative geographic scope of these interventions spans 30 provinces, covering over 60,000 square kilometers of terrain along critical ecological lines. Backed by over RMB 260 billion in total funding and supported by RMB 103 billion in central fiscal allocations, the project has restored more than 1.2 billion mu of degraded terrain. By combining direct public capital allocations with strict spatial land-use regulations, the initiative aims to manage regional human–land conflicts and establish scalable funding models for global ecosystem restoration finance.
2.2. Theoretical Analysis and Research Hypotheses
2.2.1. Direct Transmission Channels: Public Capital Accumulation and Location Rents
As a typical public good, a beautiful ecological environment is non-excludable and non-rivalrous, which inherently leads to insufficient market supply. Moreover, the negative externalities associated with pollution by firms and individuals further exacerbate market failures in allocating ecological resources. The Shan-Shui Initiative is a systemic government intervention designed to correct these failures and transform the value of “lucid waters and lush mountains” into “golden hills and silver mountains.” Central and provincial-level finances provide substantial funding for ecological restoration projects, supporting direct cost expenditures such as afforestation, mine rehabilitation, and wetland restoration. These direct financial interventions stimulate the local economy through two primary economic mechanisms.
First, the capitalization of ecological factors is considered. The Shan-Shui Initiative is essentially a systematic restoration of regional ecological capital, accompanied by the revitalization and transformation of intrinsic ecological value [25]. The initiative converts environments with negative externalities, such as polluted water bodies, abandoned mines, and degraded forestlands, into ecological capital with positive productive value. This transformation first manifests in restoring and enhancing the ecosystem’s service capacity, improving the regional ecological environment. Simultaneously, this new form of natural capital enters the production function as a new production factor—clean water sources and fertile soil provide production conditions for modern agricultural development; stable climate and clean air provide essential locational conditions for environmentally sensitive industries such as data centers and biomedicine. Furthermore, ecological capital can empower traditional production factors; in particular, a superior ecological environment can reduce firms’ production and operation costs, and a livable natural environment can attract and retain high-quality human capital, thereby enhancing county-level total factor productivity and driving sustained local economic growth [26,27].
Second, the provision of high-order public services and the restructuring of locational comparative advantages are important. A good ecological environment can provide more eco-products and services for people [28]. Based on new economic geography and human capital theory, the high-quality ecological environment provided by the Shan-Shui Initiative constitutes a non-tradable, difficult-to-replicate, location-specific high-order public good. In a modern economy characterized by highly mobile factors, this public good forms a “core competitiveness” that attracts and retains high-end human capital [29]. Ultimately, the projects enhance the regional stock of ecological capital and reshape its “locational rent,” thereby granting the region a comparative advantage in attracting mobile factors such as capital, human talent, and technology, consequently fostering the emergence and agglomeration of industries. Their agglomeration not only directly generates knowledge spillovers and innovation vitality [30,31] but also fosters sustained demand for high-value-added modern service industries such as eco-cultural tourism, health and elderly care, and cultural creativity. This reshapes the county’s comparative advantage, propelling its transition from a “cost depression” reliant on cheap traditional factors to ecological and talent advantages, thereby driving substantive ecological improvement and the direct development of the county-level economy.
H1.
The implementation of the Shan-Shui Project exerts a direct positive shock on county-level economic development.
2.2.2. Indirect Impacts
The micro foundation that supports the county’s macroeconomic growth is factor accumulation, industrial upgrading, and technological progress [32]. By promoting the allocation of labor, capital, and other production factors toward higher-value-added technologies and industries, these mechanisms allow the national economy and per capita income to continuously improve. Drawing on industrial economics, the Shan-Shui Initiative may influence county-level economic development through three distinct mechanisms: inter-sectoral reallocation, ecological industrial development, and green technological innovation.
- Sectoral reallocation effect
On the one hand, strict ecological protection redlines and negative lists for industrial access constrain land-intensive agricultural expansion. This spatial restriction, while ecologically necessary, directly reduces output from traditional farming, forestry, animal husbandry, and fishery activities that rely on extensive land use, compressing primary sector activities and reallocating labor, capital, and other productive factors from low-productivity agriculture to higher-value-added industrial sectors [33]. On the other hand, massive public expenditures on ecological restoration, such as mine rehabilitation, wetland restoration, and afforestation, directly stimulate construction and environmentally oriented manufacturing, expanding secondary industry output through the investment multiplier effect [34,35]. This fiscal injection constitutes an exogenous demand shock that generates immediate GDP growth through hiring local labor, purchasing raw materials, and procuring supporting services. Simultaneously, in the tertiary industry, the development of niche cultural tourism models—such as eco-tourism, health and wellness retreats, and parent–child educational travel—broadens the development space for modern service industries, thereby ensuring the synergistic improvement of economic growth and environmental quality [36].
H2.
The Shan-Shui Project may promote county-level economic development through inter-sectoral reallocation from the primary toward the secondary or tertiary sectors.
- 2.
- Regulation-induced effect
One probable mechanism is ecological industrial development. According to the “Pollution Haven Hypothesis,” strict environmental regulations compel some polluting industrial enterprises to withdraw from ecological function zones and migrate to areas with low-intensity environmental regulations [37]. Some enterprises may meet their emission standards through end-of-pipe treatment, mandatory installation of pollution control equipment, and process adjustments, triggering the short-run compliance response effect. Meanwhile, reducing highly polluting, high-emission enterprises directly lowers aggregate emissions and frees up land, labor, and capital, reallocating them to more productive sectors such as construction, clean manufacturing, and eco-agriculture, thereby promoting aggregate output growth.
Another probable mechanism is that sustained and predictable regulatory pressure may stimulate green technological innovation through the “Porter hypothesis” channel [38]. Unlike traditional ecological governance models, the Shan-Shui Initiative is a comprehensive, systematic, long-term, and goal-oriented national project. By providing green investment and fiscal stimulus, the initiative provides firms and local governments with relatively stable policy expectations. Well-designed environmental regulations can stimulate an “innovation offset effect” by driving firms to innovate technologically, optimize resource allocation, and introduce advanced production processes and innovative talent [39], offsetting short-term compliance costs with long-term “innovation compensation gains” and ultimately promoting county-level economic growth. Technological improvements in green innovation can reduce unnecessary production and operating costs, thereby indirectly increasing corporate profits and improving economic performance [40].
H3a.
The Shan-Shui Project may promote county-level economic development through the ecological industrial development effect.
H3b.
The Shan-Shui Project may promote county-level economic development through the green innovation effect.
3. Methodology and Data
3.1. Identification Strategies
This study employs a staggered difference-in-differences (DID) approach to identify the causal impact of the Shan-Shui Project on county-level economic development. Specifically, counties that implement the Shan-Shui Project constitute the treatment group, while those without the project serve as the control group. By comparing economic development differences between these two groups before and after the policy’s implementation, we can estimate the net treatment effect. The baseline regression model is specified as follows:
where denotes the economic performance of county in year , and is the core explanatory variable, taking the value of 1 if county implements the Shan-Shui Project in year and thereafter, and 0 otherwise. represents a vector of county-level control variables reflecting socioeconomic and physical–geographical characteristics that both influence project implementation and economic performance. denotes county fixed effects to control for time-invariant unobserved characteristics, such as geographic location. represents year fixed effects to absorb time-varying macroeconomic shocks common to all regions. Finally, is the random error term. Standard errors are clustered at the county level in all regressions to account for potential serial correlation within counties.
The fundamental premise of the DID estimation is the parallel trends assumption: in the absence of the Shan-Shui Project, the economic development of the treatment and control counties would share a common time trend. However, the selection of pilot areas for the Shan-Shui Project is not random. It follows the strategic framework of national ecological security, primarily targeting national key ecological function zones, ecological protection redlines, and national nature reserves designated by territorial spatial planning. The overall layout comprehensively considers ecosystem integrity, the continuity of geographic units, and the sustainability of socioeconomic development. Consequently, pilot projects show a distinct spatial pattern. Most are located within the “Two-Screens and Three-Belts” (an ecological security strategy established by China; it refers to “The Qinghai–Tibet Plateau Ecological Barrier,” “The Loess Plateau–Sichuan–Yunnan Ecological Barrier,” “The Northeast Forest Belt,” “The Northern Sand-Prevention Belt,” and “The Southern Hilly and Mountainous Belt”) and major river basins, which form the core skeleton of China’s ecological security strategy. As the project’s distribution aligns closely with national key ecological function areas, the initiative plays a critical role in maintaining vital ecosystem functions. Consequently, pre-treatment differences between the treatment and control groups may lead to divergent developmental trajectories in later stages, potentially violating the parallel trends assumption.
The recent econometric literature on staggered policy evaluation has moved beyond the traditional two-way fixed effects (TWFE) DID estimator because heterogeneous treatment effects can bias or even reverse its estimates. To address this concern, we complement the TWFE specification with several heterogeneity-robust estimators, including the group-time average treatment effect estimator, stacked regression and local projections. We also conduct a Goodman–Bacon decomposition to diagnose the extent of heterogeneity bias in the TWFE estimate.
3.2. Variable Definitions and Descriptive Statistics
To clarify the assumed causal relationships and motivate our choice of control variables, Figure 1 presents a directed acyclic graph (DAG). The DAG distinguishes between four types of variables:
Figure 1.
Directed acyclic graph (DAG) of main variables.
- (1)
- Treatment and outcome variables. The outcome variable is measured by the natural logarithm of the county’s Gross Domestic Product (GDP). Treatment variable is a dummy variable reflecting whether the county implement Shan-Shui Project in a certain year. The central relationship of interest is represented by the solid arrow from Treatment D to Outcome Y. This path captures the total causal effect of the policy on county-level economic performance, which is the primary parameter of interest in this study.
- (2)
- Pre-treatment confounders. To mitigate estimation bias from this non-random selection process, this study assumes that the impact of the project’s selection criteria on the dependent variable follows a specific time trend. Following Li et al. [41], we add interaction terms between the Shan-Shui Project selection variables and linear, quadratic, and cubic time trends to the baseline regression model. Based on the National Ecological Protection and Construction Plan (2013–2020) and the specific characteristics of the “Two-Screens and Three-Belts,” this study classifies the variables influencing Shan-Shui Project selection into three categories. First, topographic relief captures the physical–geographical characteristics of county-level units. It serves as a key reference indicator for assessing regional topography and geomorphology. Second, natural resource endowment is measured by the proportions of farmland, grassland, and water areas, reflecting the core elements of the “mountains, rivers, forests, farmlands, lakes, and grasslands” ecosystem. Third, socioeconomic characteristics primarily capture National Poverty-Stricken County status and population density. Typically, higher population density implies greater anthropogenic disturbance, making an area less likely to be selected for the project. Specifically, this study uses base-period (2012) data on topographic relief; proportions of farmland, grassland, and water areas; poverty-stricken status; and population density as selection indicators. The interactions between these indicators and the time-trend terms are then added to the benchmark regression model.
- (3)
- Time-varying controls, such as temperature and precipitation, which affect the outcome but not treatment assignment and are included to improve precision, and
- (4)
- Potential mechanism variables, including sectoral reallocation, ecological industrial development, and green technology innovation, which may lie on the causal pathway from the policy to GDP and are therefore examined separately rather than included as controls, are also considered. The DAG also acknowledges the presence of unobserved policy targeting concerns, represented by dashed arrows, which we address through sensitivity analysis for unobserved confounding in the robustness check section.
Table 1 presents the definitions and descriptive statistics for the principal variables used in this study.
Table 1.
Main variable definitions and descriptive statistics.
3.3. Data Sources
- Socioeconomic Data. County-level socioeconomic data spanning 2005 to 2022 were sourced from the China County Statistical Yearbook. Additionally, we constructed a policy dummy variable for impoverished counties based on the official list of 665 National Key Counties for Poverty Alleviation and Development.
- Geospatial Data. Geospatial datasets encompass a 30 m × 30 m Digital Elevation Model (DEM) and a 1 km × 1 km land-use/land-cover (LULC) dataset; we calculated the areal shares of farmland, grassland, and water bodies within each county.
- Nighttime Light (NTL) Data. This study employed the harmonized DMSP-OLS and NPP-VIIRS nighttime light (NTL) dataset developed by Wu et al. [42]. We calculated the mean and total NTL intensity for each county. To mitigate heteroscedasticity, we used the natural logarithm of mean NTL intensity in the empirical estimates.
- Shan-Shui Project Data. To construct the county-level treatment variable, we first collected the official pilot county lists of the Shan-Shui Initiative from publicly disclosed documents issued by national and local Finance Bureaus and Natural Resources Bureaus. We then obtained county-level administrative boundary shapefiles from authoritative sources, including the Ministry of Civil Affairs’ National Administrative Division Information Query Platform and the Ministry of Natural Resources’ Standard Map Service. Using ArcGIS 10.8, we performed spatial overlay and intersection analyses to match the official project lists to county boundaries. A county was coded as treated if it was officially listed as a pilot county and its territory overlapped with a Shan-Shui Project boundary. Because county-level project boundaries are not always publicly available, we adopted a conservative coding rule: if a project is officially listed as covering a county, we treat the entire county as treated.
4. Empirical Results and Analysis
4.1. Baseline Results
Utilizing a county-level panel dataset, this study employs a staggered difference-in-differences model to investigate the causal impact of the Shan-Shui Initiative on local economic development. Table 2 presents the baseline regression results. Column (1) specifies a two-way fixed effects (TWFE) model, controlling for county and year fixed effects. To account for heterogeneous pre-treatment trajectories between the treatment and control groups, Column (2) incorporates interaction terms between the six baseline covariates (proportions of farmland, grassland, and water bodies; population density; impoverished county status; and topographic relief) and time trends. Column (3) further controls for time-varying socioeconomic variables (fiscal revenue and financial development) and meteorological characteristics (temperature and precipitation) to mitigate omitted variable bias. To isolate our estimates from the confounding effects of concurrent environmental policies, Column (4) introduces a dummy variable accounting for the implementation of the National Key Ecological Function Zone policy. Finally, Column (5) incorporates province-by-year fixed effects to absorb unobservable, time-varying macroeconomic shocks at the provincial level. Throughout all specifications, standard errors are clustered at the county level to account for potential serial correlation within counties.
Table 2.
Baseline regression results.
As shown in Table 2, the baseline coefficient in Column (1) is 0.013 but is not statistically significant. This is probably because Shan-Shui pilot counties were selected on the basis of ecological importance, and are therefore systematically located in areas with different topography, resource endowments, and initial economic conditions—the treatment and control groups exhibit heterogeneous pre-treatment trends. These differential trends introduce a downward bias in the simple TWFE estimate, rendering it statistically insignificant. Upon controlling for the interactive time trends of the baseline covariates in Column (2), this specification absorbs the differential pre-treatment trajectories that are correlated with the selection criteria, and the coefficient rises to 0.053 and becomes marginally significant. The inclusion of meteorological controls in Column (3) further increases the coefficient to 0.055 (significant at 1%), which peaks at 0.065 following the inclusion of the ecological function zone policy dummy in Column (4), which implies that the implementation of the Shan-Shui Initiative translates to a 6.72% increase in GDP of pilot counties relative to non-pilot areas. Given that the average GDP of the sampled counties from 2005 to 2022 is RMB 18.63 billion, this policy effect corresponds to an average absolute local GDP increase of RMB 1.25 billion. In Column (5), the inclusion of province-by-year fixed effects refines the coefficient to 0.041 (significant at 10%), further supporting the robustness of the positive policy effect.
Heterogeneous treatment effects pose a common challenge in staggered difference-in-differences models, primarily because policy implementation timing varies sequentially across counties participating in the Shan-Shui Project. Under a staggered adoption design, the overall two-way fixed effects estimator is a weighted average of three types of 2 × 2 DID comparisons. These comparisons include (1) earlier-treated counties versus later-treated counties; (2) later-treated counties versus already-treated counties; and (3) treated counties versus never-treated counties. The fundamental issue lies in the second comparison: using already-treated counties as controls for newly treated counties. Because treatment effects in earlier-treated counties may evolve over time (dynamic treatment effects), their outcome trends do not provide a valid counterfactual, biasing the TWFE estimator. Consequently, the severity of this bias depends on the weight assigned to this problematic 2 × 2 comparison. A substantial weight on the “later-treated versus already-treated” estimator can severely distort overall causal inference.
To evaluate the extent of this heterogeneity bias in our model, we apply the Goodman–Bacon [43] decomposition theorem. The diagnostic results are presented in Table 3. Crucially, the decomposition shows that the problematic “later-treated versus already-treated” comparison receives only 3.9% weight. This negligible weighting indicates that our baseline TWFE estimates are not severely contaminated by time-varying heterogeneous treatment effects. We also note that the “treated vs. never-treated” comparison receives a large weight (0.663) and has an average estimate of −0.006, while the “earlier-treated vs. later-treated” comparison has a positive average estimate (0.242) with a weight of 0.298. The overall TWFE estimate of 0.068 reflects the combination of these components, and the fact that the negative “treated vs. never-treated” component is offset by the positive “earlier-treated vs. later-treated” component. Figure 2 visually plots this decomposition.
Table 3.
Goodman–Bacon decomposition results.
Figure 2.
Goodman–Bacon decomposition of the TWFE estimator.
For further robustness, we re-estimate the causal effects using three advanced estimators designed to be robust to heterogeneous treatment effects: the group-time average treatment effect [44], stacked regression [45], and local projections [46]. As shown in Table 4, these heterogeneity-robust estimators remain highly consistent with the baseline TWFE estimates, strongly reaffirming the robustness of our findings.
Table 4.
Robust estimators under heterogeneous treatment effects.
4.2. Parallel Trend Test and Sensitivity Analysis
The validity of the difference-in-differences approach relies on the parallel trend assumption: in the absence of the Shan-Shui Project, the GDP trajectories of the treatment (pilot) and control (non-pilot) counties would evolve in parallel. To test this assumption, we employ the event study approach proposed by Jacobson [47]. The specific model is specified as follows:
where represents a set of dummy variables capturing the periods before and after the implementation of the Shan-Shui Project. Negative values of denote the years prior to the project’s implementation, while positive values indicate the post-implementation years. All other control variables remain the same as in Equation (1). Given the sample period, we establish an observation window spanning 6 years before and 5 years after implementation to examine the regression coefficients . If the estimated coefficients for the pre-treatment periods are not significantly different from zero, the parallel trend assumption holds.
Figure 3 presents the estimated coefficients and their 95% confidence intervals. The results show that in the pre-treatment periods, the estimates are not significantly different from zero, indicating that GDP growth trends in counties covered by the Shan-Shui Initiative and those not covered were statistically parallel before policy implementation. However, in terms of dynamic effects, the GDP-enhancing effect of the Shan-Shui Project was statistically insignificant in 2016. This likely reflects an implementation lag: the project’s economic benefits take time to materialize and stabilize as the policy progresses.
Figure 3.
Parallel trend test.
Roth et al. [48] highlighted the limitations of traditional pre-treatment parallel trend tests, noting that they often suffer from low statistical power and can yield biased causal estimates and distorted inferences. To address this issue, Rambachan and Roth [49] proposed a sensitivity analysis framework for potential violations of the parallel trend assumption. This approach utilizes pre-treatment data to bound the maximum potential deviation and constructs robust confidence intervals for the treatment effect that account for this permitted deviation. If the lower bound of the confidence interval remains strictly greater than zero under the maximum permissible deviation, the empirical findings are considered statistically robust to potential violations of the parallel trend assumption. We conduct a sensitivity analysis of the treatment effect’s parallel trends in the post-implementation periods. Figure 4 illustrates the sensitivity test results for the second year post-implementation under relative magnitude and smoothness restrictions, respectively. The policy’s economic enhancement effect remains robust under both bounding constraints. These results indicate that even allowing for moderate deviations from the parallel trend, the Shan-Shui Project continues to significantly promote county-level economic development.
Figure 4.
Sensitivity analysis of the parallel trend assumption (left: relative magnitude bounds; right: smoothness bounds).
4.3. Propensity Score Matching Difference-in-Differences (PSM-DID)
As real-world policy interventions rarely satisfy the conditions of random assignment, we employ propensity score matching to construct a more comparable control group for our robustness tests. To ensure robustness, we estimate the model using three distinct matching strategies: 1:5 nearest-neighbor caliper matching, radius matching, and kernel matching. After identifying the control samples that most closely resemble the treatment group’s baseline characteristics, we re-estimate the DID model. As reported in Table 5, the PSM-DID estimation results are highly consistent with those of the baseline model, further confirming the robustness of our findings.
Table 5.
PSM-DID regression results.
4.4. Robustness Tests
4.4.1. Placebo Tests
To ensure the validity of our identification strategy, we must rule out potential confounding effects of unobservable, time-varying county characteristics on the estimation results. To address this concern, we conduct placebo tests using two distinct permutation approaches. First, we randomize the treatment status across counties. Specifically, we randomly draw a number of pseudo-treatment counties equal to the actual number of Shan-Shui Project pilot counties and assign the remaining counties to the control group. We re-estimate the baseline model and repeat this permutation process 500 times. The results are presented in Figure 5 (left panel). Second, we maintain the actual treatment groups but randomize the policy implementation timing. For each iteration, we randomly select a pseudo-implementation year within the pre-treatment period (from 2005 to the year prior to actual implementation), re-estimate the model, and repeat the process 500 times. These results are shown in Figure 5 (right panel). The results from both placebo tests demonstrate that the distributions of the pseudo-estimated coefficients are strictly centered around zero. Furthermore, the actual baseline regression coefficient (indicated by the vertical dashed line, approximately 0.08) lies far outside these distributions. The placebo exercises provide additional evidence supporting the identification strategy, but they cannot fully rule out the presence of unobserved confounding factors.
Figure 5.
Placebo tests (left: randomized treatment groups; right: randomized policy timing; vertical dashed line: actual baseline regression coefficient).
4.4.2. Instrumental Variables Approach
Although the staggered difference-in-differences method can partially address the endogeneity concern to some extent, implementation of the Shan-Shui Project is inevitably influenced by numerous unobservable county-level factors that are difficult to fully control. We further follow Yu et al. [50] and use the interaction term between the treatment dummy variable and river density as an instrumental variable (IV) for the project’s implementation. Regarding the relevance condition, regions with high river density typically began industrialization and urbanization earlier because of the advantages of water transportation, irrigation, and water resource security. Consequently, these long-term, intensive development activities have likely accumulated more pronounced ecological and environmental issues—such as water pollution, soil erosion, and ecosystem degradation—making the need for ecological restoration more urgent. Therefore, during the planning and implementation of the Shan-Shui Project, the central government is more inclined to prioritize these high-river-density areas—characterized by high ecological pressure, urgent restoration needs, and critical ecological functions—thereby satisfying the relevance assumption of the IV. Regarding the exogeneity condition, river density is determined by natural geographical conditions and is approximately exogenous.
Column (1) of Table 6 reports the first-stage regression results, showing a significant positive relationship between the IV and implementation of the Shan-Shui Project. Column (2) of Table 6 presents the second-stage estimation results. The model successfully passes both the under-identification test and the weak instrument test. The second-stage estimation results reveal that the coefficient for the Shan-Shui Project remains significantly positive but larger than the baseline results, which may indicate that the instrumental variable estimate captures a local average treatment effect (LATE), suggesting that the Shan-Shui Project has a stronger effect in areas with higher river density. However, we acknowledge that the exclusion restriction for river density is difficult to verify and may be violated through channels such as agricultural mechanization, agricultural output, and urbanization. To assess the sensitivity of our IV estimates to mild violations of the exclusion restriction, we follow Conley et al. [51] and implement the plausexog procedure, which allows the instrument to have a bounded direct effect on the outcome and constructs confidence intervals that remain valid under approximate exogeneity. Across a wide range of plausible violations, the confidence intervals for the Shan-Shui Initiative coefficient between 0.435 and 0.681 remain strictly positive, indicating that the positive policy effect is robust to moderate departures from full exogeneity. Nevertheless, we interpret the IV as the complementary evidence to the baseline rather than definitively resolving the endogeneity problem.
Table 6.
Instrumental variable regression results.
4.4.3. Alternative Measure of the Dependent Variable
To further verify the robust impact of the Shan-Shui Project on county-level economic development, we substitute GDP with average nighttime light intensity as the dependent variable. As shown in Column (1) of Table 7, the implementation of the Shan-Shui Project significantly increased nighttime light brightness in the pilot counties, corroborating the baseline findings.
Table 7.
Results of other robustness tests.
4.4.4. Winsorization of Dependent Variable
To eliminate the potential influence of outliers, we winsorize the continuous dependent variable at the 1st and 99th percentiles and re-estimate the model. The results, presented in Column (2) of Table 7, remain highly consistent with the baseline estimates, further demonstrating the reliability of our conclusions.
4.4.5. Shortening the Sample Window
The original sample spans from 2005 to 2022. As the first batch of Shan-Shui Project pilots was launched in 2016, the pre-treatment period may be disproportionately long. To ensure robustness, we restrict the observation window to a symmetric five-year period before and after implementation (2011–2021). As reported in Column (3) of Table 7, the estimated coefficient remains significantly positive.
4.4.6. Accounting for Lagged Effects
As the economic impact of the Shan-Shui Project may take time to materialize, we lag the treatment variable by one period to account for potential delayed effects. The results in Column (4) of Table 7 confirm that even after adjusting for implementation lags, the Shan-Shui Project continues to significantly promote county economic development.
4.4.7. Consider Spillover Effect
To ensure that our baseline DID estimates are not contaminated by cross-county spillovers, we re-estimate the model after excluding non-pilot counties that are adjacent to pilot counties. The rationale is that these adjacent counties may be affected by the policy through labor mobility, industrial relocation, or ecological amenity spillovers, which would contaminate the control group. The results in Column (5) of Table 7 show that the baseline results remain robust after excluding these adjacent counties.
4.4.8. Sensitivity Analysis for Unobserved Confounding
We follow Masten and Poirier [52] (2026) and implement regsensitivity, which reports the sign-change breakdown point. The result shows a delta of 88.4%, meaning that unobserved confounders would need to be approximately 88.4% as important as observed covariates to reverse the sign of the estimated effect. Although this value falls below the conventional threshold of 1, it remains substantial, suggesting that the estimate is not easily overturned by unobserved confounding. Three considerations further support this interpretation. Nevertheless, we acknowledge that sensitivity analysis cannot completely rule out the possibility that unobserved factors may still influence the results. We therefore interpret our estimates as robust to moderate, but not arbitrary, violations of the parallel trends assumption while recognizing that residual identification risk remains.
4.5. Mechanism Analysis
Drawing on existing theoretical frameworks, we focus on two potential transmission mechanisms for county-level economic development. By expanding Equation (1), we construct the following mechanism model:
where represents the mechanism variable, and all other variables are identical to those in Equation (1). We emphasize that Equation (3) estimates the effect of the treatment on potential mediators, not the effect of the mediators on the outcome. A formal mediation analysis would require additional assumptions and identification strategies, such as sequential ignorability or instrumental variables for the mediators. We therefore interpret the following results as evidence consistent with potential transmission channels rather than as definitive proof of causal mediation.
4.5.1. Mechanism I: Sectoral Reallocation Effect
According to the theoretical framework above, we applied the data from the China County Statistical Yearbook to measure the sector reallocation: the primary-to-secondary industry ratio, the secondary-to-tertiary industry ratio, the gross agricultural output value (including agriculture, forestry, animal husbandry, and fishery), and the gross output value of industrial enterprises above the designated size. The regression results are reported in Columns (1) to (4) of Table 8.
Table 8.
Mechanism test results: Industrial structural transformation.
The results show that the project significantly reduces both the primary-to-secondary industry ratio and the gross output value of the agricultural sector. Meanwhile, the secondary-to-tertiary industry ratio and the output value of enterprises above the designated size in pilot counties increased significantly by 10.6% and 32.7%, respectively, compared to non-pilot counties. This result is partially consistent with H2, reflecting that the project’s infrastructure investments may stimulate construction and environmentally oriented manufacturing, potentially generating a strong short-term GDP pull effect.
We further explored whether the project will promote industry upgrading by applying the overall industrial structure upgrading index [53] (the industrial upgrading index is constructed as a weighted sum of the output shares of the three sectors; the index assigns a weight of 1 to the primary sector, 2 to the secondary sector and 3 to the tertiary sector), but found no evidence (as shown in Column (5) of Table 8). These results more accurately reflect inter-sectoral reallocation than structural productivity improvement, suggesting that sector reallocation has not yet translated into a qualitative upgrading toward higher-value-added sectors such as modern services or high-technology manufacturing. A likely explanation is that higher-value-added tertiary industries such as eco-tourism, health and wellness, and cultural creativity depend heavily on population density, consumption capacity, and supporting infrastructure. In practice, the value-realization channels of these products remain highly immature at the county level. They require well-functioning markets to price and trade ecosystem services, transparent certification systems for green products, and effective branding and marketing infrastructure to connect local ecological assets with external consumer demand.
4.5.2. Mechanism II: Regulation-Induced Effect
- Ecological Industrial Development
We use data from Chinese A-share listed companies covering 2007–2022 extracted from the CSMAR database and supplemented with corporate annual reports, corporate social responsibility (CSR) reports. We construct six county-level corporate indicators: total carbon emissions, solid waste incineration emissions, wastewater treatment emissions, and land-use conversion emissions (from forest to industrial land), and the number of heavily polluting (in this study, heavily polluting enterprises are defined in accordance with the Guidelines for the Industry Classification of Listed Companies revised by the China Securities Regulatory Commission (CSRC) in 2012, alongside the Classified Management Directory of Environmental Verification for Listed Companies (Huanbanhan [2008] No. 373) and the Guidelines for Environmental Information Disclosure of Listed Companies (Huanbanhan [2010] No. 78) issued by the Ministry of Environmental Protection (MEP); specifically, this classification encompasses 16 heavily polluting industries, primarily including coal, mining, textiles, leather tanning, papermaking, petrochemicals, pharmaceuticals, chemical manufacturing, metallurgy, and thermal power) and clean energy enterprises (according to the Statistical Classification of Energy Conservation, Environmental Protection and Clean Industries (2021) issued by the National Bureau of Statistics (NBS), the clean industry sector encompasses eight major domains: nuclear power, wind energy, solar energy, biomass energy, hydropower, smart grids, other clean energy sectors, and the clean and efficient utilization of traditional energy). The regression results are presented in Columns (1) to (6) of Table 9.
Table 9.
Mechanism test results: Ecological industrial development effect.
The implementation of the Shan-Shui Project significantly mitigates corporate carbon emissions, solid waste, wastewater discharges, and land-use emissions, while also significantly decreasing the number of heavily polluting enterprises. This finding is consistent with H3a, but we find no evidence for H3b that clean energy enterprises did not show a statistically significant change, possibly because the entry of clean energy firms is constrained by complex market factors such as technological costs, supply chain integration, and financing accessibility.
- 2.
- Green Technological Innovation
We next examine whether the Shan-Shui Project stimulated green technological innovation, measured by the total number of green patent applications, green invention patent applications, and green utility model patent applications at the county level. As shown in Table 10, the coefficients for all three patent indicators are statistically insignificant. We find no evidence of a measurable ‘innovation offset’ effect in the short to medium term, contrary to the Porter hypothesis. The Shan-Shui Initiative’s failure to promote green technological innovation may reflect the inevitable short-term conflict between high-intensity administrative regulation and weak county-level innovation foundations. Enterprises must allocate resources to compliance expenditures for survival rather than R&D investments; even if they intend to transform, they remain constrained by talent and capital bottlenecks. This does not signify policy failure but reveals that the transmission from environmental regulation to technological innovation requires a more lenient institutional buffer, a longer cultivation period, and supporting mechanisms like green finance and talent support. Only when the long-term benefits of the “innovation offset” gradually exceed the short-term burden of “compliance costs” will the inflection point of green patent growth truly arrive. Therefore, our evidence does not support the narrative of innovation-driven green growth. More precisely, the short-term economic effect is more consistent with compliance responses and pollution reduction than with green patents or the expansion of clean-energy firms.
Table 10.
Mechanism test results: Green technology effect.
4.6. Heterogeneity Analysis
4.6.1. Regional and Poverty Status Heterogeneity
Table 11 reports the results of the heterogeneity analysis by region and poverty status. Column (1) uses the east region as the reference group. The coefficient on the Shan-Shui Project captures the baseline policy effect for the east region, which is positive and statistically significant (0.103 ***). The interaction terms between the central and west regions and the Shan-Shui Project are positive but statistically insignificant, indicating that the policy’s economic growth effect in these regions does not differ significantly from that in the east region. However, the interaction term for the northeast region is significantly negative at the 1% level, suggesting that the economic growth effect in pilot counties in the northeast is significantly lower than in the east region. The net policy effect for the northeast is approximately −0.449, implying that the initiative may even be associated with downward pressure on economic growth in this region. A plausible explanation is that the northeast region has a heavy industrial and resource-dependent economic structure, so ecological red lines impose stronger compliance costs on traditional sectors and accelerate their contraction. At the same time, population outflow, weak private-sector vitality, limited green finance, and high fiscal dependence make it difficult to replace shrinking traditional activities with new green industries.
Table 11.
Results of heterogeneity analysis: Regional characteristics.
The coefficient of Column (2) for the Shan-Shui Project represents the baseline policy effect for non-poverty counties, which is positive and significant. The interaction term between poverty-stricken counties and the Shan-Shui Project is significantly negative at the 1% level, indicating that the economic growth effect in poverty-stricken counties is significantly weaker than in non-poverty counties. This implies that in less-developed areas, the project’s positive ecological improvements have not yet translated into economic returns, likely because value-realization mechanisms such as functional ecosystem service markets, green finance channels, and entrepreneurial capabilities to capitalize on improved environmental quality are lacking.
4.6.2. Moderating Effects: Government Intervention and Financial Development
We next investigate the institutional boundary conditions that moderate the policy’s effectiveness, specifically examining the roles of government intervention intensity and financial development. Government intervention is measured by the ratio of local government fiscal expenditure to GDP, and financial development is measured by the ratio of year-end financial institution loan balances to GDP. We estimate models that include the interaction terms between the Shan-Shui Project dummy and each moderator variable. The regression results are reported in Table 12.
Table 12.
The results of the heterogeneity analysis: Government intervention and financial development.
Column (1) of Table 12 reveals that government intervention exerts a significant negative moderating effect on the policy’s economic outcomes. High-intensity government intervention often misaligns resource allocation with market demands and fosters corporate reliance on policy subsidies rather than market competition. In counties with high intervention intensity, local governments, often driven by political performance goals or rent-seeking interests, may divert funds to image projects or non-productive programs, undermining the efficiency of fund utilization. Public choice theory suggests that higher government intervention implies greater rent-seeking space and greater deviation of resource allocation from the social optimum. However, when local governments over-intervene by designating industrial directions, setting investment thresholds, or providing selective subsidies, they may compress the space for spontaneous exploration by market entities.
Column (2) of Table 12 reveals that financial development exerts a significant positive moderating effect. After the Shan-Shui Initiative improves regional ecological quality, enterprises need to invest capital for industrial conversion—for example, constructing eco-agricultural bases, developing health and wellness tourism facilities, or purchasing clean production equipment. These investments involve high upfront costs and long payback periods. Without credit support, enterprises could hardly initiate them using only their own funds. A developed financial system, through term transformation and risk-sharing mechanisms, provides “patient capital” for these long-cycle green projects, allowing the value of “lucid waters and lush mountains” sufficient time to translate into cash flow. Financial development not only provides funds but also—through market-based interest rates, post-loan supervision, and default-handling mechanisms—imposes effective governance constraints on enterprises, ensuring that green investment truly translates into output growth.
5. Discussion and Conclusions
Using Chinese county-level panel data from 2005 to 2022 and treating the Shan-Shui Initiative as a quasi-natural experiment, this study uses a staggered difference-in-differences approach to evaluate the causal effect of large-scale ecological restoration on county-level economic growth. This study provides evidence that the Shan-Shui Initiative significantly increases pilot counties’ GDP by 6.72%, extending the literature beyond its predominant focus on ecological outcomes.
A key contribution of this study lies in identifying the potential transmission mechanisms through which this growth effect operates. We find that the economic dividend may arise from the contraction of primary sector activities and the expansion of industrial output, coupled with reduced emissions and the exit of polluting firms. This pattern is consistent with economic gains being associated with compositional shifts across sectors, rather than with structural productivity effects or innovation-driven green growth. This mechanism differs from the conventional “regulation–innovation offset” logic emphasized in much of the environmental regulation literature. Unlike traditional environmental regulation policies, the Shan-Shui Initiative is an ecological restoration program that relies primarily on administrative regulation and fiscal investment. Its institutional design naturally favors generating visible ecological and economic outcomes quickly through administrative mandates and fiscal resources, but it lacks the market-based incentives and institutional infrastructure needed to foster structural upgrading and technological innovation. This finding enriches the Porter debate by showing that policy type matters; compensation-oriented and incentive-based restoration policies can generate economic effects through mechanisms distinct from those of strict environmental regulation. It also suggests that the economic effects of integrated restoration may unfold in phases: early-stage gains come from sectoral reallocation and pollution reduction, while innovation-driven and service-led upgrading may take longer.
Furthermore, our study reveals important institutional boundary conditions that moderate the policy’s economic returns. We find that financial depth amplifies the growth effect, whereas excessive government intervention dampens it. This contrasts with studies that assume homogeneous policy effects or focus solely on regulatory intensity. The Shan-Shui Project relies on local government organization and fiscal allocation, but its economic returns are not uniformly positive across regions. Regions with stronger financial development and more market-oriented institutions are better able to turn ecological restoration into green investment and economic growth, while regions with excessive government intervention may suffer from resource misallocation, inefficient project implementation, or crowding out of social investment. This finding challenges the “one-size-fits-all” assumption in ecological policy evaluation and highlights the critical role of government–market complementarities in sustainable development.
Another important question is whether the observed economic gains justify the Shan-Shui Project’s substantial fiscal costs. The project examined in this study involved a total investment of approximately CNY 2 billion, including central financial awards and local matching funds. Our estimates suggest that, if GDP growth is sustained over multiple years, cumulative economic returns could partially offset the initial fiscal outlay, particularly in counties where the project stimulated industrial output and attracted follow-up investment. However, the short-term growth effect may be modest relative to the upfront cost, especially in counties with weak financial depth or excessive government intervention, where converting ecological investment into productive economic activity is less efficient. This suggests that the cost-effectiveness of the Shan-Shui Project is not automatic but depends on local institutional and financial conditions.
Our findings suggest three policy implications. First, policymakers should actively promote industrial structural optimization and the upgrading effects of the Shan-Shui Project. Local governments should use ecological restoration as a platform to attract high-value-added, environmentally sensitive industries, such as clean manufacturing, biopharmaceuticals, and data-related services, that can benefit from improved environmental quality and generate stronger productivity spillovers.
Second, policymakers should design mechanisms that shift firms from compliance-driven ecological development toward genuine technological innovation and strengthen county-level innovation ecosystems by investing in talent programs, vocational and technical training, industry–university–research collaboration, and intellectual property protection, so that local firms can gradually build the capacity to generate green patents. Third, policymakers should shift the Shan-Shui Initiative from a fiscally driven program toward an endogenous, market-incentive-based development mechanism. This includes establishing clear property rights, reliable GEP accounting, functional ecosystem service trading platforms, and credible green certification systems. Local governments should shift from direct resource allocation toward rule-making, while central transfers should catalyze market development rather than replace it.
Several limitations should be acknowledged. First, our analysis focuses on county-level GDP as the main economic outcome, which captures aggregate economic performance but may obscure distributional effects within counties, such as changes in employment structure, income inequality, or household welfare. Future research could use firm- or household-level data to examine who benefits from the growth dividend. Second, despite employing a staggered difference-in-differences design with multiple robustness checks and sensitivity analysis, we cannot fully exclude the possibility that unobserved factors correlated with pilot-county selection and economic trends may bias our estimates. Unobserved time-varying factors correlated with both SSI selection and county economic growth, such as concurrent infrastructure investments, administrative capacity, or local political dynamics, could bias our estimates. Our analysis assumes that the effect of the project’s selection criteria on the outcome follows a specific time trend (linear, quadratic, and cubic), which may not fully capture nonlinear or discontinuous selection processes. As such, future research should therefore further investigate the potential impact of unobservables on the conclusions. Third, the economic returns of large-scale restoration may take longer to materialize, and short-term estimates may understate or overstate the long-term effects. Future research should extend the observation window and examine the dynamic trajectories of economic outcomes over longer periods. Fourth, we attempt to formally estimate spatial spillover effects using spatial econometric models with alternative spatial weight matrices (contiguity, inverse distance, and economic distance). Unfortunately, the spatial auto-regressive parameters fail to converge in several specifications, likely due to the large number of counties and the high dimensionality of the weight matrices. We also note that excluding adjacent counties only addresses cross-county spillovers and does not eliminate intra-county spillovers, which we discuss as one of limitations. Finally, more granular cost data would allow for a more precise cost–benefit analysis and help to identify which types of investment generate the highest economic returns.
Author Contributions
D.W.: writing—original draft, conceptualization, formal analysis, methodology, and visualization; Y.W.: formal analysis and methodology; X.L.: funding acquisition and investigation. All authors have read and agreed to the published version of the manuscript.
Funding
The author(s) declare that financial support was received for this work. The main funding sources for this research are the National Natural Science Foundation of China (72503090; 72474095) and Jiangsu Planning Office of Philosophy and Social Science (23EYC021).
Data Availability Statement
The data supporting this study’s findings come from multiple publicly available sources and proprietary databases. County-level socioeconomic data are available from the China County Statistical Yearbook, published by the Department of Rural Socioeconomic Survey, National Bureau of Statistics of China. The harmonized DMSP-OLS and NPP-VIIRS nighttime light dataset is available via the Harvard Dataverse at https://doi.org/10.7910/DVN/GIYGJU [42]. Geospatial data, including the Digital Elevation Model (DEM) and land-use/land-cover (LULC) data, can be obtained from the Geospatial Data Cloud (http://www.gscloud.cn) and the Resources and Environmental Scientific Data Center (http://www.resdc.cn). Micro-level enterprise data on carbon emissions, fossil fuel combustion, and solid waste incineration for Chinese A-share listed companies were extracted from the CSMAR database (https://data.csmar.com). Due to institutional restrictions and the proprietary nature of the CSMAR database, the micro-level enterprise data are not publicly available but can be accessed through a license agreement with CSMAR. The aggregated data and code required to replicate the main findings of this study are available from the corresponding author upon reasonable request.
Conflicts of Interest
The authors declare that this work was conducted in the absence of any commercial or financial relationships that could be construed as potential conflicts of interest.
References
- Tallis, H.; Kareiva, P.; Marvier, M.; Chang, A. An ecosystem services framework to support both practical conservation and economic development. Proc. Natl. Acad. Sci. USA 2008, 105, 9457–9464. [Google Scholar] [CrossRef] [Scilit] [PubMed]
- Griggs, D.; Stafford-Smith, M.; Gaffney, O.; Rockström, J.; Öhman, M.C.; Shyamsundar, P.; Steffen, W.; Glaser, G.; Kanie, N.; Noble, I. Sustainable development goals for people and planet. Nature 2013, 495, 305–307. [Google Scholar] [CrossRef] [Scilit] [PubMed]
- Bastan, M.; Ramazani Khorshid-Doust, R.; Delshad Sisi, S.; Ahmadvand, A. Sustainable development of agriculture: A system dynamics model. Kybernetes 2018, 47, 142–162. [Google Scholar] [CrossRef] [Scilit]
- Criollo, R.; Malheiros, T.; Alfaro, J.F. Municipal environmental management indicators: A bottom-up approach applied to the Colombian context. Soc. Indic. Res. 2019, 141, 1037–1054. [Google Scholar] [CrossRef] [Scilit]
- Halkos, G.; Gkampoura, E.C. Where do we stand on the 17 Sustainable Development Goals? An overview on progress. Econ. Anal. Policy 2021, 70, 94–122. [Google Scholar] [CrossRef] [Scilit]
- Christensen, J.M.; Olhoff, A. Emissions Gap Report 2019; United Nations Environment Programme (UNEP): Gigiri Nairobi, Kenya, 2019. [Google Scholar]
- Yang, Q. Do vertical ecological compensation policies promote green economic development: A case study of the transfer payments policy for China’s National Key Ecological Function Zones. Econ. Syst. 2023, 47, 101125. [Google Scholar] [CrossRef] [Scilit]
- Lu, F.; Hu, H.; Sun, W.; Zhu, J.; Liu, G.; Zhou, W.; Zhang, Q.; Shi, P.; Liu, X.; Wu, X.; et al. Effects of national ecological restoration projects on carbon sequestration in China from 2001 to 2010. Proc. Natl. Acad. Sci. USA 2018, 115, 4039–4044. [Google Scholar] [CrossRef] [Scilit] [PubMed]
- Yang, H.; Mu, S.; Li, J. Effects of ecological restoration projects on land use and land cover change and its influences on territorial NPP in Xinjiang, China. Catena 2014, 115, 85–95. [Google Scholar] [CrossRef] [Scilit]
- Lyu, F.; Tang, J.; Olhnuud, A.; Hao, F.; Gong, C. The impact of large-scale ecological restoration projects on trade-offs/synergies and clusters of ecosystem services. J. Environ. Manag. 2024, 365, 121591. [Google Scholar] [CrossRef] [Scilit] [PubMed]
- Chen, S.; Hou, M.; Wang, X.; Yao, S. Transfer payment in national key ecological functional areas and economic development: Evidence from a quasi-natural experiment in China. Environ. Dev. Sustain. 2024, 26, 4075–4095. [Google Scholar] [CrossRef] [Scilit]
- Wang, Y.; Wang, Y.; Wu, J.; Ma, L.; Deng, Y. Impact of national key ecological function areas (NKEFAs) construction on China’s economic resilience under the background of sustainable development. Forests 2024, 15, 1531. [Google Scholar] [CrossRef] [Scilit]
- Wen, H.; Shang, J.; Zhang, G. Does ecological sustainability policy promote rural income? Evidence from China’s key ecological function areas. Humanit. Soc. Sci. Commun. 2025, 12, 1929. [Google Scholar] [CrossRef] [Scilit]
- Fan, M.; Yang, P.; Li, Q. Impact of environmental regulation on green total factor productivity: A new perspective of green technological innovation. Environ. Sci. Pollut. Res. 2022, 29, 53785–53800. [Google Scholar] [CrossRef] [Scilit] [PubMed]
- Ye, Z.; Liu, Y.; Rong, Y. How environmental regulations affect green total factor productivity—Evidence from Chinese cities. Sustainability 2024, 16, 3010. [Google Scholar] [CrossRef] [Scilit]
- Liu, H.; Gao, J.; Tian, P.; Ma, X.; Meng, G.; Yang, J.; Li, Z. The impact of environmental regulation on productivity with co-production of goods and bads. Energy Econ. 2023, 125, 106818. [Google Scholar] [CrossRef] [Scilit]
- Wang, Z.; Wang, N.; Hu, X.; Wang, H. Threshold effects of environmental regulation types on green investment by heavily polluting enterprises. Environ. Sci. Eur. 2022, 34, 26. [Google Scholar] [CrossRef] [Scilit]
- Jiang, Y.; Shan, X.; Liu, Q.; Feng, Y.; Lai, Y.; Xu, K.; Wang, J.; Bai, Z.; Feng, X. Evaluating the effectiveness of the Shan-Shui Initiatives in China. Geogr. Sustain. 2025, 6, 100271. [Google Scholar] [CrossRef] [Scilit]
- Wang, B.; Che, L.; Dai, C.; Zheng, L.; Li, Z.; Wang, X. The impacts of China’s Shan-Shui initiative on ecosystem services: A case study in the Three Gorges reservoir area. Ecosyst. Health Sustain. 2025, 11, 0398. [Google Scholar] [CrossRef] [Scilit]
- Ren, Y.; Zhang, Y.; Shi, Y.; Fan, X.; Cao, Y. Assessing the effectiveness of large-scale ecological restoration programs: A spatiotemporal analysis of ecological efficiency in forest and landscape restoration. J. For. Res. 2026, 37, 68. [Google Scholar] [CrossRef] [Scilit]
- Shibo, Z.; Gui, J. The cost of ecological protection and restoration: Evidence from the impact of the Shan-shui project on land values. Land Use Policy 2026, 164, 107919. [Google Scholar] [CrossRef] [Scilit]
- Wang, Q.; Sun, X.; Xiong, H.; Wang, Q.; Zhang, B. Environmental taxes, environmental outsourcing, and pollution abatement: Evidence from Chinese industrial sewage discharge enterprises. Energy Econ. 2024, 133, 107480. [Google Scholar] [CrossRef] [Scilit]
- He, F.; Hu, L.; Wang, R.; Chen, L. The Effect of Innovative Industrial Clusters on Carbon Emission Efficiency: A Staggered DID Approach. Econ. Anal. Policy 2026, 93, 969–985. [Google Scholar] [CrossRef] [Scilit]
- Zhang, L.; Xu, S.; Chen, J.; Li, H.; Huo, J. The impact of ESG ratings on corporate overseas performance: A quasi-experiment based on a staggered DID model. Econ. Anal. Policy 2025, 88, 1453–1466. [Google Scholar] [CrossRef] [Scilit]
- Ouyang, Z.; Song, C.; Zheng, H.; Polasky, S.; Xiao, Y.; Bateman, I.J.; Liu, J.; Ruckelshaus, M.; Shi, F.; Xiao, Y.; et al. Using gross ecosystem product (GEP) to value nature in decision making. Proc. Natl. Acad. Sci. USA 2020, 117, 14593–14601. [Google Scholar] [CrossRef] [Scilit] [PubMed]
- Sultana, T.; Dey, S.R.; Tareque, M. Exploring the linkage between human capital and economic growth: A look at 141 developing and developed countries. Econ. Syst. 2022, 46, 101017. [Google Scholar] [CrossRef] [Scilit]
- Liu, D.; Wang, G.; Sun, C.; Majeed, M.T.; Andlib, Z. An analysis of the effects of human capital on green growth: Effects and transmission channels. Environ. Sci. Pollut. Res. 2023, 30, 10149–10156. [Google Scholar] [CrossRef] [Scilit] [PubMed]
- Gao, X.; Huang, B.; Hou, Y.; Xu, W.; Zheng, H.; Ma, D.; Ouyang, Z. Using ecosystem service flows to inform ecological compensation: Theory & application. Int. J. Environ. Res. Public Health 2020, 17, 3340. [Google Scholar] [CrossRef] [Scilit] [PubMed]
- Graff Zivin, J.; Neidell, M. Environment, health, and human capital. J. Econ. Lit. 2013, 51, 689–730. [Google Scholar] [CrossRef] [Scilit]
- Aritenang, A.F. The importance of agglomeration economies and technological level on local economic growth: The case of Indonesia. J. Knowl. Econ. 2021, 12, 544–563. [Google Scholar] [CrossRef] [Scilit]
- Shen, Q.; Pan, Y. Explaining and modeling the impact of industrial co-agglomeration on regional economic growth in China: Integrated a quality concern of night-time light perspective. Environ. Sci. Pollut. Res. 2024, 31, 56786–56811. [Google Scholar] [CrossRef] [Scilit] [PubMed]
- Lin, J.Y.; Wan, G.; Morgan, P.J. Prospects for a re-acceleration of economic growth in the PRC. J. Comp. Econ. 2016, 44, 842–853. [Google Scholar] [CrossRef] [Scilit]
- Yuan, Q.; Zhang, G.; Ma, X.; Yue, Z. Can China’s transfer payment in national key ecological function zones promote green poverty reduction? Quasi-natural experiment evidence from China. Environ. Dev. Sustain. 2025, 27, 30465–30491. [Google Scholar] [CrossRef] [Scilit]
- Batini, N.; Di Serio, M.; Fragetta, M.; Melina, G.; Waldron, A. Building back better: How big are green spending multipliers? Ecol. Econ. 2022, 193, 107305. [Google Scholar] [CrossRef] [Scilit]
- Shah, S.S.A.; Wu, K. How effective are green spending multipliers? Eco-friendly vs non-eco-friendly spending in OECD economies. Energy Policy 2025, 204, 114676. [Google Scholar] [CrossRef] [Scilit]
- Song, M.; Huang, D.; Paudel, B. A supply-demand framework for eco-compensation calculation and allocation in china’s national key ecological function areas—A case study in the Yangtze River Economic Belt. Land 2022, 12, 7. [Google Scholar] [CrossRef] [Scilit]
- Wang, M.; Sun, L. Basin ecological compensation and urban green total factor productivity: Evidence from typical trans-provincial river basins in China. Environ. Dev. Sustain. 2025, 1–34. [Google Scholar] [CrossRef] [Scilit]
- Porter, M.E.; Linde, C. Toward a new conception of the environment-competitiveness relationship. J. Econ. Perspect. 1995, 9, 97–118. [Google Scholar] [CrossRef] [Scilit]
- Trevlopoulos, N.S.; Tsalis, T.A.; Evangelinos, K.I.; Tsagarakis, K.P.; Vatalis, K.I.; Nikolaou, I.E. The influence of environmental regulations on business innovation, intellectual capital, environmental and economic performance. Environ. Syst. Decis. 2021, 41, 163–178. [Google Scholar] [CrossRef] [Scilit]
- Lin, T.; Wang, L.; Wu, J. Environmental regulations, green technology innovation, and high-quality economic development in China: Application of mediation and threshold effects. Sustainability 2022, 14, 6882. [Google Scholar] [CrossRef] [Scilit]
- Li, P.; Lu, Y.; Wang, J. Does flattening government improve economic performance? Evidence from China. J. Dev. Econ. 2016, 123, 18–37. [Google Scholar] [CrossRef] [Scilit]
- Wu, Y.; Shi, K.; Chen, Z.; Liu, S.; Chang, Z. Developing improved time-series DMSP-OLS-like data (1992–2019) in China by integrating DMSP-OLS and SNPP-VIIRS. IEEE Trans. Geosci. Remote Sens. 2021, 60, 4407714. [Google Scholar] [CrossRef] [Scilit]
- Goodman-Bacon, A. Difference-in-differences with variation in treatment timing. J. Econom. 2021, 225, 254–277. [Google Scholar] [CrossRef] [Scilit]
- Callaway, B.; Sant’Anna, P.H.C. Difference-in-differences with multiple time periods. J. Econom. 2021, 225, 200–230. [Google Scholar] [CrossRef] [Scilit]
- Cengiz, D.; Dube, A.; Lindner, A.; Zipperer, B. The effect of minimum wages on low-wage jobs. Q. J. Econ. 2019, 134, 1405–1454. [Google Scholar] [CrossRef] [Scilit]
- Dube, A.; Girardi, D.; Jordà, O.; Taylor, A.M. A Local Projections Approach to Difference-in-Differences Event Studies; Working Paper 31184 2023; National Bureau of Economic Research: Cambridge, MA, USA, 2023. [Google Scholar]
- Jacobson, L.S.; LaLonde, R.J.; Sullivan, D.G. Earnings losses of displaced workers. Am. Econ. Rev. 1993, 83, 685–709. [Google Scholar]
- Roth, J.; Sant’Anna, P.H.C.; Bilinski, A.; Poe, J. What’s trending in difference-in-differences? A synthesis of the recent econometrics literature. J. Econom. 2023, 235, 2218–2244. [Google Scholar] [CrossRef] [Scilit]
- Rambachan, A.; Roth, J. A more credible approach to parallel trends. Rev. Econ. Stud. 2023, 90, 2555–2591. [Google Scholar] [CrossRef] [Scilit]
- Yu, Y.; Sun, P.; Xuan, Y. Does local government environmental target constraint affect industrial transformation and upgrading? Econ. Res. J. 2020, 55, 57–72. (In Chinese) [Google Scholar]
- Conley, T.G.; Hansen, C.B.; Rossi, P.E. Plausibly exogenous. Rev. Econ. Stat. 2012, 94, 260–272. [Google Scholar] [CrossRef] [Scilit]
- Masten, M.A.; Poirier, A. The effect of omitted variables on the sign of regression coefficients. Am. Econ. Rev. 2026, 116, 2685–2710. [Google Scholar] [CrossRef] [Scilit]
- Cai, H.; Xu, Y. Does trade openness affect China’s industrial structure upgrading? J. Quant. Tech. Econ. 2017, 34, 3–22. (In Chinese) [Google Scholar]
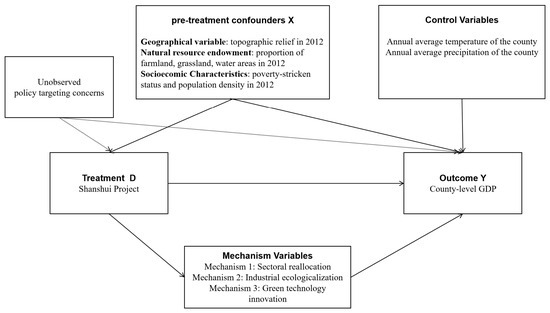
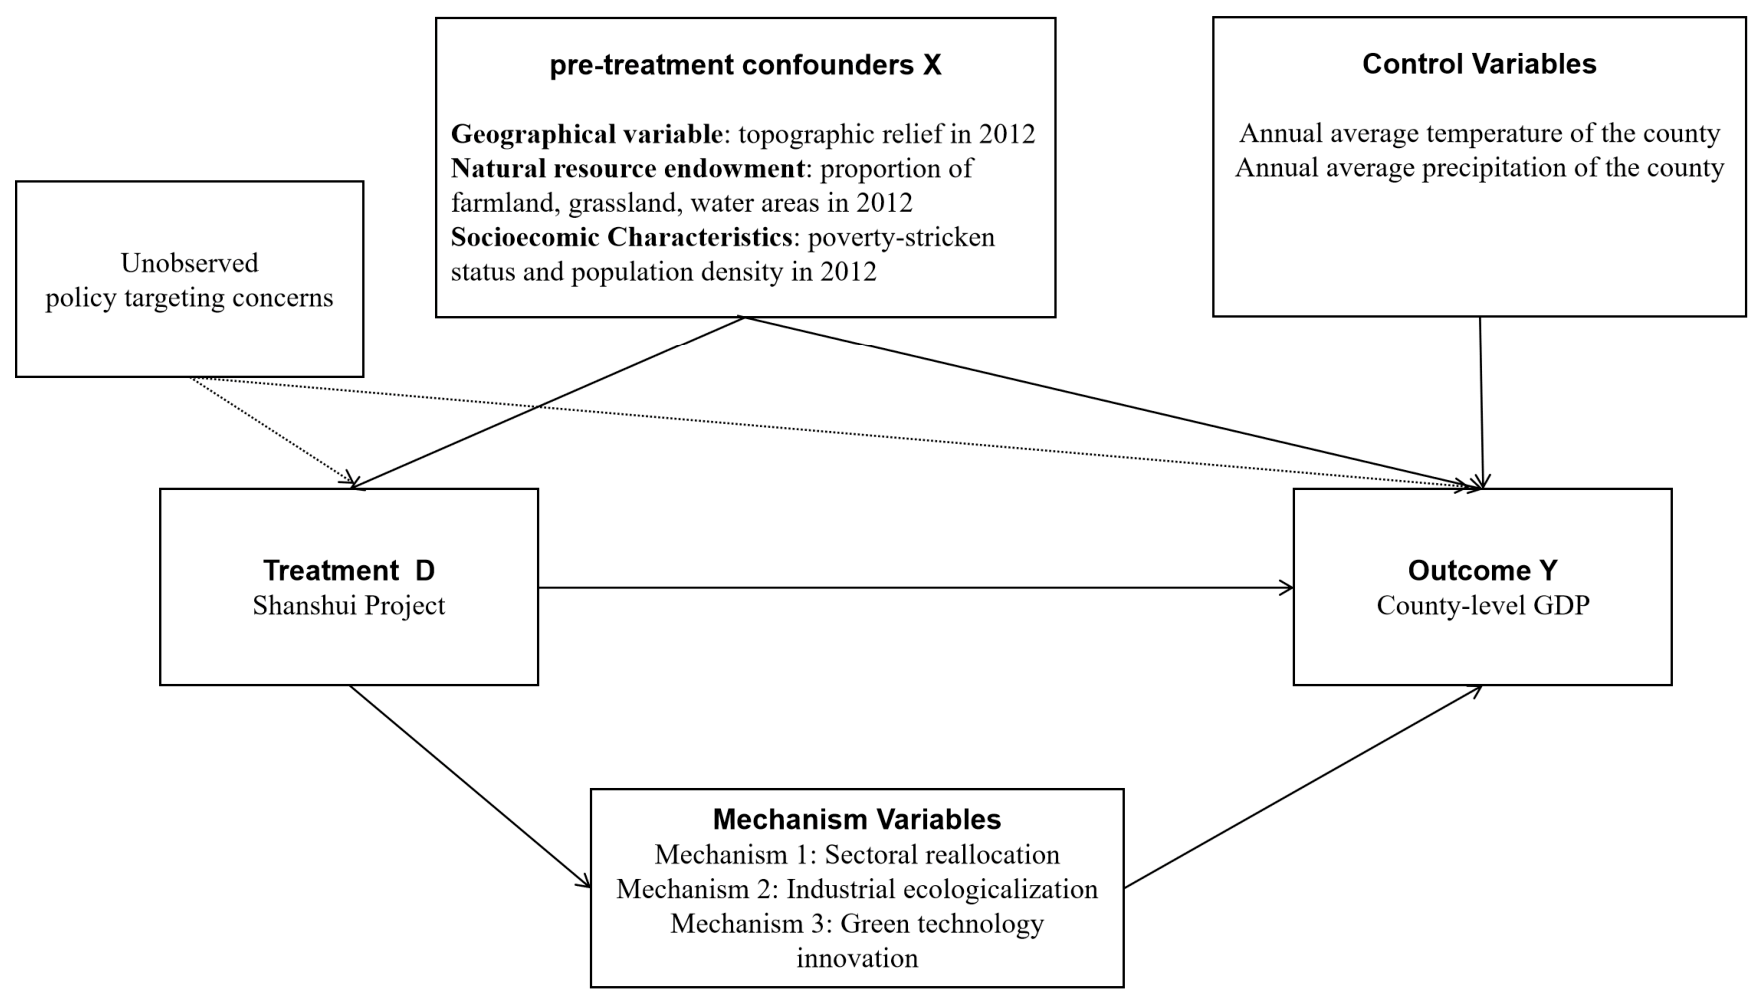
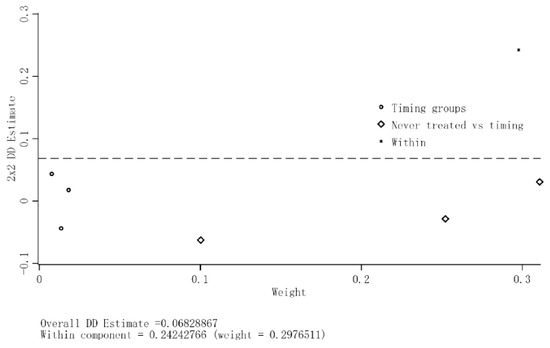
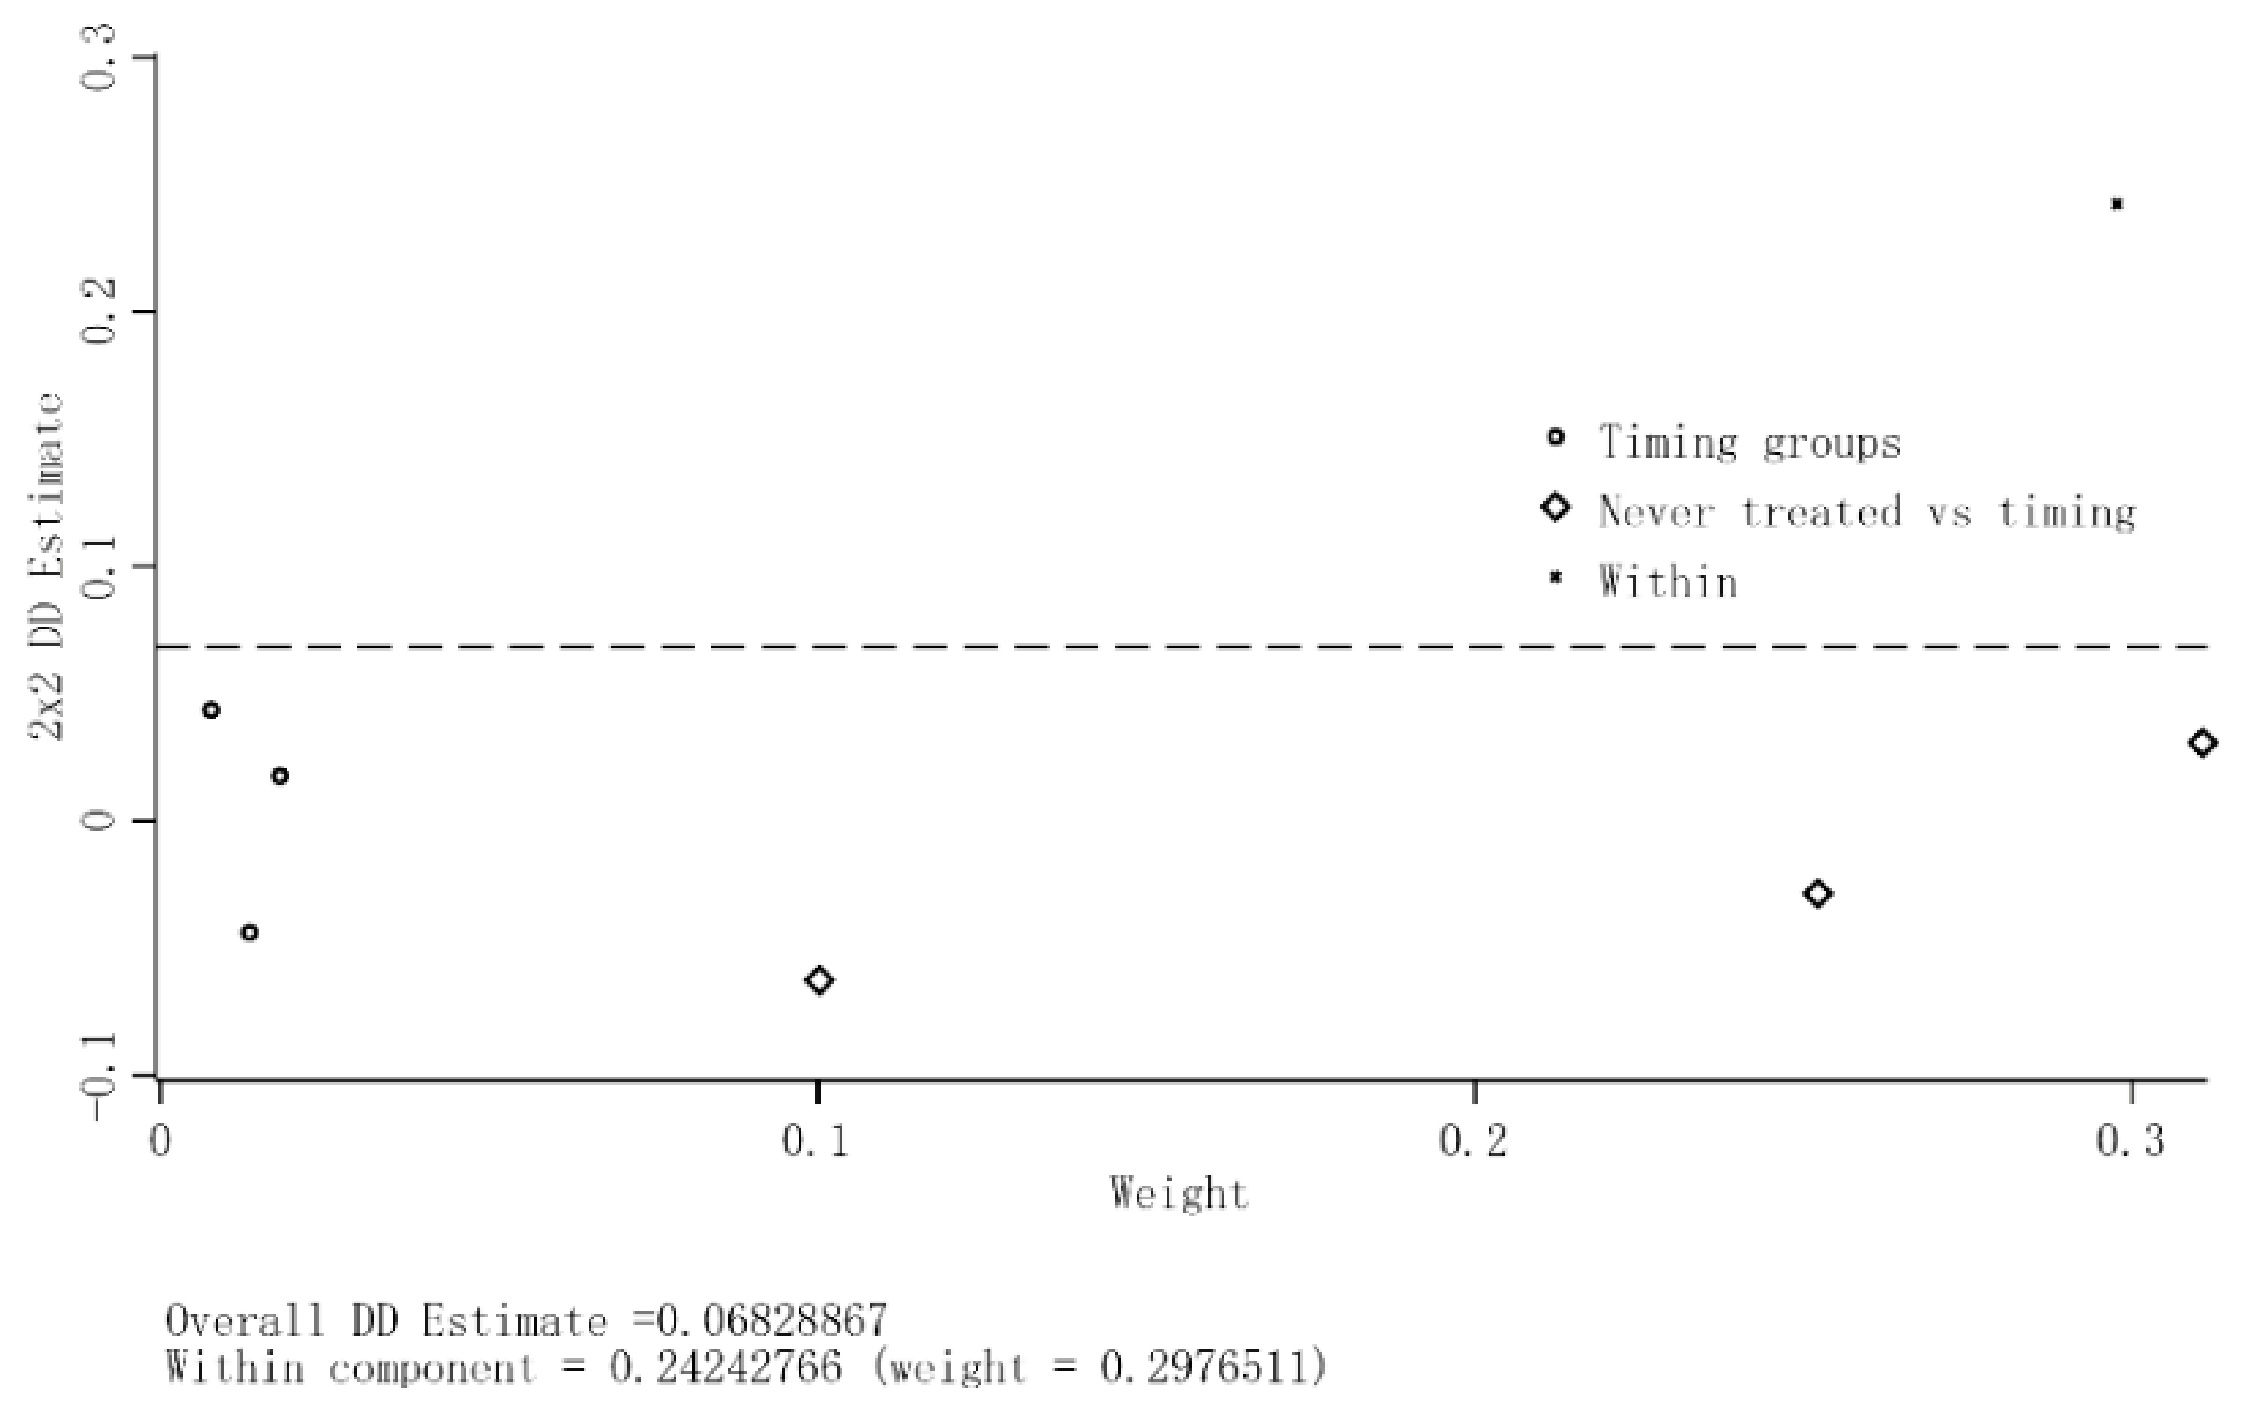
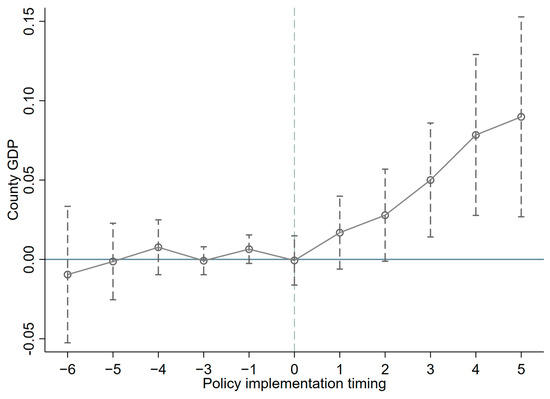
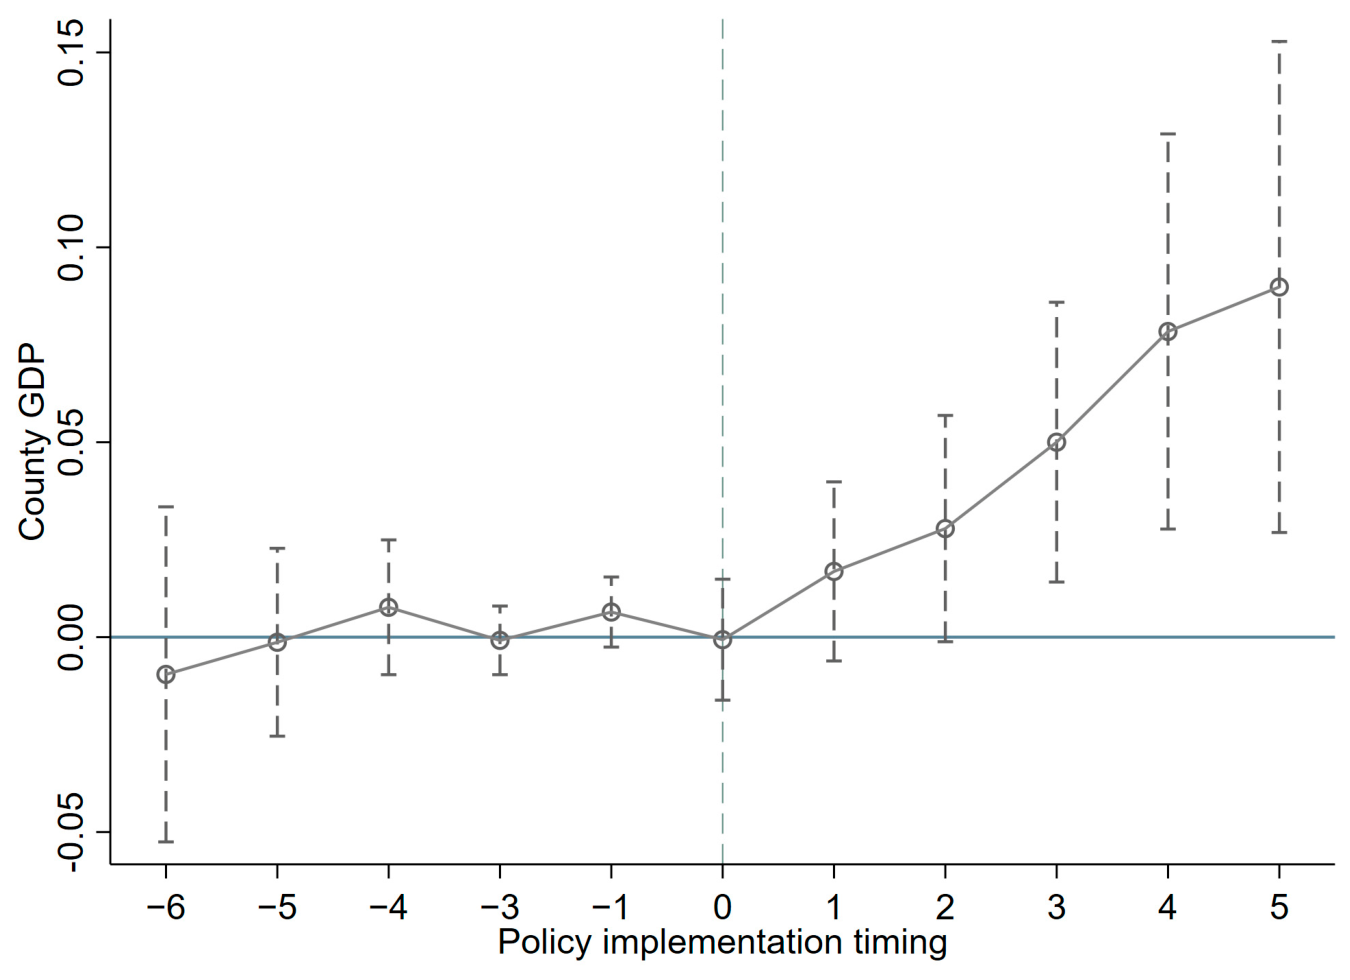
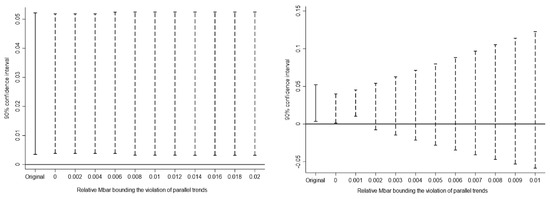
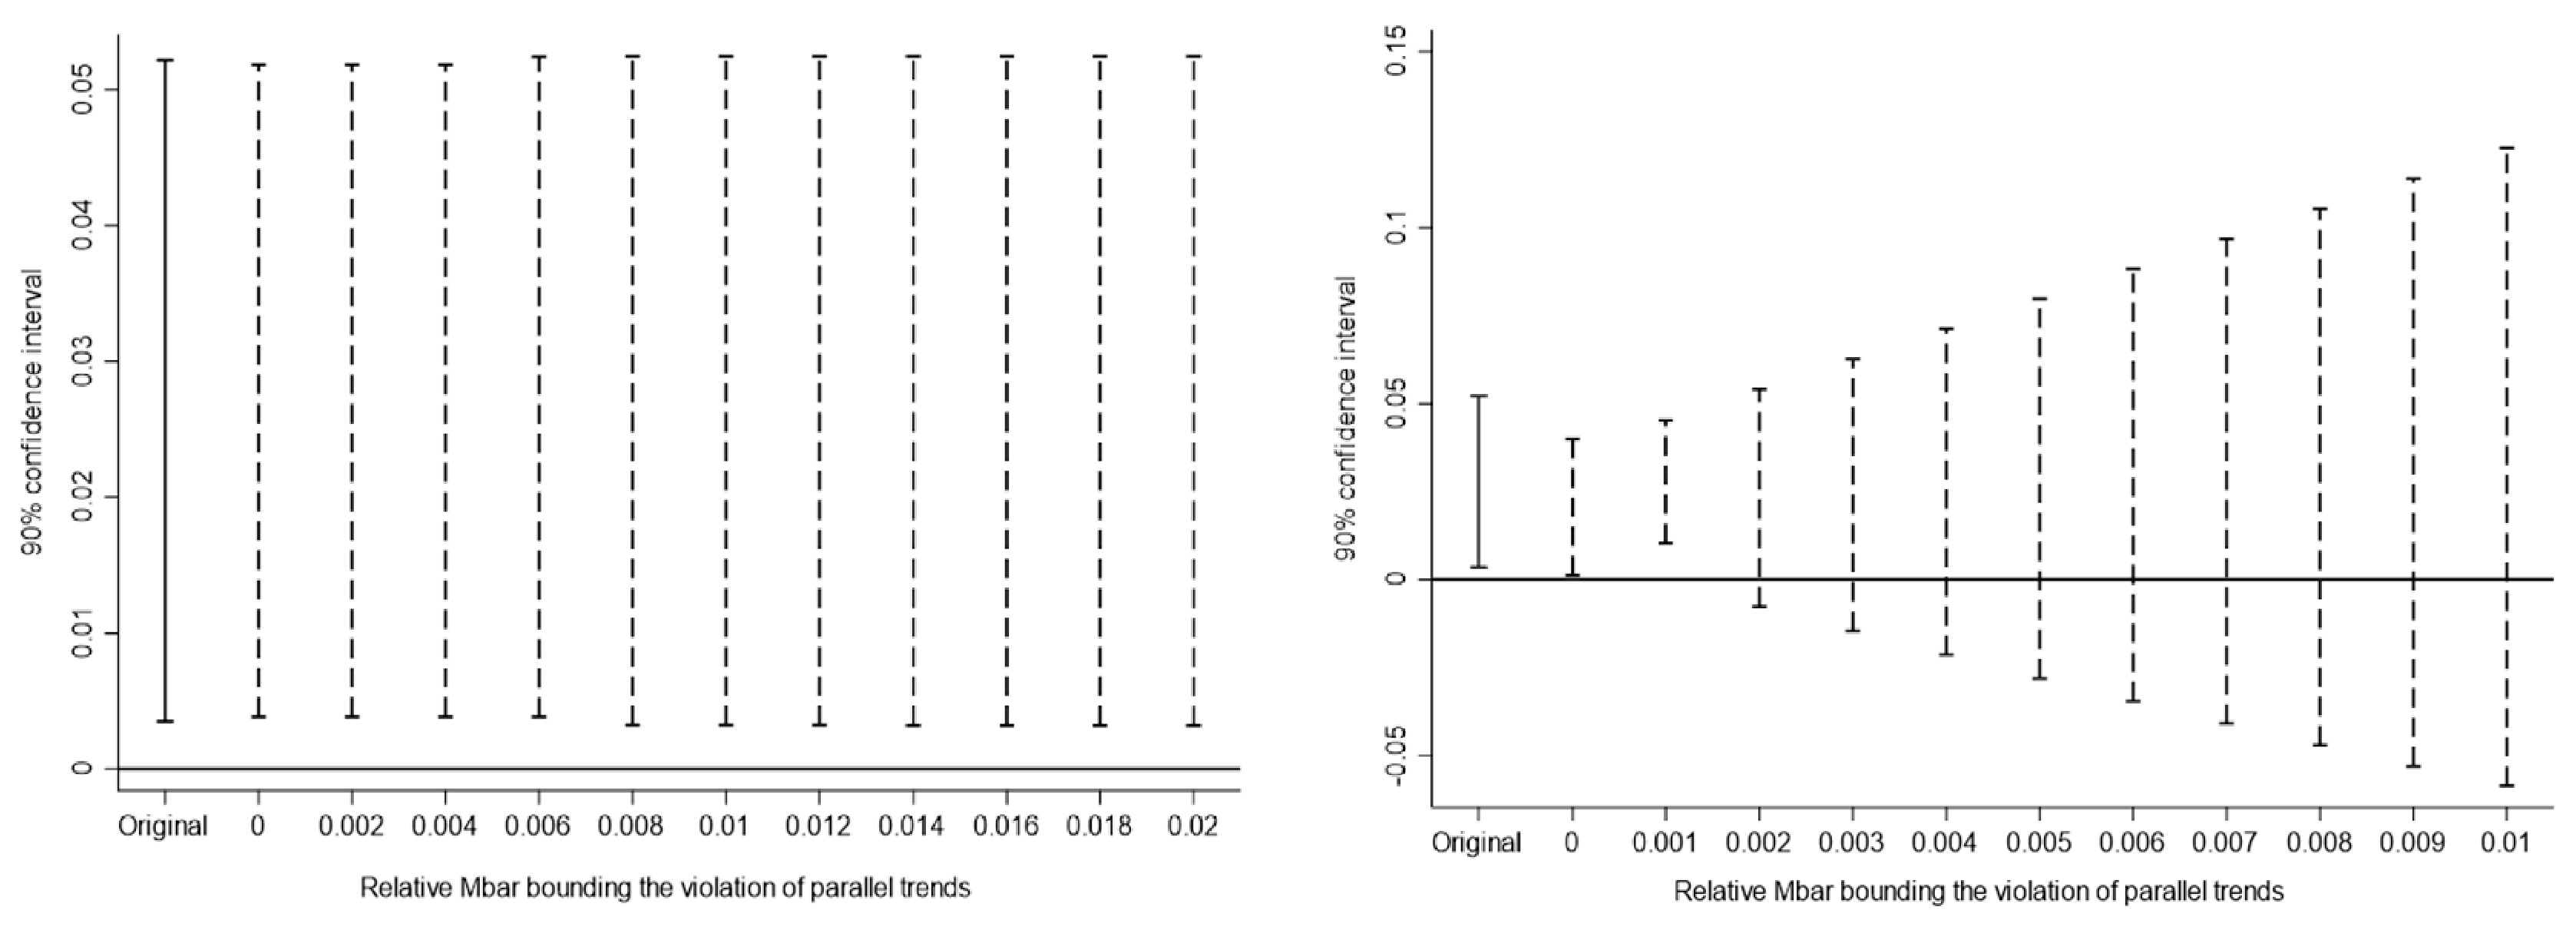
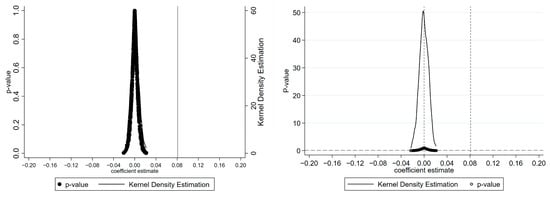
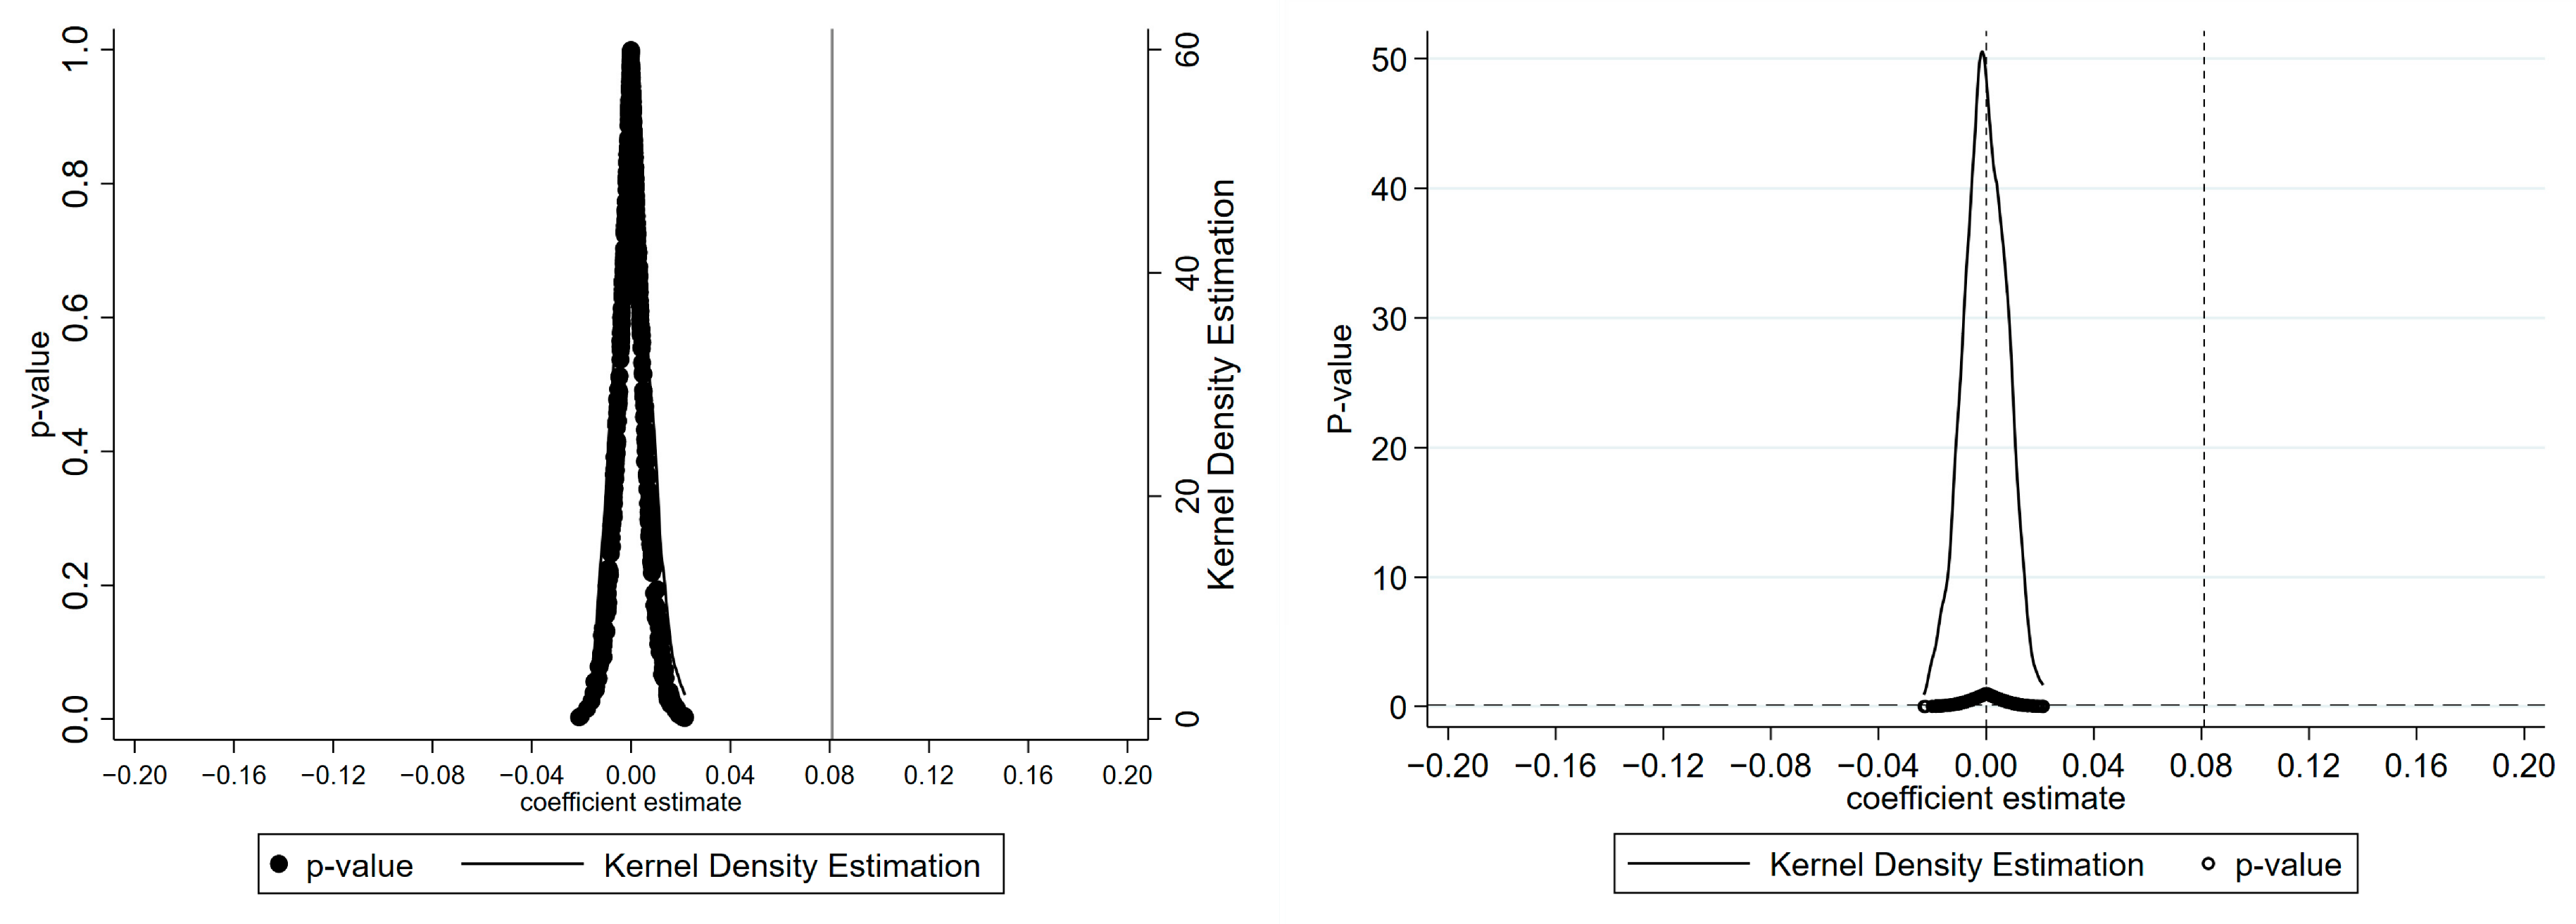

Disclaimer/Publisher’s Note: The statements, opinions and data contained in all publications are solely those of the individual author(s) and contributor(s) and not of MDPI and/or the editor(s). MDPI and/or the editor(s) disclaim responsibility for any injury to people or property resulting from any ideas, methods, instructions or products referred to in the content. |
© 2026 by the authors. Licensee MDPI, Basel, Switzerland. This article is an open access article distributed under the terms and conditions of the Creative Commons Attribution (CC BY) license.