


Abstract
Understanding how metropolitan coordination reshapes urban land expansion is essential for assessing territorial spatial governance. However, most existing studies focus on changes in built-up area or land-use composition, while paying limited attention to whether urban expansion has shifted along terrain gradients. This study integrates slope-spectrum analysis and the IntPLUS model to examine the spatiotemporal evolution and upslope expansion of impervious surfaces in China’s Capital Metropolitan Area from 2000 to 2024. A counterfactual 2024 scenario was further constructed by extending the pre-2014 land-use transition trajectory, allowing comparison between the actual post-2014 development pathway and the historical-inertia pathway. The results show that impervious surfaces increased by 59.81% during 2000–2024, with new expansion mainly concentrated in the eastern plains and urban fringe areas. After 2014, the expansion rate declined markedly, indicating a transition from rapid outward expansion to a more constrained growth stage. Meanwhile, impervious surfaces exhibited a slight but persistent upslope trend, with the mean slope increasing from 4.872° in 2000 to 5.007° in 2024 and the upper slope-spectrum boundary rising from 11.2° to 11.9°. Compared with the counterfactual scenario, the actual 2024 pathway substantially reduced impervious surface expansion below 15° and decreased cropland occupation, suggesting positive effects of post-2014 territorial spatial governance. However, part of the remaining expansion pressure shifted toward steeper areas and ecological land, indicating the need for slope-sensitive land-use regulation. These findings provide empirical evidence for balancing urban growth control, cropland protection, and ecological security in metropolitan spatial planning.
1. Introduction
The world is experiencing unprecedented urbanization [1,2], which is profoundly reshaping environmental, ecological, and socioeconomic systems [3,4,5]. According to the United Nations World Urbanization Prospects 2025, 45% of the current global population of 8.2 billion lives in urban areas, and two-thirds of population growth is expected to occur in cities by 2050 [6]. Asia has been one of the most rapidly urbanizing regions in recent decades, with China undergoing a particularly remarkable urban transition. Yet this rapid urbanization has been spatially uneven. Population, industries, and infrastructure tend to concentrate in selected places, where agglomeration economies generate productivity gains and other positive externalities [7]. This concentration produces a hierarchical center-periphery spatial structure commonly described as a metropolitan area. Metropolitan areas consist of urban cores, satellite towns, rural areas, and smaller settlements that are socioeconomically linked to the core city, often through commuting flows [8].
Impervious surfaces are one of the most direct spatial indicators of urban construction activities. They sensitively capture the intensity of urbanization, the extent of land development, and the transformation of land surfaces by human activity, and have therefore been widely used to identify urban expansion, evaluate land-use transitions, and assess ecological and environmental effects [9,10]. Existing studies using satellite remote sensing have substantially advanced our understanding of the two-dimensional processes of urban expansion, including growth in impervious surface area, expansion direction, landscape pattern, and driving mechanisms [11,12,13]. For example, studies using high-resolution commercial satellite images such as QuickBird and WorldView reported that impervious surfaces in the Shenzhen metropolitan area expanded before 2012 and then showed a declining trajectory [14]. Uhl et al. used the HISDAC-US database to examine metropolitan spatial development in the United States since 1910 and found that impervious surface morphology gradually evolved from compact forms to more complex and continuous forms, accompanied by sharp declines in clusteredness and circularity [15]. At the same time, evaluating the effects of impervious surface expansion on food security, urban heat islands, and key ecosystem services has become an important research theme [16,17,18].
However, impervious surface expansion in metropolitan areas does not occur only on a two-dimensional plane [19]. As flat developable land becomes scarcer, growth boundaries become more restrictive, transport infrastructure extends outward, and land costs rise in core areas, new impervious surfaces may shift along terrain gradients toward steeper areas, producing a process often referred to as urban slope climbing [19,20]. Conventional remote-sensing monitoring and land-use transition matrices can capture impervious surface expansion in two dimensions, but they are less able to characterize expansion in the vertical terrain dimension. In recent years, researchers have introduced slope spectra [21,22] and three-dimensional urban morphology indicators, such as building footprint area, building height, and building volume [23,24], to characterize the spatiotemporal patterns of urban expansion in three dimensions. As a specialized analytical tool, slope-spectrum analysis offers a distinct methodological contribution [21]. By characterizing the continuous distribution and structural variation in urban construction land across fine-grained topographic gradients, it overcomes the binary constraints inherent in conventional discrete slope-classification schemes. This analytical perspective is particularly well suited to capturing the subtle and continuous interactions between construction activities and topographic constraints, thereby providing a robust quantitative basis for assessing the capacity of metropolitan regions to adapt to terrain-imposed boundaries [21,22]. Studies at global and Chinese scales have found that although urban construction land remains concentrated in low-slope areas, its expansion frontier has tended to extend toward steeper terrain [19,22]. Nevertheless, two limitations remain. First, most studies of impervious surface expansion still focus on area, landscape pattern, or land-use transition, while treating slope less often as a key dimension for understanding metropolitan spatial restructuring. Second, most studies of slope climbing focus on mountainous cities or cities under strong topographic constraints, leaving insufficient evidence on whether impervious surfaces in plain-dominated metropolitan regions also undergo upslope shifts.
As a cross-administrative region centered on Beijing and encompassing parts of Tianjin and Hebei, China’s Capital Metropolitan Area serves as a representative case. It features strong core-city spillovers, intense development pressure in its plains, and ecological constraints in its northwestern mountains, thereby providing an ideal context to examine this issue [25]. Since the Chinese government proposed the Beijing–Tianjin–Hebei coordinated development strategy in 2014, industrial relocation, transport integration, ecological protection, and territorial spatial regulation have jointly reshaped the spatial development conditions of the Capital Metropolitan Area [26,27,28]. Importantly, this strategy is not a uniform constraint on urban growth; rather, it constitutes a spatially differentiated policy package with potentially contrasting effects across terrain gradients. The decentralization of Beijing’s non-capital functions and targeted industrial-relocation programs encourage manufacturing and logistics activities to move away from densely built, low-slope core areas [26,27]. Meanwhile, urban growth boundaries and the protection of permanent basic cropland constrain further sprawl across the plains, while ecological conservation red lines limit development in mountainous and other ecologically sensitive areas [27,28]. Together, these instruments can function as spatial filters along the terrain gradient, potentially redistributing development pressure from the metropolitan core and low-slope plains toward piedmont transition zones. They may therefore shift urban expansion from a largely market-led slope-climbing process toward a policy-mediated, multi-tiered distribution across terrain gradients. Existing studies on the Beijing–Tianjin–Hebei region have evaluated policy effects mainly from the perspectives of urban expansion, land-use conflicts, cropland protection, or ecological coordination [27,29]. However, there is still limited evidence on whether coordinated development has altered the terrain pathway of impervious surface expansion, particularly whether it has constrained low-slope plain sprawl while shifting development pressure toward mid- and high-slope areas. This limits our understanding of the effects of territorial spatial governance.
To fill this research gap, this study takes the Capital Metropolitan Area as an empirical case and integrates long-term land-cover data, terrain data, and a slope-spectrum model to systematically describe the spatiotemporal evolution, slope-spectrum change, and slope-climbing characteristics of impervious surfaces from 2000 to 2024. This study offers three primary contributions and novelties to the existing literature. First, we advance the analytical framework of urban expansion by integrating slope-spectrum analysis with a counterfactual simulation framework, moving beyond traditional two-dimensional metrics to capture vertical terrain dynamics. Second, we apply the advanced IntPLUS model to construct a robust 2024 counterfactual scenario under a no-policy-intervention assumption, effectively isolating the net effects of regional coordination policies from historical inertia. Third, this study provides valuable new empirical evidence on how territorial spatial governance alters the vertical expansion pathways of a plain-dominated metropolitan region, contrasting with existing literature predominantly focused on mountainous cities. Building upon these methodological and empirical novelties, this study addresses the following core research questions: (1) How have impervious surfaces spatiotemporally evolved and exhibited slope-climbing characteristics from 2000 to 2024? (2) To what extent did the post-2014 actual development pathway deviate from the historical-inertia counterfactual scenario? (3) How and to what degree has regional coordination policy altered the terrain-gradient expansion trajectory? Specifically, this study has three objectives: (1) to describe the spatiotemporal evolution of impervious surfaces in the Capital Metropolitan Area; (2) to analyze the slope-climbing characteristics of impervious surfaces; and (3) to reveal the influence of regional coordinated development policy on the slope-climbing pathway of impervious surface expansion.
2. Data Sources
2.1. Study Area
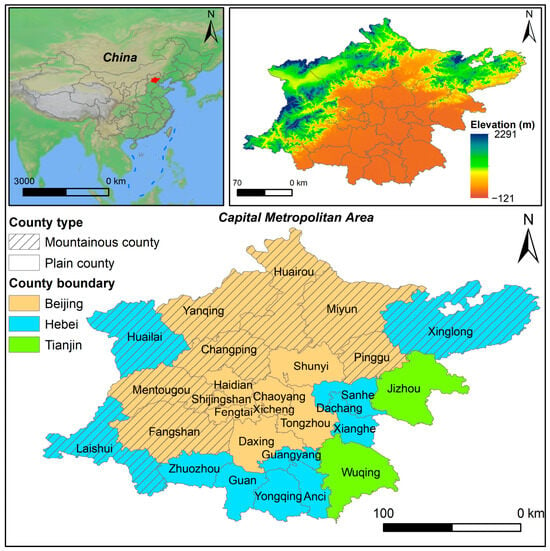
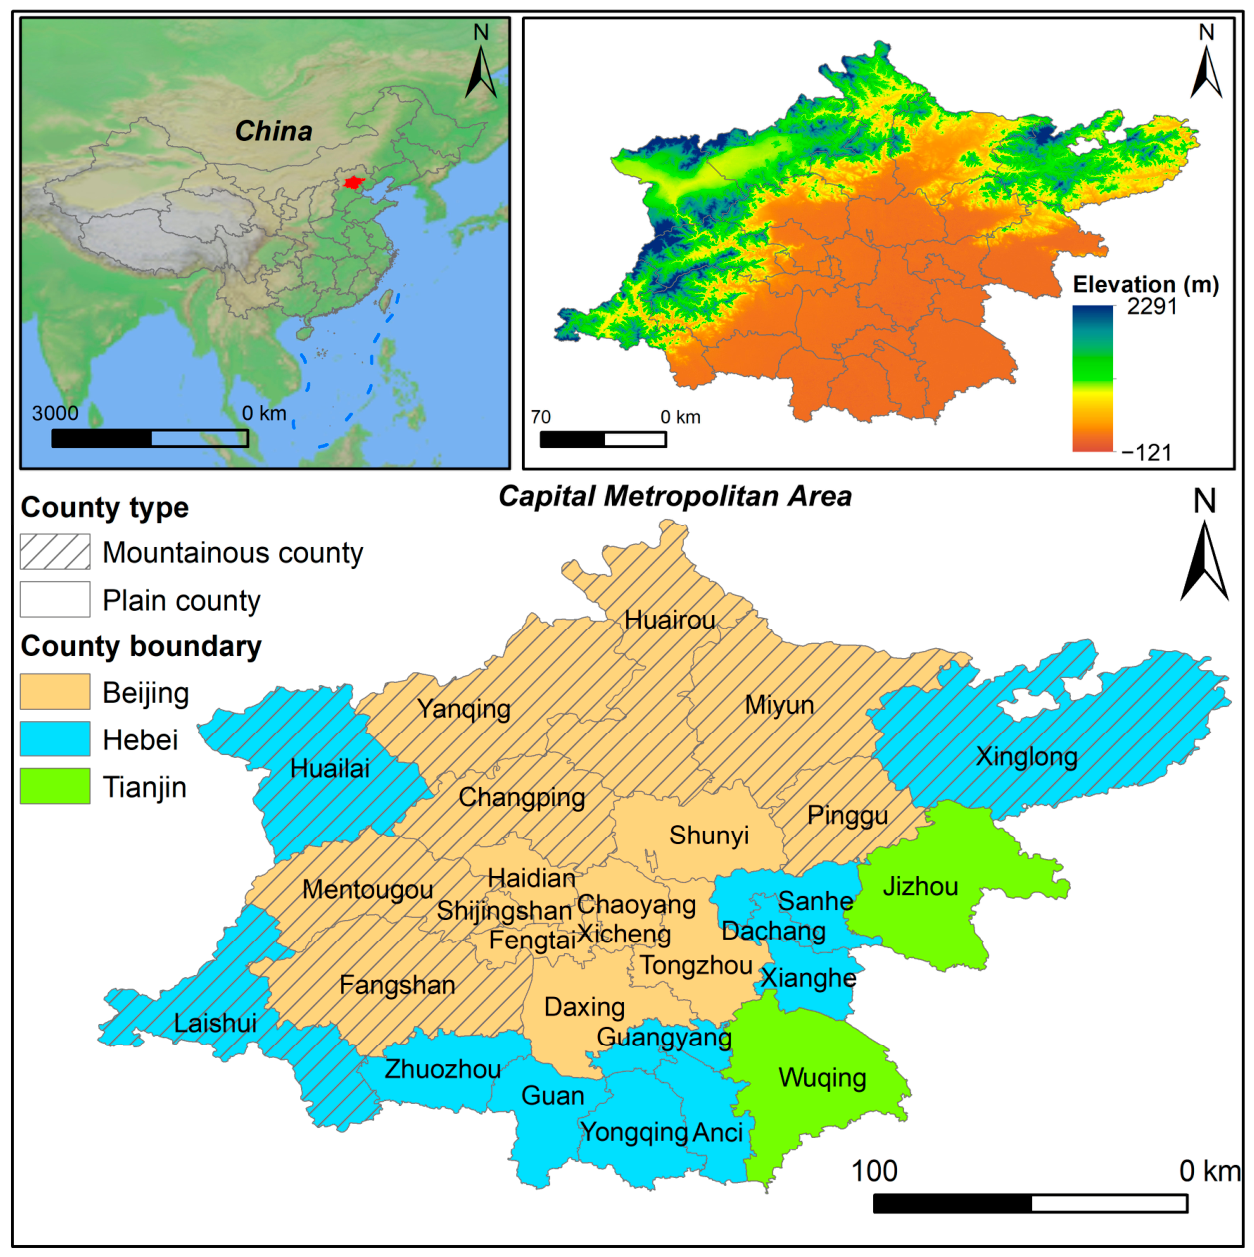
The Capital Metropolitan Area (39°4′–41°0′ N, 115°2′–118°15′ E) is located on the North China Plain and is defined as a one-hour rapid-transport commuting circle centered on Beijing, the capital of China (Figure 1). It includes 16 county-level units in Beijing and 13 surrounding county-level units in Tianjin and Hebei, with a total area of 30,600 km2 and a permanent population of approximately 27 million at the end of 2020. Based on whether mountainous areas account for more than 50% of the administrative area, the 29 county-level units are divided into 10 mountainous counties and 19 plain counties. Elevation in the Capital Metropolitan Area ranges from −121 m to 2291 m, and the terrain is dominated by alluvial plains. The plain areas contain a large share of the population and industrial activities and have a relatively high level of economic development. Mountainous areas are mainly distributed in the west and north of the metropolitan area; they have high forest coverage and function as important ecological zones, but their economic development is comparatively limited [29]. Proposed in 2014 to alleviate urban issues stemming from Beijing’s disorderly expansion, the Beijing–Tianjin–Hebei coordinated development strategy utilizes territorial and industrial planning to relocate population and industries, enhance regional sustainability, and narrow development disparities [30,31]. Consequently, this process has partially spurred urban construction in outer suburban areas.
Figure 1.
Location of study area.
2.2. Data Source and Processing
This study used multi-source data, including land cover, terrain, transportation, and remote-sensing indices (Table 1). The digital elevation model (DEM) was obtained from the Shuttle Radar Topography Mission (SRTM) dataset (https://www.earthdata.nasa.gov/, accessed on 5 May 2026), with a spatial resolution of 30 m. Land-cover data were derived from the annual China Land Cover Dataset (CLCD) (https://zenodo.org/records/15853565, accessed on 10 July 2026), also with a spatial resolution of 30 m. The land-cover types include cropland, forest, shrub, grassland, water, snow/ice, barren land, impervious surface, and wetland. The CLCD dataset was generated from existing land-cover products and Google Earth visual interpretation samples, using Landsat spectral bands and environmental covariates with a random forest classifier and spatiotemporal post-processing. Its overall accuracy reaches 79.31% based on independent validation samples [32]. The product has recently been updated to 2024 and is, to our knowledge, the most up-to-date publicly available land-cover dataset for China. Gross domestic product (GDP) data, with an approximate spatial resolution of 1 km, were downloaded from the National Tibetan Plateau Data Center (https://data.tpdc.ac.cn/, accessed on 6 May 2026). Road network data were downloaded from OpenStreetMap (https://download.geofabrik.de/, accessed on 7 May 2026), a widely used volunteered geographic information source that provides railways, expressways, ordinary roads, and other road types. Administrative boundaries and points of interest (POIs) were obtained from the Amap API (https://amap.apifox.cn/, accessed on 5 May 2026). To ensure consistency in spatiotemporal analysis, all raster datasets were resampled to a 30 m spatial resolution and projected to a WGS 84 UTM coordinate system. Spatial data processing was performed in ArcGIS Pro 3.4.
Table 1.
Descriptions of the data used in this study.
3. Methodology
3.1. Constructing the Slope Spectrum of Impervious Surface Expansion
In geomorphological research on the Loess Plateau, Tang et al. (2008) found a close relationship between slope spectra and loess landform types [33], demonstrating the potential of slope-spectrum analysis for quantitatively characterizing geographic phenomena. Building upon the methodology established by Peng et al. (2018) [21], this study constructed the terrain slope spectrum (TSS) and the impervious-land slope spectrum (ILSS) to examine the spatiotemporal evolution and slope-climbing characteristics of impervious surfaces in the Capital Metropolitan Area. A slope spectrum is a statistical model in which fixed slope intervals serve as the independent variable and the proportion of land area in each slope interval relative to the total land area serves as the dependent variable [20]. Specifically, the zonal statistics tool in ArcGIS Pro (v3.2) (Esri, Redlands, CA, USA) was used to calculate the proportion of land pixels and impervious surface pixels within each 1-degree slope interval.
where Li is the land frequency of slope interval i in the study area, namely the TSS. LAi is the number of land pixels in slope interval i, and LA is the total number of land pixels. ILit is the impervious surface frequency of slope interval i in year t, namely the ILSS. ILAit is the number of impervious surface pixels in slope interval i in year t, and ILAt is the total number of impervious surface pixels in year t.
Li = (LAi/LA) × 100%
ILit = (ILAit/ILAt) × 100%
Impervious surfaces generally tend to occur in flatter terrain; as available land becomes scarcer, they gradually extend toward steeper areas. Therefore, when the TSS and ILSS intersect, namely when Li = ILit, the corresponding slope value is defined as T. Areas where the impervious surface proportion exceeds the land proportion (slope < T) are defined as impervious surface dominant zones. Conversely, areas where slope > T are defined as non-impervious surface dominant zones. In this study, the slope spectrum is visualized directly as a density curve, with slope on the x-axis and area proportion on the y-axis.
3.2. Calculating the Slope-Climbing Index and Upper Slope Boundary
To more clearly characterize the degree of impervious surface slope climbing, we introduced the slope-climbing index [22]. First, we calculated the change in the proportion of impervious surface pixels located above T relative to the total impervious surface pixels, which was defined as the impervious surface climbing index (ICI). Second, we calculated the annual impervious surface slope-climbing index (AIL) for each study period.
where EAm and EAn represent the numbers of impervious surface pixels above T in years m and n, respectively. ILAm and ILAn represent the total numbers of impervious surface pixels in years m and n, respectively. When AIL > 0, impervious surface slope climbing is indicated, and larger AIL values imply greater climbing intensity.
The upper slope boundary (US) was further introduced to examine the maximum slope distribution across different periods. Following previous studies [21,22], this study defines the upper slope boundary as the slope corresponding to the cumulative proportion of 95% of impervious surface pixels when all impervious surface pixels are sorted by slope from low to high. The annual change in the upper slope boundary (AAUS) between two periods is calculated as follows:
where USm and USn represent the upper slope boundary in years m and n, respectively. AAUS > 0 indicates an upward shift in the slope boundary of impervious surfaces.
3.3. Simulating Impervious Surface Change with the IntPLUS Model
3.3.1. IntPLUS Model
This study introduced the Interaction Network-Patch-generating Land Use Simulation (IntPLUS) model developed by Liang et al. (2021) [34], which is one of the frontier models in land-use change research. A scenario simulation approach was adopted to construct the 2024 counterfactual distribution of impervious surfaces under a no-policy-intervention assumption. By comparing the counterfactual scenario with the actual 2024 scenario, we evaluated the influence of the Beijing–Tianjin–Hebei coordinated development strategy on impervious surface expansion during 2014–2024.
The PLUS model has been widely used to predict future land-use change [35]. Its core framework includes a cellular automata random seed (CARS) patch-generating approach based on dynamic geographic units [36]. The IntPLUS model is an improved version of PLUS and was designed as a consistency-driven dynamic simulation and interaction-network mining method [34]. It introduces a new two-step CA architecture and visualizes and analyzes competition among land-use types from a dynamic simulation perspective, thereby improving simulation accuracy [34]. The model consists of three components: (1) the LEAS module, which uses historical land-use data and random forest algorithms to extract class expansion features and estimate transition probabilities; (2) the intCARS module, which constructs a land-use interaction network through simulation calibration and addresses limitations of traditional CA competition rules in complex landscapes; and (3) the intCARS_prediction module, which integrates quantity constraints, scenario-based transition matrices, and neighborhood effects to generate coupled quantity-spatial predictions of land-use patterns under specific scenarios. Therefore, this study used the improved IntPLUS model to dynamically simulate land-use patterns in the counterfactual scenario for the Capital Metropolitan Area, with the aim of more accurately matching land-demand quantity and spatial allocation.
3.3.2. Key Parameter Settings
Neighborhood-factor weights were assigned to different land-use types according to human-activity intensity (Table S1). The 2000–2008 land-use transition matrix was used as the baseline, and conversion rules were set with reference to territorial spatial planning and ecological conservation red lines (Table S2). The 2000–2008 period was selected as the baseline for two major methodological and contextual reasons. Methodologically, it provides a robust historical foundation to calibrate the IntPLUS model and allows for an essential intermediate cross-validation against the observed 2014 land-use pattern, ensuring the model’s reliability for long-term extrapolation. Contextually, because the Beijing–Tianjin–Hebei coordinated development strategy was officially proposed in 2014, using the pre-2014 transition matrix enables us to construct a clean ‘business-as-usual’ counterfactual scenario for 2024, free from pre-existing policy interference.
Drawing on previous studies [34,37] and the high level of human activity in the study area [38], we selected 12 driving factors to predict land-use change in the Capital Metropolitan Area. These factors included mean temperature, precipitation, slope, elevation, population density, GDP, distance to urban centers, distance to county centers, distance to expressways, distance to railways, distance to roads, and distance to rivers.
3.3.3. Model Accuracy Validation
To ensure the reliability of impervious surface simulation, this study used the Kappa coefficient, overall accuracy, and figure of merit (FOM) to evaluate the prediction accuracy of the IntPLUS model [34]. First, land-use data from 2000 and 2008 were used as inputs to simulate the land-use pattern in 2014. The simulated results were then compared with the observed land-use data in 2014 to evaluate model accuracy. Higher Kappa coefficient, Overall accuracy, and FOM values indicate better prediction accuracy for land-use change. These indicators are calculated as follows:
where TP indicates categories predicted as changed and observed as changed, TN indicates categories predicted as unchanged and observed as unchanged, FP indicates categories predicted as unchanged but observed as changed, and FN indicates categories predicted as changed but observed as unchanged.
where po represents the ratio of correctly identified samples to the total number of samples. a1, a2, …, an are the actual sample numbers of each land-use type, b1, b2, …, bn are the predicted sample numbers of each land-use type, and n is the total number of samples.
where A represents areas that changed in reality but were predicted as unchanged, B represents areas that changed both in reality and in the prediction and were correctly predicted, C represents areas that changed both in reality and in the prediction but were assigned an incorrect class, and D represents areas predicted as changed but observed as unchanged.
4. Results and Analysis
4.1. Spatiotemporal Evolution of Impervious Surfaces
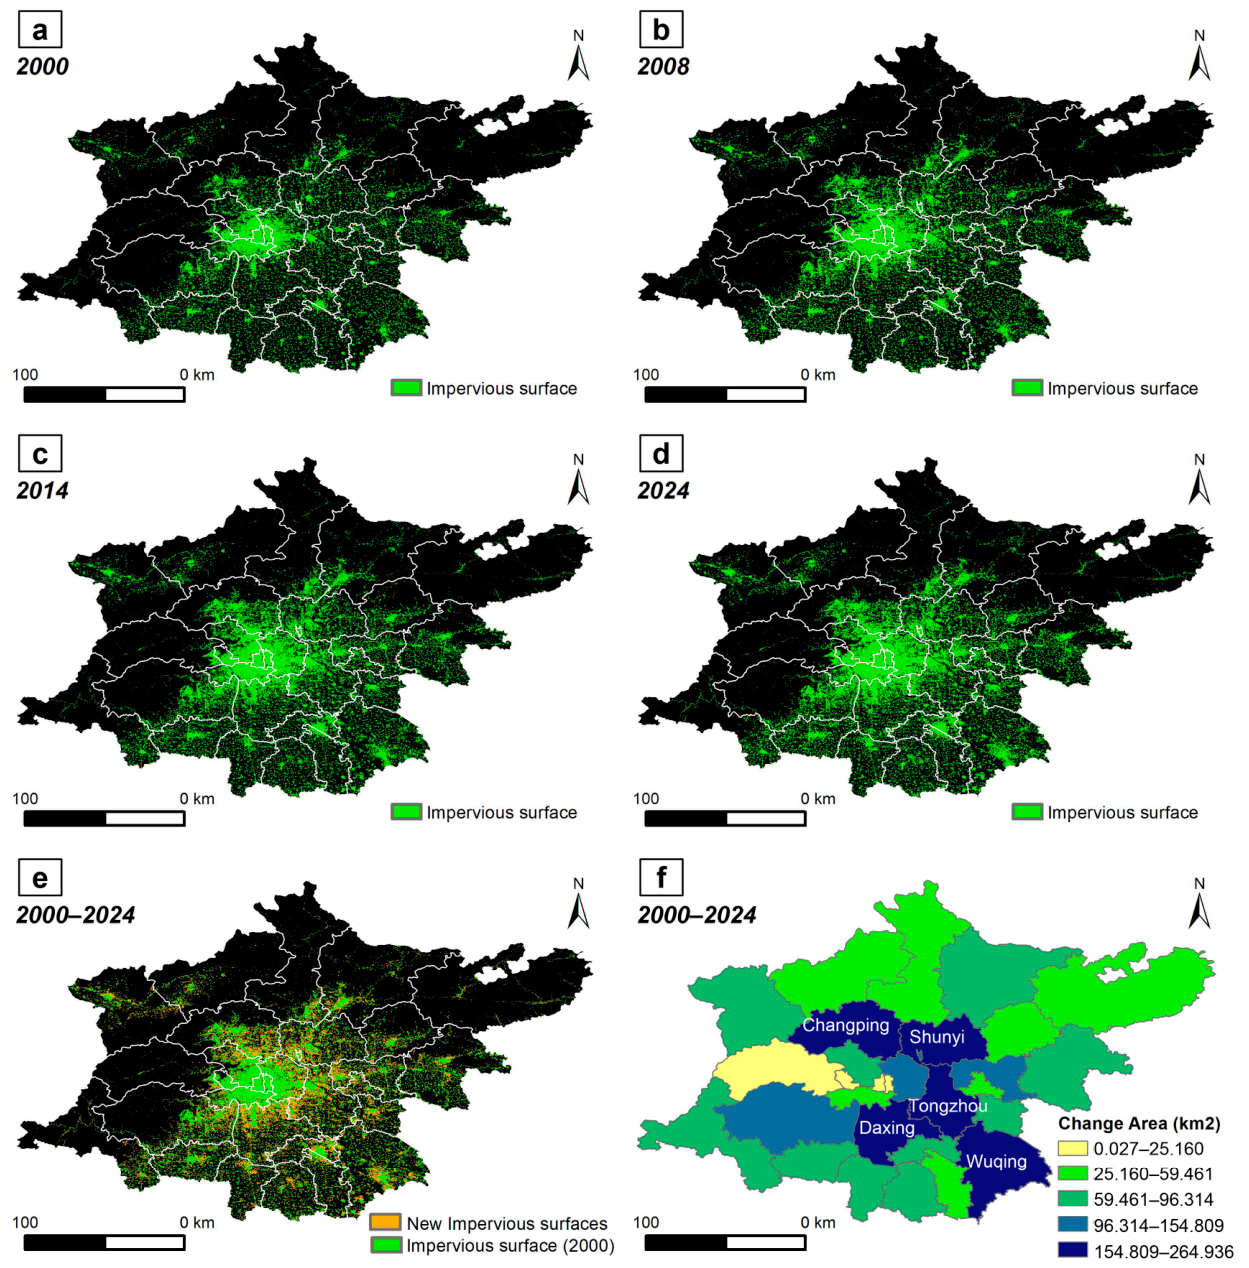
Impervious surfaces in the Capital Metropolitan Area expanded substantially from 2000 to 2024 (Table 2). The impervious surface area increased from 4376.93 km2 in 2000 to 6994.87 km2 in 2024, representing an increase of approximately 59.81%. The years 2008 and 2014 marked two key time nodes, with the expansion rate first increasing and then decreasing. Before 2008, impervious surfaces expanded at approximately 121.82 km2/year. During 2008–2014, the expansion rate increased to 152.74 km2/year. However, during 2014–2024, the expansion rate dropped markedly to 60.50 km2/year.
Table 2.
Changes in impervious surface area in the Capital Metropolitan Area.
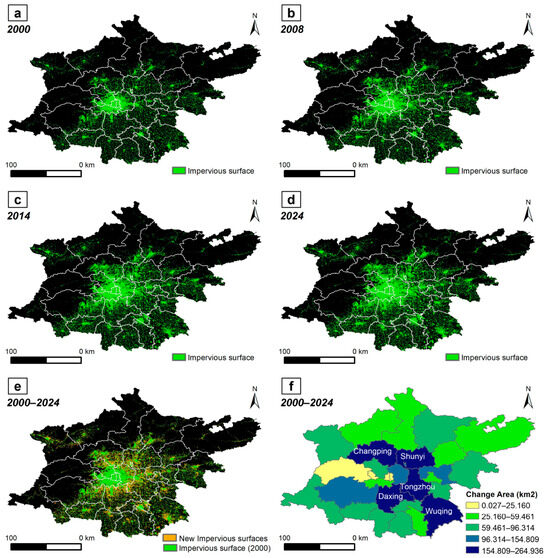
Figure 2 illustrates the spatial evolution of impervious surfaces in the Capital Metropolitan Area. Impervious surfaces expanded outward around existing built-up areas. From 2000 to 2024, the top five county-level units in terms of expansion magnitude were Daxing, Tongzhou, Shunyi, Changping, and Wuqing, all registering an average increase of more than 154 km2 and primarily distributed across the eastern plains. Among the mountainous counties, Changping, Huailai, and Miyun registered the three largest expansions, with growth areas reaching 198.14 km2, 83.04 km2, and 74.29 km2, respectively.
Figure 2.
Spatial evolution of impervious surfaces in the Capital Metropolitan Area from 2000 to 2024: (a) 2000; (b) 2008; (c) 2014; (d) 2024. (e) Spatial pattern of new impervious surfaces from 2000 to 2024. (f) Change area of impervious surfaces by county-level unit from 2000 to 2024.
4.2. Slope-Climbing Characteristics of Impervious Surfaces
4.2.1. Mean Slope Characteristics
The slope-climbing analysis provides a vertical perspective on impervious surface evolution. Table 3 summarizes changes in the mean slope of impervious surfaces in the Capital Metropolitan Area. Over the past two decades, the mean slope of impervious surfaces gradually increased from 4.872 degrees in 2000 to 5.007 degrees in 2024. This upward trend occurred in both plain and mountainous counties. In plain counties, the mean slope increased from 4.842 degrees at the beginning of the study period to 4.936 degrees at the end, while in mountainous counties it increased from 4.950 degrees to 5.181 degrees. After 2014, however, the slope-climbing magnitude slowed for the Capital Metropolitan Area as a whole and for plain counties, whereas slope climbing became more pronounced in mountainous counties.
Table 3.
Mean slope of impervious surfaces in the Capital Metropolitan Area.
4.2.2. Slope-Spectrum Change
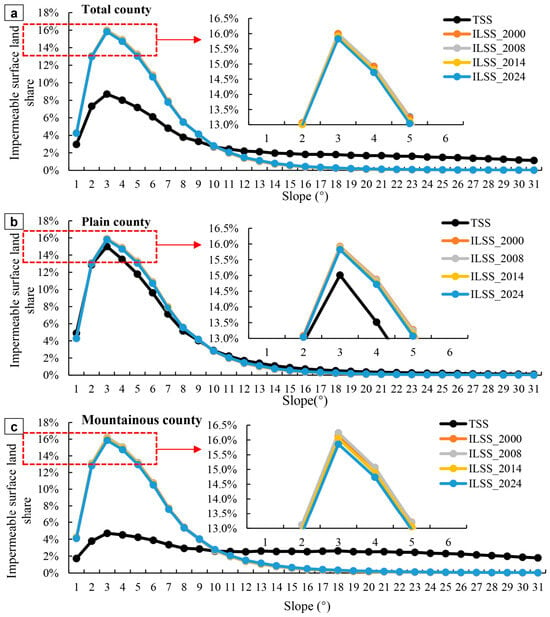
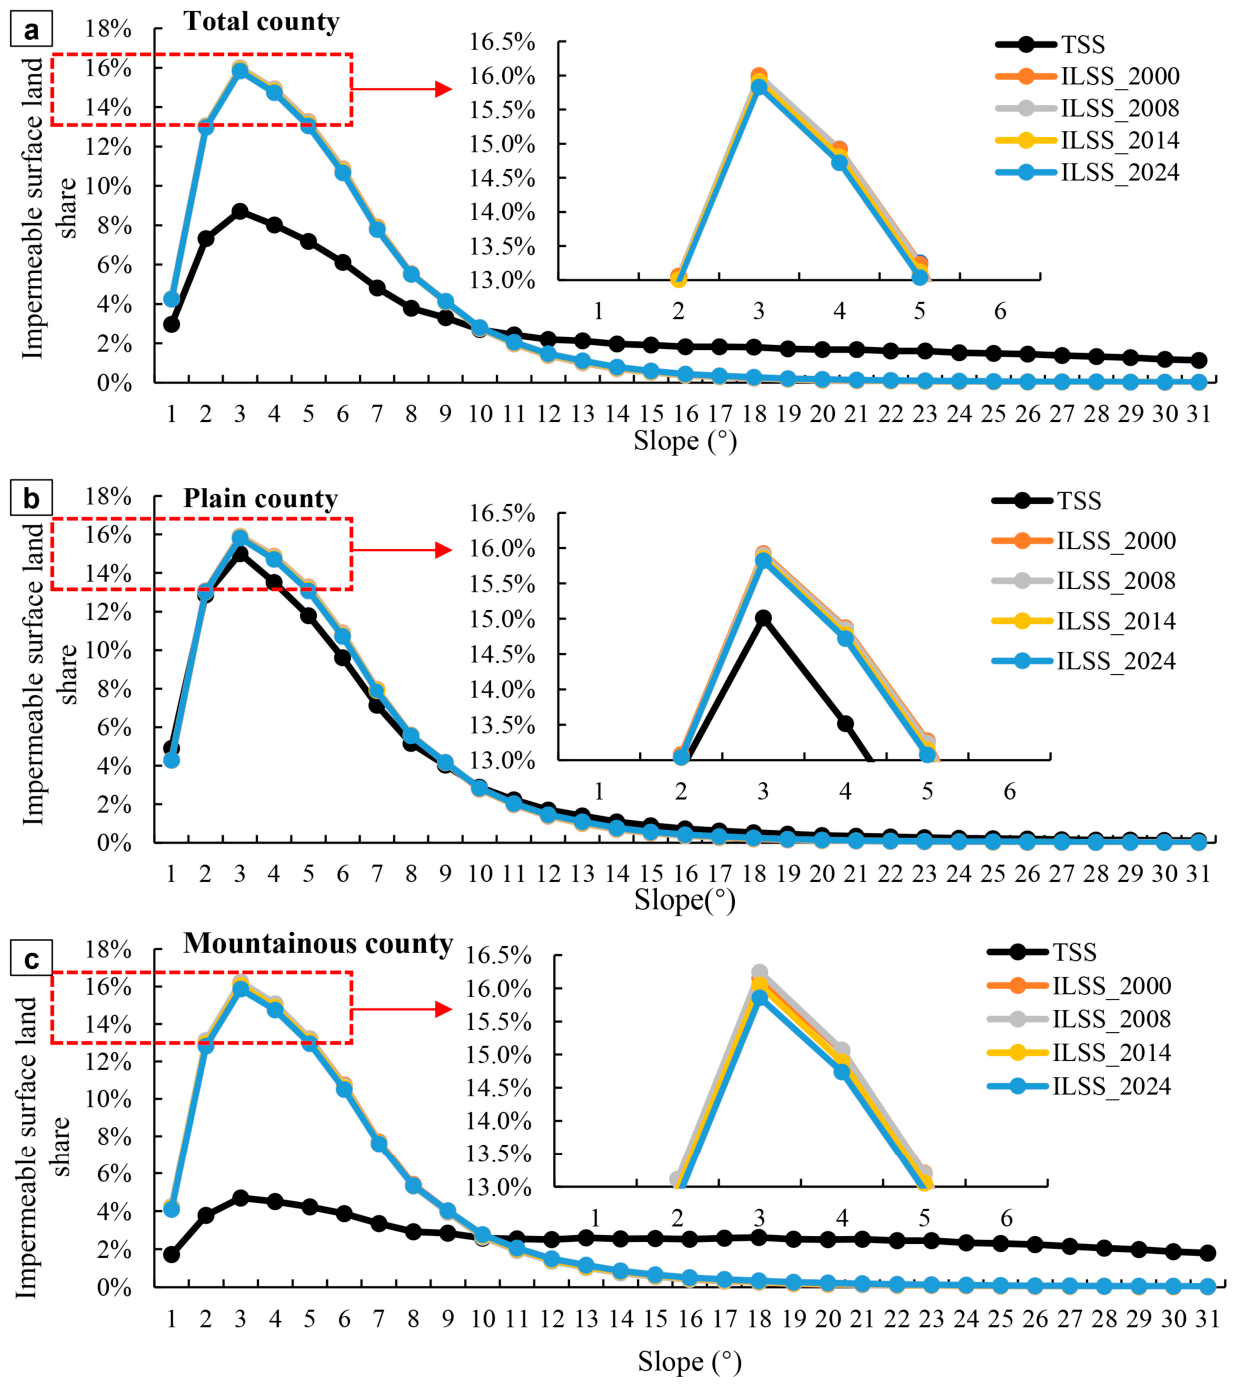
Figure 3 presents the terrain slope spectrum and impervious-land slope spectrum of the Capital Metropolitan Area from 2000 to 2024. The impervious-land slope-spectrum curve shows an inverted V-shaped skewed distribution: as slope increases, the area proportion of impervious surfaces first increases and then decreases. The peak of the impervious-land slope spectrum occurs at 3 degrees, with a multi-year average impervious surface proportion of 15.93%. The corresponding values for plain and mountainous counties are 15.87% and 16.08%, respectively. In flatter terrain, the terrain slope-spectrum curve and the impervious-land slope-spectrum curve are closer to each other; in steeper terrain, the two curves diverge more strongly. The TSS and ILSS for the Capital Metropolitan Area usually intersect at 10–11 degrees, indicating that impervious surface dominant zones are mainly concentrated below 11 degrees. Temporally, the peak of the impervious-land slope spectrum declined from 15.99% in 2000 to 15.83% in 2024. The decline in the peak was greater in mountainous counties than in plain counties, with changes of −1.82% and −0.63%, respectively. Overall, impervious surfaces in the Capital Metropolitan Area experienced clear slope climbing, especially in mountainous counties, while plain areas exhibited a slower climbing trend.
Figure 3.
Terrain slope spectrum and impervious-land slope spectrum in the Capital Metropolitan Area. (a) All county-level units; (b) plain counties; (c) mountainous counties.
The slope corresponding to the cumulative 95% impervious surface area was used as the upper slope boundary (US) to examine the position of impervious surfaces along the slope gradient. The US of the Capital Metropolitan Area increased from 11.2 degrees in 2000 to 11.9 degrees in 2024, an increase of 0.7 degrees (Table 4). Plain and mountainous counties also showed upward trends, with increases of 0.4 degrees and 1.0 degree, respectively. Therefore, the increase in US for the Capital Metropolitan Area was mainly attributable to the rapid increase in mountainous counties.
Table 4.
Upper slope boundary of the impervious-land slope spectrum in the Capital Metropolitan Area.
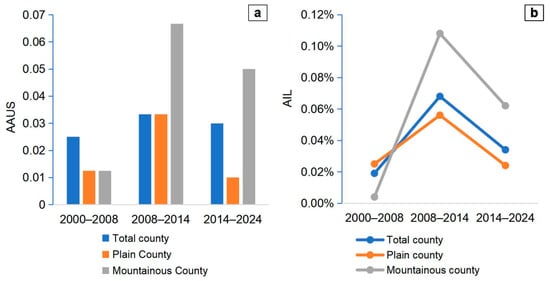
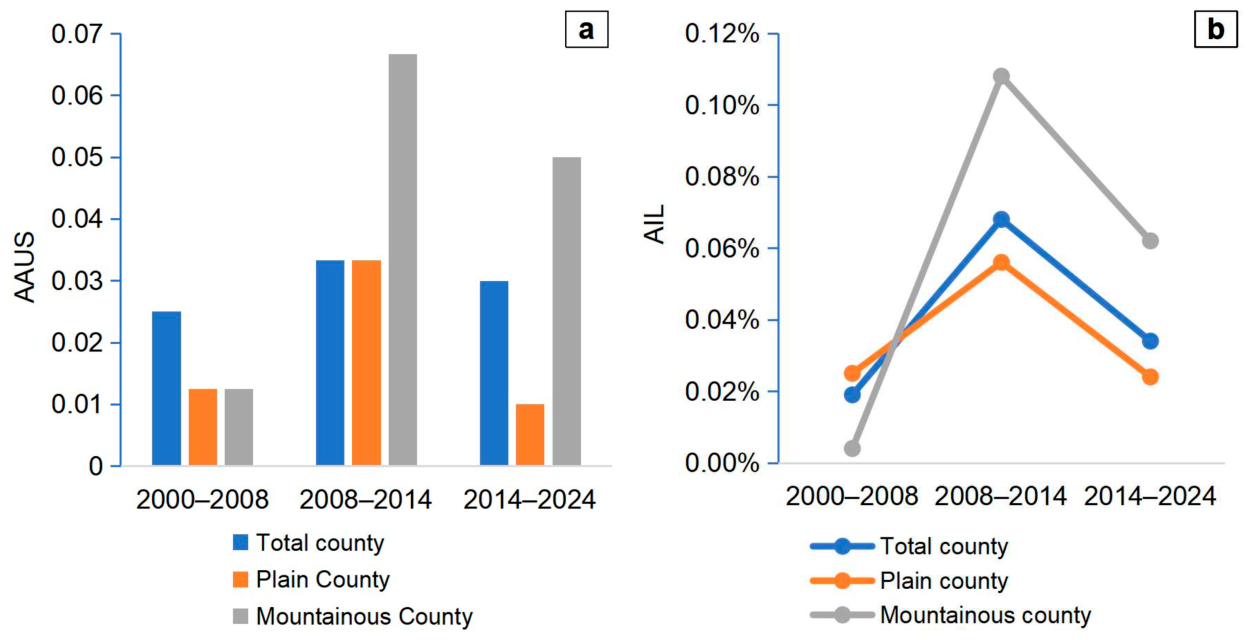
Over the past two decades, AAUS and AIL for impervious surfaces in the Capital Metropolitan Area first increased and then decreased (Figure 4). During 2008–2014, AAUS reached 0.033, higher than in the other two periods. At the same time, AIL increased from 0.019% in 2000–2008 to 0.068% in 2008–2014, before declining slightly. Plain and mountainous counties differed in their climbing speed. During 2000–2008, AIL in mountainous counties was lower than that in plain counties, indicating very slow slope climbing during that period. After 2008, AIL in mountainous counties increased rapidly and became clearly higher than the metropolitan and plain-county averages. Although it slowed by 2024, it remained above the average for the Capital Metropolitan Area.
Figure 4.
Average annual upper slope boundary (AAUS) and slope-climbing index of impervious surfaces in the Capital Metropolitan Area. (a) Average annual upper slope boundary (AAUS); (b) average annual impervious-land slope-climbing index (AIL).
4.3. Spatial Pattern of Impervious Surfaces in the Counterfactual Scenario
To simulate impervious surface expansion in 2024 under a no-policy-intervention counterfactual scenario, a reliable land-use change simulation model was required. We used land-use data from 2000 and 2008 with the IntPLUS model to simulate impervious surface expansion in 2014, and compared the simulated results with the observed 2014 land-use data for cross-validation. The Kappa coefficient, Overall accuracy, and FOM were 0.905, 0.936, and 0.145, respectively. These values indicate that the model achieved satisfactory performance and was able to reasonably represent the spatial expansion of impervious surfaces (Table S3).
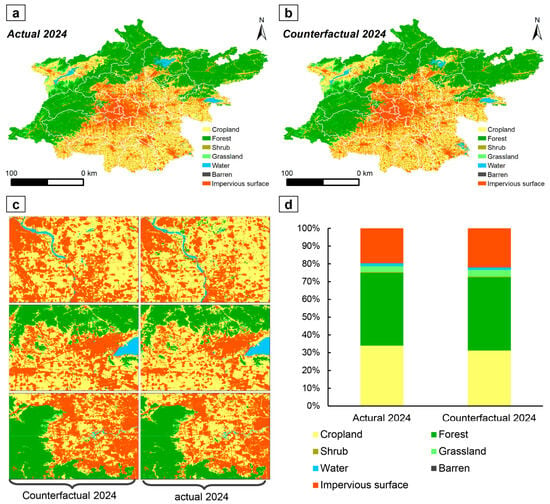
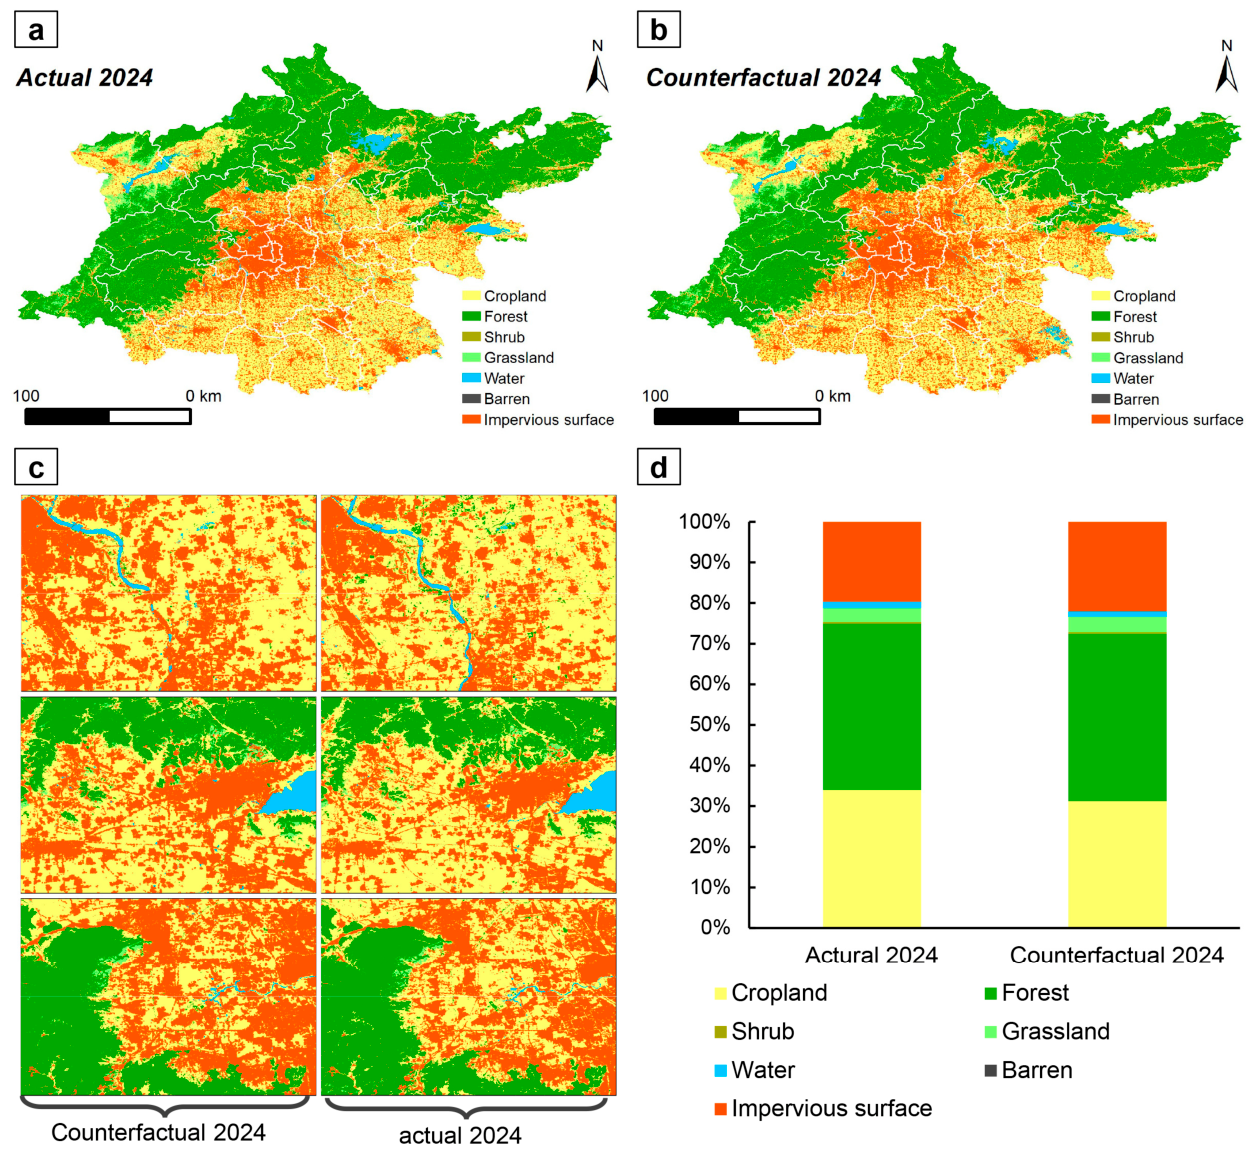
We assumed that in the absence of policy intervention, impervious surface expansion in 2024 would continue along the previous-stage trajectory, with model parameters kept consistent with the previous stage. Using the trained model and the selected driving factors, we simulated the 2024 land-use spatial pattern under the counterfactual scenario (Figure 5). Under the 2024 counterfactual scenario, impervious surfaces in the Capital Metropolitan Area continued to expand substantially in the plains, reaching 7830.62 km2, which is 11.95% higher than the actual 2024 area. Grassland area also increased substantially to 1359.14 km2, an increase of 9.14%. Forest area remained generally stable, increasing by only 0.78%. Cropland, shrub, water, and barren land all decreased substantially, with decreases of 8.09%, 10.61%, 13.82%, and 47.05%, respectively. These results indicate that without policy intervention, impervious surface expansion in the Capital Metropolitan Area would likely have followed historical inertia, with large areas of cropland, shrubland, and water around urban areas continuously converted to impervious surfaces.
Figure 5.
Comparison between actual and counterfactual land-use patterns. (a) Actual land use in 2024; (b) simulated 2024 land use under the counterfactual scenario; (c) enlarged local view; (d) proportions of land-use types under the actual and counterfactual scenarios.
4.4. Slope-Climbing Characteristics of Impervious Surfaces in the Counterfactual Scenario
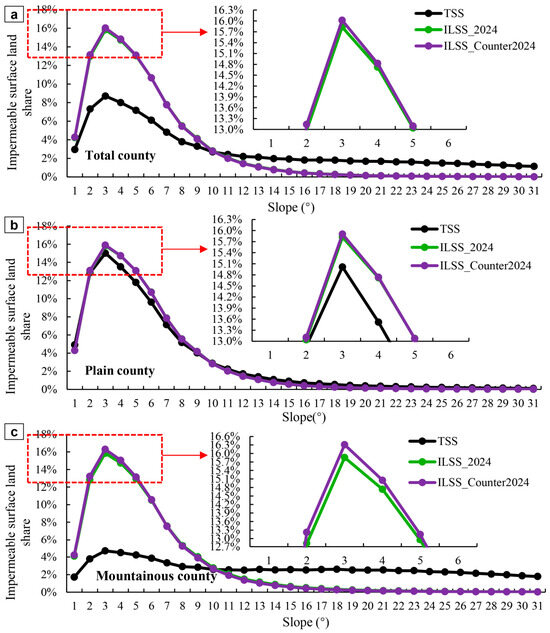
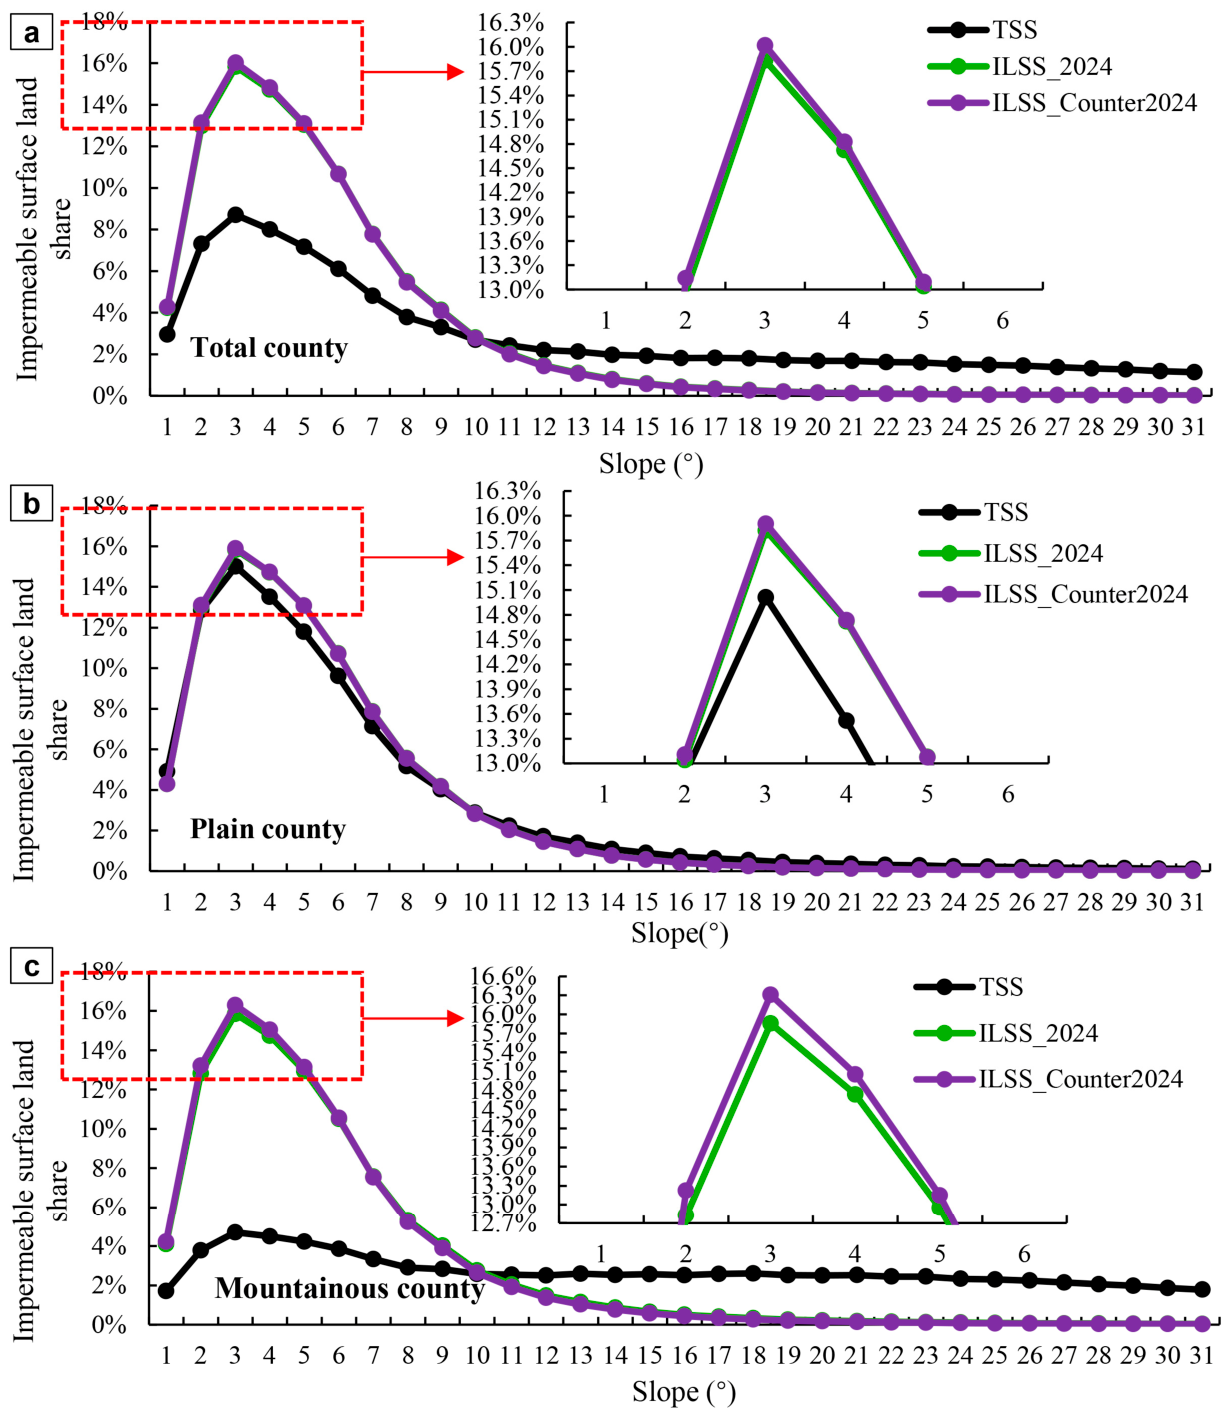
Based on the 2024 counterfactual impervious surface pattern, we analyzed the slope-climbing characteristics of impervious surfaces in the Capital Metropolitan Area. The results show that the mean slope of impervious surfaces in the Capital Metropolitan Area was 4.940 degrees under the counterfactual scenario, representing the first decline since 2000 and a decrease of 0.013 degrees relative to 2014 (Table 5). Mountainous counties showed a similar decline, whereas plain counties continued to exhibit an increase. This spatial disparity may partly reflect the restrictive effect of policy intervention on the expansion of impervious surfaces in the plain areas, and it also occurs concurrently with broader social and economic changes. From the impervious surface slope spectrum, the peak region under the counterfactual scenario increased, indicating greater concentration of impervious surfaces in low-slope areas. The slope-spectrum peak for the Capital Metropolitan Area was 16.02% under the counterfactual scenario, compared with 15.83% under the actual 2024 scenario (Figure 6). The corresponding values were 15.90% versus 15.82% for plain counties and 16.31% versus 15.86% for mountainous counties. As detailed in Table S4, the TSS and ILSS intersection threshold T for the Capital Metropolitan Area increased from 11.2° in 2000 to 11.9° in 2024. Mountainous counties consistently exhibited higher thresholds (rising from 11.6° to 12.6°) than plain counties (11.1° to 11.5°). Furthermore, the actual 2024 threshold (11.9°) exceeded the 2024 counterfactual threshold (11.6°), reflecting the spatial regulatory effects of regional policies. These results suggest that policy intervention likely played a role in constraining impervious surface expansion in low-slope flat areas of the Capital Metropolitan Area. Furthermore, the reliability of employing the IntPLUS framework within the distinct plain-mountain topography of the Capital Metropolitan Area is well-supported by existing regional studies [39,40]. These studies consistently demonstrate that the explicit incorporation of terrain constraints, such as slope and elevation gradients, into cellular automata and PLUS-based simulations effectively prevents unrealistic model behavior in high-slope zones, thereby establishing a credible baseline for evaluating policy-driven spatial restructuring.
Table 5.
Mean slope of impervious surfaces in the Capital Metropolitan Area under the counterfactual scenario.
Figure 6.
Terrain slope spectrum and impervious-land slope spectrum in the Capital Metropolitan Area under the 2024 counterfactual scenario. (a) All county-level units; (b) plain counties; (c) mountainous counties.
4.5. Slope Characteristics of Land Sources for New Impervious Surfaces
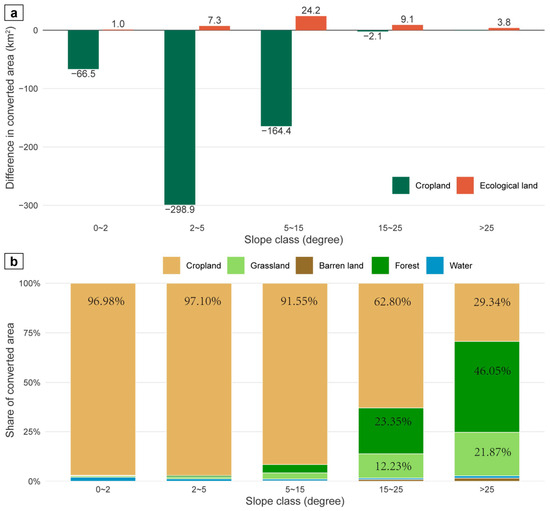
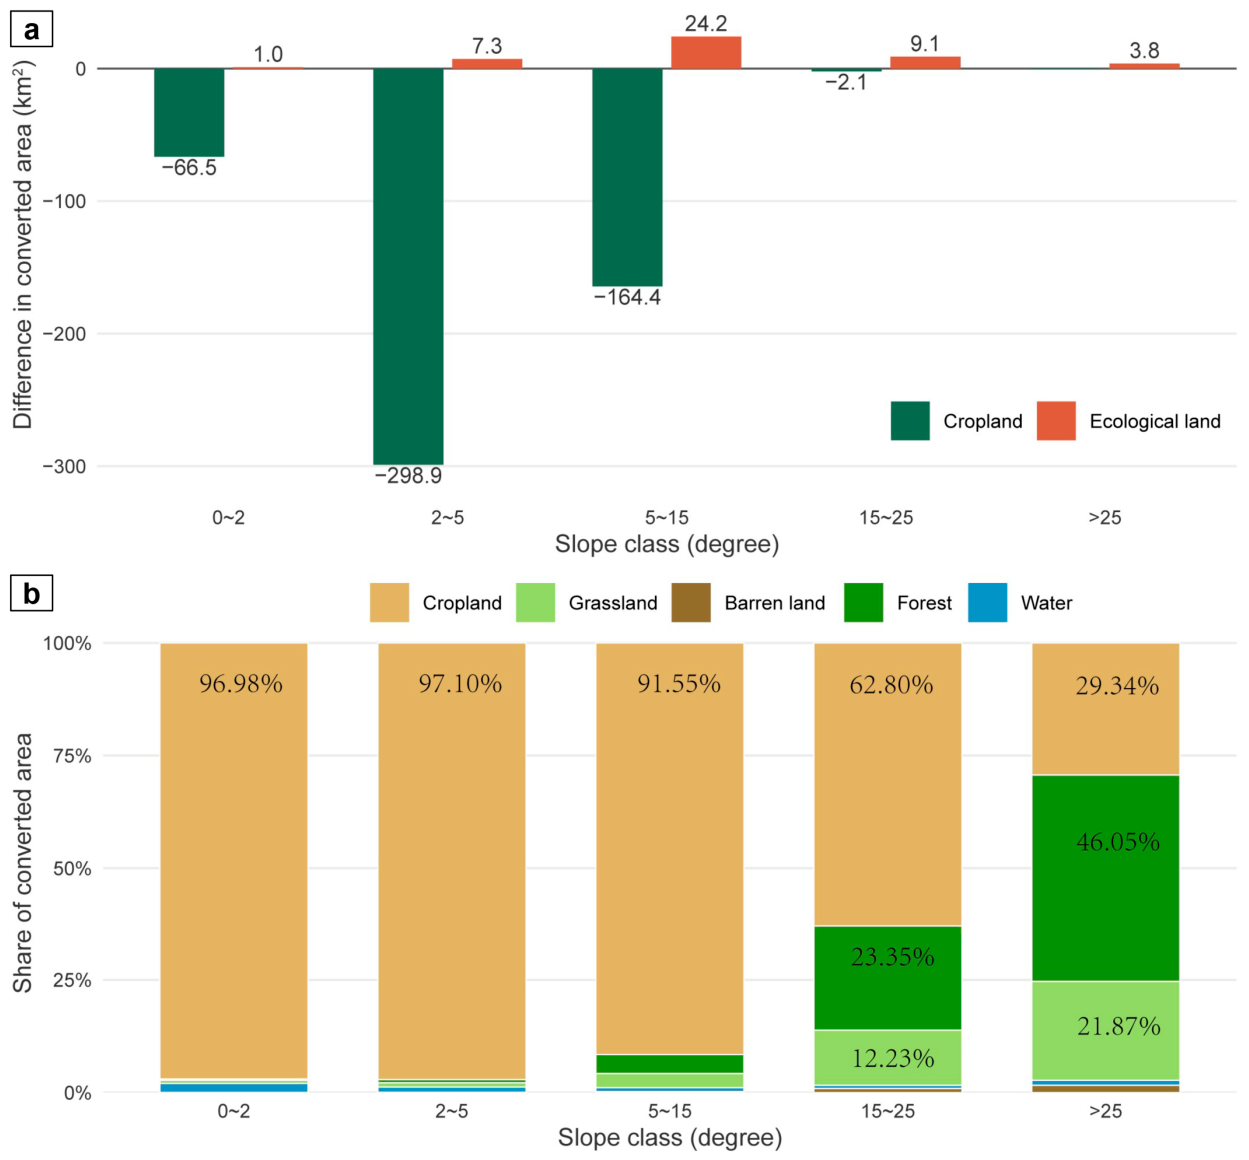
We further quantified how impervious-surface slope climbing affected land-use change under different scenarios. For analytical convenience, forest, grassland, barren land, and water were grouped as ecological land. Compared with the counterfactual scenario, the actual 2024 scenario substantially reduced cropland occupation by impervious surfaces in low-slope areas, but at the cost of slight losses of ecological land in mid- and high-slope areas (Figure 7a). Specifically, in the actual 2024 scenario, cropland occupation decreased by 66.5 km2 in the 0–2 degree slope band, by 298.9 km2 in the 2–5 degree band, and by 164.4 km2 in the 5–15 degree band, accounting for 11.96%, 49.45%, and 36.43% of the total reduction, respectively. For ecological land, the largest actual-minus-counterfactual increase in conversion to impervious surface occurred in the 5–15 degree slope band, with an increase of approximately 24.2 km2, followed by 9.1 km2 in the 15–25 degree band and 7.3 km2 in the 2–5 degree band. Overall, as slope increased, the dominant source of new impervious surfaces in the actual 2024 scenario gradually shifted from cropland to ecological land, with the transition becoming particularly evident above 15 degrees. In the >25 degree steep-slope band, nearly 70% of new impervious surfaces came from ecological land, including approximately 46.05% from forest and 21.87% from grassland. In contrast, more than 90% of new impervious surfaces below 15 degrees came from cropland.
Figure 7.
Slope-dependent land-source transitions to impervious surfaces under actual and counterfactual development pathways, 2014–2024. (a) Differences in cropland and ecological-land conversion between actual and counterfactual scenarios, calculated as actual minus counterfactual. Negative values indicate reduced land occupation under the actual pathway, whereas positive values indicate higher occupation. (b) Source composition of actual impervious surface expansion across slope classes.
5. Discussion
5.1. Comparison with Previous Studies
Extensive evidence [37,39] suggests that the spatial growth pattern of impervious surfaces in Chinese cities has undergone a transition. In the early stage, impervious-surface expansion in most cities followed a monocentric pattern and expanded outward in a concentric manner [37,41]. Slope climbing was slow during this stage, with Beijing’s six-ring spatial structure on the plains providing a typical example. As disorderly urban sprawl led to traffic congestion, environmental pollution, ecological degradation, and other sustainability challenges, Chinese urban planners and policymakers adjusted industrial layouts through spatial planning [42], transport infrastructure construction, and growth-control policies, including greenbelt-like approaches inspired by the United Kingdom [43]. These measures alleviated land pressure in urban cores, promoted high-density development in urban fringe areas, and encouraged impervious surfaces to expand toward steeper areas [20,44]. Our results show that since the implementation of the Beijing–Tianjin–Hebei coordinated development strategy in 2014, the sprawling expansion of impervious surfaces in the plains of the Capital Metropolitan Area has been substantially constrained, helping protect fertile and scarce cropland around the city. This indicates that policy factors may have optimized the territorial spatial pattern of the Capital Metropolitan Area. This finding is consistent with Zeng et al. (2025) [27] and Wang et al. (2026) [45]. Recent research on impervious surface changes in the five megacities of Beijing, Shanghai, Tianjin, Guangzhou, and Shenzhen reported that after 2015, the expansion rate of impervious surfaces in these cities slowed markedly and edge-expansion became the dominant growth type [42].
By comprehensively analyzing impervious-surface slope climbing, this study extends the discussion of vertical urban expansion from topographically constrained cities to a plain-dominated metropolitan region. Previous studies have mainly focused on hilly and mountainous cities, where the limited supply of low-slope land forces urban expansion to encounter topographic barriers at an early stage [46,47]. The relatively modest slope-climbing magnitude observed in the Capital Metropolitan Area can be understood in this context. In mountainous settings, upslope expansion may become a necessary response to the scarcity of developable flat land. By contrast, Mohapatra et al. (2014) showed that urban expansion in Gwalior initially concentrated on plains because these areas were easier and less costly to develop; only when available plain land became increasingly constrained did expansion extend onto residual and denudational hills [46]. Located on the North China Plain, the study area is subject to relatively weak topographic constraints, and the upslope expansion of impervious surfaces emerged only at a later stage. By contrast, in regions with greater topographic relief, impervious-surface slope increased earlier and more substantially [19]. Similarly, Woldesemayat and Genovese (2021) found that urban expansion in Addis Ababa was concentrated in relatively flat and accessible sectors, whereas physical barriers limited development in other directions [47]. These comparisons suggest that slope climbing is shaped not by topographic relief alone, but by the interaction of terrain scarcity, land suitability, accessibility, and spatial planning. Thus, the modest increase in impervious-surface slope observed in the Capital Metropolitan Area does not indicate an absence of terrain adaptation. Rather, it reflects the fact that low-slope land remains the dominant development space, while upslope expansion occurs incrementally along the metropolitan fringe rather than as the primary growth mode.
The contrasting trajectories of plain and mountainous counties further refine this interpretation. After 2014, slope climbing slowed in plain counties but became more pronounced in mountainous counties. This divergence suggests that coordinated development policies did not uniformly suppress vertical expansion; instead, they may have altered its spatial distribution. While restrictions on low-slope plain expansion reduced the need for further development within plain counties, part of the remaining development pressure may have been redirected toward piedmont and mountainous areas, where terrain constraints and ecological sensitivity are greater. International evidence from the Metropolitan Region of Santiago provides a useful comparison. Schuster-Olbrich et al. (2024) found that urban expansion was concentrated in rural and peri-urban municipalities outside the established urban boundary, while the core area tended to densify and the Andes acted as a natural barrier to expansion [48]. Their findings also demonstrate that planning instruments may produce different outcomes depending on their spatial coverage and implementation: growth boundaries can contain expansion, whereas partial or delayed regulation may leave peripheral agricultural land exposed to low-density development. Taken together with evidence from Addis Ababa, these studies indicate that topographic responses to urbanization are spatially differentiated rather than uniform. The Capital Metropolitan Area therefore represents a boundary condition to the conventional mountain-city narrative: in plain-dominated metropolitan regions, slope climbing is initially modest because low-slope land remains available, but it may intensify in mountainous counties when policy and land-use constraints narrow the feasible development space.
By comprehensively analyzing impervious-surface slope climbing, this study evaluates the vertical evolution of impervious surfaces in China’s Capital Metropolitan Area. Previous studies related to impervious surface slope climbing have mainly focused on hilly and mountainous cities where flat land is scarce [49,50]. In these regions, impervious surfaces gradually climb upslope as urbanization proceeds and low-slope land resources become increasingly constrained. Zhou et al. (2021) found that regions with greater topographic relief exhibit stronger impervious surface slope-climbing intensity [19]. Although our study area is located on the North China Plain, where topographic constraints are relatively limited, our results also support the general slope-climbing pattern observed in previous research [19,22]. In addition, the comparison between plain and mountainous counties confirms the robustness of earlier findings and provides new regional-scale insights into impervious surface slope climbing.
Existing studies have also used land-use change simulation to evaluate the effects of the Beijing–Tianjin–Hebei coordinated development strategy on territorial space. For example, Yang et al. (2020) integrated the Dyna-CLUE model and Markov model to predict land-use patterns in the Beijing–Tianjin–Hebei region under three scenarios in 2030 [51]. Compared with these studies, the contribution of this paper lies in combining counterfactual simulation with slope-spectrum analysis. This allows us not only to identify whether impervious-surface expansion was reduced, but also to reveal how it changed across different slope bands. At the same time, the IntPLUS model used in this study has advantages for improving simulation accuracy in contexts of land competition. The post-2014 territorial spatial evolution of the Capital Metropolitan Area was not a simple process of impervious-surface expansion, but rather a process of competition and substitution among impervious surfaces, cropland, forest, grassland, water, and other land-use types. Built on the PLUS framework, the IntPLUS model introduces a land-use interaction network that can identify promoting and inhibiting relationships among different land-use types and embed this competition into the CA simulation process.
5.2. Policy Implications and Limitations
This study finds that under the actual 2024 scenario, impervious surface area in low-slope and gently sloping areas was clearly lower than in the counterfactual scenario. While this divergence suggests that territorial spatial governance under the Beijing–Tianjin–Hebei coordinated development strategy played a notable role, we acknowledge that it should not be attributed solely to policy interventions. Concurrent macro-environmental factors [52], such as national economic deceleration, real-estate market adjustments, and pandemic-related shocks [53], also acted as important confounders that contributed to moderating expansion rates. At the same time, however, the proportion of ecological land converted to impervious surfaces increased in mid- and high-slope areas, indicating that part of the construction pressure may have shifted toward spaces with stronger topographic constraints and greater ecological sensitivity. Furthermore, we acknowledge that slope gradient should be interpreted primarily as a topographic dimension of urban expansion rather than as a direct, normative measure of sustainable or appropriate development. While shifting toward steeper terrain often elevates ecological sensitivity and engineering costs, low-slope plain expansion is not inherently sustainable if it aggressively encroaches upon high-quality prime agricultural land or vital hydrological networks. This means that controlling only the total area of impervious surfaces is insufficient to fully avoid ecological risk. Future urban sustainability must coordinate urban construction, food security, and ecological security [20]. We suggest that future territorial spatial planning in the Capital Metropolitan Area should strengthen slope-sensitive regulation by incorporating slope thresholds, ecological land types, and development suitability into impervious surface admission rules [49]. In addition, new construction demand should be guided toward stock renewal, redevelopment of inefficient land, and compact layouts around transport corridors to avoid creating new development pressure in ecologically sensitive sloping areas. A slope-spectrum monitoring mechanism should also be established at the metropolitan scale, incorporating impervious surface expansion, cropland occupation, and ecological land conversion across different slope bands into annual territorial spatial monitoring and assessment. Compared with statistics that measure only total construction-land change, slope-spectrum monitoring can identify earlier whether expansion pressure is shifting toward mid- and high-slope areas, ecologically sensitive zones, and mountainous fringes, thereby providing a basis for dynamic optimization of ecological conservation red lines, urban development boundaries, and cropland protection targets.
We acknowledge several inherent limitations. First, while the macro-level mean slope change is modest (0.135° over 24 years) and approaches DEM and classification error thresholds, the notable sub-regional divergence between plain and mountainous counties (Table 3) reveals a systematic directional trend rather than random noise. Second, extracting impervious surface expansion from land-use data involves uncertainty, especially because small patches in mountainous areas may be omitted. Previous research has found that impervious surfaces in mountainous areas are often misclassified as forest or grassland [54]. Third, parameter settings in the IntPLUS model involve a degree of subjectivity. Future research should conduct sensitivity analyses and compare how different parameter settings affect land-use change simulation results. Finally, the FOM of 0.145 reflects inherent uncertainties in long-term spatial extrapolation, meaning the counterfactual simulation should be interpreted as a macro-policy baseline rather than a precise forecast.
6. Conclusions
This study integrated slope-spectrum analysis and the IntPLUS model to analyze the spatiotemporal evolution and slope-climbing trend of impervious surfaces in China’s Capital Metropolitan Area from 2000 to 2024, and constructed a 2024 counterfactual scenario to examine land-use pattern and slope characteristics under a historical-inertia pathway. The main findings are summarized as follows.
First, from 2000 to 2024, impervious surface area in the Capital Metropolitan Area increased by approximately 59.81%, with new impervious surfaces mainly concentrated in the eastern plains. After 2014, the expansion rate of impervious surfaces slowed markedly.
Second, the mean slope of impervious surfaces in the Capital Metropolitan Area showed a steady upward trend, increasing from 4.872 degrees in 2000 to 5.007 degrees in 2024. The upper slope-spectrum boundary increased from 11.2 degrees in 2000 to 11.9 degrees in 2024, and both mountainous and plain areas experienced different degrees of slope climbing.
Third, the counterfactual scenario indicates that impervious surfaces in the Capital Metropolitan Area would have continued to follow the historical change trajectory and occupied large areas of low-slope cropland. By contrast, the actual 2024 scenario substantially reduced impervious surface expansion below 15 degrees, suggesting that post-2014 territorial spatial governance, acting alongside broader macroeconomic adjustments, likely helped constrain disorderly low-slope plain expansion and alleviate cropland occupation pressure. However, part of the new impervious surface expansion under the actual 2024 scenario still shifted toward mid- and high-slope areas and ecological land, indicating that future territorial spatial planning should pay closer attention to the potential increase in ecological risk in steep-slope areas.
Finally, integrating the slope-spectrum monitoring mechanism into land-use change and simulation models offers a viable pathway to improving the predictability of future urban expansion at broad spatial scales. By transforming complex topographic constraints into quantifiable slope-band indicators, this approach enhances the capacity of models to capture subtle terrain-dependent patterns of expansion. Future research should focus on several key technical aspects, including the dynamic parameterization of slope bands across multiple scales, adaptive threshold calibration, and the coupling of topographic constraints with complex socioeconomic drivers, so as to further improve the accuracy of spatial allocation.
Supplementary Materials
The following supporting information can be downloaded at: https://www.mdpi.com/article/10.3390/land15101866/s1, Table S1: Neighborhood-factor weights. Table S2: Conversion rules for land use types. Table S3: Accuracy assessment of IntPLUS model prediction for different land-use types. Table S4: The threshold T (intersection of TSS and ILSS).
Author Contributions
J.G.: writing—original draft, visualization, software, methodology, investigation, and data curation. W.Z.: supervision and conceptualization. J.Q.: validation and software. All authors have read and agreed to the published version of the manuscript.
Funding
This study was funded by the National Natural Science Foundation of China (Grant No. 42601483; 42501344), the Research Project on Rural Revitalization Soft Science of the Jiangsu Provincial Department of Agriculture and Rural Affairs (Grant No. 26ASS036) and the Soft science project of the Jiangsu Academy of Agricultural Sciences (Grant No. ZX(26)2001).
Data Availability Statement
The original contributions presented in the study are included in the article, and further inquiries can be directed to the corresponding author.
Conflicts of Interest
The authors declare no conflict of interest.
References
- Angel, S.; Parent, J.; Civco, D.L.; Blei, A.; Potere, D. The Dimensions of Global Urban Expansion: Estimates and Projections for All Countries, 2000–2050. Prog. Plan. 2011, 75, 53–107. [Google Scholar] [CrossRef] [Scilit]
- Liu, X.; Huang, Y.; Xu, X.; Li, X.; Li, X.; Ciais, P.; Lin, P.; Gong, K.; Ziegler, A.D.; Chen, A.; et al. High-Spatiotemporal-Resolution Mapping of Global Urban Change from 1985 to 2015. Nat. Sustain. 2020, 3, 564–570. [Google Scholar] [CrossRef] [Scilit]
- Chace, J.F.; Walsh, J.J. Urban Effects on Native Avifauna: A Review. Landsc. Urban Plan. 2006, 74, 46–69. [Google Scholar] [CrossRef] [Scilit]
- Grimmond, S. Urbanization and Global Environmental Change: Local Effects of Urban Warming. Geogr. J. 2007, 173, 83–88. [Google Scholar] [CrossRef] [Scilit]
- Christiaensen, L.; Kanbur, R. Secondary Towns and Poverty Reduction: Refocusing the Urbanization Agenda. Annu. Rev. Resour. Econ. 2017, 9, 405–419. [Google Scholar] [CrossRef] [Scilit]
- United Nations. World Urbanization Prospects 2025: Summary of Results; United Nations: New York, NY, USA, 2025. [Google Scholar]
- Giuliano, G.; Kang, S.; Yuan, Q. Agglomeration Economies and Evolving Urban Form. Ann. Reg. Sci. 2019, 63, 377–398. [Google Scholar] [CrossRef] [Scilit]
- Chavhan, S.; Venkataram, P. Prediction Based Traffic Management in a Metropolitan Area. J. Traffic Transp. Eng. 2020, 7, 447–466. [Google Scholar] [CrossRef] [Scilit]
- Melchiorri, M.; Florczyk, A.; Freire, S.; Schiavina, M.; Pesaresi, M.; Kemper, T. Unveiling 25 Years of Planetary Urbanization with Remote Sensing: Perspectives from the Global Human Settlement Layer. Remote Sens. 2018, 10, 768. [Google Scholar] [CrossRef] [Scilit]
- Qian, J.; Zhao, H.; Wang, X.; Wang, T.; Liu, B.; Feng, Z.; Xue, C. Insights from Land Sparing and Land Sharing Frameworks for Land Productivity Degradation Governance in the Yangtze River Delta Urban Agglomeration, China. Land Degrad. Dev. 2024, 35, 4240–4256. [Google Scholar] [CrossRef] [Scilit]
- Van De Voorde, T.; Jacquet, W.; Canters, F. Mapping Form and Function in Urban Areas: An Approach Based on Urban Metrics and Continuous Impervious Surface Data. Landsc. Urban Plan. 2011, 102, 143–155. [Google Scholar] [CrossRef] [Scilit]
- Deng, C.; Zhu, Z. Continuous Subpixel Monitoring of Urban Impervious Surface Using Landsat Time Series. Remote Sens. Environ. 2020, 238, 110929. [Google Scholar] [CrossRef] [Scilit]
- Shahtahmassebi, A.R.; Song, J.; Zheng, Q.; Blackburn, G.A.; Wang, K.; Huang, L.Y.; Pan, Y.; Moore, N.; Shahtahmassebi, G.; Sadrabadi Haghighi, R.; et al. Remote Sensing of Impervious Surface Growth: A Framework for Quantifying Urban Expansion and Re-Densification Mechanisms. Int. J. Appl. Earth Obs. Geoinf. 2016, 46, 94–112. [Google Scholar] [CrossRef] [Scilit]
- Zhang, T.; Huang, X. Monitoring of Urban Impervious Surfaces Using Time Series of High-Resolution Remote Sensing Images in Rapidly Urbanized Areas: A Case Study of Shenzhen. IEEE J. Sel. Top. Appl. Earth Obs. Remote Sens. 2018, 11, 2692–2708. [Google Scholar] [CrossRef]
- Uhl, J.H.; Connor, D.S.; Leyk, S.; Braswell, A.E. A Century of Decoupling Size and Structure of Urban Spaces in the United States. Commun. Earth Environ. 2021, 2, 20. [Google Scholar] [CrossRef] [Scilit] [PubMed]
- Mathew, A.; Khandelwal, S.; Kaul, N. Spatial and Temporal Variations of Urban Heat Island Effect and the Effect of Percentage Impervious Surface Area and Elevation on Land Surface Temperature: Study of Chandigarh City, India. Sustain. Cities Soc. 2016, 26, 264–277. [Google Scholar] [CrossRef] [Scilit]
- Azam, C.; Le Viol, I.; Julien, J.-F.; Bas, Y.; Kerbiriou, C. Disentangling the Relative Effect of Light Pollution, Impervious Surfaces and Intensive Agriculture on Bat Activity with a National-Scale Monitoring Program. Landsc. Ecol. 2016, 31, 2471–2483. [Google Scholar] [CrossRef] [Scilit]
- Chen, J. Rapid Urbanization in China: A Real Challenge to Soil Protection and Food Security. CATENA 2007, 69, 1–15. [Google Scholar] [CrossRef] [Scilit]
- Zhou, L.; Dang, X.; Mu, H.; Wang, B.; Wang, S. Cities Are Going Uphill: Slope Gradient Analysis of Urban Expansion and Its Driving Factors in China. Sci. Total Environ. 2021, 775, 145836. [Google Scholar] [CrossRef] [Scilit] [PubMed]
- Shi, K.; Cui, Y.; Liu, S.; Wu, Y. Global Urban Land Expansion Tends to Be Slope Climbing: A Remotely Sensed Nighttime Light Approach. Earth’s Future 2023, 11, e2022EF003384. [Google Scholar] [CrossRef] [Scilit]
- Peng, Q.; Tang, L.; Chen, J.; Wu, Y.; Chen, X. Study on the Evolution of Construction Land Slope Spectrum in Shenzhen during 2000-2015. J. Nat. Resour. 2018, 33, 2200–2212. [Google Scholar] [CrossRef] [Scilit][Green Version]
- Shi, K.; Liu, G.; Zhou, L.; Cui, Y.; Liu, S.; Wu, Y. Satellite Remote Sensing Data Reveal Increased Slope Climbing of Urban Land Expansion Worldwide. Landsc. Urban Plan. 2023, 235, 104755. [Google Scholar] [CrossRef] [Scilit]
- Shao, L.; Liao, W.; Li, P.; Luo, M.; Xiong, X.; Liu, X. Drivers of Global Surface Urban Heat Islands: Surface Property, Climate Background, and 2D/3D Urban Morphologies. Build. Environ. 2023, 242, 110581. [Google Scholar] [CrossRef] [Scilit]
- Wang, K.; He, T.; Xiao, W.; Yang, R. Projections of Future Spatiotemporal Urban 3D Expansion in China under Shared Socioeconomic Pathways. Landsc. Urban Plan. 2024, 247, 105043. [Google Scholar] [CrossRef] [Scilit]
- Li, H.; Peng, J.; Yanxu, L.; Yi’na, H. Urbanization impact on landscape patterns in Beijing City, China: A spatial heterogeneity perspective. Ecol. Indic. 2017, 82, 50–60. [Google Scholar] [CrossRef] [Scilit]
- Li, T.; Liu, Y.; Wang, C.; Olsson, G.; Wang, Z.; Wang, H. Decentralization of the Non-Capital Functions of Beijing: Industrial Relocation and Its Environmental Effects. J. Clean. Prod. 2019, 224, 545–556. [Google Scholar] [CrossRef] [Scilit]
- Zeng, L.; Yang, L.; Su, L.; Hu, H.; Feng, C. The Impact of Policies on Land Use and Land Cover Changes in the Beijing–Tianjin–Hebei Region in China. Environ. Impact Assess. Rev. 2025, 110, 107676. [Google Scholar] [CrossRef] [Scilit]
- Ju, X.; Li, W.; He, L.; Li, J.; Han, L.; Mao, J. Ecological Redline Policy May Significantly Alter Urban Expansion and Affect Surface Runoff in the Beijing-Tianjin-Hebei Megaregion of China. Environ. Res. Lett. 2020, 15, 1040b1. [Google Scholar] [CrossRef] [Scilit]
- Bao, W.; Yang, Y.; Zou, L. How to Reconcile Land Use Conflicts in Mega Urban Agglomeration? A Scenario-Based Study in the Beijing-Tianjin-Hebei Region, China. J. Environ. Manag. 2021, 296, 113168. [Google Scholar] [CrossRef] [Scilit] [PubMed]
- Zhao, L.; Zhang, G. Evaluation and Welfare Effect of Coordinated Ecological Development of the Beijing–Tianjin–Hebei Region. Chin. J. Popul. Resour. Environ. 2021, 19, 283–290. [Google Scholar] [CrossRef] [Scilit]
- Zhao, Y.; Hou, P.; Jiang, J.; Zhai, J.; Chen, Y. Temporal and Spatial Analysis of Coupling Coordination in Beijing–Tianjin–Hebei Urban Agglomeration: Ecology, Environment and Economy. Land 2024, 13, 512. [Google Scholar] [CrossRef] [Scilit]
- Yang, J.; Huang, X. The 30m Annual Land Cover Dataset and Its Dynamics in China from 1990 to 2019. Earth Syst. Sci. Data 2021, 13, 3907–3925. [Google Scholar] [CrossRef] [Scilit]
- Tang, G.; Li, F.; Liu, X.; Long, Y.; Yang, X. Research on the Slope Spectrum of the Loess Plateau. Sci. China Ser. E Technol. Sci. 2008, 51, 175–185. [Google Scholar] [CrossRef] [Scilit]
- Liang, X.; Huang, J.-L.; Guan, Q. Unveiling Land Competition through Interaction Networks: A Consistency-Based Mining and Simulation Model That Integrates Inhibiting Effects of Land Uses. Landsc. Urban Plan. 2025, 263, 105458. [Google Scholar] [CrossRef] [Scilit]
- Ma, G.; Li, Q.; Zhang, J.; Zhang, L.; Cheng, H.; Ju, Z.; Sun, G. Simulation and Analysis of Land-Use Change Based on the PLUS Model in the Fuxian Lake Basin (Yunnan–Guizhou Plateau, China). Land 2023, 12, 120. [Google Scholar] [CrossRef] [Scilit]
- Liang, X.; Guan, Q.; Clarke, K.C.; Liu, S.; Wang, B.; Yao, Y. Understanding the Drivers of Sustainable Land Expansion Using a Patch-Generating Land Use Simulation (PLUS) Model: A Case Study in Wuhan, China. Comput. Environ. Urban Syst. 2021, 85, 101569. [Google Scholar] [CrossRef] [Scilit]
- Yin, C.; Meng, F.; Yang, X.; Yang, F.; Fu, P.; Yao, G.; Chen, R. Spatio-Temporal Evolution of Urban Built-up Areas and Analysis of Driving Factors—A Comparison of Typical Cities in North and South China. Land Use Policy 2022, 117, 106114. [Google Scholar] [CrossRef] [Scilit]
- Li, L.; Huang, C.; Liu, Y. Detecting the Contribution of Transport Development to Urban Construction Land Expansion in the Beijing-Tianjin-Hebei Region of China Based on Machine Learning. Land Use Policy 2025, 157, 107622. [Google Scholar] [CrossRef] [Scilit]
- Ji, W.; Wang, Z.; Zhang, H.; Zhang, B.; Yang, F.; Yu, Z.; Li, H.; He, M.; Lv, H.; Feng, Z. Carbon Storage Change, Driving Mechanism, and Scenario Prediction in Beijing-Tianjin-Hebei Region for Regional Carbon Neutral Target: From History to Future. Sci. Total Environ. 2025, 993, 180028. [Google Scholar] [CrossRef] [Scilit] [PubMed]
- Zhai, Y.; Zhai, G.; Chen, Y.; Liu, J. Research on Regional Terrestrial Carbon Storage Based on the Pattern-Process-Function. Ecol. Inf. 2024, 80, 102523. [Google Scholar] [CrossRef] [Scilit]
- Kuang, W.; Chi, W.; Lu, D.; Dou, Y. A Comparative Analysis of Megacity Expansions in China and the U.S.: Patterns, Rates and Driving Forces. Landsc. Urban Plan. 2014, 132, 121–135. [Google Scholar] [CrossRef] [Scilit]
- Niu, F.; Li, J. Modeling the Population and Industry Distribution Impacts of Urban Land Use Policies in Beijing. Land Use Policy 2018, 70, 347–359. [Google Scholar] [CrossRef] [Scilit]
- Gennaio, M.-P.; Hersperger, A.M.; Bürgi, M. Containing Urban Sprawl—Evaluating Effectiveness of Urban Growth Boundaries Set by the Swiss Land Use Plan. Land Use Policy 2009, 26, 224–232. [Google Scholar] [CrossRef] [Scilit]
- Zhou, Y.; Zhao, Y. Multi-Dimensional Analysis of Urban Growth Characteristics Integrating Remote Sensing Data: A Case Study of the Beijing–Tianjin–Hebei Region. Remote Sens. 2025, 17, 548. [Google Scholar] [CrossRef] [Scilit]
- Wang, F.; Yang, Y.; Yu, L.; Sang, F.; Chen, Y.; Yang, S. Impervious Surface Area Changes and Urban Expansion in China’s Three Major Urban Agglomerations over the Past 40 Years. Remote Sens. 2026, 18, 2236. [Google Scholar] [CrossRef] [Scilit]
- Mohapatra, S.N.; Pani, P.; Sharma, M. Rapid Urban Expansion and Its Implications on Geomorphology: A Remote Sensing and GIS Based Study. Geogr. J. 2014, 2014, 1–10. [Google Scholar] [CrossRef] [Scilit]
- Woldesemayat, E.M.; Genovese, P.V. Monitoring Urban Expansion and Urban Green Spaces Change in Addis Ababa: Directional and Zonal Analysis Integrated with Landscape Expansion Index. Forests 2021, 12, 389. [Google Scholar] [CrossRef] [Scilit]
- Schuster-Olbrich, J.P.; Marquet, O.; Miralles-Guasch, C.; Fuentes Arce, L. Spatial Patterns and Drivers of Urban Expansion: An Exploratory Spatial Analysis of the Metropolitan Region of Santiago, Chile, from 1997 to 2013. Cities 2024, 153, 105305. [Google Scholar] [CrossRef] [Scilit]
- Zhang, L.; Wang, Y.; Bian, H.; Gao, J.; Yuan, Z.; Wang, Z.; Dai, Y.; Liu, H. Understanding the Ecological Impacts of Vertical Urban Growth in Mountainous Regions. Ecol. Inf. 2025, 87, 103079. [Google Scholar] [CrossRef] [Scilit]
- Jiao, W.; Zhou, L.; Wang, S.; Gao, H.; Huang, C.; Yuan, H. Impact of Urban Construction Land Gradient Expansion on Land Subsidence in Mountainous Cities. J. Mt. Sci. 2025, 22, 2586–2604. [Google Scholar] [CrossRef] [Scilit]
- Yang, Y.; Bao, W.; Liu, Y. Scenario Simulation of Land System Change in the Beijing-Tianjin-Hebei Region. Land Use Policy 2020, 96, 104677. [Google Scholar] [CrossRef] [Scilit]
- Zhang, Q.; Su, S. Determinants of Urban Expansion and Their Relative Importance: A Comparative Analysis of 30 Major Metropolitans in China. Habitat Int. 2016, 58, 89–107. [Google Scholar] [CrossRef] [Scilit]
- Sun, L.; Wu, C.; Li, J.; Du, B.; Zhang, L. Global Pandemic Reshaped Urban Expansion: Insights into the Policy and Spatial Expansion Pattern in Global 400+ Cities. GISci. Remote Sens. 2026, 63, 2642617. [Google Scholar] [CrossRef] [Scilit]
- Potapov, P.; Hansen, M.C.; Pickens, A.; Hernandez-Serna, A.; Tyukavina, A.; Turubanova, S.; Zalles, V.; Li, X.; Khan, A.; Stolle, F.; et al. The Global 2000–2020 Land Cover and Land Use Change Dataset Derived from the Landsat Archive: First Results. Front. Remote Sens. 2022, 3, 856903. [Google Scholar] [CrossRef] [Scilit]

Disclaimer/Publisher’s Note: The statements, opinions and data contained in all publications are solely those of the individual author(s) and contributor(s) and not of MDPI and/or the editor(s). MDPI and/or the editor(s) disclaim responsibility for any injury to people or property resulting from any ideas, methods, instructions or products referred to in the content. |
© 2026 by the authors. Licensee MDPI, Basel, Switzerland. This article is an open access article distributed under the terms and conditions of the Creative Commons Attribution (CC BY) license.