


Abstract
Accurate forecasting of sediment accumulation under extreme hydrodynamic forcing is essential for coastal engineering design and harbor management. This study evaluates the performance of Dynamic Mode Decomposition (DMD), optimized DMD (optDMD), and optimized DMD with stability constraints (optDMDs) for reconstructing and forecasting sediment accumulation height fields at the Dilderesi River mouth under a 50-year return period flood scenario. Sediment height fields generated using Delft3D are represented through reduced-order modal decompositions and the truncation rank is determined based on reconstruction-error analysis. Although all formulations reproduce the training data with negligible error, their predictive behavior differs during temporal extrapolation. Standard DMD exhibits rapid error growth at longer lead times. The optDMD formulation improves short- and intermediate-horizon performance but shows gradual degradation at extended lead times. Optimized DMD with stability constraints provides the most consistent long-horizon forecasts, maintaining high Nash–Sutcliffe efficiency and low RMSE across the full 9 h prediction interval. Examination of the continuous-time eigenvalue distributions and modal dynamics indicates that spectral characteristics of the reduced-order representation govern forecast robustness. The results demonstrate that enforcing spectral stability within reduced-order frameworks substantially enhances morphodynamic forecasting reliability under extreme flood conditions. The proposed approach provides a computationally efficient and physically consistent tool for sediment dynamics prediction in coastal engineering applications.
1. Introduction
The morphodynamic response of river mouths to extreme flood events represents a critical challenge for coastal infrastructure management, navigation safety, and ecosystem conservation [1]. Rivers serve as the primary conduits for transferring terrestrial material to coastal oceans, transporting substantial volumes of suspended and bed-load sediments during flood pulses that constitute a disproportionate fraction of the annual sediment budget [2,3]. These episodic sediment delivery events drive rapid morphological changes at river mouths, including delta progradation, mouth bar formation, and channel infilling, with direct implications for harbors and navigation channels located in these dynamic environments [4,5].
The challenge of flood-induced sedimentation is particularly acute in engineered coastal settings such as industrial ports, which are often situated near river mouths for logistical efficiency and consequently face accelerated siltation risks [6,7]. Rapid deposition of fine-grained sediments reduces navigational depths, disrupts port operations, and obstructs industrial water intake systems, generating substantial economic costs associated with maintenance dredging and operational downtime [8]. Furthermore, sediment plumes extending beyond port boundaries can bury benthic habitats, degrade water quality, and transport particle-bound contaminants, thereby transferring impacts from localized infrastructure concerns to broader coastal ecosystem degradation [9,10]. These multifaceted impacts make it essential to forecast the volume, timing, and spatial distribution of flood-driven sedimentation. Such forecasts are the foundation of sustainable sediment management, resilient infrastructure, and efficient port operations [11]. As Hawez et al. [12] point out, recent progress in process-based modeling provides the robust numerical frameworks required to address these complex problems.
While experimental data and analytical formulations offer essential baseline knowledge, numerical modeling has become indispensable for deciphering and forecasting sediment transport phenomena. This is primarily because such models can replicate the intricate physical processes that remain unobservable during extreme meteorological events [13]. During flood conditions, the sheer force and volume of flow radically reshape riverbeds and mobilize enormous sediment loads. In this context, numerical simulations offer a secure and dependable method for anticipating these alterations as they unfold. The utility of these tools extends beyond mere morphological forecasting; they are critical for evaluating the broader environmental and strategic consequences of sediment plumes [14]. These turbid plumes are primary agents in determining water quality that structure aquatic habitats, and steer the geomorphic evolution of shorelines. By simulating the trajectory of sediment particles which often serve as vectors for pollutants these models allow environmental authorities to pinpoint potential zones of contamination well before floodwaters retreat.
Using the Delft3D model, Boudet et al. [15] investigated sediment transport dynamics at the Rhone River mouth, with a specific focus on the influence of storms and floods. Their study determined that while river discharge governs overall sediment flux at the outlet, transport across the mouth-bar is controlled by the relative timing and magnitude of storm and flood events. Furthermore, they found that only floods with a return period greater than ten years generate sufficient energy to transport sediment offshore beyond the mouth-bar. While the Rhône River mouth represents a large, wave- and river-dominated deltaic system with substantial sediment discharge and relatively continuous hydrodynamic forcing, the Dilderesi River mouth exhibits distinctly different characteristics. The Dilderesi system is associated with a smaller catchment area, limited fetch conditions within a semi-enclosed basin, and relatively weak tidal influence. As a result, sediment transport in this region is primarily governed by highly episodic flood events rather than sustained hydrodynamic forcing. In addition, sediment accumulation in the study area reflects rapid, nonlinear responses to extreme discharge conditions, rather than gradual morphological evolution. These differences highlight that, unlike larger river-delta systems, the morphodynamic behavior at the Dilderesi River mouth is strongly event-driven and exhibits complex temporal variability, which motivates the use of data-driven reduced-order modeling approaches for efficient and robust prediction. This distinction further reveals the need for modeling approaches that can efficiently capture transient dynamics without relying on computationally intensive full-physics simulations. Investigating the dynamics of compound flooding, Kumbier et al. [16] used Delft3D to model a June 2016 event in the Shoalhaven Estuary, Australia, where a storm surge converged with peak river flow. Their findings emphasize that accurate flood risk assessment in such environments hinges on the simultaneous modeling of tidal and fluvial forces, a necessity amplified by the estuary’s rapid hydrological response. Focusing on geomorphic response, Shampa and Ali [17] utilized the same modeling platform to explore flood-driven changes in the Brahmaputra-Jamuna River. Their work delineated a clear morphological division: while active channels experienced net erosion, braided bars became zones of net deposition. The study also established that the post-flood stability of channels is linked directly to those exhibiting the highest velocities at peak discharge, and that the initiation of chute channels across bar tops is fundamentally a function of floodwater depth, which amplifies bed shear stress.
Aouiche et al. [18] applied the MIKE21 modeling suite to investigate the dynamics of sediment transport and subsequent river-mouth closure at Morocco’s Oum-Errabia River. By integrating wave, hydrodynamic, and sediment transport modules, they successfully simulated the processes leading to sand blockage. Their findings revealed an annual accumulation of roughly 427,400 m3 and demonstrated the necessity of routine dredging to maintain an open connection with the sea. Nugroho et al. [19] employed the U.S. Army Corps of Engineers’ HEC-RAS 2D model to assess sediment reaccumulation in the Citarum-Majalaya River following normalization efforts. Their results demonstrated that the riverbed regained half of its pre-dredging sediment volume from the previous eleven-year period in just two years. This rapid infilling diminished the river’s discharge capacity by 23% and significantly exacerbated flood hazards. Simulations indicated that a 5-year flood event could now inundate an area nearly four times larger (a 279.72% increase) due to the accumulated sediment. The study strongly advocates for continuous surveillance, biennial dredging cycles, and comprehensive watershed governance to curb sedimentation and mitigate flood risks in the region. Research conducted by Yu et al. [20] utilized a Delft3D-based two-dimensional morphodynamic model to analyze the intricate and non-linear dynamics of sediment movement and channel transformation during a severe 80-year return period flood in a gravel-bed river. Their findings, validated by post-flood observations, demonstrate that the progression and intensity of morphological shifts—including the expansion of bars and the erosion of banks—differ substantially among various river segments over the course of the flooding.
However, accurately predicting flood-driven sediment transport remains a significant challenge due to the strong nonlinearity of the governing processes and their sensitivity to extreme hydrodynamic forcing. The interaction between flow dynamics, sediment transport, and morphological evolution introduces complex feedback mechanisms that are difficult to represent efficiently in predictive models. While process-based numerical models provide detailed physical descriptions, their computational demands limit their applicability for rapid forecasting and real-time decision-making, particularly under extreme-event conditions.
To address these challenges, despite their physical fidelity, high-resolution process-based models remain computationally intensive which limit their utility for real-time forecasting applications and ensemble-based uncertainty quantification. This computational bottleneck has motivated the development of data-driven reduced-order modeling approaches that extract dominant dynamical features from high-dimensional simulation data. Data-driven modeling approaches offer complementary capabilities for extracting predictive information from high-fidelity simulation outputs or observational data. Among these methods, Dynamic Mode Decomposition (DMD) is a well-established and widely used technique for analyzing spatiotemporal data from complex dynamical systems [21,22]. DMD builds a reduced-order linear model of a dynamical system by approximating the Koopman operator, an alternative formulation of dynamical systems theory that provides a versatile framework for the data-driven study of high-dimensional nonlinear systems. The method requires no specific knowledge or assumptions about the system’s underlying physics and can be applied to both empirical measurements and simulated data [23]. From a machine learning perspective, the model is obtained through a direct procedure from a small set of multidimensional input-output pairs, which constitutes the training phase. DMD decomposes time-series data into a set of coherent spatial modes, each associated with a characteristic frequency and growth or decay rate, thereby provides a low-dimensional representation of the system’s dominant dynamics. The method further yields a mathematical model that can be used for forecasting the system’s future evolution. Unlike proper orthogonal decomposition (POD), which extracts modes based solely on energy content without temporal coherence, DMD modes correspond to dynamically relevant features with explicit temporal behavior [24].
In addition to reduced-order modeling approaches, recent years have seen a growing use of machine learning (ML) and deep learning (DL) methods for time-series forecasting in environmental and hydrodynamic systems, including recurrent neural networks, long short-term memory (LSTM) models, and transformer-based architectures. These models are capable of capturing highly nonlinear relationships and complex temporal dependencies. However, they typically require large volumes of training data, involve substantial computational cost, and often operate as black-box models with limited interpretability. In addition, their extrapolation performance can deteriorate under conditions that differ from the training data, particularly in extreme-event scenarios. In contrast, Dynamic Mode Decomposition (DMD) provides a data-driven reduced-order modeling framework that explicitly represents system dynamics through modal structures and associated temporal behavior. The method is computationally efficient, requires relatively limited data, and yields a compact representation of dominant spatiotemporal patterns. These characteristics make DMD particularly attractive for rapid forecasting applications and for scenarios where computational efficiency and robustness are critical.
Although physics-based numerical models remain indispensable for resolving hydrodynamic and morphodynamic processes with strong physical consistency, AI-based and data-driven methodologies offer a highly efficient complementary alternative for rapid prediction and reduced-order forecasting. Once trained, such approaches can generate predictions at a fraction of the computational cost of full numerical simulations, which makes them especially attractive for real-time applications, scenario screening, and engineering decision support. The rapid development of data-driven modeling paradigms further indicates that the integration of numerical and AI-based approaches will likely play an increasingly important role in future coastal and hydraulic research.
The DMD has been successfully applied across diverse fields including fluid dynamics [25], plasma physics [26], neuroscience [27], climate science [28] and ocean renewable energy [29]. Despite the demonstrated utility of DMD in various fluid mechanics applications, its application to sediment transport forecasting, particularly for flood-driven sedimentation at dynamic coastal interfaces, remains a critical research gap. While physics-based models like Delft3D provide high-fidelity insights into morphodynamics, their computational cost becomes a bottleneck for real-time forecasting and long-term uncertainty quantification. This motivates the search for efficient data-driven surrogates. The primary challenge in this transition is the nonlinear, threshold-driven coupling between flow hydrodynamics and the erodible bed. Unlike pure fluid flows where dynamics are often continuous, sediment transport is characterized by ‘piecewise’ behavior: erosion and deposition are only triggered when hydrodynamic forces, such as bed shear stress, cross specific critical thresholds [30]. Furthermore, sediment accumulation height represents a cumulative variable that integrates the history of erosion and deposition over time. This characteristic introduces additional complexity for reduced-order modeling approaches such as DMD, which assume approximately linear evolution of system states.
In this study, sediment accumulation heights at the Dilderesi River mouth, generated using a high-resolution Delft3D (https://oss.deltares.nl/web/delft3d) morphodynamic model, are analyzed, reconstructed, and forecasted using DMD. While physics-based models such as Delft3D remain essential for resolving detailed hydrodynamic–morphodynamic interactions, their computational requirements often preclude rapid forecasting or extensive scenario analysis. By applying DMD as a reduced-order modeling framework, this study investigates whether the dominant morphodynamic features of extreme flood events can be captured using a computationally efficient data-driven representation. Beyond theoretical considerations, rapid prediction of sediment accumulation has important practical implications for port operations and coastal hazard mitigation. Near-real-time forecasting of sediment deposition in critical zones could enable port authorities and coastal managers to identify potential navigation hazards during the rising phase of flood events and implement mitigation measures, such as dredging or diversion strategies, before severe channel obstruction occurs.
It should be noted that the dataset used in this study is generated from high-fidelity Delft3D simulations; therefore, the proposed framework can be interpreted as a data-driven reduced-order surrogate model that learns system dynamics directly from simulation data without relying on governing equations. A single 50-year return period flood scenario is selected as a representative extreme-event case to evaluate the performance of the proposed reduced-order modeling framework. Such extreme conditions are characterized by highly nonlinear and dynamically complex sediment transport processes, providing a stringent test for assessing the capability of DMD-based approaches to capture dominant morphodynamic behavior. Accordingly, the focus of this work is on methodological evaluation under a controlled and physically representative scenario, rather than establishing universal predictive capability across a wide range of hydrodynamic conditions.
This study addresses these challenges by applying three variants of DMD to spatiotemporal sedimentation height data derived from Delft3D simulations. The specific objectives are to: (i) generate high-fidelity spatiotemporal sedimentation fields corresponding to a 50-year return period flood event using a Delft3D simulation framework; (ii) apply standard DMD, optimized DMD [31], and optimized DMD with stability constraints to extract the dominant morphodynamic modes and forecast sediment accumulation patterns; (iii) evaluate forecasting performance through a systematic training–testing partition of temporal snapshots; and (iv) assess the ability of each DMD formulation to capture flood-driven sediment bypass and deposition dynamics at the river mouth. By comparing these three approaches, the study evaluates the role of optimization and spectral stability constraints in improving reduced-order predictions of sediment transport processes. Ultimately, the research aims to establish a computationally efficient framework for rapid morphodynamic forecasting during extreme flood events, thereby supporting more effective sediment management and coastal infrastructure planning.
The remainder of the manuscript is organized as follows. Section 2 describes the study area, data sources, and Delft3D model setup. Section 3 presents the DMD methodology and its variants. Section 4 discusses the results and forecasting performance of the proposed models. Finally, Section 5 summarizes the main findings and implications of the study.
2. Materials and Methods
2.1. Geographical Setting
The study area is located within the Dilovası district of Kocaeli, situated along the northeastern coast of İzmit Bay in the Marmara Sea, Turkey (40°45.932′ N, 29°56.295′ E). The investigation focuses on the Dilderesi River estuary, a critical interface where fluvial discharge interacts with the complex hydrodynamics of adjacent industrial harbor facilities (Figure 1). The Dilderesi River basin drains a catchment area of approximately 127.3 km2, characterized by a primary flow path of 23.5 km and a mean channel gradient of 0.015. The basin’s centroid, positioned 9.5 km from the river mouth, reflects morphology conducive to rapid hydrologic response during extreme precipitation events. The Dilderesi River is characterized by a Mediterranean-type hydrological regime, with a long-term average discharge estimated at approximately 1 m3/s. The basin’s natural morphology has undergone significant modification due to extensive anthropogenic activities. The configuration of the harbor bathymetry, characterized by main piers plays crucial role in modulating local hydrodynamic energy and sediment dynamics.
Figure 1.
Location of the study area at the Dilderesi River mouth, including the computational domain and the position of the Kocaeli Meteorological Observation Station used for rainfall data.
2.2. Hydrodynamic Model Delft3D
To analyze the spatiotemporal evolution of sediment dispersion and accumulation, a high-fidelity hydrodynamic and sediment transport model was developed using the Delft3D modeling system. In this study, Delft3D serves as the source of high-resolution data snapshots required for the subsequent modal decomposition. Developed by Deltares, the system provides comprehensive capabilities for simulating currents, waves, and morphological changes in complex coastal environments by accounting for tidal forcing, meteorological effects, and density gradients [32].
Delft3D resolves the conservation of mass and the Navier–Stokes equations for incompressible fluid dynamics under the shallow water and Boussinesq approximations [33]. The continuity equation representing the conservation of mass is given by:
The governing equations for the horizontal conservation of momentum along the Cartesian x and y axes are formulated as follows:
where η represents the water level relative to the mean surface (m), h is the total water depth (m), and, u and v are the depth-averaged velocities in the x and y directions (m/s), respectively. Further parameters include gravitational acceleration (m/s2), kinetic eddy viscosity (m2/s), and Manning’s roughness coefficient (s/m1/3). The numerical domain was discretized using a curvilinear computational grid covering approximately 4 km2, and the governing equations were solved within the Delft3D-FLOW framework using a finite difference method on a staggered Arakawa C-grid. It should be noted that the value of approximately 4 km2 refers to the total computational domain area rather than the grid spacing. The computational grid is non-uniform, with cell sizes varying from approximately 5 m in the river mouth and harbor region to about 80 m near the offshore boundary. This discretization approach was adopted because it provides reliable mass and momentum conservation, avoids pressure decoupling, and is well suited for solving shallow-water equations. Owing to these advantages, this technique has been widely used and validated in coastal and estuarine hydrodynamic and morphodynamic simulations. The computational grid was designed to achieve a balance between spatial resolution and computational efficiency while adequately resolving the dominant hydrodynamic and sediment transport processes. A finer grid resolution was employed in the river mouth and harbor regions, where strong spatial gradients in flow velocity and sediment dynamics are expected, while a relatively coarser resolution was used in offshore areas. This variable-resolution grid structure allows accurate representation of sediment deposition and erosion patterns while maintaining reasonable computational cost. The domain extent and grid configuration were also selected to minimize boundary effects and ensure that the modeled processes within the region of interest are not influenced by artificial numerical constraints. A curvilinear grid was chosen to align grid lines with the dominant flow direction and harbor geometry, enabling better resolution of near-wall gradients and reducing numerical diffusion. To ensure the high-fidelity capture of the hydrodynamic gradients required for robust modal decomposition, a stretched-grid resolution strategy was implemented in the curvilinear mesh allowing fine resolution in morphodynamically active regions while maintaining computational efficiency in offshore areas. In the vicinity of the harbor basin and river mouth, the grid was refined to approximately 5 m to resolve small-scale geometric features such as narrow channels, berths, and structural elements, and to accurately represent localized flow patterns and sediment deposition processes. This level of resolution is also essential for ensuring that the spatial structures used in the DMD analysis remain coherent and free from aliasing effects. Moving away from the region of interest toward the offshore boundary, the grid spacing was gradually increased up to approximately 80 m, where bathymetric gradients are smoother and sediment transport processes are less sensitive to fine-scale resolution. This transition was implemented using a non-uniform curvilinear mesh in which grid lines are progressively stretched using standard algebraic or hyperbolic stretching functions. Such an approach allows high resolution to be maintained in critical while significantly reducing the total number of computational cells and overall simulation cost without compromising accuracy in the key of sediment dynamics. Although Delft3D supports both 2D and 3D simulations, the present study employed a 3D hydrodynamic–morphodynamic model with five vertical sigma layers in order to represent the vertical structure of the flow and sediment transport processes. With the final grid configuration and the underlying bathymetric surface illustrated in Figure 2 and Figure 3, respectively.
Figure 2.
Curvilinear computational grid employed in the Delft3D model for the Dilderesi River estuary and harbor domain.
Figure 3.
Bathymetric distribution of the numerical domain used in the Delft3D simulations (Initial bathymetric distribution at the start of the simulation (after 6 h spin-up, before flood-induced sediment accumulation)).
Stability was ensured by maintaining a CFL number below 0.7 for all grid cells. This threshold was selected as a conservative stability criterion to ensure numerical stability and solution accuracy under the strongly varying flow conditions of the flood event and the non-uniform curvilinear grid structure employed in the Delft3D simulations. Convergence of the morphodynamic solution was checked by comparing sediment accumulation fields at successive time steps; when the normalized RMS change fell below 10–4, the solution was considered converged at that output interval. The time step was adjusted adaptively based on the CFL criterion. The adaptive computational time step used in the Delft3D simulations varied within the range of 0–6 s. To quantify the fluvial forcing and downstream water surface elevations under extreme conditions, a comprehensive hydrological analysis was conducted for the Dilderesi River. A 50-year return period was selected to represent a severe hydrological scenario, as such events are associated with high flow velocities, elevated bed shear stresses, and intense sediment transport rates that dominate morphological evolution. Rainfall intensity–duration–frequency (IDF) curves were derived from 60 years of sub-hourly rainfall records at the Kocaeli Meteorological Observation Station. The Kocaeli Meteorological Observation Station is located within approximately 10 km of the study area and is subject to the same regional climatic conditions. Its proximity and comparable elevation ensure that it captures the mesoscale precipitation patterns governing rainfall variability within the Dilderesi basin. The resulting flood hydrograph, presented in Figure 4, was used to define the unsteady upstream boundary conditions for the Delft3D model. Figure S1 presents the rainfall intensity–duration–frequency (IDF) curves derived from long-term observations at the Kocaeli Meteorological Station, which form the basis for the rainfall input used in this study.
Figure 4.
Flood hydrograph used in the Delft3D simulation. The vertical dashed lines denote the separation of the spin-up, training, and testing periods. The training interval includes the peak flow conditions, while the testing interval corresponds to the post-peak recession stage, during which sediment deposition processes remain active.
The hydraulic open-sea boundary condition was prescribed using high-frequency water level observations obtained from the Türkiye National Sea Level Monitoring System (TUDES) Yalova station (Figure 5). Water levels in Figure 5 are referenced to mean sea level (MSL) at the Yalova tide gauge. To account for momentum transfer across the air–sea interface, atmospheric forcing was incorporated using wind speed and directional vectors derived from the Copernicus ERA5 reanalysis dataset.
Figure 5.
Water level time series from TUDES Yalova station corresponding to the period of the 50-year flood event, used as the open-sea boundary condition in the model.
The model boundary conditions consisted of an unsteady upstream discharge hydrograph corresponding to the 50-year return period flood, a downstream open-sea water-level boundary prescribed from the TUDES Yalova station, and atmospheric forcing derived from ERA5 data. Wave conditions were evaluated using CMEMS data and incorporated in the overall hydrodynamic assessment. As the initial condition, the simulation was started with a 6 h spin-up period to allow the hydrodynamic and sediment fields to adjust to the imposed forcing, and sediment accumulation remained zero during this initial stabilization phase.
Wave and wind conditions at the study site were evaluated using data from the Copernicus Marine Environment Monitoring Service (CMEMS) and atmospheric reanalysis datasets to assess their potential contribution to sediment transport. The analysis indicates that the study area is characterized by limited fetch conditions within the semi-enclosed İzmit Bay, resulting in relatively low wave energy levels. Although extreme wave conditions corresponding to a 50-year return period were estimated, their influence on sediment dynamics at the harbor is minimal. This is primarily due to the combined effects of fetch limitation, wave energy attenuation through bathymetric shoaling and refraction, and relatively deep water conditions (exceeding 15 m) within the port area. Under these conditions, near-bed orbital velocities associated with wave motion remain below the critical threshold required to mobilize the predominantly fine-grained sediment.
In addition, wind-induced hydrodynamic forcing is consistent with the fetch-limited wave climate and does not significantly enhance sediment resuspension or transport in the study area. Consequently, wave- and wind-induced sediment transport are considered negligible compared to fluvial sediment delivery during flood events. Therefore, the morphodynamic evolution examined in this study is primarily governed by flood-driven sediment input from the Dilderesi River, and wave and wind forcing are not included as dominant mechanisms in the subsequent analysis.
2.3. Numerical Data
In this context, the DMD-based framework serves as a data-driven surrogate model of the high-fidelity Delft3D simulations, enabling efficient representation and forecasting of sediment dynamics. The data used in the Dynamic Mode Decomposition (DMD) analysis consist of numerically simulated sediment accumulation height fields obtained from the Delft3D morphodynamic model. The analysis focuses on the computational grid cells located within the river mouth and harbor region, highlighted in red in the model grid (Figure 6), where sedimentation associated with flood-induced fluvial discharge is most pronounced. Sediment accumulation height at each grid cell represents the bed level change relative to the initial condition and constitutes the state variable for the subsequent modal decomposition.
Figure 6.
Computational grid of the Delft3D model highlighting the subset of cells used in the Dynamic Mode Decomposition (DMD) analysis. The red-marked region corresponds to the Dilderesi river mouth and adjacent harbor basin where flood-induced sediment accumulation is most pronounced. Sediment accumulation heights at these grid cells form the state vectors used for the modal decomposition.
The Delft3D simulations were conducted with a temporal resolution of 30 min, yielding a total of 49 output snapshots spanning a 24 h flood event. These snapshots are sequentially labeled as Snapshot 1 (00:00), Snapshot 2 (00:30), …, Snapshot 49 (24:00). To prevent artificial sediment transport arising from initial transients and to ensure dynamic consistency between boundary and initial conditions, a spin-up period of 6 h was applied at the beginning of the simulation. During this spin-up phase, the hydrodynamic and sediment transport fields adjust to the imposed boundary conditions; consequently, sediment accumulation values are zero for the first 12 snapshots corresponding to this stabilization period.
As a result, the effective sedimentation signal begins after the spin-up phase. Figure 7 illustrates the spatial distribution of sediment accumulation height at selected time instances (Snapshots 14, 31, and 49), corresponding to the early development, intermediate evolution, and final state of sediment deposition during the flood event. These snapshots demonstrate the progressive accumulation of sediment at the river mouth and within the port basin as the flood evolves.
Figure 7.
Evolution of sediment accumulation height at the Dilderesi River mouth during the 50-year flood event. Shown are spatial distributions at Snapshots 14 (early stage), 31 (intermediate stage), and 49 (end of the event). The color scale represents sediment accumulation height, illustrating the temporal progression of flood-induced deposition within the river mouth and port basin.
The Delft3D morphodynamic model was calibrated using historical bathymetric survey data available for the study area. Pre- and post-event bathymetric measurements were used to quantify bed-level changes and sediment accumulation patterns within the river mouth and harbor region. The observed bathymetric differences were compared with the corresponding Delft3D-simulated bed-level changes over the same domain. Calibration was performed by adjusting key sediment transport and morphological parameters to achieve consistency between simulated and observed bed evolution. Particular attention was given to reproducing the spatial distribution of sediment deposition in low-energy zones and erosion in high-flow regions. The calibrated model was able to capture the main morphological features and sediment accumulation patterns observed in the field. The model successfully reproduced the observed deposition zones near the river mouth and erosion patterns along the main flow channel. The agreement between simulated and observed bathymetric changes indicates that the Delft3D model provides a physically realistic representation of sediment transport processes in the study area. Therefore, the Delft3D-generated dataset is considered suitable as a reference for evaluating the performance of the reduced-order modeling framework.
The Delft3D simulation is initiated at time zero, and a 6 h spin-up period is applied to ensure dynamic consistency between hydrodynamic and sediment transport processes. This spin-up interval overlaps with the early rising limb of the flood hydrograph; however, sediment accumulation remains negligible during this phase and is therefore excluded from the analysis.
The dataset was partitioned chronologically into training and testing subsets, with approximately equal proportions of data allocated to each. This relatively large testing portion provides a more rigorous evaluation of forecasting performance, as it reduces the likelihood of overfitting and ensures that model predictions are assessed over an extended time interval. The effective dataset begins after the spin-up period. The training dataset spans approximately 9.5 h and corresponds to the rising stage of the flood hydrograph. The testing dataset, covering the subsequent 9 h, corresponds to the post-peak recession stage of the event. While this configuration does not include the peak flow conditions in the testing phase, it allows assessment of the model’s ability to predict the evolution and stabilization of sediment accumulation following the rising stage. It should be noted that the testing period corresponds to the post-peak recession stage of the flood hydrograph, during which flow velocities decrease and sediment transport capacity diminishes. Under these conditions, sediment deposition becomes more dominant, and the morphodynamic evolution is governed by settling and redistribution processes. This phase is particularly relevant for evaluating the model’s ability to predict sediment accumulation patterns.
To further evaluate the robustness of the proposed framework beyond a single extreme-event scenario, an additional numerical experiment was conducted using a 25-year return period flood generated by the Delft3D model. This scenario represents a moderate flood event compared to the 50-year return period case used as the primary test condition. The same model configuration, preprocessing steps, and training–testing strategy were employed to ensure consistency and fair comparison between scenarios.
3. Dynamic Mode Decomposition Framework
3.1. Standard DMD
Dynamic Mode Decomposition (DMD) is a data-driven, equation-free technique used to extract spatiotemporal coherent structures from high-dimensional data. Unlike Proper Orthogonal Decomposition (POD), which ranks modes only by energy, DMD associates each spatial mode with a specific temporal behavior, including growth, decay, and oscillation. Given a sequence of sedimentation-height snapshots collected at uniform time intervals, the data are arranged into two snapshot matrices, and , where . Here, is the linear operator describing the system evolution. To compute efficiently, the singular value decomposition of is used, yielding
where and are the left and right singular vectors, is the diagonal matrix of singular values and represents complex conjugate transpose. The eigenvalues of define the temporal behavior of the modes, while the corresponding DMD modes represent spatially coherent structures. To obtain physically interpretable temporal dynamics, the discrete-time eigenvalues are converted to continuous-time form as
where the real part of represents growth or decay and the imaginary part represents oscillation frequency. The system state at time is then reconstructed as
where, are the modal amplitudes determined from the initial condition.
3.2. Optimized Dynamic Mode Decomposition
Standard DMD estimates system dynamics through linear regression between consecutive snapshots and may be sensitive to noise, sampling errors, and modeling uncertainties. In geophysical applications, these effects can bias the estimated eigenvalues and modes, leading to inaccurate reconstruction and forecasting.
Optimized Dynamic Mode Decomposition (optDMD) addresses this limitation by formulating the problem as a nonlinear least-squares optimization that directly fits exponential temporal dynamics to the data. Instead of estimating a one-step linear operator, optDMD determines the continuous-time eigenvalues, spatial modes, and modal amplitudes that best represent the observed spatiotemporal evolution. The optimization problem is written as
where is the number of retained modes. This approach reduces noise-induced bias and provides more reliable estimates of modal growth, decay, and oscillation characteristics. Once the optimal parameters are obtained, reconstruction and forecasting are performed using the same modal expansion as in standard DMD.
3.3. optDMD with Stability Constraint
Although optDMD improves robustness, the unconstrained formulation may still produce continuous-time eigenvalues with positive real parts, which correspond to exponentially growing and potentially unphysical dynamics. To ensure stable and physically meaningful predictions, optDMD is extended here by imposing a stability constraint on the eigenvalues:
This left-half-plane constraint suppresses spurious growth while still allowing persistent or slowly decaying dynamics. The constrained problem is solved within a nonlinear least-squares framework using variable projection. Once the parameters are identified, reconstruction and forecasting proceed as in standard DMD, but with improved long-term numerical stability.
In this study, three complementary variants of DMD are employed to analyze and forecast sediment accumulation dynamics at the Dilderesi River mouth: standard DMD, optDMD, and optimized DMD with stability constraints, optDMDs. The analysis begins with standard DMD, which provides a computationally efficient linear approximation of the system dynamics but is sensitive to noise and sampling artifacts. optDMD is then applied to improve robustness and accuracy by directly fitting continuous-time exponential dynamics to the data. Finally, optDMDs is introduced to ensure physically meaningful long-term behavior by enforcing non-growing dynamics through left-half-plane eigenvalue constraints.
To implement the decomposition, the two-dimensional sediment height fields describing the river-mouth morphology are first flattened into high-dimensional state vectors, xk, at each time snapshot. The resulting state vector represents the spatial sediment height distribution at time step , where n = × is the total number of grid cells in the computational domain. Each element of corresponds to the sediment accumulation height at a specific spatial location. This vectorized representation enables the high-dimensional morphodynamic field to be expressed in a form suitable for modal decomposition and time-evolution analysis using the DMD framework. These vectorized states are then sequentially assembled in chronological order to form the data matrices and where contains the first N − 1 snapshots and is shifted by one time interval to represent the system evolution. Following the computation of the DMD operator and the extraction of the DMD, optDMD, and optDMDs modes, the resulting vectorized modal structures are reshaped back into the original two-dimensional physical coordinate space. This spatial reconstruction preserves physical consistency and enables the dominant sediment accumulation and erosion patterns to be visualized and interpreted directly within the geographic context of the river mouth and associated port infrastructure.
4. Performance Evaluation Metrics
The performance of the DMD–based frameworks, including standard DMD, optDMD, and optDMDs, is evaluated based on their ability to accurately reconstruct observed system dynamics and predict future temporal evolution. The adopted evaluation criteria are designed to quantify both the fidelity of modal reconstructions within the observation window and the reliability of time-extrapolated forecasts. This combined assessment provides a consistent and objective basis for comparing the accuracy, stability, and physical plausibility of the different DMD formulations when applied to sediment accumulation dynamics.
Four complementary statistical performance metrics are employed: root mean square error (RMSE), mean absolute error (MAE), Nash–Sutcliffe efficiency (NSE), and BIAS. RMSE, MAE, and BIAS are expressed in meters (m), consistent with the units of sediment accumulation height. Together, these metrics characterize absolute error magnitude, predictive skill relative to a baseline reference, and systematic tendencies in both reconstructed and forecasted sedimentation height fields. The performance metrics are defined as:
In these expressions, denotes the number of observations, and represent the observed and predicted values, respectively, and is the mean of the observed dataset.
RMSE and MAE quantify the magnitude of discrepancies between model outputs and observations. RMSE places greater emphasis on larger deviations and is therefore sensitive to localized reconstruction errors and divergence in forecast trajectories, whereas MAE provides a robust measure of average absolute deviation. Lower values of both metrics indicate improved reconstruction fidelity and forecasting accuracy.
The Nash–Sutcliffe efficiency coefficient (NSE) assesses the ability of the DMD-based formulations to reproduce and predict system dynamics relative to a baseline representation defined by the mean of the observed data. NSE values approaching unity indicate strong agreement between predicted and observed temporal evolution, while values below zero indicate poor performance. Based on commonly accepted criteria in the literature, NSE values above 0.5 are considered satisfactory [34], with ranges of 0.65–0.75, 0.75–0.85, and 0.85–1.0 corresponding to fair, good, and very good performance, respectively [35,36].
Finally, BIAS is used to identify systematic tendencies in the reconstructed and forecasted sedimentation dynamics. Positive BIAS values indicate persistent overestimation, whereas negative values indicate underestimation relative to observations. This metric is particularly relevant for assessing the impact of stability constraints in optDMDs, as it reveals whether constrained formulations mitigate artificial amplification or excessive decay in long-term predictions.
To provide a clear overview of the methodology, a schematic flowchart of the proposed DMD-based modeling framework is presented in Figure 8. The workflow begins with the generation of high-resolution sediment accumulation data using the Delft3D morphodynamic model, followed by the application of a spin-up period to ensure dynamic consistency. The resulting dataset is then partitioned into training and testing subsets based on a chronological split. The training data are used to construct snapshot matrices representing the temporal evolution of sediment accumulation fields, which serve as inputs to the Dynamic Mode Decomposition (DMD), optimized DMD (optDMD), and stability-constrained optimized DMD (optDMDs) formulations. These models extract dominant spatiotemporal modes and associated temporal dynamics, which are subsequently used for reconstruction and forecasting. Finally, model performance is evaluated using standard statistical metrics, including RMSE, MAE, NSE, and BIAS.
Figure 8.
Flowchart of the DMD-based modeling architecture used in this study.
5. Results and Discussion
The 50-year return period flood represents an extreme hydrodynamic forcing scenario for the Dilderesi River mouth and provides a challenging test case for data-driven morphodynamic modeling. The Delft3D simulations reveal rapid and spatially heterogeneous sediment accumulation during the rising limb and peak of the flood hydrograph, followed by a gradual stabilization phase as discharge recedes. Deposition is primarily concentrated at the river mouth and within the port basin, where flow deceleration induced by channel expansion and harbor structures promotes sediment settling. Sedimentation height evolves as an integrated response to flood forcing, accumulating rapidly during peak discharge and approaching a quasi-steady state as flow conditions subside. To analyze and represent these sediment accumulation dynamics, the simulated sedimentation height fields are subsequently modeled and forecasted using Dynamic Mode Decomposition (DMD), optimized DMD (optDMD), and stability-constrained optimized DMD (optDMDs). Note that, in this study, “forecasting flood-driven sedimentation” refers to the out-of-sample prediction of the spatial and temporal evolution of sediment accumulation height fields during the flood event, using DMD-based reduced-order models trained on earlier sedimentation snapshots generated by the Delft3D simulation.
One of the most influential hyperparameters in the optimized DMD framework is the retained modal rank, r, which specifies how many coherent spatiotemporal modes are preserved in the reduced-order representation of the sediment accumulation field. In both optDMD and optDMDs, the modal rank determines the dimensionality of the reduced-order approximation employed in the reconstruction and forecasting expressions. An appropriate choice of r is therefore essential to accurately represent the dominant sediment accumulation dynamics while maintaining a compact modal representation.
In this study, the modal rank is selected through an empirical analysis of reconstruction accuracy by evaluating the root mean square error (RMSE) of the training data as a function of the number of modes retained in the reconstruction. Figure 9 presents the variation of reconstruction RMSE with respect to the modal rank r for both optDMD and optDMDs models. Here, the modal rank r denotes the number of retained reduced-order modal components used to represent the sediment accumulation dynamics. The values from 1 to 18 shown in Figure 9 do not correspond to 18 distinct physical sediment transport processes; rather, they indicate the number of coherent spatiotemporal modes included in the reconstruction. Because the training dataset contains 19 snapshots, the maximum effective modal rank of the sequential snapshot matrix is 18. Each mode represents a spatial sedimentation pattern associated with a characteristic temporal evolution. For both formulations, the reconstruction error decreases markedly as additional modes are included, reflecting improved representation of the sediment accumulation field, before reaching a minimum at specific modal ranks. As shown in Figure 9, the optDMD model attains its minimum reconstruction error at r = 11, while the optDMDs model achieves the lowest RMSE at r = 13. Beyond these values, no further improvement in reconstruction accuracy is observed, and the error either stabilizes or increases slightly. Accordingly, the modal ranks r = 11 for optDMD and r = 13 for optDMDs are adopted for all subsequent modal analysis and forecasting results presented in this study.
Figure 9.
Reconstruction RMSE versus number of retained modes r for optDMD and optDMDs models using sediment accumulation height data from the 50-year flood event. Here, r denotes the number of retained reduced-order modes used in the reconstruction. Since 19 training snapshots were used, the maximum effective modal rank is 18. Vertical dashed lines denote the modal ranks yielding minimum RMSE (r = 11 for optDMD and r = 13 for optDMDs), which are adopted in subsequent analyses.
Following the determination of the optimal modal ranks, the reconstruction capability of the DMD-based formulations was evaluated over the training interval. Using the learned modal structures, eigenvalues, and initial amplitudes, all three models, DMD, optDMD, and optDMDs, were employed to reconstruct the sediment accumulation fields within the training window. The reconstruction performance demonstrates exact agreement between the model outputs and the Delft3D reference data. Quantitatively, the Nash–Sutcliffe efficiency (NSE) values for all three models are equal to 1.00, indicating perfect correspondence with the observed training dynamics. Consistently, the root mean square error (RMSE), mean absolute error (MAE), and Bias values are all computed practically as 0. These results confirm that, once calibrated with the selected modal ranks, the reduced-order representations fully capture the variability of the sediment accumulation fields within the training period and show perfect reconstruction performance.
The spatial distributions of the time-averaged sediment accumulation heights further illustrate this agreement, as shown in Figure 10. The reconstructed fields obtained from DMD, optDMD, and optDMDs are visually indistinguishable from the training data, and the corresponding spatial error maps exhibit only negligible deviations across the computational grid. Nevertheless, a relative hierarchy in reconstruction accuracy can be observed. Although small in magnitude, reconstruction errors associated with the standard DMD formulation are larger than those of optDMD, while optDMD exhibits slightly higher residual errors than optDMDs. This ordering reflects the progressive reduction in bias achieved through the optimized fitting procedure and the additional stability constraints imposed in optDMDs, even within the training interval where overall reconstruction accuracy remains effectively exact.
Figure 10.
Time-averaged sediment accumulation height during the training period and corresponding reconstructions obtained using DMD, optDMD, and optDMDs for the 50-year return period flood event. The first row presents the spatial distribution of the mean sedimentation height for the Delft3D training data and the reconstructed fields from each model. The second row illustrates the associated spatial error distributions (model − training). All models reproduce the training data with negligible deviations; however, residual errors decrease progressively from DMD to optDMD and further to optDMDs.
These findings are consistent with the theoretical formulation of DMD-based models, which are designed to reproduce the training snapshots through linear combinations of extracted modes and their associated temporal dynamics. Since the modal ranks were selected based on minimum reconstruction error, the resulting reduced-order models retain sufficient degrees of freedom to represent the sediment accumulation process within the observation window exactly. Consequently, differences between the formulations are not manifested in global reconstruction metrics but become evident in the relative magnitude and spatial distribution of residual errors, and are expected to play a more pronounced role in forecasting performance beyond the training interval.
Following the assessment of reconstruction performance, the predictive capability of the DMD, optDMD, and optDMDs models is evaluated using the withheld test period corresponding to the final 9 h of the flood event. Forecast accuracy is quantified using the Nash–Sutcliffe Efficiency (NSE), root mean square error (RMSE), mean absolute error (MAE), and BIAS metrics, computed over all spatial grid points and all forecast time steps. The resulting performance statistics are summarized in Table 1, while the spatial distribution of time-averaged forecasted sediment accumulation and associated errors is illustrated in Figure 11.
Table 1.
Statistical performance metrics (NSE, RMSE (m), MAE (m), and BIAS (m)) evaluating the time-averaged forecasting accuracy of DMD, optDMD, and optDMDs models over the test interval, calculated across the entire computational grid and forecast horizon. Bold values indicate the best-performing model for each configuration.
Figure 11.
Spatial distribution of time-averaged sediment accumulation height for the test period and corresponding forecasts from DMD, optDMD, and optDMDs, together with their spatial error fields. Forecast errors are computed relative to the Delft3D reference solution and visualized using an error scale. The results indicate progressively improved forecasting accuracy from DMD to optDMD and further to optDMDs, particularly in regions of intense sediment deposition near the river mouth.
As Table 1 indicates, the standard DMD model exhibits the weakest forecasting performance among the three formulations. The NSE value of −21.5687 reveals that the forecasts are substantially poorer than a mean-value benchmark. This poor skill is further reflected in the high RMSE (0.1819 m) and MAE (0.0804 m), together with a pronounced positive BIAS (0.0787 m) which reveal systematic overestimation of sediment accumulation during the forecast period. Further, as shown in Figure 11, forecast errors are spatially widespread and particularly amplified in regions of intense deposition near the river mouth and port basin. These results suggest that unconstrained modal extrapolation in standard DMD leads to cumulative growth errors that rapidly degrade predictive accuracy under extreme flood forcing.
The optDMD formulation provides a marked improvement over standard DMD. The NSE increases to 0.8439, indicating a substantial gain in predictive skill. Correspondingly, RMSE (0.0157 m) and MAE (0.0086 m) are reduced by more than an order of magnitude compared to DMD, while the BIAS (0.0014 m) remains close to zero, with a minimal systematic error. The spatial error patterns in Figure 11 show that the deviations are mainly confined to localized zones of high sediment accumulation, whereas the majority of the computational domain is well reproduced. This indicates that optimization of the modal decomposition significantly enhances forecasting capability, although sensitivity to localized gradients persists during temporal extrapolation.
The best forecasting performance is achieved by the stability-constrained OptDMDs model. It attains the highest NSE value (0.9468), together with the lowest RMSE (0.0092 m) and MAE (0.0046 m) among all models. The small negative BIAS (−0.0023 m) indicates a negligible underestimation tendency. The spatially averaged forecast field in Figure 11 confirms that optDMDs accurately reproduces the dominant sediment accumulation patterns across the estuary and port basin, with error magnitudes remaining uniformly low throughout the domain. The combined interpretation of Table 1 and Figure 11 shows that the standard DMD formulation exhibits the lowest forecasting accuracy, followed by improved performance with optDMD, while the optDMDs model achieves the highest predictive skill. The results indicate that modal optimization improves forecast accuracy, and that the additional incorporation of stability constraint further enhances robustness.
To further gain insights into the forecasting accuracy of the developed models, the temporal robustness of the DMD-based formulations was evaluated by examining forecasting accuracy across the 9 h test horizon of the 50-year flood event. Forecast skill was quantified at each lead time using the NSE, RMSE, MAE, and BIAS. These statistics were calculated independently at every forecast step using all spatial grid points in the computational domain. The resulting lead-time-dependent metrics are presented in Table 2, while Figure 12 provides the corresponding forecast-versus-observation scatter plots.
Table 2.
Lead-time-dependent spatiotemporal forecasting performance of DMD, optDMD, and optDMDs for the 50-year flood event. NSE, RMSE (m), MAE (m), and BIAS (m) are computed at each forecast horizon (0.5–9 h) by aggregating errors over all spatial grid points and time instances within the corresponding lead time. Bold values indicate the best-performing model for each configuration.
Figure 12.
Forecast-versus-observation scatter plots of sediment accumulation height at lead times from 0.5 to 9 h during the 50-year flood event. Predictions from DMD (blue), optDMD (orange), and optDMDs (green) are compared against reference test data across all spatial grid points. The dashed line denotes the 1:1 perfect agreement line, and panel annotations report the corresponding NSE values. Insets provide magnified views of the low-magnitude range. Increasing dispersion with lead time highlights differences in forecasting stability among the three formulations.
At short lead times between 0.5 and 2 h, all three formulations exhibit near-perfect predictive performance. NSE values exceed 0.98 for each model, and both RMSE and MAE remain on the order of 10−4 to 10−3 m. The scatter plots reflect this high level of agreement. Forecasted values align closely with the 1:1 reference line across the full range of sediment accumulation heights, and dispersion is minimal. Differences among the models are negligible at this stage, which indicates that the modal structures extracted during training retain full coherence with the evolving sediment field over short extrapolation intervals.
As the lead time extends beyond 2 h, performance differences begin to emerge. The standard DMD model exhibits the earliest signs of degradation. Around the 3 h mark, NSE decreases substantially, and beyond 4.5 h it becomes negative. This transition indicates that the forecasts perform worse than a simple mean-value predictor. Error magnitudes increase rapidly during this interval. RMSE reaches 0.0668 m at 5 h, and BIAS grows progressively positive, which reflects systematic overestimation of sediment accumulation. The scatter plots reveal widening dispersion and clear deviation from the 1:1 line. In regions characterized by larger sediment magnitudes, forecast values depart increasingly from observations. These patterns demonstrate limited stability of the unconstrained DMD formulation during temporal extrapolation.
The optDMD formulation displays improved resilience during the intermediate forecast window between 2.5 and 5 h. Although performance declines gradually, the rate of deterioration is considerably slower than that observed for standard DMD. At 5 h, NSE remains above 0.92, and RMSE increases only to 0.0108 m. BIAS remains close to zero, which indicates minimal systematic drift. The corresponding scatter plots show tighter clustering around the reference line compared to DMD. Some dispersion appears at higher sediment values, yet the overall structure of the sediment field remains well represented. These results suggest that optimized parameter estimation enhances modal consistency during extrapolation, even in the absence of explicit stability constraints. The strongest intermediate-horizon performance is achieved by the stability-constrained optDMDs model. At 5 h ahead, NSE remains above 0.96, and RMSE is limited to 0.0068 m. BIAS remains small and slightly negative, which reflects mild underestimation rather than uncontrolled growth. The scatter plots confirm sustained alignment with the 1:1 reference line and limited dispersion across the spatial domain. Compared to both DMD and optDMD, the optDMDs formulation exhibits reduced error amplification, particularly in zones of higher sediment accumulation.
The most pronounced divergence among the models occurs at longer lead times between 5.5 and 9 h. Under these conditions, standard DMD becomes dynamically unstable. NSE decreases dramatically from −4.20 at 5.5 h to −106.02 at 9 h. RMSE increases from 0.0913 m to 0.4737 m, while BIAS rises sharply to 0.3094 m. These values indicate substantial cumulative overestimation of sediment accumulation. The scatter plots illustrate severe departure from the reference line, with forecasts overshooting observed values and dispersion expanding rapidly. This behavior reflects uncontrolled modal growth during extended extrapolation. The optDMD model maintains substantially better long-horizon performance. Although NSE declines from 0.8979 at 5.5 h to 0.4995 at 9 h, forecasts remain positively correlated with observations. RMSE increases steadily but remains an order of magnitude smaller than that of standard DMD. BIAS grows moderately positive yet remains limited in magnitude. The scatter plots show increasing dispersion and some slope distortion at higher sediment magnitudes; however, the general predictive structure persists. These results indicate improved stability relative to DMD, though gradual error accumulation remains evident. In contrast, the stability-constrained optDMDs formulation demonstrates consistent robustness throughout the entire 9 h forecast horizon. Even at the longest lead time, NSE remains 0.8419, while RMSE is confined to 0.0182 m and MAE remains below 0.011 m. BIAS stays small and slightly negative across all lead times. The scatter plots confirm sustained agreement with the 1:1 line and absence of explosive divergence. Although dispersion increases modestly with lead time, predictions remain well structured and spatially coherent. No systematic amplification of forecast magnitudes is observed.
Taken together, the lead-time-dependent analysis reveals a clear progression in temporal stability among the three formulations. Standard DMD performs well at very short horizons but loses reliability rapidly as extrapolation lengthens. The optDMD formulation extends predictive skill to intermediate and moderately long horizons, though performance gradually declines. The optDMDs model consistently delivers the most reliable forecasts across the full 9 h interval. While all models reconstruct the training data exactly, their extrapolative behavior differs substantially. The results demonstrate that enforcing stability constraints on the continuous-time eigenvalue spectrum effectively suppresses artificial modal growth and enhances long-horizon predictive robustness under extreme flood-driven sediment dynamics.
The lead-time-dependent forecasting results reveal progressively different temporal behaviors among the three model formulations. Although all models exhibit excellent predictive skill at short horizons, their extrapolation characteristics diverge markedly as lead time increases. To interpret these differences mechanistically, the continuous-time eigenvalue distributions of DMD, optDMD, and optDMDs are examined in the complex plane (Figure 13). In this representation, the real part of the eigenvalue, Re(ω), governs modal growth or decay, while the imaginary part, Im(ω), represents oscillatory frequency.
Figure 13.
Continuous-time eigenvalues (ω-plane) of DMD, optDMD, and constrained optDMDs models for sediment height dynamics. The real part, Re(ω), indicates modal growth/decay, while the imaginary part, Im(ω), represents angular frequency. Marker size is proportional to modal amplitude. The dashed line denotes the stability boundary (Re(ω) = 0). The zoomed view highlights the dominant spectral cluster, whereas the unconstrained optDMD model exhibits one strongly damped, high-frequency outlier outside the plotted range.
The DMD spectrum contains eigenvalues located close to, and in some cases within, the right-half plane where Re(ω) > 0. Such eigenvalues correspond to exponentially growing modes in continuous time. Even moderate positive growth rates can produce rapid amplification when repeatedly propagated during forecasting. This spectral configuration explains the sharp degradation in predictive performance observed beyond approximately 3–4 h ahead. The scatter plots show increasing dispersion away from the 1:1 line and a strong positive BIAS at longer lead times, reflecting cumulative modal growth. The pronounced decline in NSE and the substantial increase in RMSE at later horizons are therefore consistent with the presence of unstable eigenvalues in the DMD spectrum. The model accurately reconstructs the training data but lacks inherent spectral control during extrapolation, which leads to explosive behavior under extreme flood-driven sediment conditions.
The optDMD formulation exhibits a more favorable spectral distribution. Most eigenvalues lie within the left-half plane, which enhances short- and intermediate-horizon stability. This shift explains why optDMD maintains high NSE values and low error metrics up to roughly 5 h ahead. However, Figure 13 indicates that one optDMD eigenvalue resides in the right-half plane, where Re(ω) is positive. The existence of this single growing mode provides a direct explanation for the gradual divergence observed in the scatter plots at longer lead times. Although its growth rate is relatively small, its contribution accumulates over time and leads to progressive overestimation of sediment heights. This behavior is reflected in the increasing dispersion and mild positive BIAS seen beyond mid-range horizons. The decline in NSE from near-perfect values at short lead times to approximately 0.50 at 9 h is therefore consistent with the influence of this unstable spectral component. optDMD improves modal estimation compared with standard DMD, yet the absence of an explicit stability constraint allows marginal instability to persist. In contrast, the optDMDs formulation enforces a strict left-half-plane constraint on all continuous-time eigenvalues. As shown in Figure 13, no eigenvalues cross the stability boundary Re(ω) = 0. This spectral confinement eliminates exponentially growing modes and ensures that all dynamic components exhibit neutral or decaying behavior. The absence of unstable eigenvalues prevents artificial modal amplification during extrapolation and supports bounded temporal evolution of the sediment field. The scatter plots confirm sustained alignment with the 1:1 reference line and limited dispersion across the entire 9 h horizon. Error growth remains gradual, NSE values stay high, and BIAS remains small and slightly negative, indicating stable and physically consistent forecasts.
The continuous-time eigenvalue analysis therefore provides a coherent explanation for the forecasting behavior observed in the lead-time study. The explosive divergence of standard DMD originates from unstable eigenvalues that induce exponential growth. The gradual overestimation observed in optDMD is consistent with the presence of right-half-plane eigenvalue whose effect intensifies over time. The superior robustness of optDMDs arises from strict spectral stability, which suppresses artificial growth and preserves predictive accuracy under extreme-event extrapolation. These findings highlight that continuous-time spectral placement is a decisive factor for long-horizon morphodynamic forecasting, particularly in highly energetic flood scenarios.
In addition to the continuous-time eigenvalue distributions, Figure 14, Figure 15 and Figure 16 present the dominant spatial modes and their corresponding temporal dynamics for the DMD, optDMD, and optDMDs formulations. These figures provide direct insight into how each model represents the dominant sediment transport and deposition structures and how the associated modal contributions evolve over time. In all three formulations, the leading spatial modes are concentrated primarily along the river mouth outlet, the main channel, and the adjacent harbor basin, indicating that the reduced-order decomposition successfully captures the principal pathway of flood-driven sediment delivery and the main deposition zones. However, the temporal behavior of these modes differs substantially among the three models and explains their contrasting forecasting performance.
Figure 14.
Top five spatial modes of the standard Dynamic Mode Decomposition (DMD) model, ranked according to modal amplitude magnitude , together with their corresponding temporal dynamics. The upper row shows the spatial structure of each mode in physical coordinate space, where the horizontal and vertical axes denote projected spatial coordinates in meters (m), color represents the real part of the mode, and marker size reflects the relative magnitude of the modal contribution. The lower row presents the corresponding real part of the modal dynamics as a function of time (hours). The dominant DMD mode exhibits monotonic growth, indicating unstable modal amplification during extrapolation.
Figure 15.
Top five spatial modes extracted using the optimized Dynamic Mode Decomposition (optDMD) model, ranked according to modal amplitude magnitude , together with their temporal dynamics. The upper row depicts the dominant sediment transport and deposition structures in projected physical coordinates (m), with color indicating the real part of the mode and marker size scaled according to modal contribution. The lower row shows the corresponding real part of the modal dynamics plotted against time (hours). Most dominant modes exhibit decaying behavior, although one mode shows moderate growth, which explains the gradual forecast deterioration at longer lead times.
Figure 16.
Top five spatial modes of the constrained optimized Dynamic Mode Decomposition (optDMDs) model, ranked according to modal amplitude magnitude together with their temporal dynamics. The upper row highlights the dominant morphodynamic structures in projected physical coordinate space (m), where color represents the real part of the mode and marker size reflects the relative modal contribution. The lower row presents the corresponding real part of the modal dynamics versus time (hours). All leading modes display stable decay without modal growth, confirming that the imposed stability constraint suppresses artificial amplification and supports robust long-horizon forecasting.
For the standard DMD model (Figure 14), the leading mode is concentrated along the main transport corridor near the river mouth and port entrance, and its temporal contribution exhibits clear monotonic growth over time. This behavior indicates the presence of unstable modal amplification during extrapolation. Several secondary modes also show non-stationary or weakly oscillatory behavior, but their contributions remain smaller than that of the dominant growing mode. These observations explain the strong forecast divergence, increasing positive bias, and progressive overestimation of sediment accumulation previously identified for the standard DMD formulation at longer lead times. In the optDMD formulation (Figure 15), the dominant spatial modes remain concentrated in the same physically meaningful regions, particularly near the river mouth and within the harbor basin, but their temporal dynamics are more controlled. The first two dominant modes exhibit gradual decay, indicating improved damping of the principal sediment transport structures. Nevertheless, one intermediate-ranked mode still shows moderate growth, revealing the persistence of a weakly unstable component. This explains why optDMD provides markedly better short- and intermediate-horizon forecasts than standard DMD, while still showing gradual forecast deterioration at longer lead times. In contrast, the optDMDs formulation (Figure 16) exhibits both physically meaningful spatial structures and smoothly decaying temporal contributions for all dominant modes. No growing temporal component is observed among the leading modes. This indicates that the imposed stability constraint successfully suppresses artificial modal growth and ensures bounded temporal evolution throughout the forecast horizon. As a result, the optDMDs formulation provides the most stable and physically realistic long-horizon forecasts among the three models. Overall, Figure 14, Figure 15 and Figure 16 demonstrate that while the dominant spatial modes consistently identify the main sediment transport corridor and deposition zones, the temporal dynamics clearly distinguish the three formulations: unstable growth in standard DMD, partially controlled but still weakly unstable behavior in optDMD, and fully stable decaying behavior in optDMDs. These modal characteristics provide a direct physical explanation for the forecasting performance differences reported earlier. Beyond their mathematical characteristics, the spatial structures of the extracted modes provide important insight into the dominant physical processes governing sediment transport at the river mouth. The leading modes exhibit strong spatial concentration along the main channel and near the river mouth outlet, extending into the harbor basin. This spatial pattern is consistent with the primary advective transport of sediment driven by river discharge during flood conditions, where high-momentum inflow transports sediment-laden water into the receiving basin. These regions correspond to zones of elevated flow velocity and sediment flux, indicating that the dominant modes capture the bulk transport pathway responsible for sediment delivery. As the flow expands upon entering the harbor basin, a reduction in flow velocity leads to sediment settling and accumulation. This behavior is reflected in the spatial structure of the dominant modes, which show increasing intensity in regions where deposition is observed in the Delft3D simulations. Therefore, these modes can be interpreted as representing the combined effect of advective transport and subsequent deposition under decelerating flow conditions.
Secondary modes exhibit more localized spatial structures, particularly within the harbor basin and near structural boundaries such as quay walls and basin corners. These patterns are consistent with regions of flow separation, recirculation, and eddy formation induced by the complex geometry of the harbor. Such hydrodynamic features are known to promote localized sediment trapping and redistribution, contributing to spatial heterogeneity in sediment accumulation. The presence of these localized modal structures suggests that the reduced-order representation captures not only the dominant transport pathway but also secondary processes associated with flow reorganization within the basin. The temporal behavior of the modes further supports this interpretation. Modes exhibiting monotonic growth are associated with cumulative sediment deposition processes, reflecting the progressive increase in bed level due to sustained sediment supply. In contrast, modes with decaying temporal coefficients correspond to transient hydrodynamic features whose influence diminishes over time as the system approaches a quasi-equilibrium state during the later stages of the flood event.
It should be noted that peak discharge and peak sedimentation do not occur simultaneously. Due to the inherent lag between sediment transport and deposition processes, maximum sediment accumulation often occurs during the post-peak recession stage. As shown in Figure 17, sediment height continues to increase after the peak flow, indicating that deposition processes dominate during this phase. This highlights the importance of the recession period for accurately capturing sediment accumulation dynamics.
Figure 17.
Time series of sediment accumulation at a representative location near the river mouth. The figure illustrates the temporal evolution of bed level change and highlights the lag between peak discharge and peak sedimentation. Sediment accumulation continues to increase during the post-peak recession stage, indicating that deposition processes dominate as flow velocities decrease and sediment transport capacity diminishes. The shaded regions denote the training and testing periods used in the model evaluation.
Accordingly, the modal analysis demonstrates that forecasting divergence is governed not only by eigenvalue location but also by the energetic distribution of modal amplitudes . In DMD, unstable modes with non-negligible amplitude dominate the reconstruction as time increases. In optDMD, a single unstable component gradually influences the solution despite overall improved damping. In optDMDs, strict left-half-plane confinement ensures that all energetic modes remain stable, preventing artificial growth and yielding physically consistent morphodynamic evolution. This unified interpretation of spatial structures, temporal dynamics, and spectral stability provides a coherent explanation for the forecasting performance differences documented earlier.
A comparison of computational cost highlights the efficiency of the proposed reduced-order modeling framework. The Delft3D simulations require substantial computational time due to the solution of fully coupled hydrodynamic and sediment transport equations at high spatial and temporal resolutions. In contrast, the DMD-based models operate on reduced-order representations of the system and involve only matrix operations and eigendecomposition. As summarized in Table 3, the Delft3D simulation required approximately 36 h of computational time, whereas the DMD, optDMD, and optDMDs models completed reconstruction and forecasting tasks within a few minutes. This corresponds to a reduction in computational cost by several orders of magnitude. This significant computational advantage demonstrates the potential of the proposed framework for rapid prediction and real-time or near-real-time forecasting applications.
Table 3.
Comparison of computational cost between the high-fidelity Delft3D model and the proposed reduced-order DMD-based methods. The table summarizes the computational stage, approximate execution time, and relative computational cost. The results highlight that the DMD-based approaches achieve several orders of magnitude reduction in computational time for reconstruction and forecasting tasks compared to Delft3D simulations.
The comprehensive analysis of reconstruction accuracy, lead-time-dependent forecasting performance, continuous-time eigenvalue spectra, and modal structures provides a unified explanation of the predictive behavior of the three formulations under the 50-year flood scenario. Although DMD, optDMD, and optDMDs all reproduce the training data satisfactorily, their extrapolation characteristics differ fundamentally. The divergence of standard DMD forecasts originates from unstable spectral components with positive real parts, which induce exponential growth in the modal expansion and lead to amplified sediment accumulation during long-horizon prediction. The optDMD formulation improves spectral placement and short-horizon robustness; however, the presence of right-half-plane eigenvalue introduces gradual amplification that manifests as progressive overestimation at extended lead times. In contrast, the optDMDs model enforces strict left-half-plane confinement of all continuous-time eigenvalues, ensuring that every modal contribution evolves in a bounded manner. The resulting spatial modes remain physically interpretable, and their temporal dynamics decay smoothly without artificial growth. This spectral stability directly translates into sustained predictive accuracy, minimal BIAS, and controlled error propagation across the entire 9 h forecasting horizon. Collectively, the results demonstrate that continuous-time spectral stability, combined with amplitude-ranked modal representation, is a decisive factor for reliable morphodynamic forecasting under extreme hydrodynamic forcing conditions.
The predictive performance of the proposed optDMDs model for the 25-year return period flood is summarized in Table 4. The results demonstrate a high level of accuracy across all lead times. At short lead times, the model achieves near-perfect agreement with the reference data (NSE ≈ 1.0), while maintaining strong predictive skill at longer lead times (NSE ≈ 0.80 at 9 h). Error metrics, including RMSE and MAE, remain consistently low throughout the forecasting horizon, and bias values are close to zero, indicating the absence of systematic overestimation or underestimation. These results are consistent with those obtained for the 50-year return period flood, confirming the stability and robustness of the proposed approach under different flood magnitudes.
Table 4.
Forecasting performance of the proposed optDMDs model for the 25-year return period flood scenario at different lead times (0.5–9 h). Model accuracy is evaluated using Nash–Sutcliffe Efficiency (NSE), Root Mean Square Error (RMSE), Mean Absolute Error (MAE), and Bias. Bold values indicate the best-performing model for each configuration.
The findings of the present study should be interpreted in light of several limitations. Although the comparable performance observed for the 50-year and 25-year return period flood scenarios suggests that the proposed optDMDs framework is capable of capturing the underlying morphodynamic behavior of the system under different hydrological conditions within the same study domain, these results are intended to demonstrate methodological capability rather than establish universal predictive performance across all hydrodynamic scenarios. The primary evaluation is based on a 50-year return period flood event selected as a representative extreme-case condition, and morphodynamic responses may vary under different discharge magnitudes, tidal conditions, sediment characteristics, rainfall patterns, and boundary conditions. In addition, the models are constructed using Delft3D-generated sediment accumulation fields rather than field observations, and the analysis is limited to a single geographical setting. Therefore, although the additional 25-year return period flood scenario provides encouraging evidence of robustness, the current evaluation remains restricted in terms of hydrological variability and geographical diversity, and the general applicability of the proposed framework cannot yet be fully established. From a methodological perspective, the approach relies on linear modal superposition and a deterministic formulation, which do not explicitly represent the inherently nonlinear and threshold-dependent nature of sediment transport processes, such as critical shear stress governing sediment entrainment and deposition. Furthermore, modal truncation is selected on the basis of reconstruction error, which may not always provide a universally optimal rank-selection criterion. Future work should therefore extend the framework to multiple flood events, diverse environmental and morphological settings, and, where available, observational datasets. In addition, the development of systematic rank-selection strategies and nonlinear extensions of DMD-based formulations may further improve predictive accuracy and robustness for engineering-scale applications. A further limitation is that the testing dataset does not include the peak stage of the flood hydrograph, during which the intense and nonlinear sediment transport processes occur. Consequently, the predictive performance under peak-flow conditions remains to be fully evaluated. Future work should also address this limitation by incorporating peak-stage dynamics, field measurements, and extended validation scenarios to further assess model robustness and applicability.
6. Conclusions
This study examined the capability of Dynamic Mode Decomposition (DMD), optimized DMD (optDMD), and an enhanced optimized (optDMDs) formulation for reconstructing and forecasting sediment accumulation height fields at the Dilderesi River mouth under 25-year and 50-year return period flood scenarios. The principal conclusions are as follows:
- All three formulations reproduced the training data with near-perfect accuracy, indicating that the dominant sediment accumulation dynamics within the calibration interval were captured successfully by the reduced-order representations.
- The predictive behavior of the three models diverged during temporal extrapolation. Standard DMD exhibited rapid error growth and loss of forecast skill at longer lead times, whereas optDMD improved short- and intermediate-horizon performance but still showed gradual degradation during extended forecasts. In contrast, the optDMDs formulation provided the most reliable and robust long-horizon predictions, maintaining stable temporal evolution and superior overall forecasting performance throughout the test period.
- The comparative results show that spectral stability is a decisive factor in forecast robustness. The unstable behavior of standard DMD was associated with right-half-plane eigenvalues, while the enforced left-half-plane eigenvalue placement in optDMDs suppressed artificial modal growth and ensured bounded temporal evolution.
- The spatial modes obtained from the reduced-order models were physically meaningful and aligned with the dominant sediment transport pathway from the river mouth into the harbor basin, indicating that the proposed framework preserves the main morphodynamic structures governing deposition.
- In addition to its predictive accuracy, the proposed framework offers a substantial computational advantage over the high-fidelity Delft3D simulations. Because the DMD-based models operate on reduced-order representations of the system, reconstruction and forecasting can be performed much more efficiently, highlighting the strong potential of the approach for rapid or near-real-time morphodynamic forecasting applications.
The outcomes of the present study provide a methodological basis for future reduced-order morphodynamic forecasting research in other coastal and estuarine environments. A practical pathway for broader application is to first generate site-specific spatiotemporal sediment accumulation datasets, either from validated high-fidelity numerical models or, where available, from field observations, and then use these datasets to calibrate and evaluate DMD-based reduced-order models under the hydrodynamic and morphological conditions of the target system. In this way, the proposed framework may be extended to river mouths, estuaries, harbor basins, and other sediment-sensitive coastal settings.
Overall, the results demonstrate that the stability-constrained optimized DMD framework provides the most effective balance of predictive reliability, temporal robustness, physical interpretability, and computational efficiency for forecasting flood-driven sediment accumulation. The method yields stable and physically meaningful reduced-order predictions while preserving the dominant morphodynamic structures governing sediment transport and deposition under extreme hydrodynamic conditions. These characteristics reveal its strong potential as an efficient forecasting tool for sediment dynamics in coastal and estuarine environments. More broadly, the results highlight the increasing potential of AI-based and data-driven methodologies to serve as fast and effective alternatives to computationally demanding numerical models, especially in applications requiring rapid prediction, scenario analysis, and near-real-time decision support. Future studies should therefore test the method across multiple flood magnitudes, rainfall patterns, tidal regimes, sediment characteristics, and boundary conditions in order to assess its transferability, robustness, and broader engineering applicability.
Supplementary Materials
The following supporting information can be downloaded at: https://www.mdpi.com/article/10.3390/w18091087/s1, Figure S1: Rainfall intensity–duration–frequency (IDF) curves derived from long-term rainfall records at the Kocaeli Meteorological Observation Station, showing rainfall intensity as a function of duration for return periods of 2, 5, 10, 25, 50, and 100 years.
Author Contributions
Conceptualization, A.Ç., A.A. and M.Ö.; methodology, A.Ç., A.A. and M.Ö.; software, A.Ç., A.A. and M.Ö.; validation, A.Ç., A.A. and M.Ö.; formal analysis, A.Ç., A.A. and M.Ö.; investigation, A.Ç., A.A. and M.Ö.; resources, A.Ç., A.A. and M.Ö.; data curation, A.Ç., A.A. and M.Ö.; writing—original draft preparation, A.Ç., A.A. and M.Ö.; writing—review and editing, A.Ç., A.A. and M.Ö.; visualization, A.Ç., A.A. and M.Ö.; supervision, A.Ç., A.A. and M.Ö.; project administration, A.Ç., A.A. and M.Ö.; funding acquisition, A.Ç., A.A. and M.Ö. All authors have read and agreed to the published version of the manuscript.
Funding
This research received no external funding.
Data Availability Statement
The datasets presented in this study are not readily available due to privacy restrictions. Requests to access the datasets should be directed to the corresponding author.
Conflicts of Interest
The authors declare no conflicts of interest.
Abbreviations
The following abbreviations are used in this manuscript:
| DMD | Dynamic Mode Decomposition |
| optDMD | optimized DMD |
| optDMDs | optimized DMD with stability constraints |
| POD | proper orthogonal decomposition |
| 3D | Three-dimensional |
| IDF | Intensity–Duration–Frequency |
| TUDES | Türkiye National Sea Level Monitoring System |
| CMEMS | Copernicus Marine Environment Monitoring Service |
| W | West |
| WSW | West-Southwest |
| POT | Peaks over threshold |
| NW | Northwest |
| RMSE | root mean square error |
| MAE | mean absolute error |
| NSE | Nash–Sutcliffe efficiency |
References
- Syvitski, J.P.M.; Saito, Y. Morphodynamics of deltas under the influence of humans. Glob. Planet. Change 2007, 57, 261–282. [Google Scholar] [CrossRef] [Scilit]
- Walling, D.E.; Fang, D. Recent trends in the suspended sediment loads of the world’s rivers. Glob. Planet. Change 2003, 39, 111–126. [Google Scholar] [CrossRef] [Scilit]
- Milliman, J.D.; Farnsworth, K.L. River Discharge to the Coastal Ocean: A Global Synthesis; Cambridge University Press: Cambridge, UK, 2011. [Google Scholar]
- Altunkaynak, A. Sediment load prediction by genetic algorithms. Adv. Eng. Softw. 2009, 40, 928–934. [Google Scholar] [CrossRef] [Scilit]
- Fagherazzi, S.; Edmonds, D.A.; Nardin, W.; Leonardi, N.; Canestrelli, A.; Falcini, F.; Jerolmack, D.J.; Mariotti, G.; Rowland, J.C.; Slingerland, R.L. Dynamics of river mouth deposits. Rev. Geophys. 2015, 53, 642–672. [Google Scholar] [CrossRef] [Scilit]
- Altunkaynak, A.; Wang, K.-H. Triple diagram models for prediction of suspended solid concentration in Lake Okeechobee, Florida. J. Hydrol. 2010, 387, 165–175. [Google Scholar] [CrossRef] [Scilit]
- Deng, X.; Wang, Z.; Ma, X. Impact of silted coastal port engineering construction on marine dynamic environment: A case study of Binhai Port. J. Mar. Sci. Eng. 2025, 13, 494. [Google Scholar] [CrossRef] [Scilit]
- Torres-Bejarano, F.M.; Torregroza-Espinosa, A.C.; Restrepo, J.C. Modeling sediment transport and salt stratification in river estuaries: A case study of the Magdalena River, Colombia. Catena 2025, 261, 109589. [Google Scholar] [CrossRef] [Scilit]
- Altunkaynak, A. Suspended sediment concentration prediction by Geno-Kalman filtering. Expert Syst. Appl. 2010, 37, 8583–8589. [Google Scholar] [CrossRef] [Scilit]
- Lisi, I.; Feola, A.; Bruschi, A.; Pedroncini, A.; Pasquali, D.; Di Risio, M. Mathematical modeling framework of physical effects induced by sediments handling operations in marine and coastal areas. J. Mar. Sci. Eng. 2019, 7, 149. [Google Scholar] [CrossRef] [Scilit]
- Thapa, S.; Sinclair, H.D.; Creed, M.J.; Borthwick, A.G.L.; Watson, C.S.; Muthusamy, M. Sediment transport and flood risk: Impact of newly constructed embankments on river morphology and flood dynamics in Kathmandu, Nepal. Water Resour. Res. 2024, 60, e2024WR037742. [Google Scholar] [CrossRef] [Scilit]
- Hawez, D.M.; Füstös, V.; Pomázi, F.; Tamás, E.A.; Baranya, S. Simulation of sediment dynamics in a large floodplain of the Danube River. Water 2025, 17, 2399. [Google Scholar] [CrossRef] [Scilit]
- Alabyan, A.M.; Krylenko, I.N.; Lebedeva, S.V.; Panchenko, E.D. World experience in numerical simulation of flow dynamics at river mouths. Water Resour. 2022, 49, 766–780. [Google Scholar] [CrossRef] [Scilit]
- Zhang, W.; Yang, S.; Li, R.; Gan, B. Characteristics of water-sediment processes in Xinping River, a tributary of the Pinglu Canal. Environ. Fluid Mech. 2025, 25, 35. [Google Scholar] [CrossRef] [Scilit]
- Boudet, L.; Sabatier, F.; Radakovitch, O. Modelling of sediment transport pattern in the mouth of the Rhone delta: Role of storm and flood events. Estuar. Coast. Shelf Sci. 2017, 198, 568–582. [Google Scholar] [CrossRef] [Scilit]
- Kumbier, K.; Carvalho, R.C.; Vafeidis, A.T.; Woodroffe, C.D. Investigating compound flooding in an estuary using hydrodynamic modelling: A case study from the Shoalhaven River, Australia. Nat. Hazards Earth Syst. Sci. 2018, 18, 463–477. [Google Scholar] [CrossRef] [Scilit]
- Shampa; Ali, M.M. Interaction between the braided bar and adjacent channel during flood: A case study of a sand-bed braided river, Brahmaputra–Jamuna. Sustain. Water Resour. Manag. 2018, 5, 947–960. [Google Scholar] [CrossRef] [Scilit]
- Aouiche, I.; Sedrati, M.; Anthony, E.J. Modelling of sediment transport and deposition in generating river-mouth closure: Oum-Errabia River, Morocco. J. Mar. Sci. Eng. 2023, 11, 2051. [Google Scholar] [CrossRef] [Scilit]
- Nugroho, J.; Qolbi, S.A.N.; Adiprayoga, M.F.; Wulandari, S.; Soekarno, I.; Kuntoro, A.A.; Kusuma, M.S.B.; Wijayasari, W.; Rohmat, F.I.W. Post-normalization sedimentation in the Citarum Majalaya River: Patterns, impacts, and mitigation strategies. Results Eng. 2025, 27, 106943. [Google Scholar] [CrossRef] [Scilit]
- Yu, Q.; Rennie, C.D.; Slaney, J.M. Gravel-bed river morphodynamic processes throughout a large flood with an 80-year return period from numerical modeling: Implications for flood regulation strategies. J. Hydrol. 2025, 660, 133463. [Google Scholar] [CrossRef] [Scilit]
- Schmid, P.J. Dynamic mode decomposition of numerical and experimental data. J. Fluid Mech. 2010, 656, 5–28. [Google Scholar] [CrossRef] [Scilit]
- Kutz, J.N.; Brunton, S.L.; Brunton, B.W.; Proctor, J.L. Dynamic Mode Decomposition: Data-Driven Modeling of Complex Systems; SIAM: Philadelphia, PA, USA, 2016. [Google Scholar]
- Palma, G.; Bardazzi, A.; Lucarelli, A.; Pilloton, C.; Serani, A.; Lugni, C.; Diez, M. Analysis, forecasting, and system identification of a floating offshore wind turbine using dynamic mode decomposition. J. Mar. Sci. Eng. 2025, 13, 656. [Google Scholar] [CrossRef] [Scilit]
- Tu, J.H.; Rowley, C.W.; Luchtenburg, D.M.; Brunton, S.L.; Kutz, J.N. On dynamic mode decomposition: Theory and applications. J. Comput. Dyn. 2014, 1, 391–421. [Google Scholar] [CrossRef] [Scilit]
- Rodríguez-López, E.; Carter, D.W.; Ganapathisubramani, B. Dynamic mode decomposition-based reconstructions for fluid-structure interactions: An application to membrane wings. J. Fluids Struct. 2021, 104, 103315. [Google Scholar] [CrossRef] [Scilit]
- Faraji, F.; Reza, M.; Knoll, A.; Kutz, J.N. Dynamic mode decomposition for data-driven analysis and reduced-order modeling of E × B plasmas: I. Extraction of spatiotemporally coherent patterns. J. Phys. D Appl. Phys. 2024, 57, 065201. [Google Scholar] [CrossRef] [Scilit]
- Brunton, B.W.; Johnson, L.A.; Ojemann, J.G.; Kutz, J.N. Extracting spatial-temporal coherent patterns in large-scale neural recordings using dynamic mode decomposition. J. Neurosci. Methods 2016, 258, 1–15. [Google Scholar] [CrossRef] [Scilit]
- Mankovich, N.; Bouabid, S.; Nowack, P.; Bassotto, D.; Camps-Valls, G. Analyzing climate scenarios using dynamic mode decomposition with control. Environ. Data Sci. 2025, 4, e16. [Google Scholar] [CrossRef] [Scilit]
- Lydon, B.; Polagye, B.; Brunton, S. Data-driven modeling of an oscillating surge wave energy converter using dynamic mode decomposition. J. Renew. Sustain. Energy 2025, 17, 024703. [Google Scholar] [CrossRef] [Scilit]
- van Rijn, L.C. Unified view of sediment transport by currents and waves. I: Initiation of motion, bed roughness, and bed-load transport. J. Hydraul. Eng. 2007, 133, 649–667. [Google Scholar] [CrossRef] [Scilit]
- Askham, T.; Kutz, J.N. Variable projection methods for an optimized dynamic mode decomposition. SIAM J. Appl. Dyn. Syst. 2018, 17, 380–416. [Google Scholar] [CrossRef] [Scilit]
- Deltares. Delft3D-FLOW: Simulation of Multi-Dimensional Hydrodynamic Flows and Transport Phenomena, Including Sediments—User Manual; Deltares: Delft, The Netherlands, 2014. [Google Scholar]
- Lin, Q.; Shi, L.; Liang, B.; Wu, G.; Wang, Z.; Zhang, X.; Wu, Y. Characterizing interactive compound flood drivers in the Pearl River Estuary: A case study of Typhoon Hato (2017). J. Hydrol. 2024, 645, 132270. [Google Scholar] [CrossRef] [Scilit]
- Moriasi, D.N.; Arnold, J.G.; Van Liew, M.W.; Bingner, R.L.; Harmel, R.D.; Veith, T.L. Model evaluation guidelines for systematic quantification of accuracy in watershed simulations. Trans. ASABE 2007, 50, 885–900. [Google Scholar] [CrossRef] [Scilit]
- Donigian, A.S.; Love, J.T. Sediment calibration procedures and guidelines for watershed modeling. Proc. Water Environ. Fed. 2003, 2003, 728–747. [Google Scholar] [CrossRef] [Scilit]
- Wang, K.H.; Altunkaynak, A. Comparative case study of rainfall–runoff modeling between SWMM and fuzzy logic approach. J. Hydrol. Eng. 2012, 17, 283–291. [Google Scholar] [CrossRef] [Scilit]
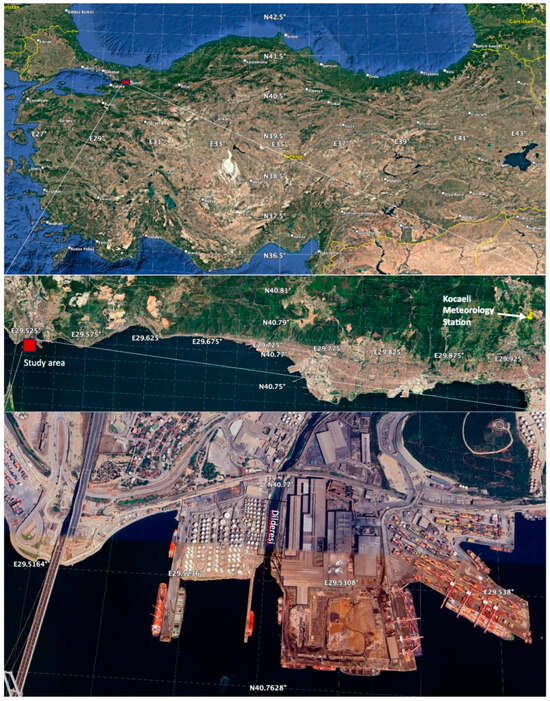
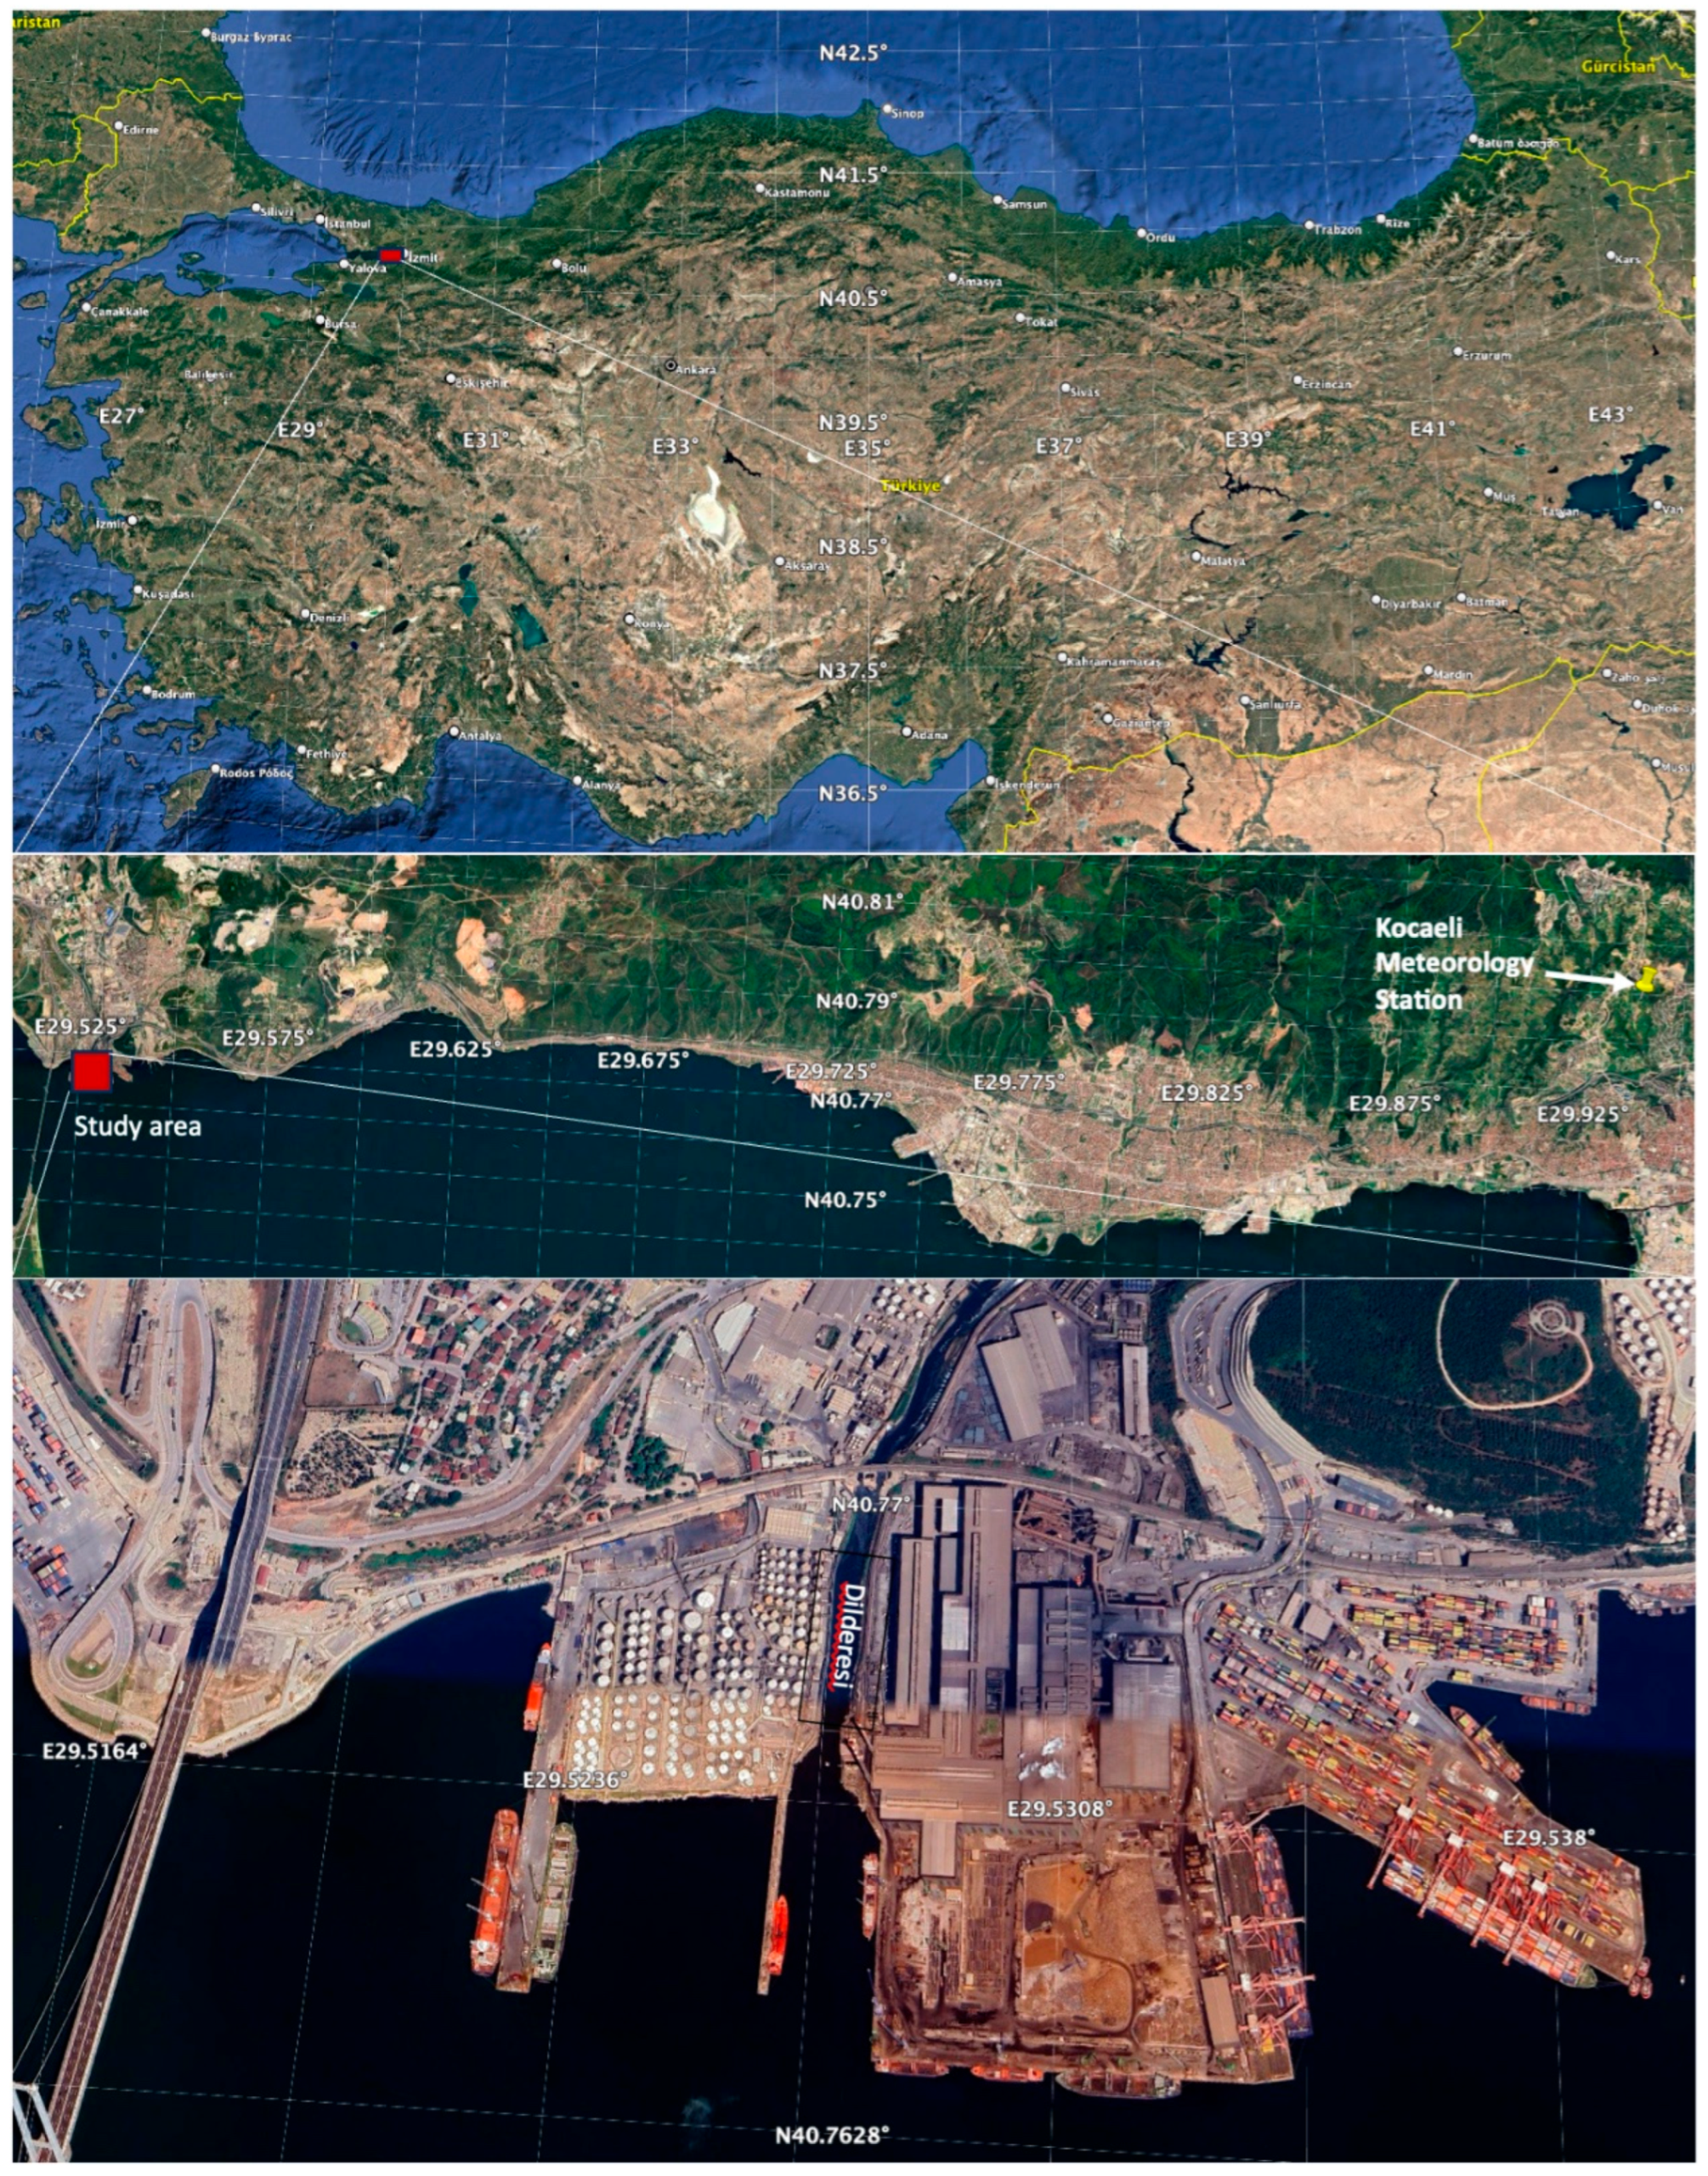
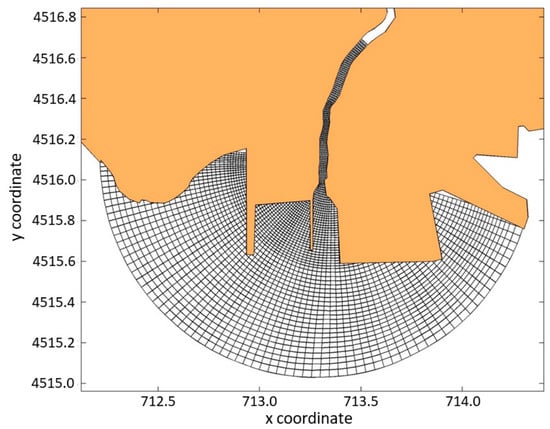
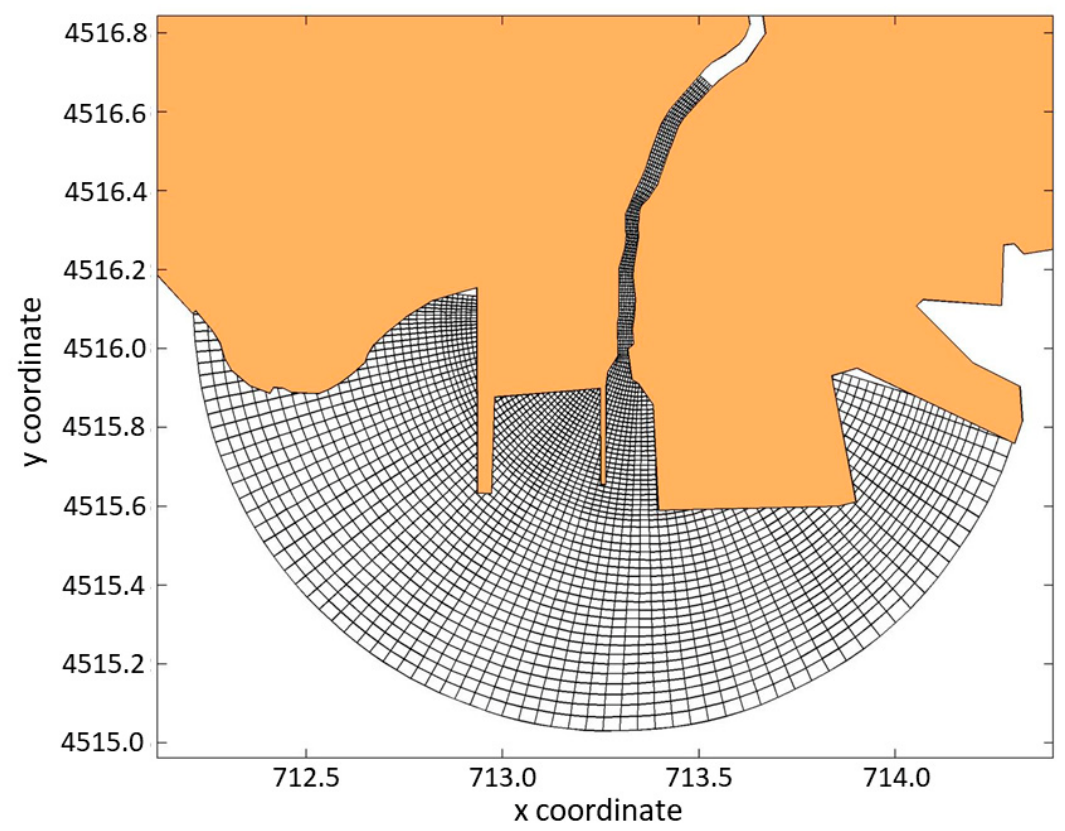
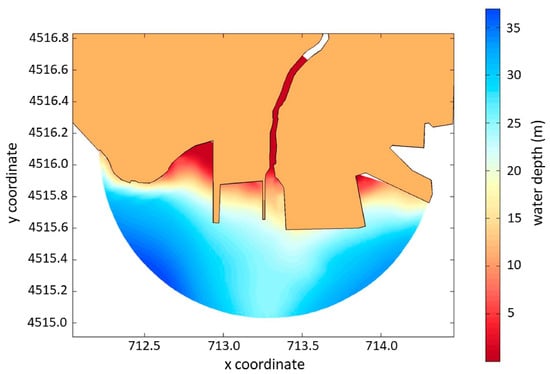
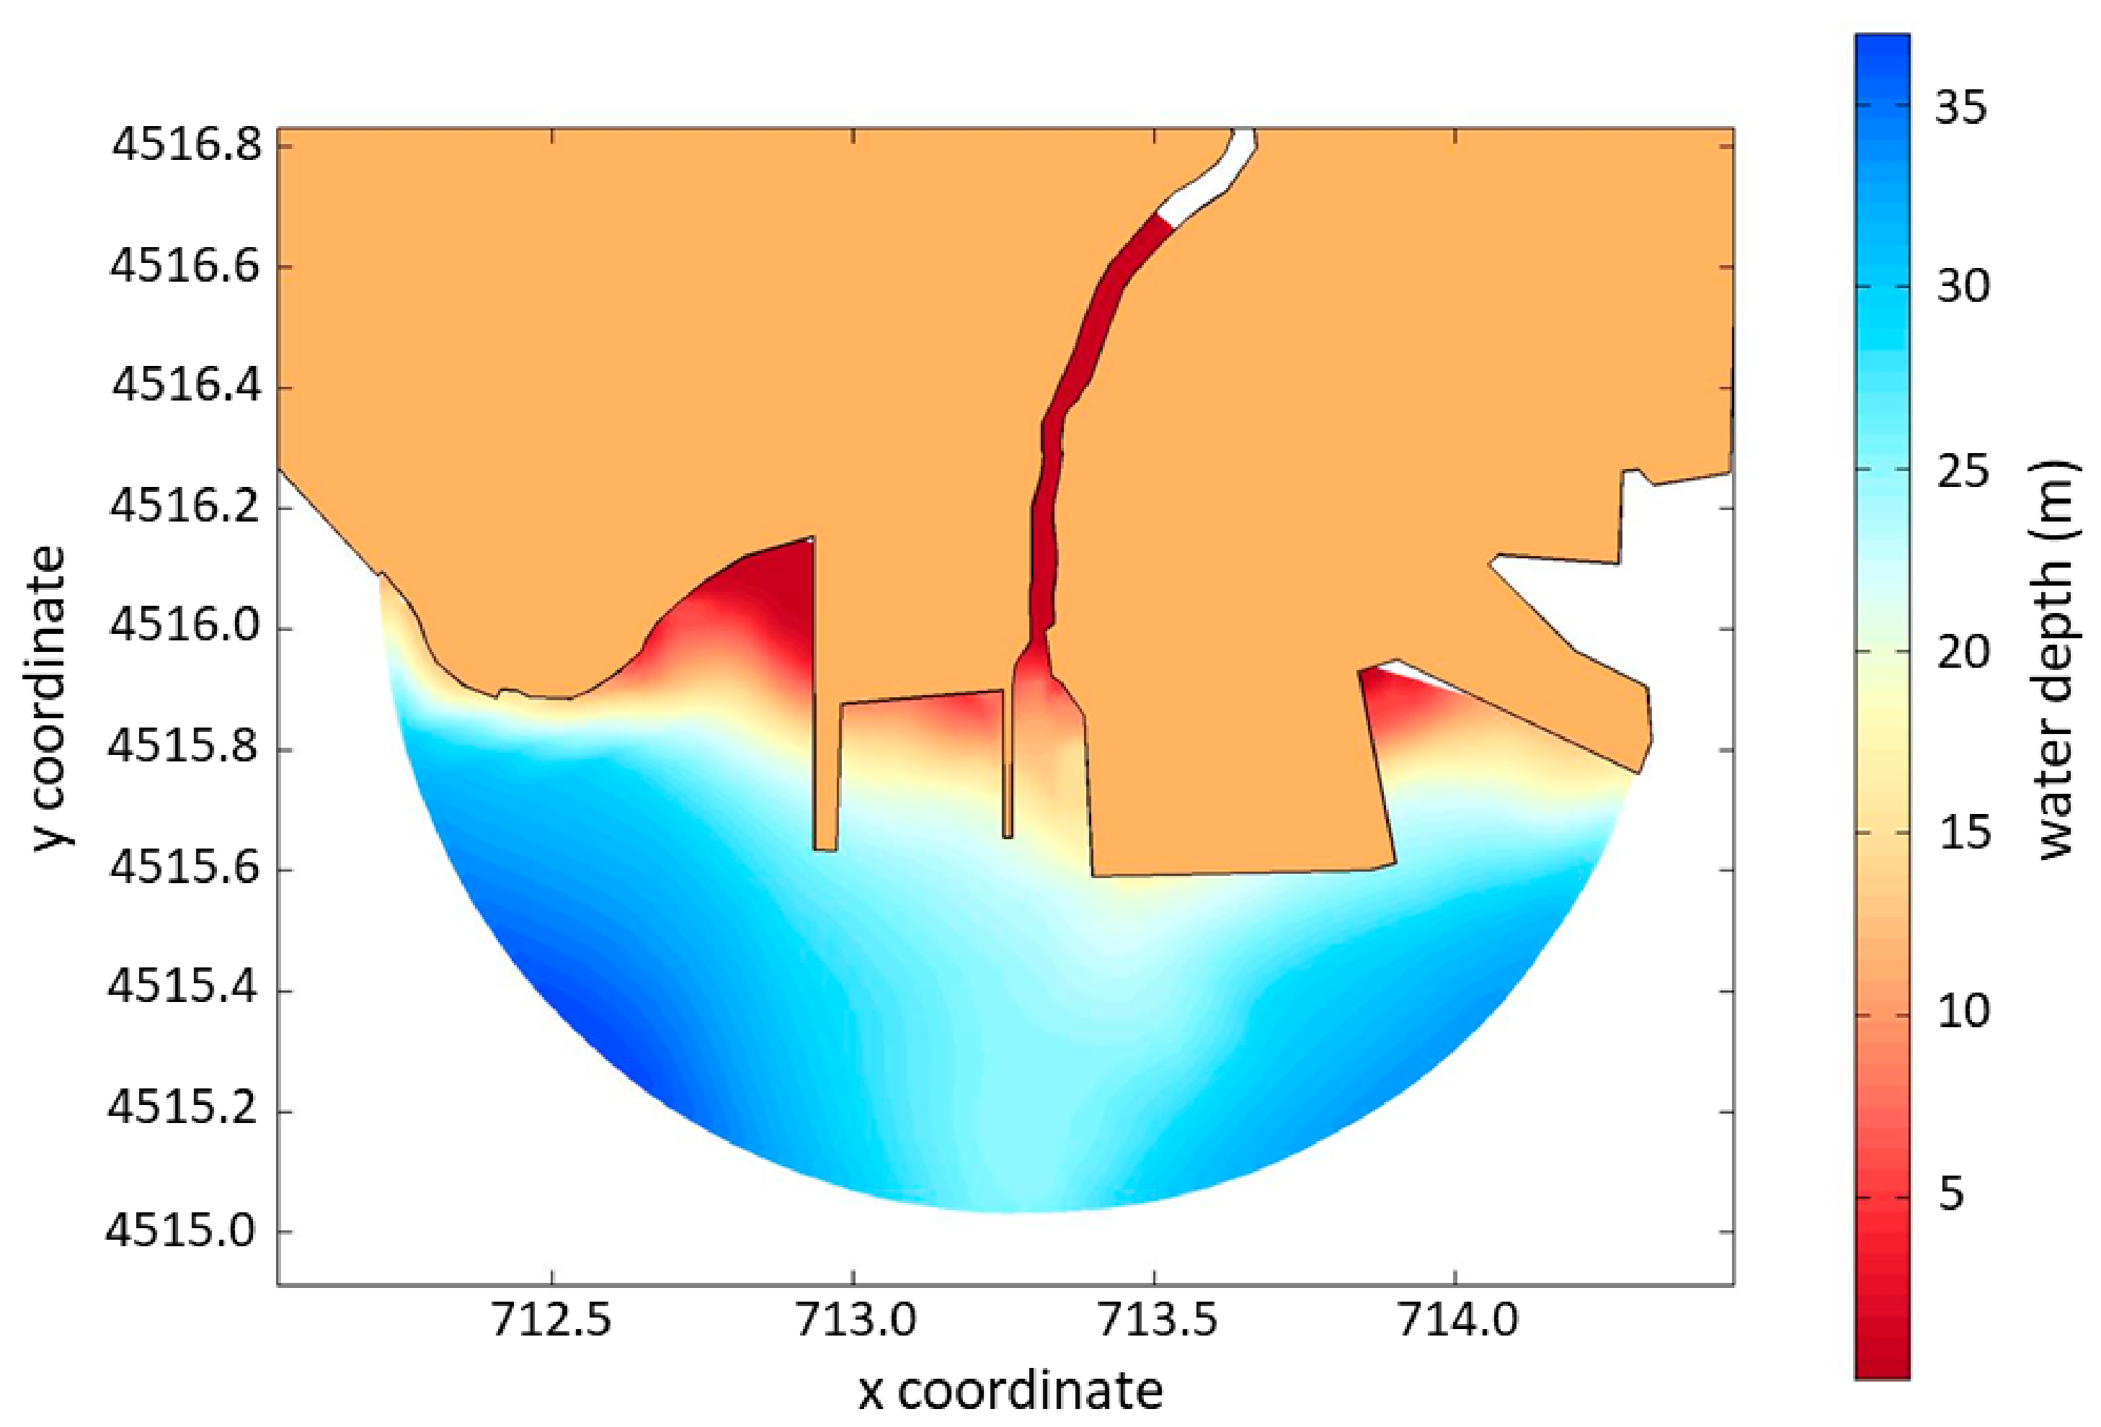
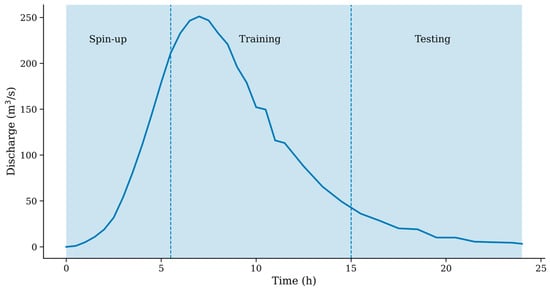
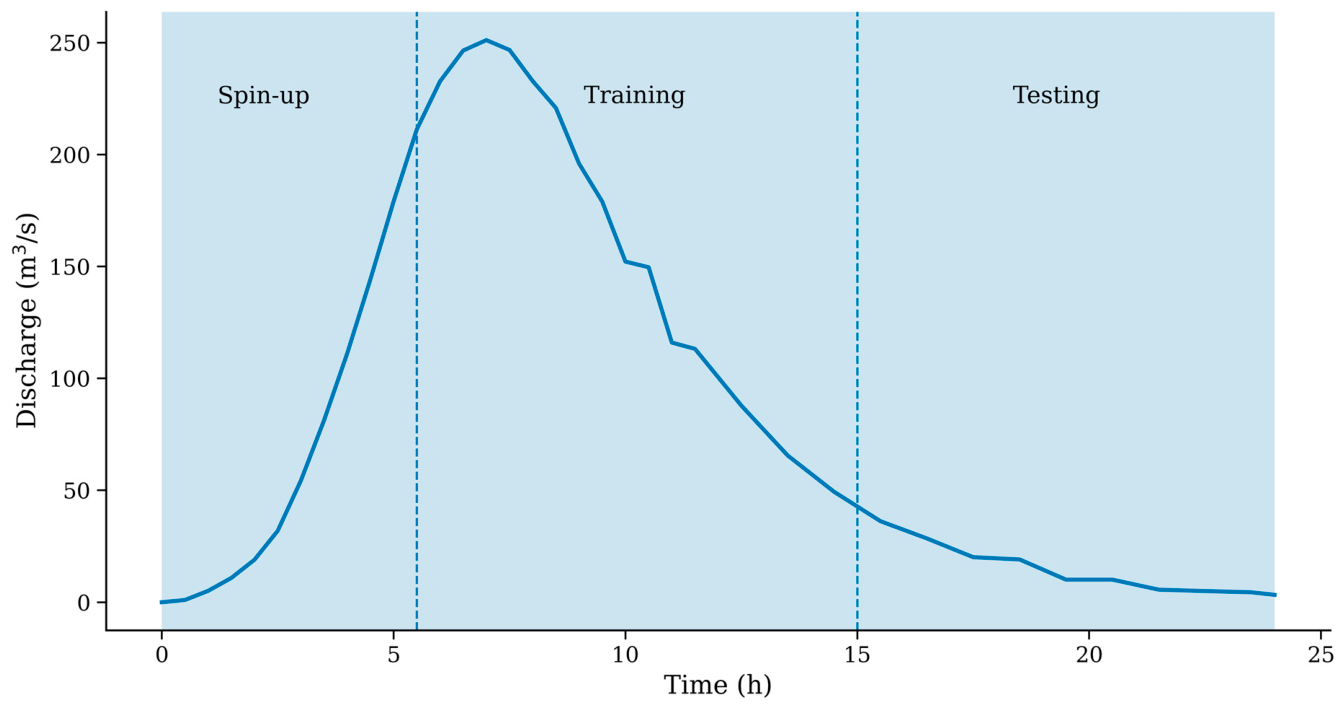
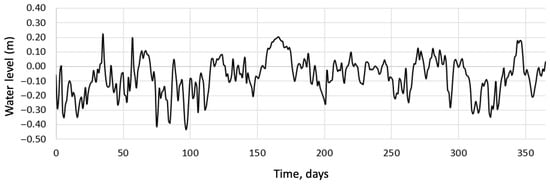
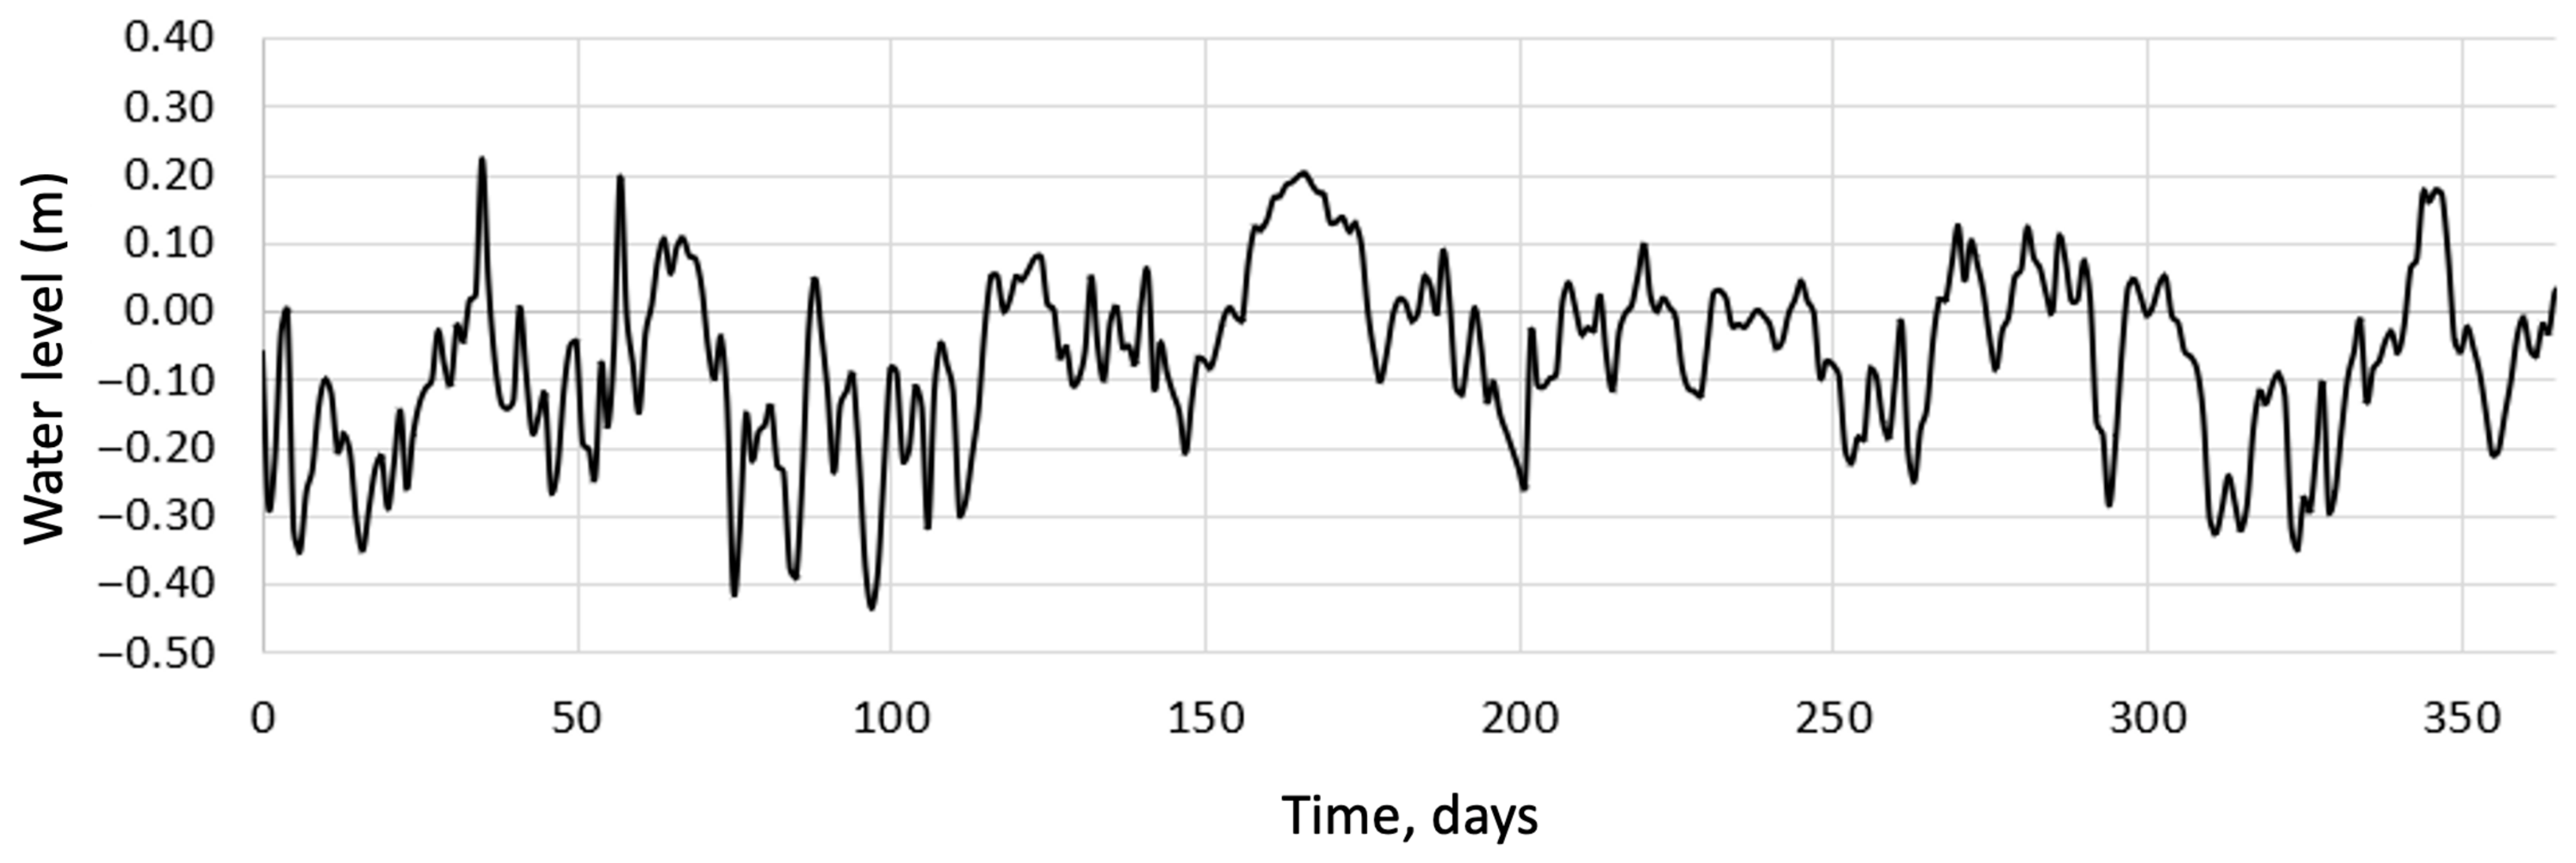
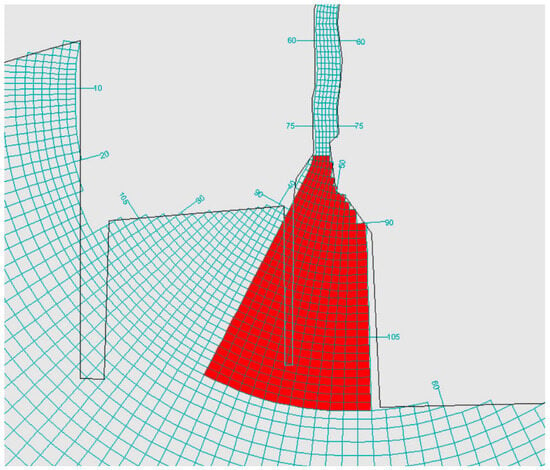
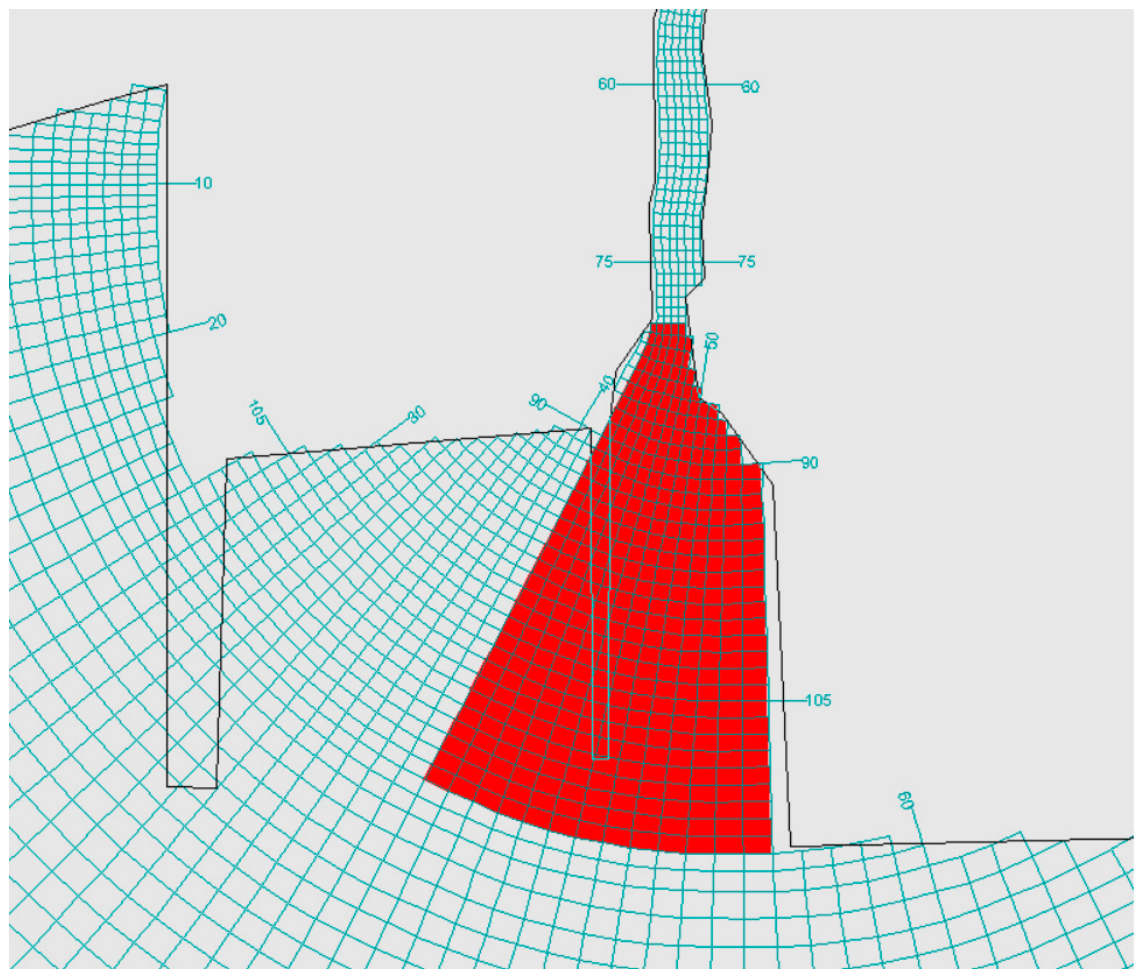
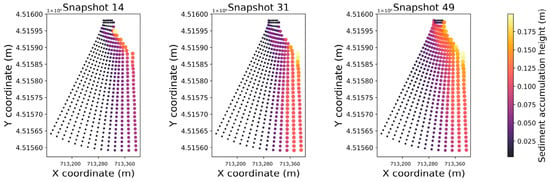
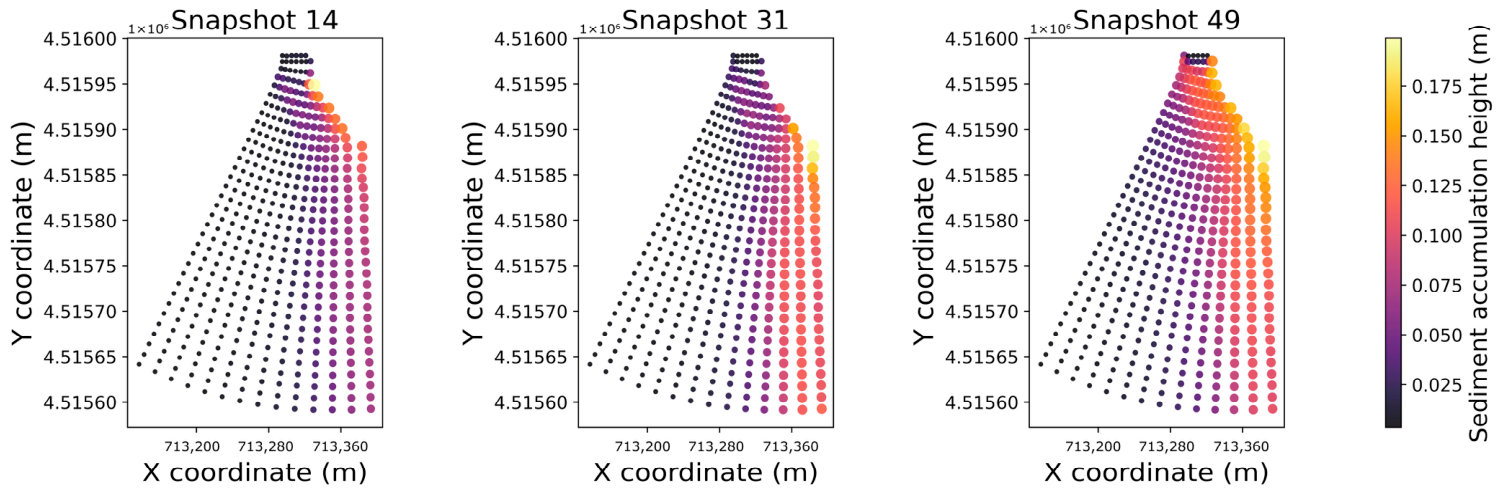
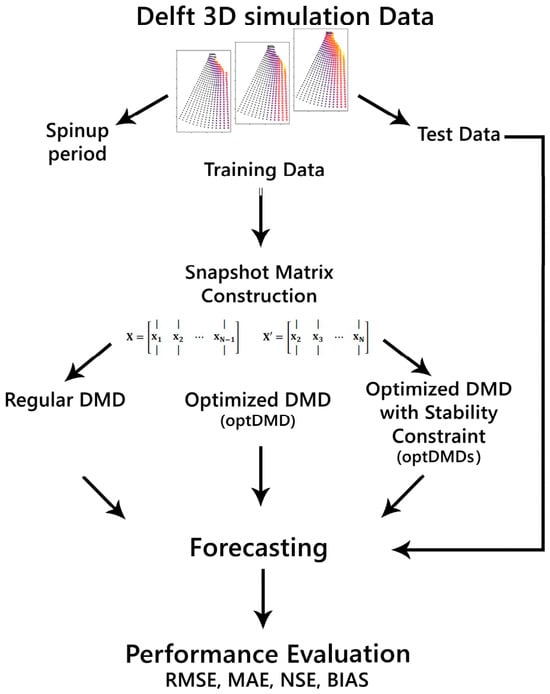
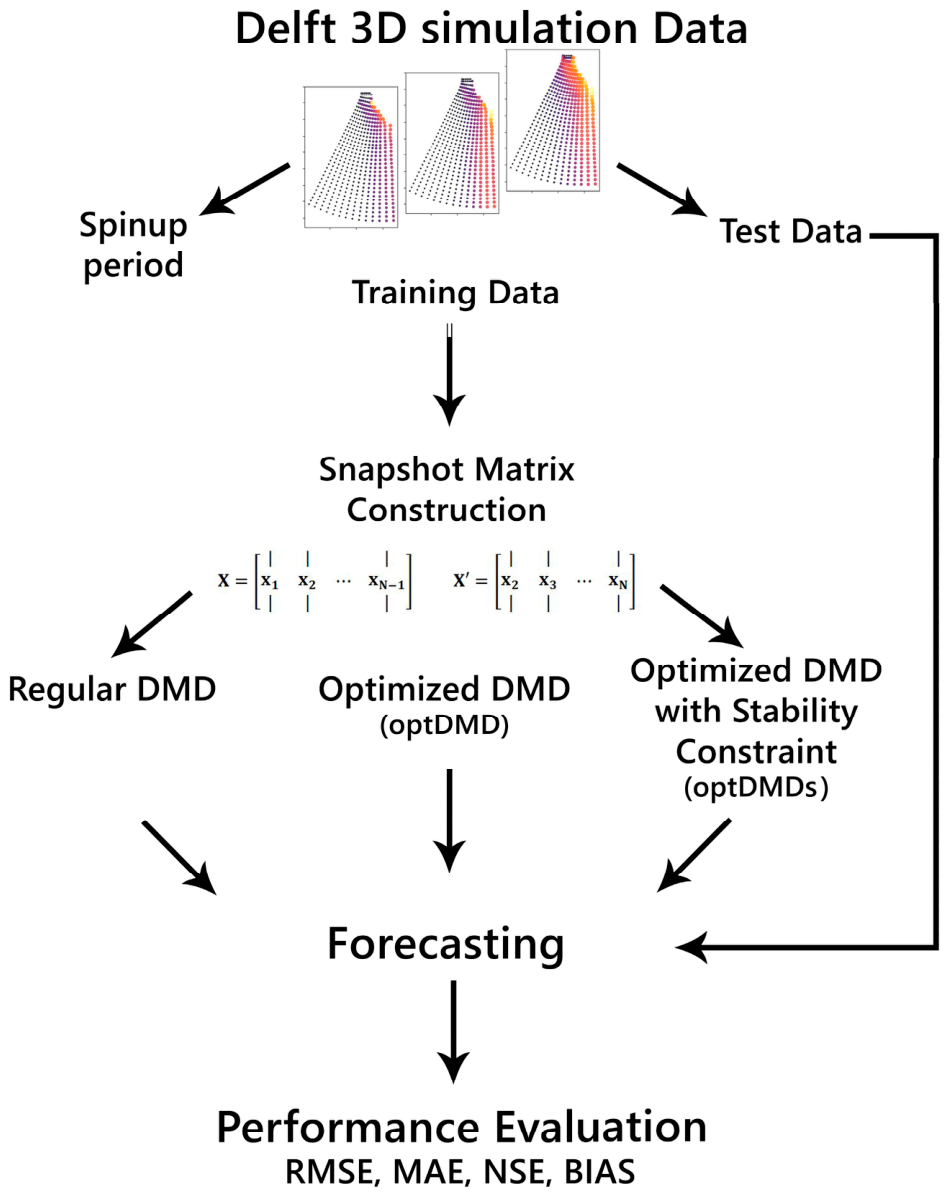
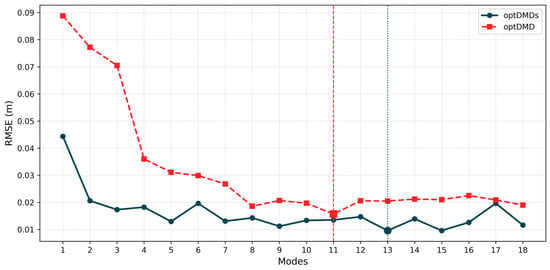
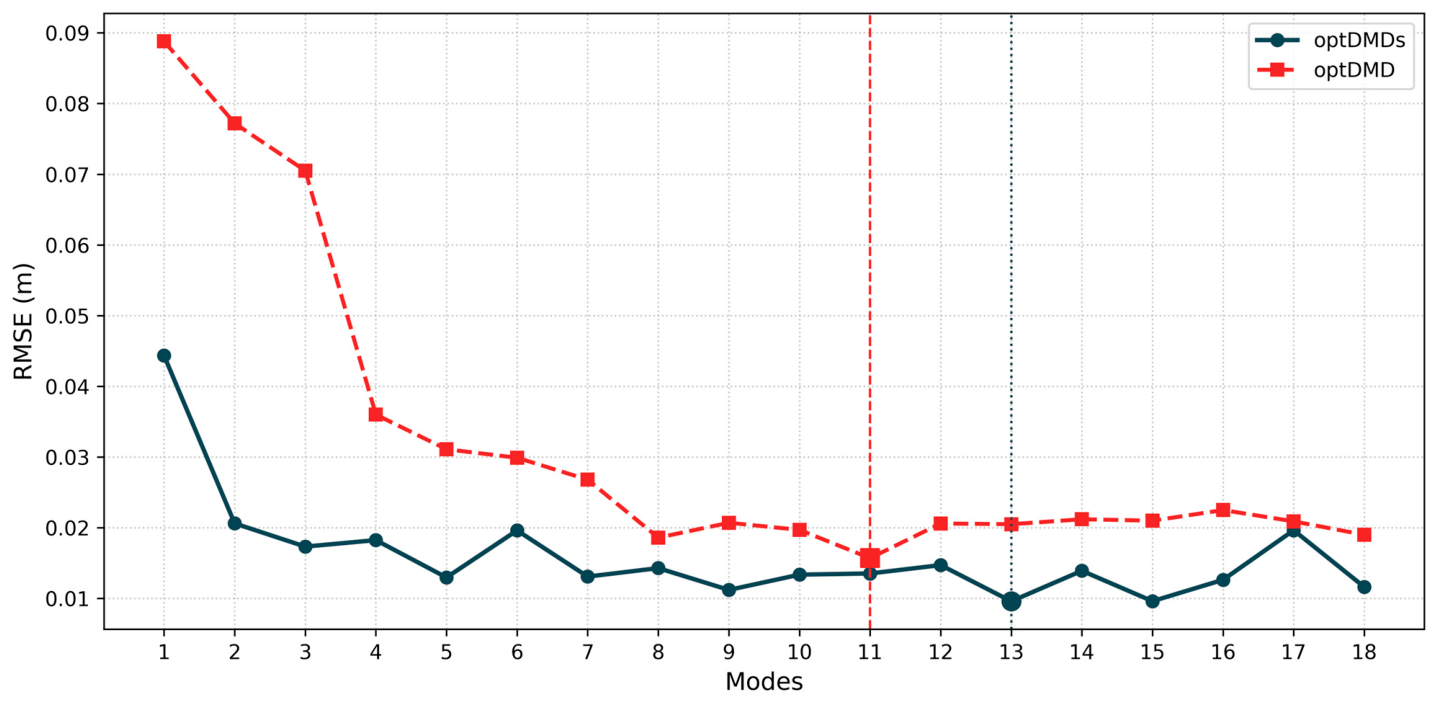
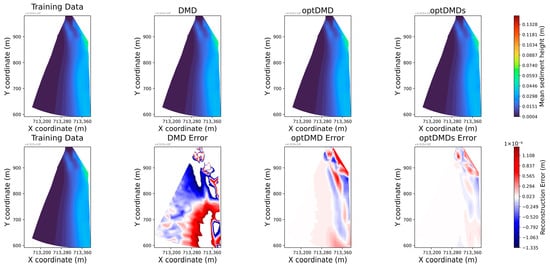
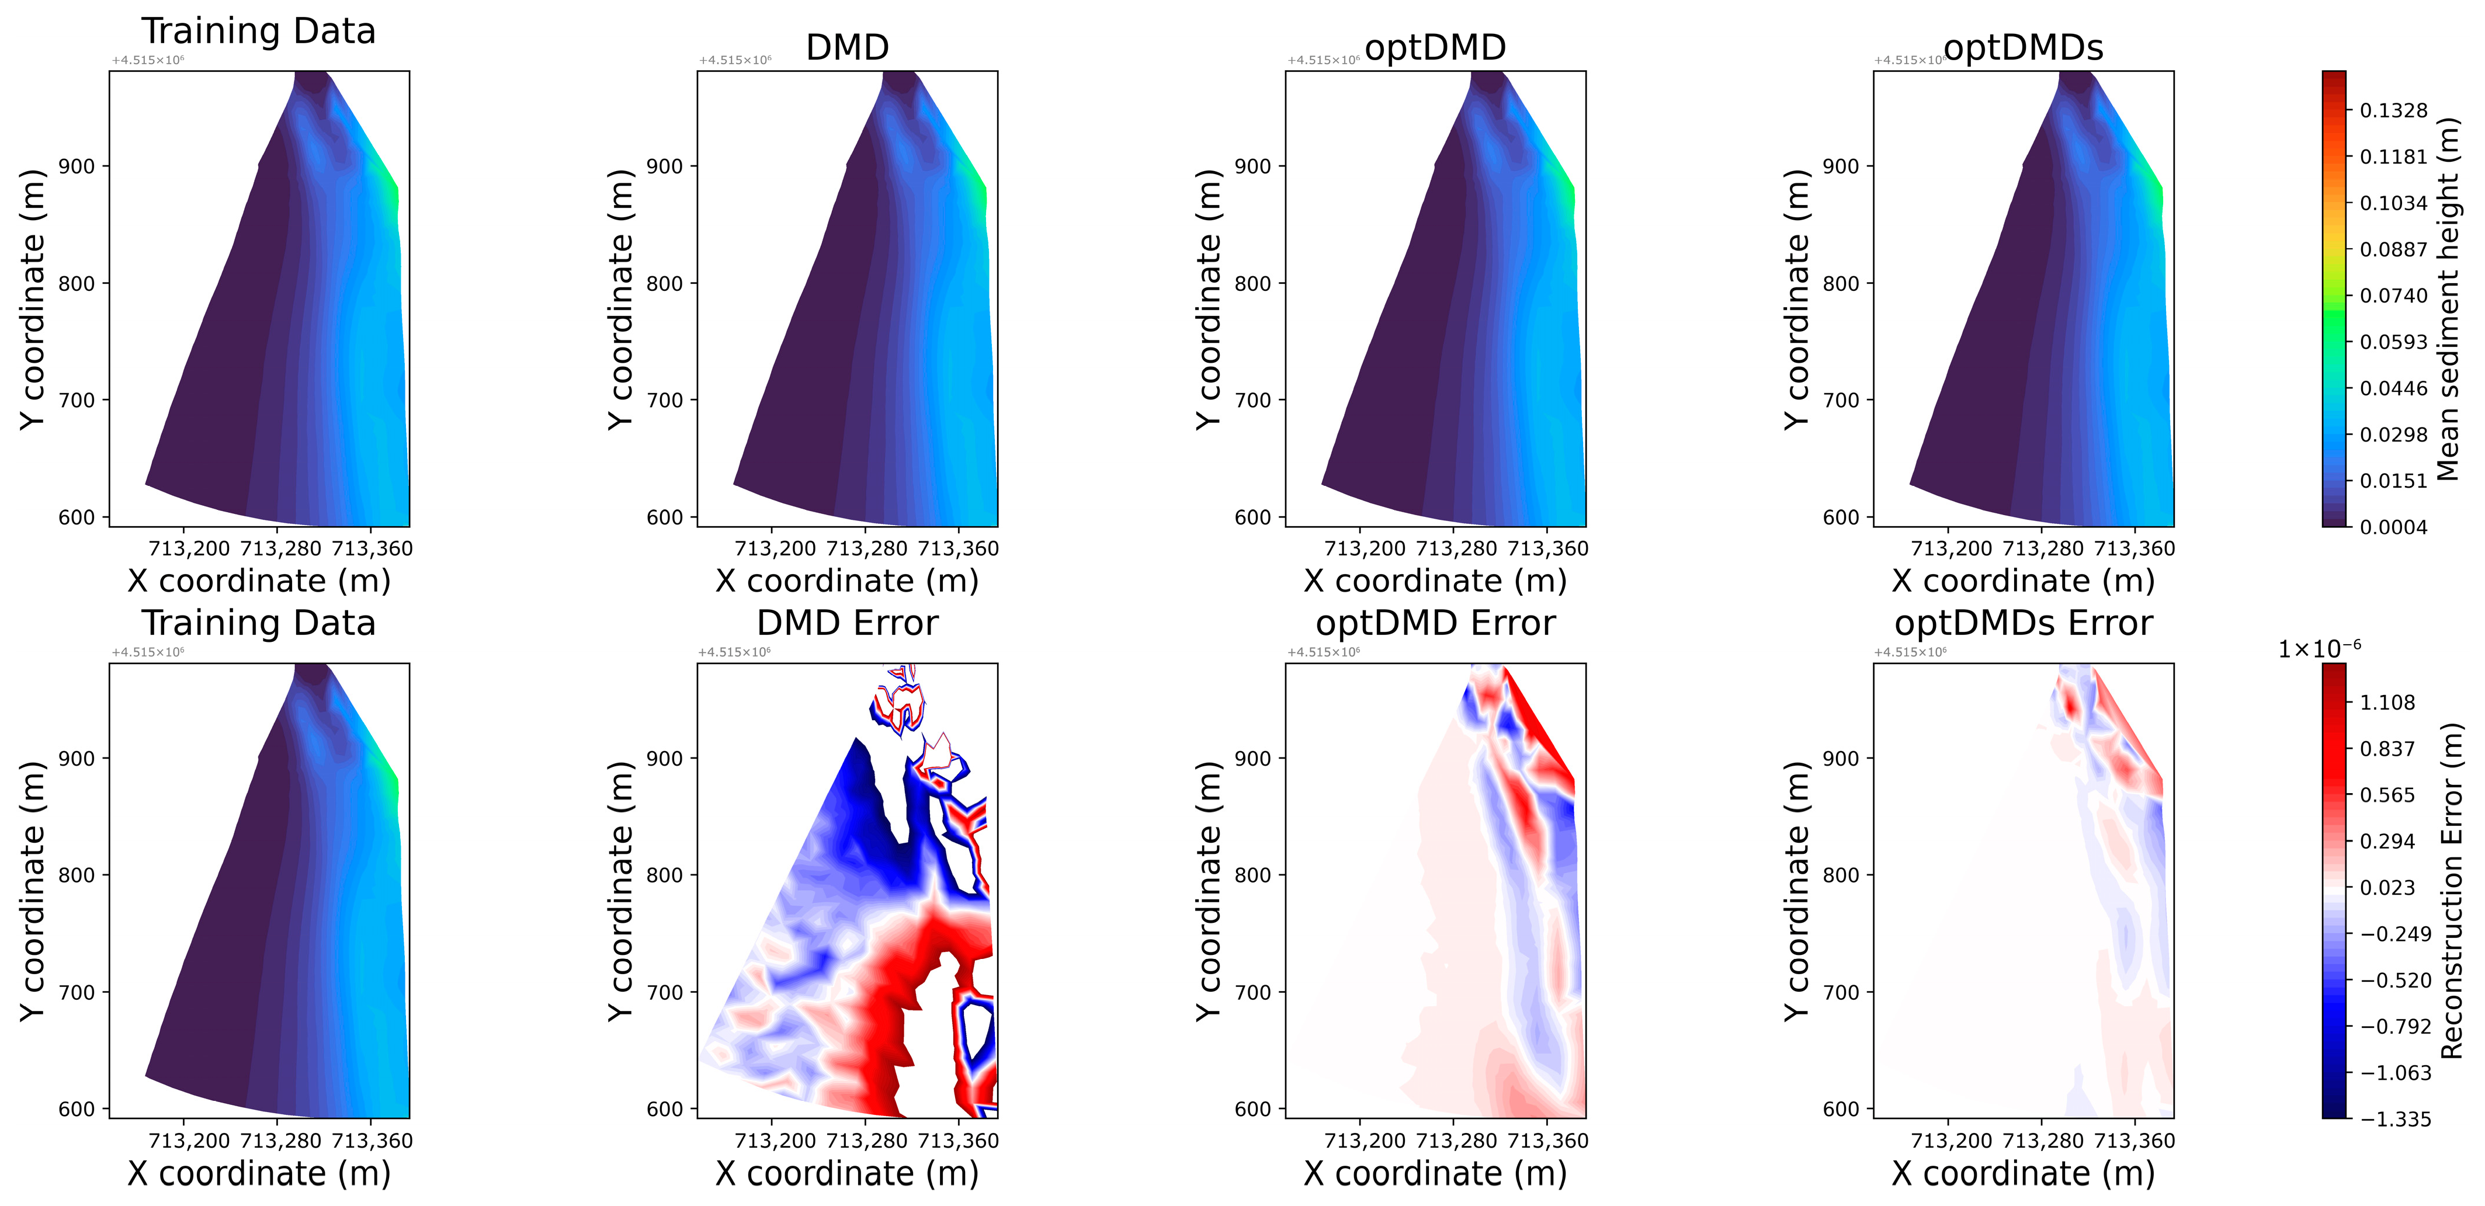
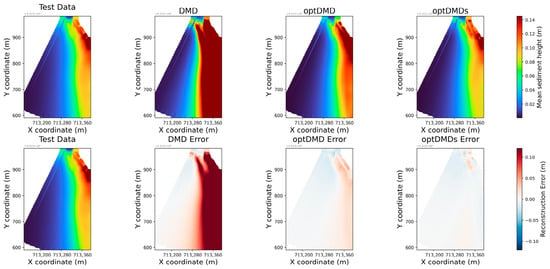
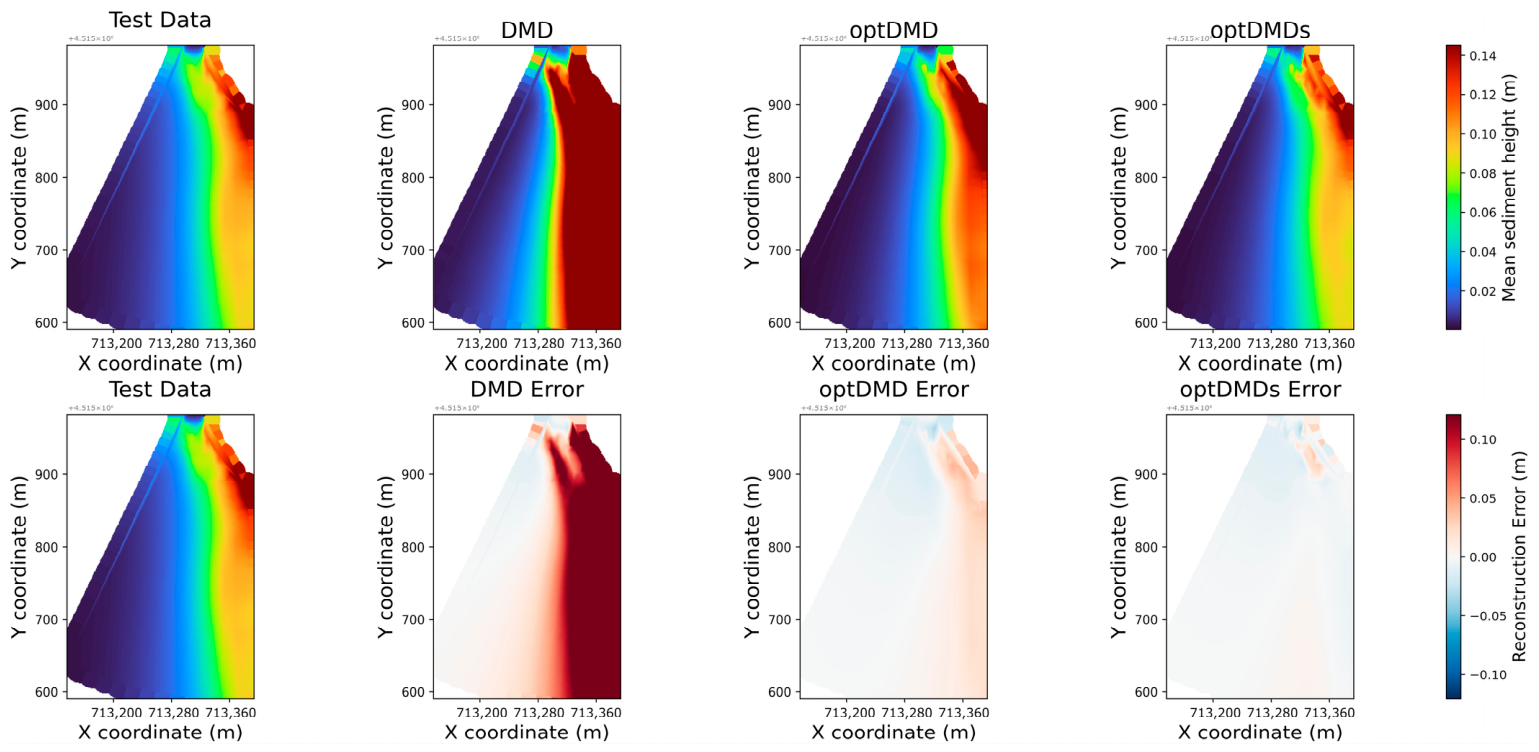
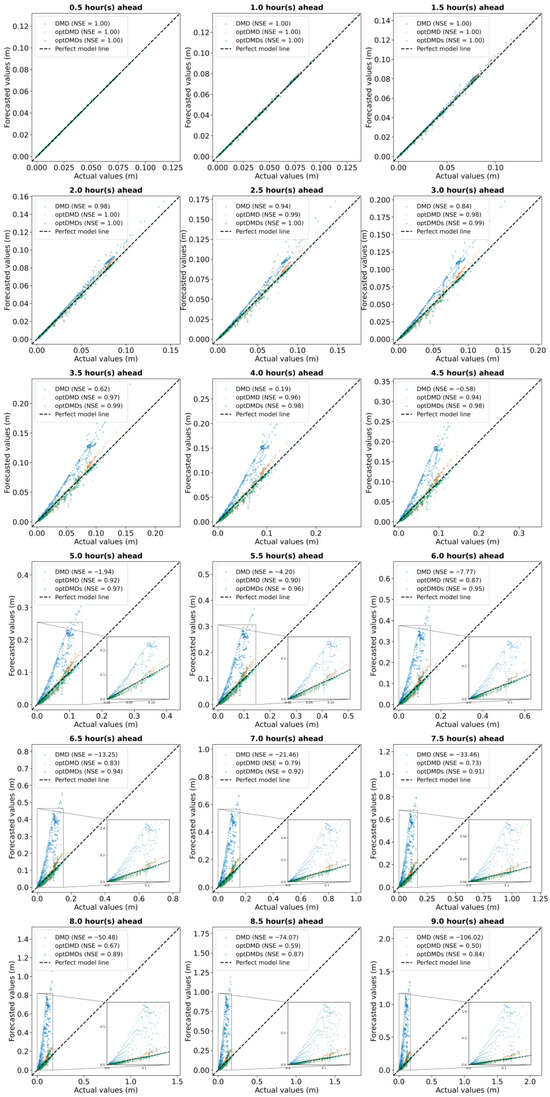
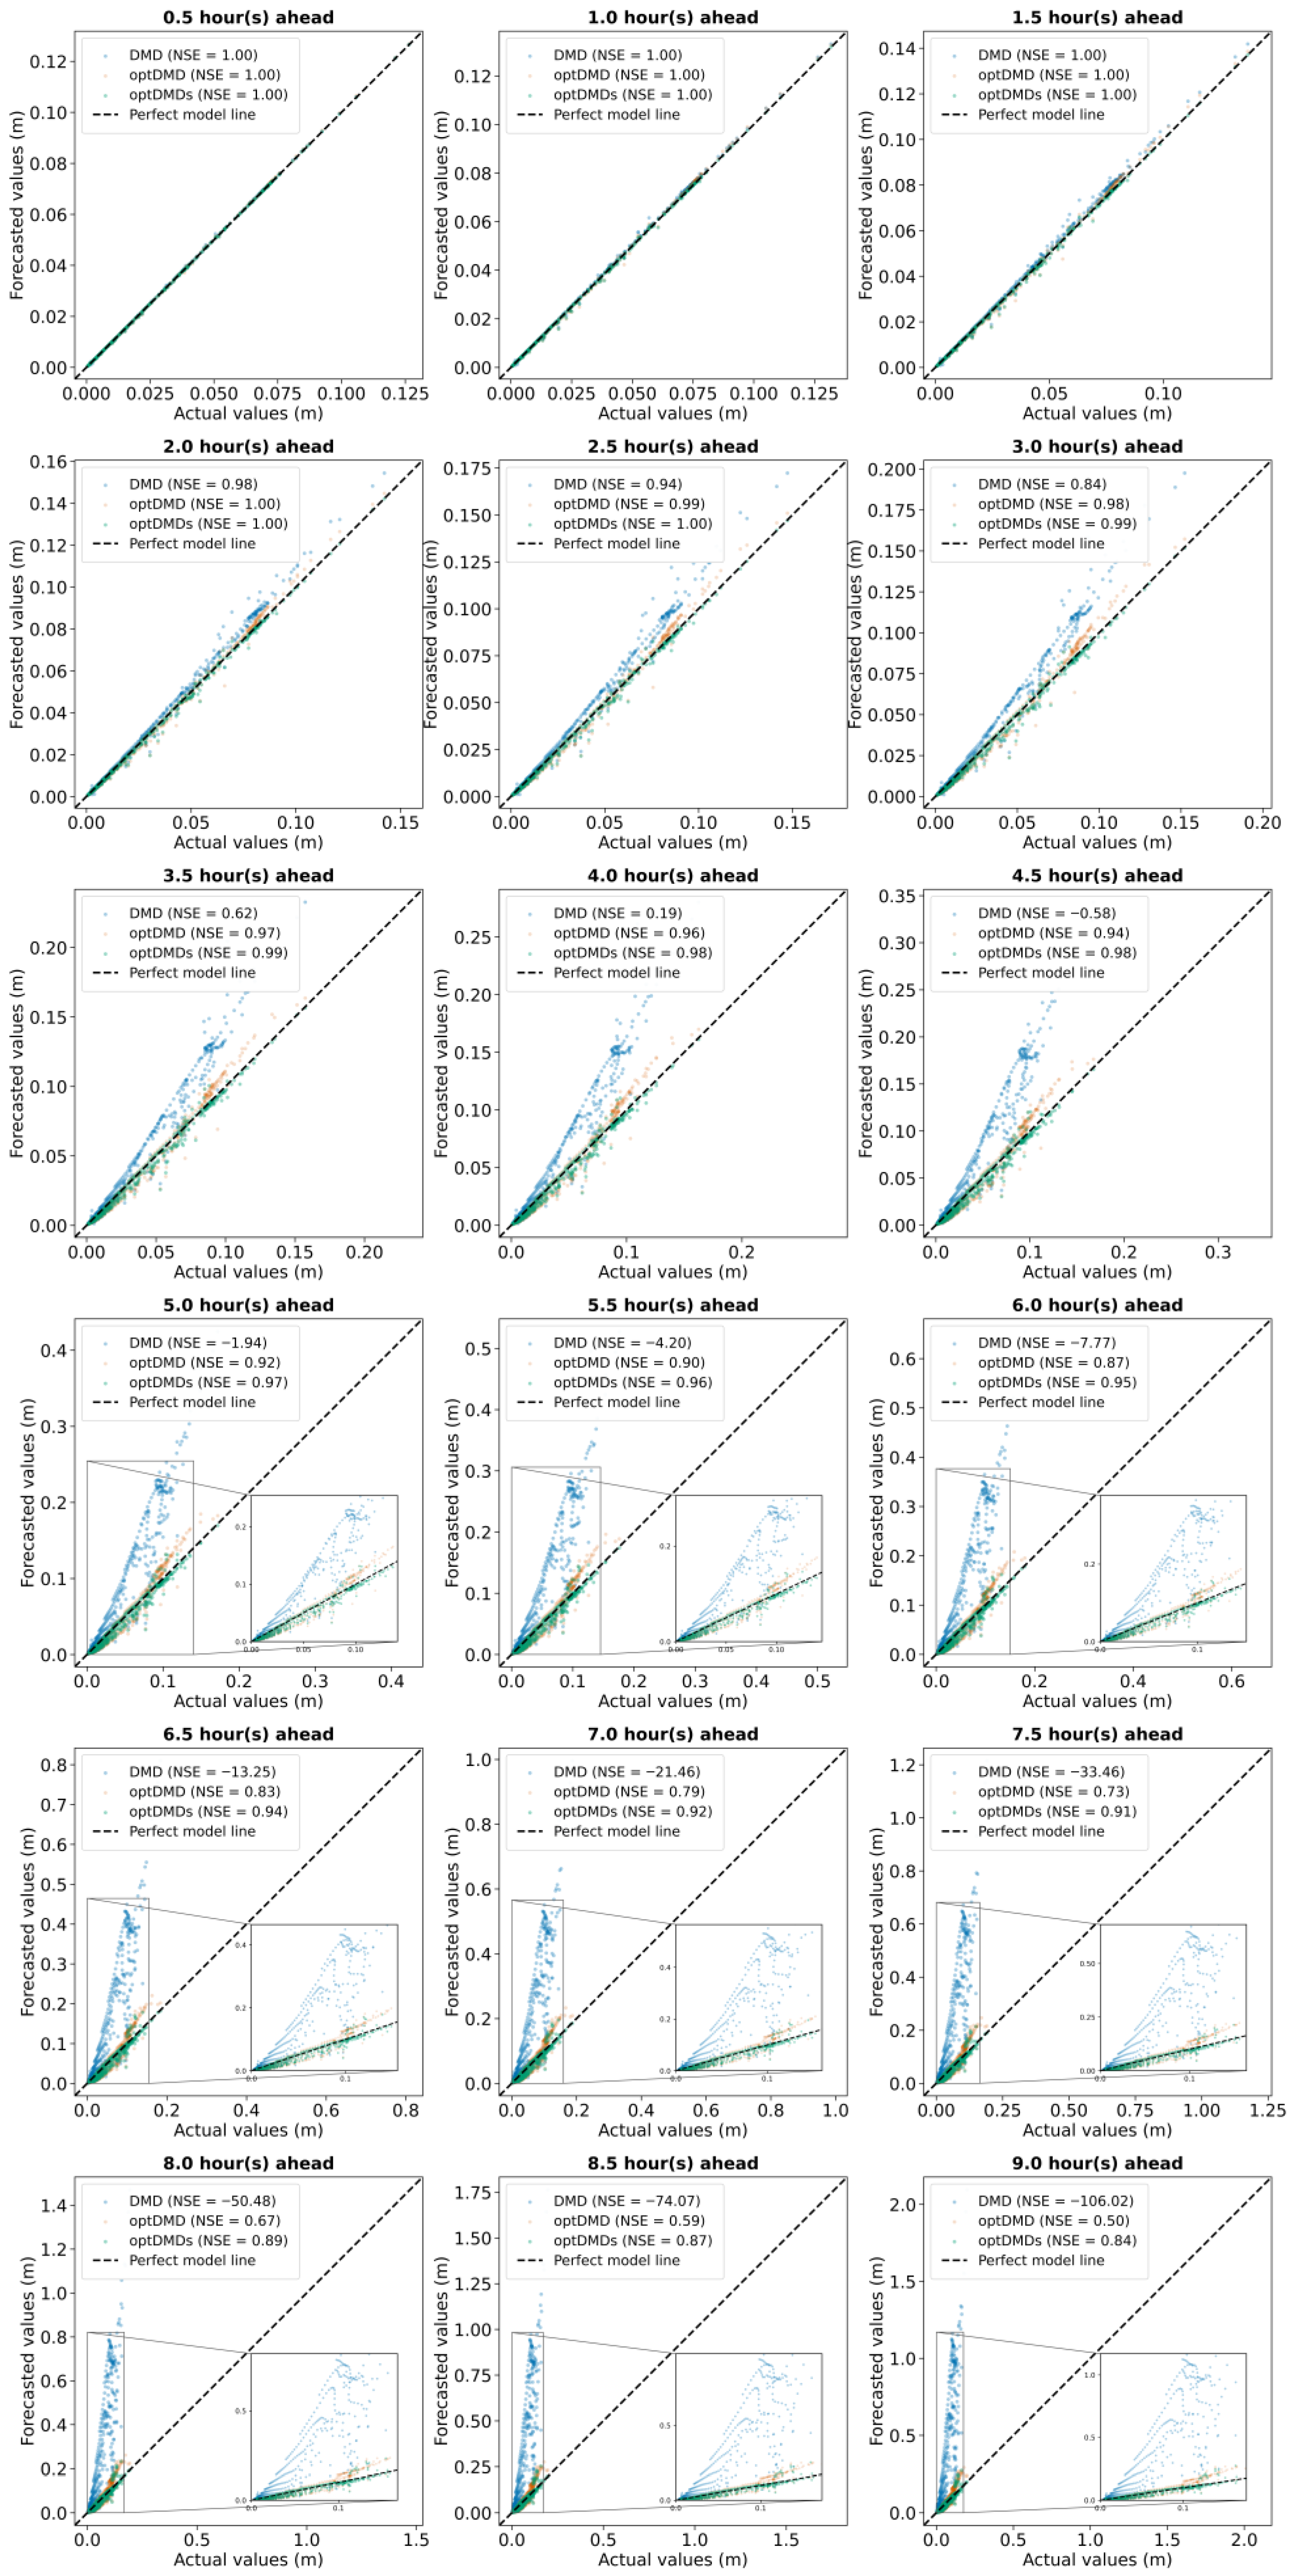
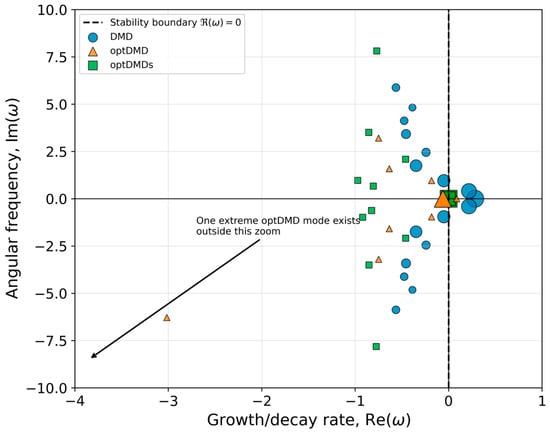
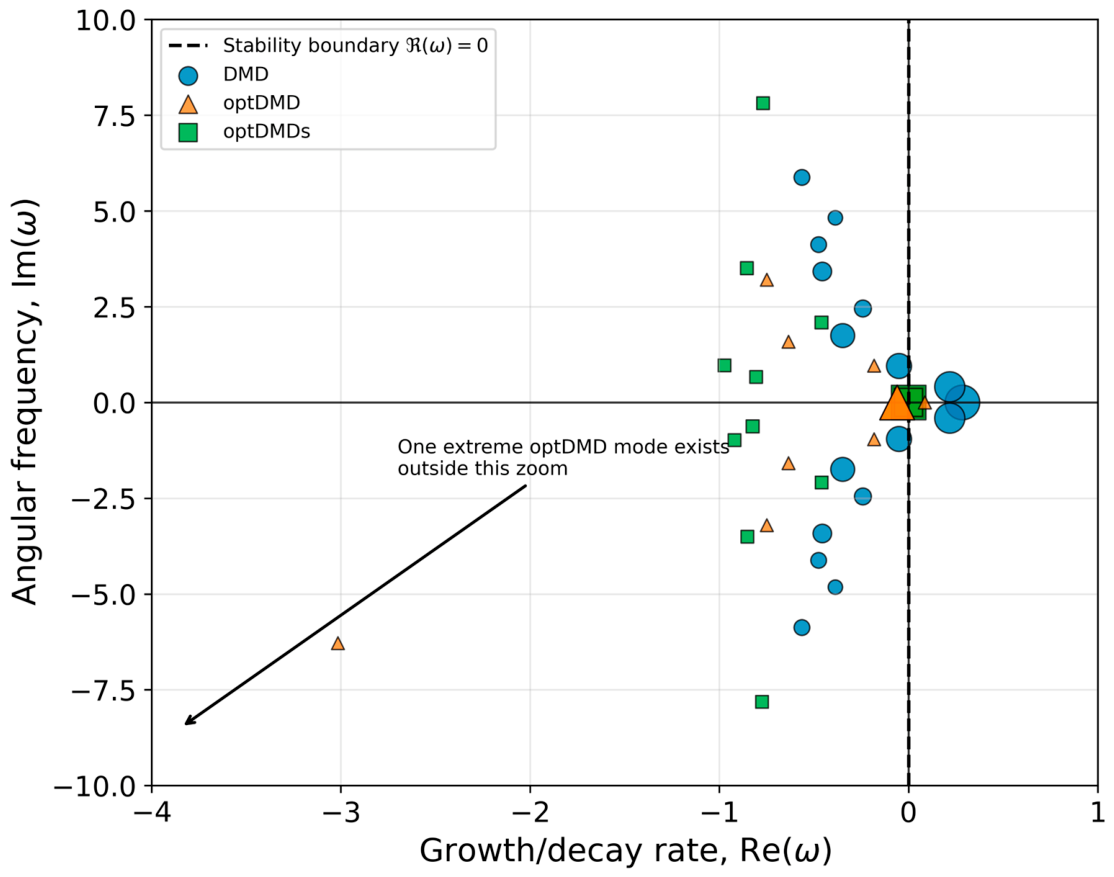
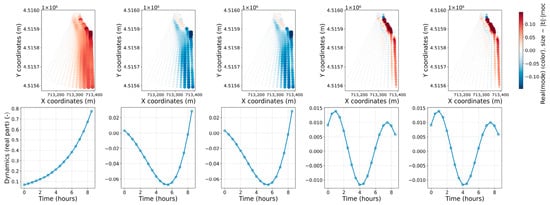
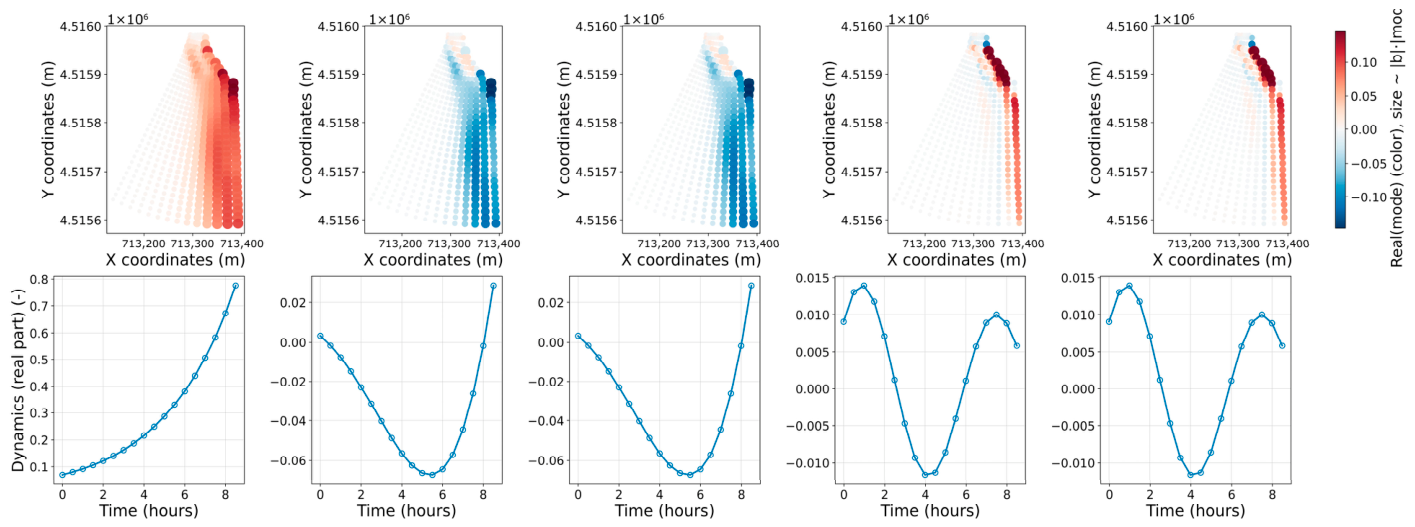
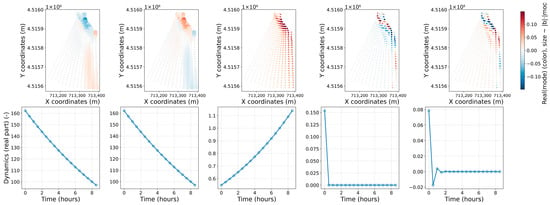
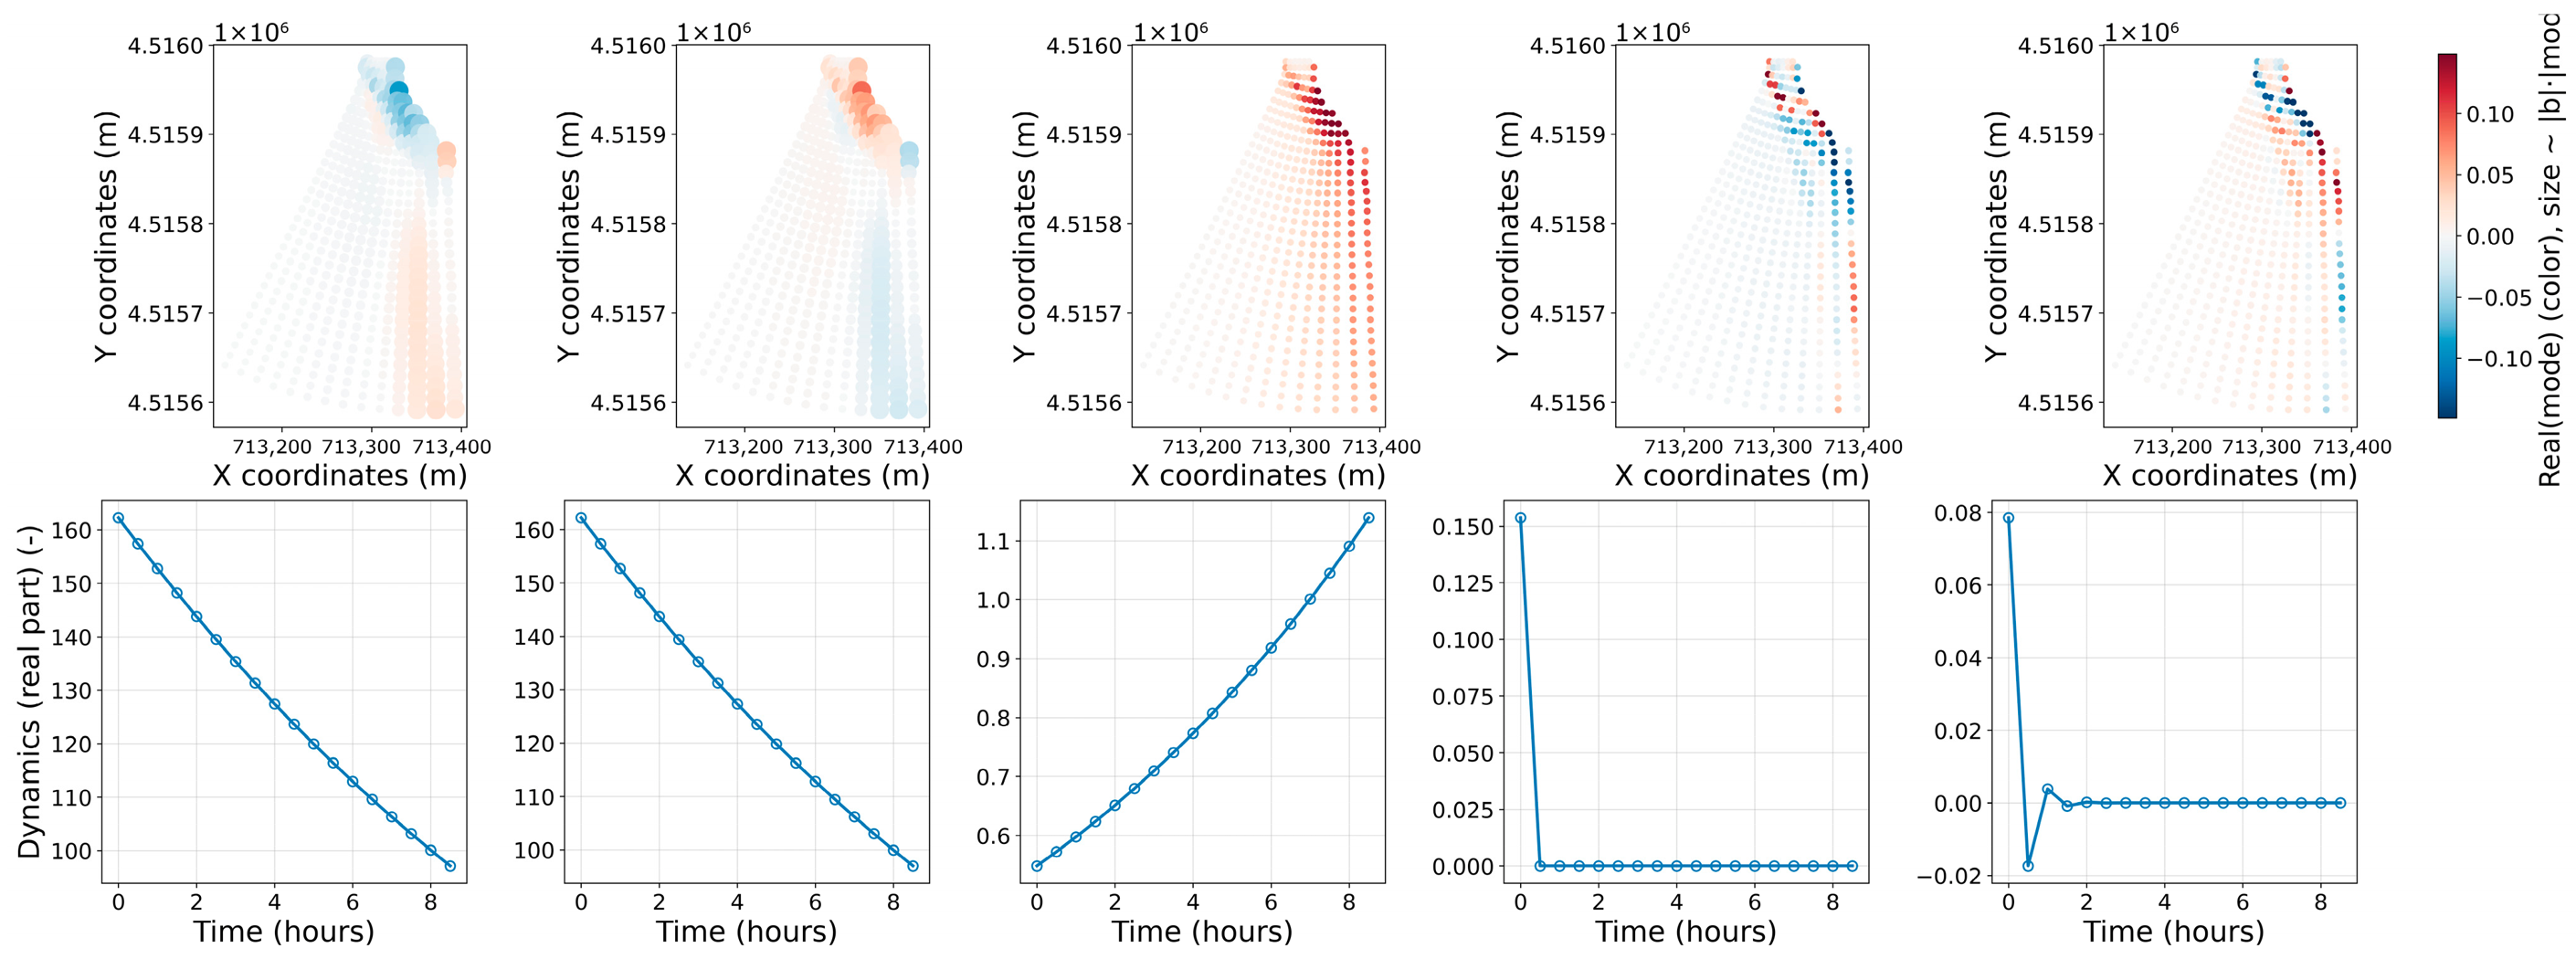
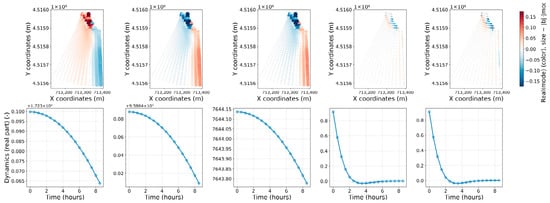
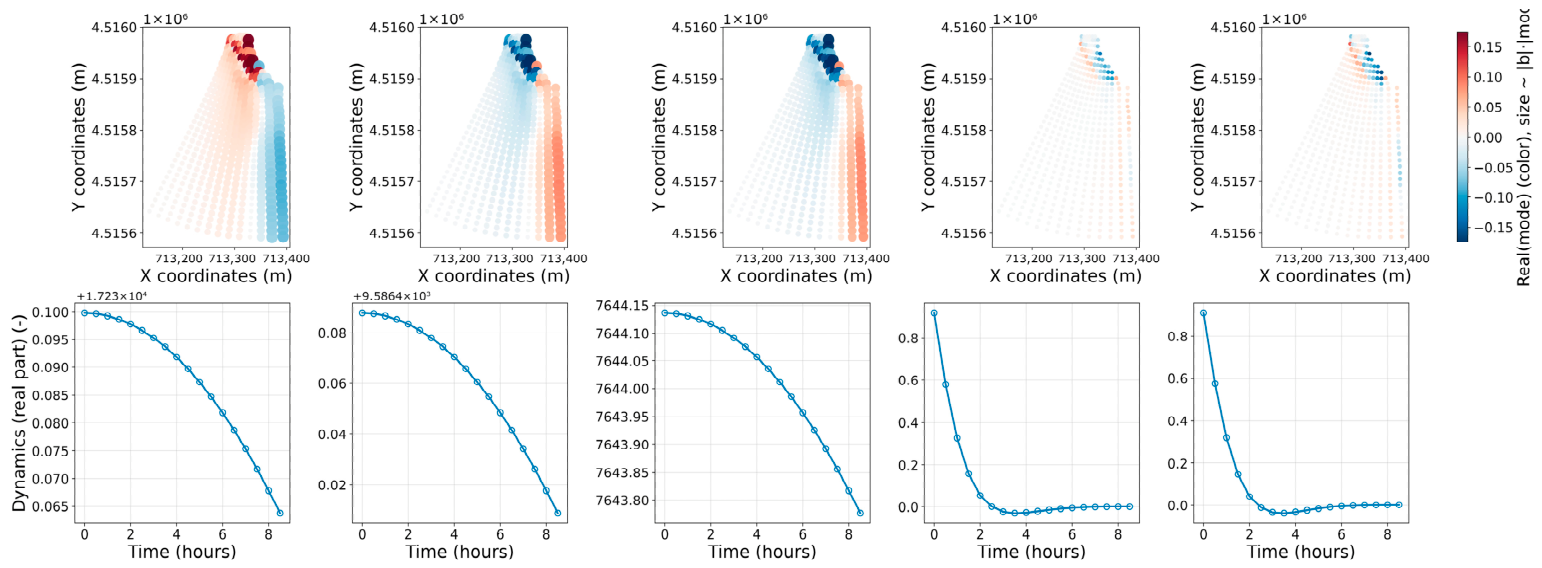
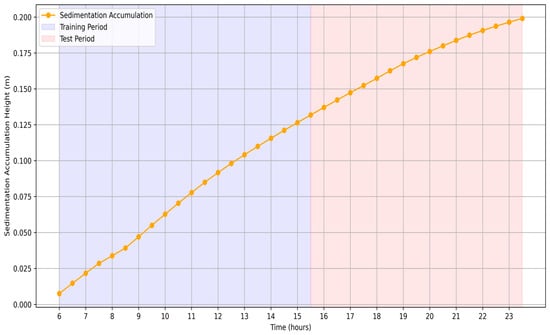
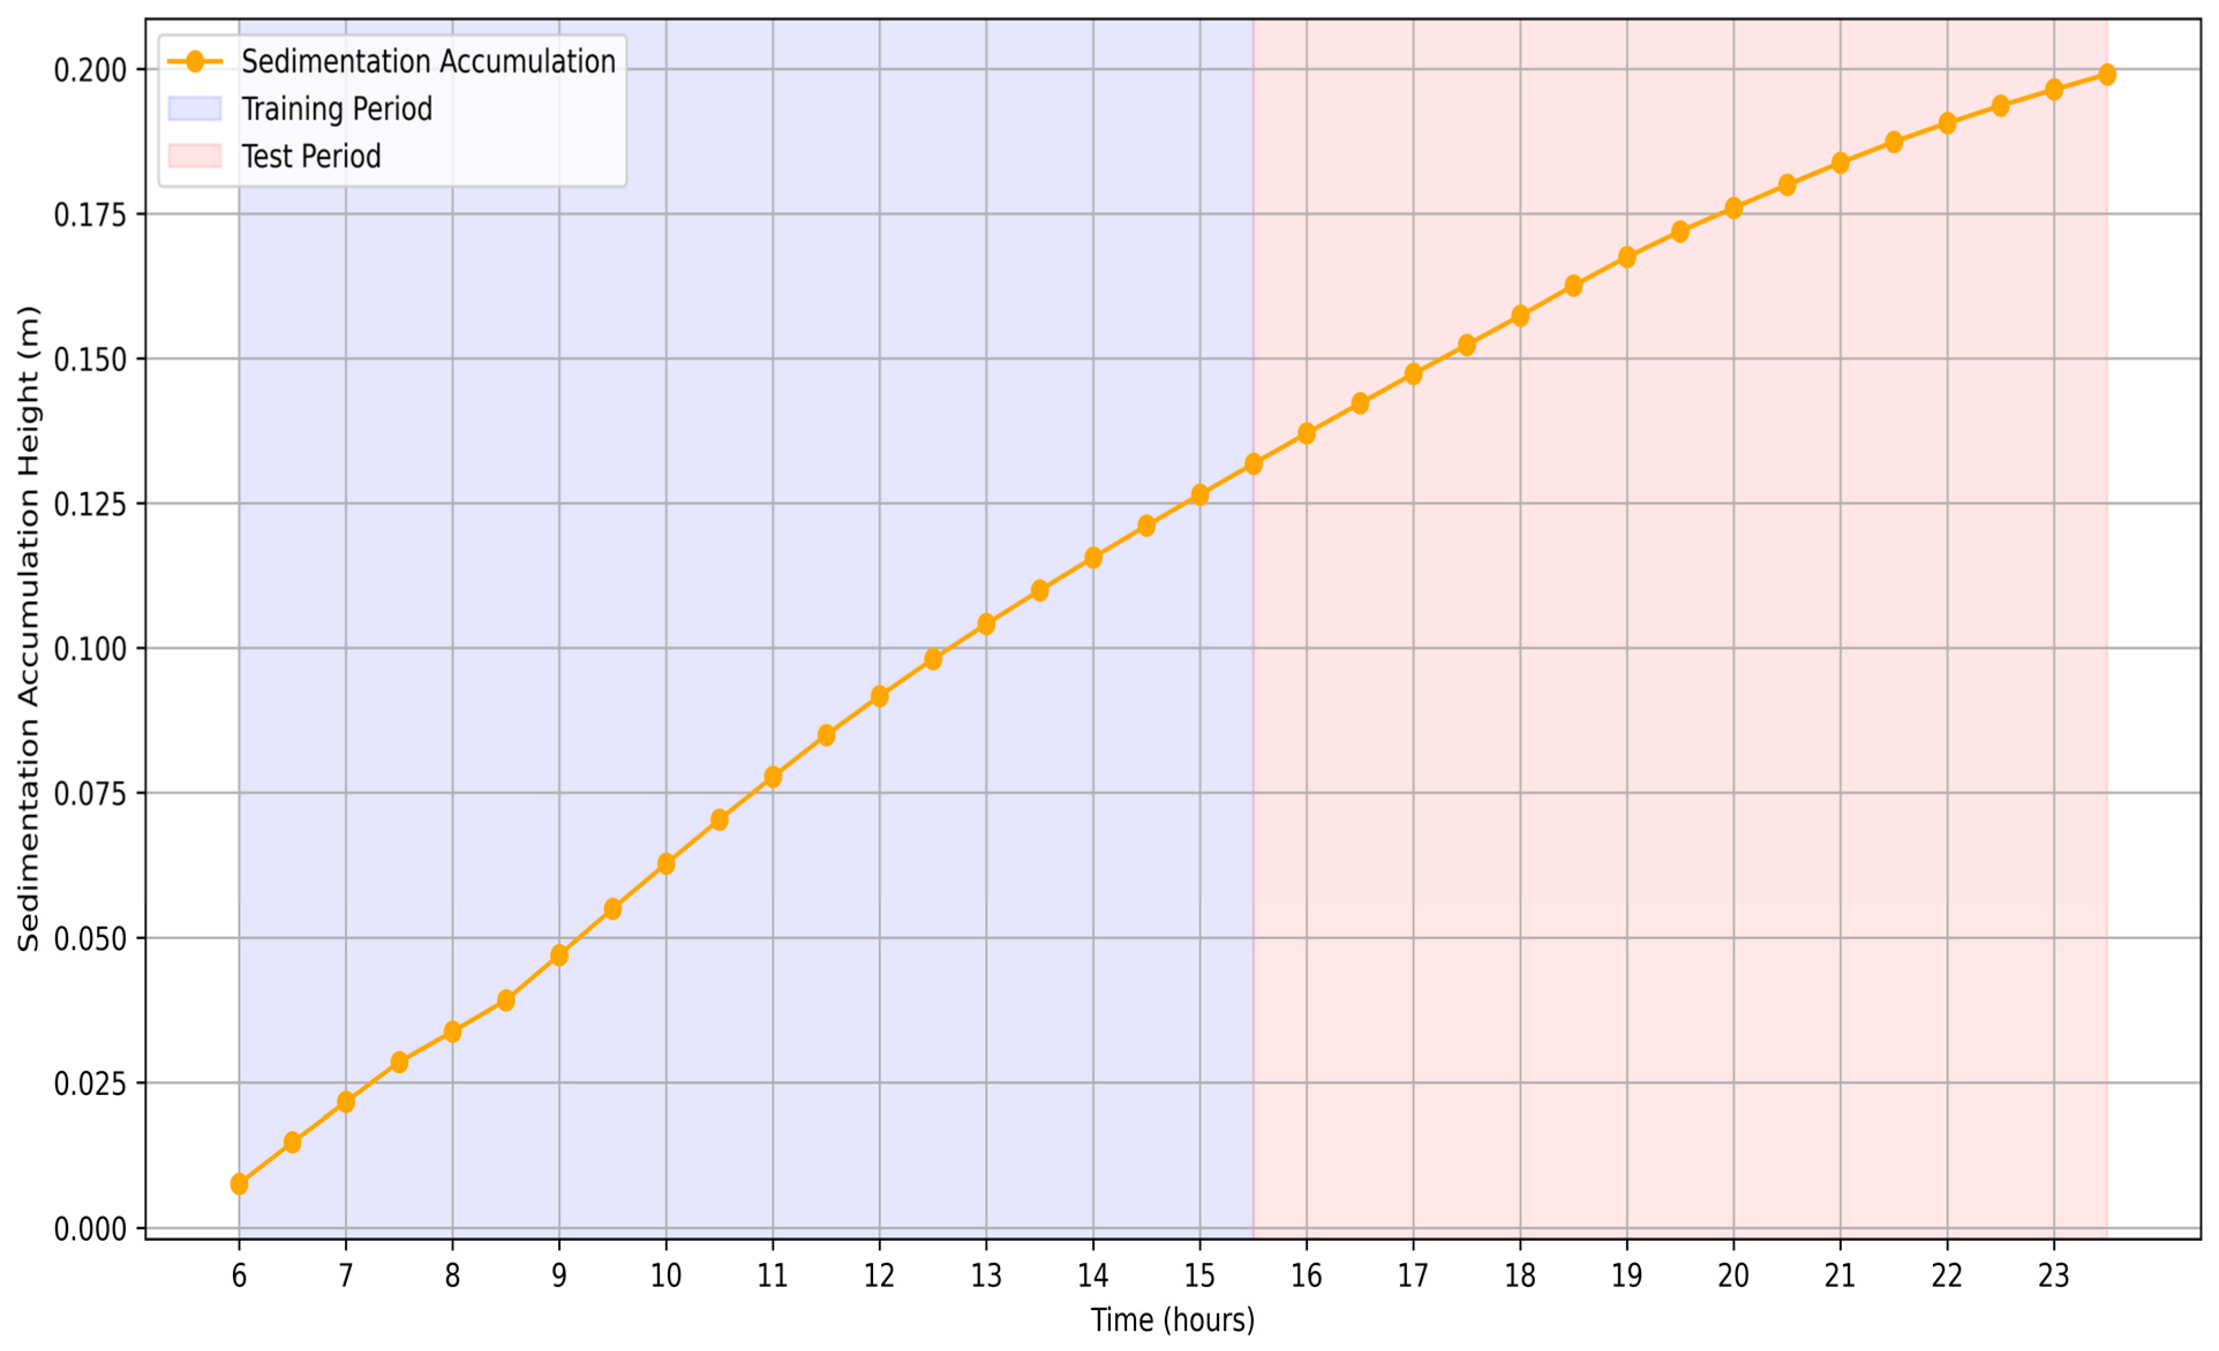

Disclaimer/Publisher’s Note: The statements, opinions and data contained in all publications are solely those of the individual author(s) and contributor(s) and not of MDPI and/or the editor(s). MDPI and/or the editor(s) disclaim responsibility for any injury to people or property resulting from any ideas, methods, instructions or products referred to in the content. |
© 2026 by the authors. Licensee MDPI, Basel, Switzerland. This article is an open access article distributed under the terms and conditions of the Creative Commons Attribution (CC BY) license.