


Abstract
The mechanical performance of concrete cutoff walls in deep overburden is decisive for dam safety. Current coarse mesh models struggle to accurately simulate their response under complex conditions. In this paper, a refined numerical model is established specifically for a concrete cutoff wall in deep overburden. The deformation and stress characteristics and mesh sensitivity of the cutoff wall are systematically investigated. A quantitative index of overstress area ratio is introduced innovatively, and the effects of cutoff wall mesh size along the thickness direction, dam height, and overburden parameters on the deformation and stress characteristics of the cutoff wall are explored in detail. The results show that the stress characteristics of the cutoff wall requires a fine mesh model with an element thickness ≤ 1/4 of the cutoff wall. The change in dam height and overburden parameters mainly affects the stress magnitude of the cutoff wall but does not change its tensile stress distribution pattern. The variable-size mesh generation achieves collaborative optimization of accuracy and efficiency, and the calculation amount is significantly reduced by about 16%, with error below 5%. This study presents an efficient method and can provide technical support for the safety evaluation of concrete cutoff walls in deep overburden.
1. Introduction
With the advancement of hydropower development, most ideal dam sites with favorable geological conditions have already been planned [1,2]. Constructing dams directly on foundations with deep overburden in seismically active regions characterized by high intensity has become an unavoidable challenge [3,4,5,6]. Earth–rock dams exhibit good adaptability to deep overburden and have made great progress and accumulated a lot of experience in recent decades [7,8,9]. Foundation seepage control is a fundamental issue for dams built on overburden. Currently, concrete cutoff walls are widely adopted as the key anti-seepage structure for earth–rock dams built on deep overburden [10,11,12,13]. The concrete cutoff wall located in the overburden is an underground hidden structure, which is rarely maintained in the later period. Under the condition of deep overburden, the cutoff wall experiences a highly complex stress state [14,15,16]. It must withstand not only the gravity load from the dam fill and the hydrostatic pressure imparted by reservoir impoundment but also significant interaction with the surrounding overburden soil. Furthermore, to ensure impermeability quality, the cutoff wall is embedded directly into the valley bedrock by 0.5~1.0 m during construction, imposing a pronounced three-dimensional valley constraint effect. These conditions will reduce the anti-seepage performance of the cutoff wall and pose a serious threat to the dam safety. Simultaneously, earth–rock dams on overburden must also withstand strong earthquakes, as potential failure would cause incalculable downstream losses [17,18]. Since the beginning of the design of the cutoff wall, a reasonable seismic performance evaluation should be carried out to ensure the safety of the dam. Therefore, conducting detailed analysis and research on concrete cutoff walls is essential for achieving a scientific understanding of their actual working behavior and, consequently, for the rational assessment of the safety status of earth–rock dams on deep overburden [19,20].
The finite element analysis method offers low cost and high repeatability, enabling relatively straightforward simulation of complex engineering problems, and has been widely adopted in dam engineering safety evaluation and design [21,22,23,24]. Wen et al. [20,25,26,27,28] conducted multiple studies on concrete cutoff walls based on finite element numerical analysis, with analytical results showing good agreement with field measurements. These results demonstrate the feasibility of applying the finite element method to concrete cutoff wall research. Much existing research on concrete cutoff walls is limited to two-dimensional finite element analysis [29,30,31,32], simulating the influence of factors such as element type, contact behavior between the cutoff wall and adjacent soil, construction simulation, and material properties on wall stress–deformation [33,34,35]. However, since the base of the concrete cutoff wall is typically embedded 0.5~1 m into bedrock to ensure effective seepage control, the valley geometry imposes strong three-dimensional constraint effects on the deformation of the cutoff wall. Two-dimensional finite element analysis can only reflect the stress–deformation state at the valley centerline of the wall and cannot reflect the complex three-dimensional effect of the cutoff wall [36]. Therefore, it is necessary to carry out more complex three-dimensional finite element analysis to accurately simulate the three-dimensional valley effect of concrete cutoff walls in deep overburden. Furthermore, appropriate quantitative indicators should be introduced to evaluate mesh sensitivity and improve the reliability of numerical results [37,38].
Mesh generation is the basis of finite element numerical simulation, so the mesh size has a great influence on the reliability and accuracy of numerical results [39]. However, there is no relevant deterministic mesh size determination method for three-dimensional cutoff wall research. The earth–rock dam built on the deep overburden is large in scale, while the thickness of the concrete cutoff wall is only about 1 m, and the scale between the two is huge. If the dam is meshed according to the uniform mesh size, the small-scale mesh of the cutoff wall will cause the numerical model to have a large number of degrees of freedom, and the calculation amount is difficult to bear [40,41]. Therefore, in the finite element analysis, the conventional linear element with a simple structure and convenient use is often used, and the unit size is generally controlled at 5–10 m or even larger to improve the calculation efficiency. However, for the thin slab concrete cutoff wall in the deep overburden, it may lead to bending deformation under load, but the conventional linear element cannot describe the bending deformation characteristics of the structure well, so it is necessary to select a more suitable element type to describe its bending deformation characteristics more accurately. Previous studies have shown that the non-conforming element can more accurately describe the tensile deformation of the thin plate cutoff wall by referring to the additional displacement mode in theory and can capture the tensile stress more than the conventional element [23].
The thickness of the cutoff wall is generally 1.2 m [42]. Many researchers divide it into two layers along the river or directly assign the element thickness (longitudinal dimension) equal to its actual thickness, neglecting the influence of element thickness on computational results. However, in the actual working state, the stress on the upstream and downstream sides of the cutoff wall is quite different. For example, the bending deformation of the cutoff wall caused by water storage is mainly manifested as compressive stress and tensile stress on the upstream and downstream sides of the bending part. Obtaining the stress generated by bending requires a more detailed mesh, so it is necessary to divide the cutoff wall into multiple layers to describe the stress state changes on the upstream and downstream sides. If the cutoff wall element is thick, it is difficult to accurately obtain the stress results, and then it is difficult to ascertain the service state of the wall.
In this paper, the concept of overstress area ratio is introduced to analyze the effect of the mesh generation strategy of the numerical model of the cutoff wall. A three-dimensional numerical model of an earth–rock dam on deep overburden is established, and the mesh sensitivity of the concrete cutoff wall is studied based on non-conforming elements. The effect of variations in element thickness, dam height, and overburden parameters on its deformation and stress characteristics is discussed. The key technical path of refinement modeling is proposed by changing the plane mesh size subdivision method. The numerical analysis was conducted with GEODYNA 2020, a nonlinear, large-scale, and high-performance analysis software system for hydraulic structure and geotechnical engineering independently developed by the Institute of Engineering Seismic Research of Dalian University of Technology [5]. The software has been applied to the safety evaluation and design optimization of several important projects and has been popularized in many design and research institutions [43,44,45,46,47].
2. Numerical Model and Calculation Parameters
2.1. Numerical Model
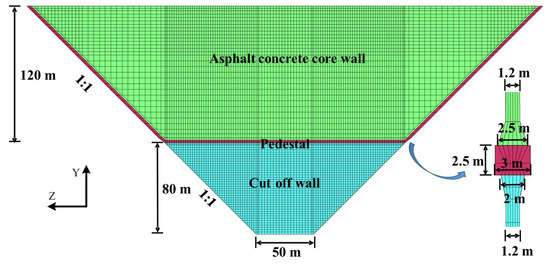
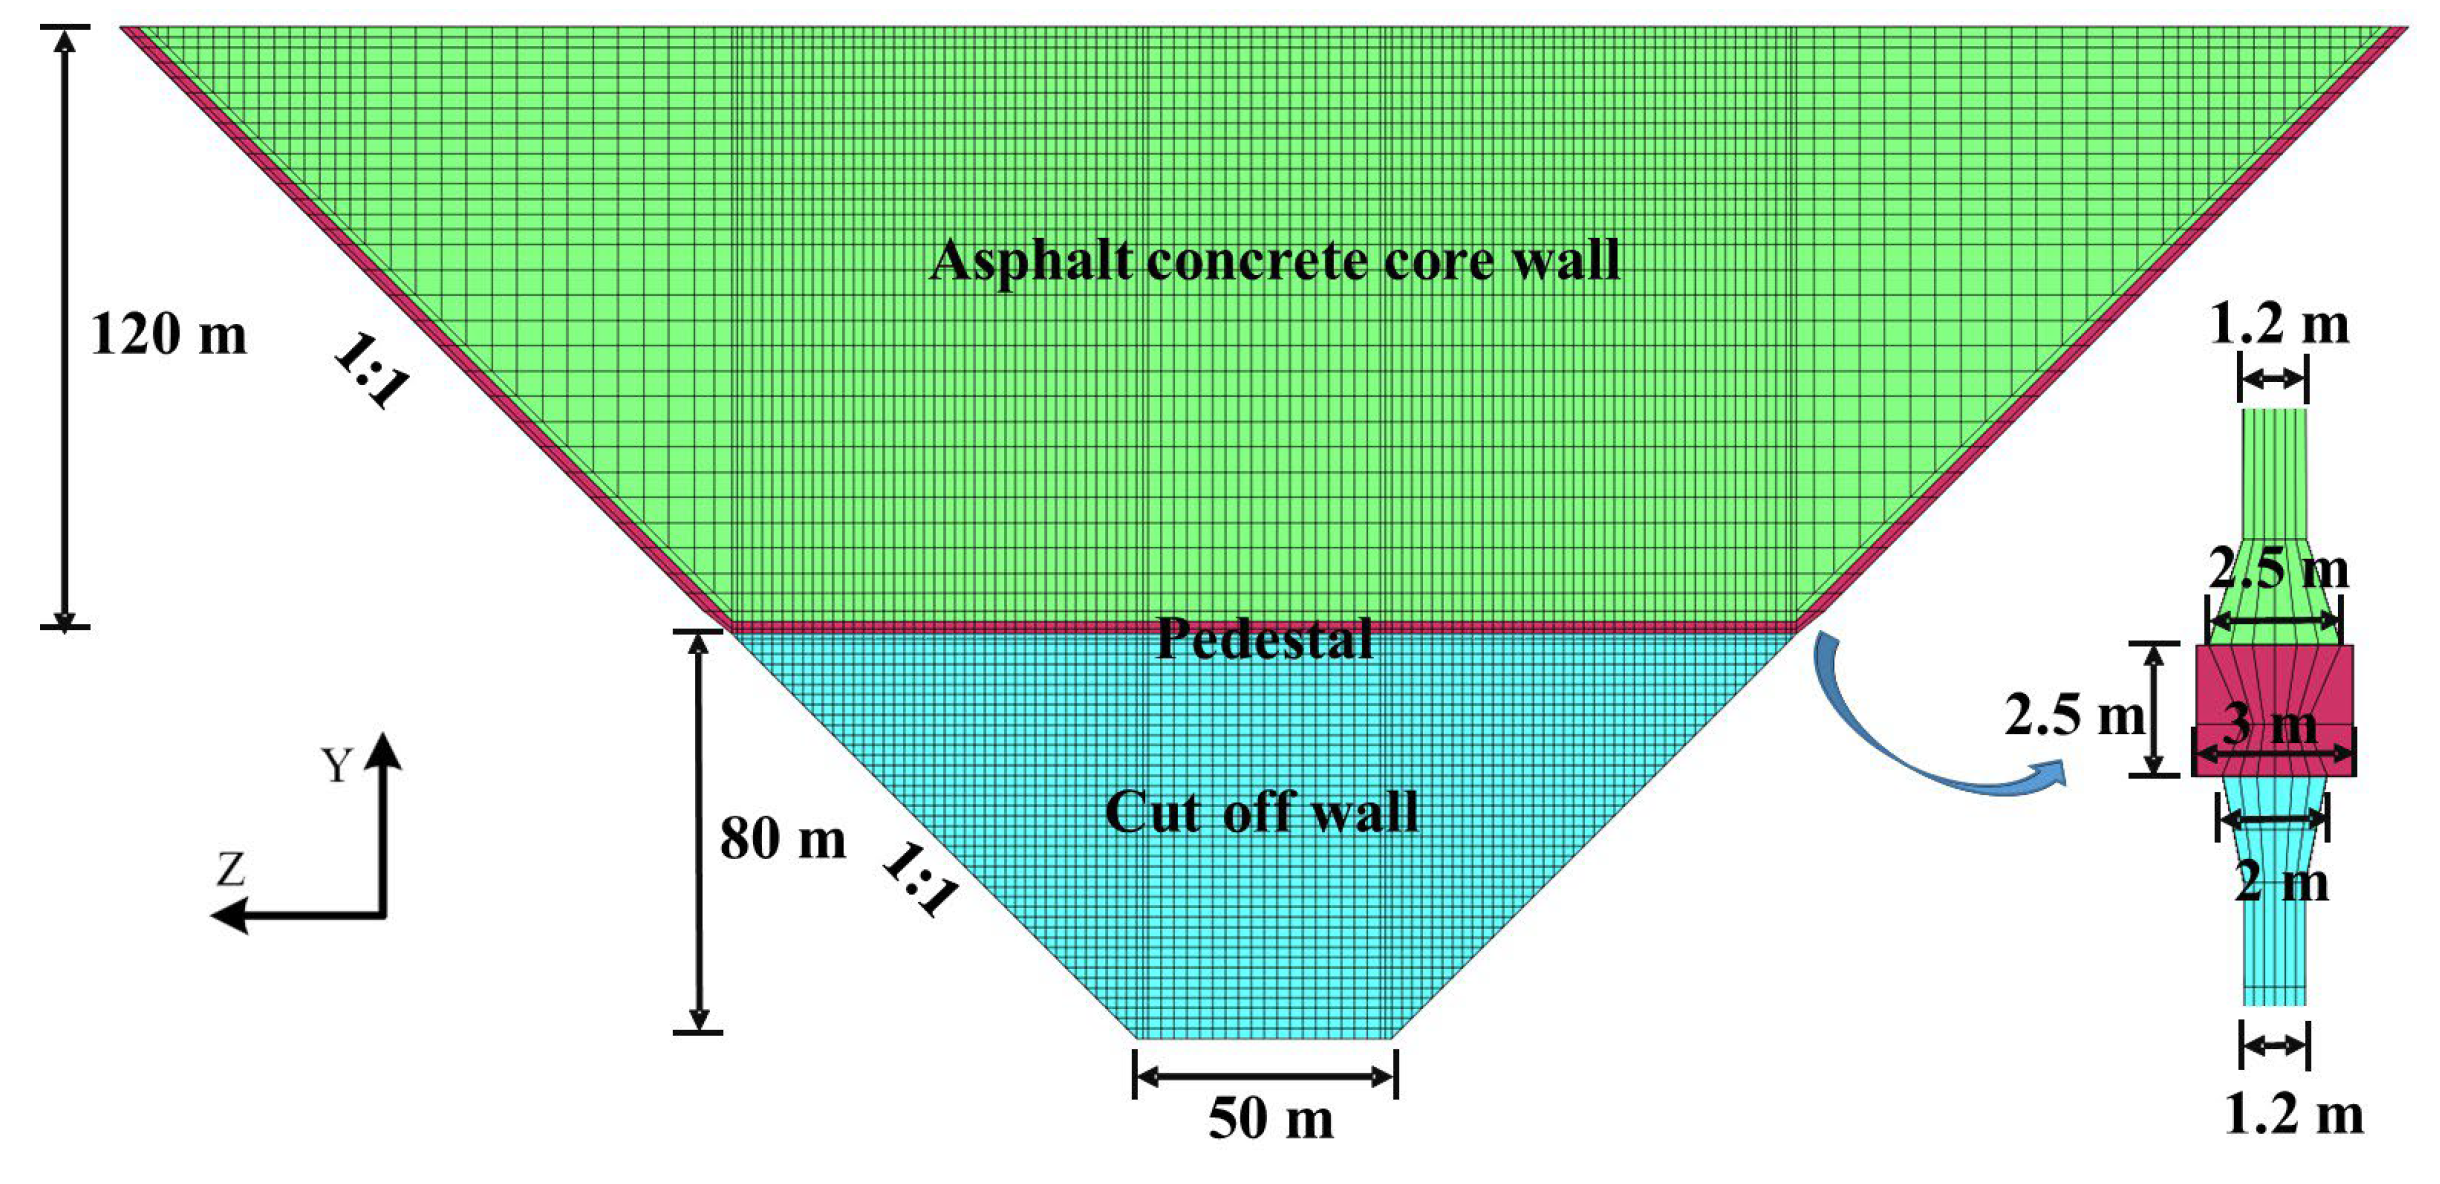
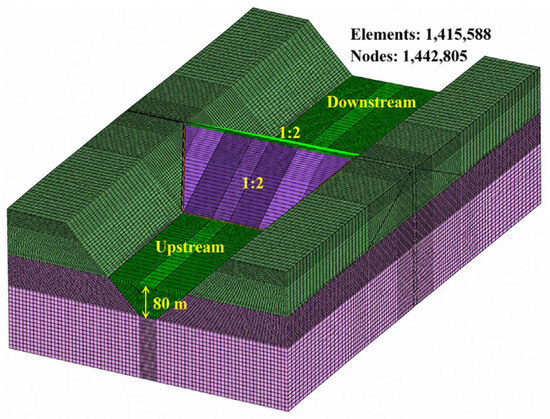
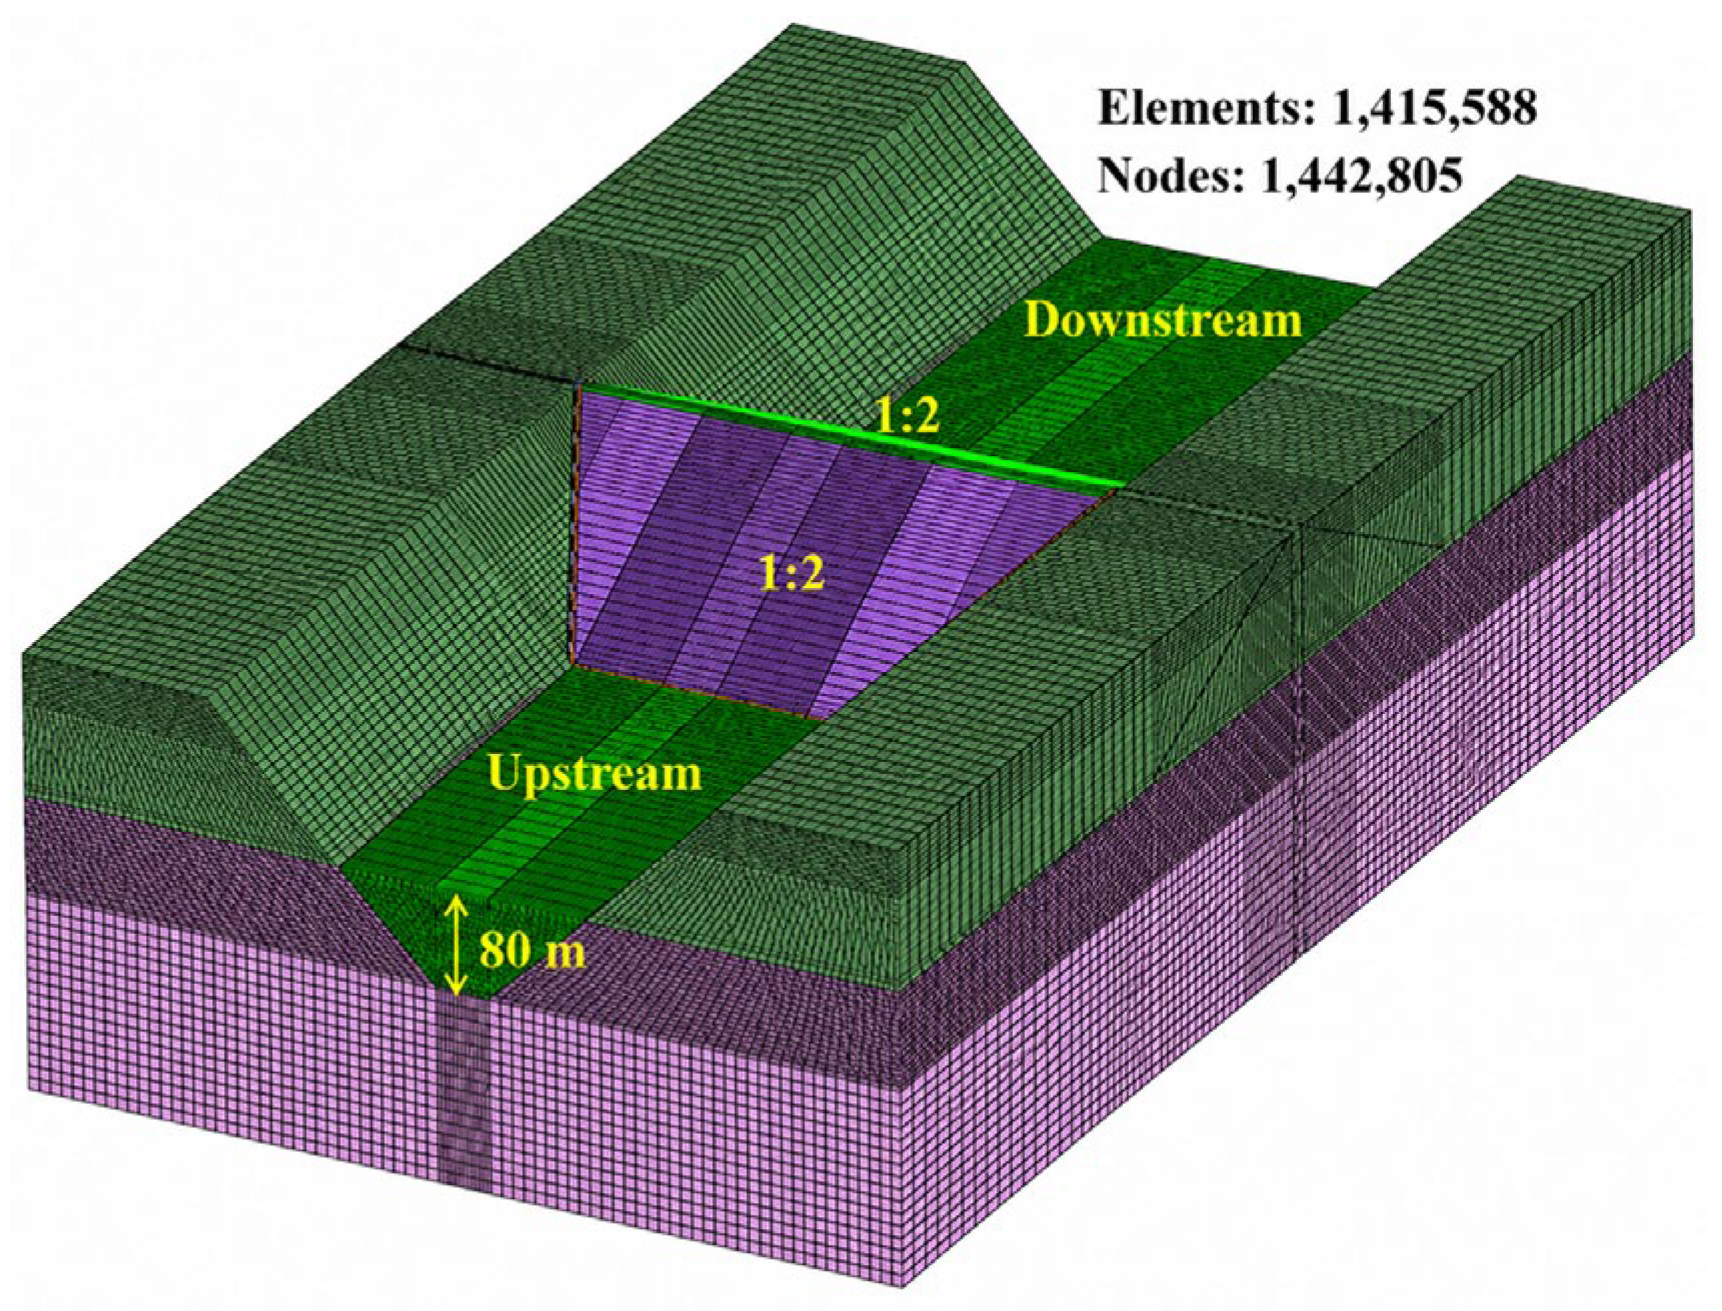
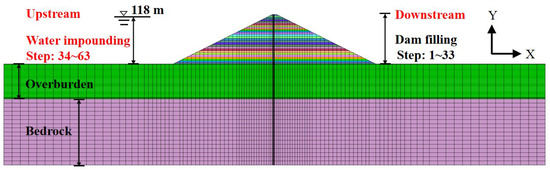
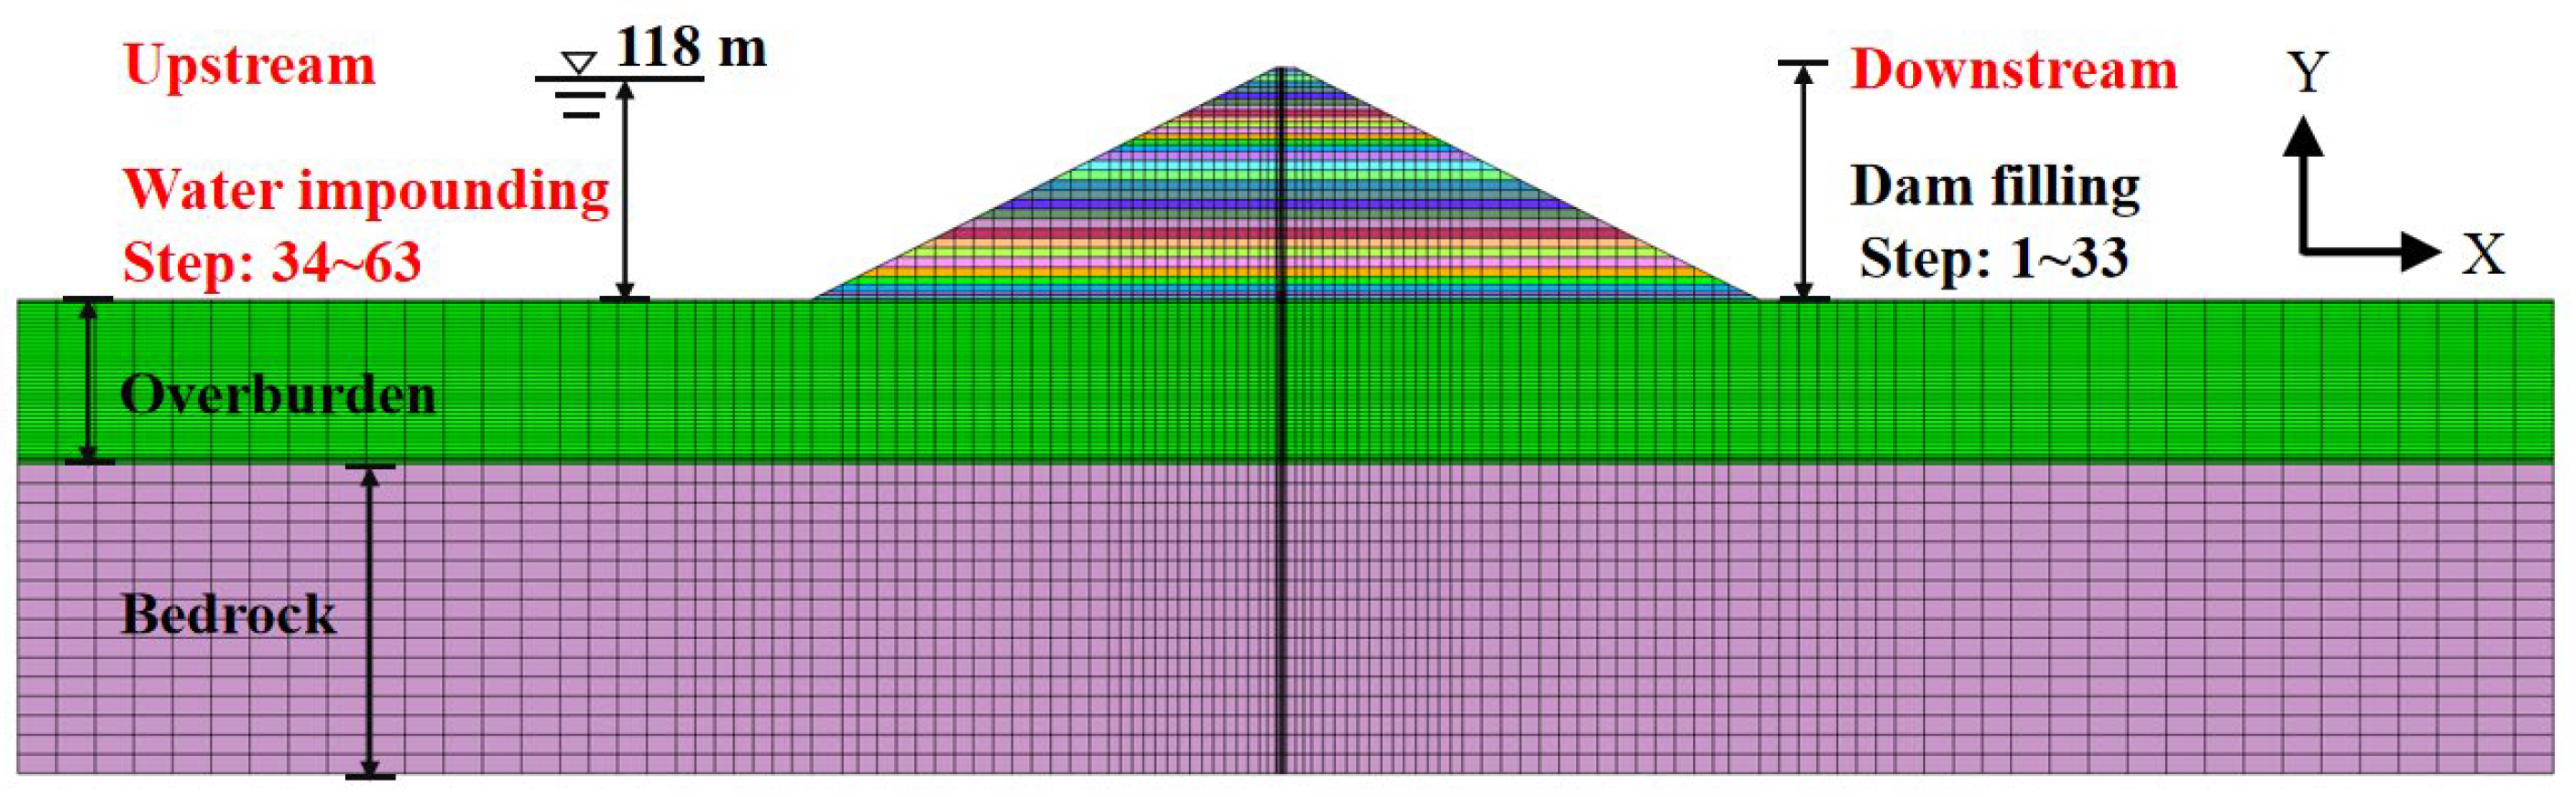
The maximum dam height of an asphalt concrete core wall dam is 120 m, and the depth of the concrete cutoff wall is 80 m. The dam crest is 10 m wide, the upstream and downstream slopes are both 1.0:2.0, and the valley slopes on the left and right sides are both 1.0:1.0. The thickness of the core wall is gradually changed. The thickness of the top is 0.5 m, and the thickness of the bottom is 1.2 m. After the transition section of 2 m high, it is expanded from 1.2 m to 2 m thick and connected to the base. The axis is 3 m away from the upstream side of the dam top, and the transition layer with a thickness of 2 m is set on both sides. The slope of the left and right valleys of the overburden layer is 1.0:1.0, and the bottom width of the valley is 50 m. The 1.2 m thick fully enclosed concrete cutoff wall is used as the vertical anti-seepage of the overburden dam foundation. The bottom of the cutoff wall is embedded in the valley bedrock at 1 m, and the anti-seepage system of the dam is shown in Figure 1. Figure 2 is a three-dimensional finite element model of the dam, which divides the cutoff wall into four layers along the thickness direction. The number of nodes in the finite model is 1,442,805, the number of elements is 1,415,588, and the main element type is an 8-node hexahedral isoparametric element. Within this model, the finite element mesh size for the concrete cutoff wall does not exceed 2 m, totaling 10,496 elements. The dam filling is divided into 33 steps, and the impoundment is divided into 30 steps. The schematic diagram of the maximum section and load step of the dam is shown in Figure 3.
Figure 1.
Finite element mesh model of dam anti-seepage system.
Figure 2.
Three-dimensional finite element mesh model of dam.
Figure 3.
The maximum section and load step diagram of the dam.
2.2. Calculation Parameters
The Duncan Chang E-B model [48] is used to simulate the soil behavior in the static calculation. The material parameters are taken from the results of an indoor triaxial test of actual earth–rock dam construction materials.
Among them, represents the soil density, denotes the cohesion, is the internal friction angle, and represents the reduction of the internal friction angle in logarithmic coordinates with a tenfold increase in confining pressure. is the failure ratio, k is the unloading modulus number, n is the loading modulus exponent, and m is the bulk modulus exponent.
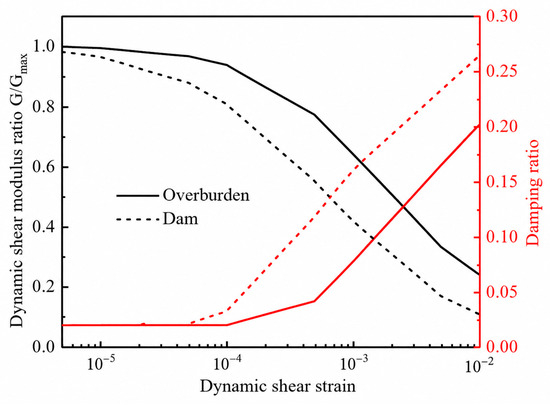
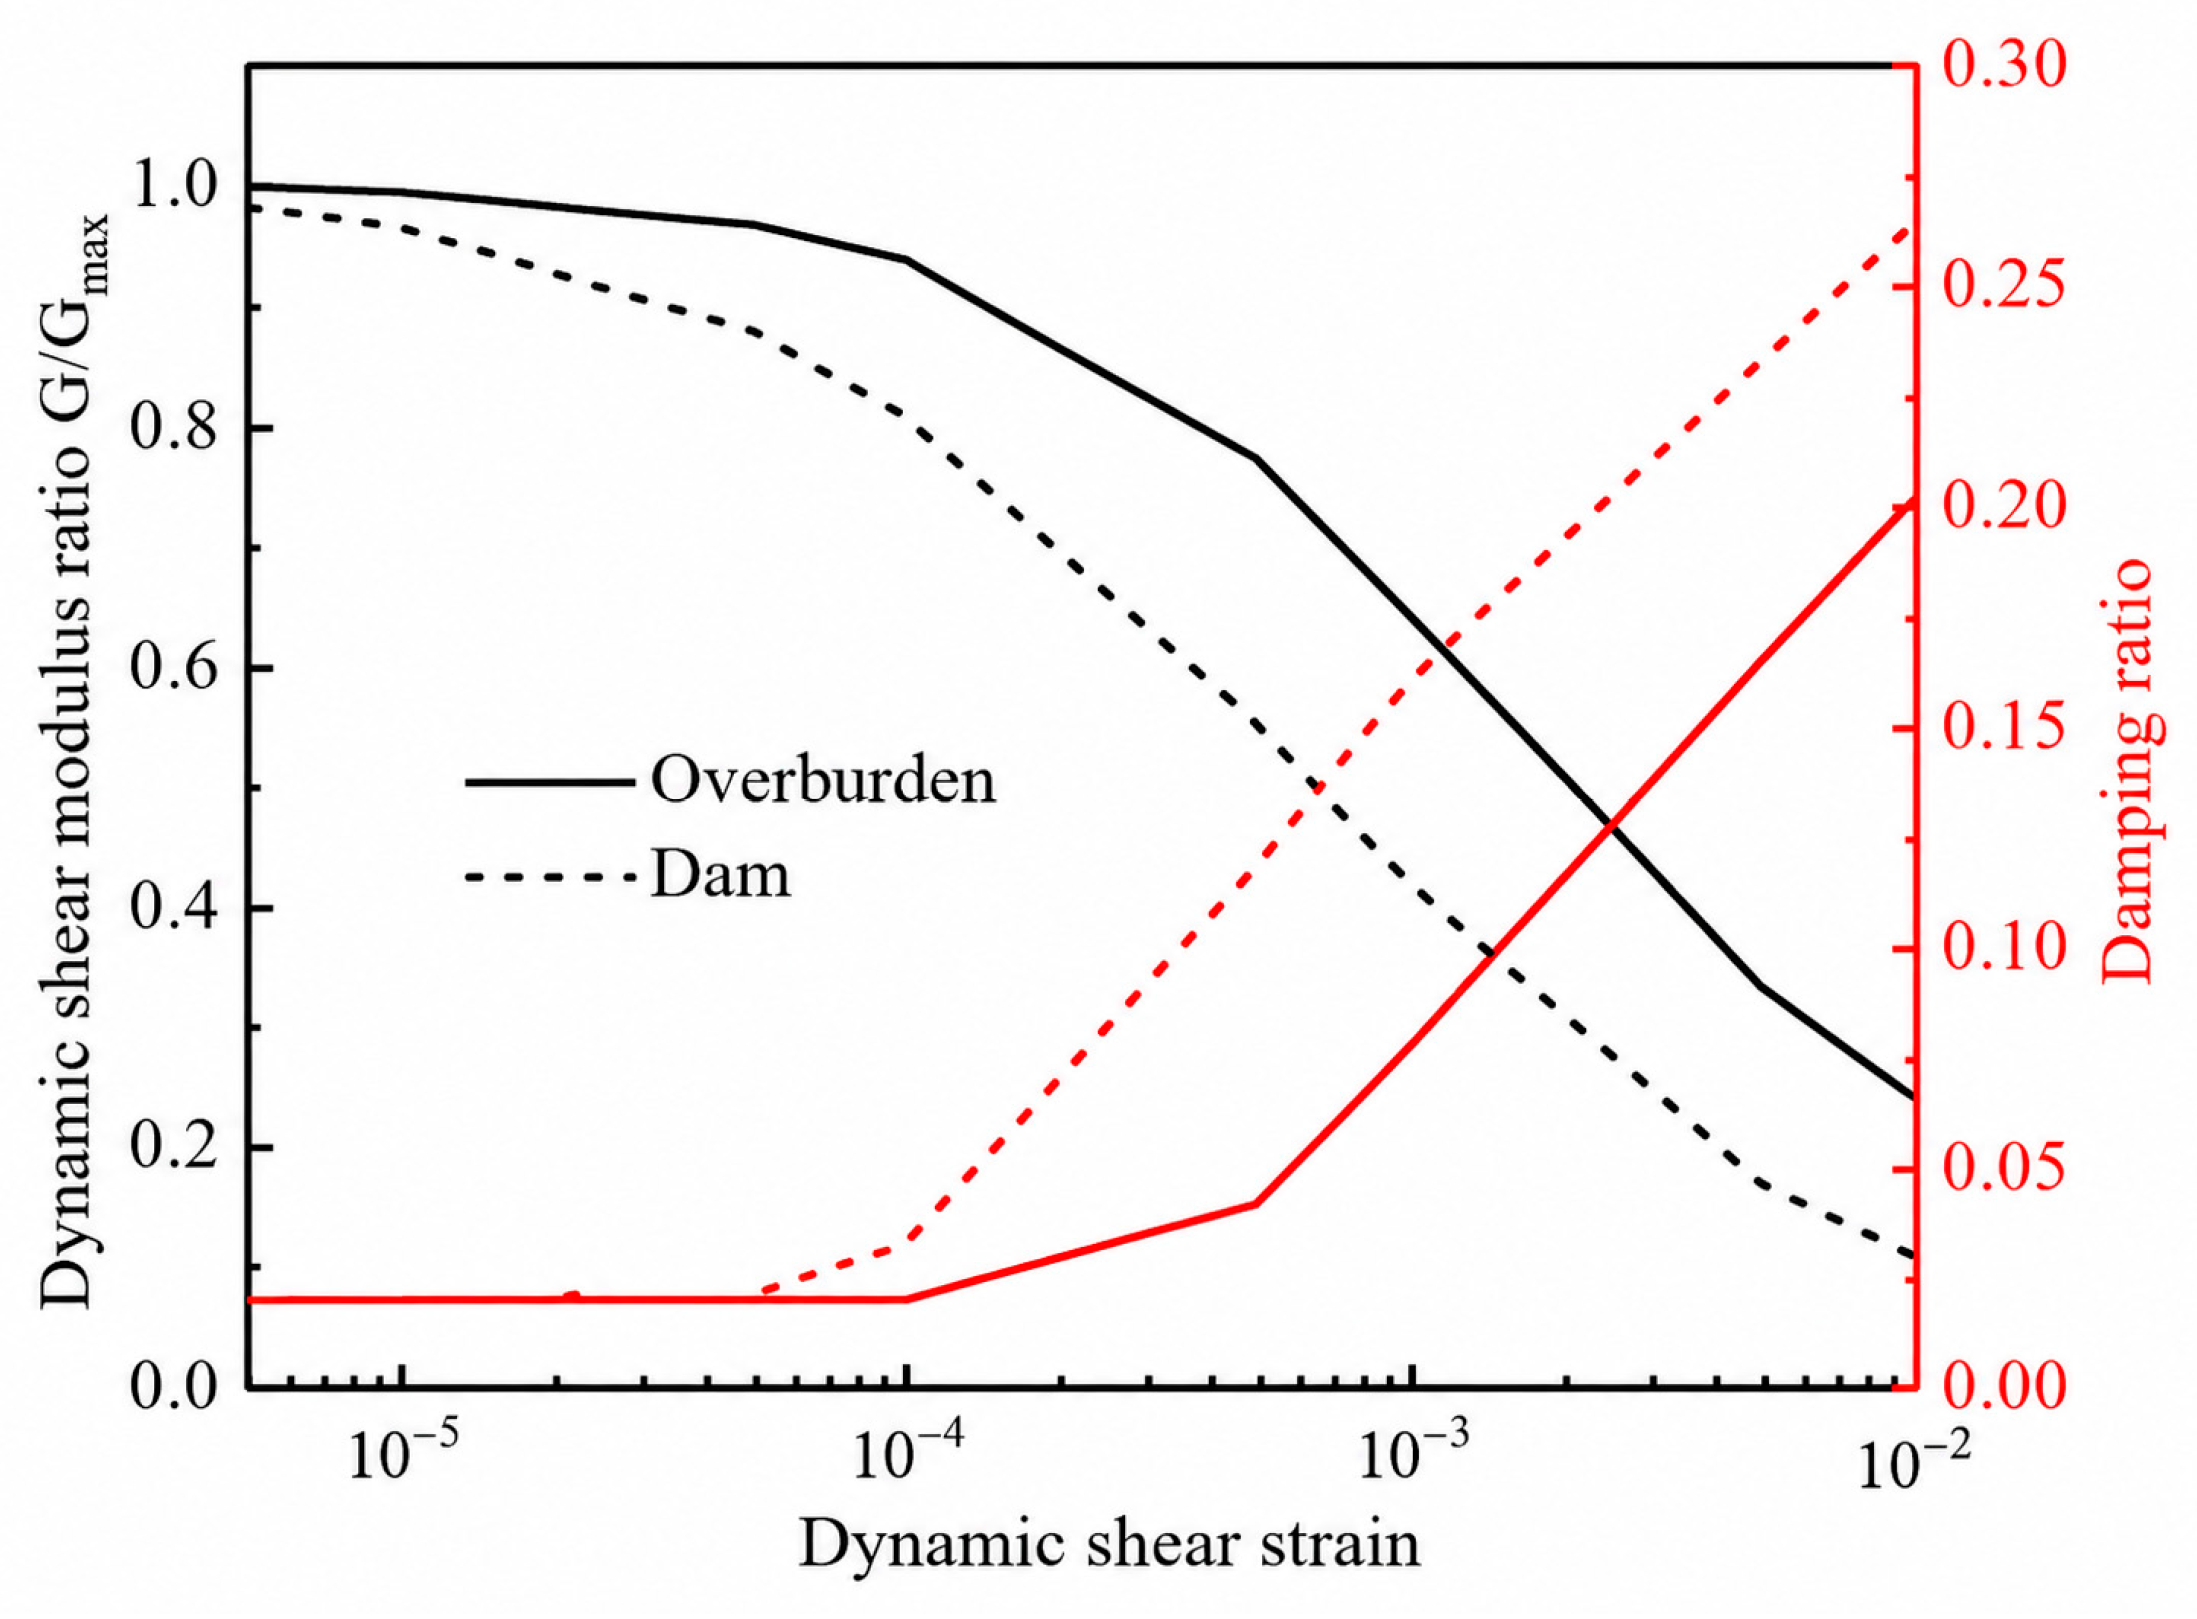
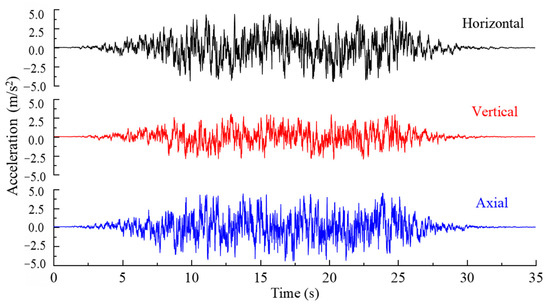
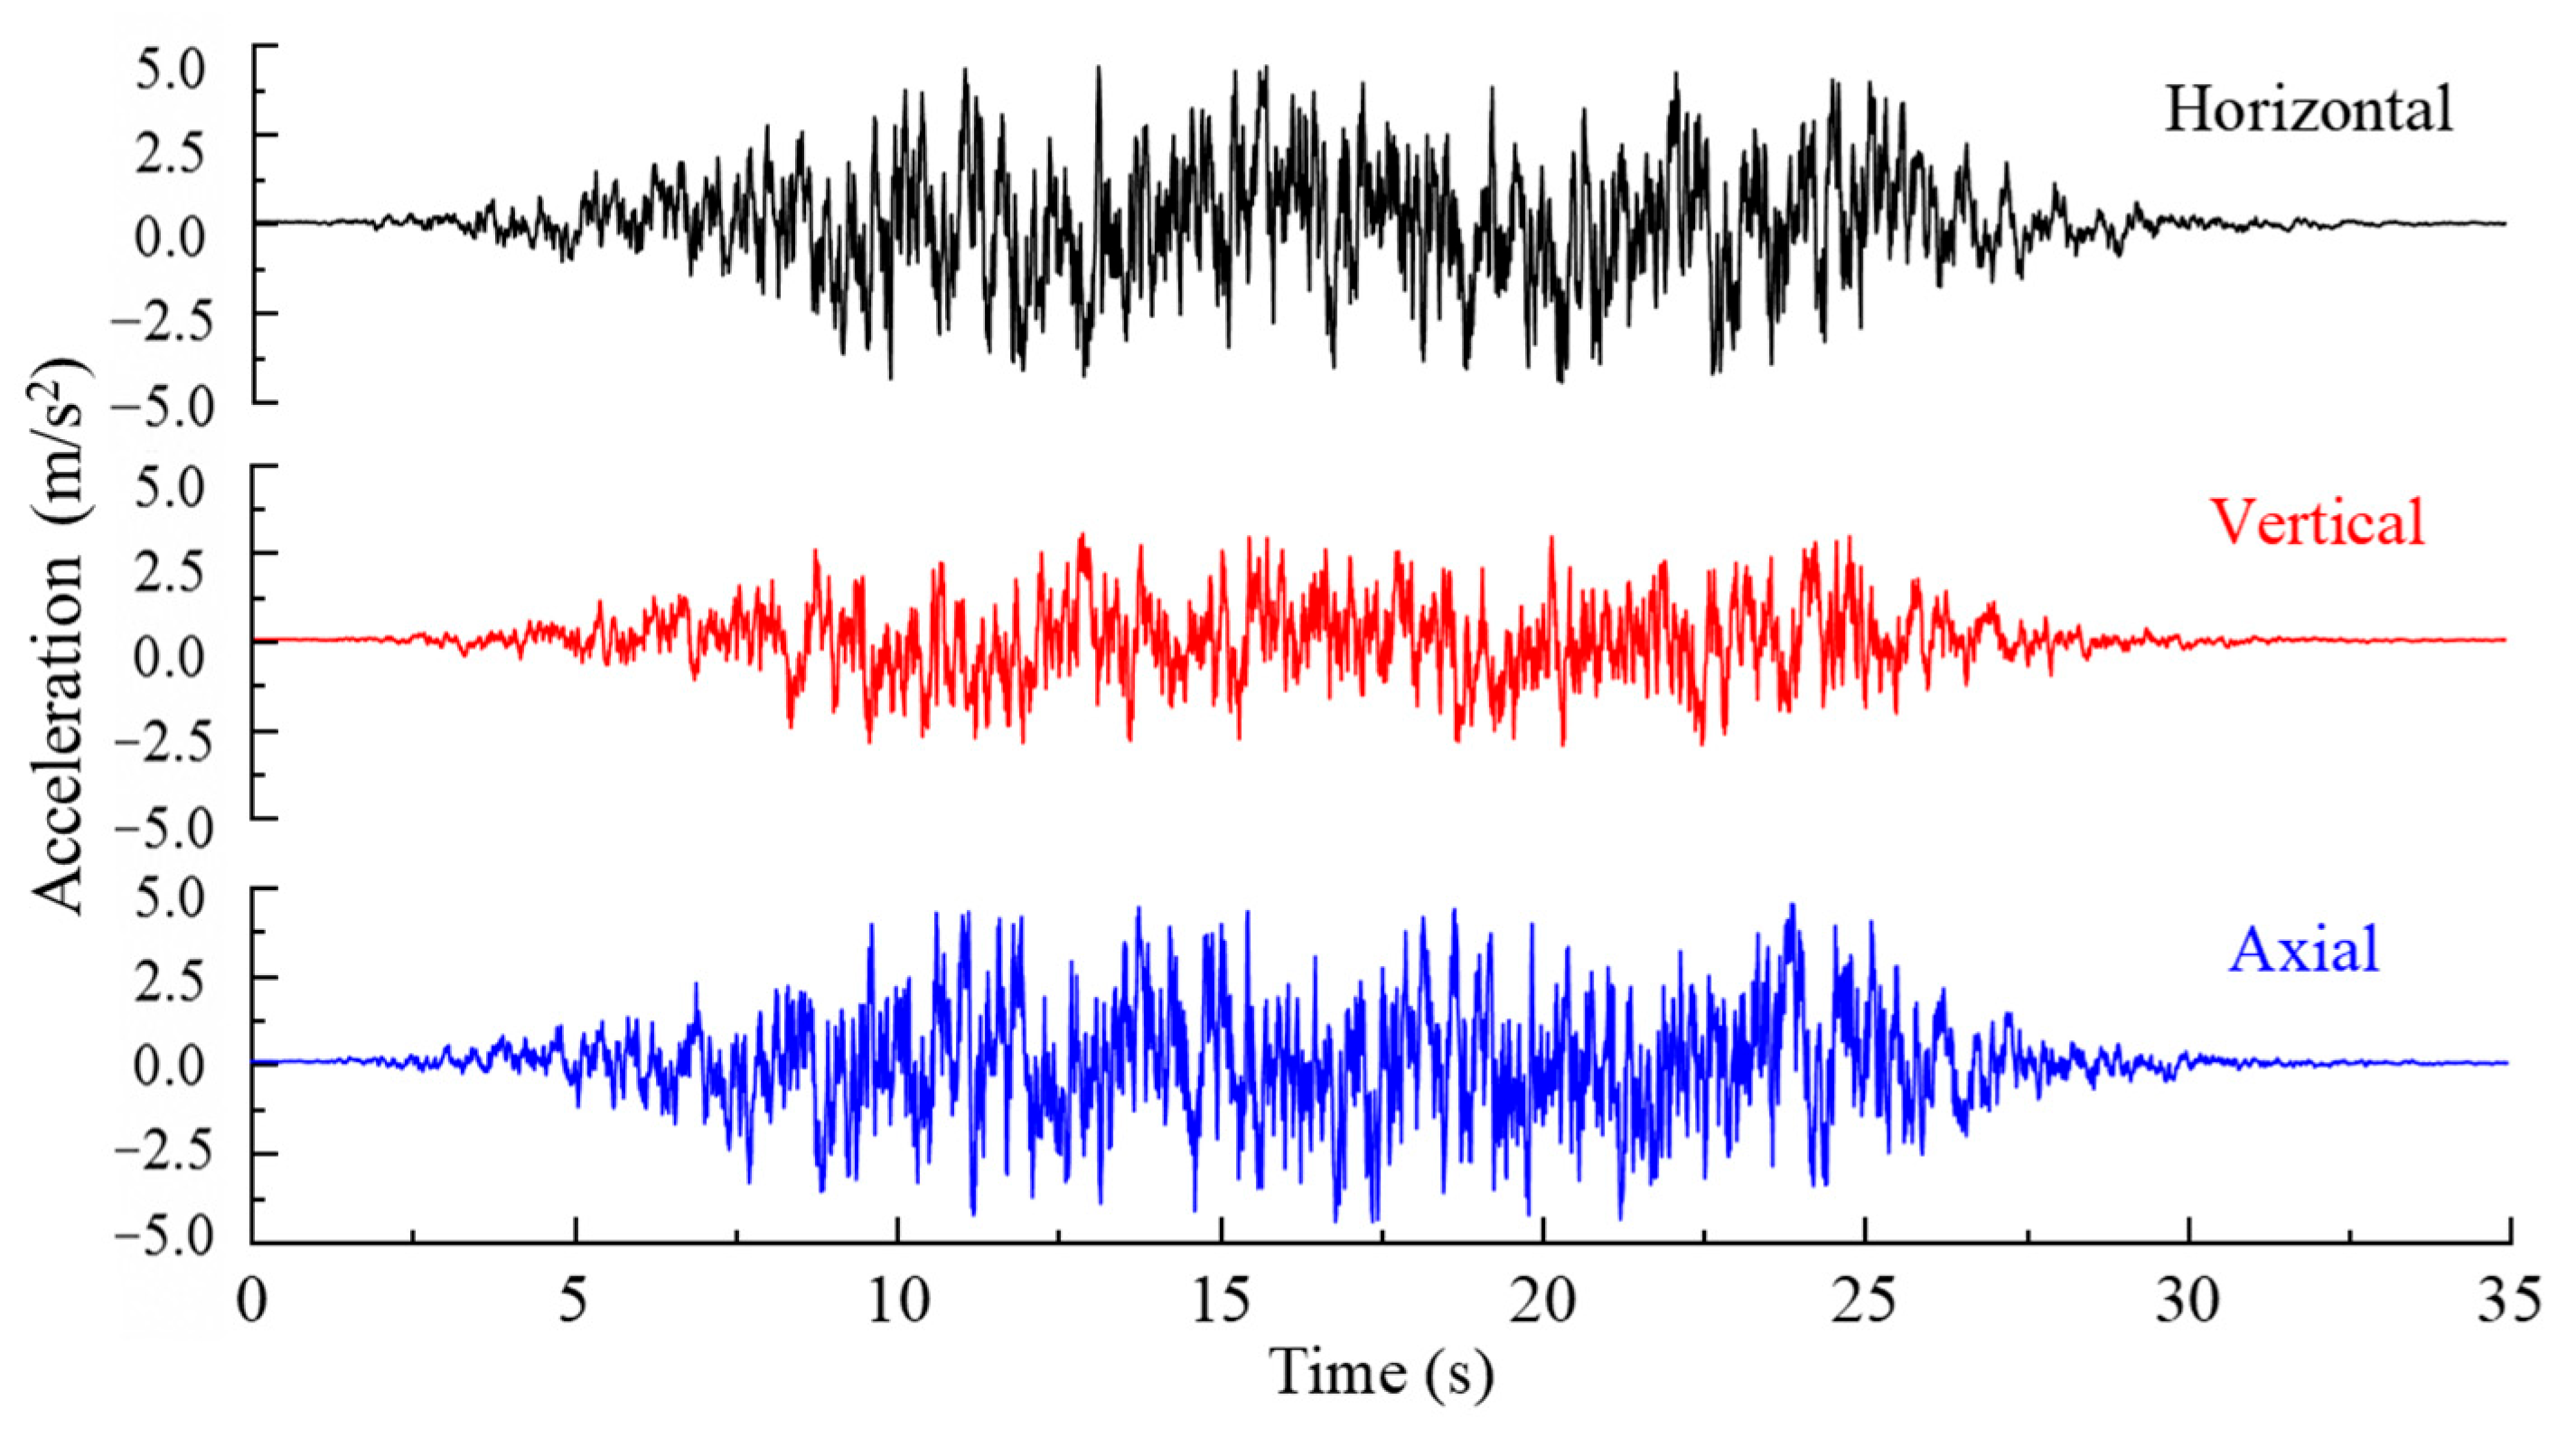
The cutoff wall, base, and asphalt concrete core wall are simulated by the linear elastic model. The density of the cutoff wall and the base is 2400 kg/m3, the elastic modulus is 8 × 10⁹ Pa, and Poisson’s ratio is 0.167. The density of the asphalt concrete core wall is 2430 kg/m3, the elastic modulus is 3.4 × 10⁸ Pa, and Poisson’s ratio is 0.48. The calculation parameters are shown in Table 1. To better simulate the interaction between materials with significantly different deformation characteristics, Goodman interface elements were assigned between the asphalt concrete core wall and the dam fill and between the overburden and the concrete cutoff wall, as detailed in Table 2. For dynamic analysis, an equivalent linear model was used to simulate soil behavior, with its dynamic parameters provided in Table 3. Normalized modulus reduction and damping ratio curves are shown in Figure 4. The seismic acceleration time history used is the artificial seismic wave based on the Code for Seismic Design of Hydraulic Structures in Hydropower Project [38] and the zoning map of ground motion parameters in China. The longitudinal, vertical, and dam axial accelerations are adjusted to 0.40 g, 0.27 g (2/3 of the peak acceleration along the river), and 0.40 g, respectively. The seismic wave acceleration time history is shown in Figure 5.
Table 1.
Soil parameters of Duncan model and equivalent linear model.
Table 2.
Interface parameters.
Table 3.
Dynamical parameters.
Figure 4.
Characteristic curve of normalized modulus and damping ratio.
Figure 5.
Acceleration time history of seismic wave.
3. Results and Analysis
Obtaining the stress generated by bending requires a more refined mesh, which will lead to a large number of elements, and the amount of calculation is unbearable. There is a significant gradient between the stress of the upstream and downstream sides of the cutoff wall. If the number of layers of the cutoff wall along the thickness direction is small, it is difficult to support the stress transition of the upstream and downstream sides of the wall, thus affecting the capture of stress. Therefore, this paper discusses the influence of the thickness of the cutoff wall element and the subdivision method on the static and dynamic analysis results of the cutoff wall and determines the fine mesh model of the cutoff wall. The tensile range of the wall is the main concern. The cutoff wall studied in this paper is made of C30 concrete. In the present study, the threshold for identifying potential damage zones is determined based on the tensile strength criterion of the cutoff wall concrete under static and dynamic conditions. For static analysis, the design tensile strength of C30 concrete is taken as 2.73 MPa; therefore, regions where the tensile stress exceeds 2.73 MPa are identified as potential damage zones. For dynamic analysis, according to the Code for Seismic Design of Hydraulic Structures of Hydropower Project, the dynamic tensile strength of concrete may be increased by 20% compared with the static value. Accordingly, the dynamic threshold is taken as 3.28 MPa (2.73 × 1.2), and regions exceeding this value are defined as potential damage zones. In this paper, the potential damage zone is referred to as the overstress area, and the ratio of the overstress area to the total area of the downstream surface of the cutoff wall is defined as the overstress area ratio.
3.1. The Effect of Element Thickness on the Stress and Deformation Characteristics of the Cutoff Wall
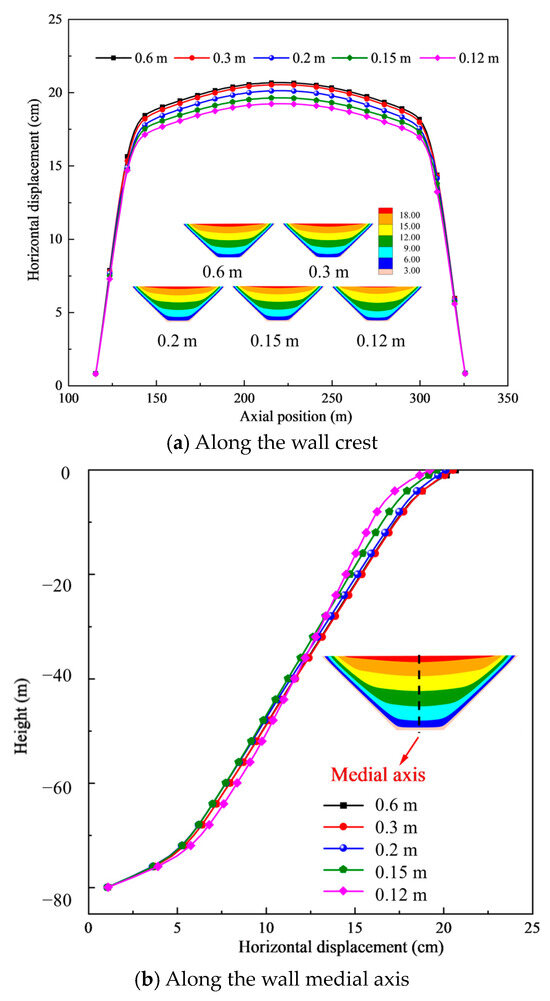
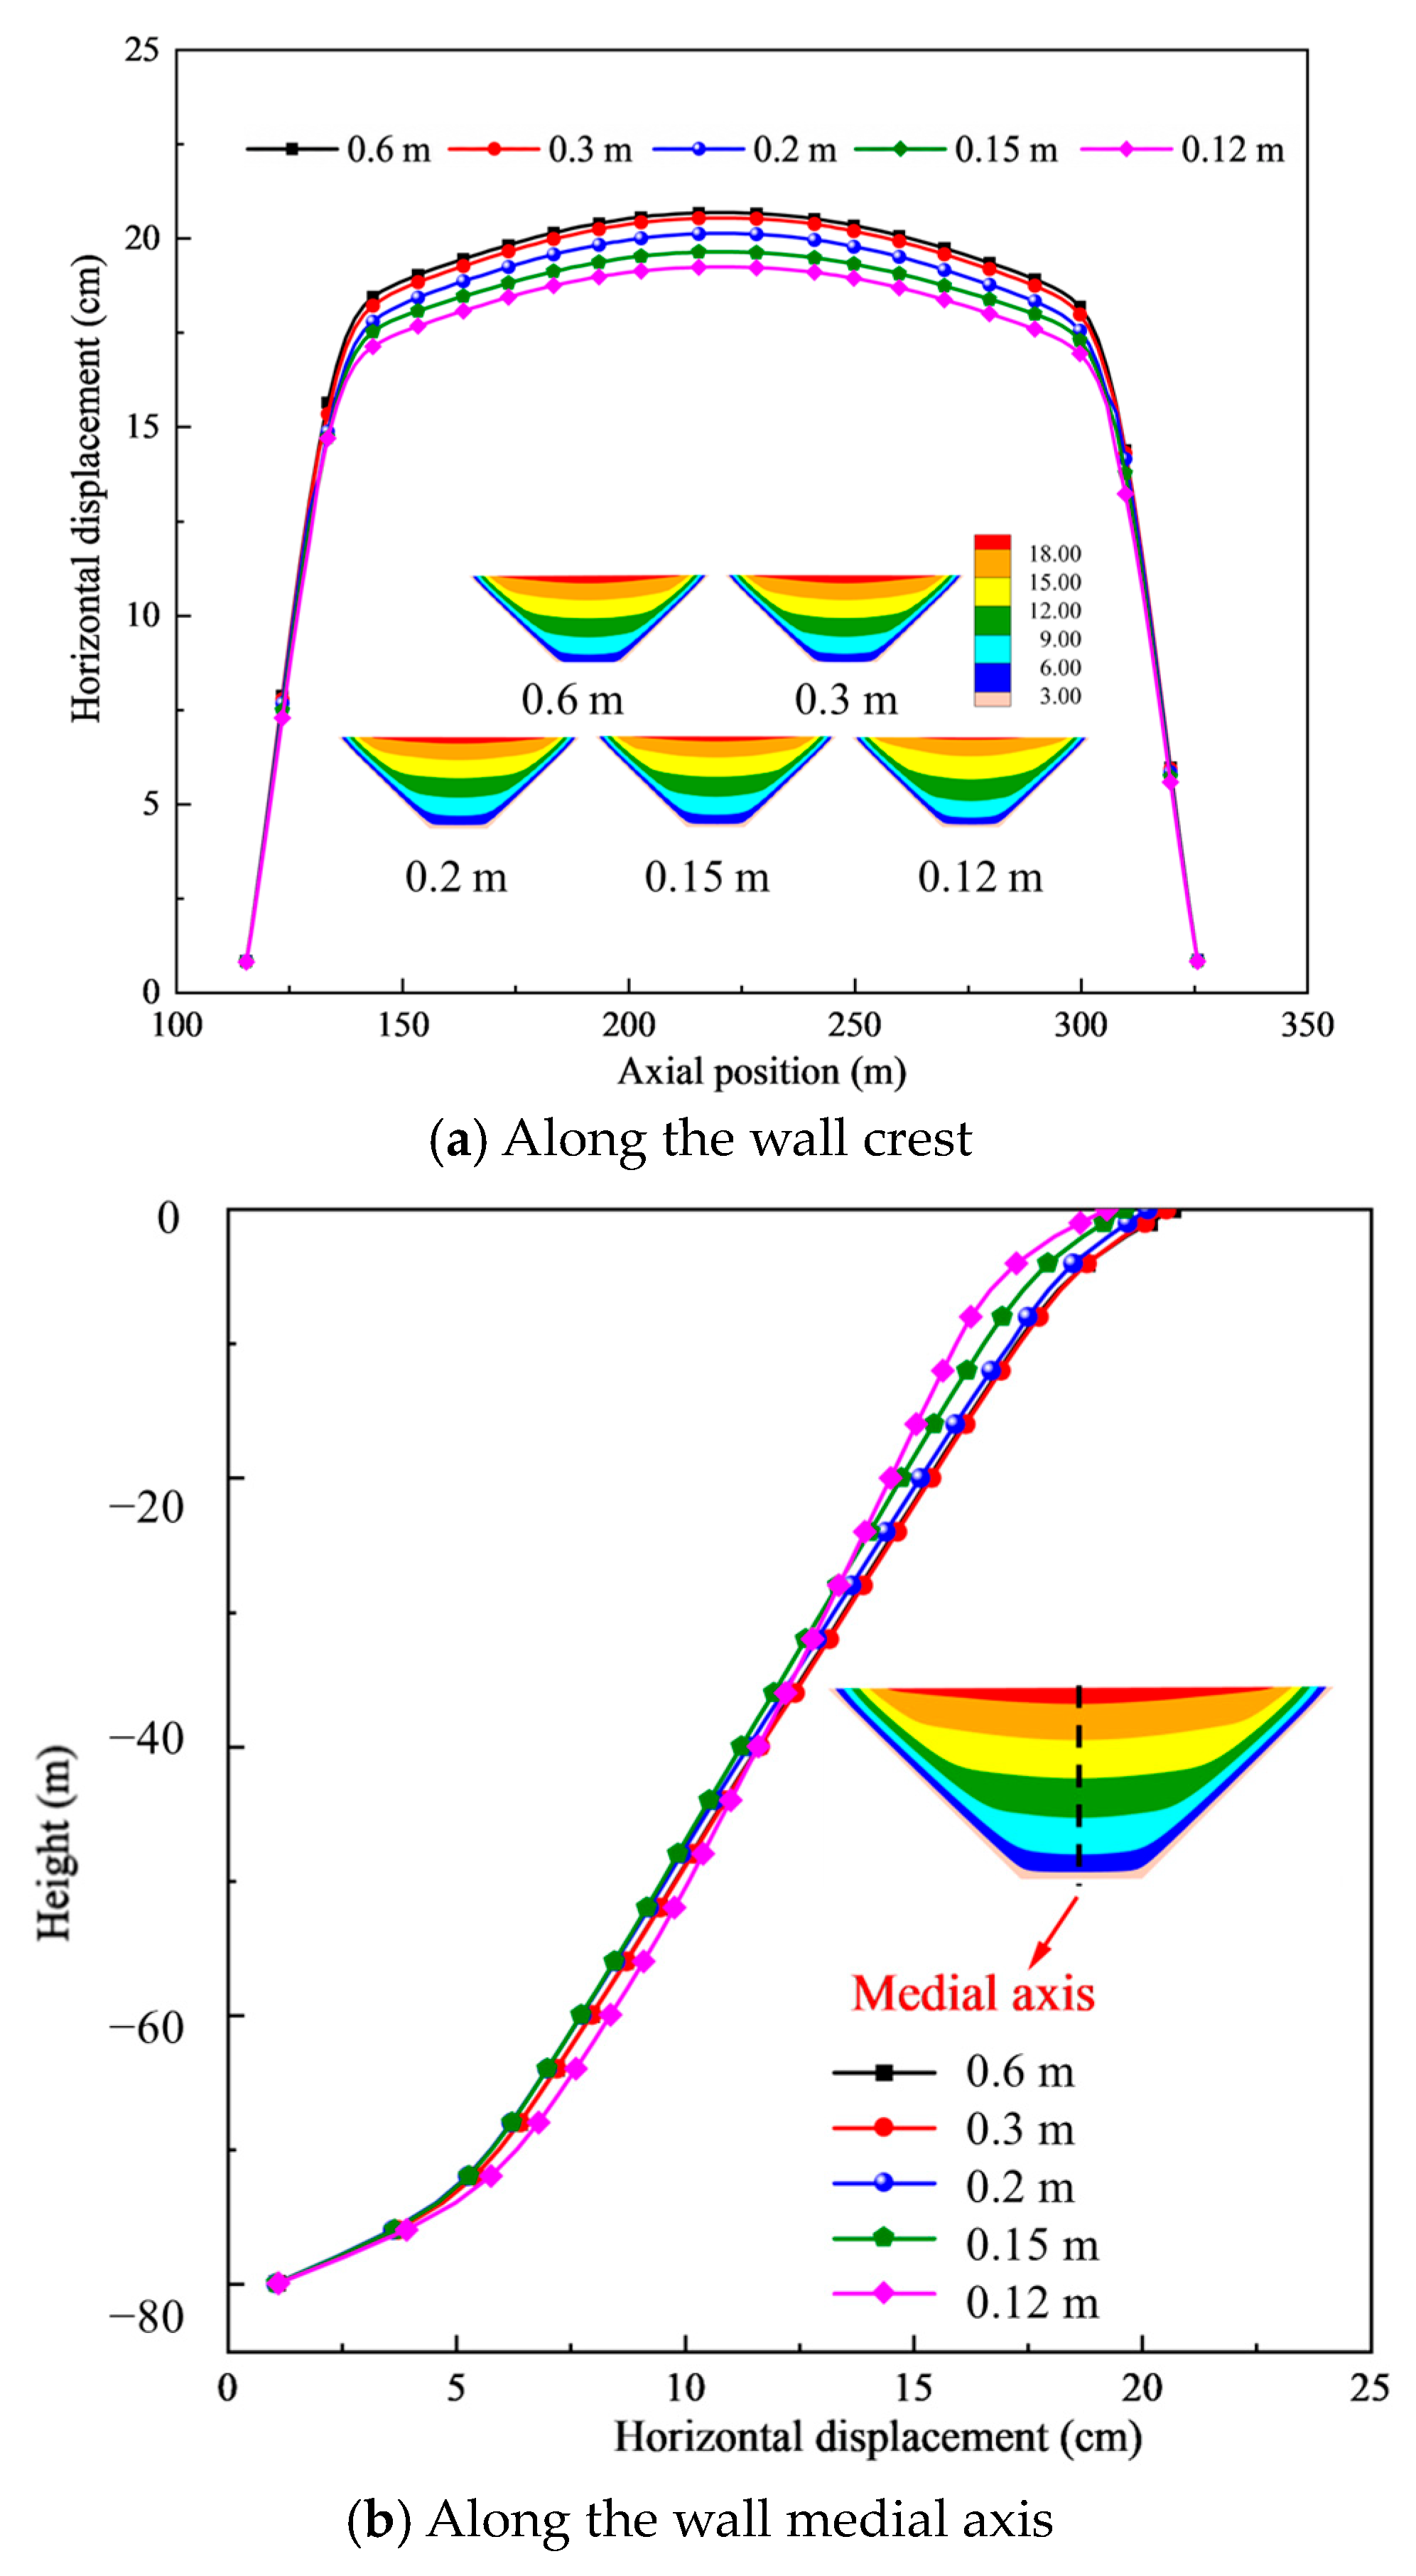
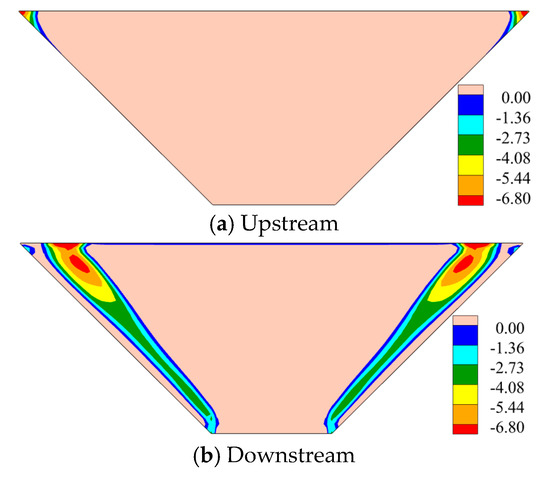
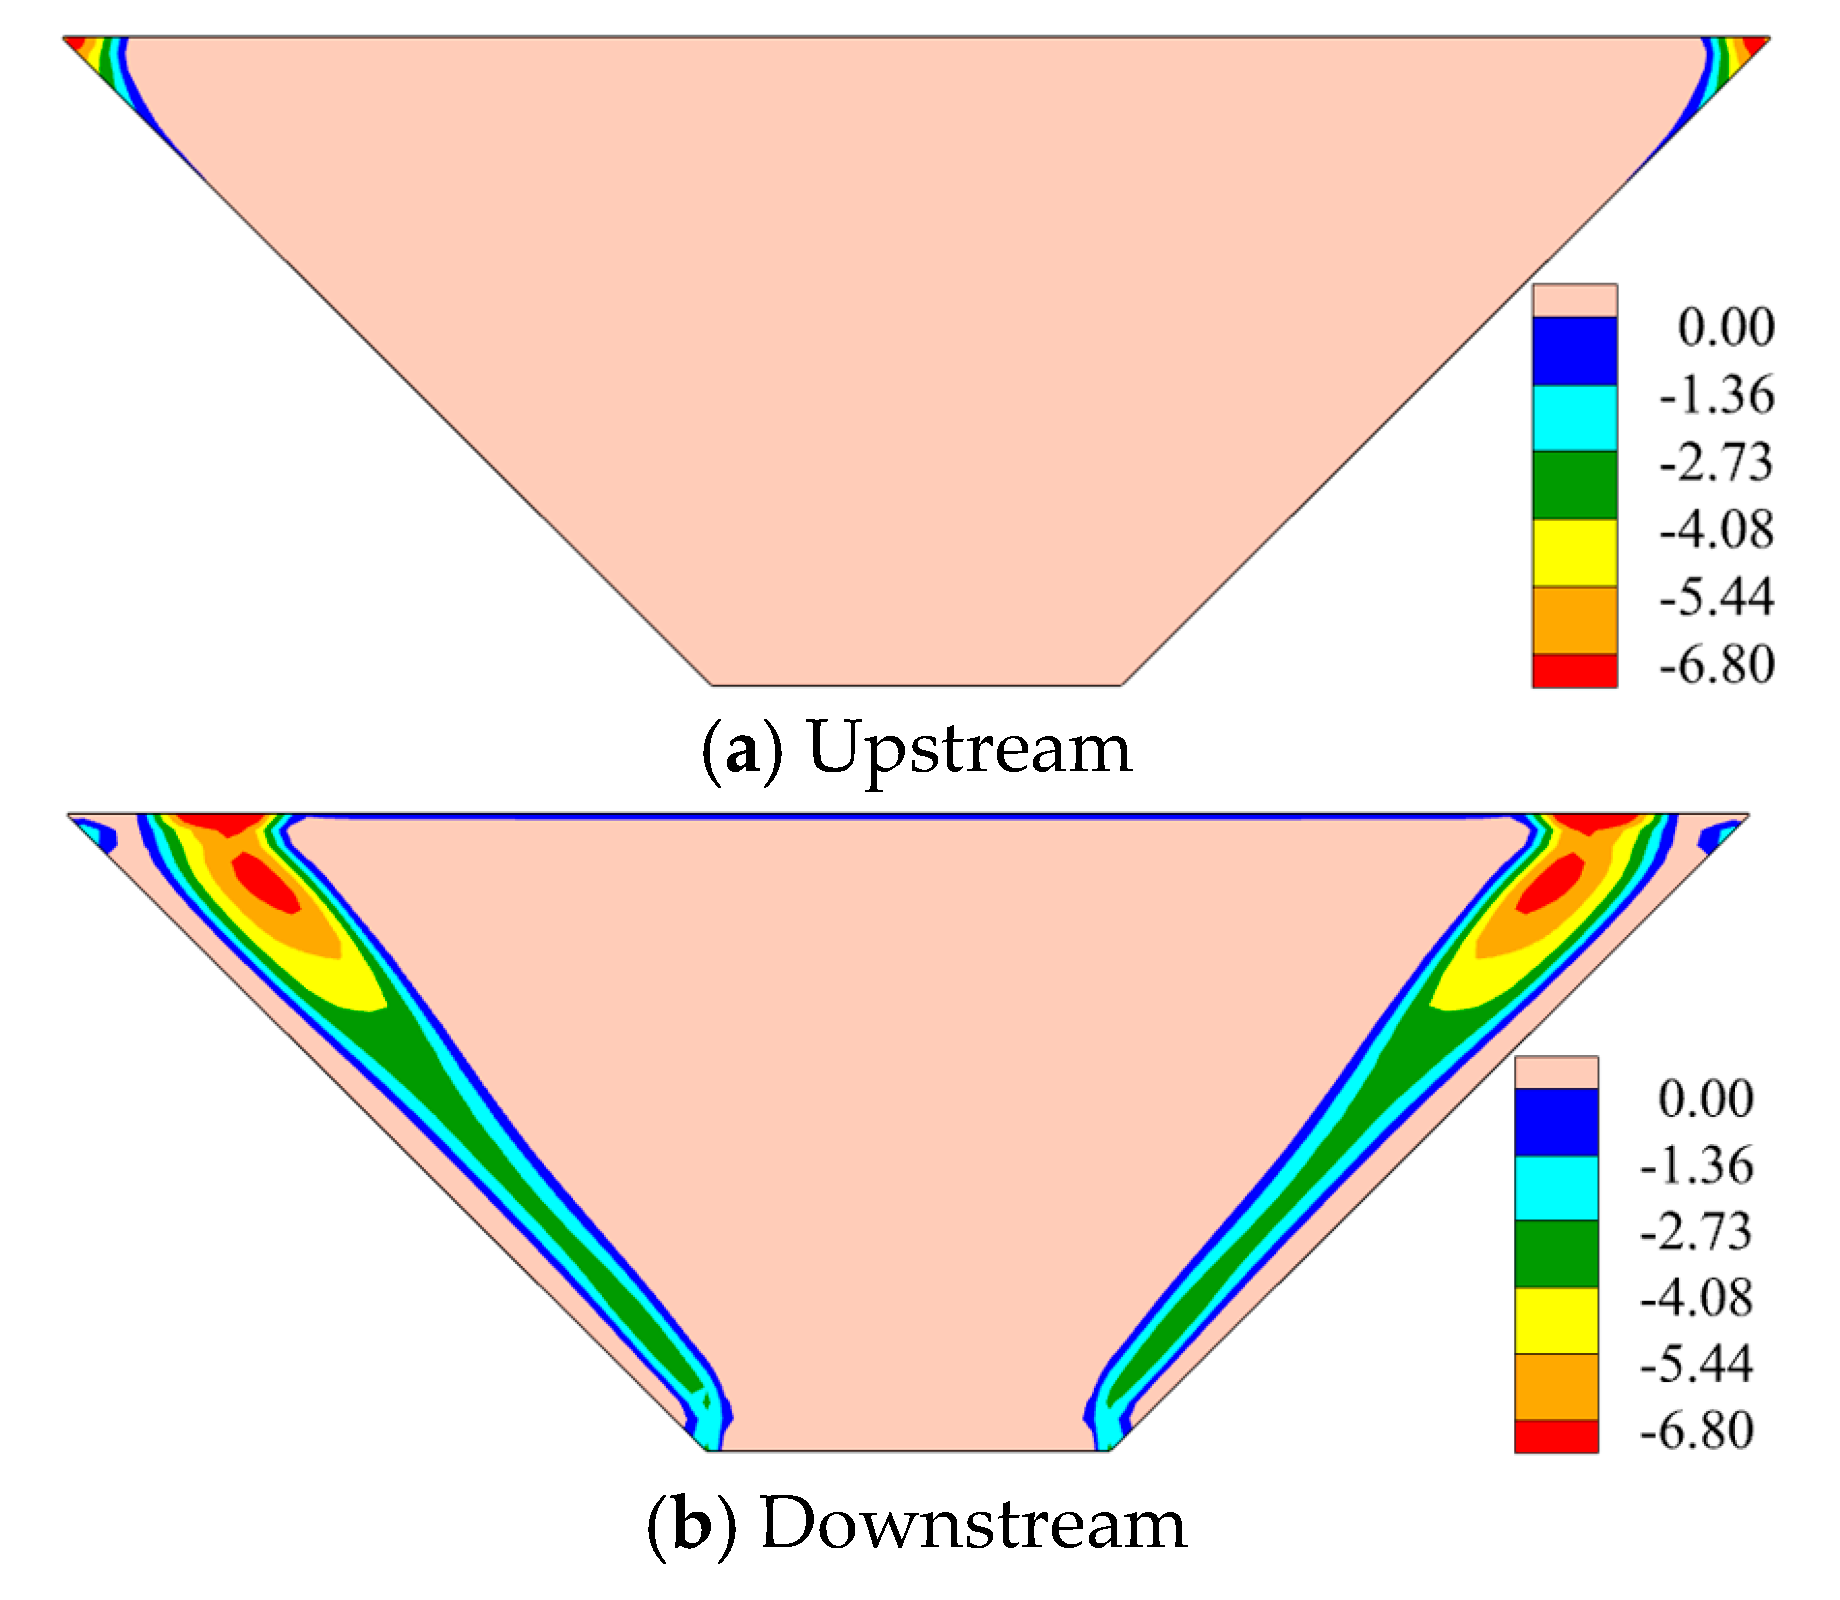
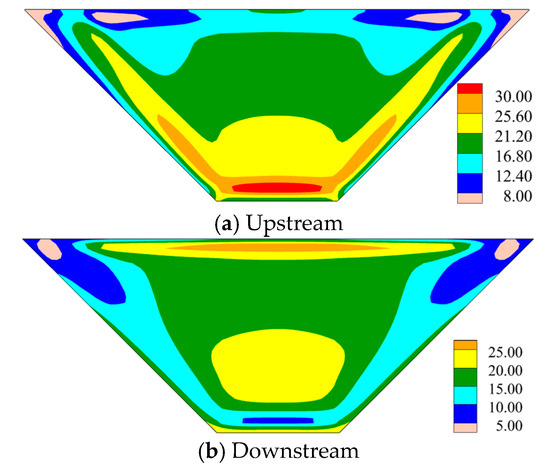
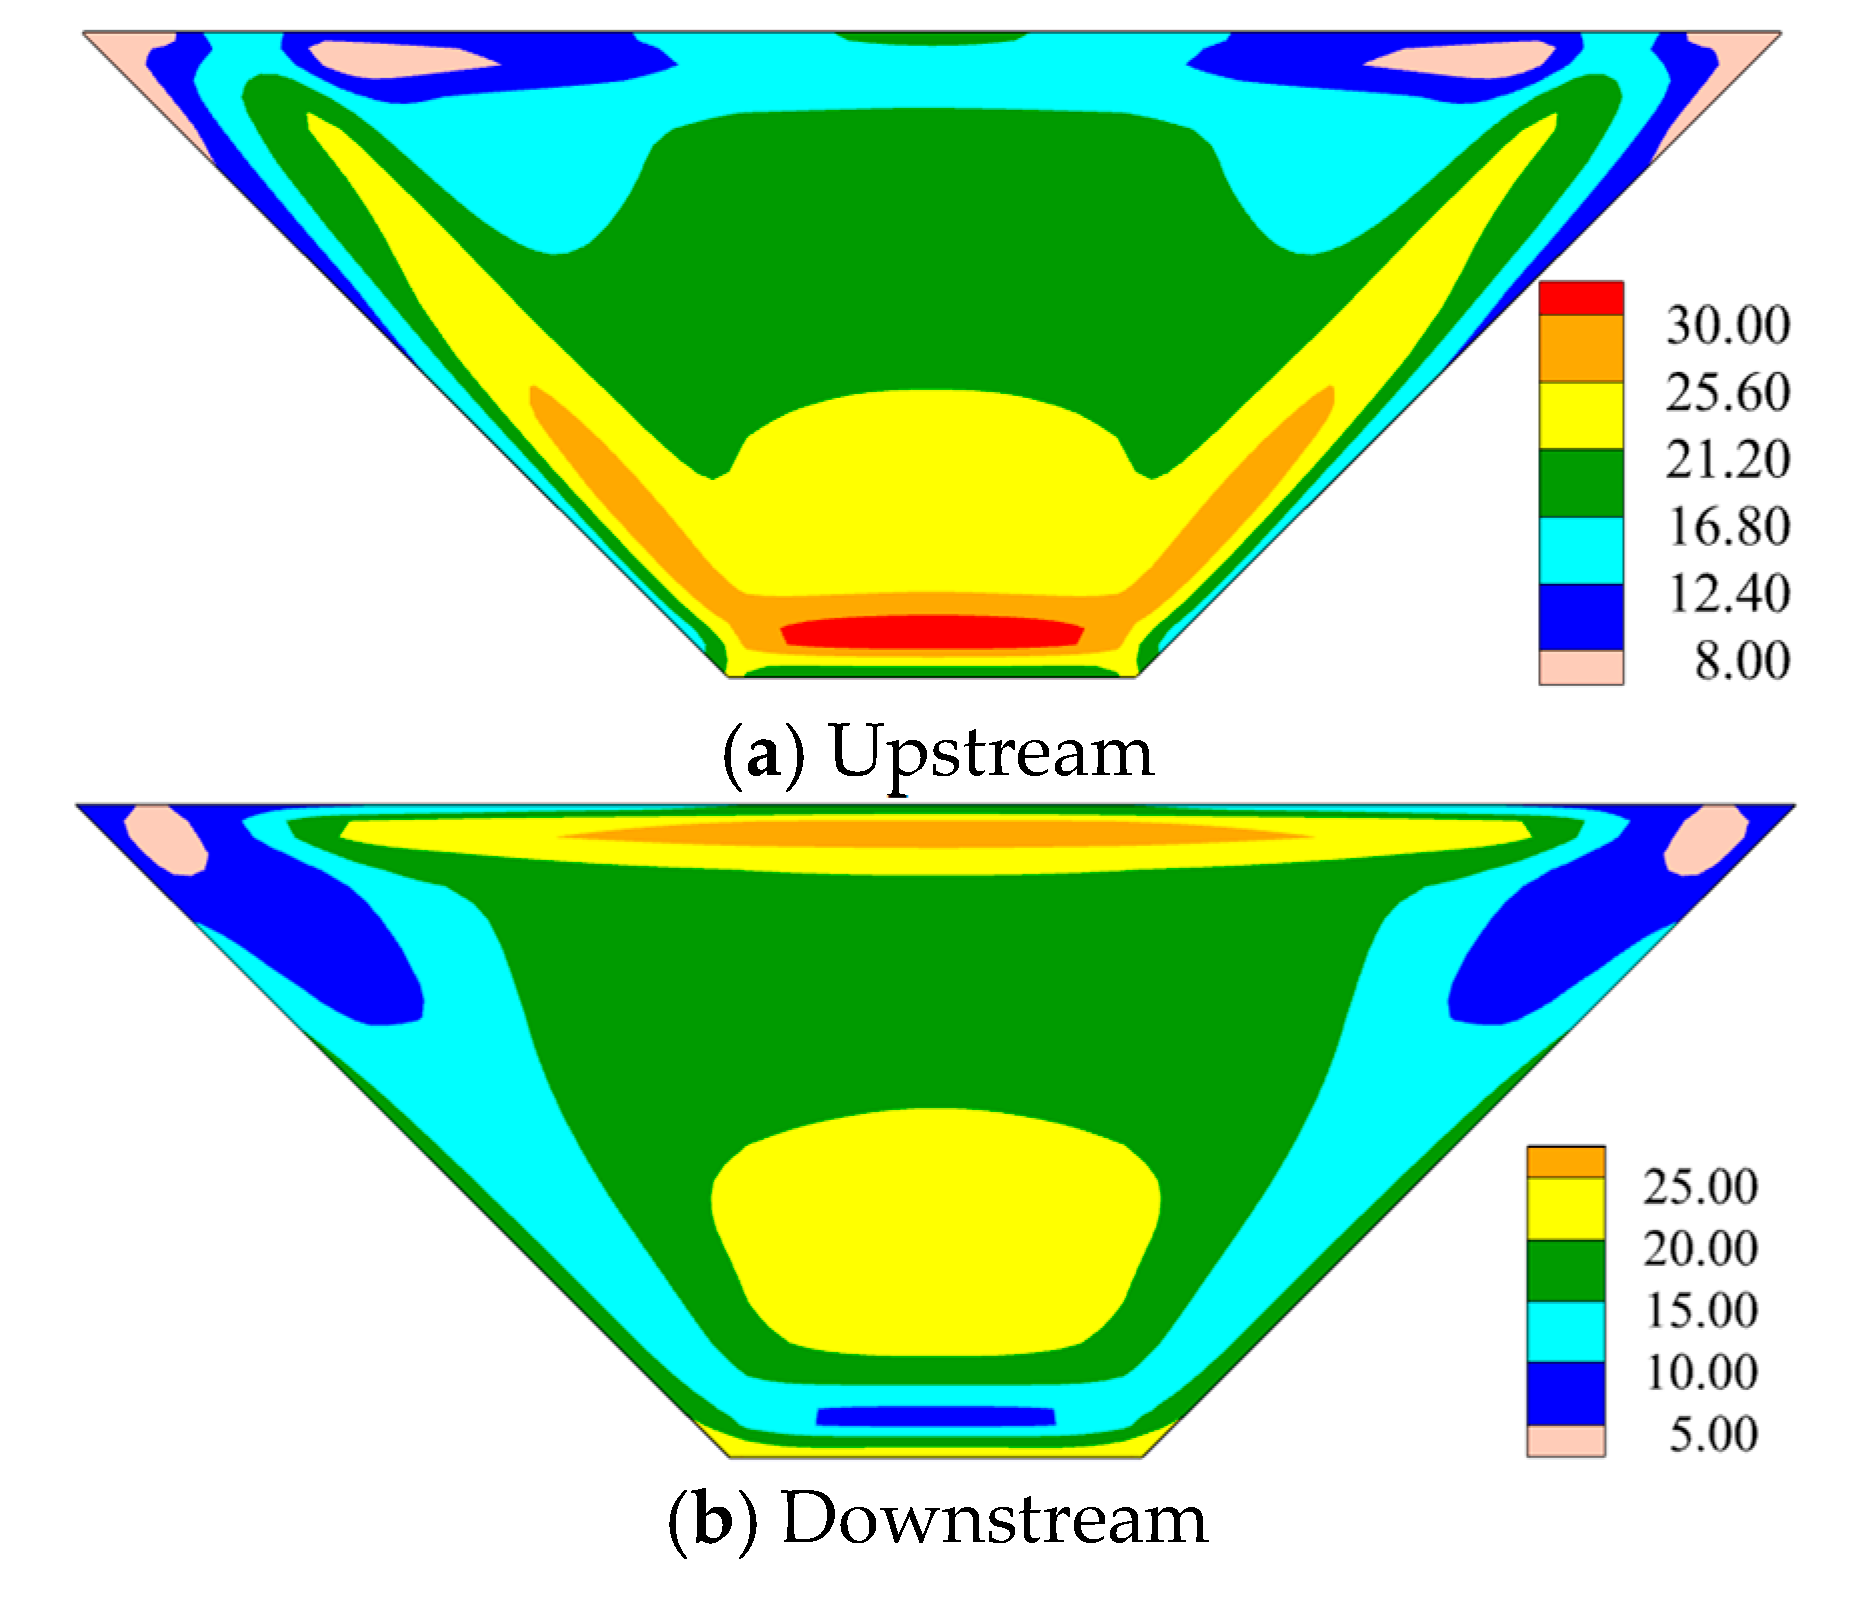
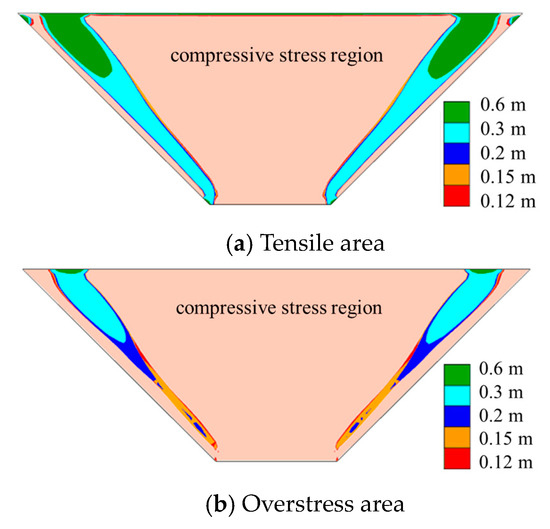
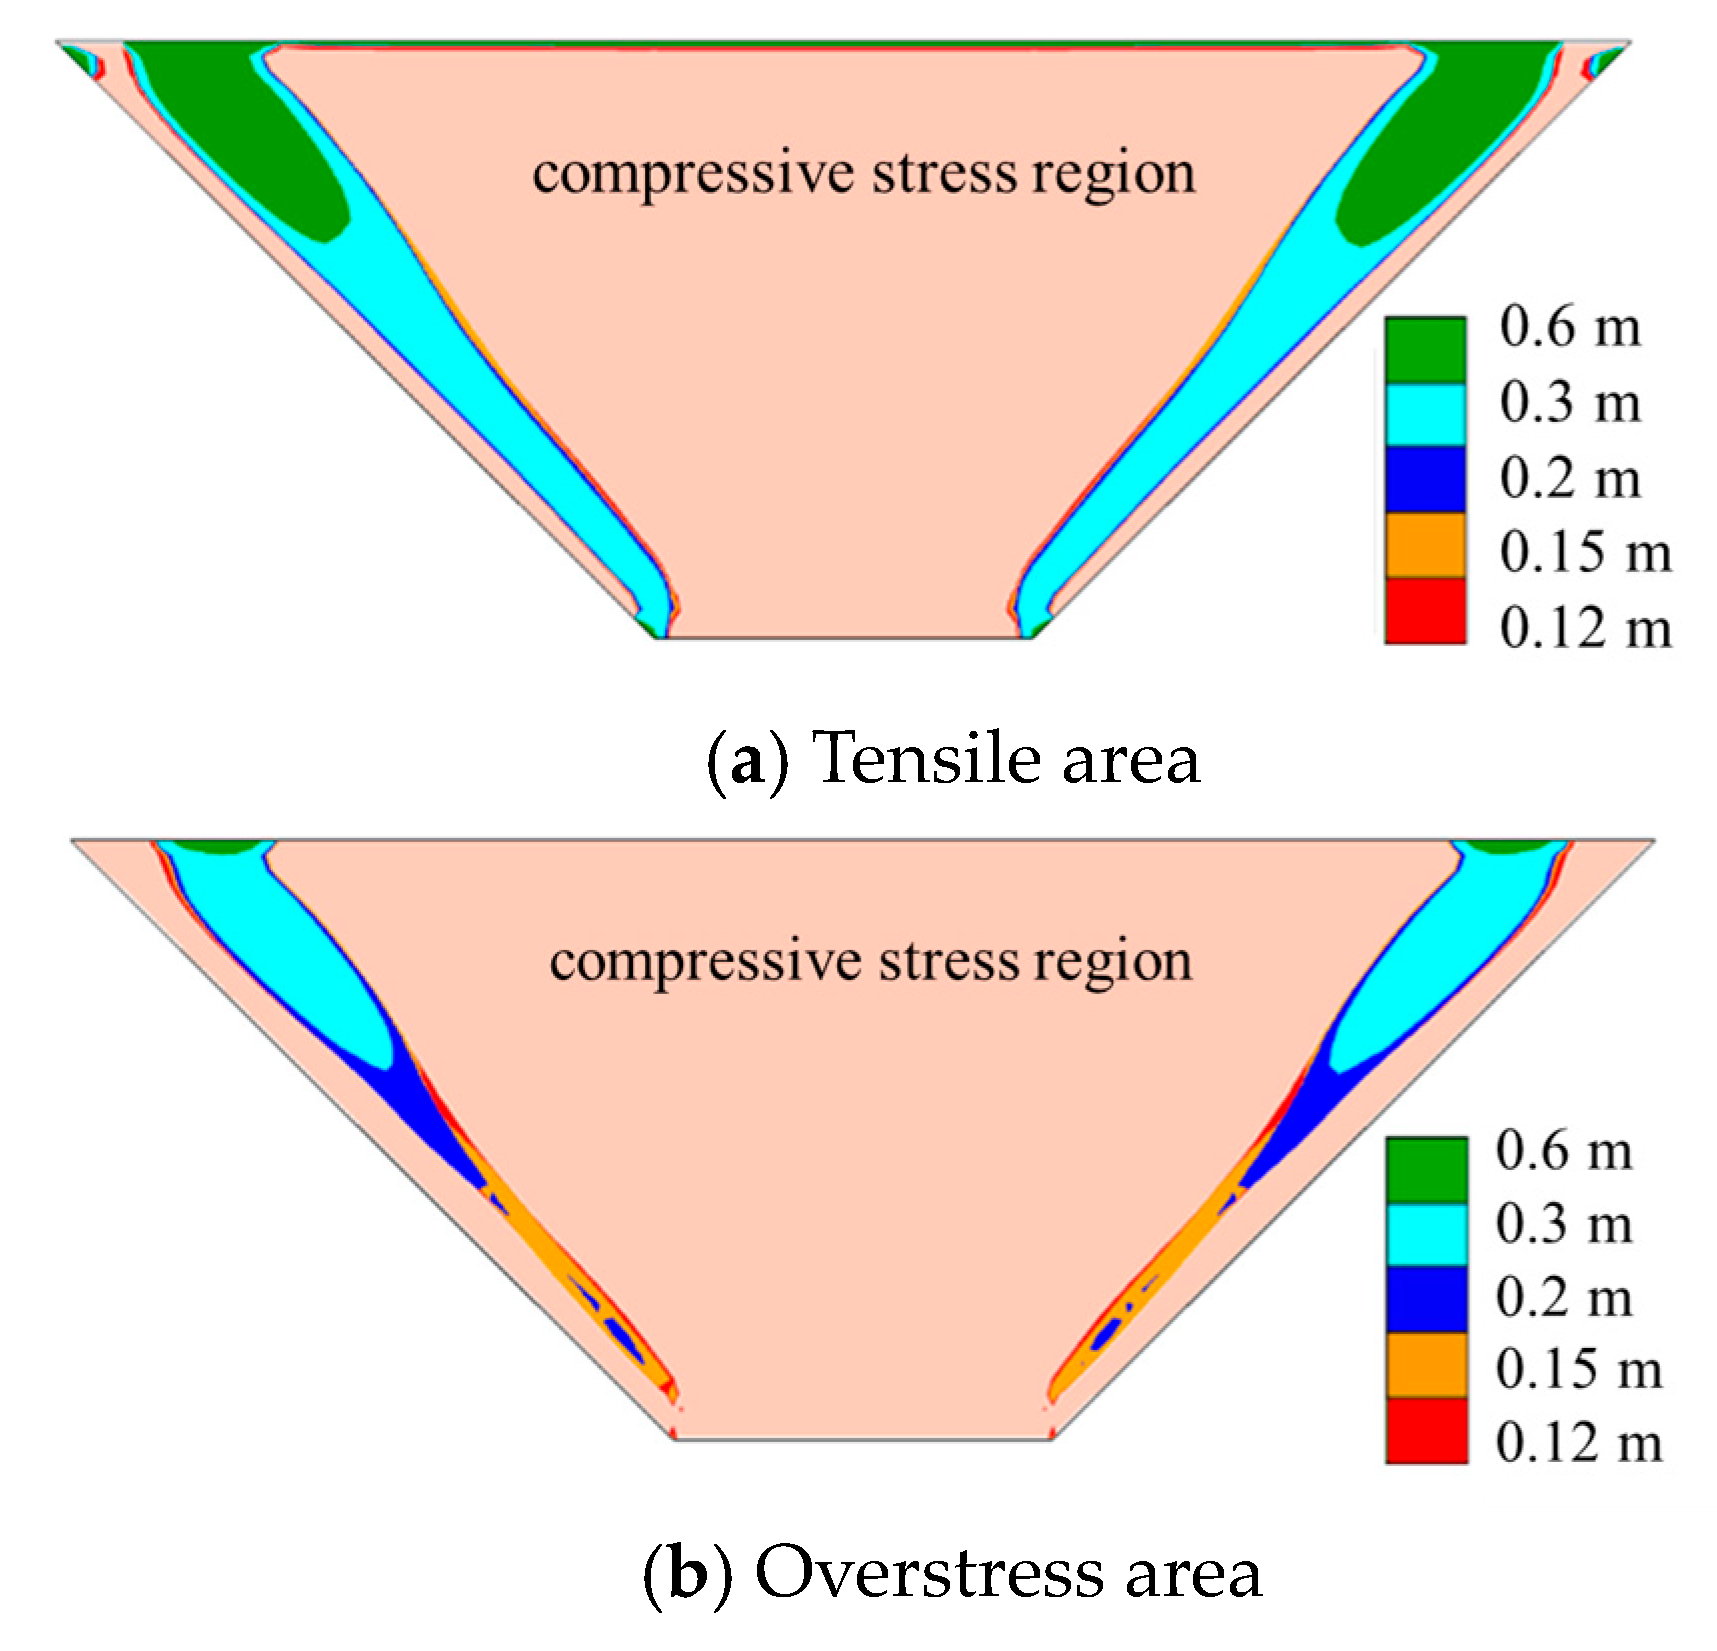
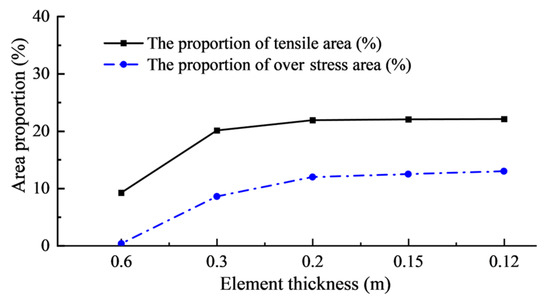
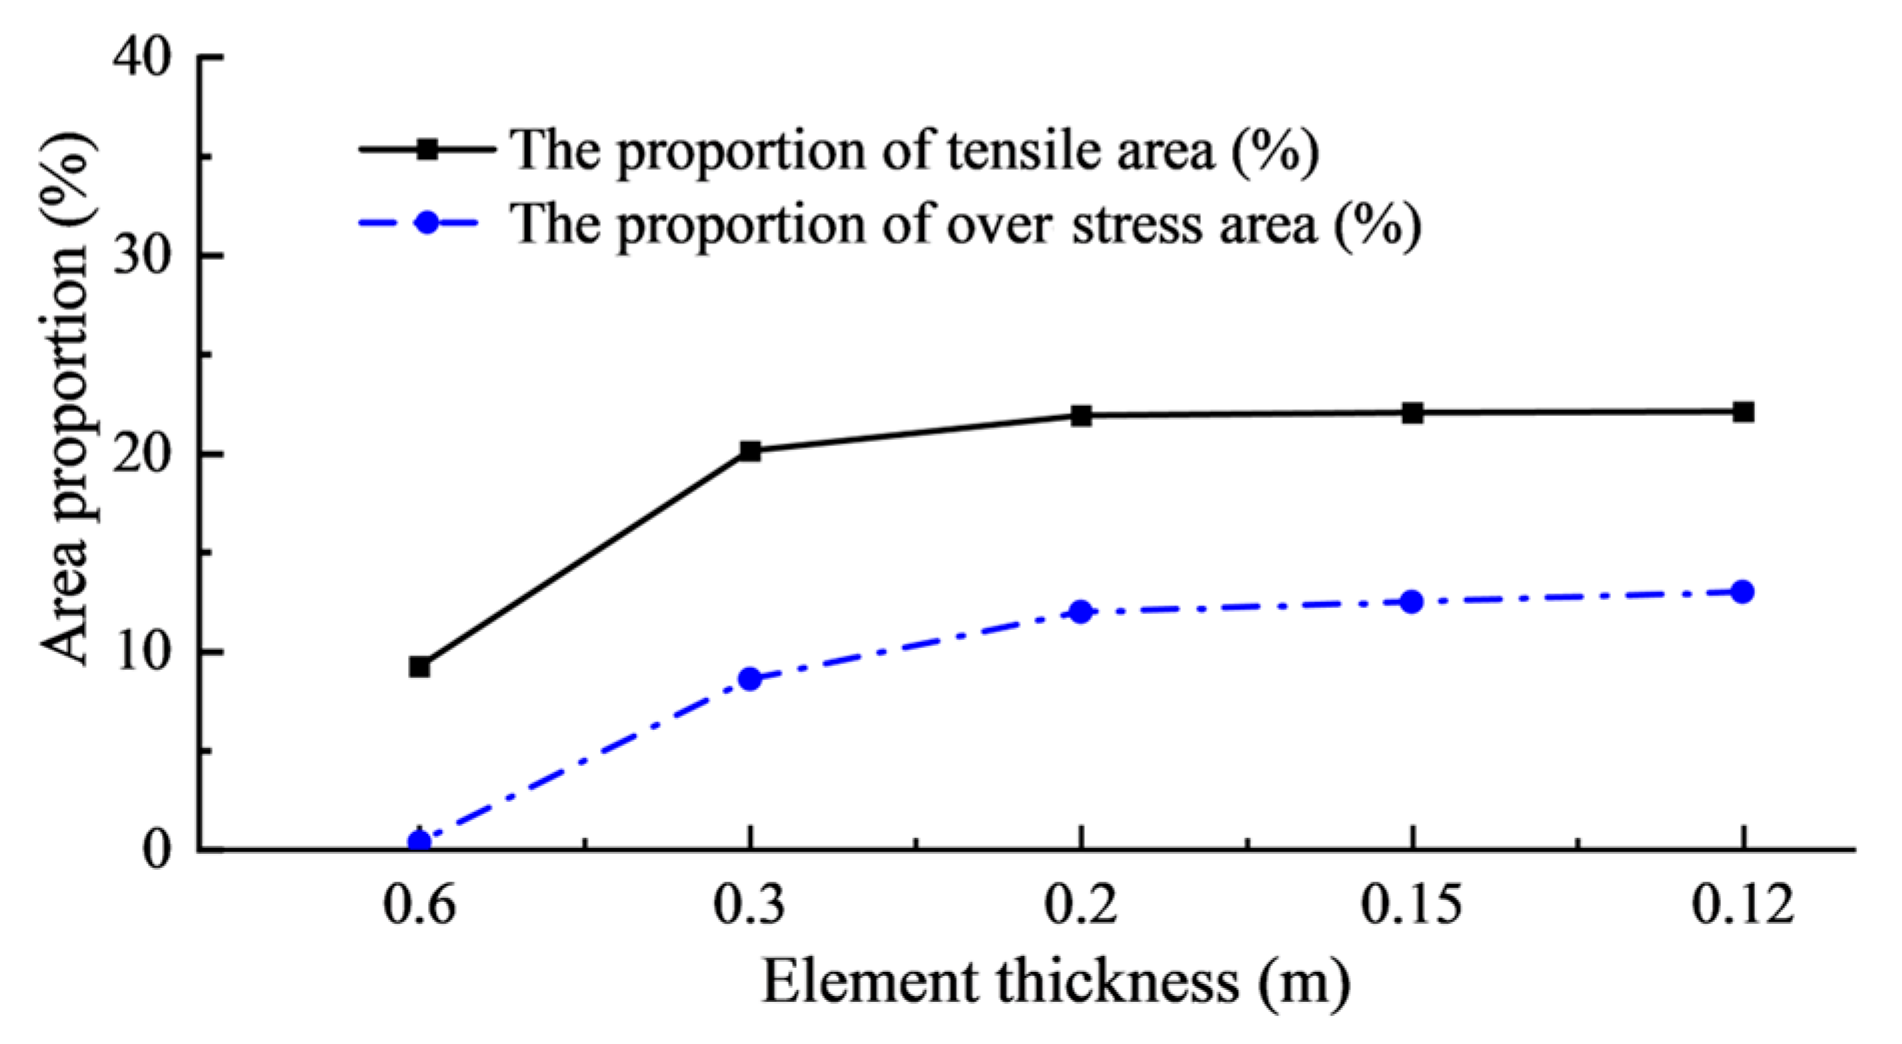
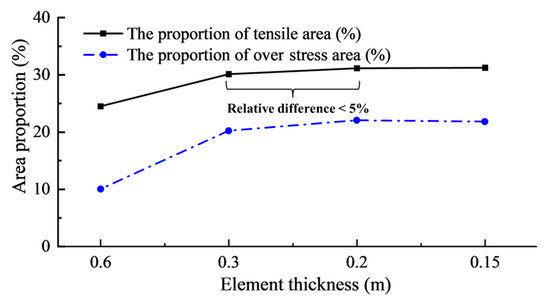
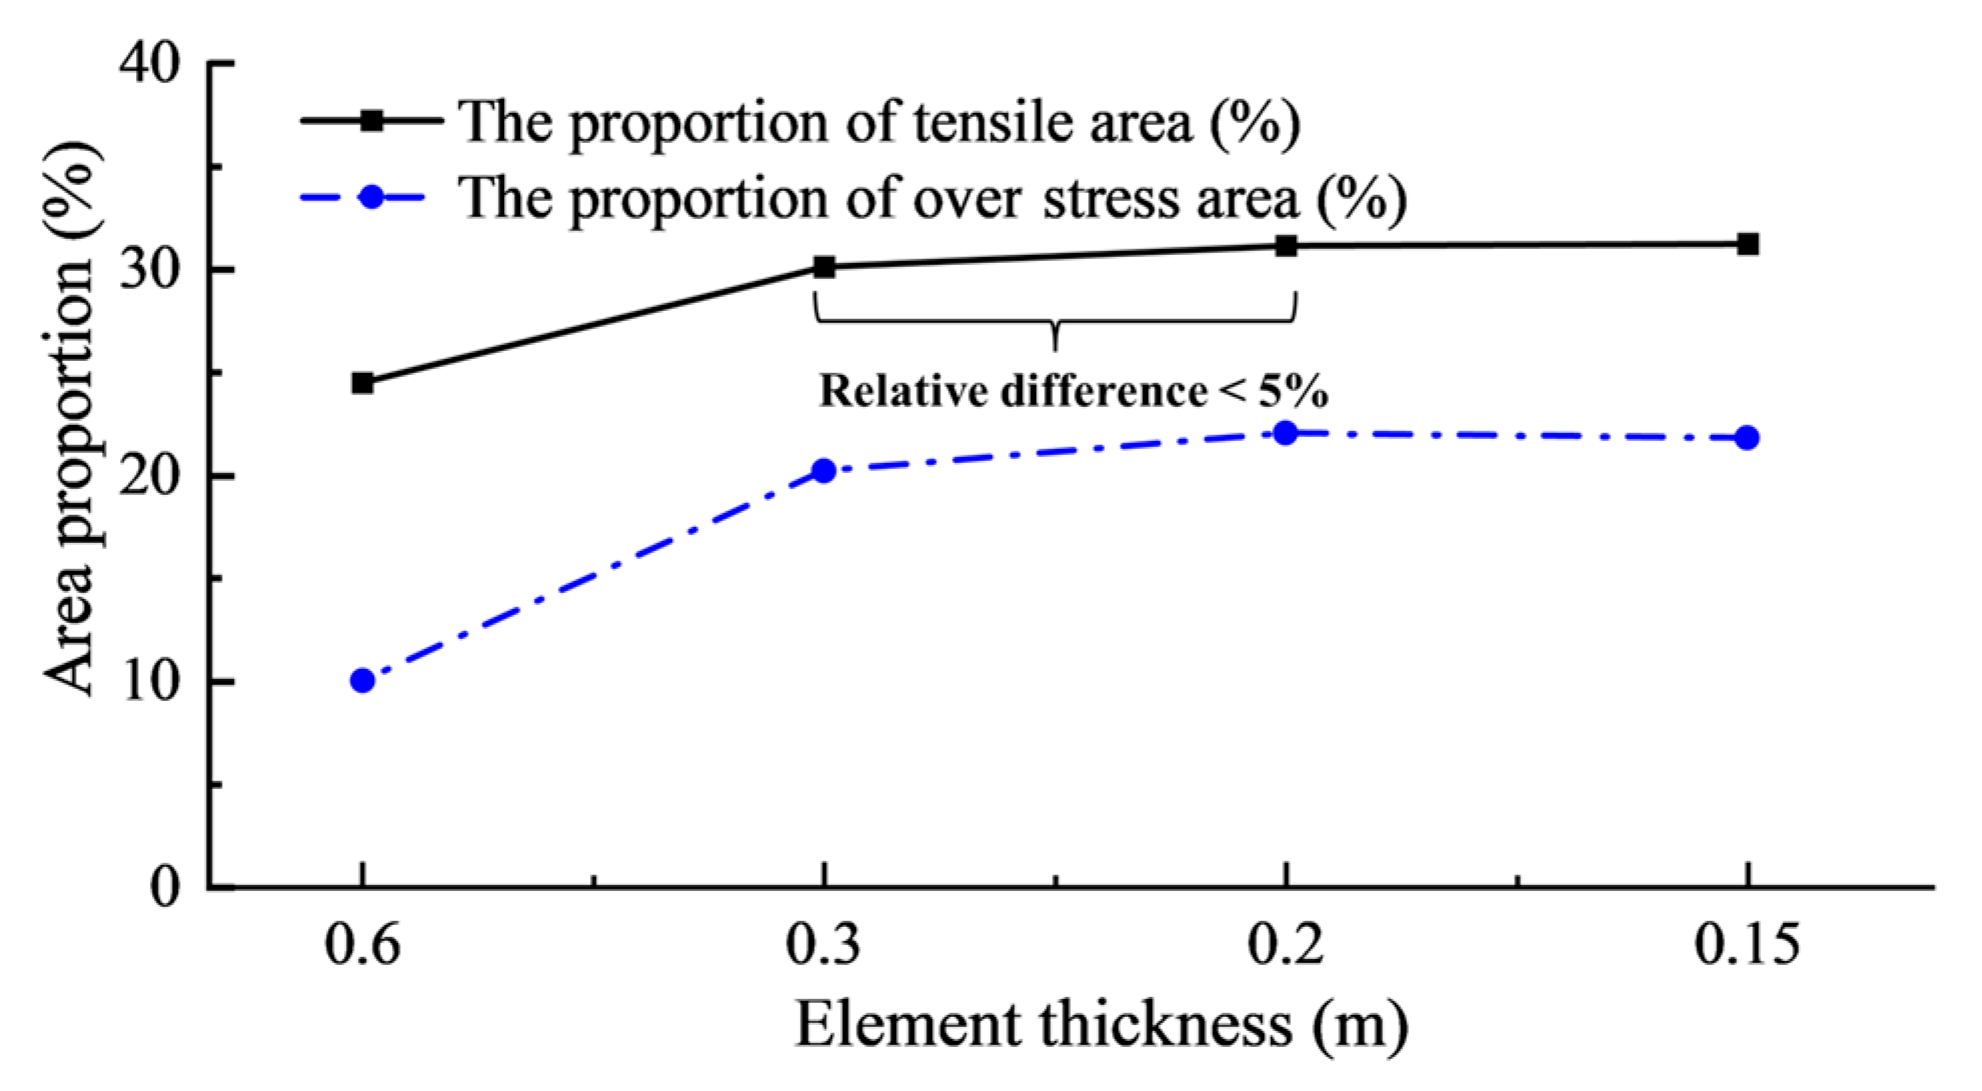
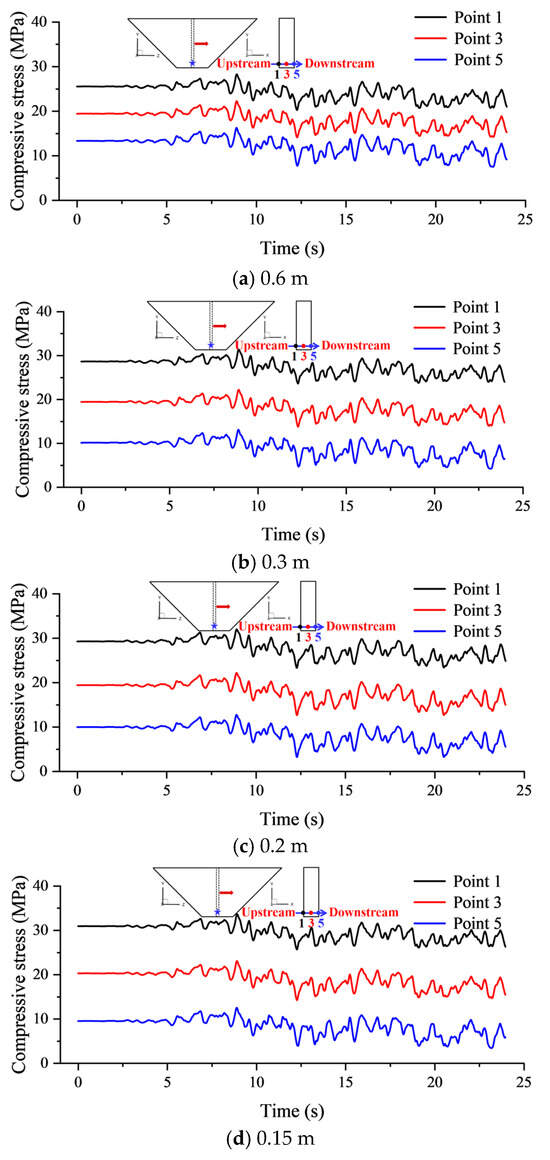
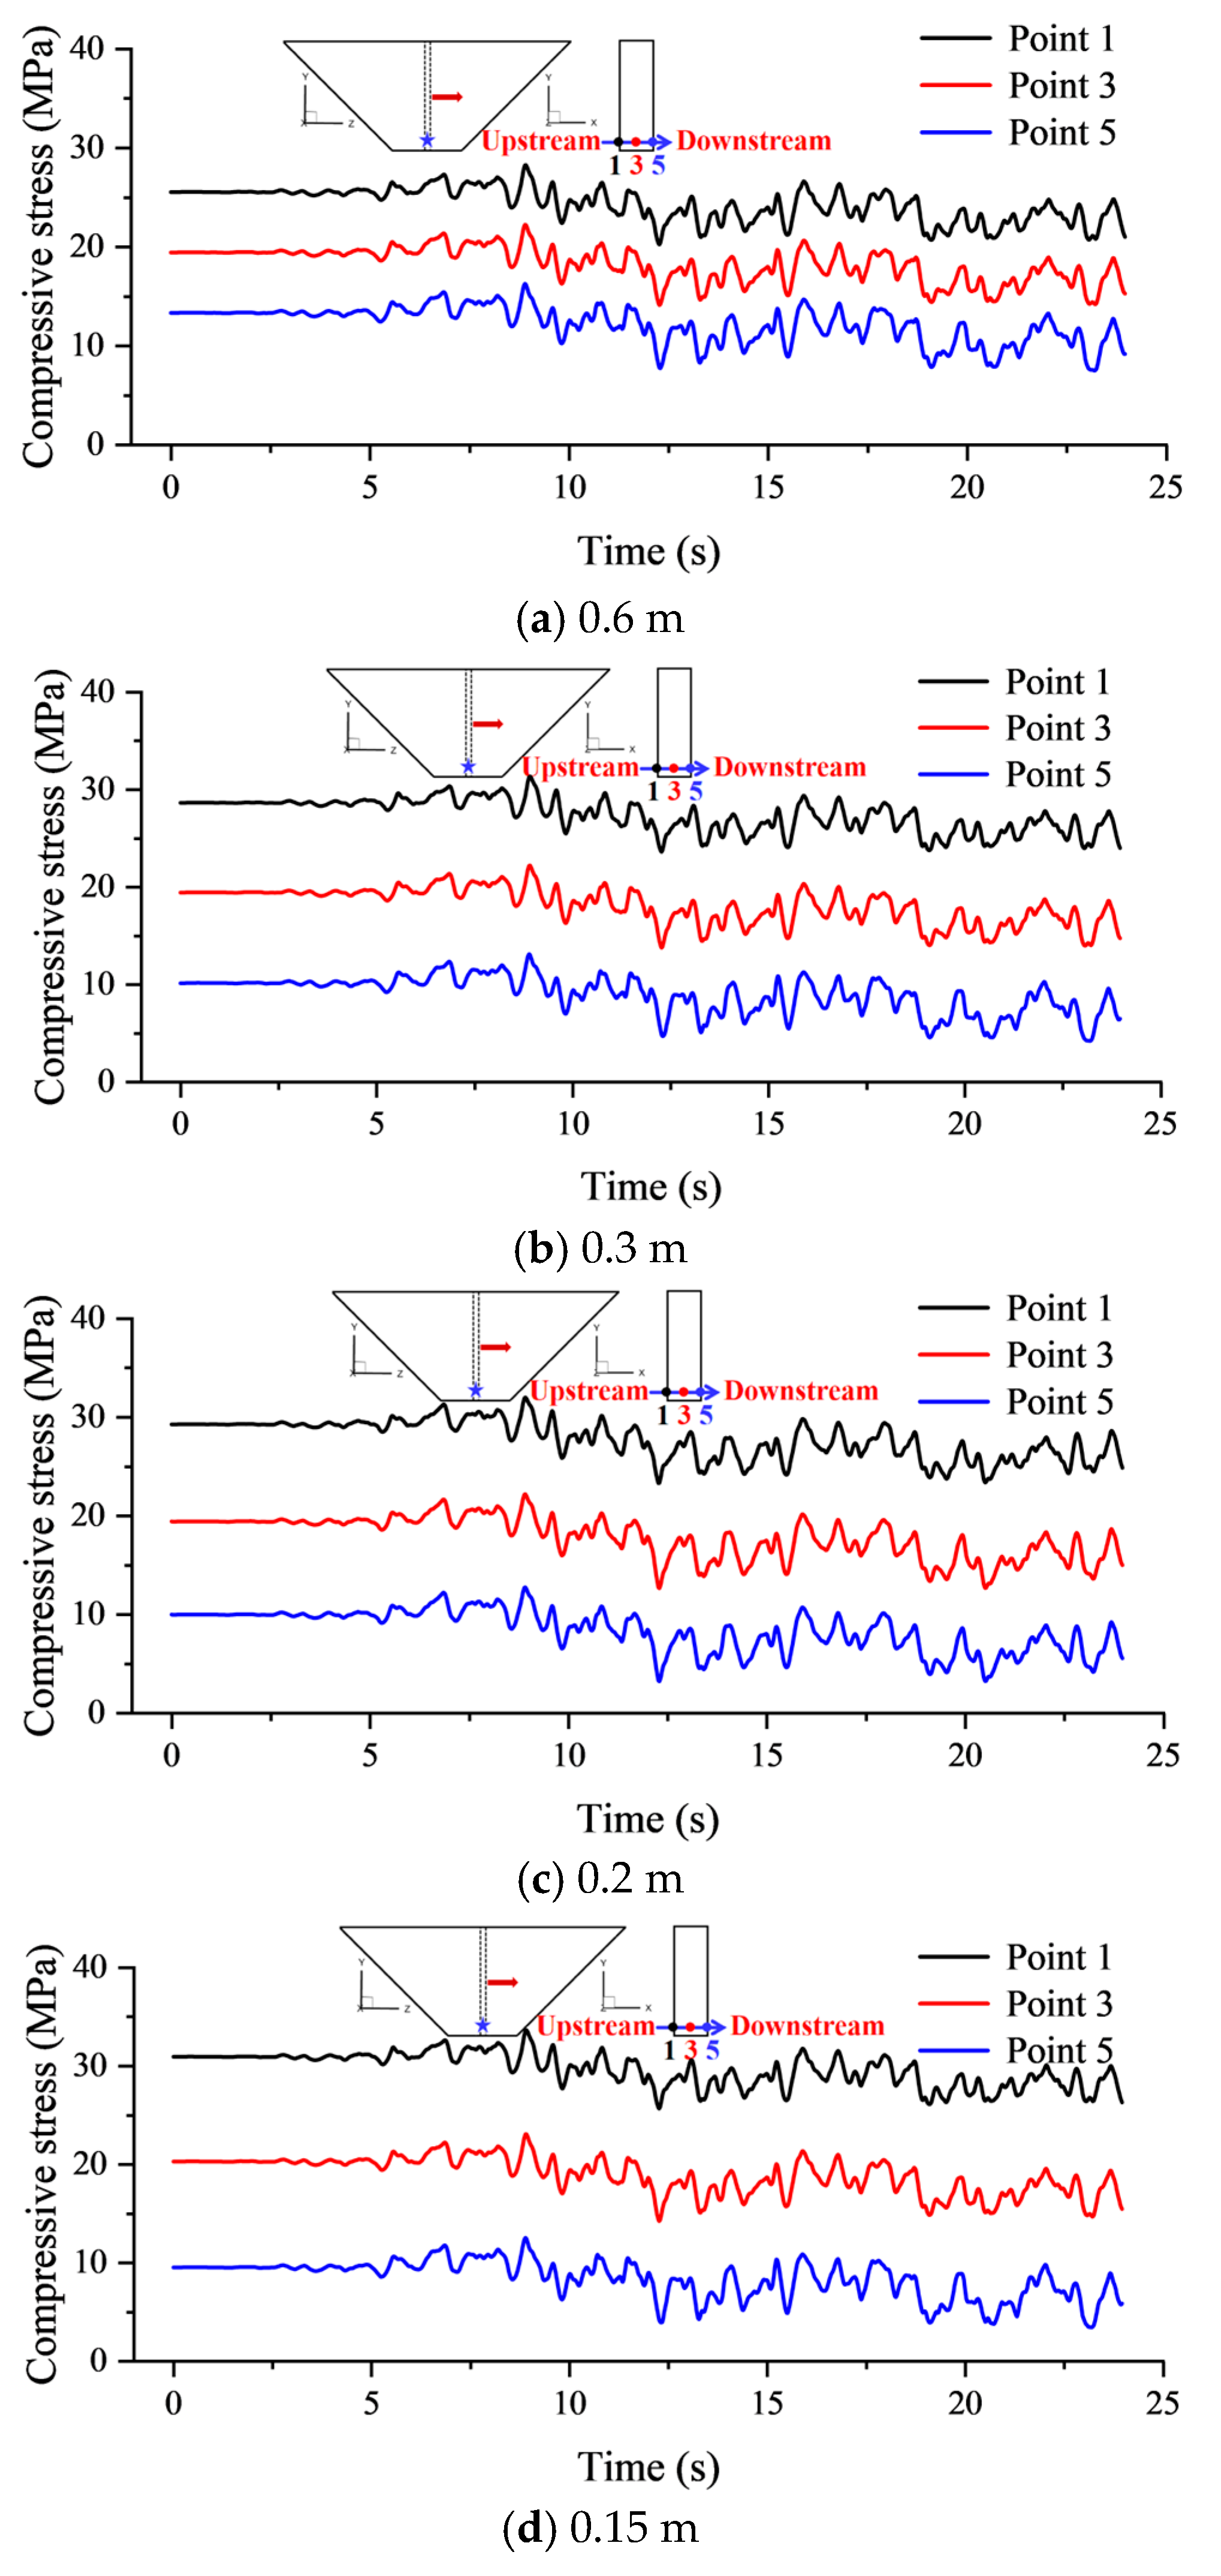
The cutoff wall was discretized into two, four, six, eight, and ten layers along its thickness direction, corresponding to element thicknesses of 0.6 m, 0.3 m, 0.2 m, 0.15 m, and 0.12 m, respectively. Figure 6 displays the displacement distribution of the cutoff wall under full-reservoir conditions for different discretized layers. It was observed that the overall deformation pattern remained essentially consistent across all discretization schemes, with the maximum discrepancy in streamwise displacement at the wall crest not exceeding 7%. This consistency arises because displacement fields are primarily governed by the global stiffness matrix and exhibit low sensitivity to local mesh refinement. Consequently, the influence of element thickness may be neglected when solely examining deformation distribution. Figure 7 and Figure 8 illustrate the stress states on the upstream and downstream of the 10-layer cutoff wall. The upstream face predominantly experiences compressive stress, while tensile stress primarily develops on the downstream. This significant stress differential between faces exhibits substantial stress gradients. Resolving this stress transition requires sufficiently refined elements; multi-layer discretization is essential to facilitate effective stress transfer. Insufficient layering (i.e., excessive element thickness) compromises adequate resolution of this stress transition. Figure 9 presents contour plots of minor principal stress distribution on the downstream under full-reservoir conditions for different conditions. Figure 10 shows the tensile area ratio and overstress area ratio on the downstream face for varying discretized layers. Element thickness substantially influences tensile stress distribution. Coarser discretization (e.g., 0.6 m) significantly underestimates tensile zones, critically impairing subsequent tensile damage analysis accuracy. In this study, convergence is considered to be achieved when the relative differences in the tensile area ratio and overstress area ratio between two successive mesh refinements are less than 5%. Based on this criterion, the results can be regarded as converged when the element thickness is refined to 0.3 m or less.
Figure 6.
Distribution of horizontal displacement under full reservoir (cm).
Figure 7.
Distribution of minor principal stress under full reservoir with 10 layers (MPa).
Figure 8.
Distribution of major principal stress under full reservoir with 10 layers (MPa).
Figure 9.
Tensile stress range on the downstream face under full reservoir for different refinements (MPa).
Figure 10.
Tensile area ratio and overstress area ratio on the downstream under full-reservoir conditions for different element thicknesses.
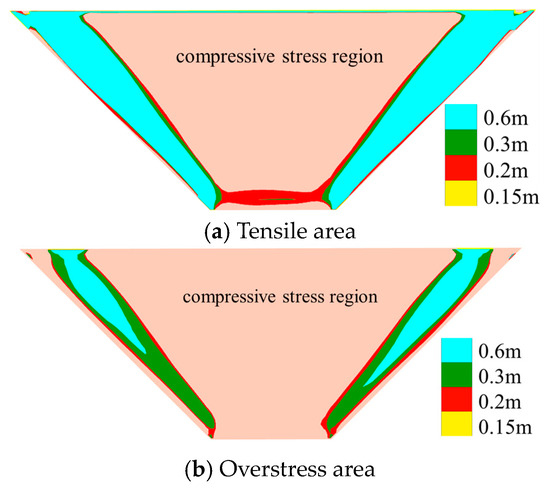
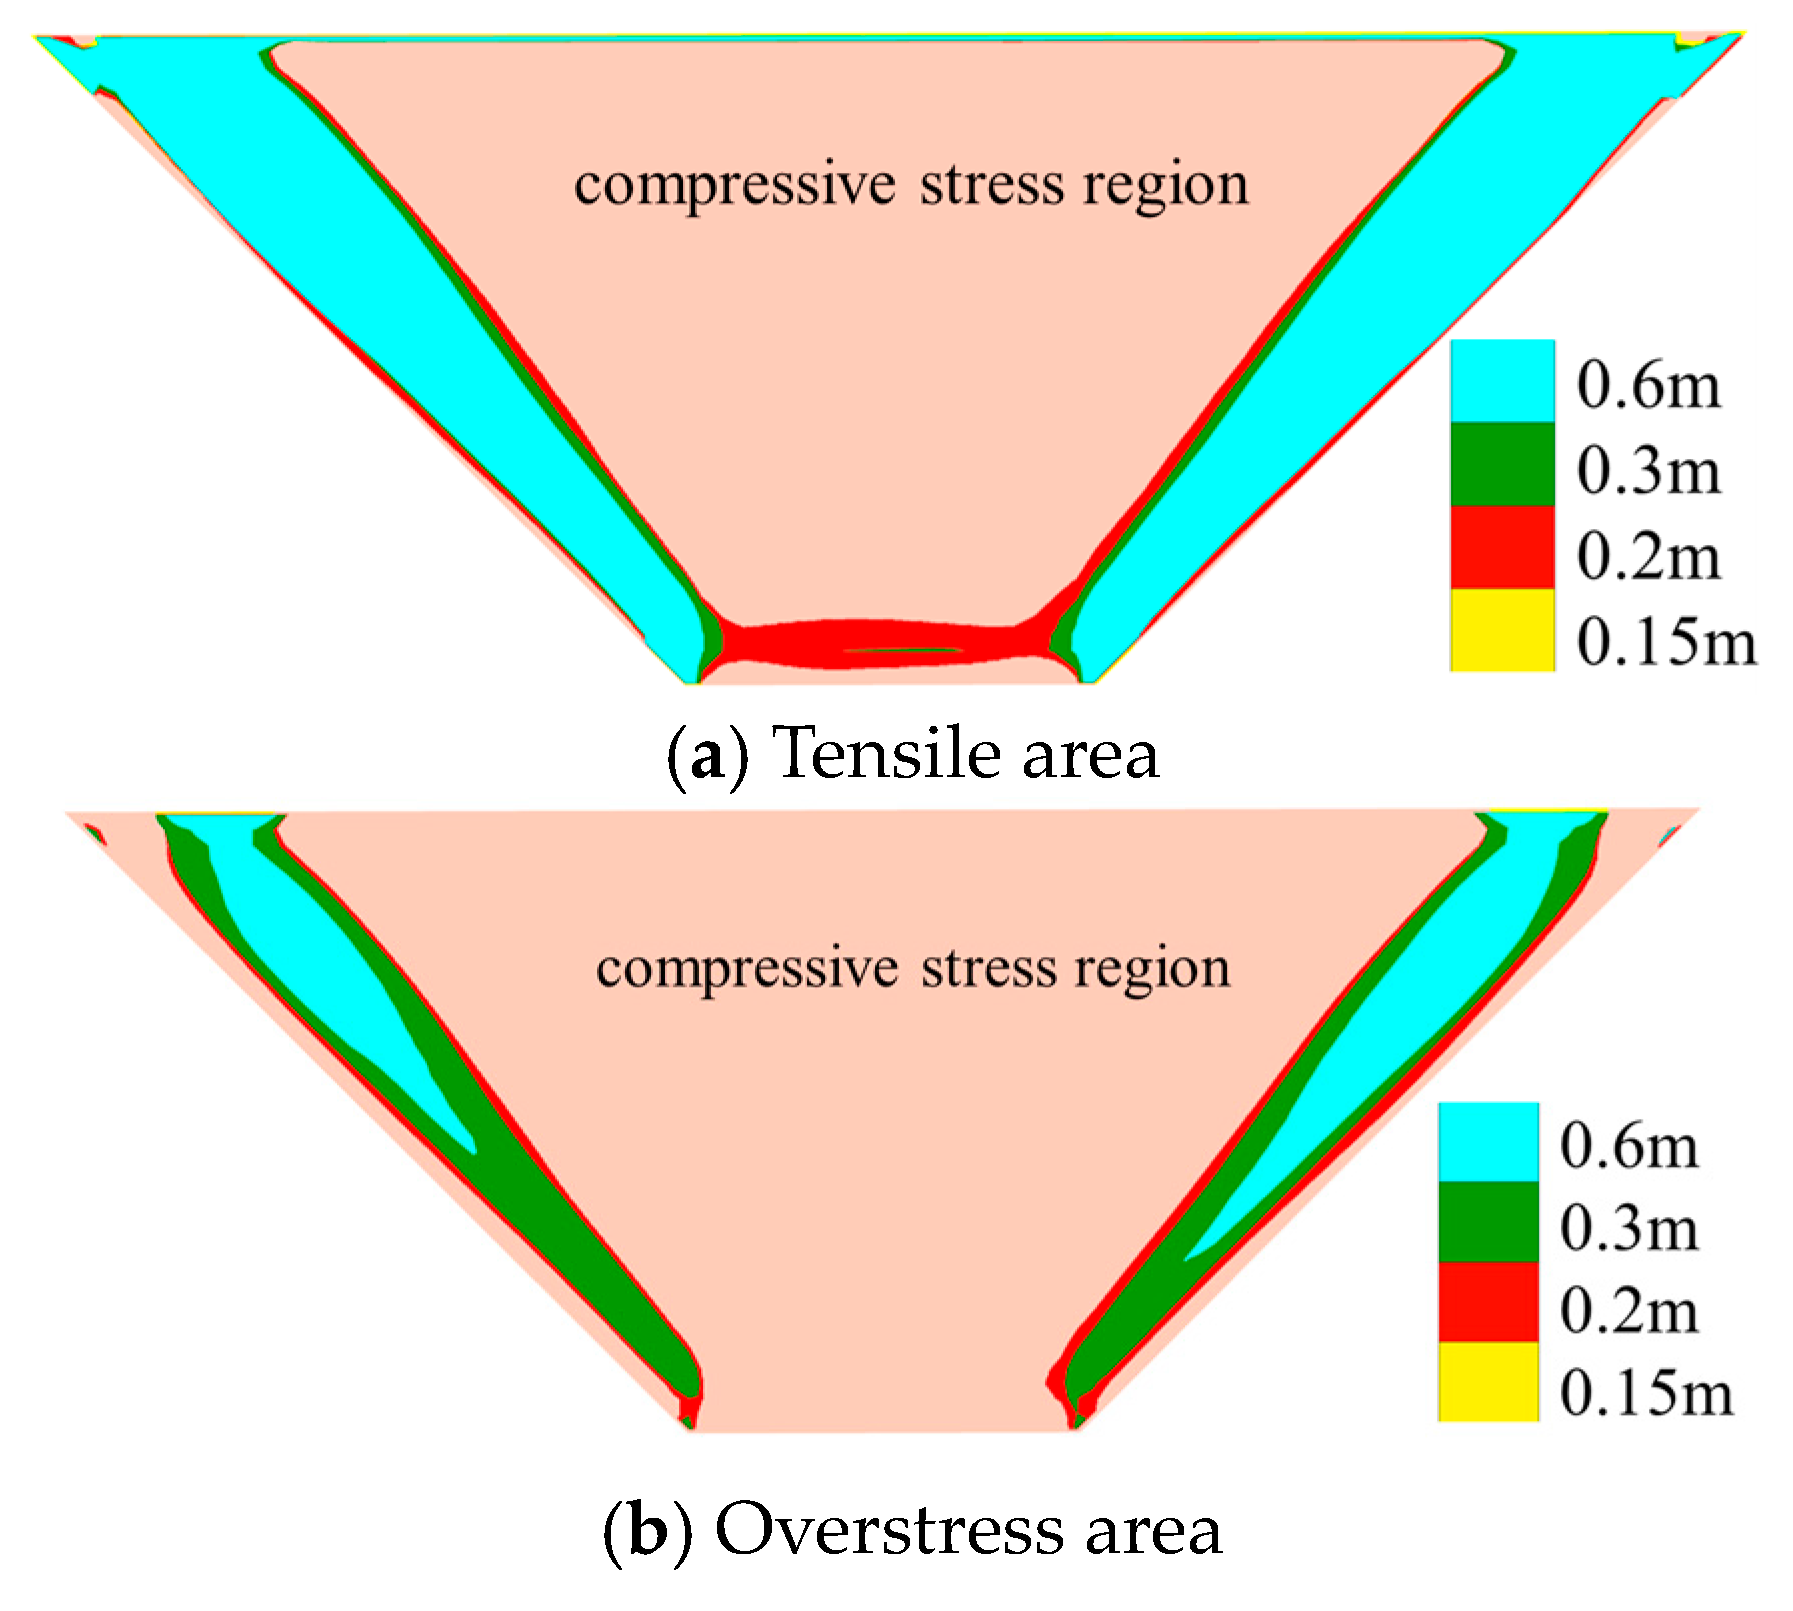
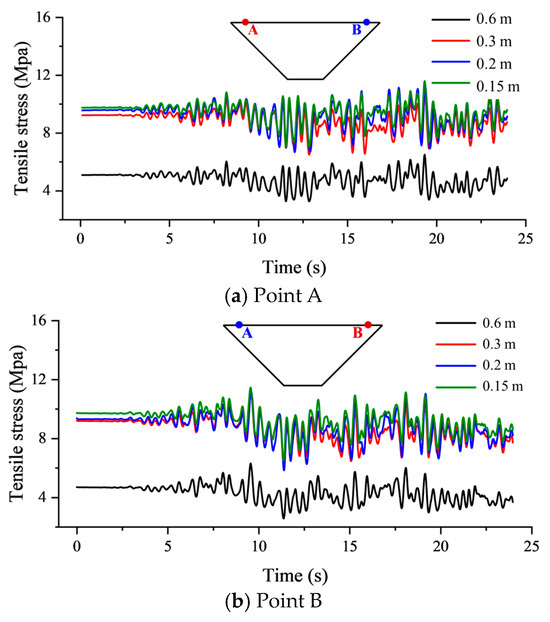
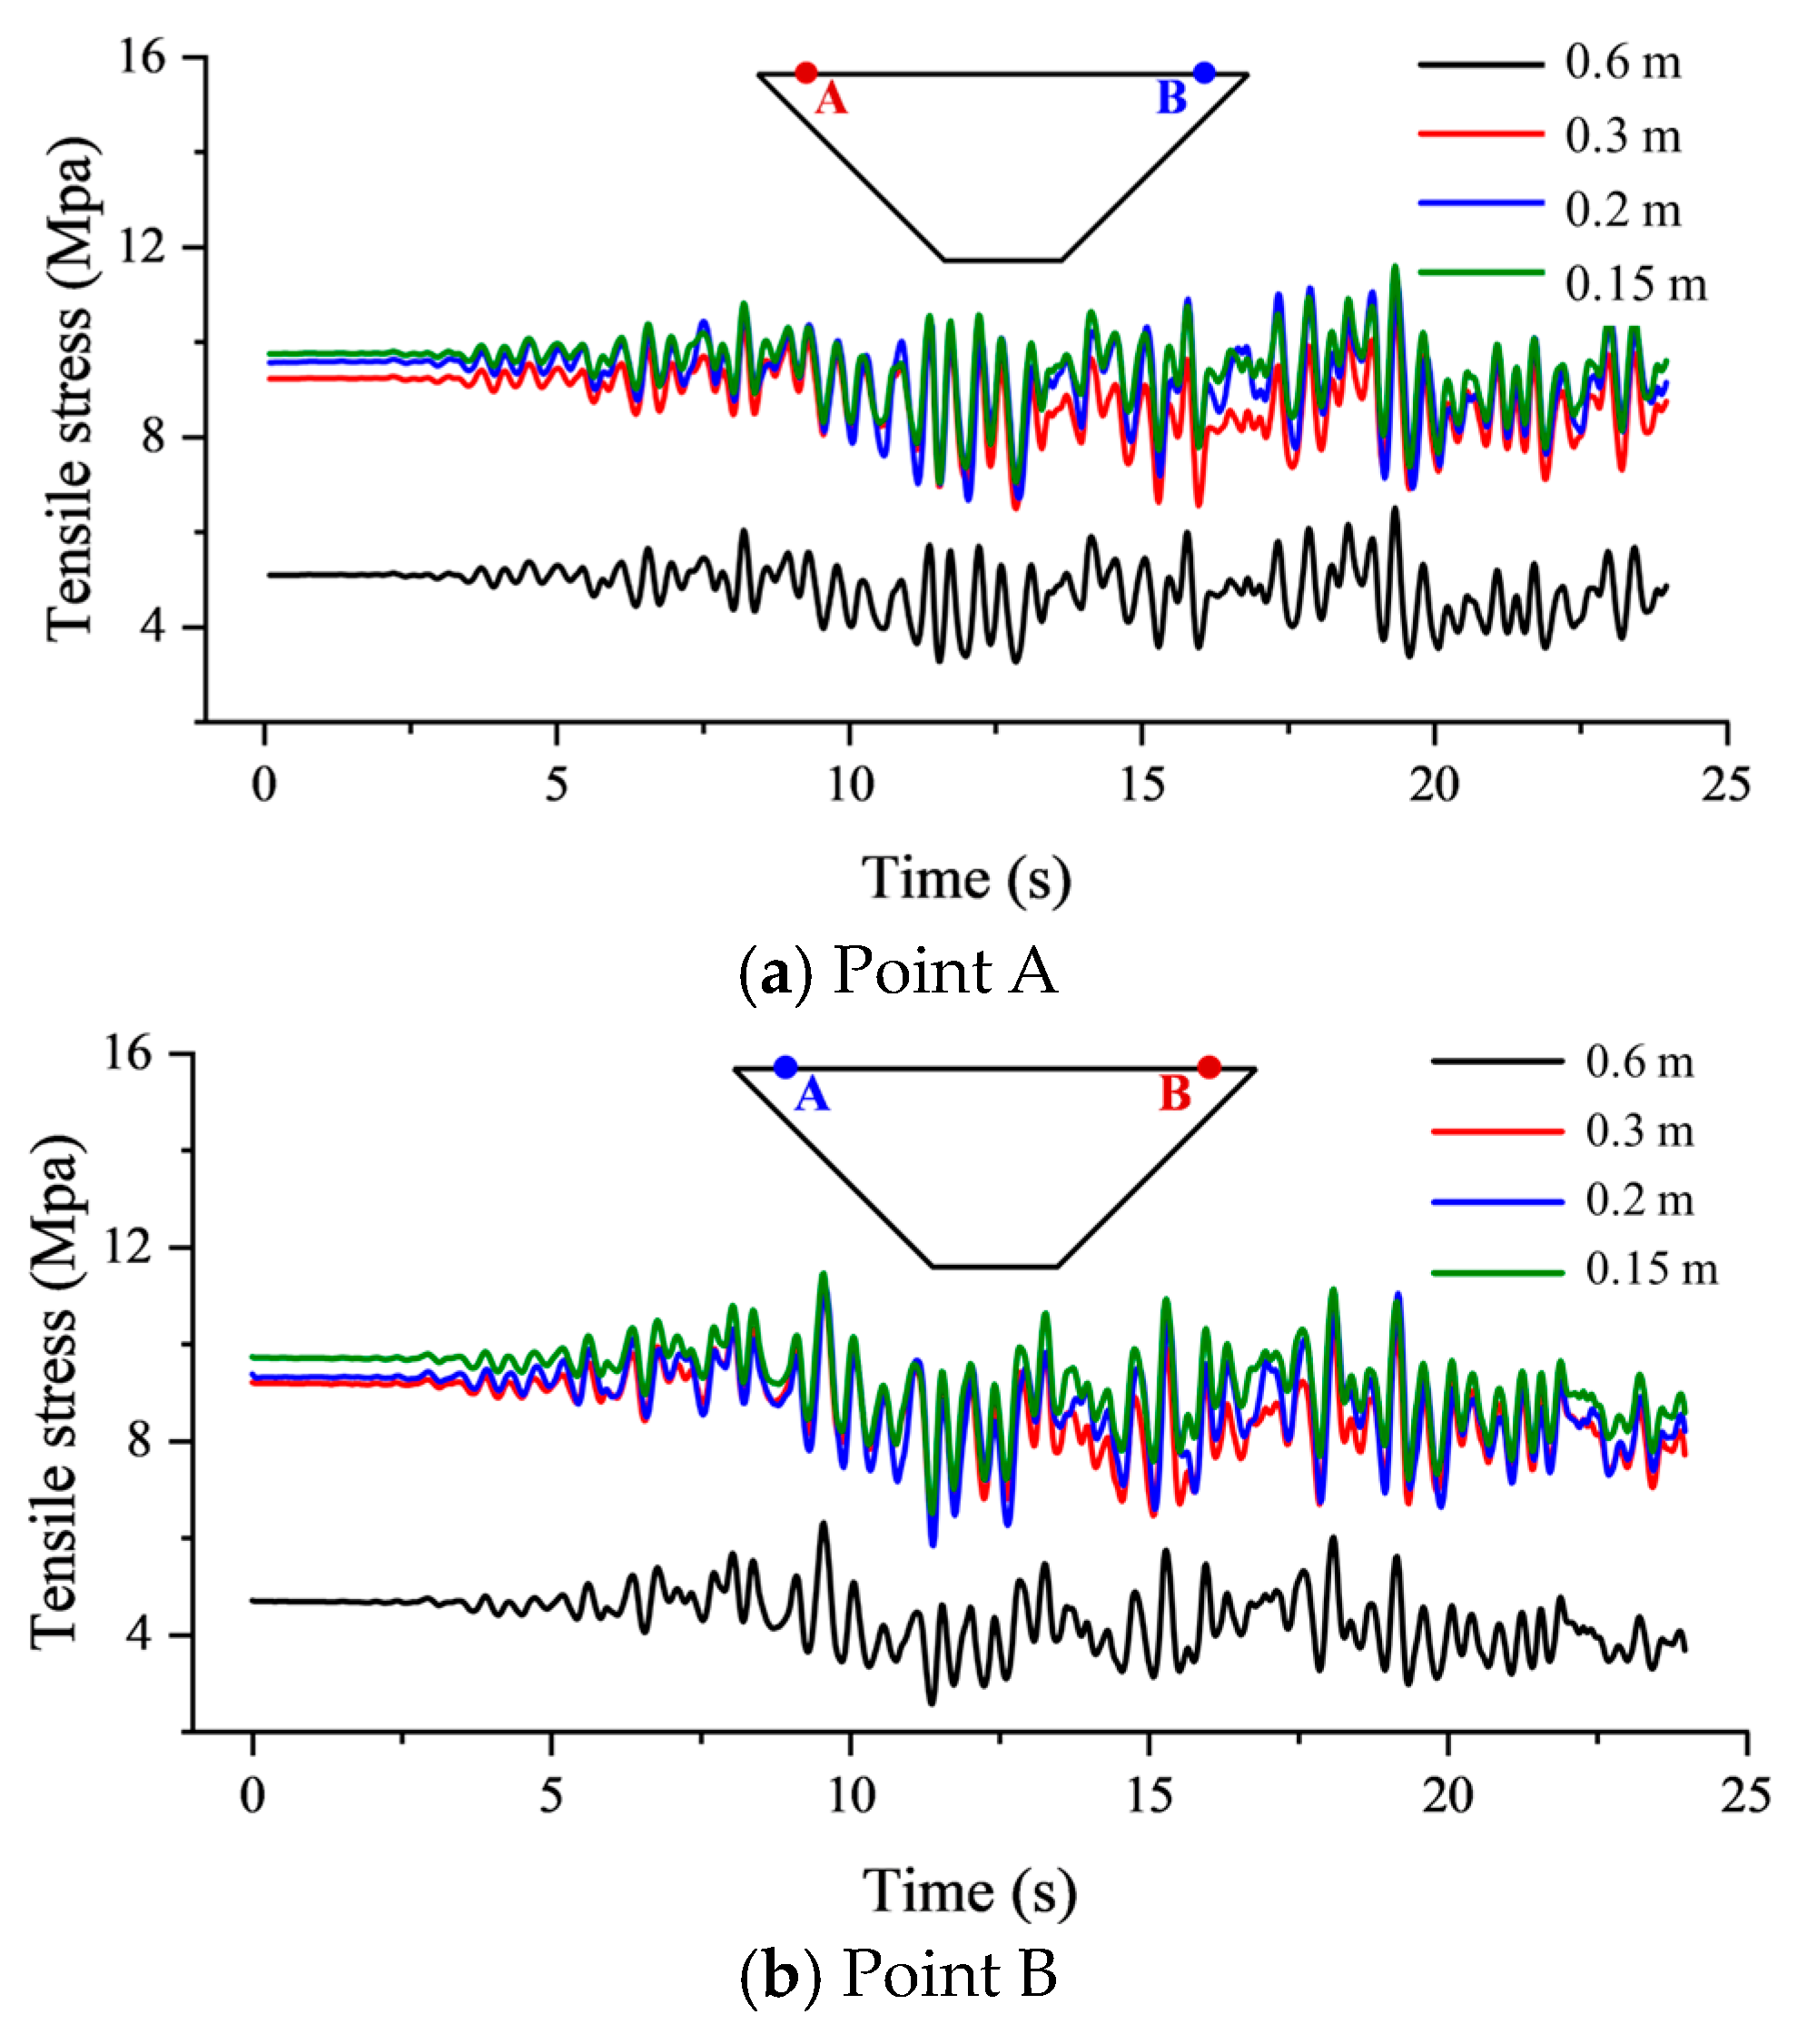
To further investigate the influence of discretized layer count on tensile stress, dynamic analysis was performed for the model with the cutoff wall discretized into eight, six, four, and two layers. Figure 11 and Figure 12 present the tensile area and overstress area on the downstream under different discretization schemes. Discretization at 0.6 m severely underestimates the tensile zone, critically compromising subsequent damage analysis accuracy. Specifically, the overstress area ratio reaches only 10% at 0.6 m discretization. Coarse-mesh element resolution fails to accurately resolve stress transfer mechanism due to bending deformation. Mesh refinement significantly enhances stress capture capability. When element thickness reduces below 0.3 m, both the tensile area ratio and overstress area converge, stabilizing near 31% and 21%, respectively. The captured overstress area is more than 100% higher than that of the 0.6 m mesh. In this study, the tensile area ratio and overstress area ratio are adopted as the main evaluation indicators. The weighted overstress index will be considered in future work. The time history curve of Figure 13 further supports this conclusion. The 0.6 m mesh exhibits distorted stress transfer from excessive element stiffness, failing to reflect true dynamic response. The 0.3 m mesh accurately captures peak stress and resolves seismic stress fluctuation detail. Adopting 0.3 m element thickness (4-layer wall) satisfies the convergence requirement for tensile and overstressed regions while avoiding computational burden from excessive refinement (6/8 layers), establishing it as the optimal solution for dynamic damage analysis of cutoff wall.
Figure 11.
Tensile stress range on the downstream face under seismic loading.
Figure 12.
Tensile area ratio on the downstream side of the cutoff wall under full-reservoir conditions for different element thicknesses.
Figure 13.
Tensile stress development time history on the downstream side for different refinement.
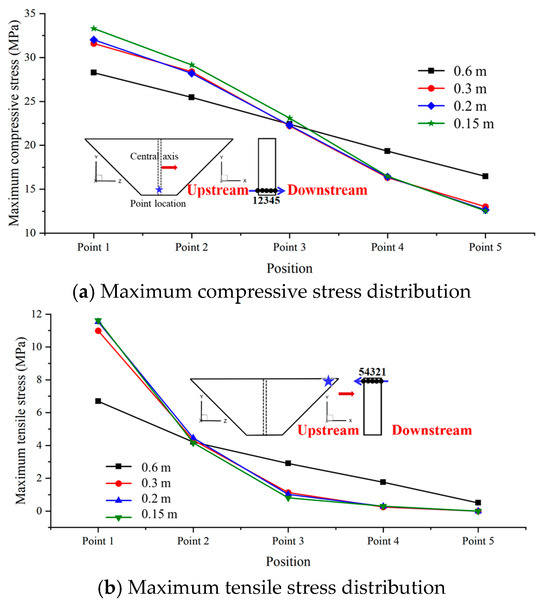
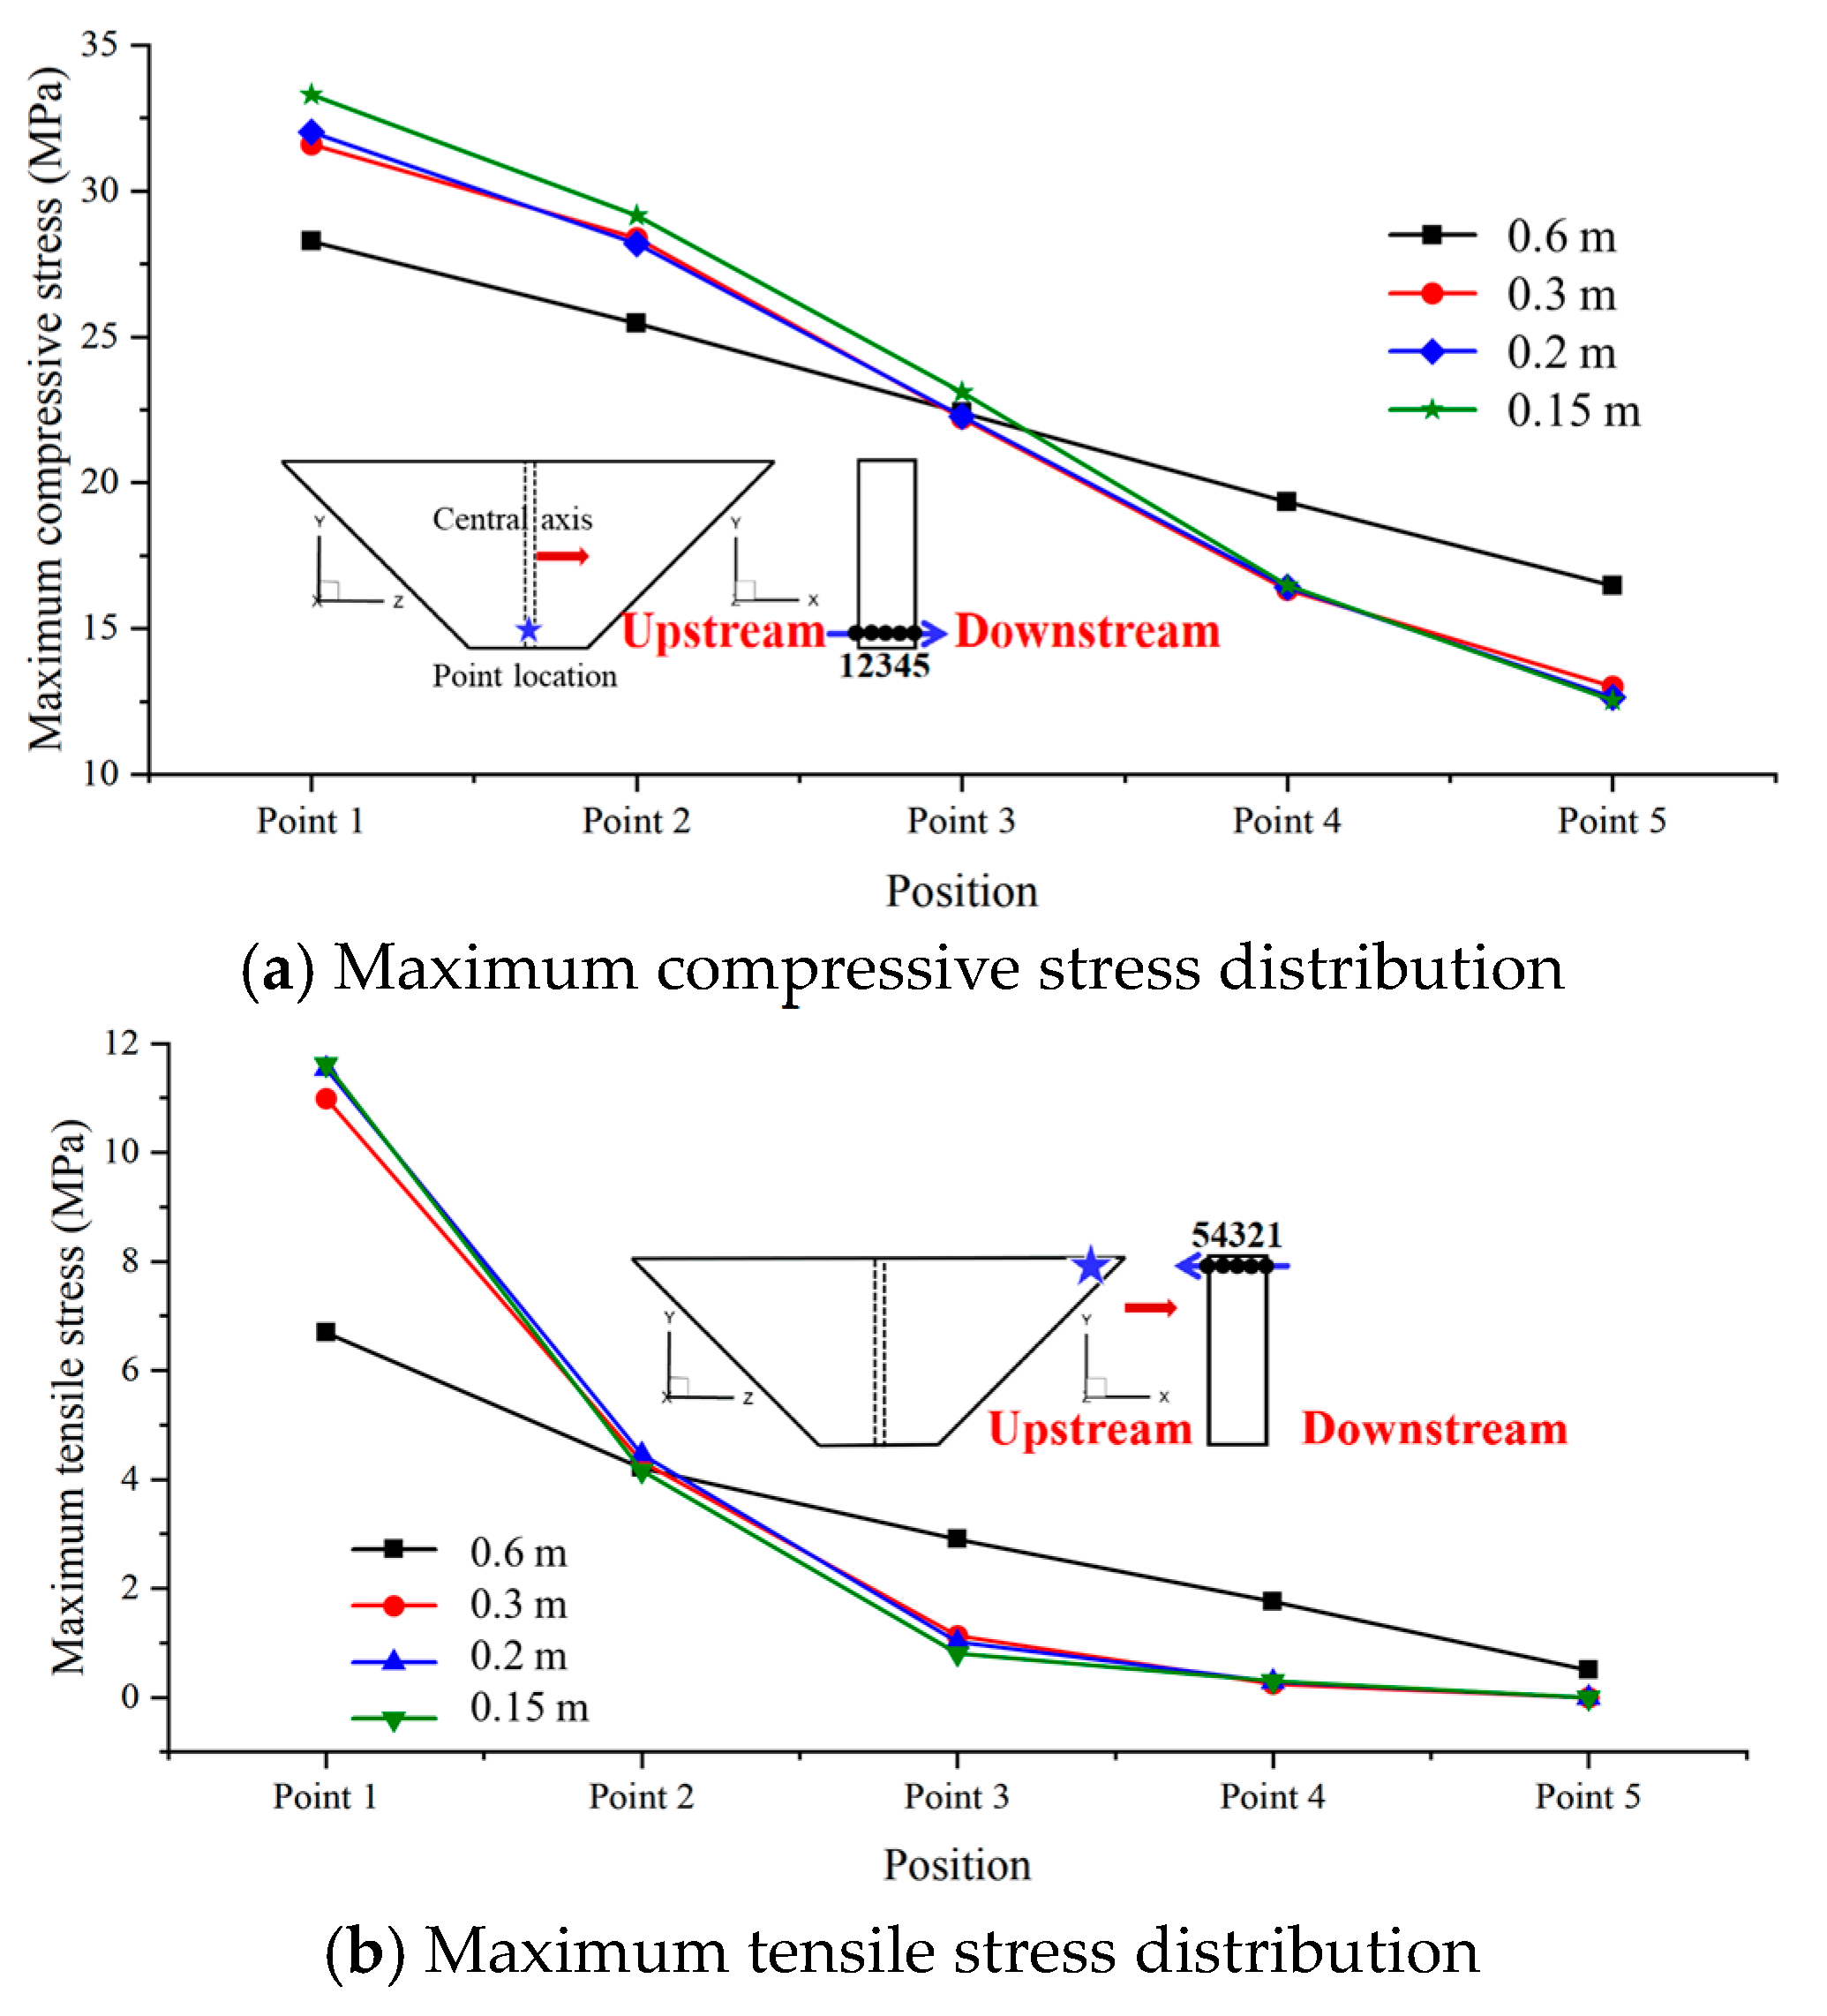
Figure 14 shows the stress distribution along the thickness of the cutoff wall with different numbers of layers under seismic loading. Figure 15 depicts the time history of stress development. The maximum compressive stress on the upstream surface increases significantly with the mesh refinement. The 0.3 m mesh increases by 34% compared with the 0.6 m mesh and then tends to converge. This occurs because the stiffness of the few-layer mesh element is too large, which will underestimate the bending effect. Refined meshing reduces wall flexural rigidity, increasing compressive deformation susceptibility at the upstream face and elevating compressive stress to the true value. The compressive stress of the downstream surface changes in the opposite direction, which is reduced by 21% and tends to be stable after 0.3 m mesh. Insufficient discretization cannot resolve bending moment gradients, inducing spurious compressive stress at the downstream face. Refined meshing enables authentic bending transfer, releasing downstream compressive stress. The distribution of tensile stress is similar. The coarse mesh cannot simulate the real bending gradient while underestimating the upstream compressive stress and downstream tensile stress, resulting in dangerous design deviations.
Figure 14.
Stress distribution of different positions along the thickness direction.
Figure 15.
Compressive stress development time history of different positions.
3.2. Sensitivity Analysis of Dam Height and Overburden Parameter
The cutoff wall in deep overburden sustains both the dam weight and hydrostatic pressure from reservoir impoundment. Under dam weight loading, significant differential settlement occurs between the cutoff wall and surrounding overburden, subjecting the wall to substantial soil frictional resistance. Furthermore, deformation of the cutoff wall is primarily governed by the overburden behavior. During reservoir filling, pronounced streamwise deformation in the overburden induces corresponding deformation in the wall. Dam height and overburden parameters critically influence the stress and deformation state of the cutoff wall, with seismic action further intensifying these effects. Whether these factors alter the fundamental stress and deformation distribution pattern remains unclear. Consequently, conducting sensitivity analysis of the cutoff wall under varying dam heights and overburden parameters is imperative. It should be noted that the dam height and overburden modulus may interact and jointly affect the stress state of the cutoff wall. In the present study, single-factor sensitivity analyses are conducted to identify the independent influence of each factor, while their coupled effects will be further investigated in future work.
3.2.1. Effect of Dam Height
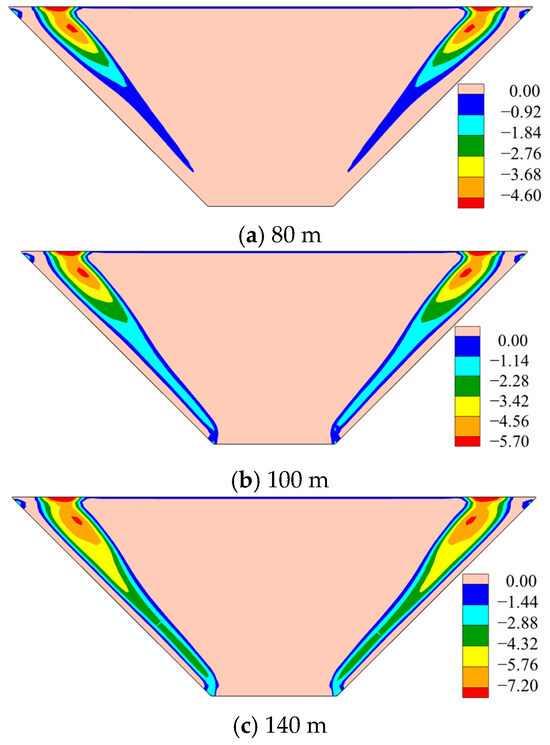
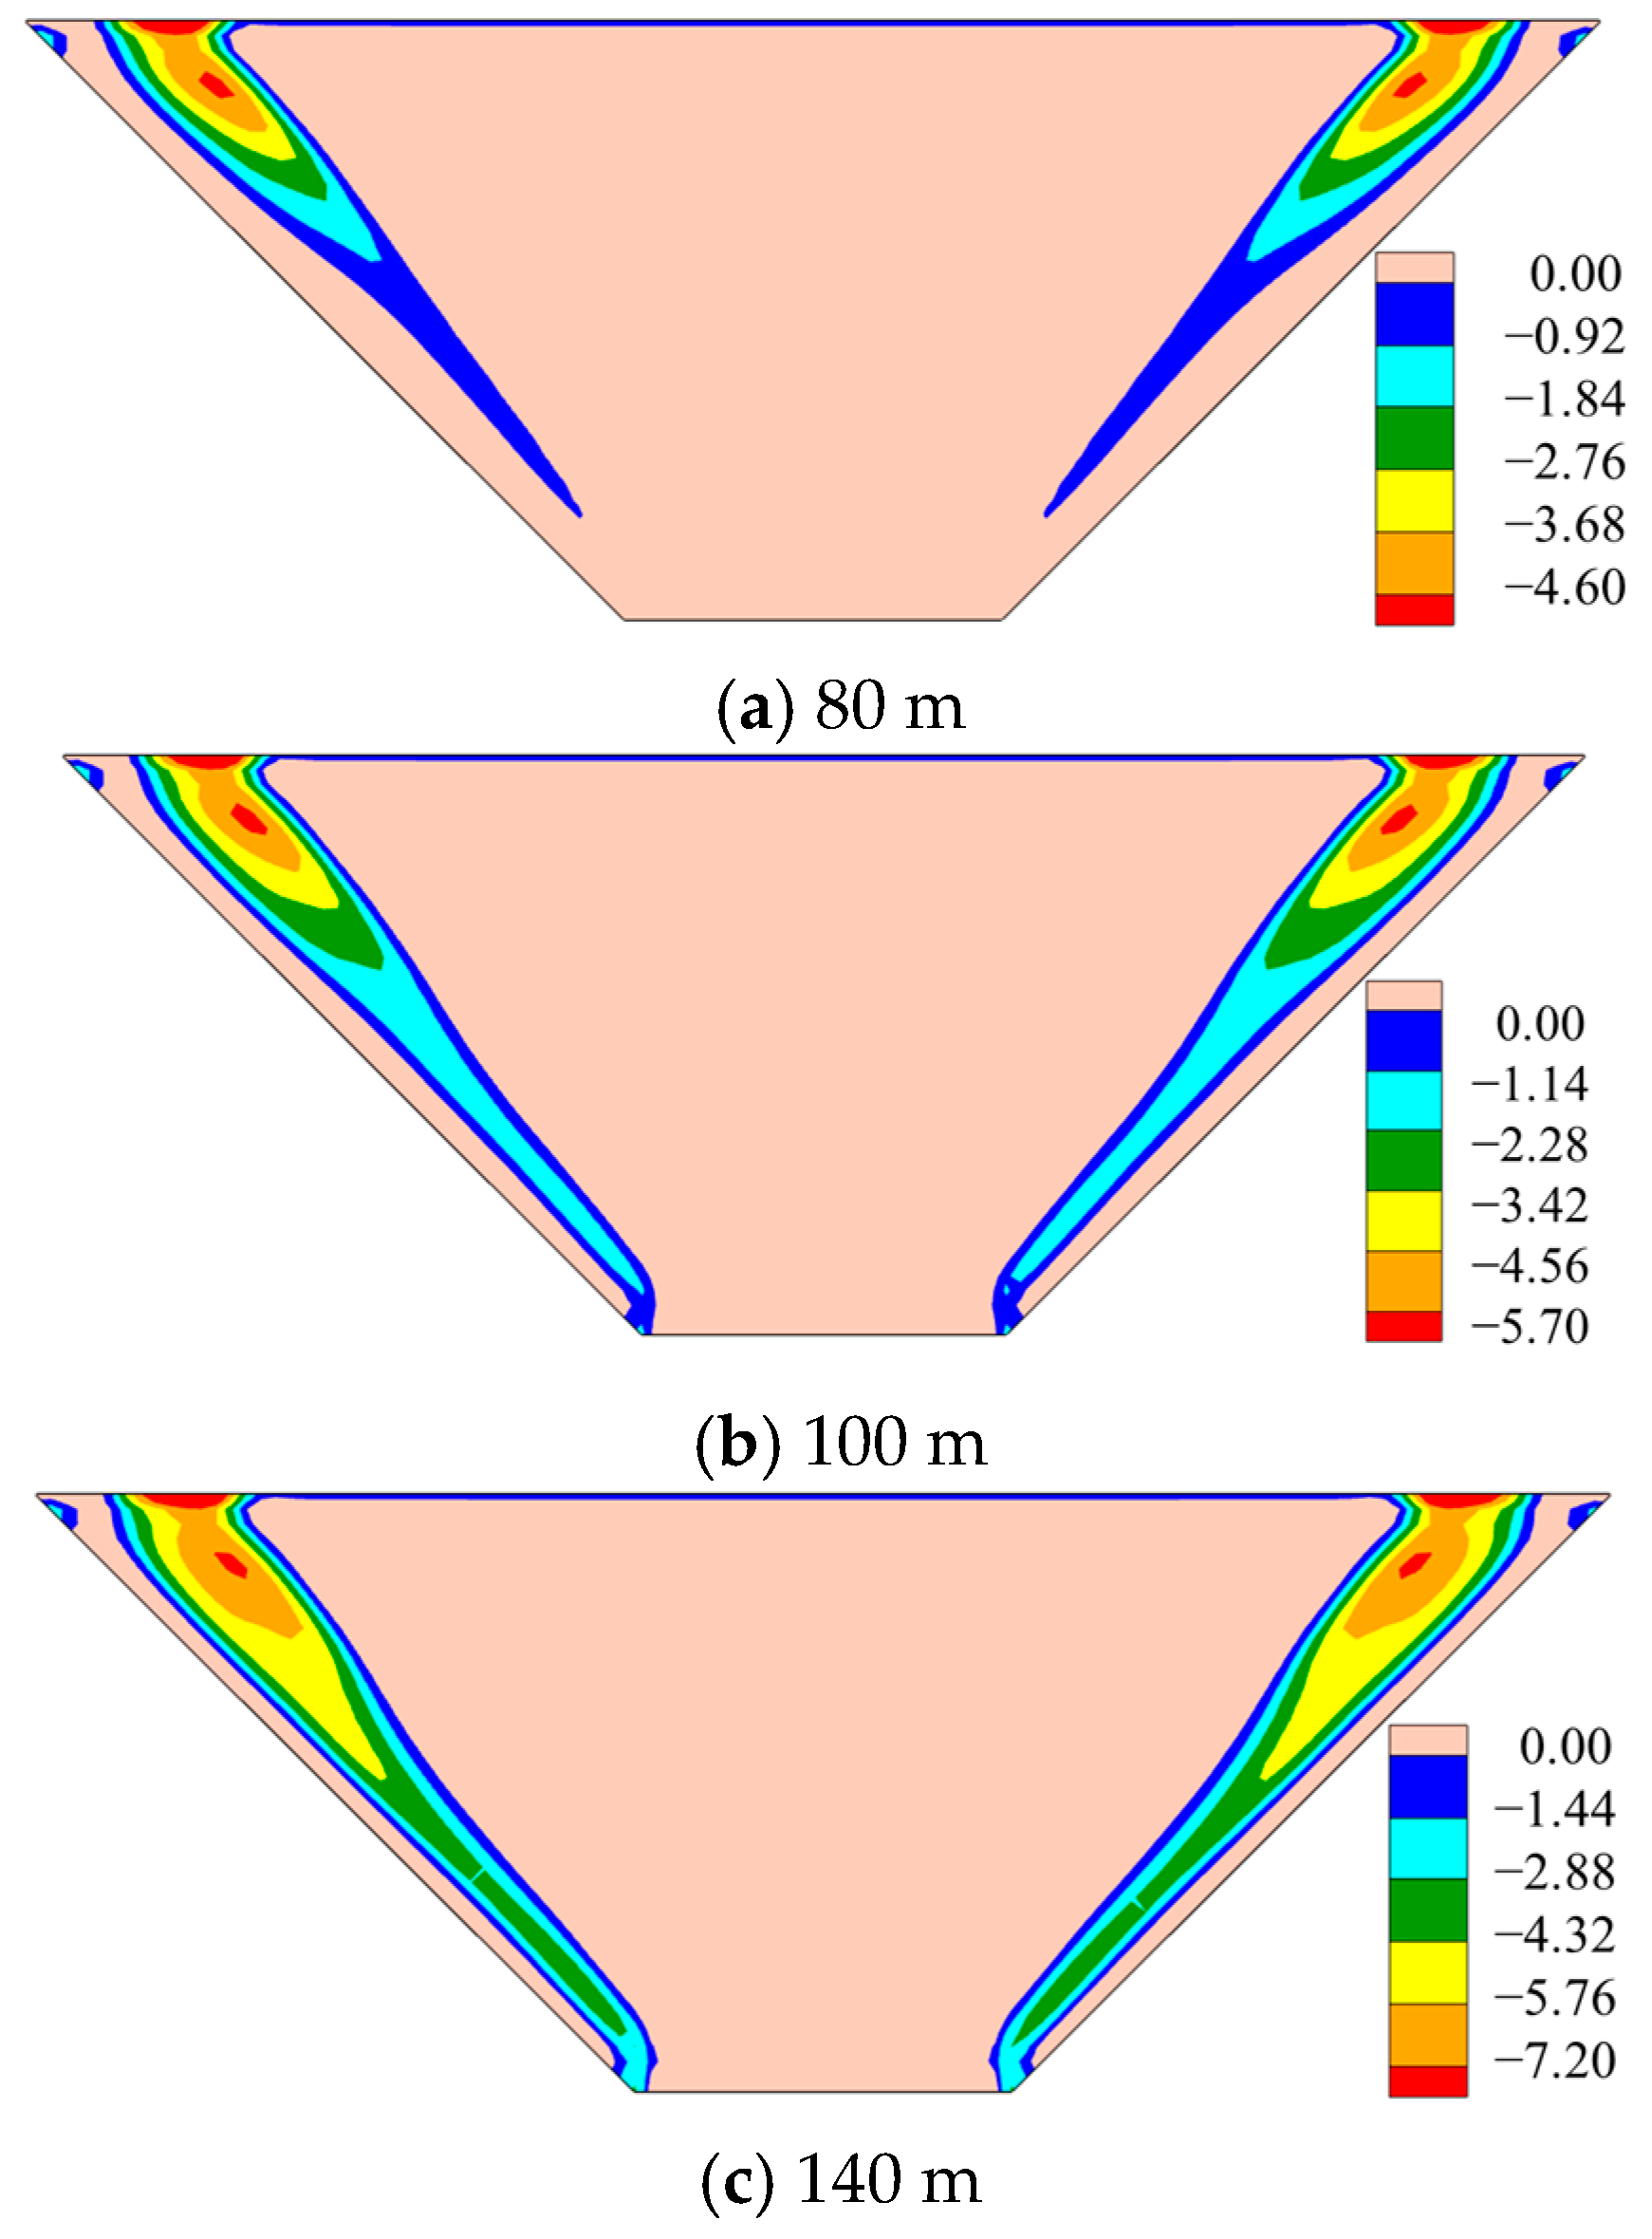
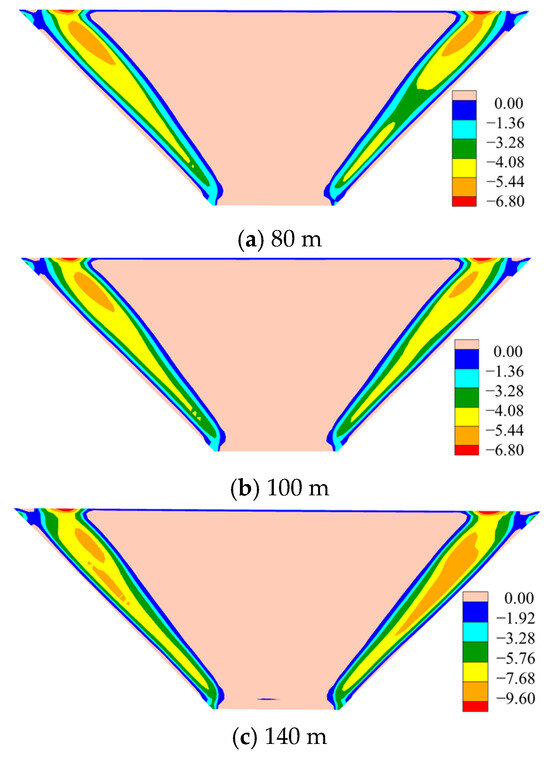
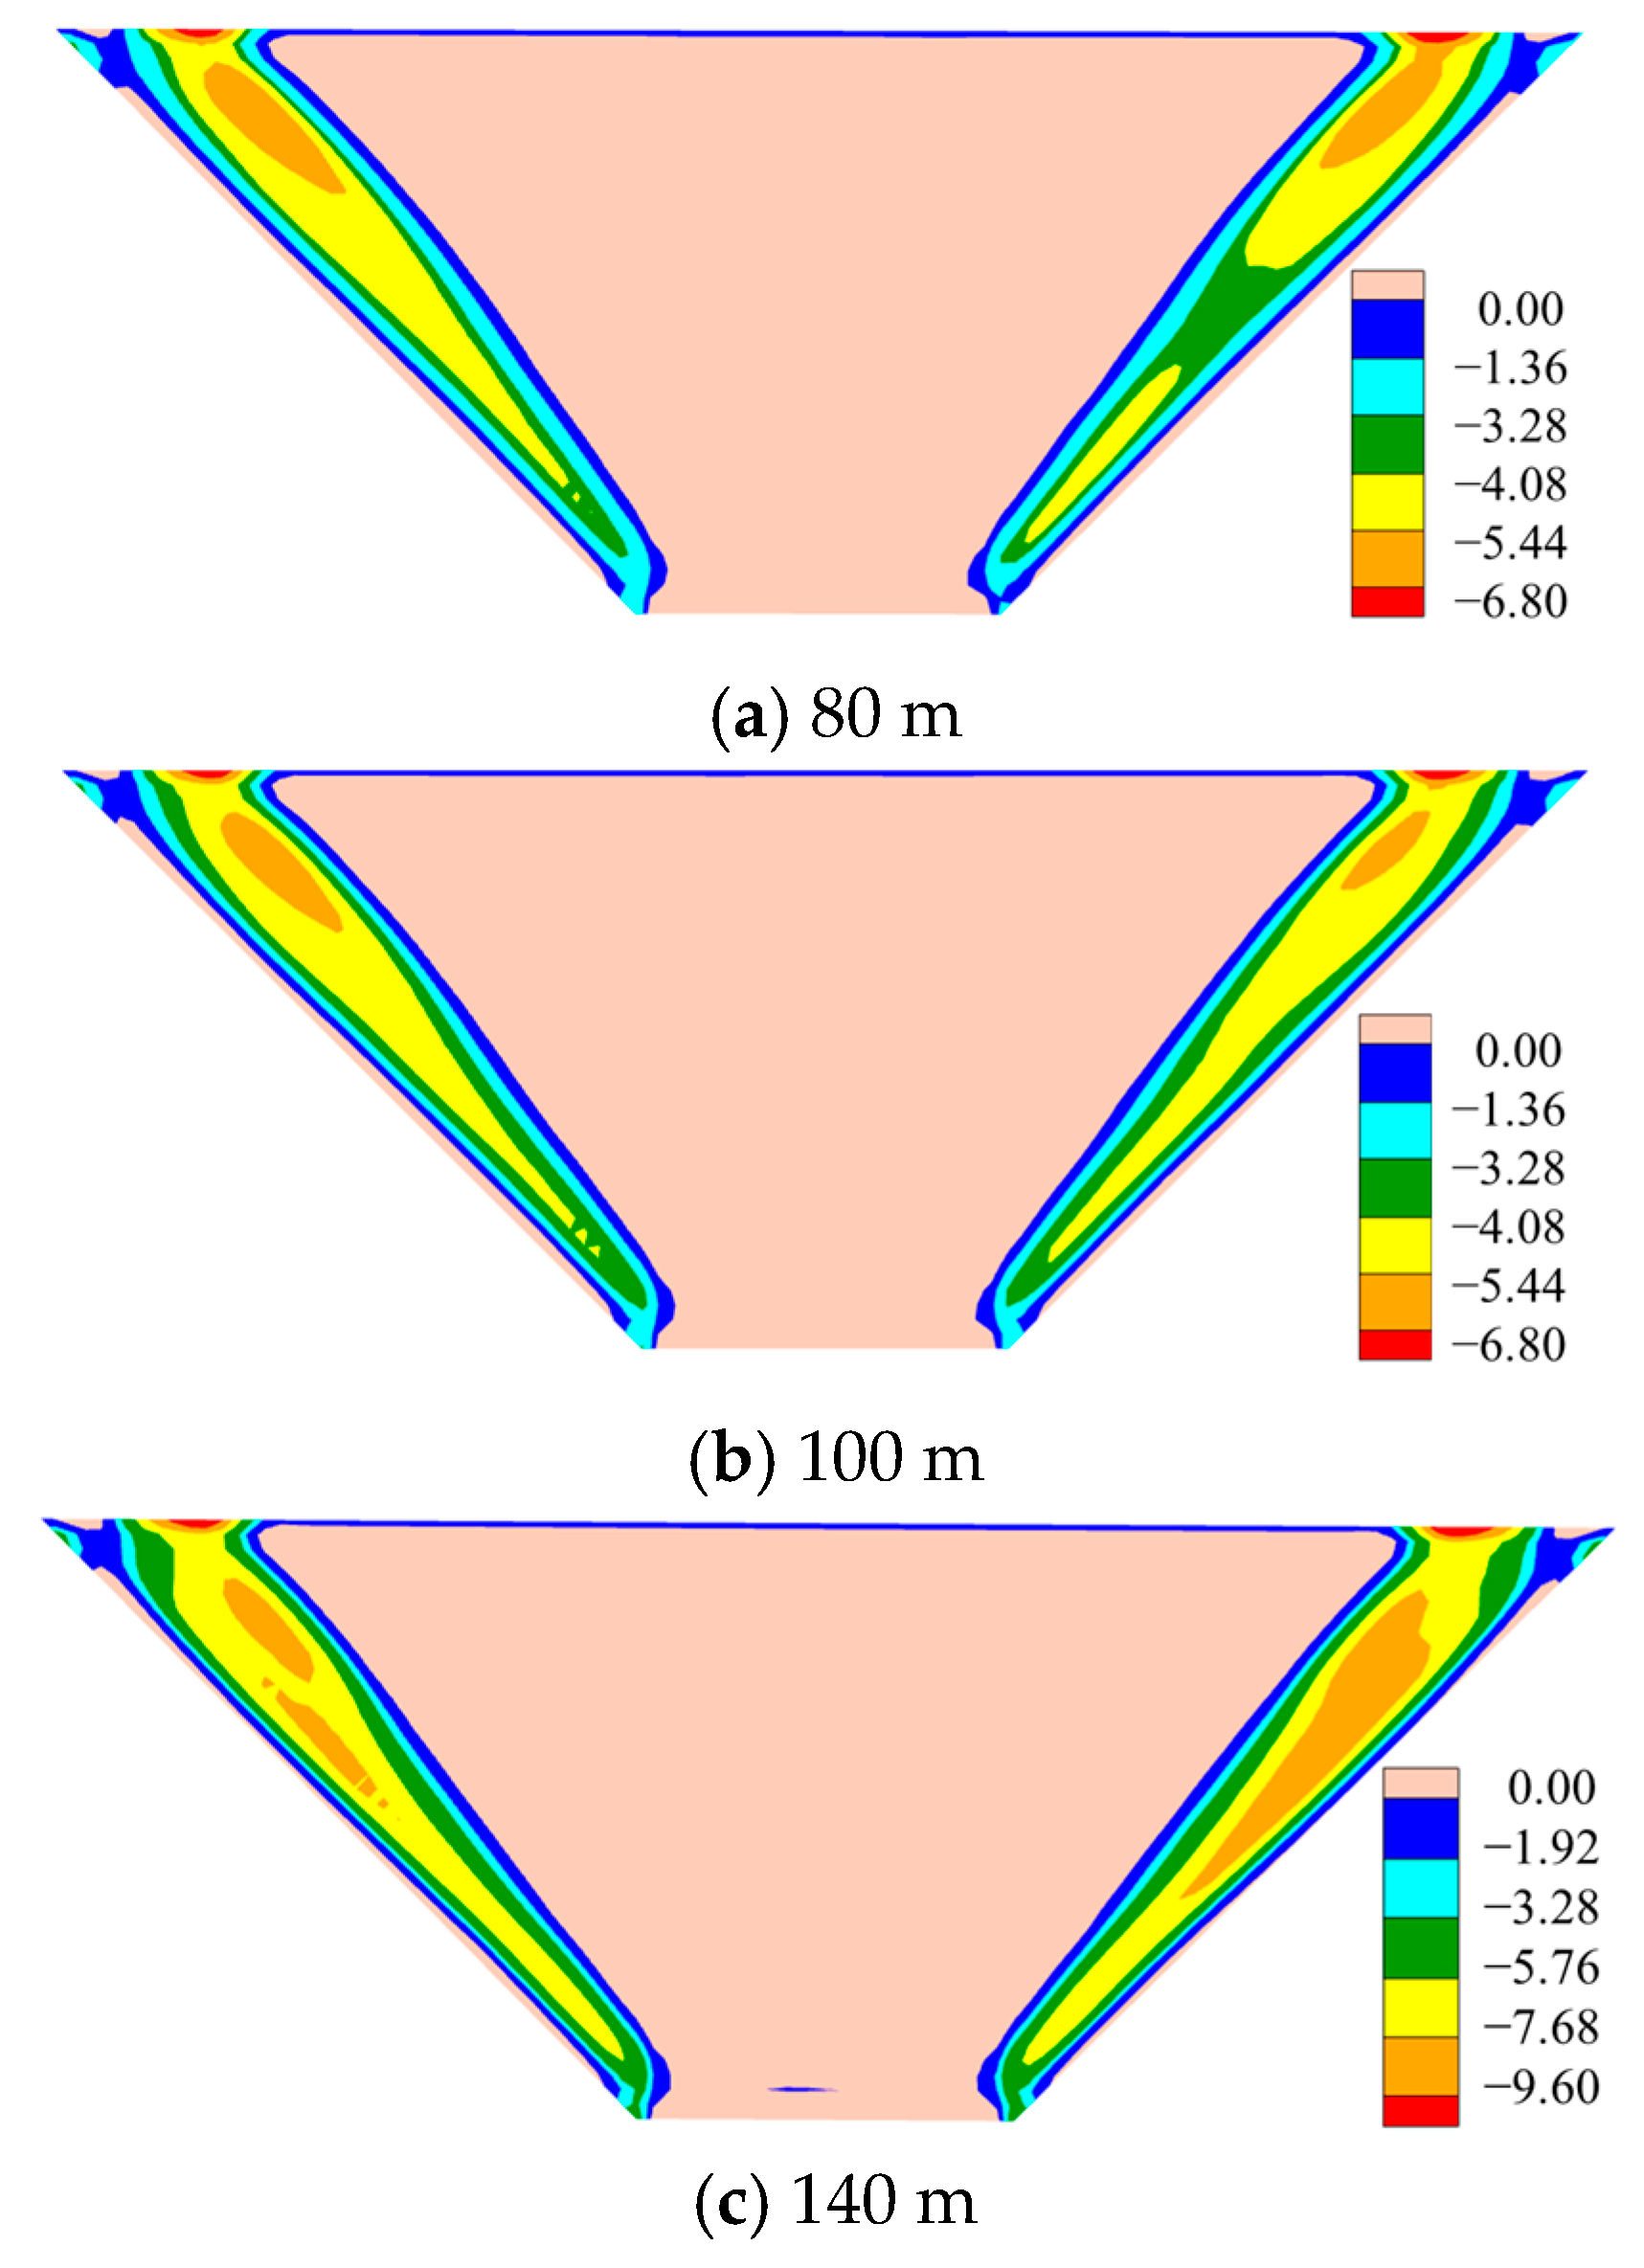
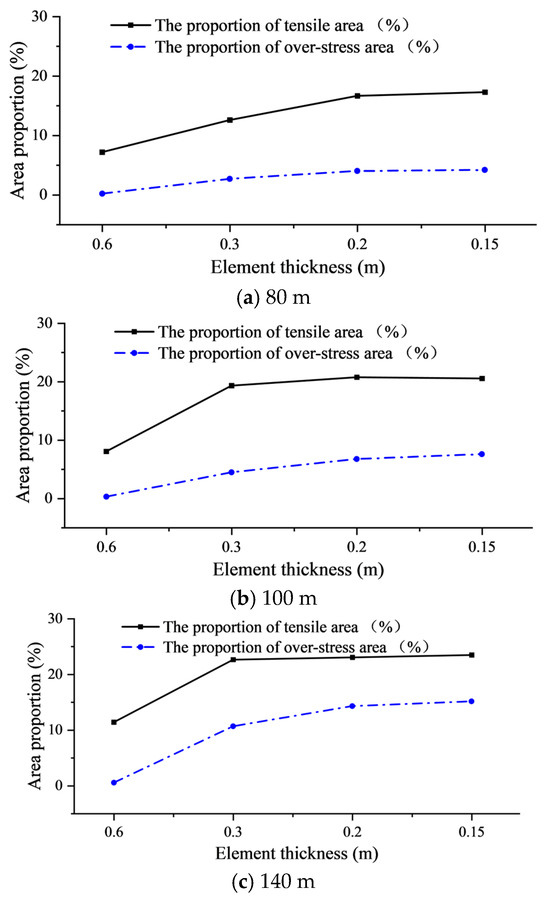
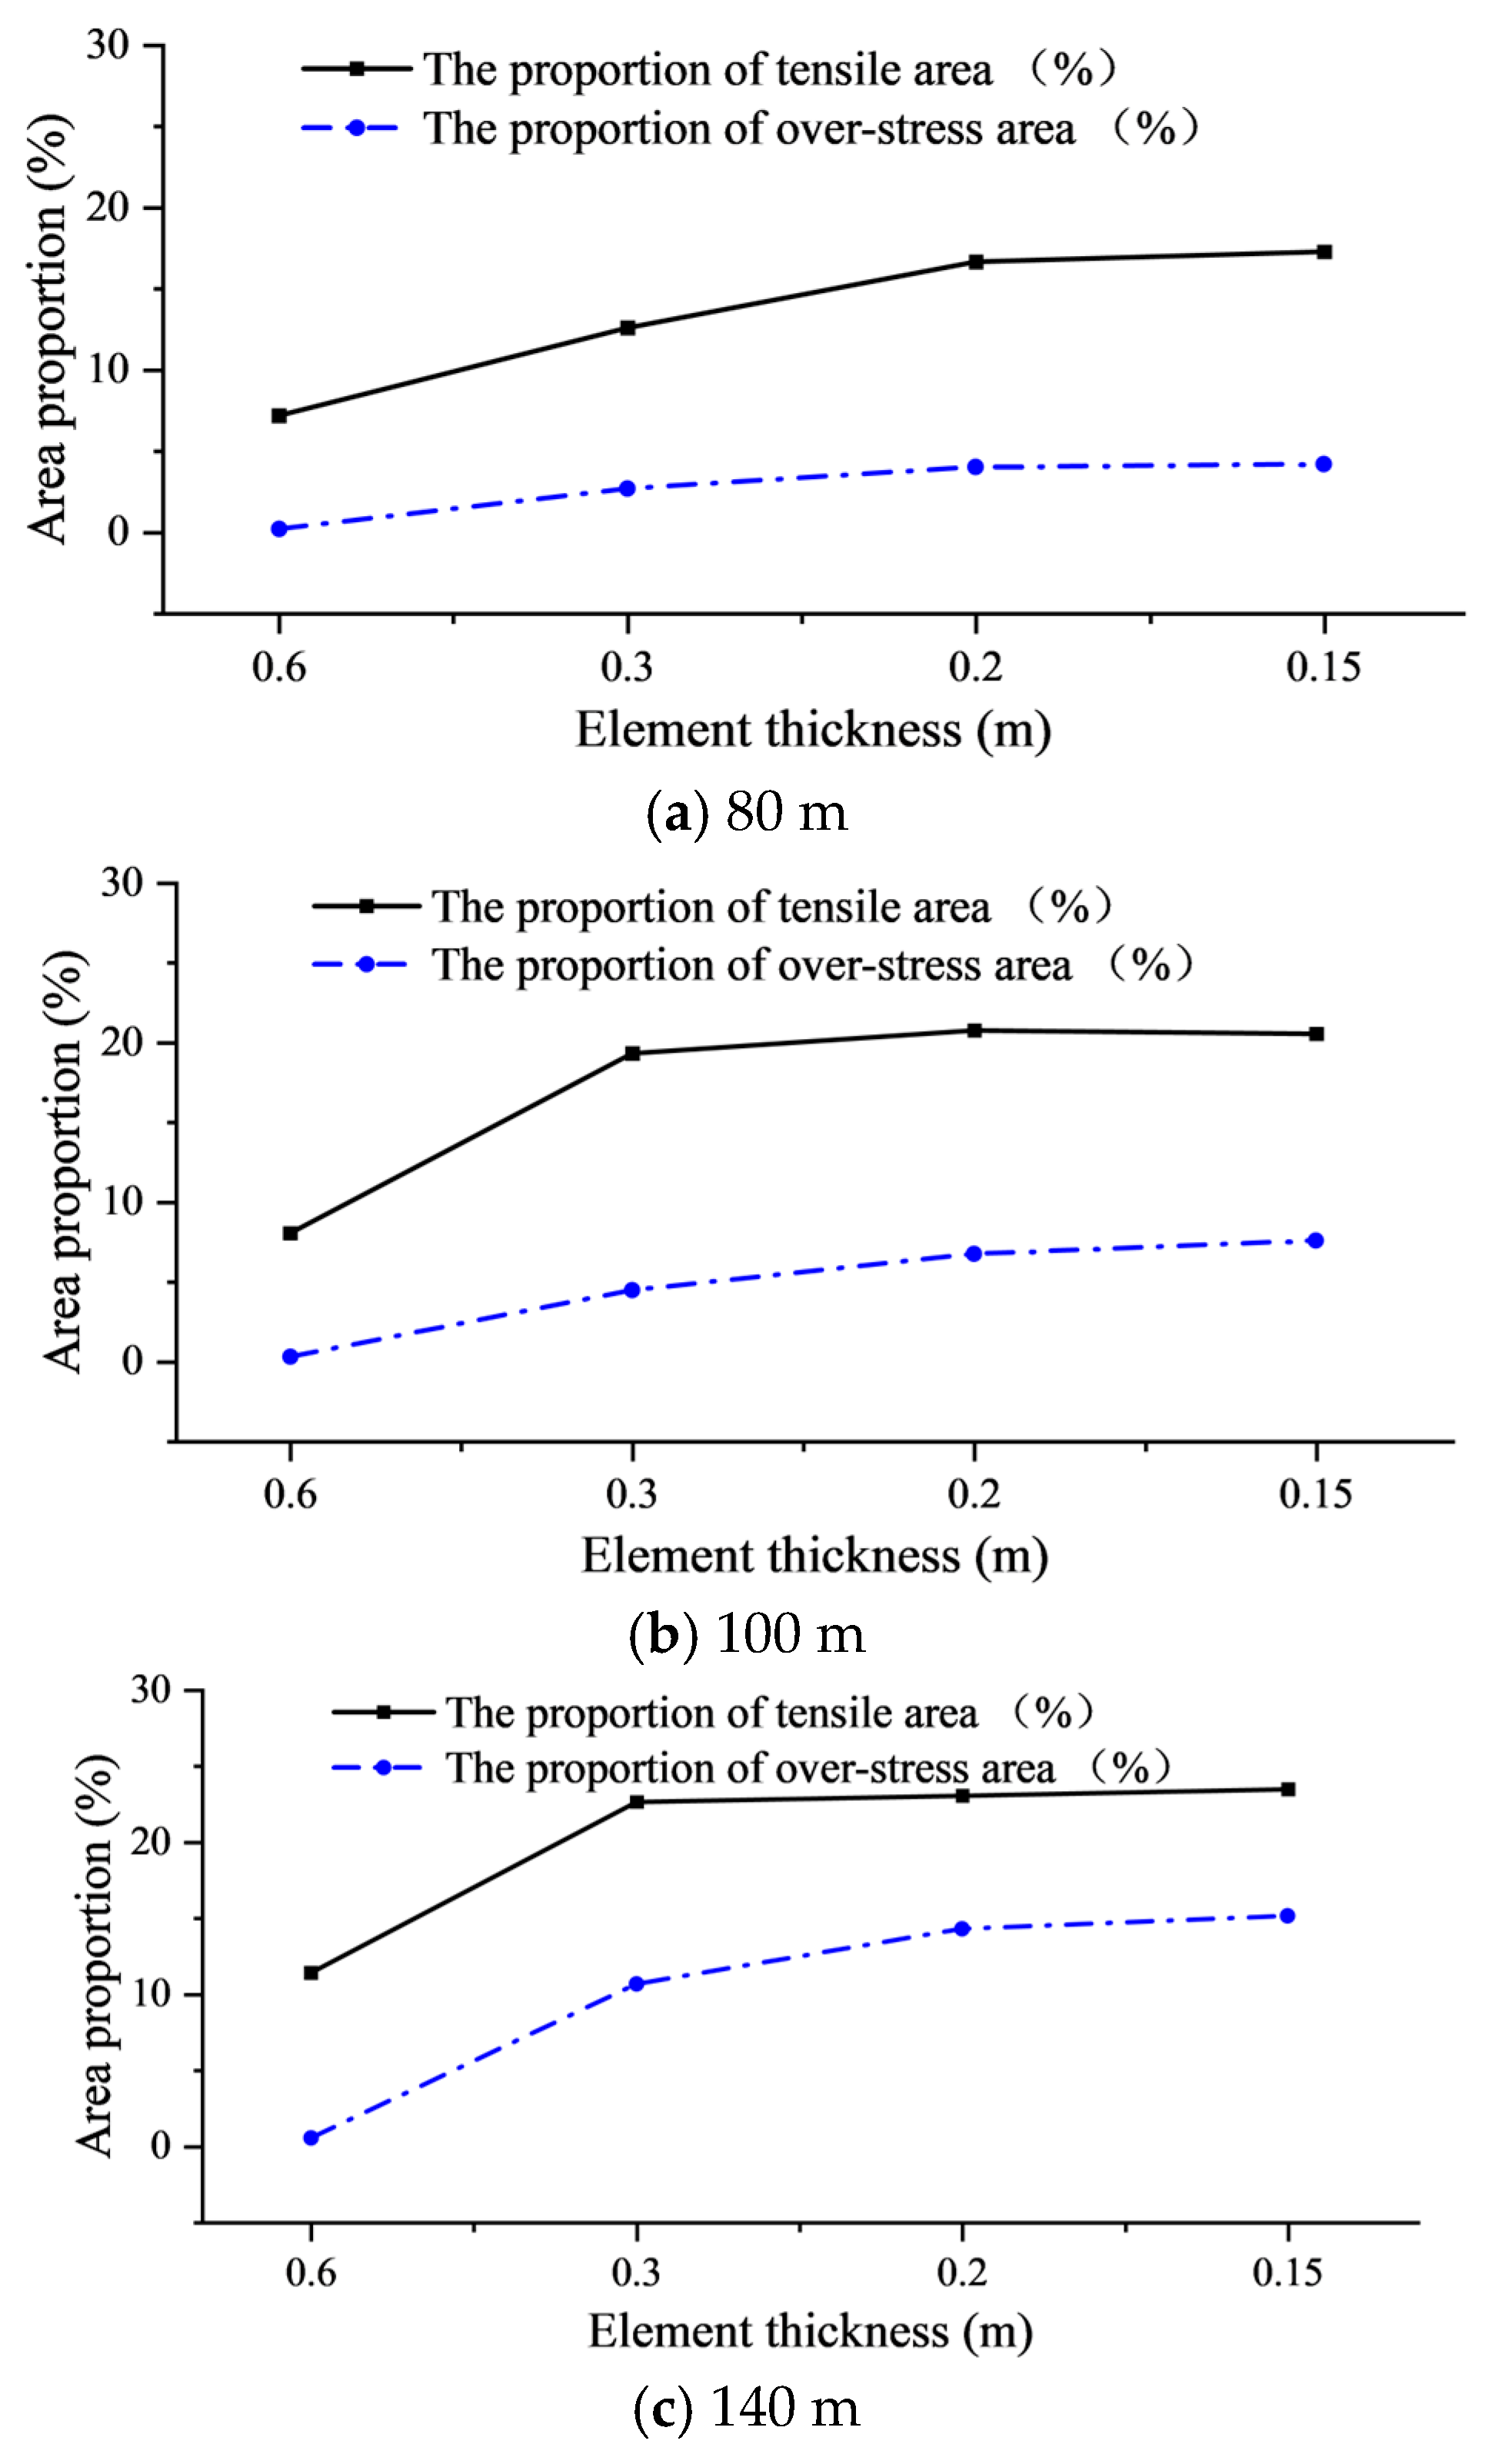
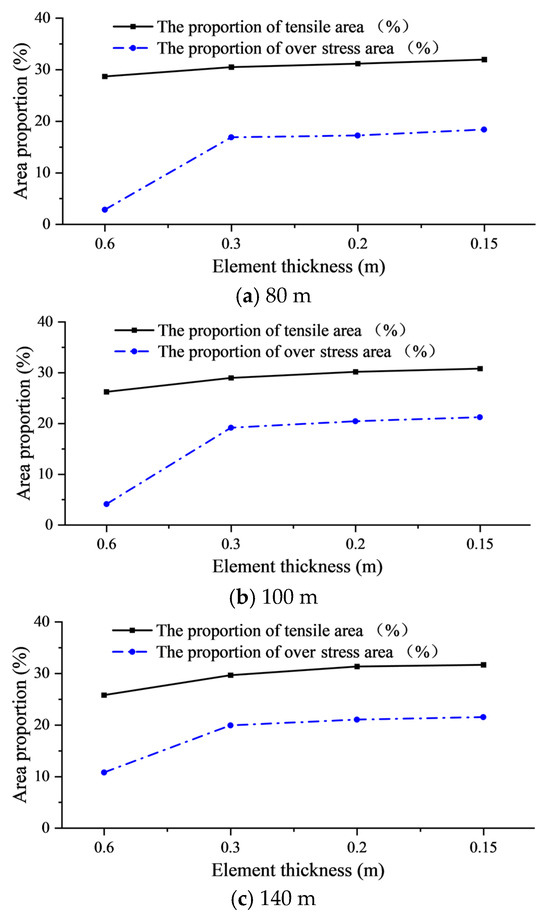
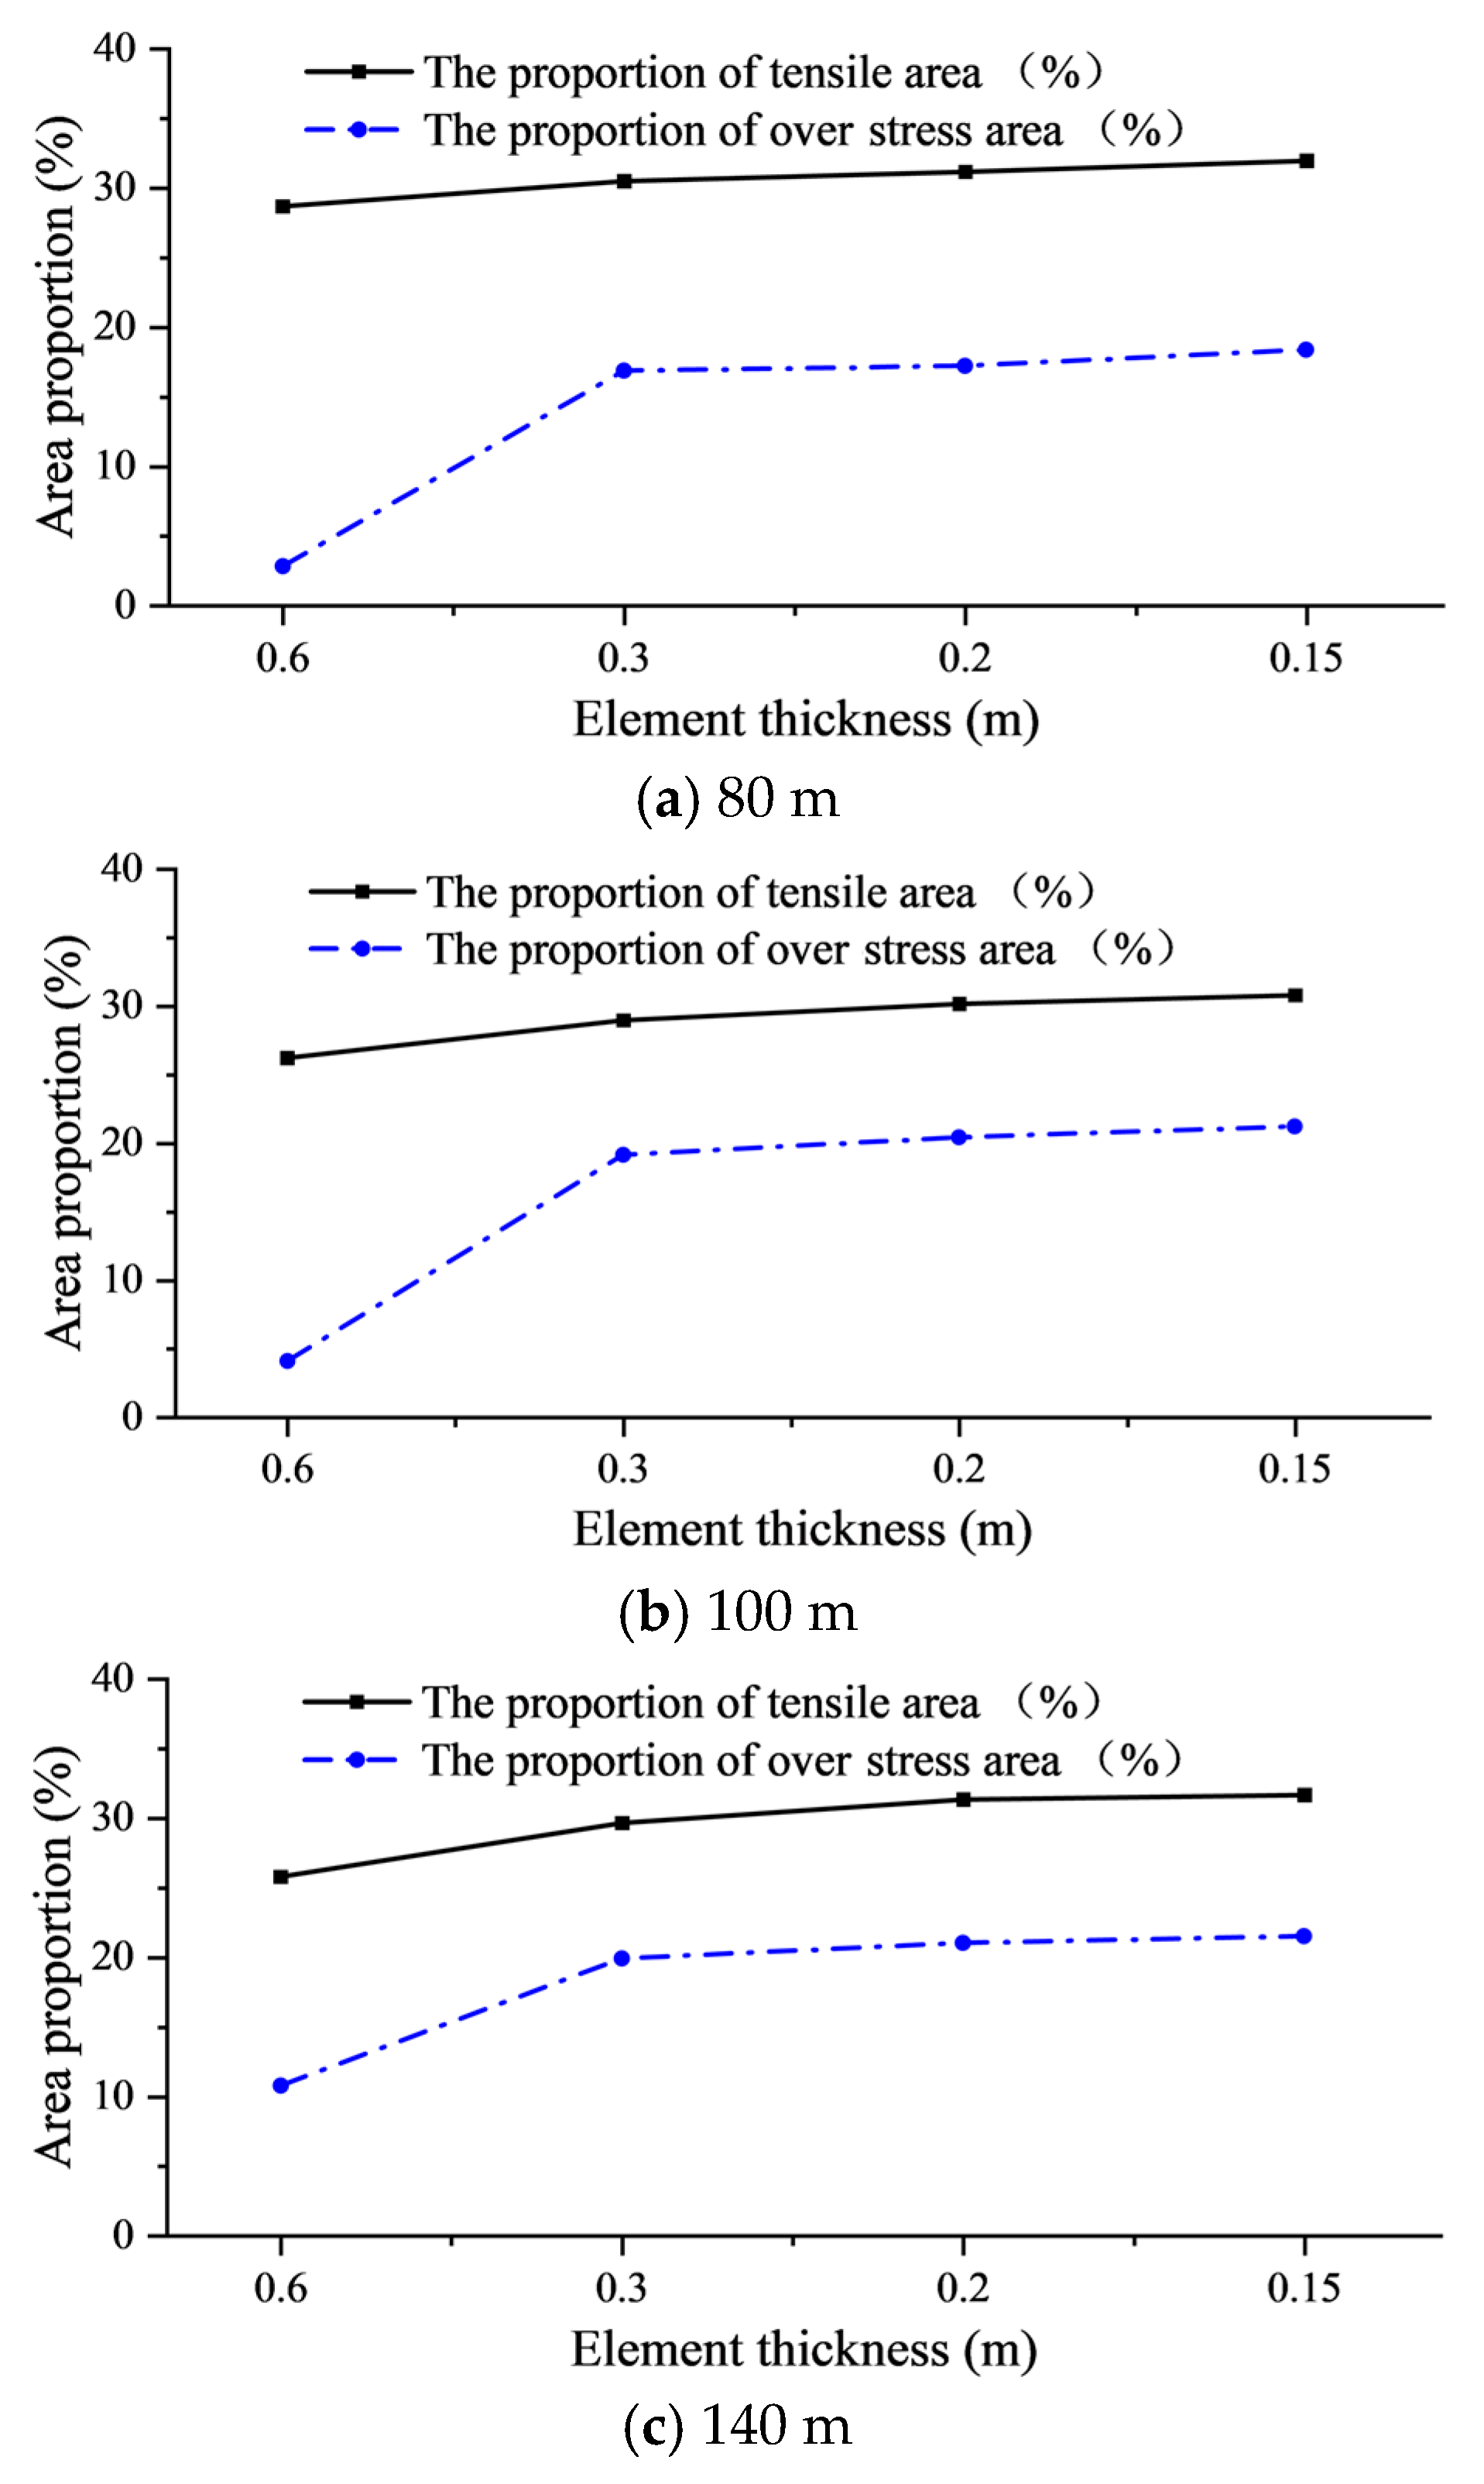
Based on the original 120 m dam height model, three additional conditions with dam heights of 80 m, 100 m, and 140 m were established by solely varying the dam height. Figure 16 and Figure 17 illustrate the tensile stress distribution under the full-reservoir condition and seismic loading across these configurations. Regardless of static or seismic action, the peak position of tensile stress is always stable at the top of the wall on both sides of the downstream side to 1/3 of the wall height, which proves that this area is an inherently weak area. Increasing the dam height exhibits a pronounced amplification of peak tensile stress at the downstream face, a trend persistent under seismic excitation. This demonstrates heightened tensile severity with dam elevation, reflecting elevated seismic vulnerability in higher dam. Mechanistically, increased normal pool elevation elevates upstream hydrostatic pressure on the cutoff wall while amplifying seismic inertial force. The combined action exacerbates downstream streamwise deformation and bending curvature, intensifying tensile stress development. Figure 18 (full reservoir) and Figure 19 (seismic) reveal mesh sensitivity in tensile stress identification. Both the tensile area ratio and overstress area ratio increase with dam height. Coarse meshing (0.6 m) fails to detect a meaningful overstress region, particularly in lower-height conditions (Figure 19a,b), where it completely misses critical damage-prone zones downstream, severely underestimating latent risks. In contrast, the 4-layer mesh (0.3 m) shows a step-by-step recognition capability improvement. The identification ability of the overstress area under earthquake is 500%, 400% and 100% higher than that of the 2-layer wall for 80 m/100 m/140 m dams, respectively. The element thickness of 0.3 m can effectively capture the tension and compression stress transition caused by the bending of the wall, while the coarse grid leads to stress homogenization due to excessive element stiffness. It is worth noting that the 4-layer mesh is close to the convergence state, and the difference between the tensile area and the overstress area under earthquake is less than 6% compared with the denser mesh (6/8 layers), which proves that it has the optimal balance between accuracy and efficiency. Notably, while dam height modifies tensile stress magnitude and spatial extent, the fundamental distribution pattern remains unaltered.
Figure 16.
Distribution of minor principal stress on the downstream under full reservoir (MPa).
Figure 17.
Distribution of minimum minor principal stress on the downstream under seismic loading for different dam heights (MPa).
Figure 18.
Tensile area ratio on the downstream side of the cutoff wall under full-reservoir conditions for different dam heights.
Figure 19.
Variation of tensile area ratio and overstress area ratio on the downstream side of the cutoff wall under seismic loading for different dam heights.
3.2.2. The Effect of Overburden Parameter
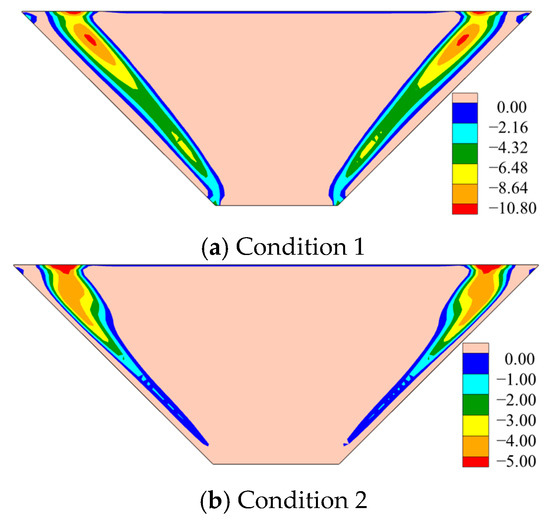
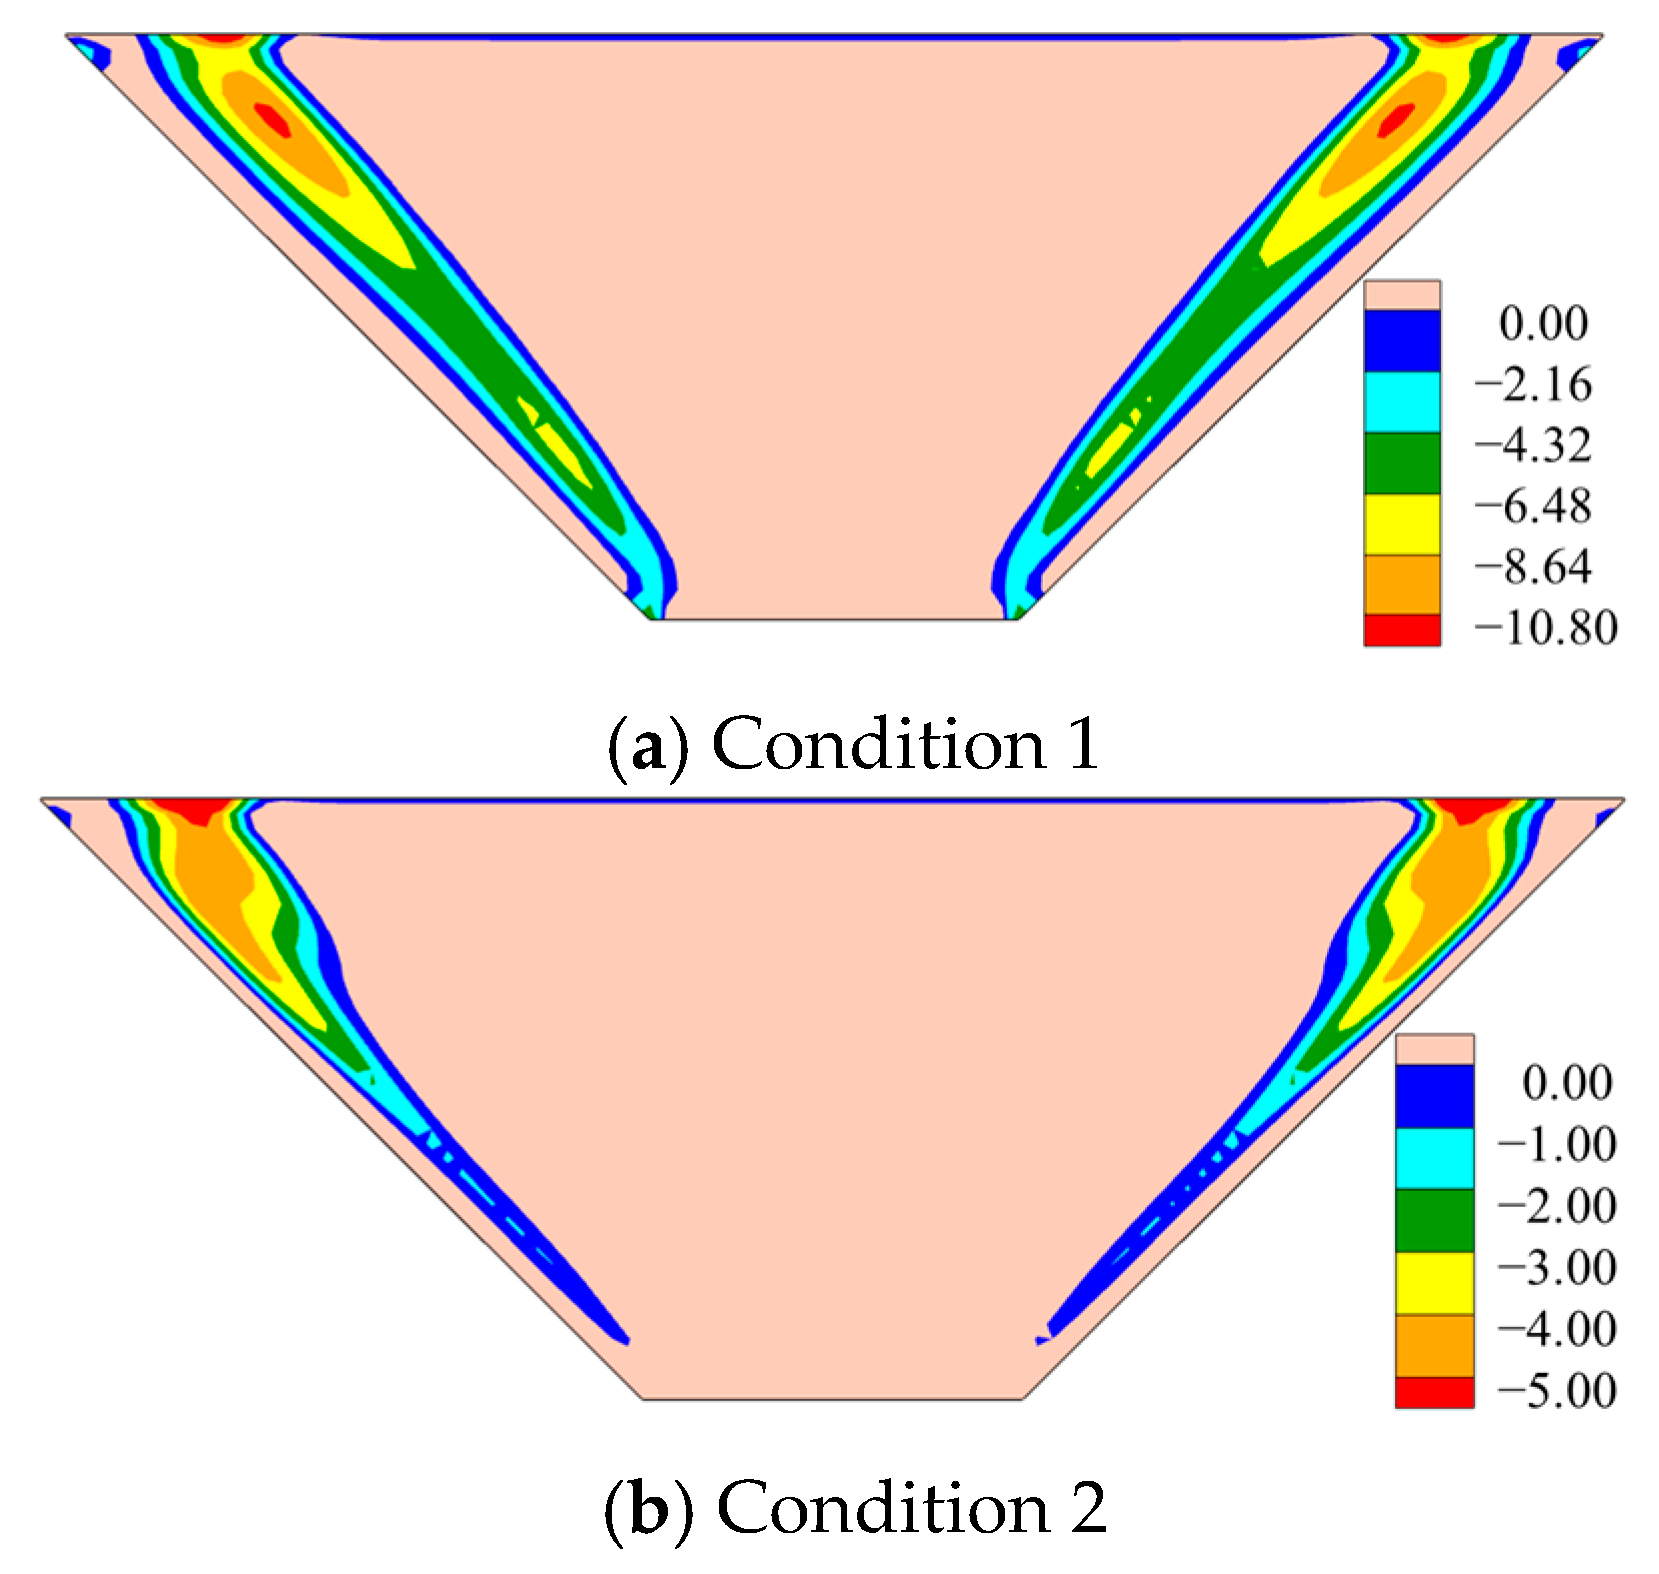
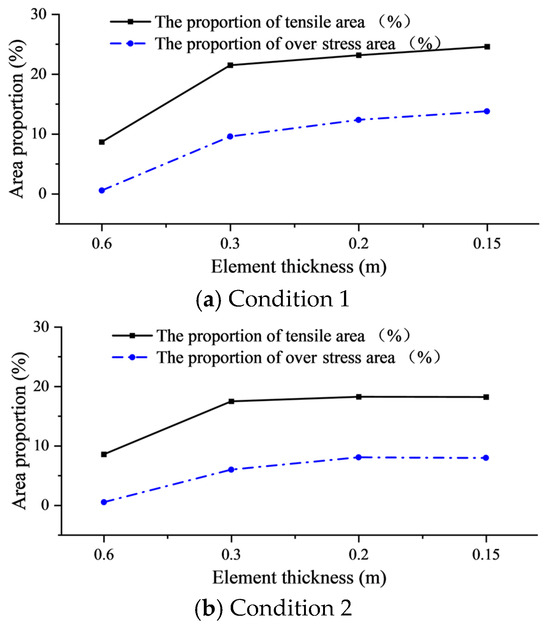
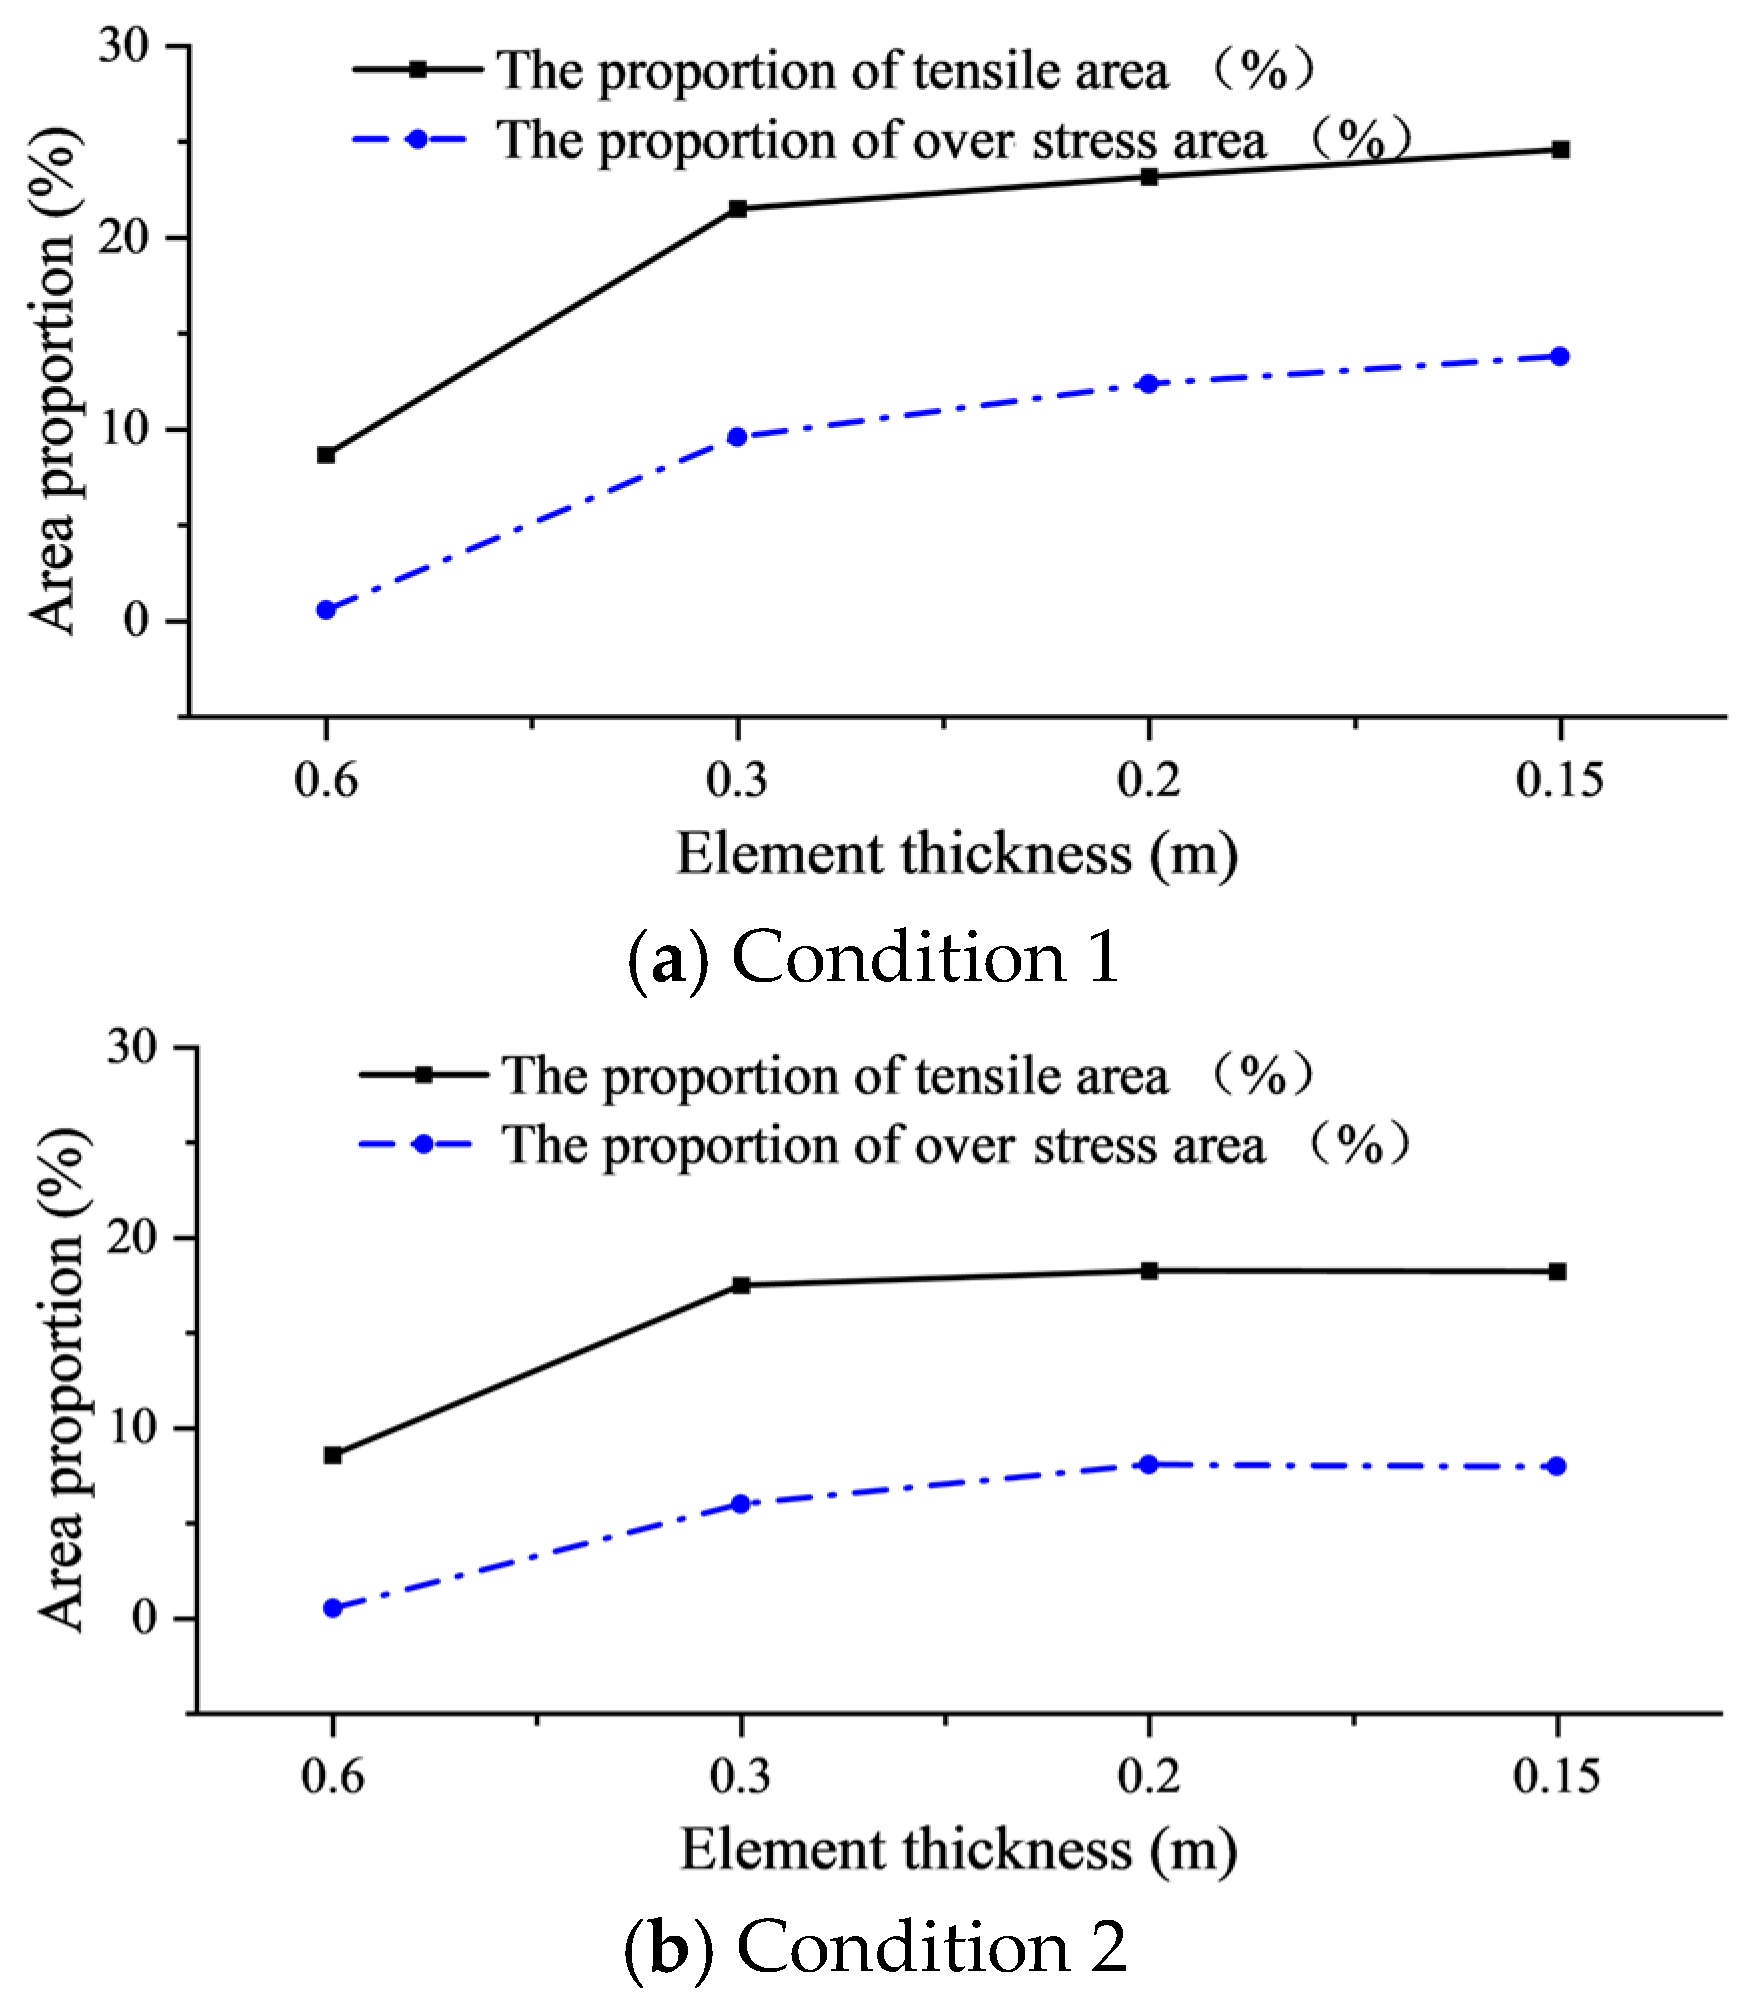
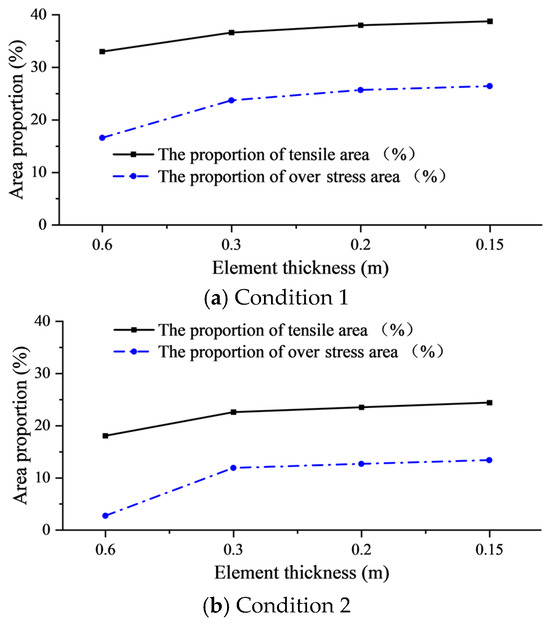
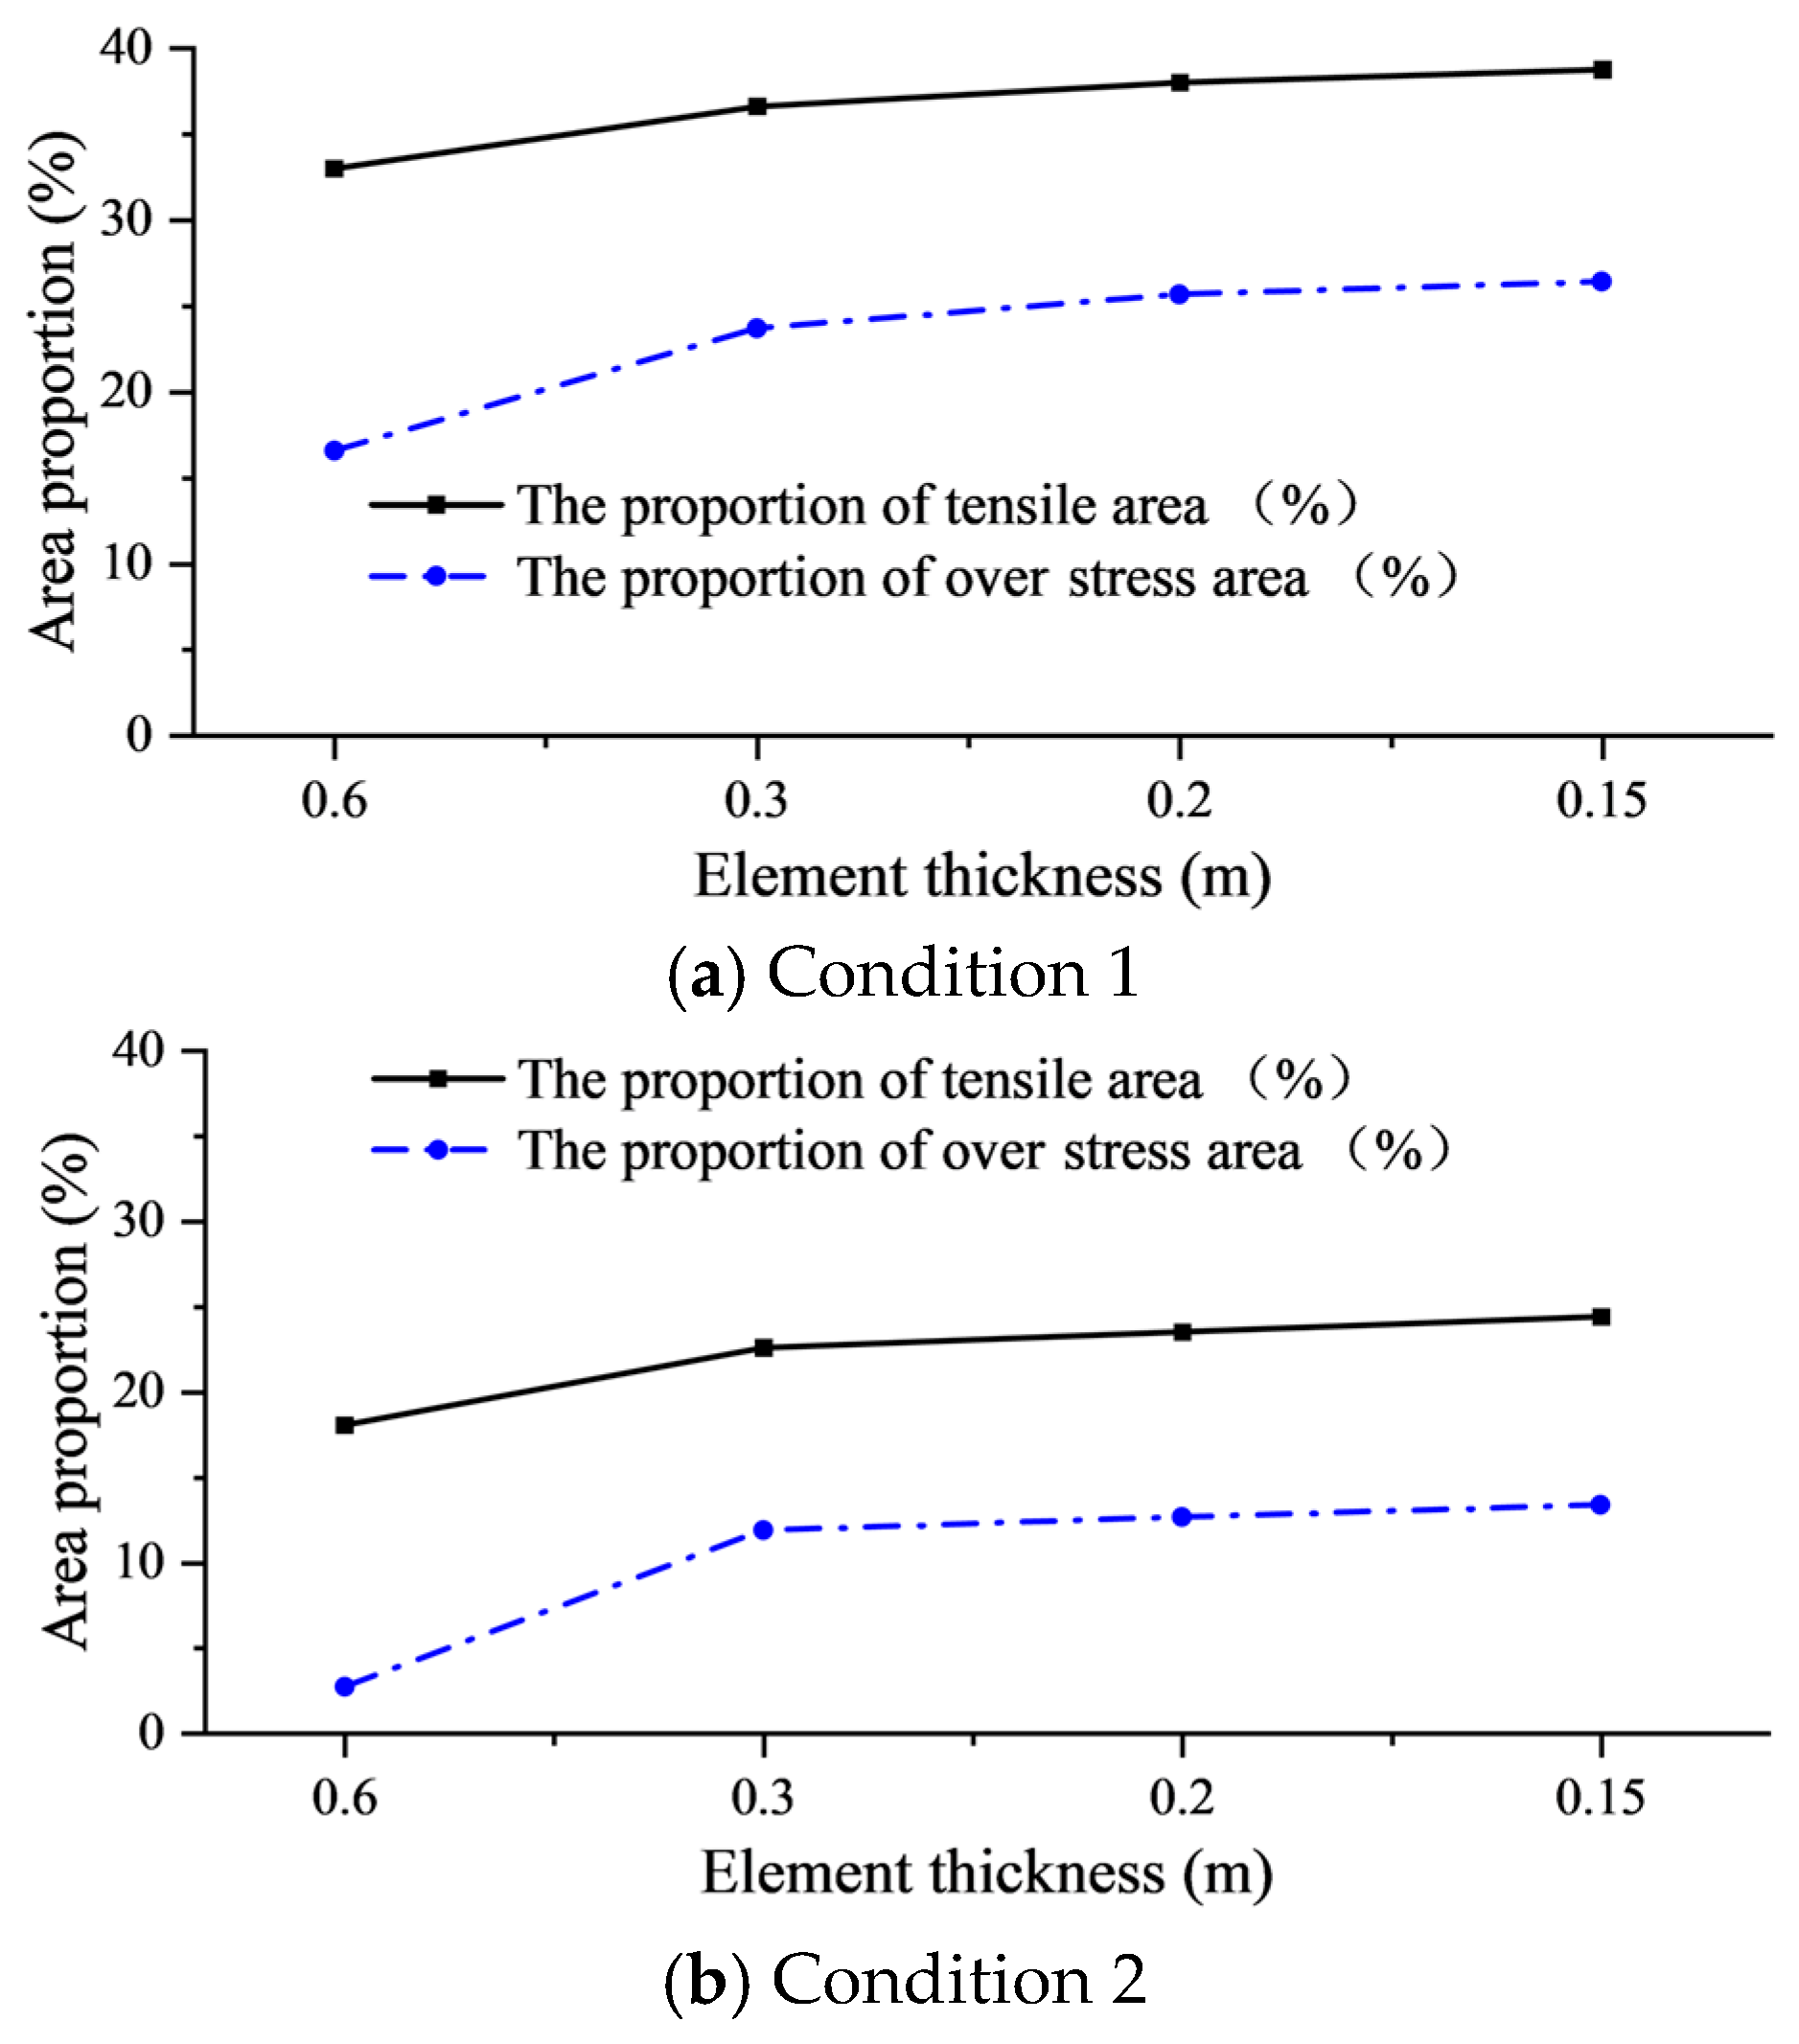
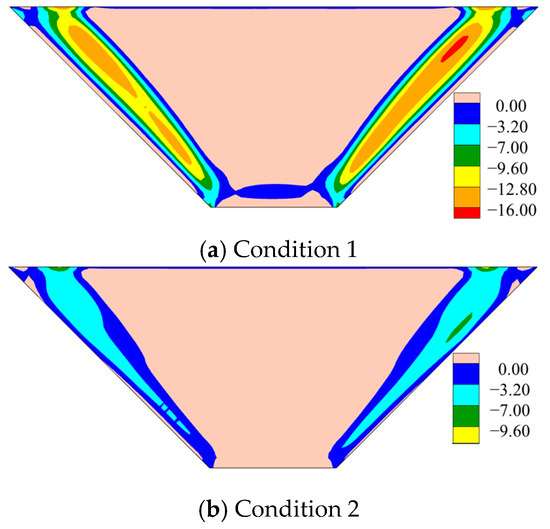
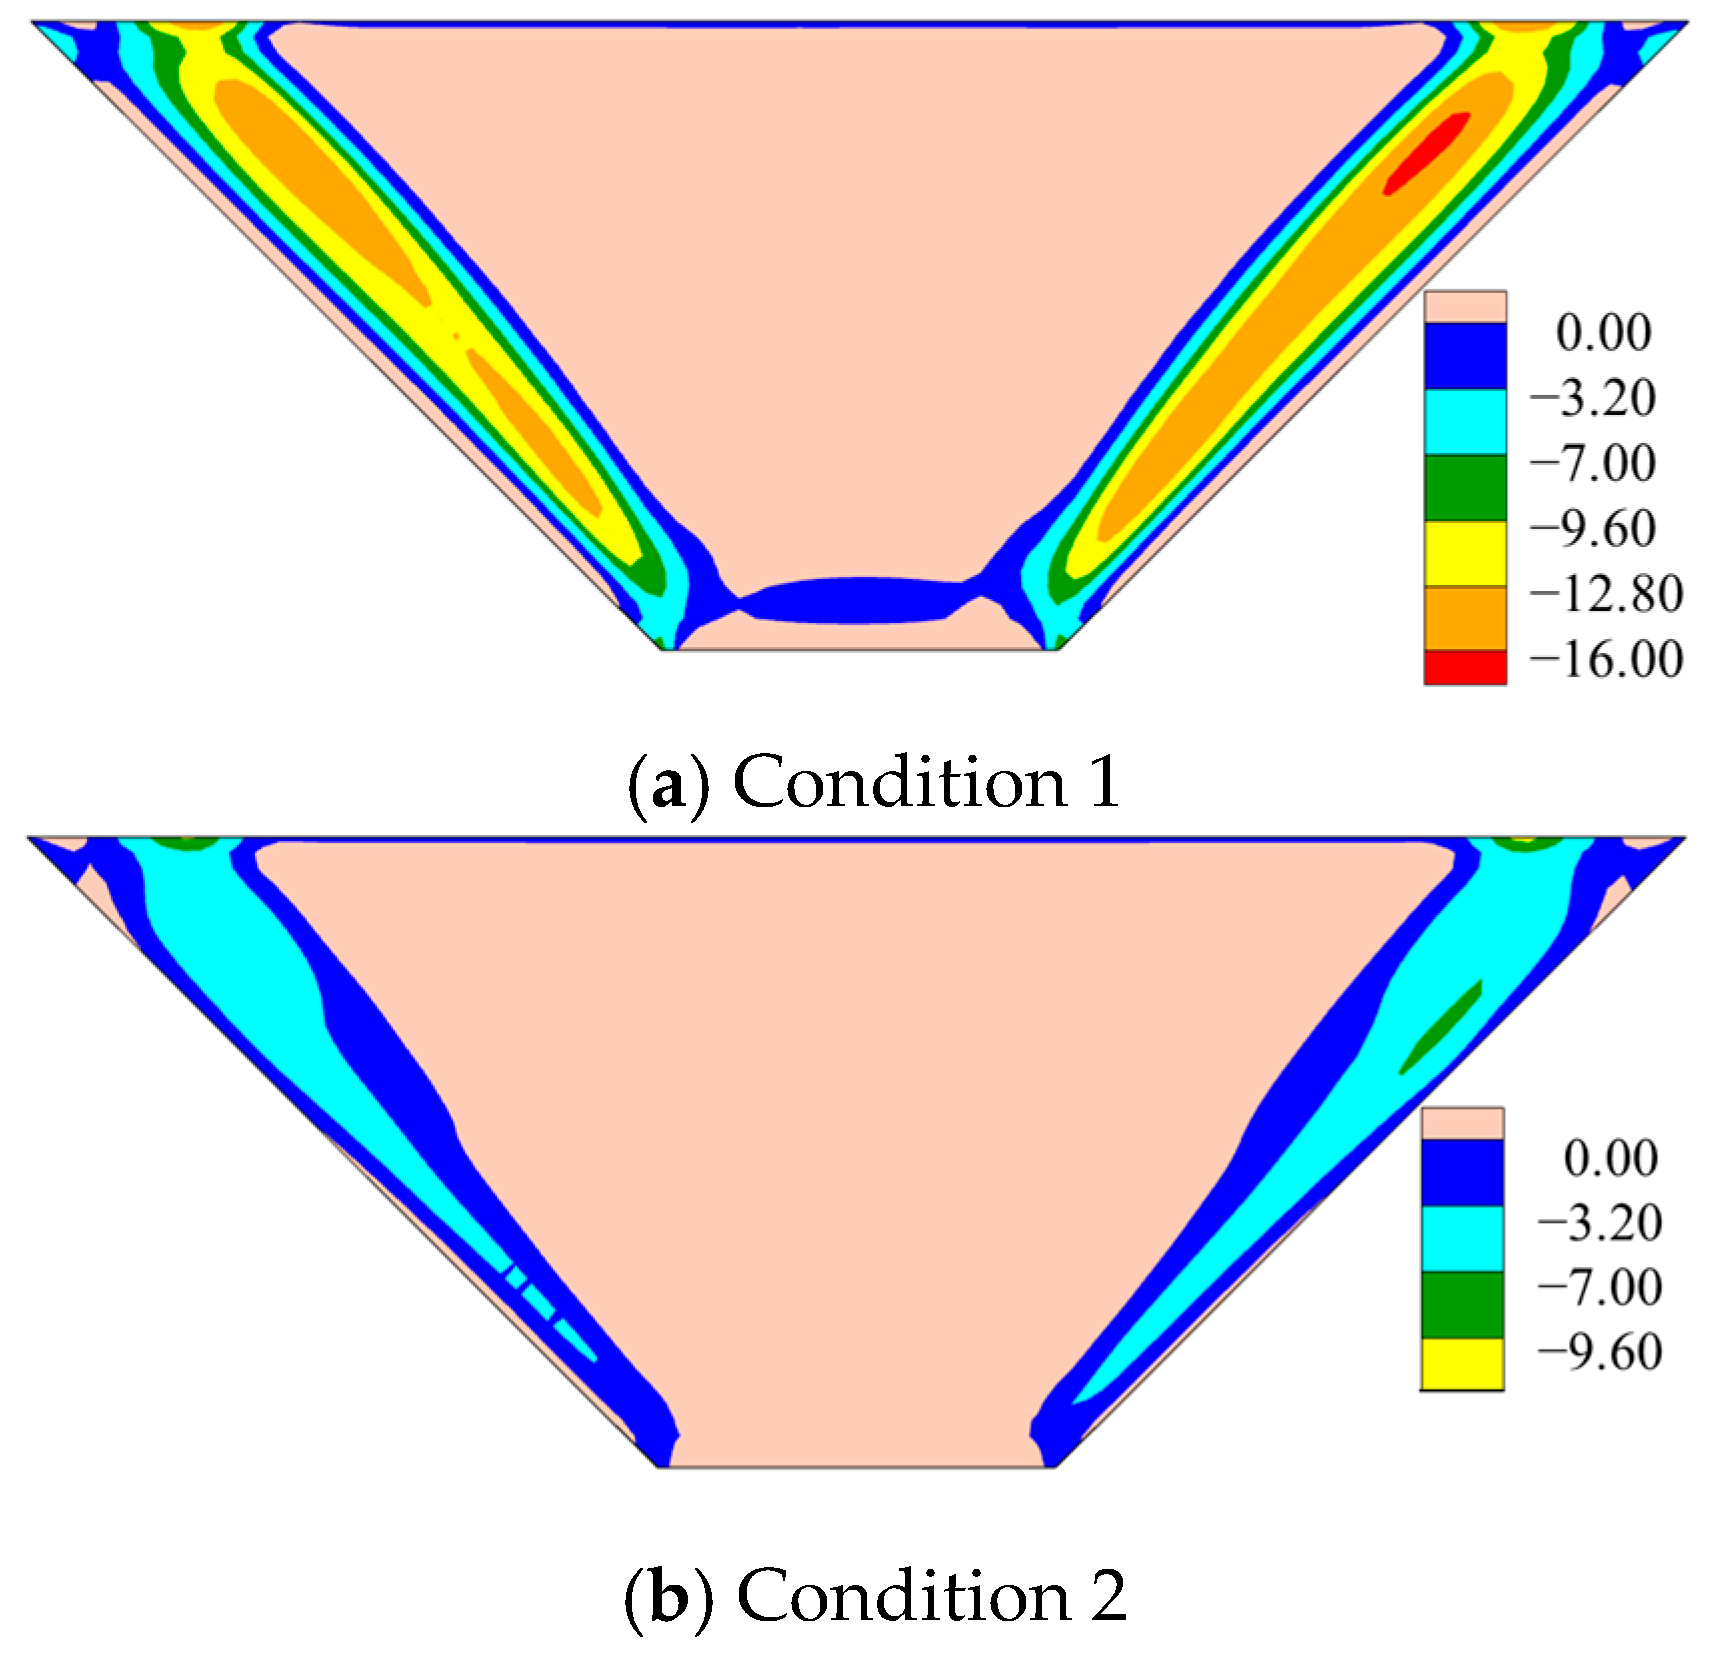
The deformation of the overburden soil is mainly controlled by its modulus. For this reason, different modulus conditions are set up, and the modulus coefficient is reduced by one time (condition 1) and doubled (condition 2) for sensitivity analysis. After changing the modulus, the distribution of the small principal stress of the cutoff wall at full reservoir is shown in Figure 20. With the decrease in the modulus coefficient of the overburden soil, the peak tensile stress of the wall increases from 5.00 MPa to 10.80 MPa. This trend persists under seismic loading. Peak tensile stress rises from 7.00 MPa to 16.00 MPa as the modulus decreases, confirming heightened seismic vulnerability in weaker foundations. Mechanistically, a lower modulus increases soil deformability, amplifying streamwise deformation of the cutoff wall. This exacerbates wall bending curvature, intensifying tensile stress development. Figure 21 and Figure 22 are the tensile stress range of the downstream side of the cutoff wall under different working conditions. Figure 23 shows the distribution of the minimum minor principal stress on the downstream face under seismic loading for different overburden modulus conditions. The lower the modulus coefficient of the overburden soil is, the stronger the tensile degree of the downstream side is. When the full storage period is divided into 4 layers, the tensile area of the cutoff wall is more than 100% as large as that of the 2 layers. When the 2 layers are divided, the ratio of the overstress area of working condition 1 and working condition 2 is 0.56% and 0.53%, respectively, which is seriously distorted. The tensile stress of the 4-layer mesh is close to convergence. Due to the change in the soil parameters of the overburden, the softness of the soil is changed, which, in turn, affects the deformation capacity of the cutoff wall, so the tensile stress value and the tensile range are also changed accordingly, but the fundamental distribution pattern remains consistent.
Figure 20.
Distribution of minor principal stress on the downstream under full reservoir for different overburden parameters (MPa).
Figure 21.
Variation of tensile area ratio and overstress area ratio on the downstream side of the cutoff wall under full-reservoir conditions for different overburden parameters.
Figure 22.
Variation of tensile area ratio and overstress area ratio on the downstream side of the cutoff wall under seismic loading for different overburden parameters.
Figure 23.
Distribution of minimum minor principal stress on the downstream under seismic loading different overburden modulus conditions (MPa).
3.3. The Effect of Cutoff Wall Subdivision Method on Deformation and Stress Characteristics
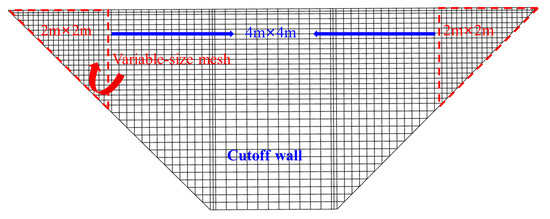
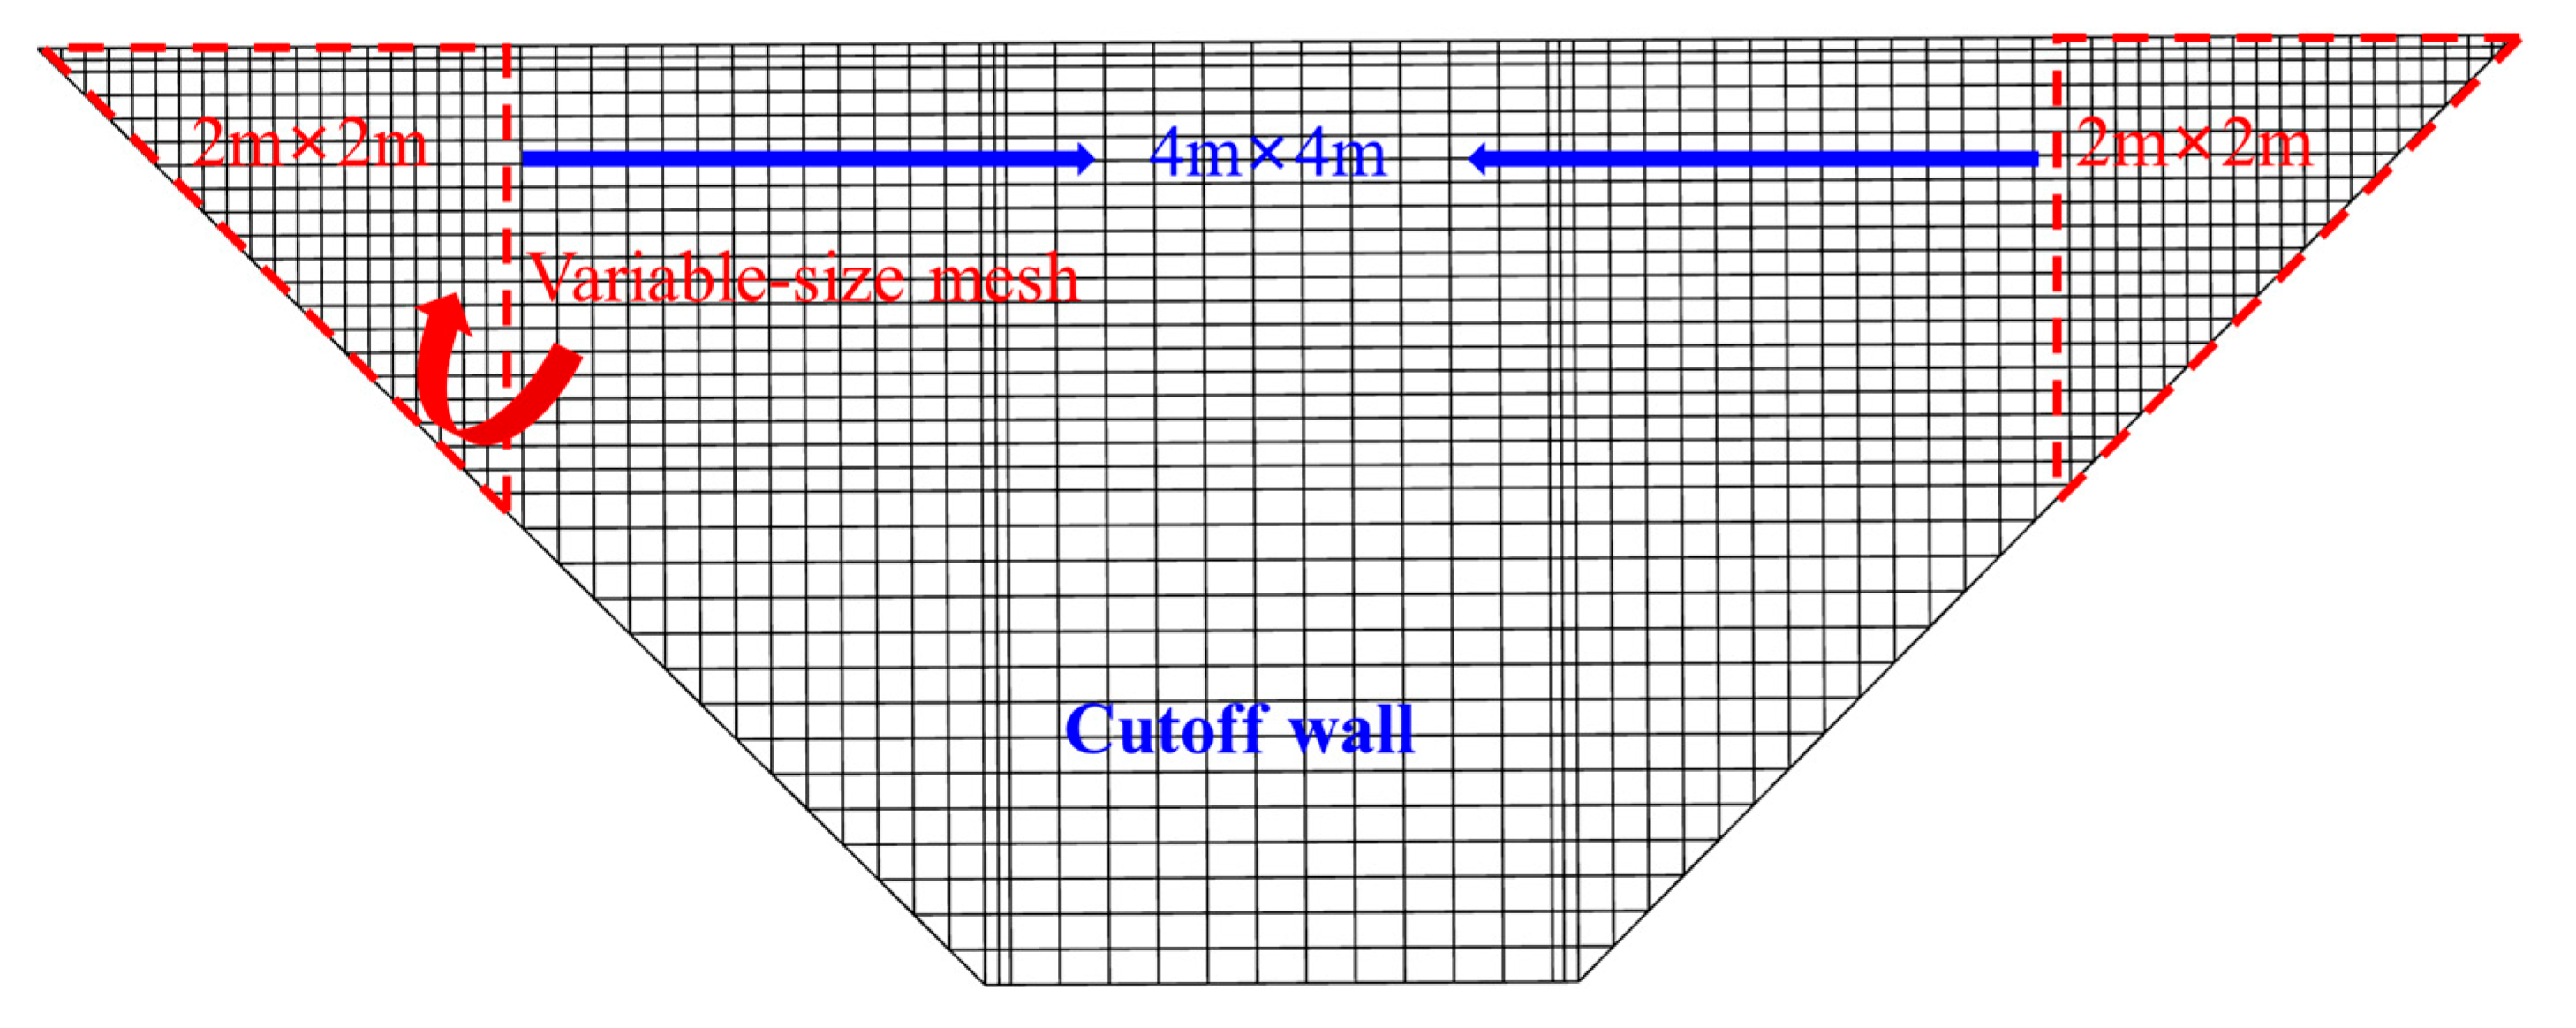
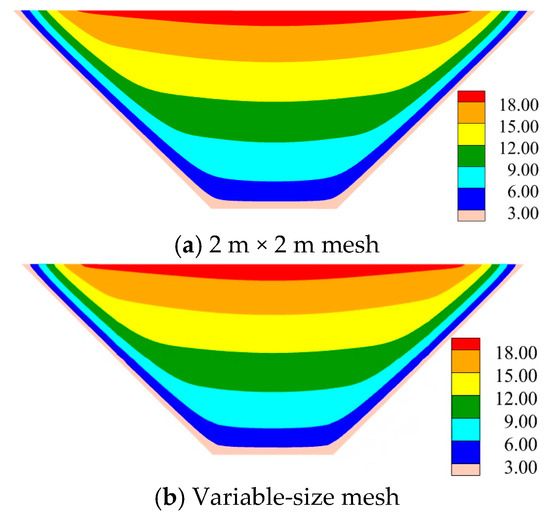
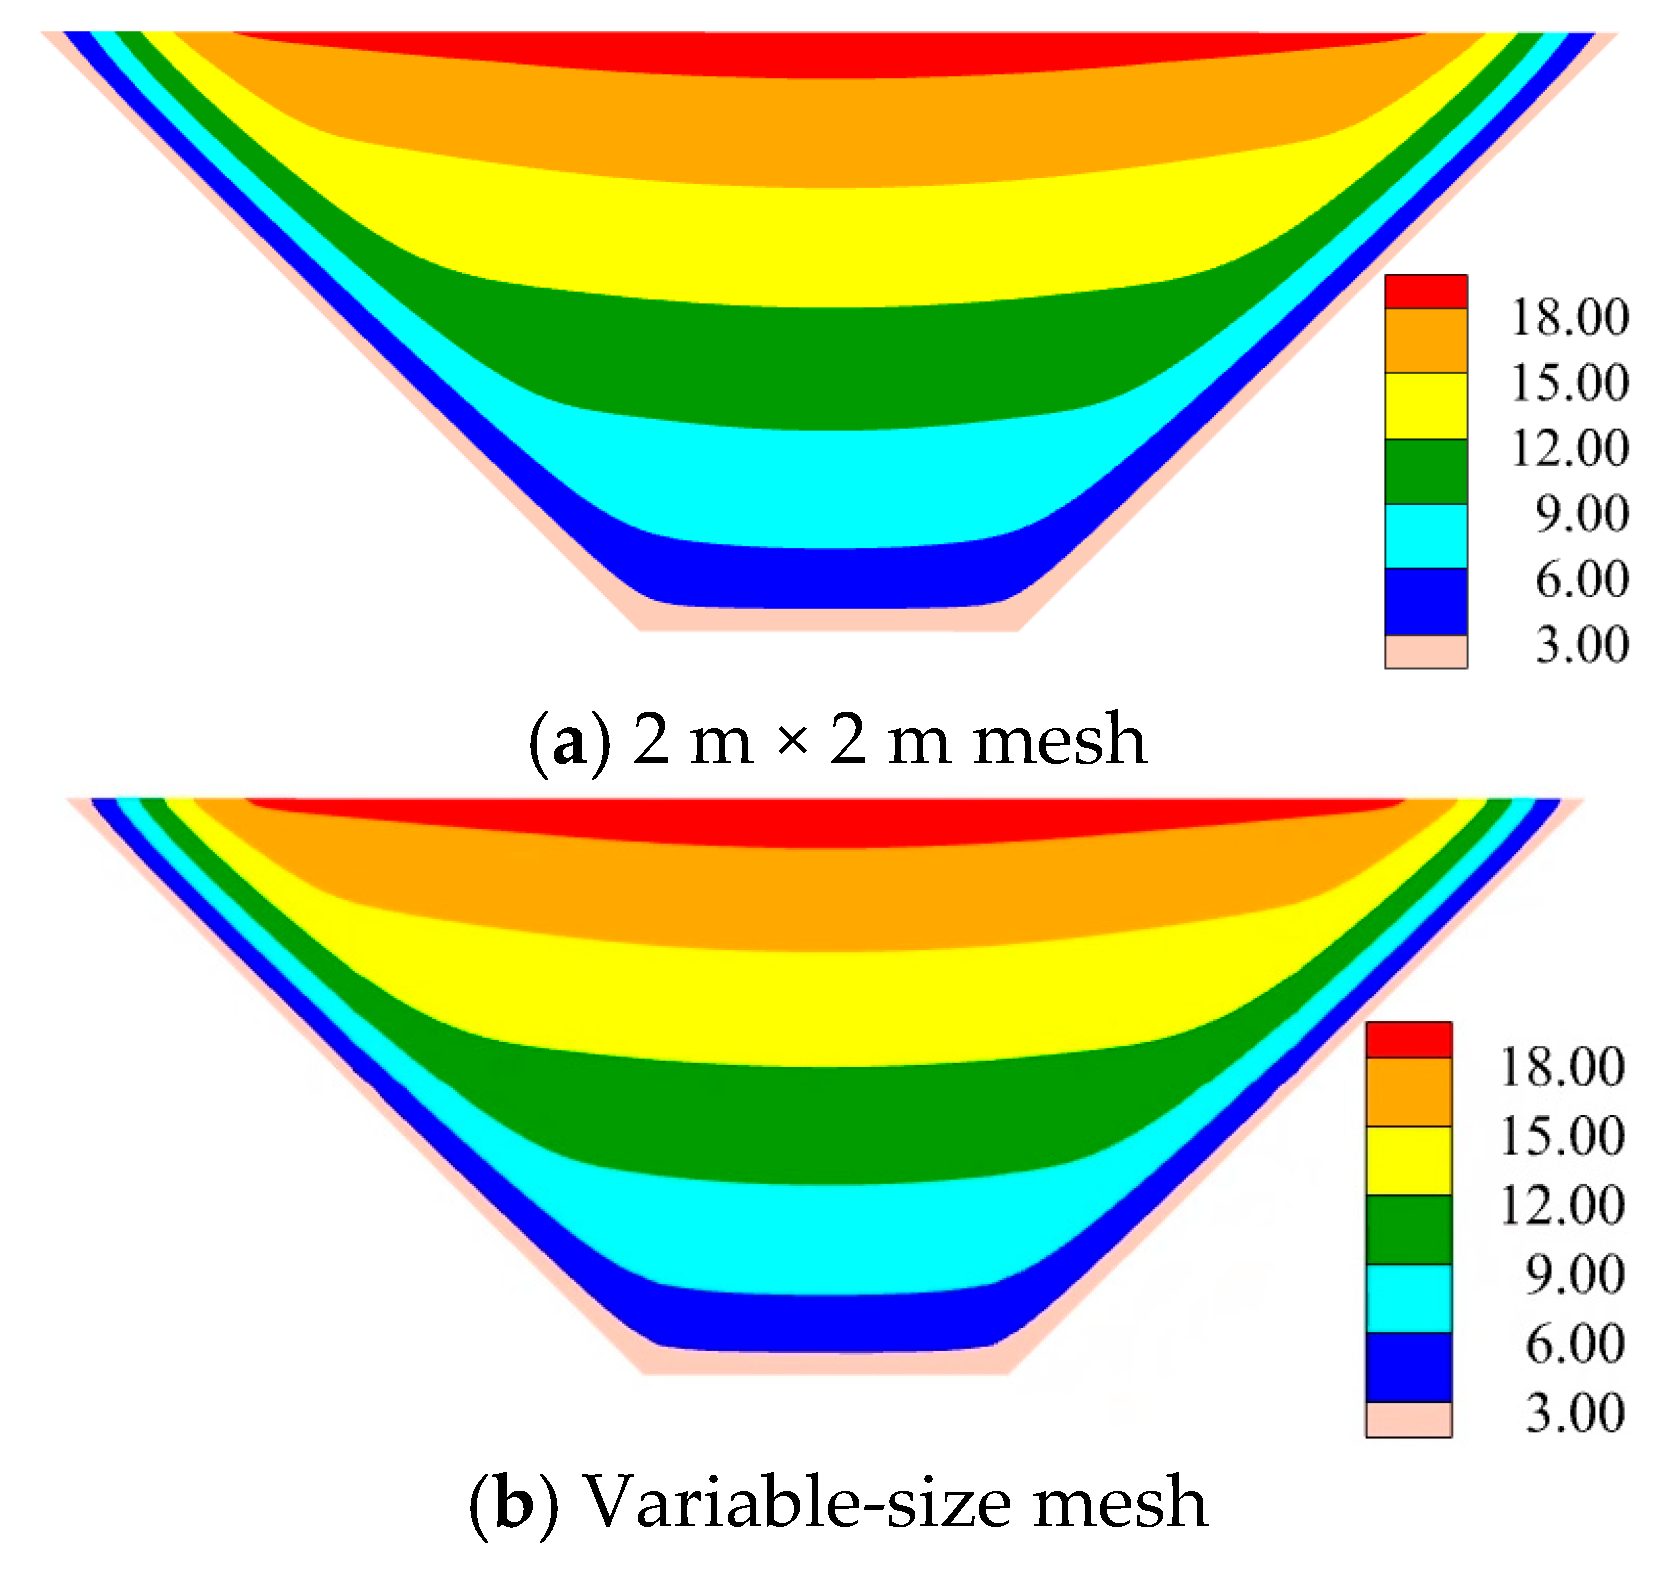
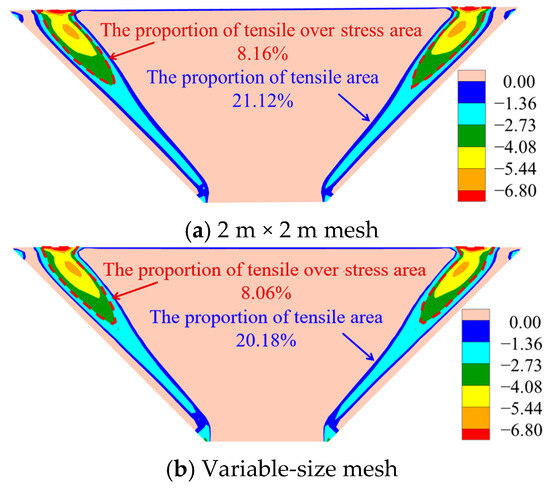
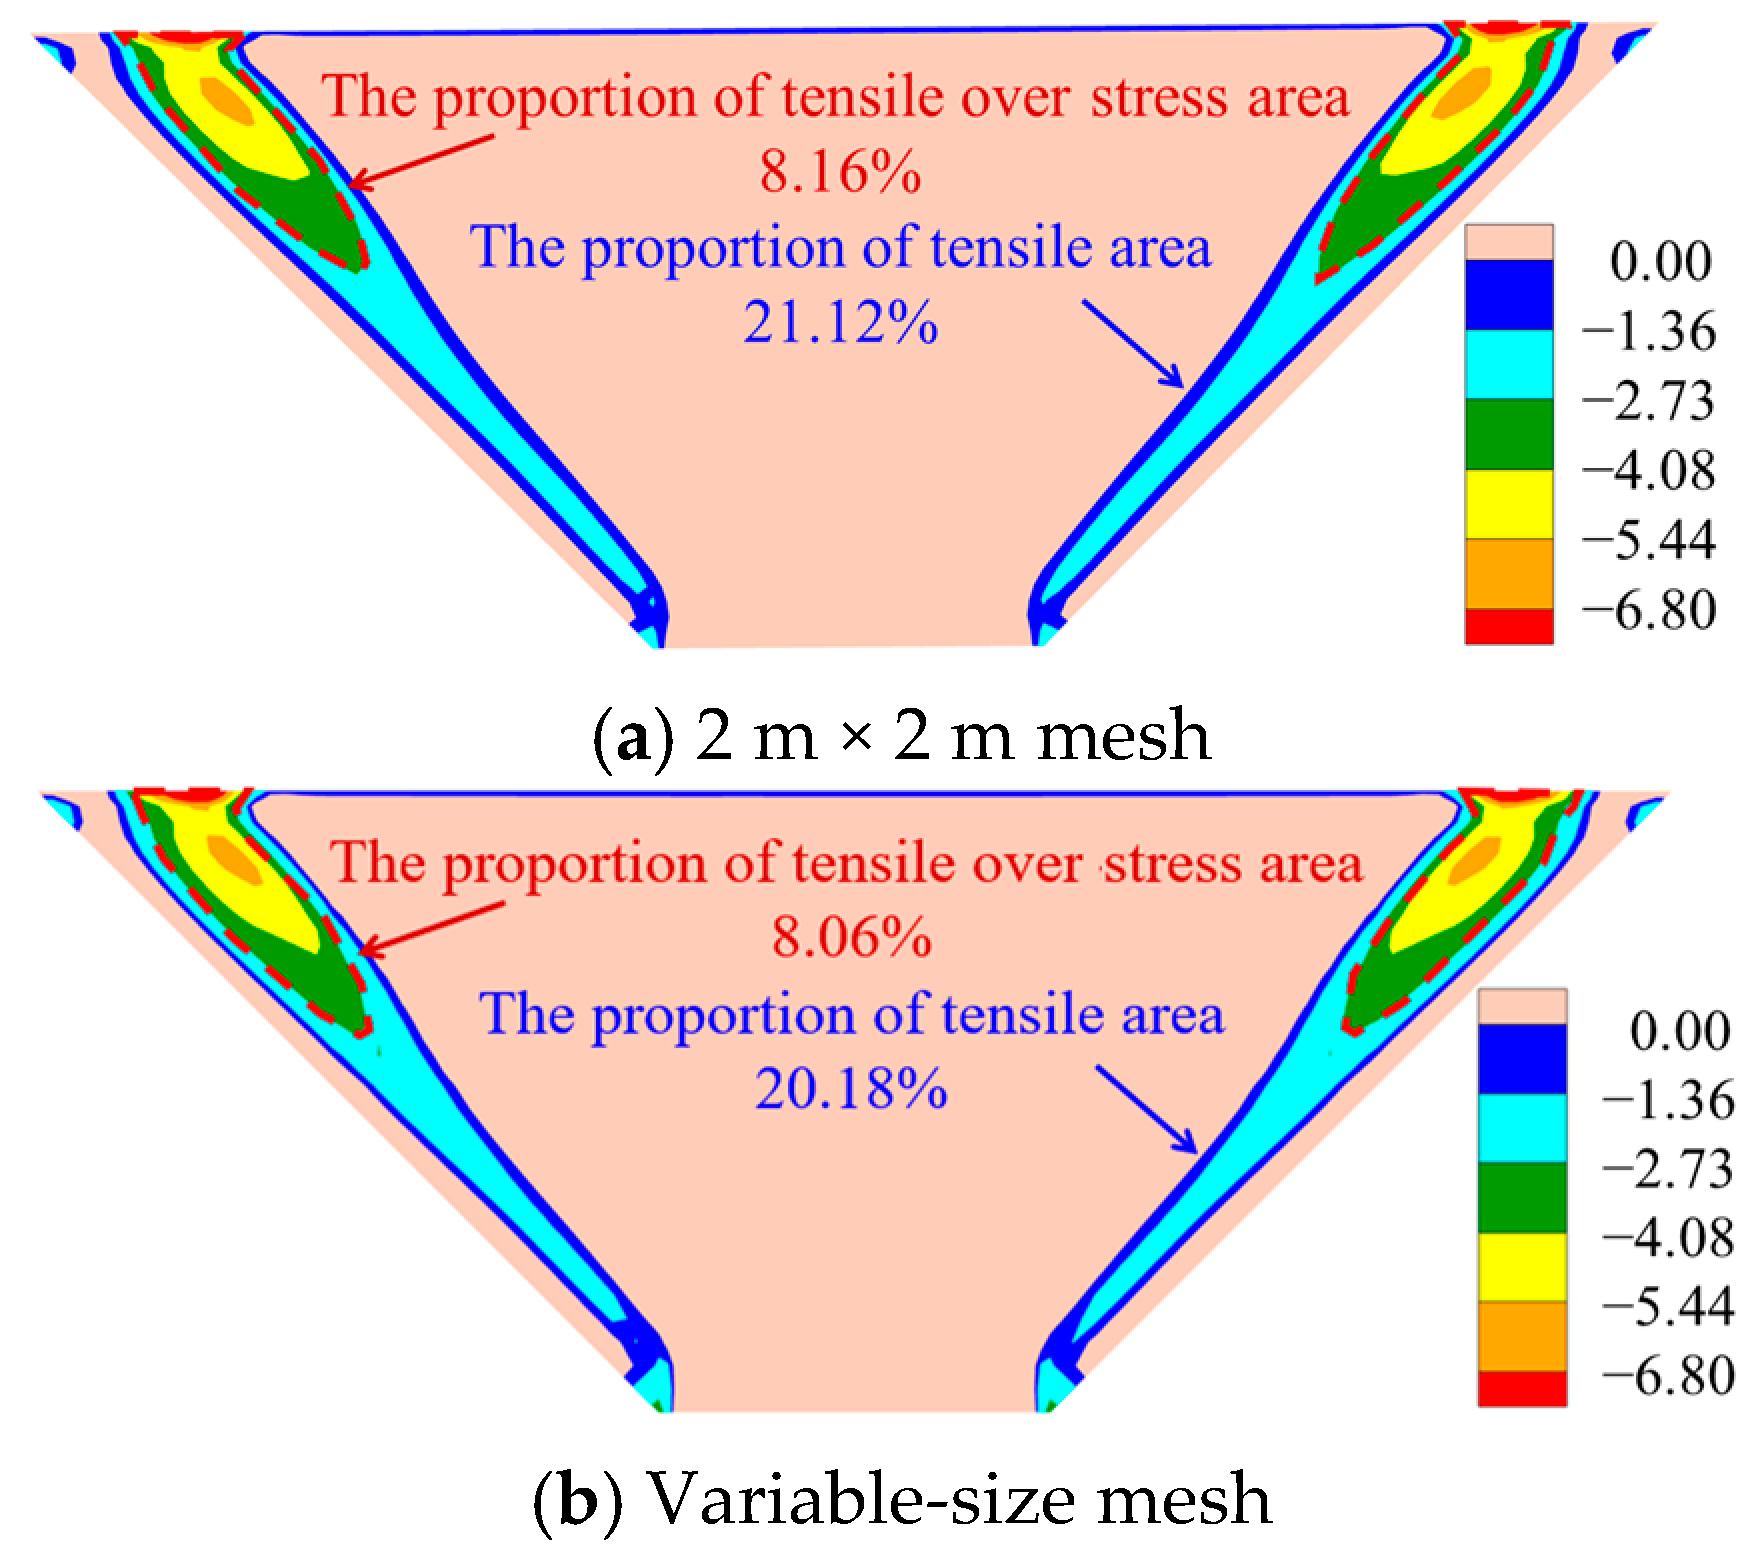
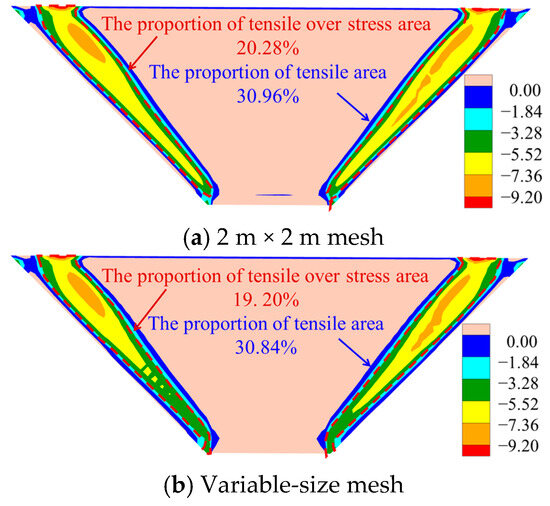
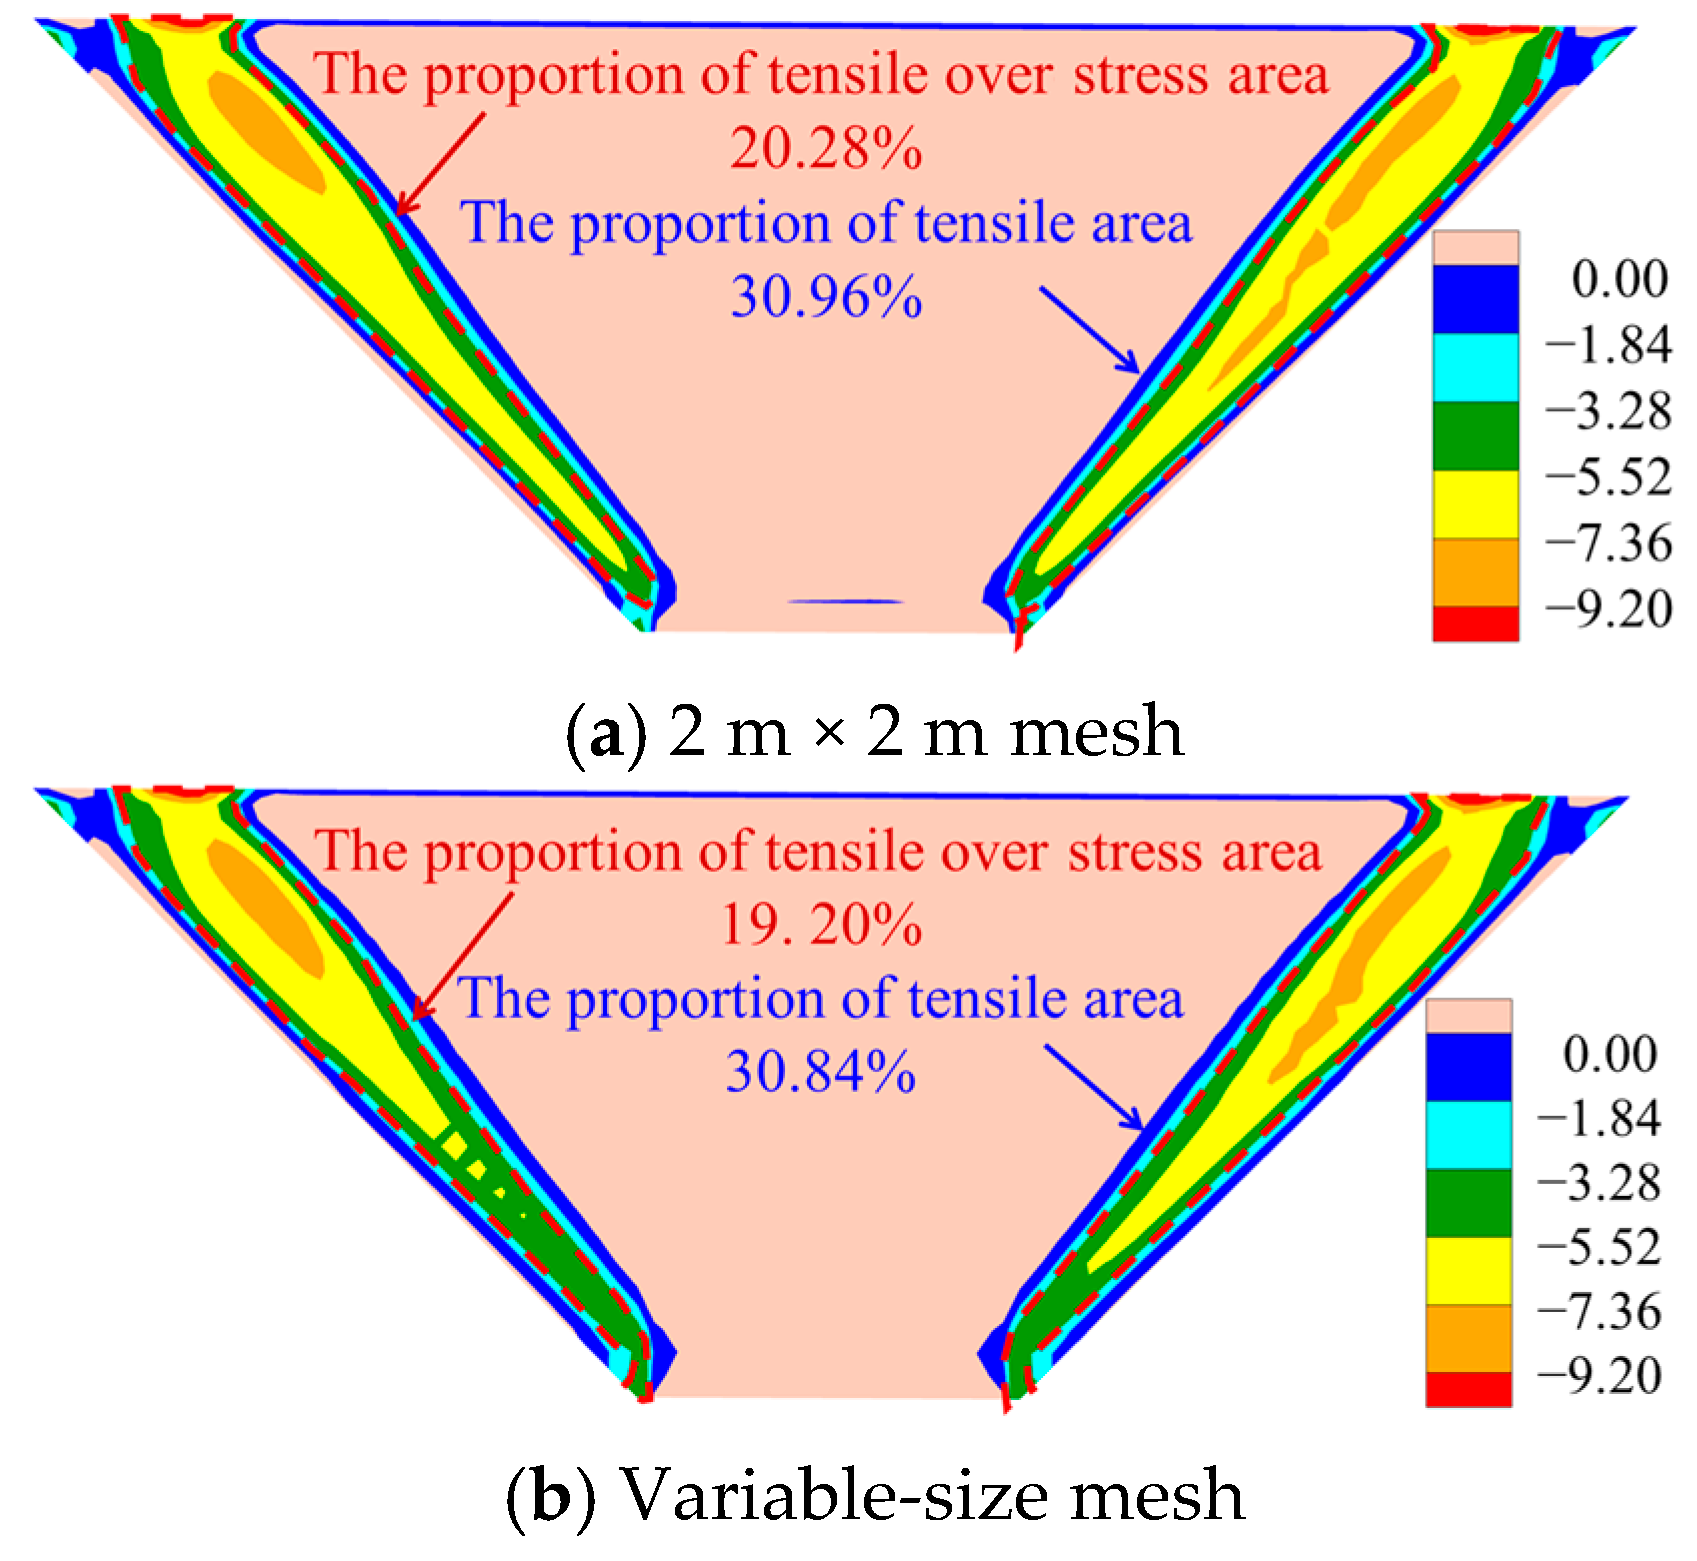
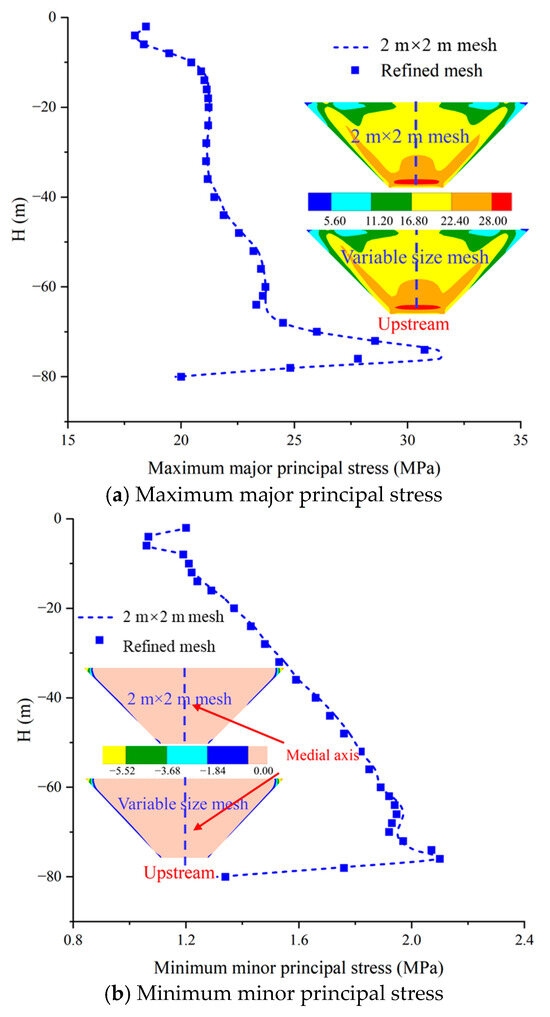
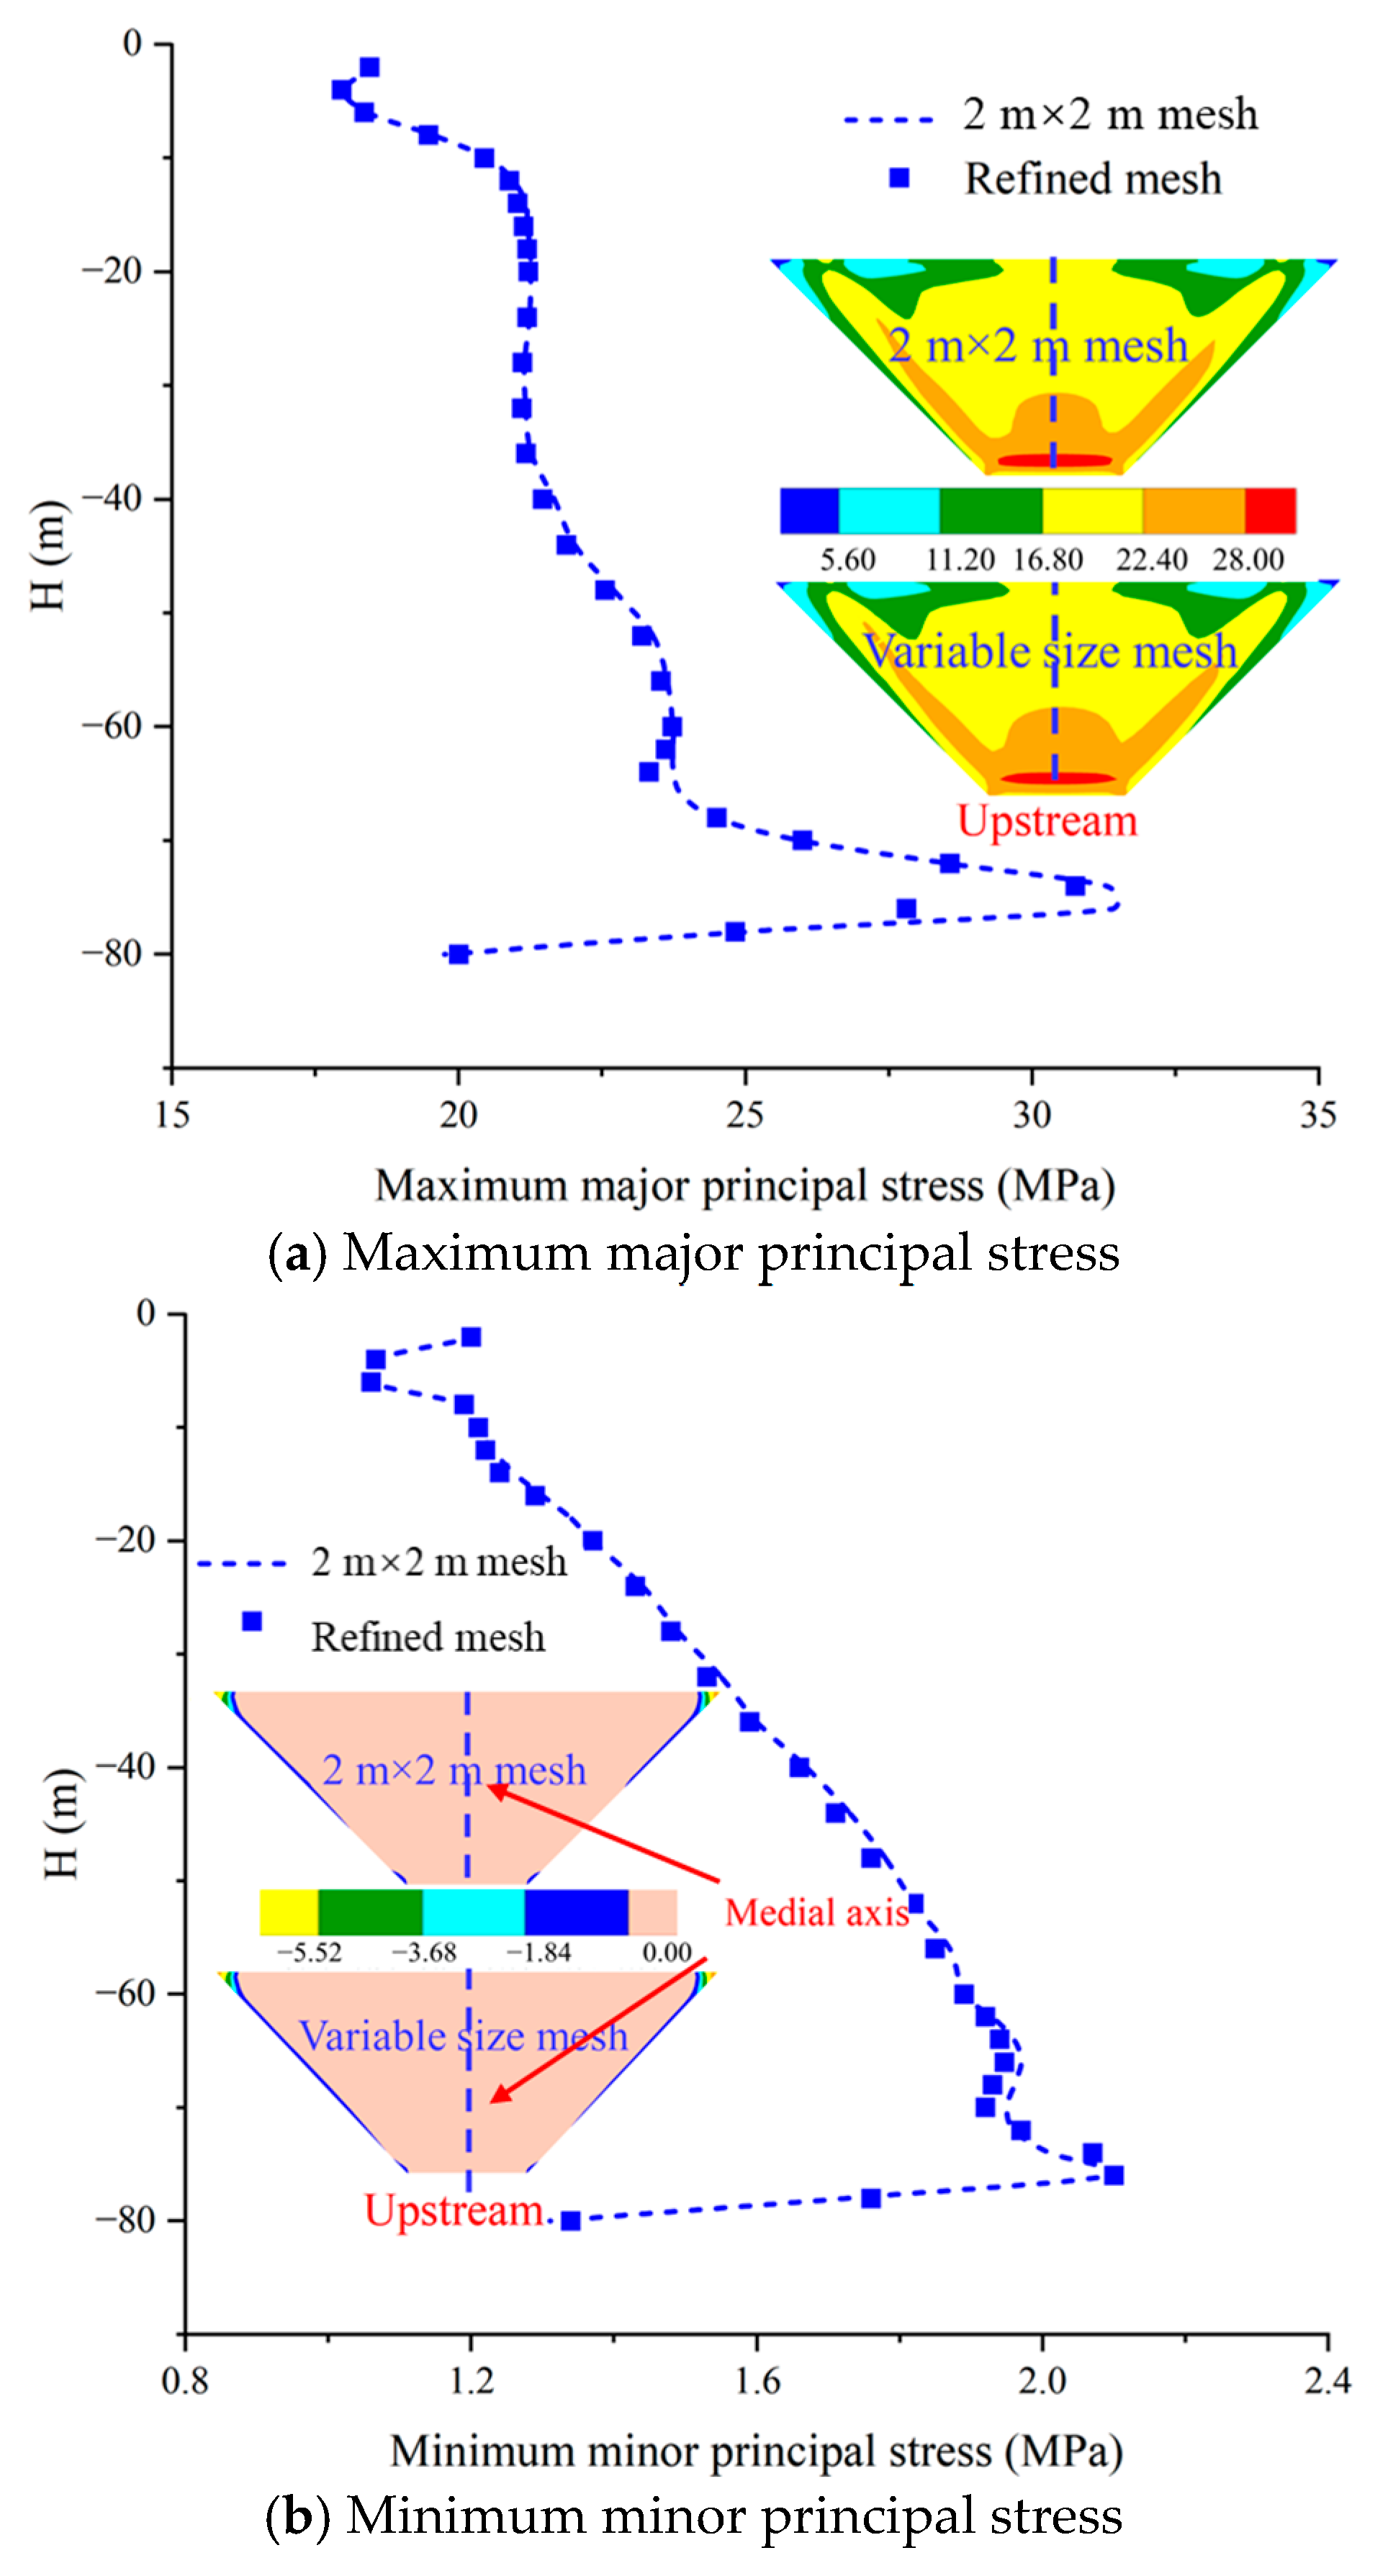
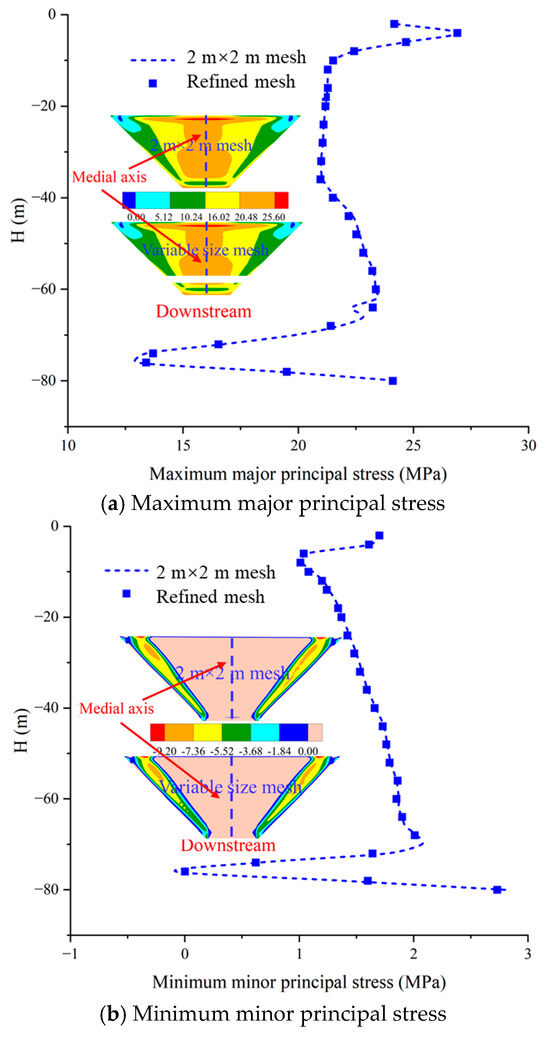
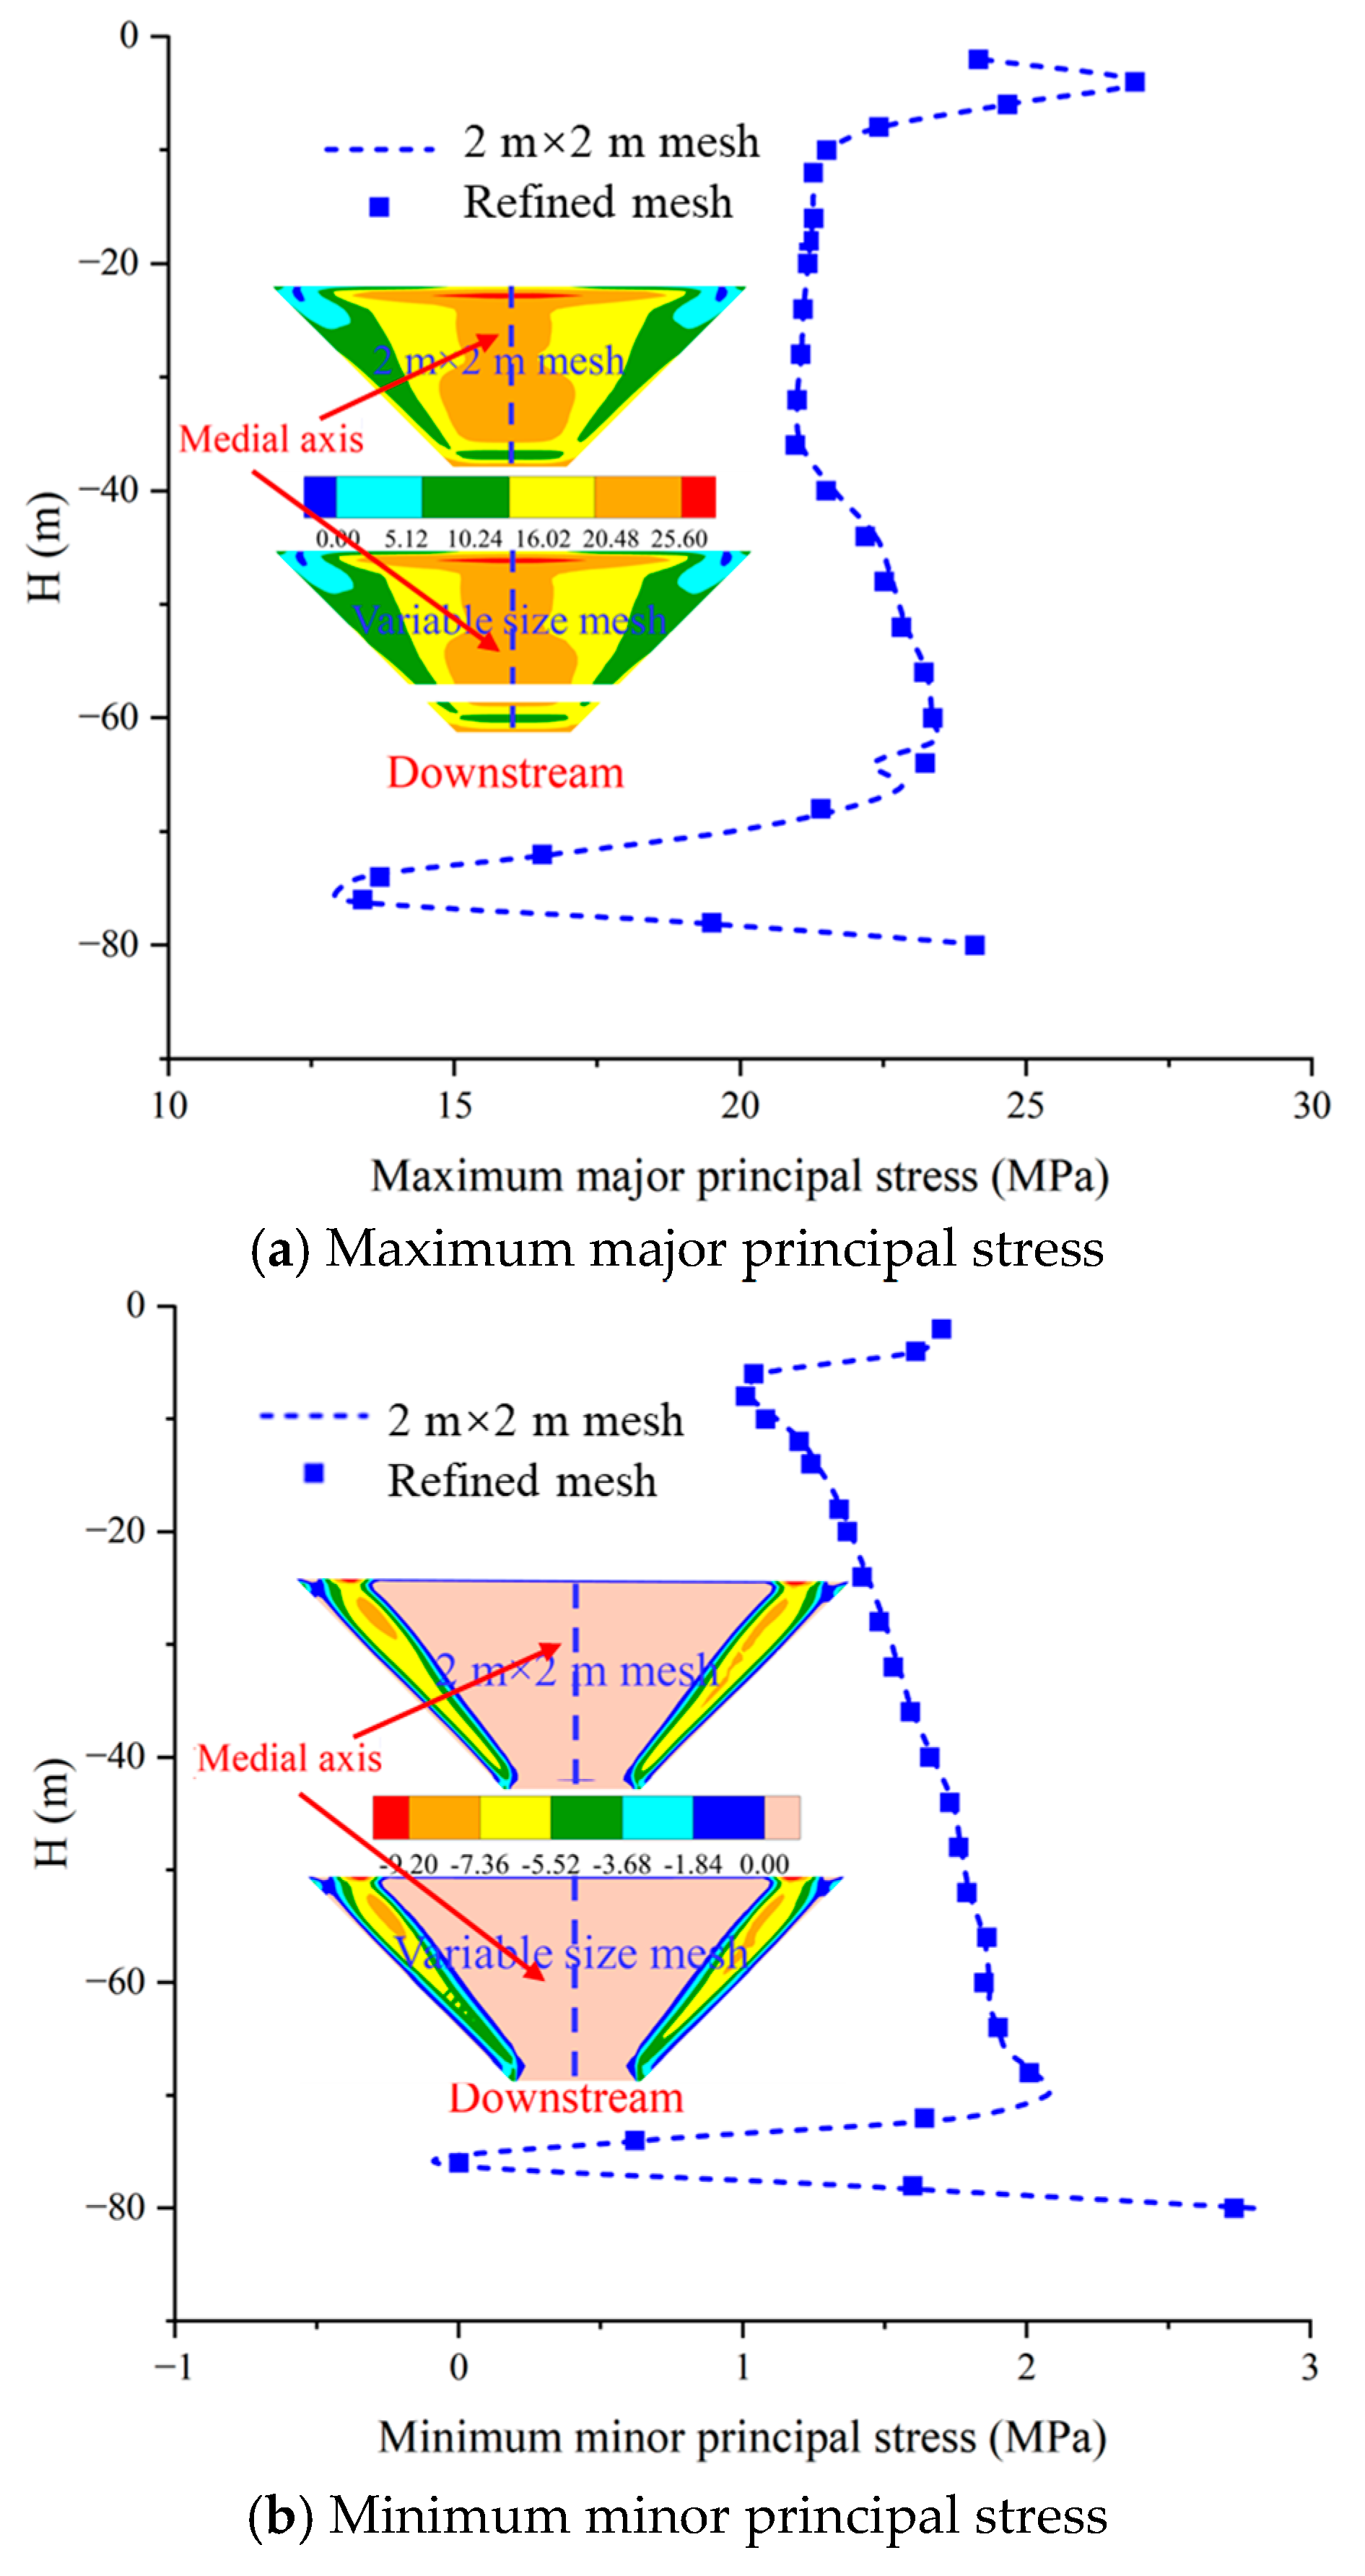
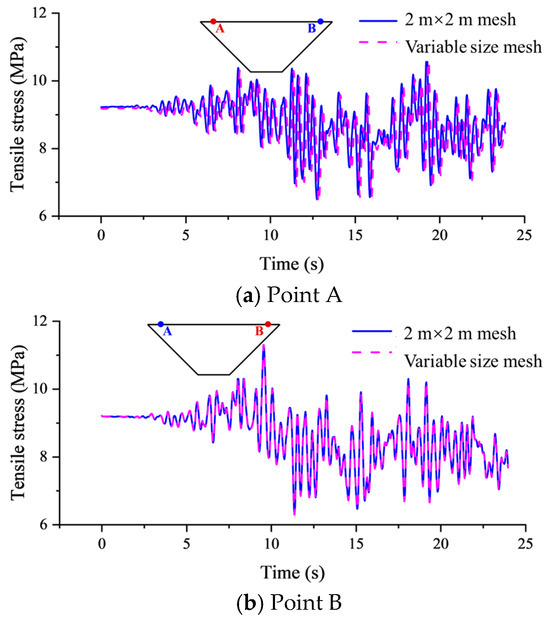
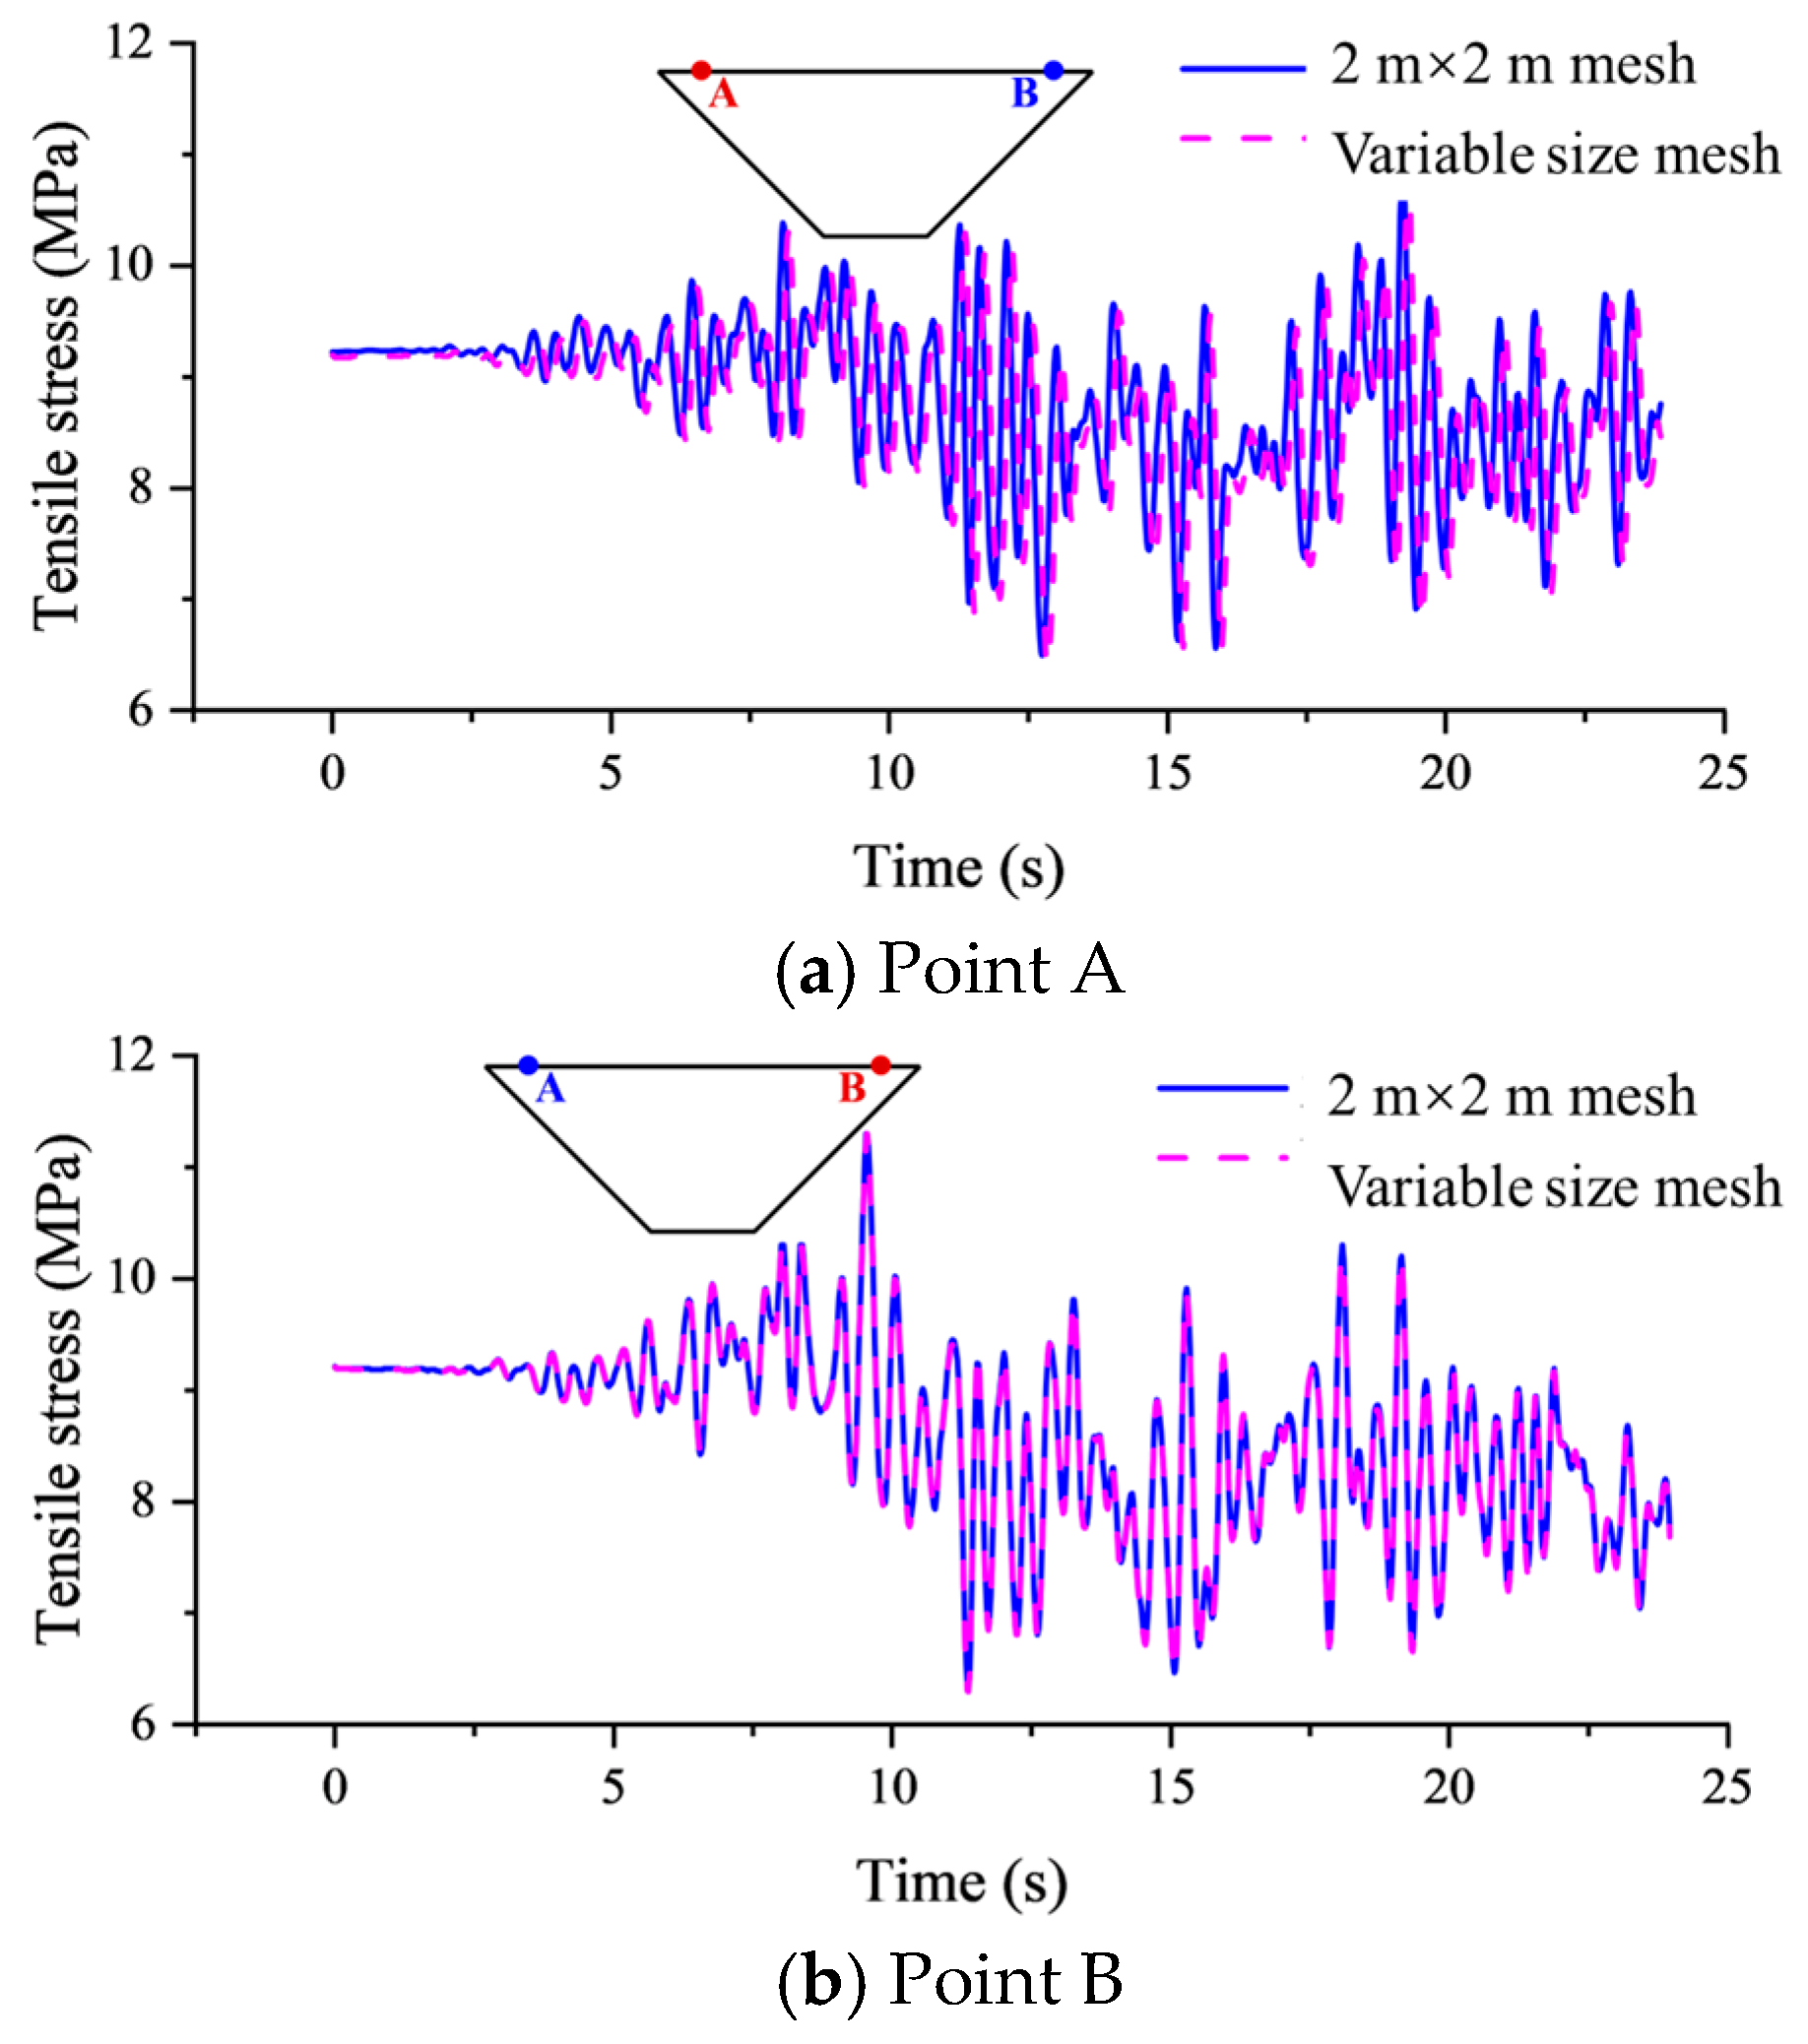
The first author has previously carried out related work and proposed the 2 m × 2 m (axial × vertical) plane size of the cutoff wall [49]. Although the tensile stress can be obtained more accurately, the uniform mesh size still leads to a large number of element nodes, which requires a lot of calculation. From the above, the tensile stress is mainly concentrated in the upper part of the left and right sides of the downstream side of the wall, and its weak area is also in this part. The probability of damage in the middle part of the wall is relatively small, so the mesh size can be appropriately increased to reduce the computational burden. The plane size of the top two ends of the cutoff wall is maintained at 2 m × 2 m, and then the axial size is gradually transitioned to 4 m, as shown in Figure 24. Figure 25 compares displacement distributions under the full-reservoir condition between uniform 2 m × 2 m and variable-size meshing, revealing consistent patterns and reaffirming deformation insensitivity to mesh size. Figure 26 and Figure 27 demonstrate identical tensile stress distribution patterns under both full-reservoir and seismic loading, and the tensile stress distribution is consistent. Due to the increase of the grid size in the middle part of the wall, the tensile area of the cutoff wall is slightly reduced. The error of tensile area ratio under full-reservoir and seismic loading is less than 5%. The key is to maintain a fine resolution of 2 m mesh in the stress concentration area to ensure the accuracy of bending stress analysis. Due to the gentle stress gradient in the middle relaxation area, the mesh size of 4 m still meets the calculation convergence requirement. Figure 28 and Figure 29 depict the stress distribution along the wall height at the medial axis (coarsened area) under seismic loading. The influence of the local variation of the mesh on the distribution of the maximum principal stress and the maximum principal stress along the height of the cutoff wall is almost negligible. Figure 30 shows the time history of tensile stress development in the dense mesh area (weak area) on the downstream of the cutoff wall with different subdivision methods under earthquake. The tensile stress development time history of the locally relaxed mesh and the uniform mesh is highly consistent. The refined mesh (2 m) in the high-stress zone accurately captures the extreme bending stress, and the relaxed mesh (4 m) gradient transition in the middle zone eliminates the numerical oscillation caused by the sudden change in size. The number of variable-size meshes of cutoff wall elements is only 1.2 million, which is 16% less than the number of 2 m × 2 m meshes. It is determined as the final size of the cutoff wall, and an efficient and accurate numerical model scheme is established for the three-dimensional fine analysis of the cutoff wall of high dams with deep overburden. It should be noted that the proposed variable-size mesh scheme is mainly applicable to three-dimensional numerical analyses of cutoff walls in deep overburden foundations where the stress concentration is primarily located in the upper parts of the downstream side and the stress gradient in the middle region is relatively gentle. For models with significantly different valley geometries or substantially greater dam heights, additional mesh convergence analyses are still recommended to verify the applicability of the present scheme. Further validation under more complex topographic and structural conditions will be carried out in future work.
Figure 24.
Variable-size mesh model of cutoff wall.
Figure 25.
Displacement distribution of cutoff wall under full reservoir (cm).
Figure 26.
Tensile stress range on the downstream under full reservoir (MPa).
Figure 27.
Tensile stress range on the downstream face under seismic loading for different plane mesh subdivision methods (MPa).
Figure 28.
Principal stress distribution on the upstream of cutoff wall under seismic loading.
Figure 29.
Principal stress distribution on the downstream of cutoff wall under seismic loading.
Figure 30.
Tensile stress development time history of different positions.
4. Conclusions
In this paper, through the three-dimensional numerical analysis of the concrete cutoff wall of the earth–rock dam with deep overburden, the key problems in the safety evaluation are studied. The effect of the element thickness of the cutoff wall on deformation and stress characteristics is mainly discussed, and the key technical path of fine modeling is proposed. Then, the sensitivity of the dam height and overburden parameter is discussed in detail. Finally, the number of elements is optimized by changing the plane size subdivision method to improve the calculation efficiency. Based on the above research, the main conclusions are as follows:
(1) The element thickness is the key control factor of the tensile stress analysis of the cutoff wall. The maximum deformation of the cutoff wall with different element thicknesses is not more than 7%, with a consistent deformation pattern. The stress state of the upstream and downstream of the cutoff wall is significantly different. When the element thickness is large, the stress transition of the upstream and downstream sides is affected, and the obtained tensile stress range will be greatly reduced. When the element thickness of the cutoff wall is 0.3 m (4 layers) and below, the overstress area ratio under static and dynamic conditions is convergence. It has been able to meet the requirements of calculation accuracy and can more accurately reflect the stress distribution and change of the cutoff wall. Compared with the coarse mesh of only 0.6 m (2 layers), the maximum increase of the overstress area obtained under dynamic analysis can exceed 100%.
(2) Variations in dam height and overburden parameter only regulate the stress magnitude and do not affect the distribution pattern of tensile stress of the cutoff wall. Regardless of static or seismic loading, the position of peak tensile stress is always stable at the top of the wall on both sides of the downstream side to 1/3 of the wall height, which proves that this area is an inherently weak area. The tensile area increases with the increase in dam height and decreases with the increase in modulus. It reflects that a high dam and soft foundation are more sensitive to seismic loading. The change in dam height and the overburden parameter only changes the tensile stress value and tensile range of the cutoff wall and does not affect the distribution pattern of tensile stress.
(3) A variable-size mesh generation scheme for the cutoff wall is proposed to achieve precision–efficiency collaborative optimization. The plane size of the weak zone at both ends of the top of the cutoff wall is set to 2 m × 2 m, and the axial size of the mesh gradually transitions to the middle to 4 m. The displacement distribution of the variable-size mesh cutoff wall is basically the same as that of the uniform mesh, and the difference in tensile area is not more than 5%. Under seismic loading, the stress distribution and time history of the mesh refinement area and the relaxation area are highly consistent. The calculation amount is reduced by more than 16% while ensuring the calculation accuracy, and an efficient and accurate numerical model is established for the three-dimensional fine analysis of the cutoff wall of a high dam with deep overburden.
Author Contributions
Y.D.: Investigation and Writing—Original Draft. J.H.: Investigation, Supervision, and Writing—Review and Editing. Y.Q.: Conceptualization, Data Curation, Formal analysis, Investigation, and Supervision. Y.F.: Writing—Original Draft. X.Y.: Conceptualization, Methodology, Resources, Investigation, and Writing—Review and Editing. All authors have read and agreed to the published version of the manuscript.
Funding
This research was supported by the Henan Province Science and Technology Research Project (No. 242102321112), the National Natural Science Foundation of China (No. 52192674, 52109151), the Open Research Fund of the Key Laboratory of Engineering Geophysical Prospecting and Detection of the Chinese Geophysical Society (No. CJ2021D05), and the China Postdoctoral Science Foundation (No. 2021M692938). This financial support is gratefully acknowledged.
Data Availability Statement
The original contributions presented in this study are included in the article. Further inquiries can be directed to the corresponding author.
Conflicts of Interest
Author Junjie Hua was employed by the company Changjiang Survey, Planning, Design and Research Co., Ltd. The remaining authors declare that the research was conducted in the absence of any commercial or financial relationship that could be construed as a potential conflict of interest.
References
- Wang, F.; Song, Z.; Liu, Y.; Luo, B. Seismic wave input method for high earth dams considering the transmission amplification effect of the bedrock–overburden interface. Comput. Geotech. 2021, 130, 103927. [Google Scholar] [CrossRef] [Scilit]
- Peng, J.; Zou, D.; Qu, Y.; Liu, J.; Chen, K. Study on the elastoplastic damage evolution characteristics of suspended cut-off wall of rockfill dam on ultra-deep overburden during construction and long-term operations. Eng. Struct. 2025, 326, 119497. [Google Scholar] [CrossRef] [Scilit]
- Chen, Z.; Cheng, G.; Yang, C. Research work on construction safety of major infrastructures in China: Overview and a forward look. Tu Mu Gong Cheng Xue Bao 2016, 49, 1–5. [Google Scholar]
- Deng, M.J.; Yu, H.M.; Li, X.Q. Advances of dam construction techniques in Xinjiang. Yantu Gongcheng Xuebao Chin. J. Geotech. Eng. 2010, 32, 1678–1687. [Google Scholar]
- Zou, D.; Qu, Y.; Zhao, Y.; Yu, J.; Li, W.; Tang, C. Influence mechanism of dynamic interaction between earth–rock dam and foundation. J. Southeast Univ. (Nat. Sci. Ed.) 2025, 1–12. [Google Scholar]
- Shelman, E.R. Finite Element Analysis of a Levee; Iowa State University: Ames, IA, USA, 2013; ISBN 978-1-303-45437-0. [Google Scholar]
- Li, Y.; Sun, X.; Li, G.; Zhang, J.; Fang, D.; Wang, X. Impact of concrete face cracks on the saturated and unsaturated seepage behavior of rockfill dams. Structures 2024, 61, 105990. [Google Scholar] [CrossRef] [Scilit]
- Xu, B.; Li, Y.; Pang, R. Plasticity inverse analysis for Zipingpu concrete-faced rockfill dam based on advanced cloud surrogate model via improved Jaya optimization algorithm. Comput. Geotech. 2023, 160, 105555. [Google Scholar] [CrossRef] [Scilit]
- Aditya, T.V.S.; Singh, B. Performance Analysis of Zoned Embankment Dam with Internal Drains and Cutoff Wall Using Numerical Simulation. In Proceedings of the Indian Geotechnical Conference, Chennai, India, 17–19 December 2026; Springer: Singapore, 2026; pp. 13–25. ISBN 978-981-96-8713-8. [Google Scholar]
- Yu, X.; Kong, X.; Zou, D. Deformation and stress distribution characteristics of concrete cut-off wall. J. Zhejiang Univ. Eng. Sci. 2017, 51, 1704–1711. [Google Scholar]
- Zong, D.; Liu, J.; Xiao, E.; Chen, Z. 60 years’ perspective of the diaphragm wall technology for seepage control, Part I: Construction method and workmanship. Shuili Xuebao J. Hydraul. Eng. 2016, 47, 455–462. [Google Scholar] [CrossRef]
- Zong, D.; Liu, J.; Xiao, E.; Chen, Z. 60 years’perspective of the diaphragm wall technology for seepage control, Part II. Innovation and applications. Shuili Xuebao J. Hydraul. Eng. 2016, 47, 483–492. [Google Scholar] [CrossRef]
- Yi, G.; Zou, D.; Li, Y.; Chen, K.; Luo, X.; Gao, D. Application of high-accuracy cross-order algorithm in bending analysis of cutoff wall. Comput. Geotech. 2026, 190, 107744. [Google Scholar] [CrossRef] [Scilit]
- Yu, X.; Kong, X.; Zou, D.; Zhou, Y. 3D valley effect mechanism and damage behavior of the concrete cut-off wall in overburden. Shuili Xuebao J. Hydraul. Eng. 2019, 50, 1123–1134. [Google Scholar]
- Chi, S.; Feng, W.; Jia, Y.; Zhang, Z. Application of the soil parameter random field in the 3D random finite element analysis of Guanyinyan composite dam. Case Stud. Constr. Mater. 2022, 17, e01329. [Google Scholar] [CrossRef] [Scilit]
- Hekmatzadeh, A.A.; Zarei, F.; Johari, A.; Haghighi, A.T. Reliability analysis of stability against piping and sliding in diversion dams, considering four cutoff wall configurations. Comput. Geotech. 2018, 98, 217–231. [Google Scholar] [CrossRef] [Scilit]
- Qu, P.F.; Chai, J.R.; Xu, Z.G. Three-Dimensional Static and Dynamic Analyses of an Embedded Concrete-Face Rockfill Dam. Water 2023, 15, 4189. [Google Scholar] [CrossRef] [Scilit]
- Nikrou, P.; Pirboudaghi, S. Seepage analysis and control of the Sahand rockfill dam drainage using instrumental data. arXiv 2024, arXiv:2410.06079. [Google Scholar] [CrossRef] [Scilit]
- Luo, Y.; Zhang, X.; Zhang, H.; Sheng, J.; Zhan, M.; Wang, H.; He, S. Review of suffusion in deep alluvium foundation. Yantu Lixue Rock Soil Mech. 2022, 43, 3094–3106. [Google Scholar] [CrossRef]
- Wen, L.F.; Chai, J.R.; Wang, X. Stress-deformation behavior of a concrete-faced rockfill dam with a deep overburden foundation. Yantu Lixue Rock Soil Mech. 2015, 36, 2386–2394. [Google Scholar] [CrossRef]
- Kong, X.; Zou, D.; Liu, J. Developments in seismic safety evaluation methods and aseismic measures for high rockfill dams. Shuili Fadian Xuebao J. Hydroelectr. Eng. 2016, 35, 1–14. [Google Scholar] [CrossRef]
- Yu, X.; Kong, X.; Zou, D.; Zhou, Y.; Hu, Z. Linear elastic and plastic-damage analyses of a concrete cut-off wall constructed in deep overburden. Comput. Geotech. 2015, 69, 462–473. [Google Scholar] [CrossRef] [Scilit]
- Wen, L.; Chai, J.; Xu, Z.; Qin, Y.; Li, Y. Comparative and Numerical Analyses of Response of Concrete Cutoff Walls of Earthen Dams on Alluvium Foundations. J. Geotech. Geoenviron. Eng. 2019, 145, 4019069. [Google Scholar] [CrossRef] [Scilit]
- Zhou, Y.; Zhang, Y.; Pang, R.; Xu, B. Seismic fragility analysis of high concrete faced rockfill dams based on plastic failure with support vector machine. Soil Dyn. Earthq. Eng. 2021, 144, 106587. [Google Scholar] [CrossRef] [Scilit]
- Wen, L.; Chai, J.; Xu, Z.; Qin, Y.; Li, Y. Monitoring and numerical analysis of behaviour of Miaojiaba concrete-face rockfill dam built on river gravel foundation in China. Comput. Geotech. 2017, 85, 230–248. [Google Scholar] [CrossRef] [Scilit]
- Wen, L.; Chai, J.; Wang, X.; Xu, Z.; Qin, Y.; Li, Y. Behaviour of concrete-face rockfill dam on sand and gravel foundation. Proc. Inst. Civ. Eng. Geotech. Eng. 2015, 168, 439–456. [Google Scholar] [CrossRef] [Scilit]
- Wen, L.; Li, Y.; Chai, J. Plastic-damage analysis of concrete cutoff wall for a concrete face rockfill dam. Proc. Inst. Civ. Eng. Geotech. Eng. 2020, 173, 153–168. [Google Scholar] [CrossRef] [Scilit]
- Wen, L.; Chai, J.; Xu, Z.; Qin, Y.; Li, Y. A statistical analysis on concrete cut-off wall behaviour. Proc. Inst. Civ. Eng. Geotech. Eng. 2017, 171, 160–173. [Google Scholar] [CrossRef] [Scilit]
- Zhang, X.; Bao, C.; Zhang, J. Deformation behaviour and performance analysis of cut-off wall of the phase II cofferdam in the Three Gorges Project. J. Hydraul. Eng. 2000, 31, 91–96. [Google Scholar]
- Wang, G.; Zhang, J.; Pu, J. Influencing factors of stress and displacement of concrete cut-off wall in dam foundation. China Civ. Eng. J. 2006, 39, 73–77. [Google Scholar]
- Jie, Y.; Zhou, H. Bending moment calculation of cut-off wall. Chin. J. Rock Mech. Eng. 2009, 28, 1213–1219. [Google Scholar]
- Nie, X.; Zou, D.; Chen, K.; Liu, J.; Tian, S. A linear smoothed polygonal scaled boundary element method with consistent one-point integration scheme. Comput. Geotech. 2025, 186, 107438. [Google Scholar] [CrossRef] [Scilit]
- Chen, K.; Guo, H.; Luo, X.; Zou, D.; Tian, S. A rapid prediction approach for the global deformation field of concrete-faced rockfill dams based on POD–MLP. Eng. Anal. Bound. Elem. 2026, 183, 106599. [Google Scholar] [CrossRef] [Scilit]
- Zhuo, Y.; Chen, K.; Zou, D.; Tian, S.; Wu, S.; Zhang, S. Crack analysis of the foundation gallery within an asphalt concrete core dam based on 3D SBFEM-PFM. Eng. Anal. Bound. Elem. 2026, 184, 106641. [Google Scholar] [CrossRef] [Scilit]
- Yi, G.; Zou, D.; Chen, K.; Zhang, M.; Pang, S. A flexible solution for seepage problems integrating SBFEM and recursive polytree meshing. Eng. Anal. Bound. Elem. 2025, 179, 106389. [Google Scholar] [CrossRef] [Scilit]
- Wen, L.; Cao, W.; Li, Y.; Liu, Y.; Zhou, H. Quantitative study on the influence of foundation valley shape on the behaviour of concrete cut-off walls. Structures 2022, 38, 861–873. [Google Scholar] [CrossRef] [Scilit]
- National Energy Administration. Code for Design of Hydraulic Concrete Structures; National Energy Administration: Beijing, China, 2022.
- National Energy Administration. Code for Seismic Design of Hydraulic Structures of Hydropower Projects; National Energy Administration: Beijing, China, 2015.
- Cui, H.; Cui, Y.; Wang, Z. Mesh size effect in nonlinear finite element analysis of concrete. Concrete 2007, 6, 27–29. [Google Scholar]
- Yu, X.; Lai, Y.P.; Wang, Y.K.; Qu, Y.Q.; Zheng, H.R. Identification method of cross-scale mesh and application in analysis of cutoff wall. J. Zhejiang Univ. Eng. Sci. 2023, 57, 2116–2125. [Google Scholar]
- Mei, J.; Cao, H.; Luo, G.; Pan, H. Analytical Method for Groundwater Seepage through and Beneath a Fully Penetrating Cut-off Wall Considering Effects of Wall Permeability and Thickness. Water 2022, 14, 3982. [Google Scholar] [CrossRef] [Scilit]
- Ning, F.; Kong, X.; Zou, D.; Liu, J.; Yu, X.; Zhou, C. Scale effect of rockfill materials and its influences on deformation and stress analysis of Aertashi CFRD. Chin. J. Geotech. Eng. 2021, 43, 263–270. [Google Scholar] [CrossRef]
- Zou, D.; Xu, B.; Kong, X.; Liu, H.; Zhou, Y. Numerical simulation of the seismic response of the Zipingpu concrete face rockfill dam during the Wenchuan earthquake based on a generalized plasticity model. Comput. Geotech. 2013, 49, 111–122. [Google Scholar] [CrossRef] [Scilit]
- Zou, D.; Han, H.; Ling, H.I.; Zhou, Y.; Liu, J. An approach for the real-time slip deformation coupled with strain softening of a high rockfill dam subjected to pulse-like ground motions. Soil Dyn. Earthq. Eng. 2019, 117, 30–46. [Google Scholar] [CrossRef] [Scilit]
- Zou, D.; Chen, K.; Kong, X.; Yu, X. An approach integrating BIM, octree and FEM-SBFEM for highly efficient modeling and seismic damage analysis of building structures. Eng. Anal. Bound. Elem. 2019, 104, 332–346. [Google Scholar] [CrossRef] [Scilit]
- Zou, D.; Gong, J.; Kong, X.; Qu, Y.; Liu, J.; Chen, K. Local large deformation between cut-off wall and core wall on deep overburden by meshless method. Chin. J. Geotech. Eng. 2023, 45, 1773–1781. [Google Scholar] [CrossRef]
- Zou, D.; Liu, J.; Kong, X.; Chen, K.; Qu, Y.; Ning, F.; Gong, J. Damage evolution mechanism and safety evaluation criterion of ultra-high rockfill dam system under strong earthquakes. Chin. J. Geotech. Eng. 2022, 44, 1329–1340. [Google Scholar]
- Duncan, J.M.; Chang, C. Nonlinear Analysis of Stress and Strain in Soils. J. Soil Mech. Found. Div. 1970, 96, 1629–1653. [Google Scholar] [CrossRef] [Scilit]
- Yu, X.; Wang, Y.; Tulamaiti, Y.; Zhou, C.; Zhou, Y.; Wang, G. Refined numerical simulation of a concrete cut-off wall in the thick overburden of dam foundation. Structures 2021, 33, 4407–4420. [Google Scholar] [CrossRef] [Scilit]

Disclaimer/Publisher’s Note: The statements, opinions and data contained in all publications are solely those of the individual author(s) and contributor(s) and not of MDPI and/or the editor(s). MDPI and/or the editor(s) disclaim responsibility for any injury to people or property resulting from any ideas, methods, instructions or products referred to in the content. |
© 2026 by the authors. Licensee MDPI, Basel, Switzerland. This article is an open access article distributed under the terms and conditions of the Creative Commons Attribution (CC BY) license.