


Abstract
The objective of this study was to assess and model the condition and resilience of the Cunas River using integrated indices and multivariate statistics in order to determine the impact of anthropogenic pressure and enhance water security in the Peruvian Andes. Stations in the upper, middle, and lower reaches of the river were monitored during the rainy and dry seasons, applying quality indices (NSF-WQI, WA-WQI, CCME-WQI, and I-WQI), principal component analysis (PCA), hierarchical cluster analysis (HCA), and Spearman’s rank correlation (ρ) to assess the intensity and direction of associations between physical–chemical parameters. The results reveal severe degradation in the lower section of the river, with critical hypoxia and extreme coliform levels during the dry season, drastically exceeding the levels in the upper reach. The I-WQI demonstrated superior performance (322.24; Unfit) by being more sensitive than the NSF-WQI (53.15–59.87). PCA confirmed that low flow explains the greatest variance in pollution (PC1 71.55%), while HCA identified maximum synergy (rescaling distance < 1) between biochemical oxygen demand (BOD5) and total phosphorus, indicating the collapse of self-purification capacity. The HCA identified a maximum synergy between BOD5 and total phosphorus during the low-flow season, while the PCA confirmed that low discharge intensifies pollutant concentrations. These findings support the need for resilience-based governance that prioritizes the protection of natural infrastructure.
1. Introduction
Water is central to global security, underpinning public health and socioeconomic stability [1]. Although access to safe water has increased globally, water quality is facing systemic degradation due to industrial discharges, agrochemical runoff, and untreated wastewater [2,3]. This seasonal crisis directly undermines the Sustainable Development Goals (SDGs) for Zero Hunger (SDG 2), Good Health and Well-being (SDG 3), and Clean Water and Sanitation (SDG 6) [4,5,6]. In Peru, the gap is critical: only 19% of wastewater is treated [7], turning rivers into recipients of raw effluents that threaten public health and ecological integrity. According to the WHO, the prevalence of waterborne diseases is linked to the degradation of these sources, underscoring the urgency of establishing comprehensive protection frameworks [8].
High Andean rivers, such as the Cunas River, exhibit unique hydrological characteristics due to their high spatiotemporal variability and their role as providers of multiple-use ecosystem services. However, knowledge regarding their water health under anthropogenic pressure remains fragmented. Assessing these high-mountain lotic systems requires tools that synthesize the multidimensionality of the data without compromising scientific rigor [9]. However, the application of conventional indices, such as that of the National Sanitation Foundation (WQI-NSF), though robust and globally validated [10], presents critical limitations in mountain regions. The rigidity in assigning weights to parameters often ignores local hydrogeochemical particularities and emerging pollution sources. Therefore, a profound understanding of contemporary water health demands the integration of these indices with multivariate statistical tools and objective weighting methods that allow for capturing the true variance of the ecosystem [11,12].
Despite the strategic importance of High Andean rivers, a critical fragmentation persists in the knowledge regarding their water health under multiple-use scenarios. Under this premise, the present study proposes a methodological advancement by implementing the Das [13,14]. This synergy allows for the neutralization of analytical subjectivity by incorporating the intrinsic dispersion and correlation of the data, revealing the system’s capacity to transition toward proactive water management. The objective of this study was to assess and model the condition and resilience of the Cunas River using integrated indices and multivariate statistics in order to determine the impact of anthropogenic pressure and enhance water security in the Peruvian Andes. Specifically, it seeks to quantify water quality using the NSF-WQI and I-WQI indices, identify the determinants of spatial and temporal variability through multivariate analysis, and evaluate potential risks to public health to establish a methodological precedent for sustainability.
2. Materials and Methods
2.1. Study Area
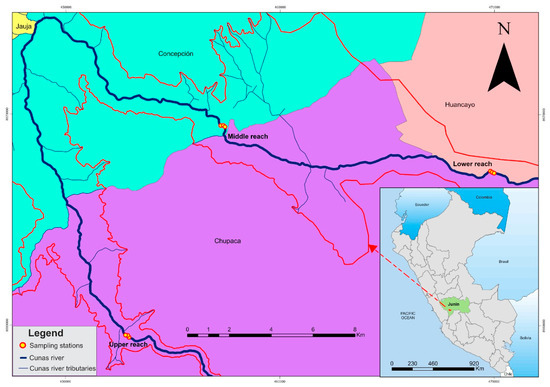
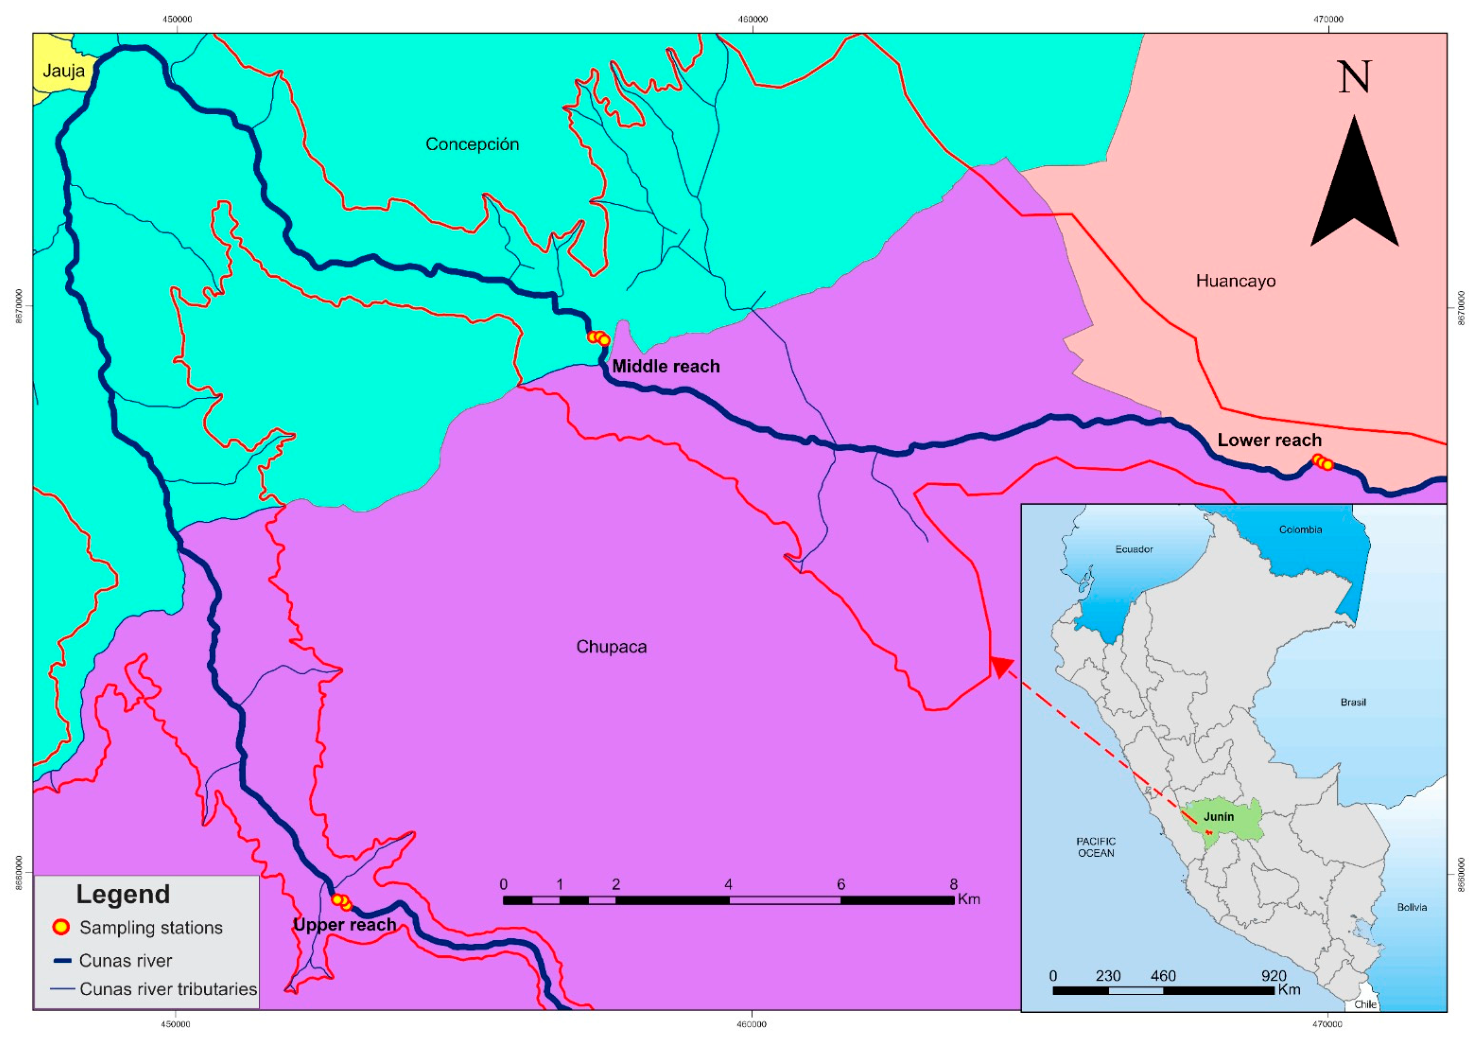
The Cunas River sub-basin is located in the central region of the Peruvian Andes, covering an area of 1699 km2, between 11°45′ and 12°20′ S and 75°15′ and 75°45′ W, at an altitude ranging from 3190 to 4797 m a.s.l. The Cunas River originates at an elevation of 4535 m and flows for 101.1 km, passing through the provinces of Concepción (latitude −11.9678°, longitude −75.3281°), Chupaca (latitude −12.0572°, longitude −75.2898°) and Huancayo (latitude −12.0638°, longitude −75.2165°) [15] (Figure 1). The Cunas River has an annual volume of 468.4 hm3, characterized by a hydrological regime with marked seasonality. During the rainy season (December–April), the system concentrates 78.5% of its total discharge (367.5 hm3), which decreases to a remnant of 100.9 hm3 during the low-flow season (May–November). Temporal variability is reflected in extreme flow fluctuations, reaching maximums of 44.5 m3/s in February and summer minimums of 3.957 m3/s in August. The sub-basin’s climate is frigid and rainy from December to April. The average annual precipitation reaches 854.6 mm, primarily concentrated between December and April. The average annual temperature is 9.1 °C; however, a significant decrease to 6.7 °C is observed in July, during the low-flow period. The average annual relative humidity is 63.2%, increasing to 70% in March [16].
Figure 1.
Map showing the study area and sampling sites along the Cunas River. The colored areas represent the provinces of Jauja (yellow), Concepción (green), Chupaca (purple) and Huancayo (pink).
2.2. Water Sampling and Analysis
Sampling was conducted during 2021 in the rainy season (January–March) and the low-flow season (June–August). Three study reaches were delimited (upper, middle, and lower), establishing 15 sampling sites in each. Each site was monitored during the rainy and dry seasons, resulting in a total of 90 water samples (45 sites over two seasons) collected during the study period. Samples were collected 20 cm below the surface and stored in polyethylene and glass bottles, previously sterilized and pre-rinsed with distilled water [17]. The in situ characterization of dissolved oxygen (DO), total dissolved solids (TDS), and pH was performed using Hanna Instruments portable multiparameter meters (models HI 9146, HI 9835, and HI 991301, Woonsocket, USA, respectively).
The remaining physicochemical and microbiological parameters were determined according to the Standard Methods for the Examination of Water and Wastewater [18]. Turbidity was analyzed using the nephelometric method (SM 2130 B) with a HANNA HI93703 turbidimeter (Woonsocket, RI, USA) calibrated with formazin standards. Biochemical oxygen demand (BOD5) was quantified via the respirometric incubation method at 20 ± 1 °C for five days (SM 5210 B), using an Oxitop IS 6 system (Weilheim, Germany) and a VELP F10400320 incubator (Usmate Velate, Italy). Inorganic nutrients—nitrates (NO3−) and total phosphorus (TP)—were determined with a Lovibond MD600 photometer (Usmate Velate, Italy); NO3− through the salicylic acid method (SM 4500-NO3− E) and total phosphorus (TP) by the ascorbic acid method (SM 4500-P E). Total dissolved solids (TDS) were determined using the electrometric method with a WTW Multi 3630 IDS multiparameter meter equipped with a TetraCon 925 sensor (Weilheim, Germany).
The microbiological analysis of thermotolerant coliforms (TC) was conducted under ISO 9308-2:2012 standards using the Colilert-18 method. Sample handling was performed under aseptic conditions within a Heal Force AlphaClean 1300 laminar flow cabinet (Shanghai, China). Incubation for thermotolerant coliforms was carried out in Memmert 110 equipment (Schwabach, Germany) at 44 ± 0.5 °C for 24 h. The detection of positive wells was based on fluorescence under ultraviolet radiation (λ = 365 nm) using a Spectroline A-160/FE lamp (Westbury, NY, USA), quantified according to Most Probable Number (MPN) tables.
2.3. Multidimensional Water Quality Assessment and Statistical Analysis
2.3.1. National Sanitation Foundation Water Quality Index (NSF-WQI)
The NSF-WQI is a fundamental analytical tool based on expert consensus. Its mathematical formulation is based on the weighted sum of nine quality sub-indices (Qi) corresponding to critical parameters such as DO, pH, BOD5, NO3−, phosphates (PO43−) (calculated from TP), temperature, turbidity, total dissolved solids, and TC [19]. The mathematical foundations of the index, its constituent parameters, and their respective valuation scales are shown in Table 1.
Table 1.
Methodological framework of water quality indices through mathematical formulation and range interpretation indicators.
2.3.2. Weighted Arithmetic Water Quality Index (WA-WQI)
The WA-WQI represents a linear aggregation technique that quantifies resource degradation by integrating individual quality sub-indices and relative importance weights (Wi). This approach is particularly useful for prioritizing critical parameters, such as organic load or bacterial density, based on their potential impact on the ecosystem [20]. The mathematical expression, selected parameters, and their corresponding interpretation scale are presented in Table 1.
2.3.3. Canadian Council of Ministers of the Environment Water Quality Index (CCME-WQI)
The CCME-WQI is an analytical framework designed to quantify the level of compliance of physicochemical and microbiological parameters with pre-established quality objectives or standards. This method stands out for its operational flexibility, allowing for the dynamic selection of parameters and reference criteria according to the specific use of the resource, such as human consumption or aquatic biota protection, provided that defined regulatory thresholds are available (Table 1) [21].
2.3.4. Integrated Water Quality Index (I-WQI)
The I-WQI is based on the convergence of physicochemical and microbiological parameters to derive a synthetic value that holistically quantifies the state of the water resource. For this study, eight indicators were selected: pH, DO, turbidity, NO3−, TP, SDT, BOD5, and thermotolerant coliforms. The calculation process was systematically performed using R software v4.3.2 through a four-step algorithmic sequence.
Initially, a Min–Max normalization was performed to transform the original data matrix into a dimensionless matrix (), ensuring comparability among parameters with different units of measurement [20]. Subsequently, a hybrid weighting model was applied that combined the Entropy and CRITIC strategies. Under the Entropy approach, the probability distribution of the parameters was first calculated from the normalized matrix. This step allowed for the estimation of the entropy components () and the global entropy values (). These components reflect the intrinsic variability and information content of each parameter [21,22].
At the same time, the CRITIC method assessed the interrelationships among the parameters using the correlation matrix . Based on this, the criterion’s information measure was calculated by combining the standard deviation and the conflict between variables to estimate the CRITIC weights, which capture both the intensity of contrast and structural interdependence [23]. The final weights were obtained through a linear combination of both methods, using a smoothing coefficient p = 0.5. This value was selected to balance objective variability and correlation structure, ensuring a balanced and adaptive integration. In the final phase, the quality sub-indices by parameter were calculated and aggregated using the combined weights to obtain the overall I-WQI as a weighted sum [24]. The detailed mathematical formulation of each phase is presented in Table 2.
Table 2.
Objective weighting algorithms and mathematical expressions for determining the Integrated Water Quality Index (I-WQI).
Finally, the calculated indices were classified according to the quality ranges (excellent to very poor) described in Table S1. This standardization allows for a comparison of model performance, given that the WA-WQI and I-WQI scales operate inversely to those of the NSF-WQI and CCME-WQI.
2.4. Statistical Analysis
The assessment of water health began by comparing the physicochemical and microbiological parameters with the Peruvian Environmental Quality Standards (EQS). The normality of the data series was verified using the Shapiro–Wilk test (Tables S2 and S3). In addition, Levene’s test was performed to assess the homogeneity of variances in seasonal comparisons between different river segments (Table S4). Based on the results of both tests, either the Mann–Whitney U test or Student’s t-test was selectively applied to evaluate seasonal variations (rainy season versus dry season). Spatial heterogeneity between the upper, middle, and lower reaches of the river was determined using the Kruskal–Wallis test. Subsequently, multivariate statistical techniques were applied to model the incidence of anthropogenic pressure on water resources. In order to identify the critical determinants of degradation, Spearman’s correlation coefficients were calculated to establish parametric interdependencies, complementing this analysis with a reduction in dimensions using Principal Component Analysis (PCA) with Varimax rotation [25], but first, DCA was performed to estimate the gradient length (Table S5). Finally, a Hierarchical Cluster Analysis (HCA) was performed to zone health risks and identify critical areas for resilient water management in the basin. The consistency of these groups was compared with the results of the NSF-WQI, WA-WQI, CCME-WQI, and I-WQI indices, ensuring a robust interpretation of water resilience. All statistical analyses and data processing were performed using R software (version 4.3.1) and Python (version 3.11), with a significance level of p < 0.05 set for all tests.
3. Results
3.1. Diagnosis of Water Health and Compliance with Environmental Quality Standards
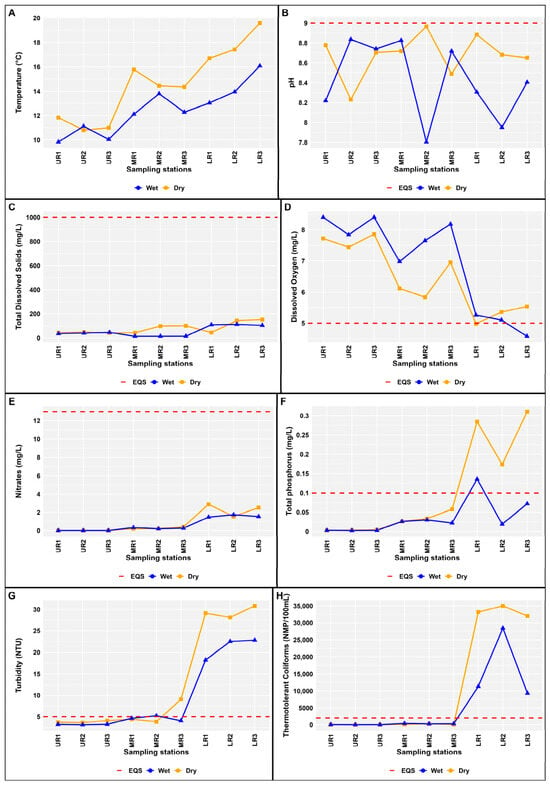
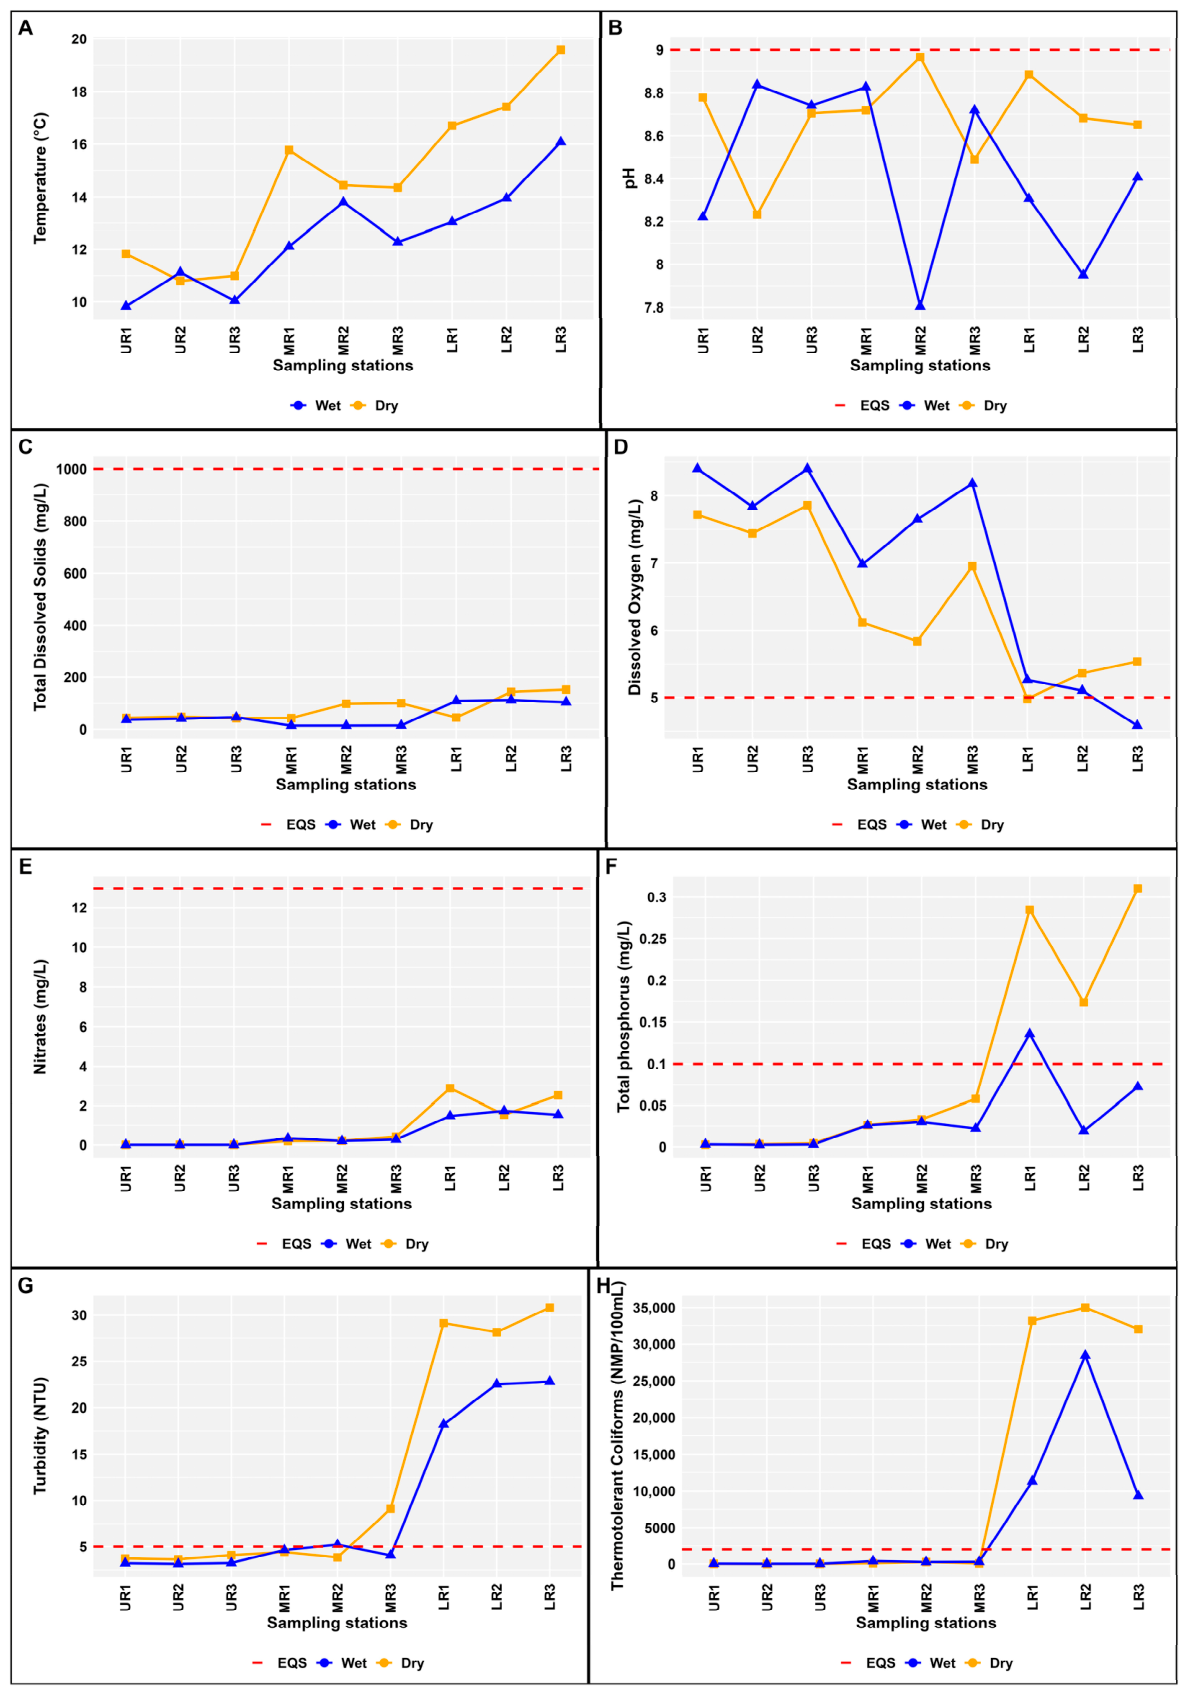
The water quality dynamics in the Cunas River showed a severe longitudinal degradation gradient. The upper section exhibited nearly pristine conditions that contrasted with the critical deterioration of the lower section, especially during low-flow periods. This systemic change was initially evident in the thermal gradient (Tables S6 and S8; Figure 2A). In the upper section, the temperature remained at baseline levels, gradually increasing in the middle section (Table S7) and the lower section. This temperature gradient directly impacted oxygenation capacity; while the upper section recorded optimal dissolved oxygen (DO) levels (Table S6), the lower section of the river experienced a critical decline (Table S8), exceeding Peruvian environmental quality standards (EQS) for water (≥5 mg/L) [26] (Figure 2D). Meanwhile, the pH (Figure 2B), although it remained within normal limits, showed greater instability in the middle and lower ranges, suggesting an impairment in the system’s buffering capacity.
Figure 2.
Longitudinal dynamics of water quality parameters. (A) Temperature, (B) pH, (C) Total dissolved solids, (D) Dissolved oxygen, (E) Nitrates, (F) Total phosphorus, (G) Turbidity, (H) Thermotolerant coliforms (Note: UR = Upper reach; MR = Middle reach; LR = Lower reach; EQS = Environmental quality standard. Trend lines compare seasonal behavior against EQS represented by the red dotted lines.
In the upper section, TDS and NO3− showed baseline concentrations. However, anthropogenic pressure drastically altered the hydrochemistry as the river flowed into its lower reaches. TDS and NO3− showed increases of up to two orders of magnitude compared to the baseline (Figure 2C,E). Although these parameters did not exceed Category 4 thresholds, the magnitude of the increase indicated a loss of functional stability long before reaching levels of acute toxicity (Table S8).
The thermotolerant coliform (TC) count showed a gradual increase in the middle section, followed by a sharp increase in the lower section. During the low-flow period, the lower section exceeded the conservation limit (2000 NMP/100 mL) exponentially, with densities three times the permitted threshold (Figure 2H). This spatial asymmetry confirmed the lower section as a persistent fecal contamination hotspot (Table S8; Figure 2H) and validates the need to apply the integrated index (I-WQI) to zone areas requiring immediate mitigation measures in response to health risks.
3.2. Analysis of Spatiotemporal Heterogeneity and Significance of Critical Indicators
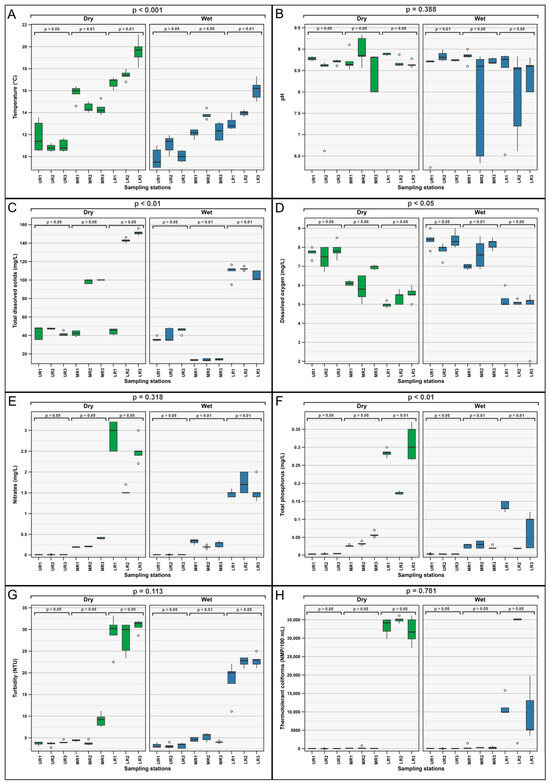
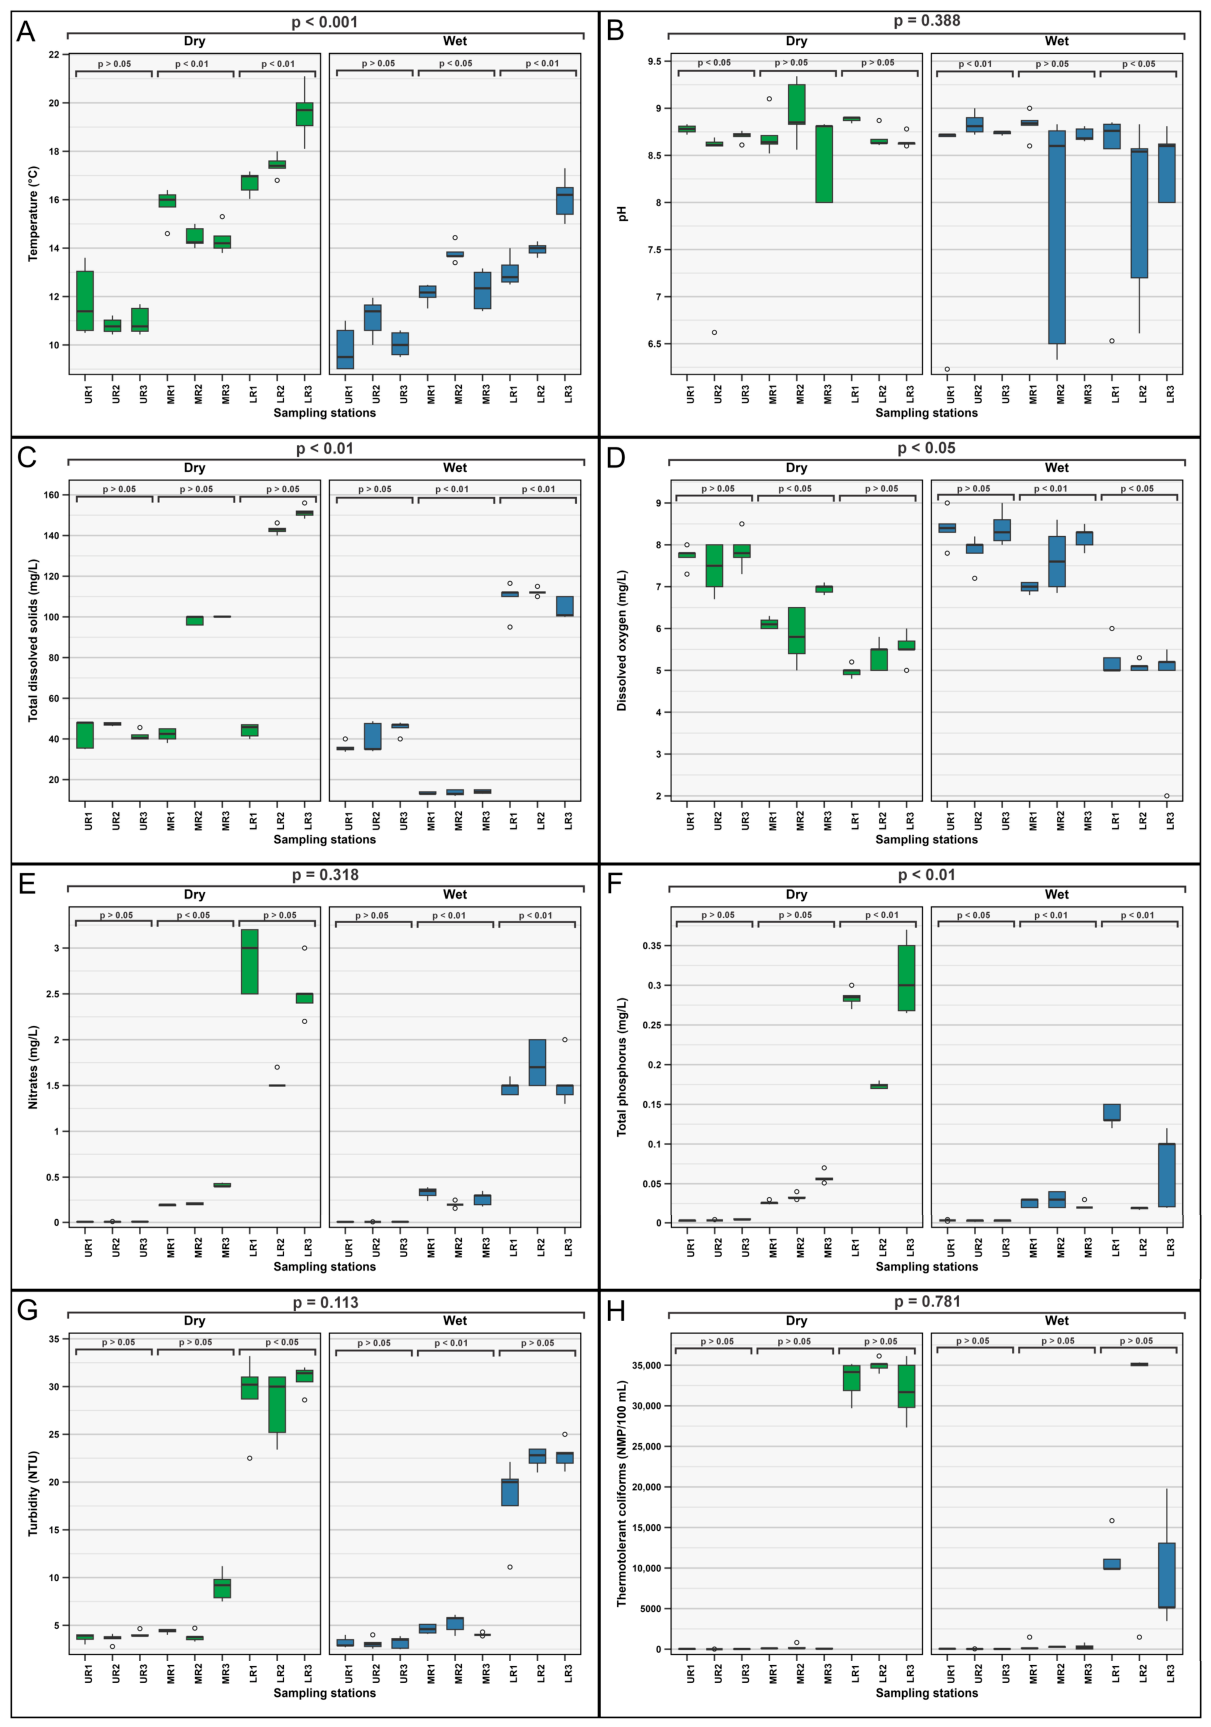
Figure 3 shows marked statistically significant heterogeneity along the course of the Cunas River. The Kruskal–Wallis test confirmed significant differences between the upper, middle, and lower reaches of the river for most parameters in both hydrological periods (p = 0.000), validating the existence of a longitudinal degradation gradient (Table S9). With regard to thermal dynamics, temperature exhibited a highly significant longitudinal increase (p = 0.000) and marked overall seasonality (p = 0.000, Table S10). The assessment of seasonality was based on the distributional nature of the data, as verified by the Shapiro–Wilk test (Table S3). In the upper reach, temperature exhibited a non-parametric distribution during the low-flow period (W = 0.7748; p < 0.01), which validated the use of the Mann–Whitney U test (p = 0.038; Table S11). In contrast, in the middle and lower reaches, the normality of the data (p > 0.05) allowed for the application of Student’s t-test, confirming highly significant seasonal variations (p < 0.001). This methodological stratification ensures the appropriateness of the statistical inferences, tailoring the choice of tests to the intrinsic probability distribution of the data in each river section. Figure 3A shows much greater dispersion during the low-flow season, especially in the lower reach. On the other hand, pH showed overall stability (p = 0.388, Table S10), although Figure 3B reveals a greater range of values and the presence of outliers in the lower reach during the rainy season, corroborated by a significant local difference (p = 0.007, Table S8).
Figure 3.
Boxplots of critical parameters for water health segregated by zone and hydrological period. (A) Temperature, (B) pH, (C) Total dissolved solids, (D) Dissolved oxygen, (E) Nitrates, (F) Total phosphorus, (G) Turbidity, 3.3. (H) Thermotolerant coliforms (Note: UR = Upper reach; MR = Middle reach; LR = Lower reach).
The comparative analysis showed a significant overall reduction in DO concentrations between hydrological periods (p = 0.027, Table S10). This seasonal variability was mainly driven by the upper reach (Student’s t-test, p = 0.003) and the middle reach (Mann–Whitney U test, p = 0.000). In contrast, the lower reach did not show significant seasonal differences (p = 0.495), maintaining persistent levels of hypoxia independent of the flow regime (Figure 3D). This deterioration coincides with a statistically significant increase in TDS (p = 0.002, Table S10), whose values in the lower reach during low flow markedly exceed the levels recorded in the rest of the river (Figure 3C). In terms of organic and physical load, BOD5 showed absolute spatial differences (p = 0.000), maintaining overall seasonal stability (p = 0.855, Table S10). Turbidity showed similar behavior, with high spatial variability (p = 0.000) and significant seasonal changes focused on the upper reach (p = 0.002, Student’s t-test) and lower reach (p = 0.000, Mann–Whitney U test). Box plots (Figure 3G) show that the peak turbidity occurs in the lower reach during the low-flow period, suggesting an effect of sediment and suspended solids concentration.
Finally, nutrients and bacterial load confirmed the diagnosis of health risk. Total phosphorus showed high overall seasonal sensitivity (p = 0.009, Table S10) and extreme specific variations in the lower reach (Figure 3F), validated by the Mann–Whitney U test (p = 0.000, Table S11). Nitrates, although stable overall, revealed highly significant seasonal variation in the lower reach (p = 0.001), where Figure 3E shows an exponential increase during low water flow. This pattern is repeated in TC, which showed severe seasonal degradation in the lower reach. The growth in bacterial load observed in Figure 3H, especially at the end points of the gradient, confirms that health safety is critically compromised by the convergence of low dilutions and persistent anthropogenic pressures.
3.3. Multidimensional Assessment of Water Health Using Quality Indices (WQI)
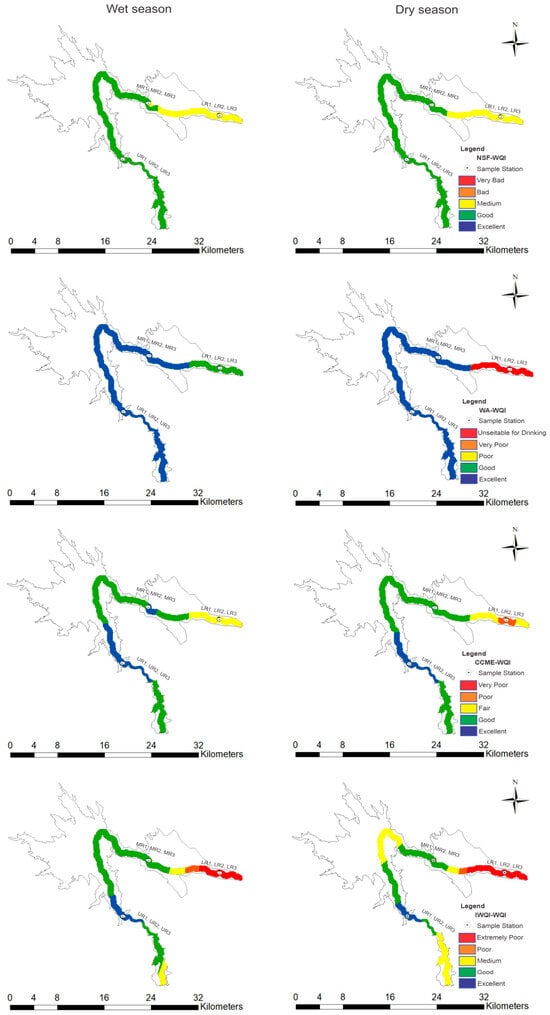
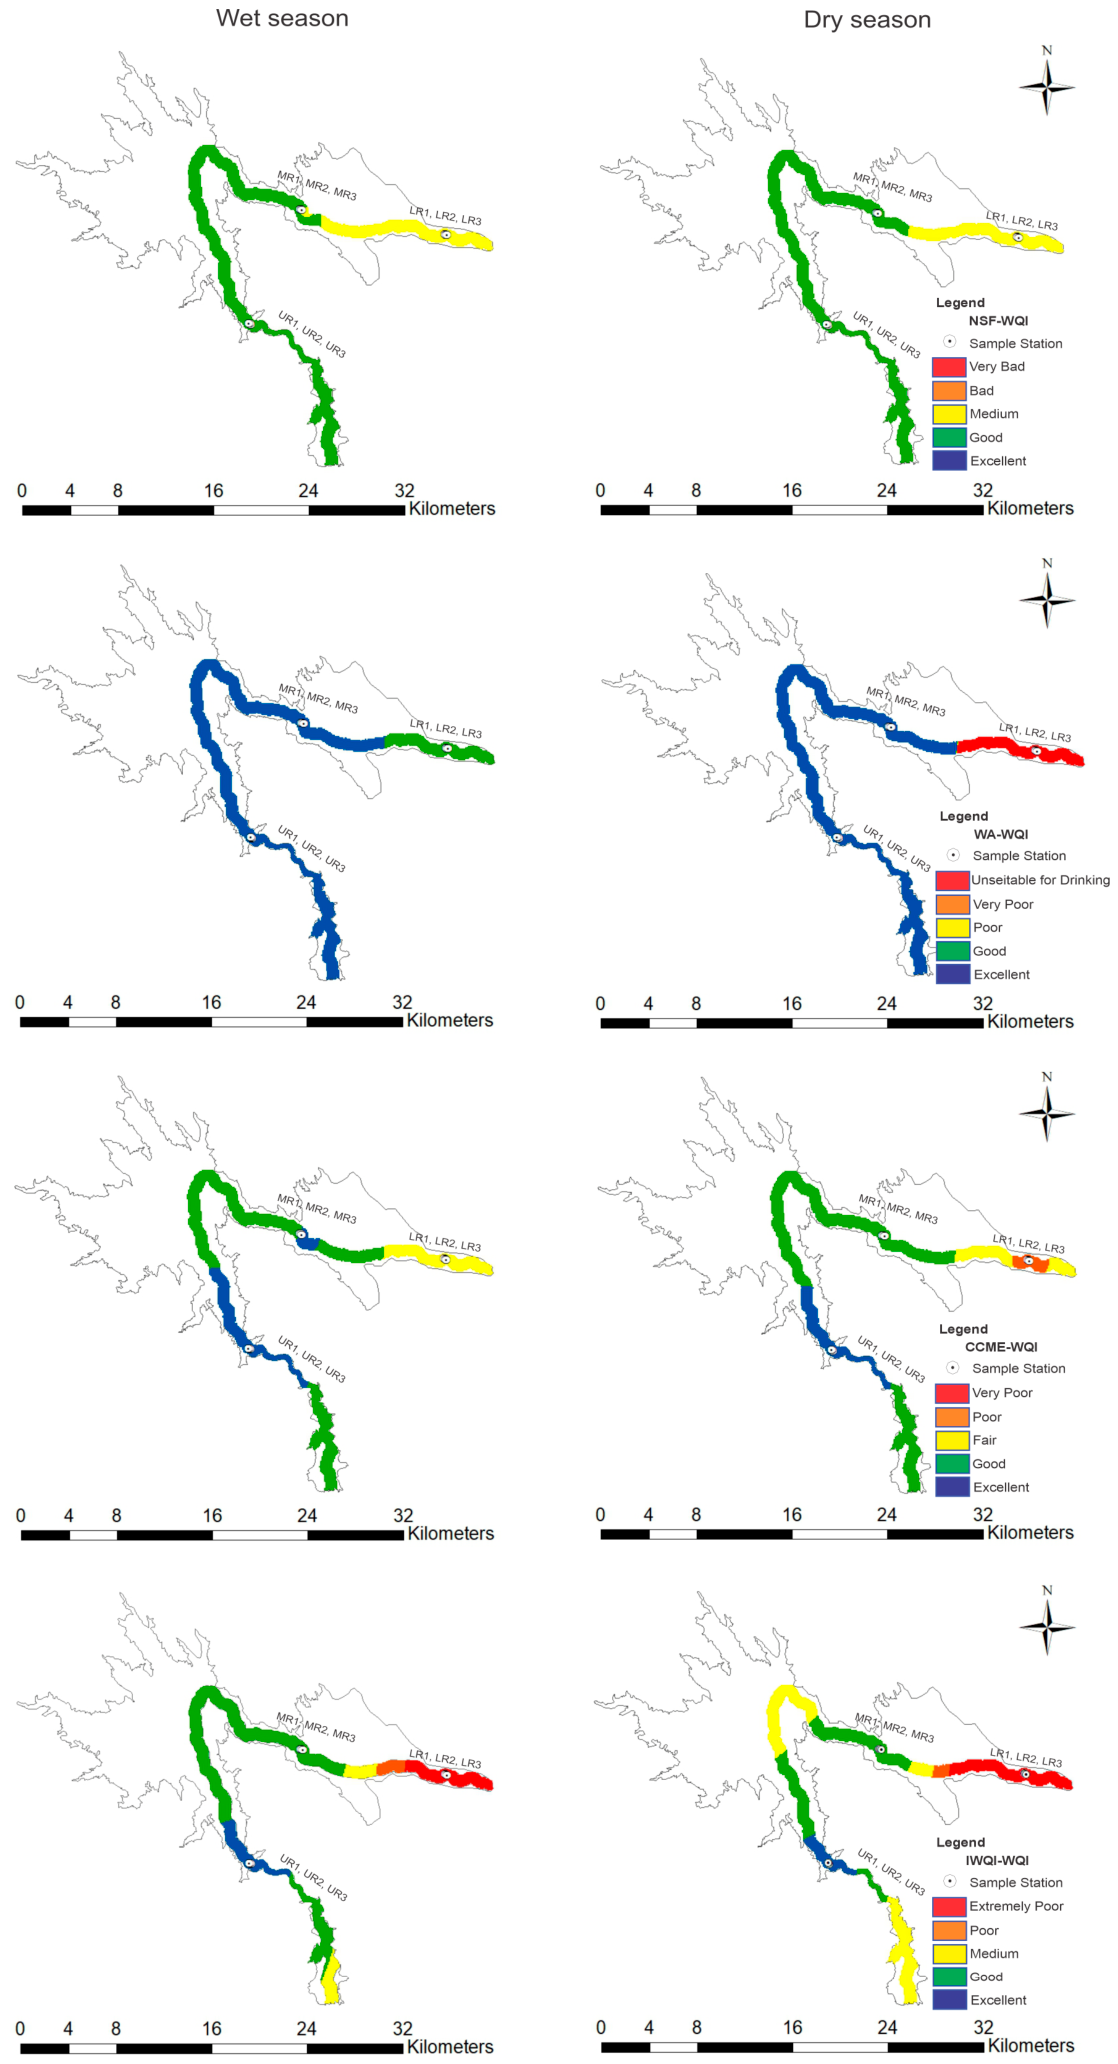
The integrated application of the NSF-WQI, WA-WQI, CCME-WQI, and I-WQI models (Table S12) revealed marked heterogeneity in water health assessment, showing systematic and functional degradation along the Cunas River gradient. Figure 4 shows an absolute predominance of green and blue tones among the four models in the upper reach, confirming optimal conservation conditions at all sampling sites. While the NSF-WQI, WA-WQI, and CCME-WQI register excellent values (above 80 or 90 points on their direct scales), the I-WQI presents low values (15.44–19.76), which, according to its scale, confirm excellent quality due to the minimal load of nutrients and solutes. This benchmark serves as a high-quality reference point, consistently validated by the sensitivity of all indices. In the middle reach, methodological divergence begins to become evident in the face of the first anthropogenic alterations. The NSF-WQI, with values ranging from 68.30 to 73.04, shows greater reactivity in detecting incipient degradation towards the Medium category during low flow. In contrast, the WA-WQI and CCME-WQI remain in the Excellent to Good ranges, showing lower sensitivity or greater algorithmic tolerance to the first pollutant loads. The I-WQI, with values remaining in the Excellent to Good range (up to 33.98), confirms that the water still has chemical characteristics suitable for irrigation, although environmental indices are beginning to indicate the onset of a process of qualitative deterioration. Finally, the lower reach shows a complete sanitary collapse, clearly differentiating the robustness of each index. The NSF-WQI classifies this sector as Medium (53.15–59.87), a rating that is remarkably conservative and unrepresentative of the microbiological reality. In contrast, the WA-WQI and especially the I-WQI capture the severity of the degradation. While the WA-WQI scales up to the Very Poor category, the I-WQI reaches extreme values (322.24), which confirm, due to their high magnitude, that the water is Very Poor and unviable for irrigation due to the critical accumulation of coliforms and ionic load. This diagnostic disparity confirms that, in the face of severe anthropogenic pressure, the I-WQI is the most accurate and sensitive tool for defining the risk of use, transforming the physical reality of the river into a numerical value that warns of the unviability of the resource for multiple uses.
Figure 4.
Spatial distribution of environmental quality indices in the Cunas (Note: UR = Upper reach; MR = Middle reach; LR = Lower reach).
3.4. Chemometric Modeling of Degradation Factors and Anthropogenic Pressure
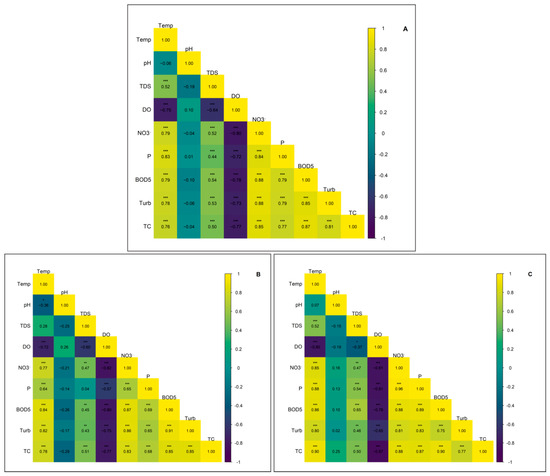
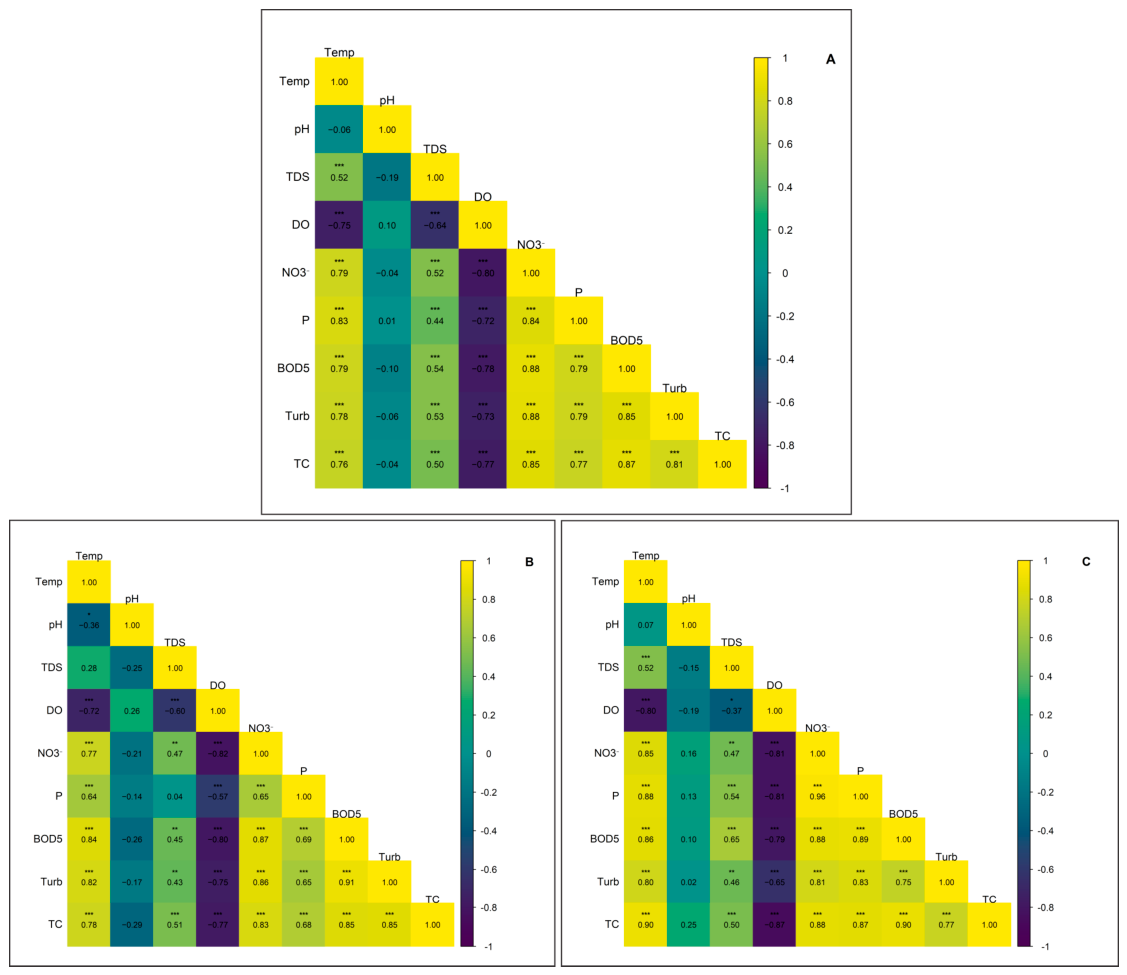
To identify the primary determinants of degradation and characterize the sources of anthropogenic pressure, a Spearman correlation analysis was performed (Figure 5). Most interactions between parameters exhibited high statistical significance (p < 0.001, Table S13); however, associations linked to pH did not reach significance thresholds (p > 0.05), suggesting that the system’s pollutant dynamics are independent of variations in acid–base equilibrium. The comprehensive analysis (Figure 5A) revealed robust positive correlations between temperature and critical loading variables, such as turbidity (ρ = 0.776), BOD5 (ρ = 0.785), and total phosphorus (ρ = 0.829). These results indicate that the influx of nutrients and organic matter is not stochastic but rather follows a synchronous anthropogenic forcing, where wastewater discharges and runoff act as the dominant vectors of degradation. During the high-flow (rainy) season (Figure 5B), a pronounced negative correlation was observed between DO and pollution indicators, notably with NO3− (ρ = −0.795) and BOD5 (ρ = −0.777). The increase in temperature and turbidity during this phase is directly associated with the proliferation of nutrients and bacterial load. Specifically, the inverse relationship between DO and the organic (BOD5) and microbiological (TC, ρ = −0.765) dimensions exhibited critical significance (p < 0.001), confirming that the deoxygenation of the water body is a biologically mediated process. Finally, under low-flow (dry) conditions (Figure 5C), the association between TDS and TC (ρ = 0.496; p < 0.001) demonstrates that the reduction in the river’s dilution capacity exacerbates sanitary vulnerability, promoting the persistence of solutes and pathogens within the lotic system.
Figure 5.
Spearman correlation matrices of physicochemical and microbiological parameters of the water of the Cunas River. (A) Comprehensive analysis (all periods). (B) Hydrochemical dynamics during the rainy season. (C) Degradation synergies during the dry season (Note: The color gradations represent the coefficient ρ, demonstrating the robustness of the associations between organic load and nutrient indicators). * p < 0.05, ** p < 0.01, and *** p < 0.001.
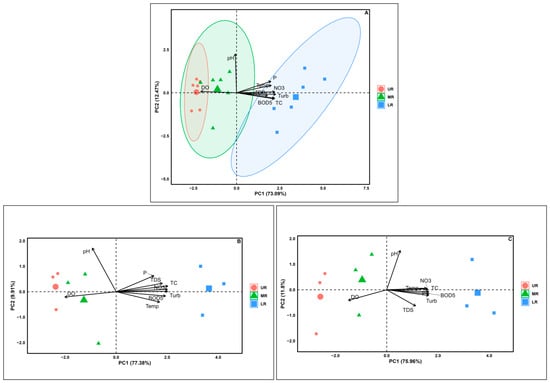
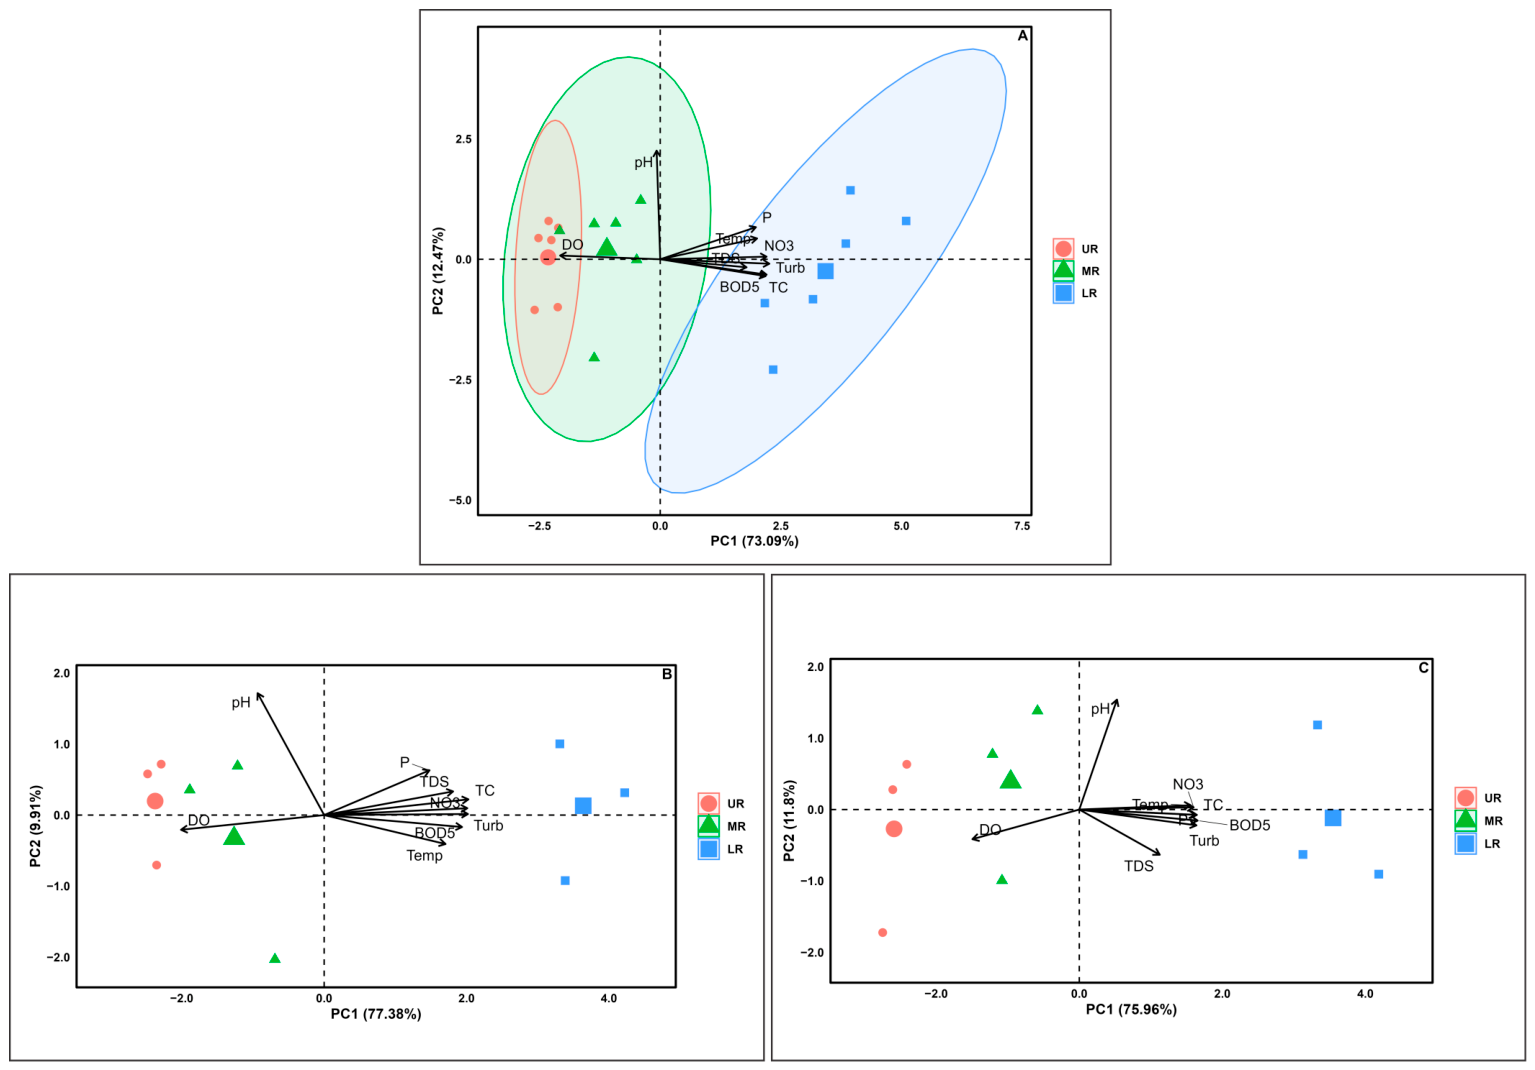
Principal Component Analysis (PCA) complemented these findings by explaining 85.56% of the total accumulated variance through the first two components (Figure 6A, Tables S14–S16). The first principal component (PC1) explained 73.09% of the variance, positively grouping most parameters, while DO showed a robust negative load, evidencing a direct association between water degradation and hypoxia. PC2, which represented 12.47% of the variance, showed positive values for pH, temperature, and NO3−, contrasting with negative values for BOD5, TDS, turbidity, and TC. During the rainy season, PC1 explained 77.38% of the total variance, showing a close relationship between nutrients, turbidity, and TC in the positive sector of the axis. This pattern confirmed that sediment transport and surface runoff act as the main vehicles for TP, NO3−, and bacterial contamination into the riverbed during the rainy season (Figure 6B). In contrast, during low water, PC1 explained 75.96% of the variance, where stations in the lower reaches of the river showed a strong association with physical and organic degradation parameters (BOD5, TDS, TC) in the positive sector, moving away from stations in the upper reaches that were positively correlated with DO (Figure 6C). Under these low-flow conditions, the correlations between TDS, BOD5, and TC intensified to levels above 0.75, reflecting that mineralization and microbiological load were significantly concentrated, exacerbating water quality deterioration due to the river’s reduced dilution capacity. This spatial arrangement in the biplot consolidated the evidence of severe and concentrated deterioration in the lower reach of the Cunas River, statistically validating the synergy between the previously reported degradation parameters.
Figure 6.
Biplot of Principal Component Analysis (PCA) detailing the spatiotemporal segregation of water quality in the Cunas River. (A) Overall grouping of stations and load vectors by component. (B) Influence of runoff on pollutant variance in the rainy season. (C) Pollutant concentration and loss of dilution capacity during low water flow.
3.5. Health Risk Zoning and Water Resilience Capacity
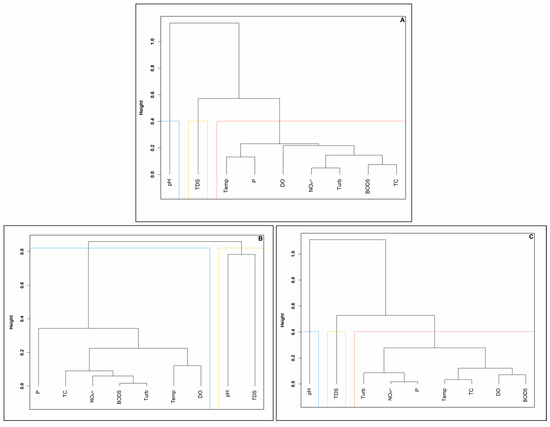
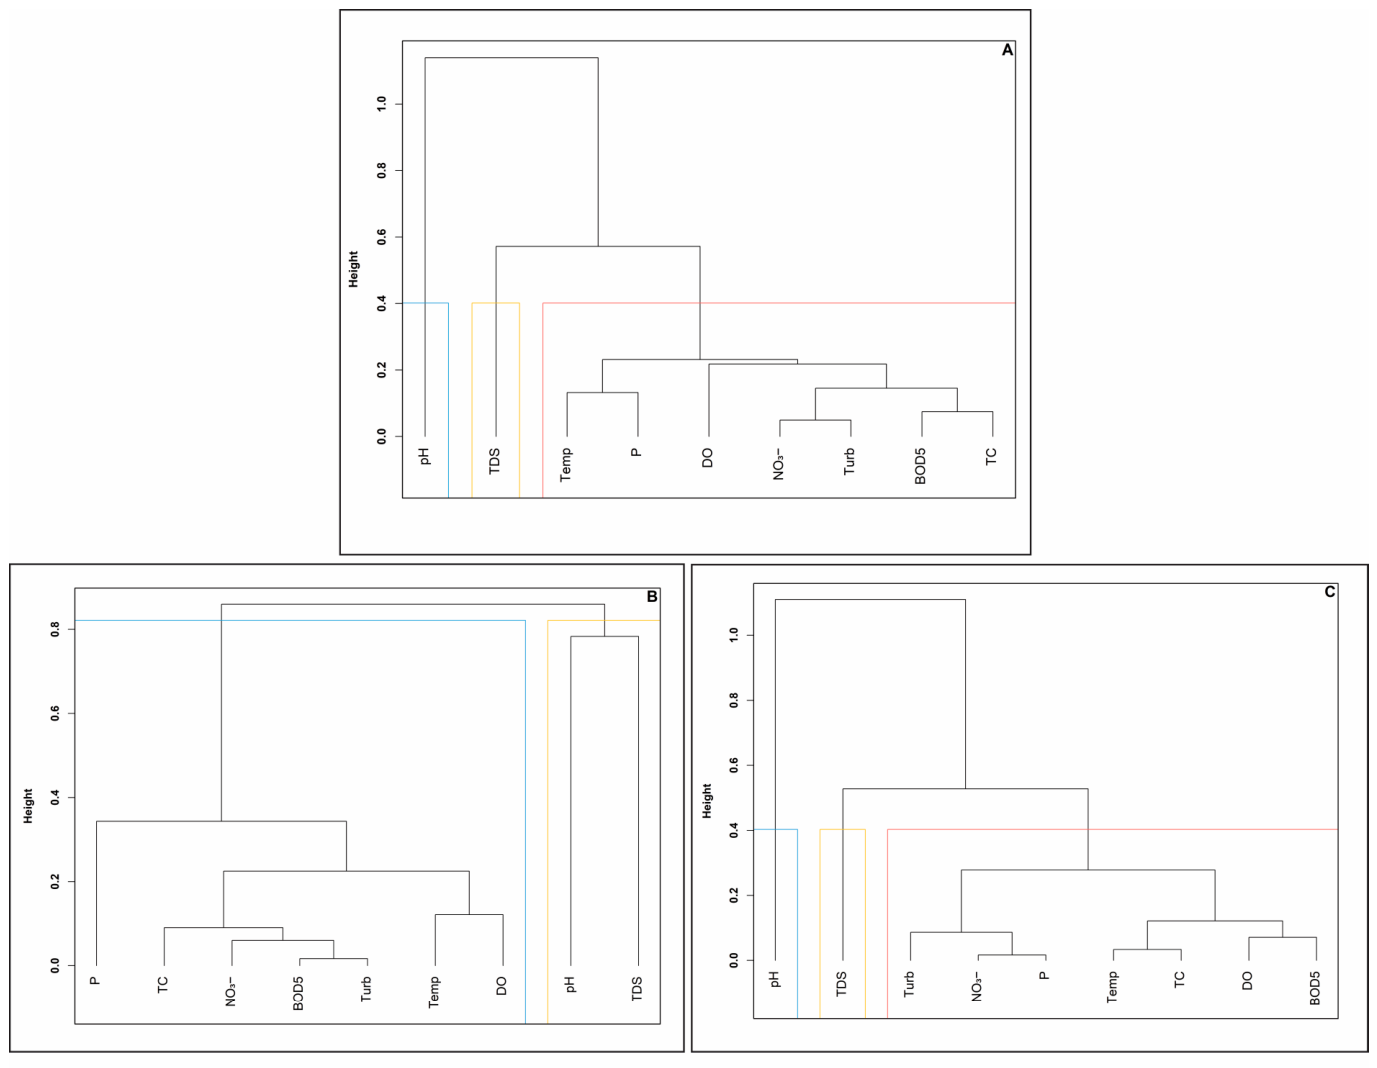
Hierarchical cluster analysis (HCA), performed using Ward’s method and Euclidean squared distance, allowed the physicochemical and microbiological parameters to be grouped according to their degree of functional similarity and anthropogenic origin in the Cunas River sub-basin. The global dendrogram (Figure 7A) revealed a clear segregation of pH from the rest of the monitored parameters, confirming its atypical hydrochemical behavior and consistent buffering capacity against external pollutant loads. A main degradation cluster was identified, consisting of temperature, TP, turbidity, NO3−, and BOD5. This grouping shows a strong synergy between nutrient inputs, organic matter, and increased solids, factors attributable to the convergence of point and diffuse sources along the altitudinal gradient.
Figure 7.
Hierarchical clustering dendrograms based on Ward’s method for identifying functional similarity between parameters. (A) Global cluster structure and hydrochemical isolation of pH. (B) Synergy of organic load and sediment transport during flood periods. (C) Cluster reconfiguration due to concentration effects during low-flow periods (Note: Dissimilarity distances confirm the close relationship between BOD5, TP, and TC in critical areas).
When analyzing the data structure by sampling season, significant reorganizations were observed in the groupings that define the resilience of the system. During the rainy season (Figure 7B), turbidity was closely associated with BOD5 and TC, reinforcing the interpretation that sediment transport by surface runoff is the main vehicle of organic and bacterial contamination during rainfall. In this scenario, TP and DO showed greater dissimilarity with respect to the core contaminants, suggesting a differentiated transport dynamic under high-flow conditions.
In contrast, during low flow (Figure 7C), a critical reconfiguration of the main cluster was observed, where BOD5 and TP exhibited maximum similarity (dissimilarity distance ≈ 0). This finding reflects that, under low-flow conditions, nutrient load and organic matter are concentrated and respond synergistically to the reduction in the dilution volume of the water system, exacerbating the health risk. This clustering structure statistically validated the interdependencies previously identified in Spearman’s correlation matrix (Figure 4) and PCA (Figure 5), consolidating the identification of key indicators for diagnosing water security in the high Andean region.
4. Discussion
4.1. Longitudinal Degradation Dynamics and Thermal Vulnerability of the Ecosystem
The dynamics of water quality in the Cunas River showed a severe longitudinal degradation gradient (p < 0.001), validating the hypothesis that anthropogenic interventions in the lower reaches have altered the integrity of the system. The results show that the increase in temperature (from 9.82 °C to 19.59 °C) is the main factor determining the deterioration. This increase is not only due to the altitudinal gradient but also serves as an indicator of the loss of riparian vegetation caused by agricultural expansion and livestock activities in the lower reaches. This removal of natural buffer zones increases direct solar radiation on the water’s surface—an effect intensified by the high-altitude conditions of the Peruvian Andes—which drastically reduces the solubility of dissolved oxygen (ρ < −0.65). This thermal progression caused critical hypoxia levels (4.58 mg/L) to violate Environmental Quality Standards (EQS ≥ 5 mg/L). This pattern is consistent with that reported by Doretto et al. [27], who examined the dynamics of river systems along a longitudinal gradient, noting how this natural progression is exacerbated by accumulated anthropogenic pressure. Our findings also coincide with those of Ramos-Pacheco et al. [28] in the Chumbao River (Peru), where the calcareous geology provides relative pH stability (p = 0.388 in the Cunas) but is unable to buffer the organic load. The accumulation of TDS, which quadrupled in the lower reach of the river, reflects accelerated mineralization similar to that reported by Bieroza et al. [29], who highlight that the use of high-frequency sensors has made it possible to identify how the enrichment of solutes in the lower areas of the basins is not only an effect of passive accumulation but also the result of complex interactions between water residence time, base flow, and the intensification of anthropogenic sources that dominate the river’s chemodynamics during periods of low flow.
4.2. Aggregation Bias and Diagnostic Efficacy of Multidimensional Models (I-WQI)
A key technical finding of this study is the identification of aggregation bias in traditional assessment models. The diagnostic disparity between the NSF-WQI Medium category and the Unsuitable category determined by the I-WQI and WA-WQI reveals a critical limitation of fixed-weight indices. According to Uddin et al. [30], traditional water quality indices (WQI) have critical limitations in their aggregation structure, since the use of arithmetic or geometric averaging functions induces the phenomenon of overshadowing. This mathematical bias occurs when the impact of microbiological parameters with extreme exceedances, such as those recorded in the lower reach of the Cunas River, is neutralized or masked by the average of other indicators with acceptable values. As a result, the final index underestimates the actual health risk and distorts the ecological status of the water system.
The diagnostic superiority of the I-WQI lies in its algorithmic architecture based on Entropy and CRITIC methods [24]. By basing the weighting on the intrinsic dispersion of the data and the conflict between parameters, the model gave a preponderant mathematical weight to critical excesses, such as 35,006.40 NMP/100 mL of TC. This approach allows the complexity of ecosystems under stress to be captured more robustly than simple linear weightings. This methodology is in line with cutting-edge trends where hybrid models are essential for defining reliable functional quality baselines. In this regard, the comprehensive fuzzy evaluation approach, weighted by entropy, demonstrates that combining subjective expert weights with objective mathematical weights makes it possible to resolve the uncertainty inherent in pollutant class limits. This methodology optimizes the classification of impacted rivers using nonlinear models, identifying transition zones and critical thresholds where water health collapses under severe anthropogenic pressure [31].
4.3. Chemical Analysis of Pollution Sources and Transport Mechanisms
The dynamics of nutrients and solids in the Cunas River are intrinsically linked to seasonality, a phenomenon that Cavallini et al. [32] describe as fundamental to understanding load trends in river systems. Through the articulation of multivariate analyses, it was determined that during the rainy season, the strong correlation between turbidity and nutrients (ρ > 0.80) positions surface runoff from agricultural areas as the main vector of phosphorus and nitrates. This finding is consistent with the research of Wu et al. [33], who argue that in dynamic river systems, sediment transport and runoff dominate water quality variability during rainfall. According to these authors, rainfall intensity and flow act synergistically, exponentially increasing the transport rates of solids and associated pollutants. However, hydrological alternation regulates transport through cycles of accumulation during droughts and massive washing during floods, where high-energy events mobilize accumulated sediments and pollutants [34]. This observation is consistent with the results in the Cunas River, where seasonal vulnerability manifests itself critically during low-water periods. At this stage, dilution capacity decreases dramatically, intensifying nutrient and TDS concentrations under point source control. As Cavallini et al. argue, low discharges exacerbate degradation due to lower biological assimilation and longer residence times, which in the lower section of the Cunas River accelerates the functional collapse of the ecosystem in the face of persistent organic loads.
The PCA confirmed that the total variance in the rainy season is directly linked to factors related to the transport of suspended solids due to soil erosion. Conversely, during the dry season, the intensification of the correlations between TDS, BOD5, and bacterial load (ρ > 0.75) reflects a critical concentration effect due to the reduction in flow. Cluster analysis (HCA) validated this reconfiguration: during low flow, BOD5 and TP exhibited maximum similarity (distance ≈ 0), suggesting a common origin from direct domestic discharges. This phenomenon coincides with the findings of Hridoy et al. [35], who demonstrate that in water ecosystems under pressure, water quality is contingent on anthropogenic discharges. These authors say that stuff like DO and BOD5 are key predictors of the river’s health and any risks to it. In the lower part of the river, this mix of seasonal vulnerability and constant human pressure speeds up the functional collapse, where low flow stops persistent organic loads from being diluted.
4.4. Microbiological Collapse and Health Risk Management in the Lower Reach of the River
The level of thermotolerant coliforms (TC) detected in the lower section of the river constitutes unequivocal evidence of systemic environmental degradation. The four-order-of-magnitude disparity between the baseline in the upper section (3.47 CFU/100 mL) and the critical concentrations in the lower section (>35,000 CFU/100 mL) underscores the extreme vulnerability of the flowing water ecosystem to accumulated anthropogenic pressure. These findings are validated by O’Grady et al. [36], who, using advanced predictive models, confirm that in basins with high anthropogenic pressure, BOD5 and bacterial load are the determining indicators of aquatic disease risk. According to these authors, when quality parameters exceed degradation thresholds, ecosystem resilience is lost, transforming the body of water into an active vector for the spread of pathogens, a reality that is reflected in the bacteriological gap observed in the Cunas River.
Finally, the statistical significance of these variations (p < 0.001) reinforces the need to transition to risk-based management. The technical unfeasibility of the lower reach requires urgent restoration interventions, in line with the adaptive management approaches of Xue et al. [37], which include the optimization of time-targeted remediation programs implemented during low-flow periods. These are significantly more cost-effective, as they allow for the management of concentrated pollutant loads at times when the ecosystem’s self-purification capacity is minimal.
5. Conclusions
This study demonstrates critical spatiotemporal heterogeneity in the water health of the Cunas River, revealing a severe longitudinal degradation gradient that ranges from near-pristine conditions in the upper reach to functional and sanitary collapse in the lower reach of the river. This transition manifests itself in a highly significant temperature increase (p = 0.000), reaching 19.59 ± 1.11 °C during low water, which has an inverse impact on DO levels (ρ < −0.65). While the upper reach maintains optimal DO levels (8.40 ± 0.43 mg/L), the lower reach experiences persistent hypoxia (4.58 ± 1.45 mg/L), exceeding EQS regardless of the flow regime.
Chemometric modeling identified cumulative anthropogenic pressure as the determining factor in this deterioration. Spearman’s correlation analysis confirmed robust synergies (ρ > 0.75) during low flow between TDS, BOD5, and TC, showing that reduced dilution capacity exacerbates mineralization and health risks. Likewise, HCA confirmed this degradation by showing maximum functional similarity (distance of ≈ 0) between BOD5 and TP during low flow, which constitutes statistical evidence that domestic and agricultural discharges have exceeded the system’s self-purification capacity.
The magnitude of the risk was confirmed by microbiological analysis, which showed the load of TC in the lower reach of the river (35,006.40 ± 796.93 NMP/100 mL) exceeds that of the upper reach by four orders of magnitude, far exceeding the EQS for mountain river water (2000 NMP/100 mL). Multidimensional assessment using quality indices positions the I-WQI as the tool with the highest diagnostic sensitivity, categorizing this reach as Unsuitable (322.24) and accurately identifying areas of absolute sanitary collapse. Consequently, the findings highlight the need for a transition towards resilience-based water governance that prioritizes the protection of natural infrastructure in the upper reaches and the implementation of technical risk zoning. Finally, the study establishes a methodological precedent for the management of high Andean watersheds, demonstrating that population health security is intrinsic to maintaining the biophysical limits of the resource in the face of current anthropogenic and climatic pressures.
Supplementary Materials
The following supporting information can be downloaded at https://www.mdpi.com/article/10.3390/w18091057/s1, Table S1. Comparison of water quality classification ranges for different water quality indices (NSF-WQI, WA-WQI, CCME-WQI, and I-WQI). Table S2. Normality test (Shapiro–Wilk) of the physical-chemical and microbiological parameters of the water from the Cunas River, according to sampling season. Table S3. Normality test (Shapiro–Wilk) of the physical-chemical and microbiological parameters in the upper, middle, and lower reaches, according to sampling season. Table S4. Homogeneity of variances (Levene’s test) for seasonal comparisons by river segment. Table S5. Gradient lengths obtained by detrended correspondence analysis (DCA) prior to PCA. Table S6. Descriptive statistics of the physicochemical and microbiological parameters of the water in the upper reach of the Cunas River, according to sampling season. Table S7. Descriptive statistics of the physicochemical and microbiological parameters of the water in the middle reach of the Cunas River, according to sampling season. Table S8. Descriptive statistics of the physicochemical and microbiological parameters of the water in the lower reach of the Cunas River, according to sampling season. Table S9. Significance tests of the physicochemical and microbiological parameters in the upper, middle, and lower reaches of the Cunas River, according to sampling season. Table S10. Significance tests for physicochemical and microbiological parameters in the wet and dry seasons. Table S11. Significance tests for physicochemical and microbiological parameters in the upper, middle, and lower reaches of the Cunas River, according to sampling seasons (wet and dry season). Table S12. Comparative assessment of water health using the NSF-WQI, WA-WQI, CCME-WQI, and I-WQI indices according to the section of the Cunas River and hydrological scenario. Table S13. Spearman rank correlation coefficients, p-values, and significance levels among physicochemical and microbiological parameters. Table S14. Summary of the principal component analysis (PCA) of the physicochemical and microbiological parameters of the water of the Cunas River during the wet and dry seasons. Table S15. Summary of the principal component analysis (PCA) of the physicochemical and microbiological parameters of the water of the Cunas River during the wet season. Table S16. Summary of the principal component analysis (PCA) of the physicochemical and microbiological parameters of the water of the Cunas River during the dry season.
Author Contributions
Conceptualization, M.C. and J.H.; methodology, M.C., Y.H. and J.H.; validation, M.C.; formal analysis, Y.H. and J.H.; investigation, M.C., Y.H. and J.H.; resources, M.C.; data curation, Y.H.; writing—original draft preparation, M.C.; writing—review and editing, M.C., Y.H. and J.H.; visualization, M.C.; supervision, M.C.; project administration, M.C. and J.H.; funding acquisition, M.C. All authors have read and agreed to the published version of the manuscript.
Funding
This research was funded by the Universidad Nacional del Centro del Perú, under Resolution N° 1042-R-2022.
Data Availability Statement
The original contributions presented in this study are included in the article/Supplementary Materials. The data are available by contacting the corresponding authors for collaboration or other reasonable requests.
Acknowledgments
Sincere thanks to the Water Research Laboratory of the Universidad Nacional del Centro del Perú for their invaluable support. During the preparation of this manuscript, the authors used the generative AI (https://gemini.google.com/) solely to improve manuscript readability and bibliographic reference management. The tools were not used to generate data, perform analyses, or derive scientific conclusions. The authors reviewed and edited the output and take full responsibility for the content of this publication.
Conflicts of Interest
The authors declare no conflicts of interest.
References
- He, C.; Liu, Z.; Wu, J.; Pan, X.; Fang, Z.; Li, J.; Bryan, B.A. Future Global Urban Water Scarcity and Potential Solutions. Nat. Commun. 2021, 12, 4667. [Google Scholar] [CrossRef] [Scilit]
- Mokarram, M.; Saber, A.; Sheykhi, V. Effects of Heavy Metal Contamination on River Water Quality Due to Release of Industrial Effluents. J. Clean. Prod. 2020, 277, 123380. [Google Scholar] [CrossRef] [Scilit]
- Lokman, A.; Ismail, W.Z.W.; Aziz, N.A.A. A Review of Water Quality Forecasting and Classification Using Machine Learning Models and Statistical Analysis. Water 2025, 17, 2243. [Google Scholar] [CrossRef] [Scilit]
- Desbureaux, S.; Mortier, F.; Zaveri, E.; Van Vliet, M.T.H.; Russ, J.; Rodella, A.S.; Damania, R. Mapping Global Hotspots and Trends of Water Quality (1992–2010): A Data Driven Approach. Environ. Res. Lett. 2022, 17, 114048. [Google Scholar] [CrossRef] [Scilit]
- Jones, E.R.; Bierkens, M.F.P.; Van Vliet, M.T.H. Current and Future Global Water Scarcity Intensifies When Accounting for Surface Water Quality. Nat. Clim. Change 2024, 14, 629–635. [Google Scholar] [CrossRef] [Scilit]
- Shamsudduha, M.; Lee, J.; Joseph, G.; Bahuguna, A.; Wijesundera, S.; Nair, S.S.; Hoo, Y.R.; Wang, Q.; Ayling, S.C.E. Assessing the Water Quality Hazard and Challenges to Achieving the Freshwater Goal in Sri Lanka. Sci. Rep. 2025, 15, 10187. [Google Scholar] [CrossRef] [Scilit]
- Drenkhan, F.; Carey, M.; Huggel, C.; Seidel, J.; Oré, M.T. The Changing Water Cycle: Climatic and Socioeconomic Drivers of Water-related Changes in the Andes of Peru. WIREs Water 2015, 2, 715–733. [Google Scholar] [CrossRef] [Scilit]
- Shayo, G.M.; Elimbinzi, E.; Shao, G.N.; Fabian, C. Severity of Waterborne Diseases in Developing Countries and the Effectiveness of Ceramic Filters for Improving Water Quality. Bull. Natl. Res. Cent. 2023, 47, 113. [Google Scholar] [CrossRef] [Scilit]
- Lv, M.; Niu, X.; Zhang, D.; Ding, H.; Lin, Z.; Zhou, S.; Zhu, Y. A Data-Driven Framework for Spatiotemporal Analysis and Prediction of River Water Quality: A Case Study in Pearl River, China. Water 2023, 15, 257. [Google Scholar] [CrossRef] [Scilit]
- Flores-Gómez, S.; Costa, A.B.D.; Lobo, E.A. Assessment of Water Quality in High-Pressure Peruvian Anthropic Sectors of Lake Titicaca Using a Calibrated Index. J. Geosci. Environ. Prot. 2024, 12, 97–114. [Google Scholar] [CrossRef]
- Das, A. Surface Water Quality Evaluation Impacting Drinking Water Sources and Sanitation Using Water Quality Index, Multivariate Techniques, and Interpretable Machine Learning Models in Mahanadi River, Odisha (India). Environ. Geochem. Health 2025, 47, 497. [Google Scholar] [CrossRef] [Scilit]
- Huang, Y.; Cai, Y.; He, Y.; Dai, C.; Wan, H.; Guo, H. A Water Quality Prediction Approach for the Downstream and Delta of Dongjiang River Basin under the Joint Effects of Water Intakes, Pollution Sources, and Climate Change. J. Hydrol. 2024, 640, 131686. [Google Scholar] [CrossRef] [Scilit]
- Amiri, V.; Rezaei, M.; Sohrabi, N. Groundwater Quality Assessment Using Entropy Weighted Water Quality Index (EWQI) in Lenjanat, Iran. Environ. Earth Sci. 2014, 72, 3479–3490. [Google Scholar] [CrossRef] [Scilit]
- Reshma, A.S.; Nandanan, K.; Ekkirala, H.C.; Ajith, V.; Sudheer, A.; Guntha, R.; Ramesh, M.V. Unravelling water sustainability: A decentralised, data-driven model for water governance. Sci. Rep. 2026. [Google Scholar] [CrossRef] [Scilit]
- Dominguez Franco, H.; Custodio, M.; Peñaloza, R.; De La Cruz, H. Application of Multivariate Statistical Methods and Water Quality Index for the Evaluation of Surface Water Quality in the Cunas River Basin, Peru. Asian J. Water Environ. Pollut. 2021, 18, 19. [Google Scholar] [CrossRef] [Scilit]
- Autoridad Nacional del Agua [ANA]; Typsa–Tecnoma–Engecorps Consortium, Inclam Group. Water Resources Assessment in the Mantaro River Basin. Lima, Peru, 2015.
- Custodio, M.; Peñaloza, R.; Alvarado, J.; Chanamé, F.; Maldonado, E. Surface Water Quality in the Mantaro RiverWatershed Assessed after the Cessationof Anthropogenic Activities Dueto the COVID-19 Pandemic. Pol. J. Environ. Stud. 2021, 30, 3005–3018. [Google Scholar] [CrossRef] [Scilit]
- Lipps, W.C.; Braun-Howland, E.B.; Baxter, T.E. Standard Methods for the Examination of Water and Wastewater, 24th ed.; American Public Health Association: Wahington, DC, USA, 2023. [Google Scholar]
- Brown, R.M.; McClelland, N.I.; Deininger, R.A.; O’Connor, M.F. A Water Quality Index—Crashing the Psychological Barrier. In Proceedings of the Indicators of Environmental Quality; Thomas, W.A., Ed.; Springer: Boston, MA, USA, 1972; pp. 173–182. [Google Scholar]
- Ramakrishnaiah, C.R.; Sadashivaiah, C.; Ranganna, G. Assessment of Water Quality Index for the Groundwater in Tumkur Taluk, Karnataka State, India. J. Chem. 2009, 6, 757424. [Google Scholar] [CrossRef] [Scilit]
- Panagopoulos, Y.; Alexakis, D.E.; Skoulikidis, N.T.; Laschou, S.; Papadopoulos, A.; Dimitriou, E. Implementing the CCME Water Quality Index for the Evaluation of the Physicochemical Quality of Greek Rivers. Water 2022, 14, 2738. [Google Scholar] [CrossRef] [Scilit]
- Bretcan, P.; Tanislav, D.; Radulescu, C.; Serban, G.; Danielescu, S.; Reid, M.; Dunea, D. Evaluation of Shallow Groundwater Quality at Regional Scales Using Adaptive Water Quality Indices. Int. J. Environ. Res. Public Health 2022, 19, 10637. [Google Scholar] [CrossRef] [Scilit]
- Chen, Y.-L.; Shen, S.-L.; Zhou, A. Assessment of Red Tide Risk by Integrating CRITIC Weight Method, TOPSIS-ASSETS Method, and Monte Carlo Simulation. Environ. Pollut. 2022, 314, 120254. [Google Scholar] [CrossRef] [Scilit]
- Das, A. Surface Water Quality Evaluation, Apportionment of Pollution Sources and Aptness Testing for Drinking Using Water Quality Indices and Multivariate Modelling in Baitarani River Basin, Odisha. HydroResearch 2025, 8, 244–264. [Google Scholar] [CrossRef] [Scilit]
- Gautam, V.K.; Kothari, M.; Al-Ramadan, B.; Singh, P.K.; Upadhyay, H.; Pande, C.B.; Alshehri, F.; Yaseen, Z.M. Groundwater Quality Characterization Using an Integrated Water Quality Index and Multivariate Statistical Techniques. PLoS ONE 2024, 19, e0294533. [Google Scholar] [CrossRef] [Scilit] [PubMed]
- Ministerio del Ambiente (MINAM). Aprueban Estándares de Calidad Ambiental (ECA) para Agua y establecen Disposiciones Complementarias (Environmental Quality Standards for Water): Decreto Supremo N° 004-2017-MINAM; El Peruano: Lima, Peru, 2017. [Google Scholar]
- Doretto, A.; Piano, E.; Larson, C.E. The River Continuum Concept: Lessons from the Past and Perspectives for the Future. Can. J. Fish. Aquat. Sci. 2020, 77, 1853–1864. [Google Scholar] [CrossRef] [Scilit]
- Ramos-Pacheco, B.S.; Choque-Quispe, D.; Ligarda-Samanez, C.A.; Solano-Reynoso, A.M.; Choque-Quispe, Y.; Aguirre Landa, J.P.; Agreda Cerna, H.W.; Palomino-Rincón, H.; Taipe-Pardo, F.; Zamalloa-Puma, M.M.; et al. Water Pollution Indexes Proposal for a High Andean River Using Multivariate Statistics: Case of Chumbao River, Andahuaylas, Apurímac. Water 2023, 15, 2662. [Google Scholar] [CrossRef] [Scilit]
- Bieroza, M.; Acharya, S.; Benisch, J.; Ter Borg, R.N.; Hallberg, L.; Negri, C.; Pruitt, A.; Pucher, M.; Saavedra, F.; Staniszewska, K.; et al. Advances in Catchment Science, Hydrochemistry, and Aquatic Ecology Enabled by High-Frequency Water Quality Measurements. Environ. Sci. Technol. 2023, 57, 4701–4719. [Google Scholar] [CrossRef] [Scilit] [PubMed]
- Uddin, M.G.; Nash, S.; Rahman, A.; Olbert, A.I. A Comprehensive Method for Improvement of Water Quality Index (WQI) Models for Coastal Water Quality Assessment. Water Res. 2022, 219, 118532. [Google Scholar] [CrossRef] [Scilit]
- Ren, J.; Han, G.; Gao, X.; Zhang, S. Water Quality Assessment in a Megacity River: Water Chemical Analysis Integrated with AHP-Entropy Weighted Fuzzy Comprehensive Evaluation Model. J. Environ. Sci. 2026, 162, 121–130. [Google Scholar] [CrossRef] [Scilit]
- Cavallini, E.; Viaroli, P.; Naldi, M.; Saccò, M.; Scibona, A.; Barbieri, E.; Franceschini, S.; Nizzoli, D. Seasonal Variability and Hydrological Patterns Influence the Long-Term Trends of Nutrient Loads in the River Po. Water 2024, 16, 2628. [Google Scholar] [CrossRef] [Scilit]
- Wu, J.; Liu, W.; Zhang, J.; Chen, X.; Yu, Z.; Luan, J.; Tian, Y.; Lan, T.; Li, X.; Wang, G. Sediment Transport Rate Variability over Time: Individual and Synergistic Effects of Precipitation and Flow. J. Hydrol. Reg. Stud. 2025, 59, 102410. [Google Scholar] [CrossRef] [Scilit]
- Bentivenga, M.; De Vente, J.; Giano, S.I.; Prosser, G.; Piccarreta, M. Suspended Sediment Yield under Alternating Dry/Wet Cycles in a Mediterranean River Catchment: The Case of the Ofanto River, Southern Italy. Hydrol. Sci. J. 2023, 68, 1809–1825. [Google Scholar] [CrossRef] [Scilit]
- Hridoy, M.A.A.M.; Shawkat, A.I.; Bordin, C.; Acharjee, M.R.; Masood, A.; Baki, A.O.; Al Mamun, M.A. Advanced Machine Learning Models for Accurate Water Quality Classification and WQI Prediction: Implications for Aquatic Disease Risk Management. Sci. Total Environ. 2025, 1008, 180965. [Google Scholar] [CrossRef] [Scilit] [PubMed]
- O’Grady, J.; Zhang, D.; O’Connor, N.; Regan, F. A Comprehensive Review of Catchment Water Quality Monitoring Using a Tiered Framework of Integrated Sensing Technologies. Sci. Total Environ. 2021, 765, 142766. [Google Scholar] [CrossRef] [Scilit] [PubMed]
- Xue, J.; Yuan, C.; Ji, X.; Zhang, M. Predictive Modeling of Nitrogen and Phosphorus Concentrations in Rivers Using a Machine Learning Framework: A Case Study in an Urban-Rural Transitional Area in Wenzhou China. Sci. Total Environ. 2024, 910, 168521. [Google Scholar] [CrossRef] [Scilit] [PubMed]

Disclaimer/Publisher’s Note: The statements, opinions and data contained in all publications are solely those of the individual author(s) and contributor(s) and not of MDPI and/or the editor(s). MDPI and/or the editor(s) disclaim responsibility for any injury to people or property resulting from any ideas, methods, instructions or products referred to in the content. |
© 2026 by the authors. Licensee MDPI, Basel, Switzerland. This article is an open access article distributed under the terms and conditions of the Creative Commons Attribution (CC BY) license.