


Abstract
The aim of this study is to conduct a comprehensive assessment of the water quality of the Sidi Mohammed Ben Taiba (SMBT), one of the largest drinking water reservoirs in northwestern Algeria, by integrating chemical and biological indicators. The assessment combines the Drinking Water Quality Index (DWQI), the Irrigation Water Quality Index (IWQI), the Organic Pollution Index (OPI) and zooplankton-based biological indicators (Zoo-IQ). A total of 23 physicochemical parameters were analyzed and interpreted using multivariate statistical approaches. This study fills an important knowledge gap by evaluating long-term temporal variability (January 2018–May 2025) and recent spatial heterogeneity (June 2023–May 2025), aiming to support sustainable water management. The results indicate that the reservoir water quality is generally suitable for drinking purposes (22.3 < DWQI < 54.0), is deemed excellent for agricultural irrigation (65 < IWQI < 69) and that the reservoir surface waters are slightly polluted to unpolluted (0.3 < OPI < 1.1). However, a deterioration in water quality has been detected in recent years, linked to increasing nutrient concentrations, as confirmed by the TSI–SD index. Despite the early signs of nutrient enrichment, the Zoo-IQ index remained within the moderate to good range, suggesting a certain degree of resilience in the zooplankton community. However, pronounced seasonal fluctuations observed in the Zoo-IQ and species diversity (H′) during periods of environmental stress serve as an early warning signal of emerging problems that may negatively affect water quality indices (WQI, IWQI, OPI). Station S4, located at the confluence of Wadi Belhassen and Wadi Farhat, descending from the Dahra mountain range in Algeria, has been identified as the most sensitive area and a potential hotspot for future pollution. The study provides robust data on the quality of reservoir water, offering a valuable decision-making tool for artificial reservoir managers and contributing to sustainable water management by identifying risk areas and supporting the implementation of preventive measures.
1. Introduction
Water is fundamental to life and constitutes a cornerstone of ecosystem functioning and human well-being. It plays an essential role in sustaining the health and balance of ecosystems, habitats, and rural or urban communities [1,2,3]. However, rapid population growth, urbanization, and the intensification of human activities have substantially increased the release of physical, chemical, and biological pollutants into aquatic environments, leading to a widespread deterioration of surface water quality [2]. Surface water pollution disrupts ecosystem functions and poses serious health risks to humans, animals, and plants. Most critically, it endangers the sustainability of water resources essential for meeting both human and environmental needs [4]. High-quality, pure water is used for daily consumption, domestic supply, irrigation, recreation, and industrial activities [5,6]. Its suitability depends on the types and concentrations of pollutants, which are often assessed through standardized criteria and incorporated into water quality indicators [7]. These indicators support decision-making and enhance communication in water management by providing a single, comprehensive value [2], and they are widely applied worldwide, including in countries such as India, the United States [8], Russia [9], Egypt [10], and Algeria [11]. This approach is a comprehensive tool for assessing the overall water situation, but it does not sufficiently account for more integrative biological parameters. Zooplankton communities are present in all surface water bodies and can reflect environmental conditions. Stamou et al. [12] developed a zooplankton quality index (Zoo-IQ) to assess lake water quality in the Mediterranean, using a five-level system, based on abundance, biomass, body weight, and the proportion of Cladocera. It is therefore essential to link the physicochemical and chemical indicators with zooplankton communities, which serve as the connection between phytoplankton and fish [13,14], as this linkage reflects the function and stability of the ecosystem and provides comprehensive, integrated, and accurate results [15].
In our study, we used the Drinking Water Quality Index (DWQI) to estimate the suitability of water for human consumption according to World Health Organization standards, and the Irrigation Water Quality Index (IWQI) to assess the suitability of water for agricultural purposes. The IWQI is often evaluated using metrics such as the Sodium Absorption Ratio (SAR), Residual Sodium Carbonate (RSC), Permeability Index (PI), Kelly Ratio (KR), and Soluble Sodium Percentage (SSP). Understanding the factors that affect soil and plants is of utmost importance, especially in arid and semi-arid regions that rely on dam water during periods of low rainfall. We also used the Overall Pollution Index (OPI), which unlike the Water Quality Index that provides a broad general assessment focuses specifically on the degree of pollution in the water source [1]. To ensure that our results are accurate and comprehensive, we incorporated a zooplankton-based quality index, which is particularly important for understanding the dynamics of water pollution and providing a clear forward-looking perspective.
In Algeria, the level of surface water pollution is increasing due to untreated wastewater and agricultural runoff. With the rising demand for freshwater and the limited availability of this resource, the need to protect water resources has become increasingly urgent [1]. For this reason, there is a need for integrated assessment tools, especially for artificial storage dams [16], such as the Sidi Mohamed Ben Taiba reservoir (SMBT), which provides water for irrigation and domestic use in northwestern Algeria. This reservoir was monitored over eight years (January 2018–May 2025) and the analysis was complemented by an analysis of the spatial heterogeneity of its physical, chemical, and biological parameters (June 2023–May 2025).
This study aims to (i) provide a comprehensive assessment of the water quality of the SMBT reservoir from January 2018 to May 2025 by integrating multiple chemical and biological indices, including the Drinking Water Quality Index, Irrigation Water Quality Index, Pollution Index, and Zooplanktonic Index, and (ii) identify spatial (2023–2025) and temporal patterns (2018–2025) of water quality degradation and pollution drivers, thereby supporting sustainable water management.
2. Materials and Methods
2.1. Study Area
Sidi Mohammed Ben Taiba Lake Reservoir (N 36°19′10″, E 2°1′35″) is located on Oued Beda “a northern tributary of Oued Cheliff” 150 km from Algiers in the commune of Arib (wilaya of Ain Defla). The reservoir site is located immediately downstream from the confluence of Oued Ferhat and Oued El Had, which join to form Oued Ebda (Figure 1). Commissioned in 2005, the reservoir drains a 194 km2 watershed, with an average annual inflow of 29 hm3 (Hydrological Basin Agency), an initial storage capacity of 75 hm3, a regulated volume of 56 hm3 per year, and a height of 48 m [17].
Figure 1.
Location map of the study area and sampling stations within the SMBT reservoir.
The main objective of the reservoir is to regulate the water supply from Oued Ebda, in order to meet the needs for irrigation of the El Amra–Abadia perimeter (8500 ha), as well as to strengthen the drinking water supply for the localities of Ain Defla, Khemis-Miliana, and Sidi-Lakhdar [17]. A general feature of the reservoir is given in Table 1.
Table 1.
Means values (±SE) of physicochemical parameters in SMBT reservoir (June 2023 to May 2025; n = 23) in the four stations (S1, S2, S3, and S4).
2.2. Water and Biological Samplings
Surface water samples were taken monthly over eight years from January 2018 to May 2025; only one station (S1), located at the deepest point of the reservoir, was used per month for long-term monitoring. For spatial monitoring of potential sources of pollution, four stations were monitored for a two-year period (June 2023 to May 2025) (Figure 1). These stations were located in front of each tributary of the reservoir in order to highlight potential sources of pollution from these tributaries.
In situ measurements of physical and chemical parameters including Electrical Conductivity (EC), Total Dissolved Solids (TDS), pH, Salinity (Sal), Water Temperature (TW), and Turbidity (Tur) were carried out using a YSI Pro DSS multiparameter probe (YSI Inc., Yellow Springs, OH, USA). Water transparency was determined using a Secchi disk (20 cm diameter). At each sampling date, water samples were kept at 4 °C in the dark in a pre-rinsed 1 L polypropylene bottle, and they were examined within 24 h.
The analysis methods followed those advocated by Rodier [18], and were conducted in the laboratory; nitrate (NO3−), nitrite (NO2−), sulfate (SO42−), phosphate (PO43−) and chlorophyll-a were measured by molecular absorption spectrometry, while ammonium (NH4+), aluminum (Al3+), manganese (Mn2+), and iron (Fe2+) were measured by spectrophotometric methods. In addition, the concentrations of calcium (Ca2+), magnesium (Mg2+), bicarbonate (CO3−), total hardness, organic matter (OM), and chloride concentration (Cl−) were determined by volumetric titration; sodium (Na+) and potassium (K+) were analyzed by flame spectrophotometry (Corning 410). These chemical parameters are required to compute the water quality indices (Table S2).
Zooplankton were collected using a plankton net (35 cm diameter, 75 cm length, 55 µm mesh size) and were integratively sampled from depths of 0–10 m to the surface. All collected samples were preserved in 50 mL bottles with a 5% formalin solution. The volume of filtered water was calculated using the following equation, V = π × 2r × d, where V is the volume of filtered water, r is the radius of the net mouth, and d is the distance the net was towed. To ensure representative zooplankton counts, a 10 mL subsample was taken for species identification and counting under a Leica compound microscope. The total biomass (μg.L−1) was calculated according to Bottrell et al. 1976 [19]
where nᵢ = number of individuals of species i (ind.L−1), wᵢ = weight of a single individual of species i (μg.ind−1), a = coefficient determined for each species, and b = exponent that determines how weight changes with body length.
Zooplankton taxonomy was determined according to Shiel [20] for rotifers, and [21] for Cladocerans and copepods. Zooplankton density in each sample was expressed as the total number of individuals per cubic meter (ind/m3).
2.3. Calculation of the Drink Water Quality Index (DWQI)
The Drinking Water Quality Index (DWQI) is an analytical tool designed to integrate various water quality physicochemical parameters. It aggregates inputs such as temperature, pH, turbidity, and dissolved oxygen into a single, composite numerical value [22]. The primary objective of the DWQI [23] is to provide a comprehensive yet easily understandable assessment of the overall water quality status (Table S3). It is one of the most important factors that affect consumer health [24,25]. The calculation of the DWQI involves four main steps [22,26];
- 1
- Calculating the relative weight (Wi).
Wi is the weight of each parameter and n is the number of parameter (n = 22)
- 2
- Calculating the quality rating scale for each parameter (qi) by dividing its concentration in each water sample by its specified standards according to the World Health Organization and multiplying the results by 100.
Ci is the concentration of each chemical parameter in each sample in mg.L−1 and Si is the World Health Organization (WHO) guideline for each parameter in mg.L−1 according to the WHO.
- 3
- Defining SI for each parameter.
- 4
- The sum of SI values gives a water quality index for each sample.
SIi is the sub-index of parameter i, and qi is the rating based on concentration of parameter i and n is the number of parameters.
2.4. Calculation of the Irrigation Water Quality (IWQI)
The Irrigation Water Quality Index (IWQI) index is a tool of integrating several chemical parameters related to soil and plant irrigation into a single value that facilitates the assessment of water suitability for irrigation [27] (Table S3). The calculation of the IWQI involves four main steps [26,27];
- 1
- Calculation of sub-indicators (meq.L−1).
- 2
- Assigning a weight (Wi) to each indicator according to its importance for irrigation.
- 3
- Calculating the sub-score (Qi) for each indicator.
Qi = (calculated value/standard value) × 100 (The standard according to WHO)
- 4
- Final IWQI calculation.
2.5. Calculation of the Overall Pollution Index (OPI) for Surface Waters
The Overall Pollution Index (OPI) serves as an essential tool in environmental risk management, guiding efforts to reduce pollution (Table S3). By pinpointing specific pollutants and their sources [28]. In general, the OPI is calculated as the sum of the products of individual pollution factors (Pi) and their corresponding relative weights (Wi), where the weights are assigned according to the significance of each parameter in the overall evaluation of water quality, as follows [1,29].
OPI: Overall Pollution Index;
Wi: Relative weight of parameter i (based on its importance);
Pi: Pollution factor of parameter i;
Calculate the sub-index for each pollutant (Pix).
where
Cx is the concentration of the pollutant x in the water, and Cmax is the maximum permissible concentration for pollutant x based on environmental standards.
2.6. Calculation of Zooplankton Index of Quality Assessment (Zoo-IQ)
Zoo-IQ is an index that assesses overall degradation, combining endpoint metrics that respond to pressures from both eutrophication and fish predation [12]. It measures aspects (group dominance, body weight) that are influenced by the temporal succession of the zooplankton community [30]. RZoo was excluded from the composite Zoo-IQ to avoid bias in the final classification, while it was retained for ecological interpretation. Due to the low relative contribution of Calanoida, more than 90% of the samples exhibited zero values (only 9 out of 87 were non-zero), indicating very low occurrence and a zero-inflated distribution with limited variability. It was calculated according to the following equation according to Stamou et al. [12], as detailed below:
Zoo-IQ = AZoo + BZoo + RZoo + MWZoo + RClad
Zoo-IQ = AZoo + BZoo + MWZoo + RClad
AZoo: Total abundance (ind.L−1) of zooplankton communities (rotifers, cladocerans, copepods).
BZoo: Total biomass (μg.L−1) of zooplankton communities (rotifers, cladocerans, copepods).
RZoo: Cal/(Clad + Cy) where Cal is calanoid copepods, Clad is cladocerans and Cy is cyclopoid copepods; for copepods only the abundances of adults were used.
MWZoo: Mean size (weight) of zooplankton is the ratio of dry biomass to abundance.
RClad: Ratio of large-sized cladocerans (>500 μm) to total Cladocera.
2.7. Calculation of Trophic State Index (TSI)
The trophic state index (TSI) is used to assess the trophic state or productivity of water bodies and relies on several physical and chemical variables that indicate the nutrient richness of the water. The most important of these are chlorophyll-a, Secchi depth, and total phosphorus [31]. In this study, we relied on the Secchi depth (SD) and chlorophyll-a for its calculation according to the following formula:
in which
TSI = [(TSICA) + (TSISD)]/2)
(TSICA) = 9.81 in chlorophyll-a (μg.L−1) + 30.6
(TSISD) = 60 − 14.41 in Secchi depth (m)
2.8. Calculation of Shannon–Wiener Index (H′)
According to Shannon [32], the Shannon–Wiener index (H′) measures the diversity of species in a biological community. A high value reflects a stable and balanced community, while a low value indicates environmental stress. It is calculated as follows:
where ni = the average density of species (individuals per L) and N = the average density of individuals in the sample.
H′ = −∑ (ni/N) log2 (ni/N)
2.9. Statistical Analyses
This study employed several statistical analyses conducted using version 5.1.1 of R software (R Core Team, 2025), following a systematic approach consisting of three main steps: descriptive data analysis, correlation analyses, and multivariate analyses using the vegan package. Data were entered and organized using Microsoft Excel 2023, and linear relationships were assessed using Spearman’s correlation coefficient, as it does not require normality and is robust to non-linear relationships. Kruskal–Wallis tests, followed by Dunn’s post hoc comparisons, were used to assess spatial differences in chemical variables among stations. Linear Mixed-Effects Models (LME) were applied to study temporal changes in water quality indices (DWQI, IWQI, and OPI), with time (year/month) and season as fixed effects and annual variability as a random effect to account for the hierarchical structure of the temporal data. Due to the sequential nature of monthly measurements at the same station, a first-order autoregressive (AR1) correlation structure was included in the models to ensure residual independence and accurate p-values. The analysis was primarily based on the lme4 package, and rigorous pre-tests were conducted to ensure the reliability of the models; specifically, the normality of residuals and homoscedasticity were assessed through visual inspection of residual plots and Q–Q plots. Regarding data distribution, for the DWQI and IWQI indices, residual diagnostic tests indicated a good agreement with a Gaussian distribution and homoscedasticity, allowing the use of the original (untransformed) values in the modeling. In contrast, despite the presence of skewness in the raw data and outliers in the OPI, the data were kept untransformed in order to preserve the environmental sensitivity of these extreme values, which reflect occasional pollution events.
To explore multivariate patterns in the hydrochemical fingerprint of the reservoir, Principal Component Analysis (PCA) was conducted using the rda () function from the vegan package to identify the dominant factors and the spatial and temporal variability in water quality, as well as their relationships with biological indices, after scaling and reducing the data. Additionally, simple linear regression was performed to examine the relationship between the Trophic Status Index (TSI_SD) and the zooplankton quality index (Zoo-IQ).
3. Results
3.1. Analysis of Physical and Chemical Parameters and Spearman Correlation Matrix
Temporal variation in the 23 physical and chemical parameters at the SMBT Dam from January 2018 to May 2025 is depicted using time-series plots, and the correlations between these physicochemical parameters are shown in Figures S1 and S2, respectively, in the Supplementary Materials. Additionally, the average values of the physical and chemical parameters at the different sampling sites from June 2023 to May 2025 are summarized in Table 1.
Water temperature showed an annual cyclical pattern reflecting the atmospheric temperature and revealed significant seasonal variations, with higher values in summer (28–39 °C) and lower values in winter (7.7–21 °C). In contrast, dissolved oxygen concentrations exhibited an opposite trend, ranging from a minimum of 6.4 mg.L−1 in summer to a maximum of 12.0 mg.L−1 in winter. In the correlation matrix, the dissolved oxygen was negatively correlated with the water temperature (Figure S2). During the study period, the pH values of the dam water ranged from 7.21 to 8.41, and electrical conductivity was low, varying between 406 μS.cm−1 in summer to 646 μS.cm−1 in winter. The measured values of salinity, chloride, sodium, and total dissolved solids (TDS) indicate that the dam water generally exhibits a low salinity level, as its highest values did not exceed 300, 88.39, 35, and 580 mg.L−1 over eight years. The turbidity values ranged from 0.35 to 9.14 NTU, and the total hardness of the dam water ranged from 18 to 30 mg.L−1 as CaCO3; this low hardness level reflects limited concentrations of Ca2+ and Mg2+ ions, which did not exceed 66 and 80 mg.L−1, respectively. A strong negative correlation (−0.54) was observed between Ca2+ and Mg2+ (Figure S2). The concentrations of NH4+ in the samples ranged from 0.01 to 0.04 mg.L−1, while PO43− and SO42− reached maximum values of 0.5 and 209 mg.L−1, respectively. A positive correlation was observed among these parameters, suggesting that the geochemical processes or anthropogenic inputs contributing to their occurrence in the water are likely interconnected. HCO3− concentrations exceeded 90 mg.L−1 in all water samples analyzed during this study, except for two samples collected in March 2024 at stations S2 and S3. Nitrate concentrations were generally low (<6.8 mg.L−1), and thus classified as “no problem”. The minimum NO2− concentration was recorded at station S1 (0.007 mg.L−1), whereas the maximum values were observed at stations S3 and S4 (0.086 mg.L−1), and the concentration of Mn in the samples did not exceed 0.08 mg.L−1. High concentrations of Al3+ have been recorded, clearly exceeding the World Health Organization’s recommended guidelines of 0.2 mg.L−1 for drinking water, almost every year in the fall and winter seasons. Also, a high concentration of Fe2+ was recorded at 0.81 mg.L−1 in September 2021, but concentrations in all other samples remained below 0.3 mg.L−1. Chlorophyll-a concentrations showed a gradual increase from S1 to S4, indicating a spatial gradient in phytoplankton biomass and primary productivity. The highest values observed at S4 suggest enhanced nutrient availability and stronger environmental impact (Table 1). Our results also showed that the concentration of OM did not exceed 5.0 mg.L−1, which also indicates a good organic quality of the water. In addition, an inverse relationship was observed between dissolved oxygen, OM, and NO3− (Figure 3). In recent years, since 2022, an increase in Mg2+, PO43−, NO3−, SO42−, and Mo has been observed, accompanied by a rise in pH value, but with stability in TDS (Figure S1). While significant spatial variations in Cl−, SO42−, NO2−, and Mg2+ were observed throughout the study period, the Kruskal–Wallis and Dunn tests revealed significant differences, with Cl− and Mg2+ concentrations being higher in S3 and S4, except for NO2− and SO42− at S2 and S4 in Figure 2. High concentrations of SO42− and NO2− were recorded at Station S2.
Figure 2.
Box plots of NO2−, Cl−, SO42−, Mg2+ in the four stations of the reservoir. Results of Kruskal–Wallis and Dunn pairwise tests are also shown.
3.2. Drinking Water Quality Index
Figure S3 in the Supplementary Materials illustrates the seasonal and interannual variation in DWQI at SMBT Dam from winter 2018 to spring 2025. In general, water quality ranged between “good” and “excellent”, with most DWQI values lying between 20 and 40, confirming that the dam’s water remained relatively stable and suitable for drinking during the study period. However, distinct pollution peaks were observed, most notably in July 2018 (DWQI ≈ 52), June 2021 (DWQI ≈ 51) and December 2021 (DWQI ≈ 53.40) classified as poor for drinking according to Tyagi et al. [33]. From 2022 to 2025, the values clearly stabilized between 25 and 40, indicating a relative improvement in water quality. The DWQI indicates clear seasonal fluctuations, as its values rise slightly in spring and autumn; in summer and winter, the values are more stable. Despite the downward trend in DWQI values (Slope = −0.39) during the study period (2018–2025), the Mann–Kendall test did not show statistical significance (p > 0.05), indicating that the change in water quality is closer to fluctuation than to a fixed direction.
3.3. Irrigation Water Quality Index
The values of IWQI ranged between 64.8 and 69.5, with an average of 67.3, all of which fall within the “good” category and are suitable for irrigation without treatment (Figure S4 in the Supplementary Materials). It is observed that the water quality of the dam shows a gradual decline over the years; for instance, in 2018 the average was 68.1, which decreased to 65.8 by 2025. Although it remains within the “good” classification, a slow decline is evident. This trend was confirmed by the trend analysis of the IWQI during the study period, which showed a significant decrease. The non-parametric Mann–Kendall test confirmed a strong negative trend (τ = −0.38, p < 0.001), indicating a gradual deterioration in water quality. The linear regression model also indicated a significant negative trend (slope = −0.052), reflecting a gradual deterioration in the suitability of the dam’s water for irrigation purposes over time.
Five hydrochemical parameters (Table 2) were used to calculate the IWQI; Sodium Adsorption Ratio (SAR), Residual Sodium Carbonate (RSC), Permeability Index (PI), Kelly’s Ratio (KR), and Soluble Sodium Percentage (SSP). These parameters provide an integrated assessment of water suitability for irrigation. SAR values of the studied samples ranged between 0.49 and 1.09, with an average of 0.71 and a standard deviation of 0.11. According to the SAR classification, this corresponds to excellent irrigation water. PI values ranged from 28.81 to 94.70, with an average of 59.66 and a standard deviation of 6.30. Based on these results, the water samples fall within the good category. KR reflects the relative excess of sodium in water. In the study area, KR values ranged between 0.11 and 0.36, with an average of 0.22 and a standard deviation of 0.048. Based on these results, most samples are suitable for irrigation. RSC values ranged between (−5.49) and (−0.74) meq.L−1, with an average of (−2.40) meq.L−1 and a standard deviation of 0.96. These values indicate water that is good and suitable for irrigation. SSP values ranged between 10.81 and 27.28, with an average of 18.71 µeq.L−1 and a standard deviation of 3.22. That is, all the samples fall within the good category for agricultural use.
Table 2.
Spatial mean standard error of physicochemical parameters in SMBT reservoir (June 2023 to May 2025).
Although the IWQI classified the water as good to excellent during the study period in all samples, the Magnesium Hazard index (MH) gave high values (MH < 60) in 30 percent of the samples. This increase reflects a relative imbalance between calcium and magnesium ions in the water due to the higher concentration of magnesium compared to calcium. This rise particularly affects station S4 of the samples.
3.4. Overall Pollution Index (OPI)
The majority of stations (S1 to S4) showed OPI values less than 1.0 throughout the study period (Figure 3). Station S1 in the fall of 2020 and station S3 in June 2024 showed an increase in the Pollution Index, but within a low level (0.85 and 1.1, respectively). This may be attributed to an increase in aluminum and turbidity concentrations in the fall of 2021 and an increase in aluminum and manganese in the spring of 2024 (Figure S5 in the Supplementary Materials).
Figure 3.
Boxplots of the Overall Pollution Index (OPI) of the four stations (S1, S2, S3, and S4) between 2018 and 2025 in SMBT reservoir. Black dots indicate outliers and red lines indicate mean values (±SE).
The non-parametric Mann–Kendall test and the parametric linear regression model for OPI showed the absence of a monotonic trend (τ = −0.006, p = 0.905), and the weak negative slope = 0.0002 confirmed that the rate of change was very minimal (Figure S5). The linear regression analysis also showed that the slope was not significant (p = 0.416, R2 = 0.004), indicating that OPI values remained almost constant over eight years without any clear improvement or deterioration, suggesting temporal stability in pollution levels in the reservoir. However, all values of OPI (0.3 < OPI < 1.12) indicated that the dam water is clean to slightly and temporarily polluted, such as the autumn and winter seasons when rainwater accumulates in valleys polluted by household waste due to human activity. However, the results of the Linear Mixed Model test for the OPI showed significant spatial differences among the four stations (F = 4.35, p = 0.007).
Post hoc Tukey’s tests (Figure 3) indicated that stations S3 and S4 recorded significantly higher OPI values compared to station S1 (p < 0.05), while station S2 did not show a significant difference from the other stations. These results indicate that stations S3 and S4 are impacted by a higher level of pollution.
3.5. Analysis of Spatio-Temporal Distribution of Water Quality Variables
The Principal Component Analysis (PCA) was employed to explore the multivariate structure of the dataset, integrating both temporal variability (years) and the spatial layout of stations S1 to S4 (Figure 4). The first two PCA axes (PCA1 and PCA2) account for 29.9% and 21.3% of the variance, respectively, while the overall model explains 51.2% of the total variance. The dominant factors influencing the reservoir’s water quality are associated with turbidity and TDS. In contrast, the second PCA axis reflects a nutrient-related gradient, driven primarily by PO43−, NO3−, Mg2+, and organic matter (OM). The temporal analysis highlighted a clear differentiation among the studied periods. The early years (2018–2019) were closely associated with turbidity and salinity-related variables, reflecting increased suspended solids and higher total dissolved solids during this period. In contrast, the intermediate years (2020–2021) were characterized by ellipses clustered around the center of the ordination plot and extending across the four quadrants, indicating the absence of a dominant set of environmental drivers and suggesting relatively balanced physicochemical conditions. Conversely, the most recent years (2023–2025) showed a pronounced shift, with ellipses strongly oriented toward the lower-left quadrant and clearly separated from the 2018 group. This pattern reflects a strong association with nutrient and metal variables, particularly magnesium, phosphate, nitrate and pH, indicating an increasing influence of nutrient enrichment and mineral inputs during the most recent period. The spatial analysis among stations revealed that the most impacted stations, especially S3 and S4, were strongly associated with PO43−, OM, Mg2+, and NO3−, indicating a higher exposure to organic/fecal pollution and surface runoff. Among them, S4 emerged as the most affected station, whereas S1 and S2 exhibited more stable and clearer water conditions.
Figure 4.
Results of the PCA on the influence of significant environmental variables and the distribution of samples according to station and year.
Furthermore, all environmental variables showed significant differences among years according to the Kruskal–Wallis test, with p-values ranging from 2.57 × 10⁻⁶ to 1.30 × 10⁻¹², indicating clear temporal variations in all studied variables. The analysis of variance (ANOVA) demonstrated that the most influential variables explaining the variability of the Drinking Water Quality Index (DWQI) were turbidity, which showed the highest statistical contribution (F = 257.86, p < 0.001), followed by organic matter (F = 143.59, p < 0.001) and phosphate (F = 48.20, p < 0.001). These results confirm that these three parameters represent the primary drivers of water quality degradation in the reservoir.
3.6. Zooplankton Indicators
A total of 63 zooplankton species were identified during the last two years of the study and total biomass was 17.14 mg/L (Table S3). Rotifers were the dominant group, with 47 species, mainly from the genera Keratella and Polyarthra. Cladocerans were represented by nine species, primarily from the genera Diaphanosoma and Ceriodaphnia, and copepods by seven species, mainly from the genus Acanthocyclops, which is clearly reflected in the Zoo-IQ index. Figure 5 shows that the water quality of the reservoir ranges from “moderate” to “good” according to the Zoo-IQ classification. MWZoo appears as the largest and most stable contributor to the mean value of Zoo-IQ. In contrast, AZoo and BZoo exhibit greater seasonal variability. The peak observed in spring 2024 and autumn 2024 results from a sharp reduction in their values, reflecting the sensitivity of zooplankton groups that typically flourish in spring and decline under environmental stress.
Figure 5.
Mean Zoo-IQ index values of surface waters at SMBT Dam. Dashed lines and colors indicate the quality range based on Zoo-IQ.
Considering the overall temporal trend of the zooplankton quality index (Zoo-IQ) across all stations (S1–S4), we observe stability within the “moderate” and “good” quality ranges throughout the study period, with the mean Zoo-IQ fluctuating between its minimum value (11) and maximum value (16), despite pronounced seasonal variability (Figure 5). Moreover, the variance analysis around the mean indicates a relatively wide variation across all periods, mostly covering the range from 10 to 15, which reflects substantial differences in water quality among the four stations.
The Shannon’s diversity index (H′) calculated for each station (S1–S4) over the two-year period ranged between 1.65 and 2.7 (Figure 6). The pronounced diversity peaks observed during autumn 2023 and autumn 2024 indicate that taxonomic diversity increases markedly following the summer productivity phase. Conversely, the lowest diversity values were recorded at all stations during winter 2025. Spatially, stations S1, S2, and S3 generally exhibit similar patterns, whereas station S4 shows the greatest variability, recording the lowest diversity value (1.65) in winter 2025.
Figure 6.
Temporal variation in the Shannon–Wiener index in the four stations (S1, S2, S3, and S4).
The temporal and spatial analysis presented in Figure 7 of the components of the Zooplankton Index of Quality (Zoo-IQ) for each station (S1–S4) reveals complex patterns of variability that are consistent with the overall trend of Zoo-IQ. In general, most of the total scores fall within “moderate” (10–14) to “good” (14–18) ranges, indicating a moderately healthy biological response of the water body. This analysis confirms that seasonality plays a crucial role, exceeding a simple direct and static relationship with trophic status. The temporal trend clearly shows that spring and summer represent periods of optimal performance, during which all stations converge toward high scores, approaching 16.5 in spring 2024. This increase is mainly attributed to the dynamic contribution of AZoo, which represents the largest proportion of the increase during high-quality seasons. In contrast, the MWZoo component represents a relatively constant baseline value (approximately 5), providing a stable foundation for water quality and preventing a complete collapse of the index.
Figure 7.
Temporal variation in mean Zoo-IQ index in the four stations (SI, S2, S3, and S4).
From a spatial perspective, despite the similar performance observed among stations during spring, station S4 exhibits the widest range of variability. It records low scores reaching 8 during certain periods (autumn 2023), temporarily placing it within the poor category, before recovering to the good category in spring. This pronounced variability at station S4 indicates that it is the most vulnerable to environmental stress and seasonal degradation, compared with the other stations, which display relatively stable moderate performance.
The trophic state index indicates that the water body falls within a mesotrophic–eutrophic range, confirming the presence of a strong inverse relationship between the trophic state index (TSIChla-SD) and Zoo-IQ (Figure 8), with a regression slope of −0.243 and significant p = 0.002.
Figure 8.
Scatter plots of Zoo-IQ against TSIChla-SD in the surface water body in the four stations. Vertical lines indicate trophic state index (Oligo: oligotrophic, Meso: mesotrophic, Eu: eutrophic and Hyper: hypertrophic).
3.7. Linking Chemical and Biological Indicators to Water Quality in the SMBT Reservoir
The PCA biplot (Figure 9) illustrates the relationships between physicochemical indices (IWQI, OPI, DWQI) and biological metrics (Zoo_IQ, TSIChla-SD), representing 60.31% of the total variance. The first two PCA axes accounted for most of the constrained variance, with PC1 and PC2 explaining 26.61% and 33.7%, respectively. These results revealed a highly significant relationship between environmental variables and the biological dataset (permutation test, p = 0.001). All canonical axes (CPA1–CPA4) were highly significant, indicating a strong environmental gradient structuring the community. Additionally, all tested environmental variables (TSI Chla-SD, Zoo_IQ, IWQI, OPI, and DWQI) showed significant contributions to the model (p = 0.001). A strong positive correlation was observed between the Organic Pollution Index (OPI) and the Drinking Water Quality Index (DWQI), indicating that both indices are influenced by the same environmental factors in the study area. In contrast, the Zooplankton Quality Index (Zoo_IQ) showed a strong and independent association with the second axis in the positive direction, whereas the Irrigation Water Quality Index (IWQI) and the Trophic Status Index (TSI Chla-SD) were oriented in different directions, reflecting variation in their responses to spatial or seasonal changes.
Figure 9.
PCA biplot showing the relationships between water quality and biological indices. Sampling points are colored by station, while arrows represent chemical indices (IWQI, OPI, DWQI) and biological indices (Zoo_IQ, TSI Chla-SD).
Regarding the distribution of sampling stations, the plot revealed a strong overlap among the four stations (S1, S2, S3, and S4), suggesting relatively homogeneous hydrochemical and biological conditions across these sites. However, a slight tendency was observed for stations S3 and S4 to shift toward the positive side of the first axis, linking them more clearly with the Organic Pollution Index (OPI), compared to S1 and S2, which showed a wider dispersion toward the negative side of the first axis. This indicates that the stations on the right side are more affected by relatively higher environmental pressure related to water quality.
4. Discussion
4.1. Analysis of Physicochemical Parameters
According to the World Health Organization, the reservoir water quality is classified as good and characterized by a low level of pollution. These results are also consistent with the study of Hamil et al. [34] on the Ghrib Dam located in the Cheliff Valley within the same province (semi-arid region), which similarly reported low pollution levels and acceptable water quality. The DO concentration in the water exceeds the minimum tolerance threshold for zooplankton (DO > 5 mg.L−1). DO is considered the most important parameter for assessing water quality, as it directly affects aquatic life and its distribution [35]. The naturally alkaline pH falls within the permissible range (6.0–9.0) established by WHO guidelines. The values of EC were low, corresponding to the excellent quality class [36], and are widely used as a key indicator for evaluating water suitability for agricultural use [37]. This is confirmed by TDS values, which also range within acceptable limits. Finally, turbidity values also indicate low to moderate levels of suspended matter in the reservoir water, such as clay, fine particles, and organic material, without evidence of severe pollution.
The results of HCO3−, NO3−, and NO2− indicate that natural geochemical processes and human activities, such as fertilizer application, return flow of irrigation water, and wastewater discharge, play an important role in shaping the hydrochemical characteristics of the studied waters [38]. The high Al3+ concentrations recorded almost every year during autumn and winter, which exceed the drinking water guidelines recommended by the World Health Organization [39], can be attributed to the increased solubility of aluminum in water at lower temperatures, as well as to surface runoff from surrounding soils into the reservoir. In addition, seasonal mixing processes may contribute to the resuspension of aluminum accumulated in bottom sediments [39,40]. The elevated iron concentration observed in September 2021 may be related to local geological processes, such as the dissolution of iron-bearing minerals under specific conditions (e.g., low pH or oxygen depletion) or to anthropogenic activities [41].
As shown in Figure S2, an inverse relationship was observed between DO and OM as well as between DO and NO3− concentrations. This pattern can be explained by the fact that high OM levels increase nutrient availability, which in turn stimulates microbial respiration and organic matter decomposition, ultimately leading to a reduction in dissolved oxygen levels [42,43]. Strong positive correlations between Mg, NO2−, NH4+, SO42−, and PO43− indicate that these parameters likely share common sources, with untreated domestic wastewater from tributaries and agricultural runoff being the main contributors to their enrichment in the reservoir. The negative relationship observed between water temperature, salinity, and EC in this study contrasts with the typically positive relationship reported in many aquatic systems. This atypical pattern may reflect the combined influence of hydrological inputs and outputs under ongoing climate change, particularly in surface waters, where dilution and stratification processes can alter physicochemical interactions [44,45]. Increases in Mg2+, PO43−, NO3−, SO42−, and OM were observed since 2022, accompanied by a rise in pH, while TDS remained relatively stable. This pattern suggests the early onset of water eutrophication [46,47]. These changes reflect an increased nutrient input into the aquatic system, potentially driven by agricultural runoff, fertilizer application, and organic matter degradation, which collectively promote the growth of phytoplankton and algae [48]. This is supported by Messaoudi et al. [49]. and Hamil et al. [34], who studied Ghrib Dam. The observed increase in pH further reflects enhanced photosynthetic activity, and this is confirmed by the study by Liang et al. [50], as these organisms consume dissolved CO2, thereby increasing water alkalinity [51,52]. Overall, these combined conditions indicate an early stage of nutrient enrichment, serving as an early warning signal of potential water quality degradation if nutrient inputs continue unabated [47]. High concentrations of SO42− and NO2− recorded at station S2 indicate the influence of organic pollution sources, mainly derived from domestic wastewater and agricultural fertilizers [53]. These pollutants may be transported into the reservoir through Oued El Hadd, which flows across Arib city and is surrounded by extensive agricultural lands [17]. In contrast, stations S3 and S4 are located along Oued Belahcen (Oued Aghrez), the western/northwestern tributary of the SMBT reservoir, which drains the western slopes of Mount Zaccar, and Oued Farhat, the eastern tributary, originating from the Beni Ghamrane Mountains. These oueds are part of the Dahra mountain range, which is geologically characterized by salt-rich formations, dolomite, and gypsum deposits [54]. This geological setting explains the higher concentrations of Cl−, Mg2+, and SO42− observed at these stations compared to the others. At station S4, the elevated levels of Cl−, Mg2+, and SO42− may have inhibited the conversion of NO3− to NO2− [55], resulting in higher NO2− concentrations relative to the other stations. Furthermore, Oued Farhat passes through the municipality of El Makhatria, which increases the likelihood of domestic wastewater inputs and agricultural runoff, further contributing to nutrient enrichment at this station.
4.2. Drinking Water Quality Index
The Drinking Water Quality Index is a single value derived from physical and chemical parameters that provides a simplified representation of water quality to support management-related decisions [48,56]. The DWQI values indicate that the reservoir water was generally suitable for drinking throughout the study period in terms of physicochemical characteristics [57]. However, distinct pollution peaks were recorded during certain months of specific years, which were classified as unsuitable for drinking according to Tyagi et al. [33]. These peaks are mainly associated with fertilizer and pesticide-rich surface runoff, particularly during the agricultural season, or with occasional discharges of domestic or industrial wastewater [57], resulting in intermittent deterioration of water quality. The DWQI also reveals clear seasonal fluctuations, with slightly higher values in spring and autumn, reflecting the influence of rainfall and surface runoff, which promote the leaching of pollutants from agricultural lands [58]. In contrast, values were more stable during summer and winter, possibly due to higher evaporation rates in summer or natural dilution resulting from increased inflow during winter [59].
4.3. Irrigation Water Quality
The Irrigation Water Quality Index provides insight into how water quality influences soil properties, crop growth, and overall agricultural productivity by summarizing complex information into a single numerical value or qualitative class [60]. Evaluating the IWQI is particularly important in the context of modern irrigation systems, such as drip irrigation, which rely on precise equipment and are therefore highly susceptible to clogging caused by sedimentation [61,62].
Five hydrochemical parameters were used to evaluate the suitability of water for irrigation. The results indicate that all values of these parameters fall within the excellent to good quality classes. SAR is considered a strong indicator, as it shows a close relationship with the exchangeable sodium percentage in soils [63]. High salinity reduces the osmotic activity of plants, thereby limiting water uptake by roots and its transport to stems and leaves, which ultimately leads to reduced crop productivity [64]. KR reflects the relative excess of sodium in water. Water with KR values greater than 1 is considered unsuitable for irrigation, whereas KR values below 1 indicate suitability for agricultural use. RSC expresses the effect of carbonate and bicarbonate ions relative to calcium and magnesium [64,65]. Similarly, PI values also indicate that the reservoir water is suitable for irrigation, as the concentrations of Na+, Ca2+, Mg2+, and HCO3− influence soil permeability over the long term [65]. Water usability in agricultural practices is mainly affected by alkalinity [66]. According to Gholami and Srikantaswamy [67], less soluble salts tend to precipitate and accumulate in soils, whereas highly soluble salts increase soil salinity. The Soluble Sodium Percentage (SSP) measures the proportion of Na+ relative to other cations. A high Na+ ratio compared to Ca2+ and Mg2+ can lead to the formation of toxic conditions, causing leaf scorching and tissue damage [64].
Overall, the values of PI, RSC, SSP, SAR, and KR in the studied samples indicate excellent irrigation water, suitable for use without posing any risks to soils or crops. This high quality can be attributed to the continuous recharge of the dam’s water from valley streams originating in the Al-Zahra Mountain range, which is mainly fed by rainfall [17].
On the other hand, the Magnesium Hazard (MH) index yielded elevated values in station S4. The presence of samples with high magnesium concentrations poses a hazard that may lead, in the long term, to the deterioration of soil permeability and the loss of cohesion of its surface structure [68]. Therefore, it is recommended to dilute the irrigation water with alternative water sources rich in calcium, or to use calcium supplements, such as agricultural gypsum, in addition to improving drainage networks and regularly monitoring hydrochemical indicators and soil properties [26].
4.4. Overall Pollution Index
The Overall Pollution Index is a tool used to assess environmental quality by integrating the effects of multiple pollutants into a single value reflecting the overall level of pollution. The OPI values indicate that the reservoir water generally falls within the “acceptable” quality category [69]. However, some samples from station S1 in autumn 2020 and station S3 in June 2024 exhibited elevated OPI values, indicating increased pollution levels. This increase is mainly attributed to higher aluminum and turbidity concentrations in autumn 2021, and to elevated aluminum and manganese concentrations in spring 2024.
The results also show that stations S3 and S4 are affected by higher pollution levels, likely due to their proximity to anthropogenic discharge sources, as they are located near the confluence of Oued Ferhat and Oued Belhassen, the western tributaries of the reservoir, combined with limited water renewal, particularly during summer. In contrast, stations S1 and S2 appeared to be less impacted by pollution [70,71].
4.5. Analysis of Spatio-Temporal Distribution of Water Quality Variables
During the early years (2018–2019), the primary environmental challenge was associated with turbidity and elevated concentrations of total solids (salts), linked to dry climatic conditions and intense surface runoff [72]. This runoff subsequently led to increases in suspended solids and total dissolved solids [73]. Such phenomena represent a regional issue, impacting reservoir efficiency and its water recharge capacity.
Our findings are consistent with previous studies conducted on Kaddara Dam in Algeria [74], and in the Oued Mina basin and Sidi Mohamed Ben Ouda Dam [75]. Changes observed during the transitional period (2020–2022) ultimately led to a new environmental situation in the recent years (2023–2025). The data indicate a shift in the main environmental stressor, from salinity-related pressures to nutrient pollution, reflecting a transition from natural/climatic sources (salinity) to anthropogenic sources, such as agricultural runoff and untreated wastewater. The increase in PO43− concentrations in the recent period serves as a clear indicator of environmental degradation (eutrophication), posing a threat to the sustainability of the aquatic ecosystem [47].
One of the limitations of the study is that the bottom of the reservoir could not be characterized in terms of physical chemistry for logistical reasons. Surface water quality could deteriorate rapidly if oxygen conditions at depth change. The great depth of the dam initially allows it to act as a nutrient sink, slowing down the effect of inputs for a few years, and this is confirmed by Djazzar Meliani [76]. However, the surface water masses are likely to tip over at some point when the accumulation of organic matter at the bottom is combined with summer anoxia in the deep waters. Biological indicators can therefore serve as a more sensitive and comprehensive marker of environmental changes.
4.6. Zooplankton Indicators
The reservoir water exhibits considerable biological diversity, with 63 zooplankton species recorded during the study period, dominated by rotifers (47 species). Compared to the only statistical study of zooplankton conducted by Djazzar Meliani [76] for this dam during the period from July 2009 to September 2010, only 18 zooplankton species were identified, including eight cladocerans, six rotifers, and four copepods. Based on the overall Zooplankton Quality Index (Zoo-IQ) calculated across all stations over a two-year period (from summer 2023 to spring 2025), the water quality of the reservoir ranges from “moderate” to “good”, according to the classification of [12]. The MWZoo index appears to be the largest and most stable contributor to the mean Zoo-IQ value, indicating the presence of larger-bodied aquatic organisms, which is generally associated with better water quality. Larger zooplankton are more efficient grazers of phytoplankton, thereby enhancing water clarity and reducing harmful eutrophication, which helps prevent the degradation of overall water quality into “poor” or “bad” categories, even during less favorable seasons [77]. In contrast, AZoo and BZoo exhibit greater seasonal variability. The peaks observed in spring 2024 and autumn 2024 result from sharp declines in their values, reflecting the sensitivity of zooplankton assemblages that typically thrive in spring but decrease under environmental stress. The persistent decline in RClad further suggests that large-bodied crustacean groups are under predation pressure [78]. It is worth noting that the occurrence of Calanoida was very low, as it was recorded only during four months of the study and in small abundances. This low presence was observed despite the fact that the reservoir water quality did not exhibit severe eutrophication, which resulted in the absence of Rzoo. Overall, the distribution of Calanoida is influenced not only by water quality, particularly in deep reservoirs, but also by other environmental factors such as temperature and predation pressure. In addition, Calanoida tends to be associated with environments characterized by higher abundances of large filamentous phytoplankton (MBFG3) and large mucilaginous phytoplankton (MBFG7), and lower proportions of small-sized phytoplankton (MBFG1) [79]. However, this pattern was not clearly observed during the microscopic examination of our samples.
These results confirm the seasonal variability of the Shannon diversity index (H′). The values of the H′ index are generally classified as “moderate” to “good” diversity in aquatic ecosystems, indicating a relatively stable biological community that is not dominated by a single species [80]. The pronounced diversity peaks observed in autumn 2023 and autumn 2024, in contrast to the spring peak (Spr-24) recorded for the overall biological quality index (Zoo-IQ), suggest that taxonomic diversity increases substantially after the summer productivity phase. Conversely, the lowest diversity values were recorded during winter 2025, coinciding with the seasonal decline in mean Zoo-IQ. This seasonal fluctuation demonstrates that changes in biological water quality (Zoo-IQ) are not merely driven by variations in organism abundance, but rather reflect shifts in community structure and diversity, with diversity increasing during moderate seasons and declining under environmental stress. Spatially, variance analysis among stations shows that S1, S2, and S3 generally exhibit similar patterns, whereas station S4 displays the greatest variability, confirming it as the most vulnerable site. Station S4 recorded the lowest absolute diversity value (1.65) in winter 2025 and also exhibited low Zoo-IQ values, reaching as low as 8 during certain periods (autumn 2023), temporarily placing it in the poor performance category before recovering to a good status in spring. These pronounced fluctuations at S4 indicate that it is more exposed to environmental stress and seasonal decline than the other stations, which show more moderate and relatively stable performance. This pattern is consistent with the results of the Overall Pollution Index (OPI).
The trophic state index indicates that the reservoir water falls within the mesotrophic–eutrophic range. A strong inverse relationship is observed between the trophic state index (TSIChla_SD) and Zoo-IQ, suggesting that increased nutrient enrichment leads to a deterioration of biological quality, in agreement with ecological models describing intensified pressure on aquatic ecosystems [81]. However, the wide scatter of data points around the regression line indicates that trophic state is not the sole controlling factor, highlighting the importance of temporal and spatial dynamics in shaping zooplankton community responses. This implies that the biological quality of the system is governed in a non-linear manner, with strong modulation by seasonal variability. Despite the elevated trophic status, the zooplankton community of the reservoir shows a degree of resilience, as the overall Zoo-IQ values remained within the moderate to good range throughout the study period.
4.7. Linking Chemical and Biological Indicators to Water Quality in SMBT Reservoir
The present results provide a robust basis for classifying and assessing water quality in the SMBT reservoir and confirm that anthropogenic activities are the primary drivers of water quality degradation in the studied area. Stations S3 and S4 are located in proximity to potential sources of organic pollution, such as untreated domestic wastewater discharges and intensive agricultural runoff. This contamination not only reduces water suitability for drinking, as reflected by low DWQI values, but also limits its suitability for irrigation, as indicated by low IWQI values. In contrast, the negative relationship between Zoo-IQ and TSIChla_SD indicates that increasing nutrient enrichment adversely affects ecosystem health through enhanced eutrophication processes, potentially leading to excessive algal blooms. Such conditions may alter water chemistry and reduce biodiversity [82], including zooplankton communities.
Notably, the Organic Pollution Index (OPI) indicates weak organic pollution, particularly at station S4. Despite this, zooplankton communities exhibit marked resilience and stability within the ecosystem. This can be explained by the fact that nutrient levels have not yet reached a threshold of severe eutrophication capable of inducing harmful algal blooms or significant dissolved oxygen depletion. Instead, these communities may benefit from slight increases in nutrients and organic carbon, resulting in moderate increases in biomass without noticeable community degradation [83].
The Principal Component Analysis (PCA) further supports this interpretation. The ordination plot reveals a positive association between OPI and the first principal component (PC1), particularly in samples from station S4, indicating a relative influence of organic inputs. However, this effect is not associated with biological deterioration, as zooplankton communities are independently associated with the second principal component (PC2), reflecting a balanced ecological response and adaptability to moderate environmental stress. Moreover, the substantial overlap among sampling stations in the PCA space suggests a relatively homogeneous environmental structure, supporting the idea that organic pollution remains limited and does not induce strong spatial differentiation or major alterations in zooplankton community structure.
Overall, these findings suggest that water quality degradation in the SMBT reservoir is not driven solely by organic pollution but results from multiple interacting environmental pressures. This explains the apparent discrepancy between physicochemical indices and biological responses, highlighting the importance of integrating both chemical and biological indicators for a comprehensive ecological assessment.
5. Conclusions
This study provides a comprehensive assessment of the temporal and spatial variation in water quality of the SMBT Dam, based on chemical and biological indicators. The results indicate that all evaluated stations generally exhibit good water quality, with low to minimal pollution levels, making them suitable for human consumption, agricultural irrigation, and fish farming, as the reservoir represents an integrated aquatic ecosystem. These findings are essential for understanding the current status of water resources in semi-arid regions such as northwestern Algeria.
However, the analysis of trends in water quality indicators (DWQI, IWQI, and OPI) over the 2018–2025 period at the deepest point of the reservoir revealed a gradual trend of water quality deterioration in the reservoir, which was further supported by biological indicators (Zoo-IQ, H′) and the trophic state index (TSIChla_SD). The results indicate that the reservoir water falls within the mesotrophic–eutrophic range and is subject to the combined effects of nutrient enrichment and pronounced seasonal fluctuations. This confirms that water quality degradation is not driven solely by increased organism abundance, but also by a loss of species diversity and a disruption of balanced community structure. Our spatial analysis of water quality between 2023 and 2025 highlighted the role of station S4 as the most biologically vulnerable area, suggesting that the reservoir’s two western tributaries, namely Wadi Belhassen and Wadi Farhat, should be subject to priority targeted assessments to ensure that localized biological degradation does not result in unacceptable concentrations of pollutants or microorganisms that could negatively impact the reservoir’s ecosystem as a whole. Overall, the biological findings suggest that maintaining Zoo-IQ and H′ within a good range is an effective approach for supporting the stability of the DWQI and IWQI within safe limits for human and agricultural uses.
This study emphasizes the importance of these tools in assessing water quality and multiple pollution levels over time, and highlights the crucial role of continuous monitoring, proactive management, and effective pollution control strategies to ensure the long-term sustainability of water resources. The study also provides practical insights for policymakers and environmental managers, aiming to improve water quality management and develop sustainable policies to protect water resources.
Supplementary Materials
The following supporting information can be downloaded at: https://www.mdpi.com/article/10.3390/w18091022/s1, Figure S1. Temporal variation in physicochemical parameters in SMBT reservoir between 2018 and 2025; TW (°C); pH; DO (mg/L); Fe+2 (mg/L); PO4− (mg/L); NO3− (mg/L); NO2− (mg/L); EC (μs/cm); Cl− (mg/L); Ca2+ (mg/L); Na+ (mg/L); K+ (mg/L); Mo (mg/L);So4− (mg/L); Mg+2 (mg/L); Mn (mg/L); NH4 (mg/L); Al3+ (mg/L); HCO3− (mg/L); Sal (g/L);TH (mg/L); Turb (NTU); TDS (mg/L); Figure S2. Spearman correlation matrix of physicochemical parameters at SMBT reservoir; Figure S3. Drinking Water Quality Index of surface water in the SMBT reservoir; Figure S4. Irrigation Water Quality Index of surface waters at SMBT reservoir; Figure S5. Overall Pollution Index of surface water in the SMBT reservoir; Table S1. Species composition, biomass (mg/L), dominance (%) and distribution of the zooplankton assemblage in SMBT Dam; Table S2. Water quality parameters, WHO standard values, index type, and relative weights for OPI, IWQI and DWQI calculation; Table S3. Water quality classification for OPI, DWQI and IWQI.
Author Contributions
Conceptualization; taxonomy; statistical analysis; methodology; investigation; writing—original draft; writing, review and editing; visualization, A.B. Supervision; taxonomy; statistical analysis; resources; writing, original draft; project administration; visualization, S.H. Statistical analysis; writing, review and editing, M.B. Statistical analysis; review and editing, C.P. and A.P. All authors have read and agreed to the published version of the manuscript.
Funding
This research was partly funded by Campus France through the Hubert Curien Partnership (PHC Tassili 2024-2026, project code: 51371QB).
Data Availability Statement
The original contributions presented in this study are included in the article and/or Supplementary Materials. Further inquiries can be directed to the corresponding authors.
Acknowledgments
The authors would like to express their sincere gratitude to the National Agency for Dams and Transfers (ANBT) and to the staff of the SMBT artificial dam for their valuable cooperation and support during the implementation of this research work. Their assistance in facilitating field sampling and data collection is greatly appreciated.
Conflicts of Interest
The authors declare no conflicts of interest.
References
- Bouchareb, N.; Chouaib, R.A.; Meriem, L.; Abdelaziz, B.; Salah, K.; Sara, B.; Mohamed, C. Monitoring Water Quality in Beni Haroun Dam Northeastern Algeria: Application of Water Quality Index (WQI), Pollution Index (PI), and Statistical Analyses. Desalination Water Treat. 2025, 323, 101267. [Google Scholar] [CrossRef] [Scilit]
- Dippong, T.; Hoaghia, M.-A.; Senila, M. Appraisal of Heavy Metal Pollution in Alluvial Aquifers. Study Case on the Protected Area of Ronișoara Forest, Romania. Ecol. Indic. 2022, 143, 109347. [Google Scholar] [CrossRef] [Scilit]
- Zhao, K.; Lai, Y.; He, Z.; Liu, W.; Zhao, R.; Wang, Y.; Tian, X.; Nie, J. Study on Energy Dissipation and Acoustic Emission Characteristics of Fiber Tailings Cemented Backfill with Different Ash-Sand Ratios. Process Saf. Environ. Prot. 2023, 174, 983–996. [Google Scholar] [CrossRef] [Scilit]
- Boelee, E.; Geerling, G.; Van Der Zaan, B.; Blauw, A.; Vethaak, A.D. Water and Health: From Environmental Pressures to Integrated Responses. Acta Trop. 2019, 193, 217–226. [Google Scholar] [CrossRef] [Scilit] [PubMed]
- Elsayed, S.; Ibrahim, H.; Hussein, H.; Elsherbiny, O.; Elmetwalli, A.H.; Moghanm, F.S.; Ghoneim, A.M.; Danish, S.; Datta, R.; Gad, M. Assessment of Water Quality in Lake Qaroun Using Ground-Based Remote Sensing Data and Artificial Neural Networks. Water 2021, 13, 3094. [Google Scholar] [CrossRef] [Scilit]
- Gad, M.; Saleh, A.H.; Hussein, H.; Farouk, M.; Elsayed, S. Appraisal of Surface Water Quality of Nile River Using Water Quality Indices, Spectral Signature and Multivariate Modeling. Water 2022, 14, 1131. [Google Scholar] [CrossRef] [Scilit]
- Soumaila, K.I.; Niandou, A.S.; Naimi, M.; Mohamed, C.; Schimmel, K.; Luster-Teasley, S.; Sheick, N.N. A Systematic Review and Meta-Analysis of Water Quality Indices. J. Agric. Sci. Technol. B 2019, 9, 1–14. [Google Scholar] [CrossRef] [Scilit]
- Canter, L.W. Environmental Impact Assessment, 2nd ed.; McGraw-Hill Series in Water Resources and Environmental Engineering; McGraw-Hill: New York, NY, USA, 1996. [Google Scholar]
- Gol’d, Z.G.; Glushchenko, L.A.; Morozova, I.I.; Shulepina, S.P.; Shadrin, I.A. Water Quality Assessment Based on Chemical and Biological Characteristics: An Example of Classification of Characteristics for the Cheremushnyi Creek–Yenisey River Water System. Water Resour. 2003, 30, 304–314. [Google Scholar] [CrossRef] [Scilit]
- Atta, H.S.; Omar, M.A.-S.; Tawfik, A.M. Water Quality Index for Assessment of Drinking Groundwater Purpose Case Study: Area Surrounding Ismailia Canal, Egypt. J. Eng. Appl. Sci. 2022, 69, 83. [Google Scholar] [CrossRef] [Scilit]
- Abidi Saad, M.; Seghir, K.; Touahri, A.; Bendekkoum, M.; Bellaoueur, A. Applying the Water Quality Indices and Geographic Information System Approach to Assessing the Suitability of Groundwater Quality for Drinking and Irrigation Purposes in the Semi-Arid Region of Tebessa-Ain Chabro, Northeastern Algeria. Appl. Water Sci. 2024, 14, 221. [Google Scholar] [CrossRef] [Scilit]
- Stamou, G.; Mazaris, A.D.; Moustaka-Gouni, M.; Špoljar, M.; Ternjej, I.; Dražina, T.; Dorak, Z.; Michaloudi, E. Introducing a Zooplanktonic Index for Assessing Water Quality of Natural Lakes in the Mediterranean Region. Ecol. Inform. 2022, 69, 101616. [Google Scholar] [CrossRef] [Scilit]
- Ersoy, Z.; Brucet, S.; Bartrons, M.; Mehner, T. Short-Term Fish Predation Destroys Resilience of Zooplankton Communities and Prevents Recovery of Phytoplankton Control by Zooplankton Grazing. PLoS ONE 2019, 14, e0212351. [Google Scholar] [CrossRef] [Scilit] [PubMed]
- Ochocka, A. Zooplankton Index for Shallow Lakes’ Assessment: Elaboration of a New Classification Method for Polish Lakes. Water 2024, 16, 2730. [Google Scholar] [CrossRef] [Scilit]
- Islam, S.S.; Dhara, S.N.; Midya, S. Water Quality Assessment Using WQI and Zooplankton Indicators in Aquatic Ecosystems: Insights from a Correlation-Based Study. Clean. Water 2025, 4, 100103. [Google Scholar] [CrossRef] [Scilit]
- Bordalo, A.A.; Teixeira, R.; Wiebe, W.J. A Water Quality Index Applied to an International Shared River Basin: The Case of the Douro River. Environ. Manag. 2006, 38, 910–920. [Google Scholar] [CrossRef] [Scilit]
- Agence Nationale des Barrages et Transferts (ANBT). Barrage de Sidi M’hamed Ben Taïba; ANBT: Alger, Algeria, 2018. [Google Scholar]
- Rodier, J.; Legube, B.; Merlet, N. L’analyse de L’eau, 9th ed.; Dunod: Paris, France, 2009. [Google Scholar]
- Bottrell, H.H.; Duncan, A.; Gliwicz, Z.M.; Grygierek, E.; Herzig, A.; Hillbricht-Ilkowska, A.; Kurasawa, H.; Larsson, P.; Weglenska, T. A Review of Some Problems in Zooplankton Production Studies. Nor. J. Zool. 1976, 24, 419–456. [Google Scholar]
- Shiel, R.J. A Guide to Identification of Rotifers, Cladocerans and Copepods from Australian Inland Waters; Co-Operative Research Centre for Freshwater Ecology: Albury, NSW, Australia, 1995. [Google Scholar]
- Błędzki, L.A.; Rybak, J.I. Freshwater Crustacean Zooplankton of Europe: Cladocera & Copepoda (Calanoida, Cyclopoida) Key to Species Identification with Notes on Ecology, Distribution, Methods and Introduction to Data Analysis; Springer: Cham, Switzerland, 2016. [Google Scholar]
- RadFard, M.; Seif, M.; Hashemi, A.H.G.; Zarei, A.; Saghi, M.H.; Shalyari, N.; Morovati, R.; Heidarinejad, Z.; Samaei, M.R. Protocol for the Estimation of Drinking Water Quality Index (DWQI) in Water Resources: Artificial Neural Network (ANFIS) and Arc-Gis. MethodsX 2019, 6, 1021–1029. [Google Scholar] [CrossRef] [Scilit]
- Yadav, A.K.; Khan, P.; Sharma, S.K. Water Quality Index Assessment of Groundwater in Todaraisingh Tehsil of Rajasthan State, India-A Greener Approach. J. Chem. 2010, 7, S428–S432. [Google Scholar] [CrossRef] [Scilit]
- Fentie, M.; Assefa, E.; Aklog, D.; Tadesse, A.; Janka, E. Assessment of Drinking Water Quality in Northern Ethiopia Rural Area: A Case Study of Farta District, South Gondar Zone. Water 2024, 16, 1651. [Google Scholar] [CrossRef] [Scilit]
- Li, P.; Wu, J. Drinking Water Quality and Public Health. Expo. Health 2019, 11, 73–79. [Google Scholar] [CrossRef] [Scilit]
- Soleimani, H.; Abbasnia, A.; Yousefi, M.; Mohammadi, A.A.; Khorasgani, F.C. Data on Assessment of Groundwater Quality for Drinking and Irrigation in Rural Area Sarpol-e Zahab City, Kermanshah Province, Iran. Data Brief 2018, 17, 148–156. [Google Scholar] [CrossRef] [Scilit] [PubMed]
- Yıldız, S.; Karakuş, C.B. Estimation of Irrigation Water Quality Index with Development of an Optimum Model: A Case Study. Environ. Dev. Sustain. 2020, 22, 4771–4786. [Google Scholar] [CrossRef] [Scilit]
- Akhmetova, D.; Ozgeldinova, Z.; Ramazanova, N.; Sadvakassova, S.; Inkarova, Z.; Kenzhebay, R.; Shingisbayeva, Z.; Abildaeva, R.; Kozhabekova, Z.; Alagujayeva, M.; et al. Assessment of Chemical Pollution Load in Surface Waters of the Turkestan Region and Its Indirect Impact on Landscapes: A Comprehensive Study. Geosciences 2025, 15, 73. [Google Scholar] [CrossRef] [Scilit]
- Sharma, V.; Sharma, M.; Pandita, S.; Kumar, V.; Kour, J.; Sharma, N. Assessment of Water Quality Using Different Pollution Indices and Multivariate Statistical Techniques. In Heavy Metals in the Environment; Elsevier: Amsterdam, The Netherlands, 2021; pp. 165–178. [Google Scholar]
- Stamou, G.; Katsiapi, M.; Moustaka-Gouni, M.; Michaloudi, E. The Neglected Zooplankton Communities as Indicators of Ecological Water Quality of Mediterranean Lakes. Limnetica 2021, 40, 359–373. [Google Scholar] [CrossRef] [Scilit]
- Carlson, R.E. A Trophic State Index for Lakes1. Limnol. Oceanogr. 1977, 22, 361–369. [Google Scholar] [CrossRef] [Scilit]
- Shannon, C.E. A Mathematical Theory of Communication. Bell Syst. Tech. J. 1948, 27, 379–423. [Google Scholar] [CrossRef] [Scilit]
- Tyagi, S.; Sharma, B.; Singh, P.; Dobhal, R. Water Quality Assessment in Terms of Water Quality Index. Am. J. Water Resour. 2020, 1, 34–38. [Google Scholar] [CrossRef] [Scilit]
- Hamil, S.; Arab, S.; Chaffai, A.; Baha, M.; Arab, A. Assessment of Surface Water Quality Using Multivariate Statistical Analysis Techniques: A Case Study from Ghrib Dam, Algeria. Arab. J. Geosci. 2018, 11, 754. [Google Scholar] [CrossRef] [Scilit]
- Naubi, I.; Zardari, N.H.; Shirazi, S.; Ibrahim, F.; Baloo, L. Effectiveness of Water Quality Index for Monitoring Malaysian River Water Quality. Pol. J. Environ. Stud. 2016, 25, 231–239. [Google Scholar] [CrossRef] [Scilit]
- Bouaroudj, S.; Menad, A.; Bounamous, A.; Ali-Khodja, H.; Gherib, A.; Weigel, D.E.; Chenchouni, H. Assessment of Water Quality at the Largest Dam in Algeria (Beni Haroun Dam) and Effects of Irrigation on Soil Characteristics of Agricultural Lands. Chemosphere 2019, 219, 76–88. [Google Scholar] [CrossRef] [Scilit]
- Dandapat, A.K.; Panda, P.K.; Sankalp, S.; Jothimani, M. Integrated Assessment of Groundwater Quality for Sustainable Irrigation in Drought-Prone Central Districts of Odisha, India. Discov. Sustain. 2024, 5, 238. [Google Scholar] [CrossRef] [Scilit]
- Xu, L.; Xin, B.; Liu, W.; Liu, H.; Yang, G.; Hao, G. Biogeochemical Mechanisms of HCO3–Ca Water and NO3− Pollution in a Typical Piedmont Agricultural Area: Insights from Nitrification and Carbonate Weathering. Toxics 2025, 13, 394. [Google Scholar] [CrossRef] [Scilit] [PubMed]
- Hızlı, S.; Karaoğlu, A.G.; Gören, A.Y.; Kobya, M. Identifying Geogenic and Anthropogenic Aluminum Pollution on Different Spatial Distributions and Removal of Natural Waters and Soil in Çanakkale, Turkey. ACS Omega 2023, 8, 8557–8568. [Google Scholar] [CrossRef] [Scilit] [PubMed]
- Senze, M.; Kowalska-Góralska, M.; Czyż, K.; Wondołowska-Grabowska, A.; Łuczyńska, J. Aluminum in Bottom Sediments of the Lower Silesian Rivers Supplying Dam Reservoirs vs. Selected Chemical Parameters. Int. J. Environ. Res. Public Health 2021, 18, 13170. [Google Scholar] [CrossRef] [Scilit]
- Xie, T.; Lu, S.; Zeng, J.; Rao, L.; Wang, X.; Win, M.S.; Zhang, D.; Lu, H.; Liu, X.; Wang, Q. Soluble Fe Release from Iron-Bearing Clay Mineral Particles in Acid Environment and Their Oxidative Potential. Sci. Total Environ. 2020, 726, 138650. [Google Scholar] [CrossRef] [Scilit]
- Dindar, E. Assessment of Pollution Status Using Water Quality Index (WQI) and Hydrochemical Indicators in the Gemlik Gulf, Marmara Sea, Türkiye: A Spatial and Temporal Perspective. Environ. Sci. Pollut. Res. 2025, 32, 14860–14890. [Google Scholar] [CrossRef] [Scilit]
- Varol, M. Use of Water Quality Index and Multivariate Statistical Methods for the Evaluation of Water Quality of a Stream Affected by Multiple Stressors: A Case Study. Environ. Pollut. 2020, 266, 115417. [Google Scholar] [CrossRef] [Scilit]
- Jeppesen, E.; Beklioğlu, M.; Özkan, K.; Akyürek, Z. Salinization Increase Due to Climate Change Will Have Substantial Negative Effects on Inland Waters: A Call for Multifaceted Research at the Local and Global Scale. Innov. 2020, 1, 100030. [Google Scholar] [CrossRef] [Scilit]
- Liu, X.; Zhang, G.; Zhang, J.; Xu, Y.J.; Wu, Y.; Wu, Y.; Sun, G.; Chen, Y.; Ma, H. Effects of Irrigation Discharge on Salinity of a Large Freshwater Lake: A Case Study in Chagan Lake, Northeast China. Water 2020, 12, 2112. [Google Scholar] [CrossRef] [Scilit]
- Dávalos-Peña, I.; Fuentes-Rivas, R.M.; De Oca, R.M.G.F.-M.; Ramos-Leal, J.A.; Morán-Ramírez, J.; Alva, G.M. Assessment of Physicochemical Groundwater Quality and Hydrogeochemical Processes in an Area near a Municipal Landfill Site: A Case Study of the Toluca Valley. Int. J. Environ. Res. Public Health 2021, 18, 11195. [Google Scholar] [CrossRef] [Scilit]
- Timalsina, R.; Acharya, S.; Đurin, B.; Awasthi, M.P.; Pant, R.R.; Joshi, G.R.; Byanju, R.M.; Panthi, K.P.; Joshi, S.; Kumar, A.; et al. An Assessment of Seasonal Water Quality in Phewa Lake, Nepal, by Integrating Geochemical Indices and Statistical Techniques: A Sustainable Approach. Water 2025, 17, 238. [Google Scholar] [CrossRef] [Scilit]
- Yang, Y.-Y.; Tfaily, M.M.; Wilmoth, J.L.; Toor, G.S. Molecular Characterization of Dissolved Organic Nitrogen and Phosphorus in Agricultural Runoff and Surface Waters. Water Res. 2022, 219, 118533. [Google Scholar] [CrossRef] [Scilit] [PubMed]
- Messaoudi, A.; Attou, F.; Ghennam, K.; Nabi, F.; Mostefaoui, H. Time Series Analysis and Modeling of Physicochemical Water Parameters in Ghrib Dam, Medea, Algeria. Ecol. Eng. Environ. Technol. 2026, 27, 314–324. [Google Scholar] [CrossRef] [Scilit] [PubMed]
- Liang, L.; Deng, Y.; Wang, W.; Zhou, S.; Zhang, L. Influences of Lower pH on Phytoplankton Growth in Alkaline Lakes after Water Transfer: Insights from a Coupled Hydrodynamic–Algal Ecological Model and Experimental Analysis. Environ. Res. 2024, 257, 119201. [Google Scholar] [CrossRef] [Scilit]
- Mackay, E.B.; Feuchtmayr, H.; De Ville, M.M.; Thackeray, S.J.; Callaghan, N.; Marshall, M.; Rhodes, G.; Yates, C.A.; Johnes, P.J.; Maberly, S.C. Dissolved Organic Nutrient Uptake by Riverine Phytoplankton Varies along a Gradient of Nutrient Enrichment. Sci. Total Environ. 2020, 722, 137837. [Google Scholar] [CrossRef] [Scilit]
- Reinl, K.L.; Harris, T.D.; Elfferich, I.; Coker, A.; Zhan, Q.; De Senerpont Domis, L.N.; Morales-Williams, A.M.; Bhattacharya, R.; Grossart, H.-P.; North, R.L.; et al. The Role of Organic Nutrients in Structuring Freshwater Phytoplankton Communities in a Rapidly Changing World. Water Res. 2022, 219, 118573. [Google Scholar] [CrossRef] [Scilit]
- Torres-Martínez, J.A.; Mora, A.; Knappett, P.S.K.; Ornelas-Soto, N.; Mahlknecht, J. Tracking Nitrate and Sulfate Sources in Groundwater of an Urbanized Valley Using a Multi-Tracer Approach Combined with a Bayesian Isotope Mixing Model. Water Res. 2020, 182, 115962. [Google Scholar] [CrossRef] [Scilit]
- Chaa, H.; Boutaleb, A. Mineralogical and Geochemical Characteristics of the Zaccar Fe-(Ba-Pb-Zn-Cu) Deposit in Ain Defla, Algeria (Northwestern Algeria). Arab. J. Geosci. 2016, 9, 266. [Google Scholar] [CrossRef] [Scilit]
- Mikami, I.; Ishii, T.; Kitamura, F.; Masunaga, A. Effect of Other Anions on Reduction of Nitrate in Water over Pd–In Catalyst Loaded on Various Supports. IOP Conf. Ser. Earth Environ. Sci. 2020, 427, 012004. [Google Scholar] [CrossRef] [Scilit]
- Patel, P.S.; Pandya, D.M.; Shah, M. A Systematic and Comparative Study of Water Quality Index (WQI) for Groundwater Quality Analysis and Assessment. Environ. Sci. Pollut. Res. 2023, 30, 54303–54323. [Google Scholar] [CrossRef] [Scilit]
- Ewaid, S.H.; Abed, S.A. Water Quality Index for Al-Gharraf River, Southern Iraq. Egypt. J. Aquat. Res. 2017, 43, 117–122. [Google Scholar] [CrossRef] [Scilit]
- Berhanu, K.G.; Lohani, T.K.; Hatiye, S.D. Spatial and Seasonal Groundwater Quality Assessment for Drinking Suitability Using Index and Machine Learning Approach. Heliyon 2024, 10, e30362. [Google Scholar] [CrossRef] [Scilit] [PubMed]
- Hammoumi, D.; Al-Aizari, H.S.; Alaraidh, I.A.; Okla, M.K.; Assal, M.E.; Al-Aizari, A.R.; Moshab, M.S.; Chakiri, S.; Bejjaji, Z. Seasonal Variations and Assessment of Surface Water Quality Using Water Quality Index (WQI) and Principal Component Analysis (PCA): A Case Study. Sustainability 2024, 16, 5644. [Google Scholar] [CrossRef] [Scilit]
- Abd, M.H.; Al-Ani, Y.; Allawi, M.F. Applications of Artificial Intelligence Methods for Irrigation Water Quality Index: Review. Int. J. Des. Nat. Ecodynamics 2025, 20, 187–196. [Google Scholar] [CrossRef] [Scilit]
- Anyango, G.W.; Bhowmick, G.D.; Bhattacharya, N.S. A Critical Review of Irrigation Water Quality Index and Water Quality Management Practices in Micro-Irrigation for Efficient Policy Making. Desalination Water Treat. 2024, 318, 100304. [Google Scholar] [CrossRef] [Scilit]
- Hussein, E.E.; Derdour, A.; Zerouali, B.; Almaliki, A.; Wong, Y.J.; Ballesta-de Los Santos, M.; Minh Ngoc, P.; Hashim, M.A.; Elbeltagi, A. Groundwater Quality Assessment and Irrigation Water Quality Index Prediction Using Machine Learning Algorithms. Water 2024, 16, 264. [Google Scholar] [CrossRef] [Scilit]
- Suarez, D.L.; Wood, J.D.; Lesch, S.M. Effect of SAR on Water Infiltration under a Sequential Rain–Irrigation Management System. Agric. Water Manag. 2006, 86, 150–164. [Google Scholar] [CrossRef] [Scilit]
- Srinivasamoorthy, K.; Gopinath, M.; Chidambaram, S.; Vasanthavigar, M.; Sarma, V.S. Hydrochemical Characterization and Quality Appraisal of Groundwater from Pungar Sub Basin, Tamilnadu, India. J. King Saud Univ. Sci. 2014, 26, 37–52. [Google Scholar] [CrossRef] [Scilit]
- Ravikumar, P.; Somashekar, R.K.; Angami, M. Hydrochemistry and Evaluation of Groundwater Suitability for Irrigation and Drinking Purposes in the Markandeya River Basin, Belgaum District, Karnataka State, India. Environ. Monit. Assess. 2011, 173, 459–487. [Google Scholar] [CrossRef] [Scilit]
- Panday, D.P.; Kumari, A.; Kumar, M. Alkalinity-Salinity-Sustainability: Decadal Groundwater Trends and Its Impact on Agricultural Water Quality in the Indian Peninsula. Sci. Total Environ. 2025, 978, 179459. [Google Scholar] [CrossRef] [Scilit]
- Gholami, S.; Srikantaswamy, S. Statistical Multivariate Analysis in the Assessment of River Water Quality in the Vicinity of KRS Dam, Karnataka, India. Nat. Resour. Res. 2009, 18, 235–247. [Google Scholar] [CrossRef] [Scilit]
- Zhang, X.C.; Norton, L.D. Effect of Exchangeable Mg on Saturated Hydraulic Conductivity, Disaggregation and Clay Dispersion of Disturbed Soils. J. Hydrol. 2002, 260, 194–205. [Google Scholar] [CrossRef] [Scilit]
- Ramos-Pacheco, B.S.; Choque-Quispe, D.; Ligarda-Samanez, C.A.; Solano-Reynoso, A.M.; Choque-Quispe, Y.; Aguirre Landa, J.P.; Agreda Cerna, H.W.; Palomino-Rincón, H.; Taipe-Pardo, F.; Zamalloa-Puma, M.M.; et al. Water Pollution Indexes Proposal for a High Andean River Using Multivariate Statistics: Case of Chumbao River, Andahuaylas, Apurímac. Water 2023, 15, 2662. [Google Scholar] [CrossRef] [Scilit]
- Chen, P.; Li, L.; Zhang, H. Spatio-Temporal Variations and Source Apportionment of Water Pollution in Danjiangkou Reservoir Basin, Central China. Water 2015, 7, 2591–2611. [Google Scholar] [CrossRef] [Scilit]
- Irani, T.; Mostafazadeh, R.; Mousavi Moghanjoghi, S. Changes in Water Quality Condition at Sequential Monitoring Stations Based on IRWQI along the Little Zab River in Northwestern Iran. Sci. Rep. 2025, 15, 29583. [Google Scholar] [CrossRef] [Scilit]
- Tramblay, Y.; Jarlan, L.; Hanich, L.; Somot, S. Future Scenarios of Surface Water Resources Availability in North African Dams. Water Resour. Manag. 2018, 32, 1291–1306. [Google Scholar] [CrossRef] [Scilit]
- Johnston, S.G.; Maher, D.T. Drought, Megafires and Flood—Climate Extreme Impacts on Catchment-Scale River Water Quality on Australia’s East Coast. Water Res. 2022, 218, 118510. [Google Scholar] [CrossRef] [Scilit]
- Fashagba, T.S.; Bessedik, M.; ElSayed, N.B.; Abdelbaki, C.; Kumar, N. Evaluating the Water Quality of the Keddara Dam (Algeria) Using Water Quality Indices. Water 2024, 16, 1291. [Google Scholar] [CrossRef] [Scilit]
- Hallouz, F.; Meddi, M.; Mahé, G.; Toumi, S.; Rahmani, S.E.A. Erosion, Suspended Sediment Transport and Sedimentation on the Wadi Mina at the Sidi M’Hamed Ben Aouda Dam, Algeria. Water 2018, 10, 895. [Google Scholar] [CrossRef] [Scilit]
- Djezzar, M. Biodiversité et Diagnose Piscicole de Trois Lacs de Barrages Du Haut Cheliff (Ain-Defla, Algérie): Ghrib, Harreza et Sidi M’Hamed Bentaïba. Ph.D. Thesis, Ecole Nationale Supérieure d’Agronomie El Harrach, Alger, Algérie, 2015. [Google Scholar]
- Wang, L.; Chen, J.; Su, H.; Ma, X.; Wu, Z.; Shen, H.; Yu, J.; Liu, J.; Wu, Y.; Ding, G.; et al. Is Zooplankton Body Size an Indicator of Water Quality in (Sub)Tropical Reservoirs in China? Ecosystems 2022, 25, 308–319. [Google Scholar] [CrossRef] [Scilit]
- Iglesias, C.; Mazzeo, N.; Meerhoff, M.; Lacerot, G.; Clemente, J.M.; Scasso, F.; Kruk, C.; Goyenola, G.; García-Alonso, J.; Amsinck, S.L.; et al. High Predation Is of Key Importance for Dominance of Small-Bodied Zooplankton in Warm Shallow Lakes: Evidence from Lakes, Fish Exclosures and Surface Sediments. Hydrobiologia 2011, 667, 133–147. [Google Scholar] [CrossRef] [Scilit]
- Choi, Y.; Hong, G.-H.; La, G.-H.; Kim, H.-W.; Kim, M.S.; Jang, M.-H.; Chang, K.-H.; Oh, H.-J. Spatial Distribution of Calanoida in Freshwater Ecosystems and Their Application as a Food Web Assessment Index. Water 2024, 16, 3414. [Google Scholar] [CrossRef] [Scilit]
- Dutta, T.K. Zooplankton Diversity Indices for the Assessment of Perennial Freshwater Body in Bishnupur, Bankura, West Bengal. Biosci. Biotechnol. Res. Commun. 2021, 14, 1821–1824. [Google Scholar] [CrossRef] [Scilit]
- Karpowicz, M.; Kuczyńska-Kippen, N.; Sługocki, Ł.; Czerniawski, R.; Bogacka-Kapusta, E.; Ejsmont-Karabin, J. Trophic Status Index Discrepancies as a Tool for Improving Lake Management: Insights from 160 Polish Lakes. Sci. Total Environ. 2025, 981, 179581. [Google Scholar] [CrossRef] [Scilit]
- Ardón, M.; Zeglin, L.H.; Utz, R.M.; Cooper, S.D.; Dodds, W.K.; Bixby, R.J.; Burdett, A.S.; Follstad Shah, J.; Griffiths, N.A.; Harms, T.K.; et al. Experimental Nitrogen and Phosphorus Enrichment Stimulates Multiple Trophic Levels of Algal and Detrital-based Food Webs: A Global Meta-analysis from Streams and Rivers. Biol. Rev. 2021, 96, 692–715. [Google Scholar] [CrossRef] [Scilit]
- Silva, M.I.B.D.; Brandão, L.P.M.; Brighenti, L.S.; Staehr, P.A.U.; Barros, C.F.D.A.; Barbosa, F.A.R.; Bezerra-Neto, J.F. Nutrient, Organic Matter and Shading Alter Planktonic Structure and Density of a Tropical Lake. Limnol. Rev. 2025, 25, 16. [Google Scholar] [CrossRef] [Scilit]
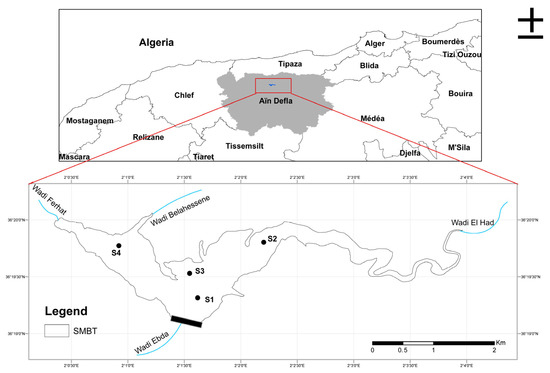
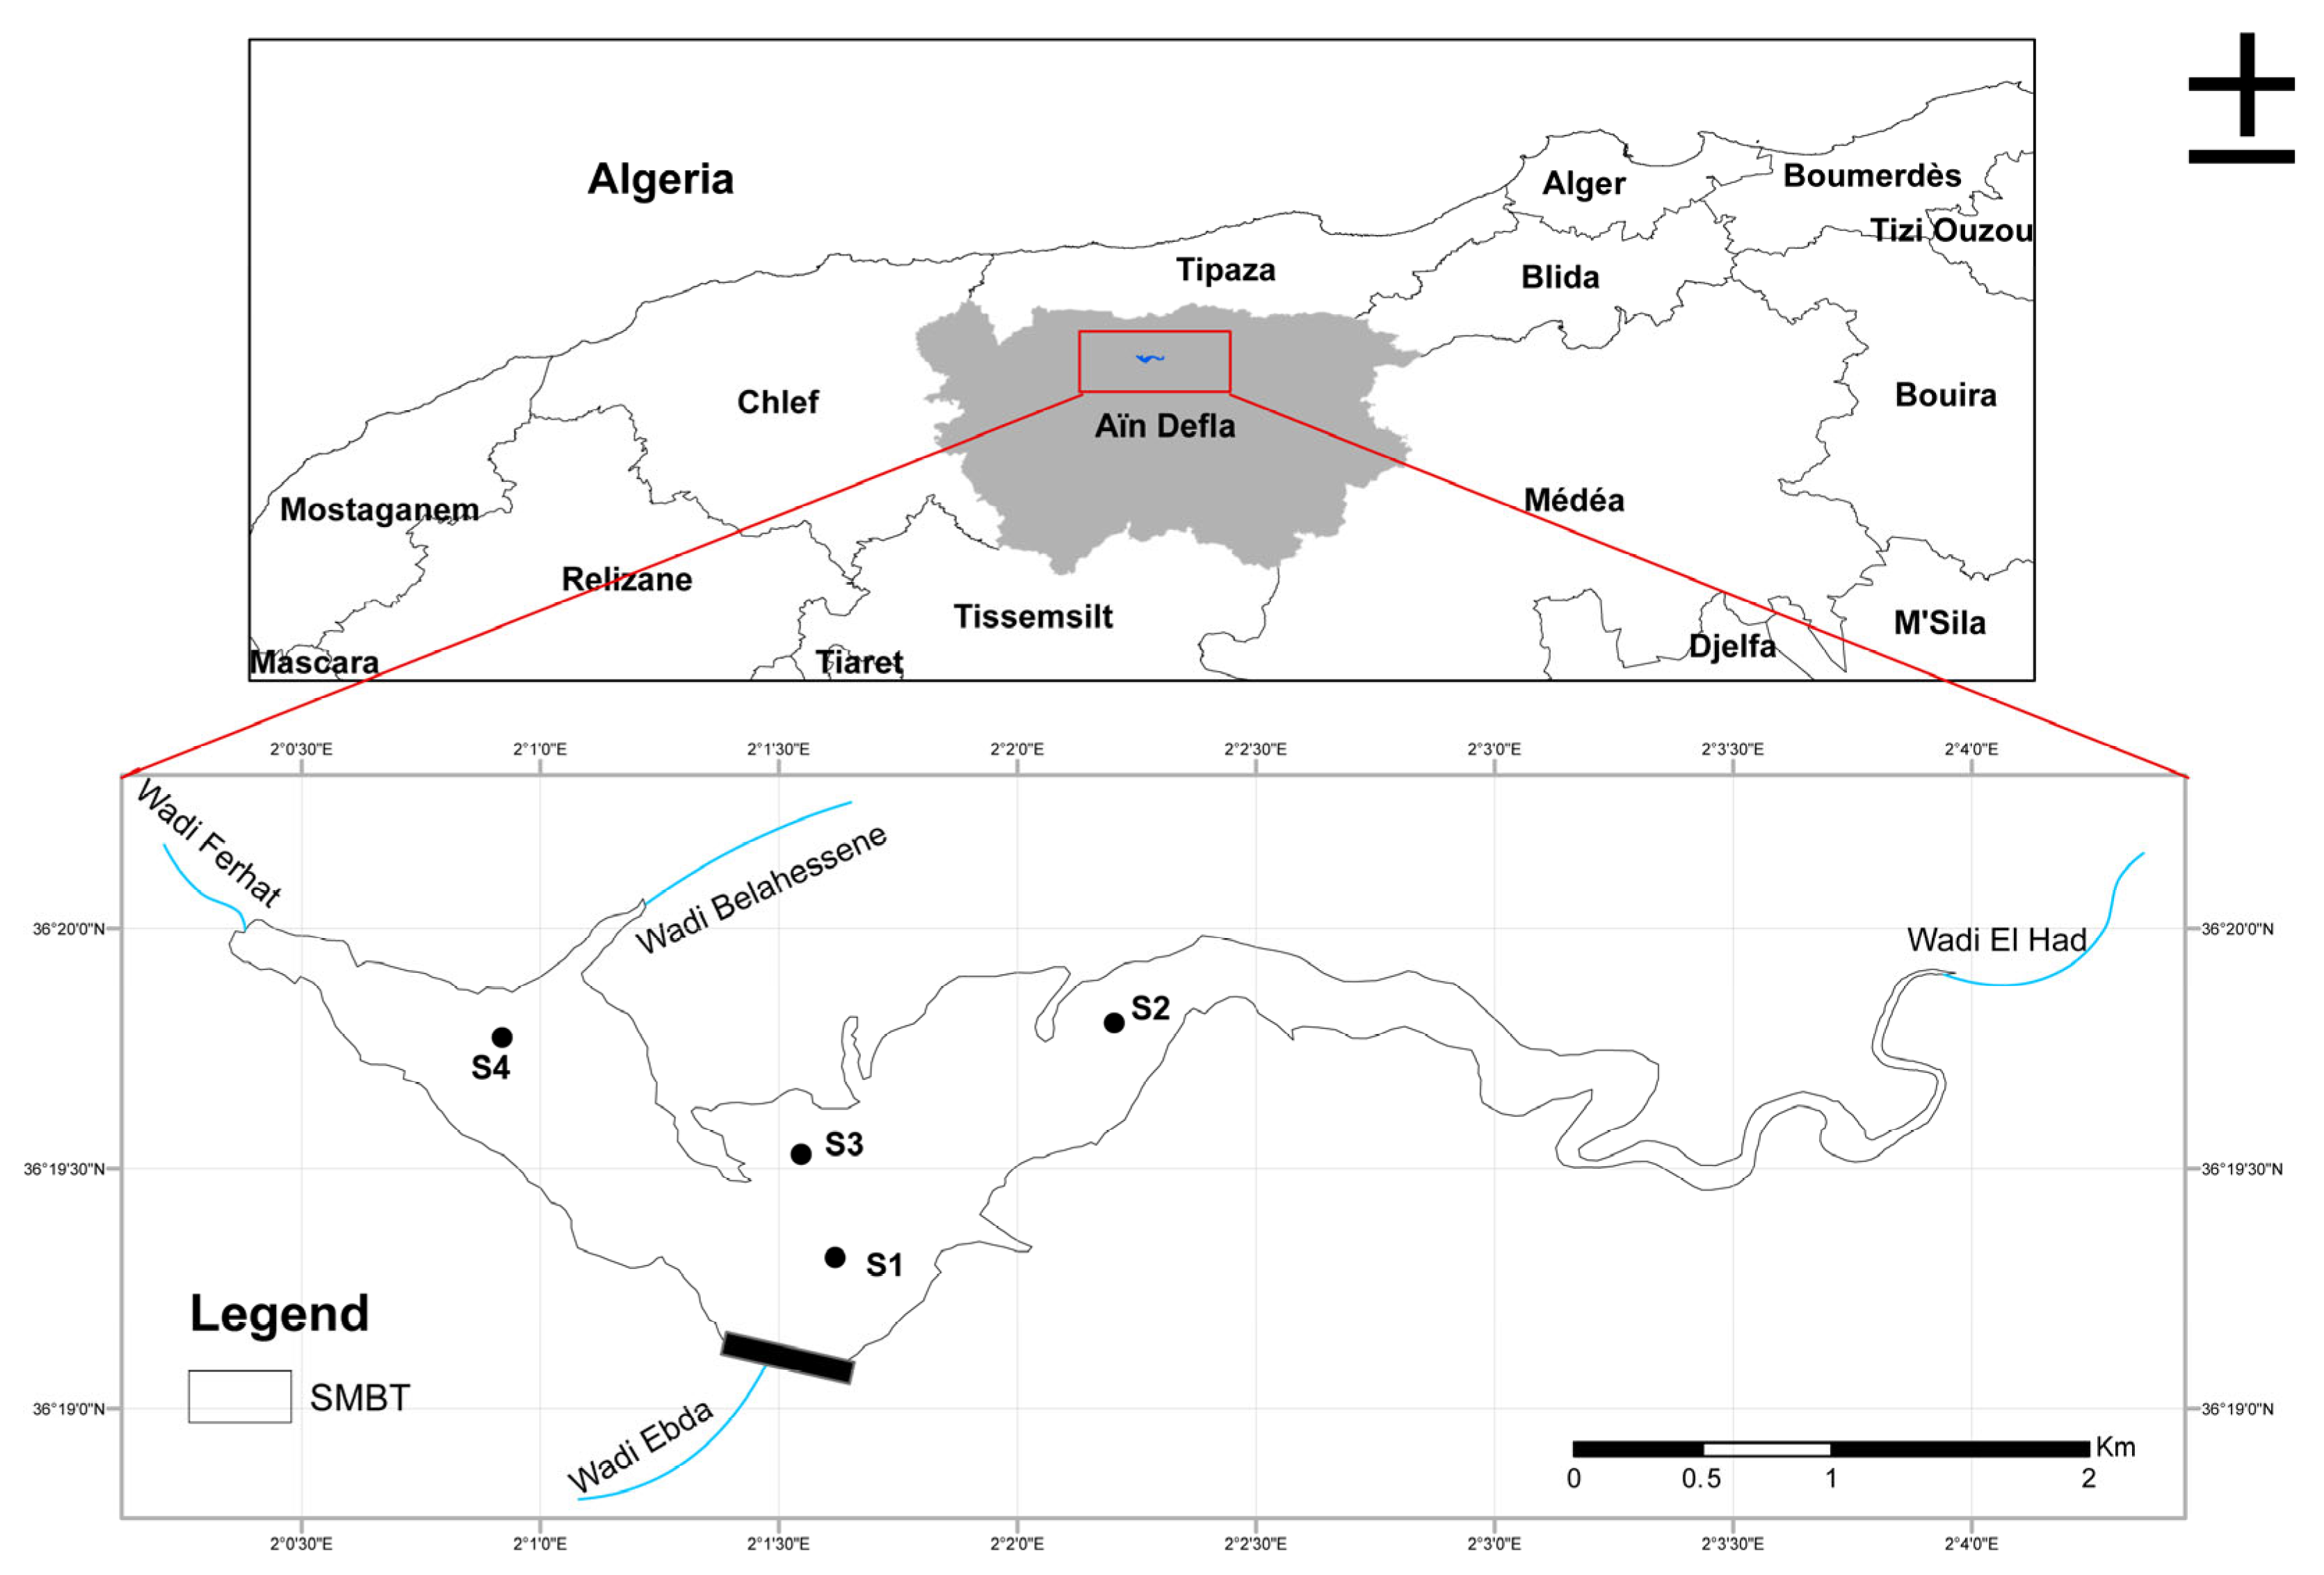
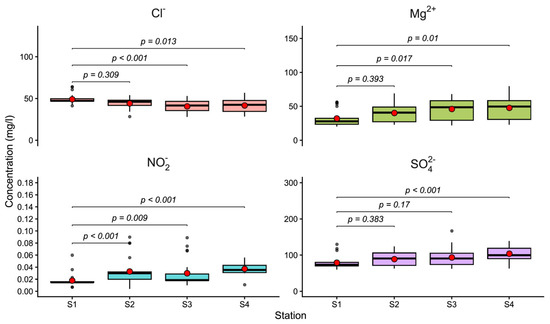
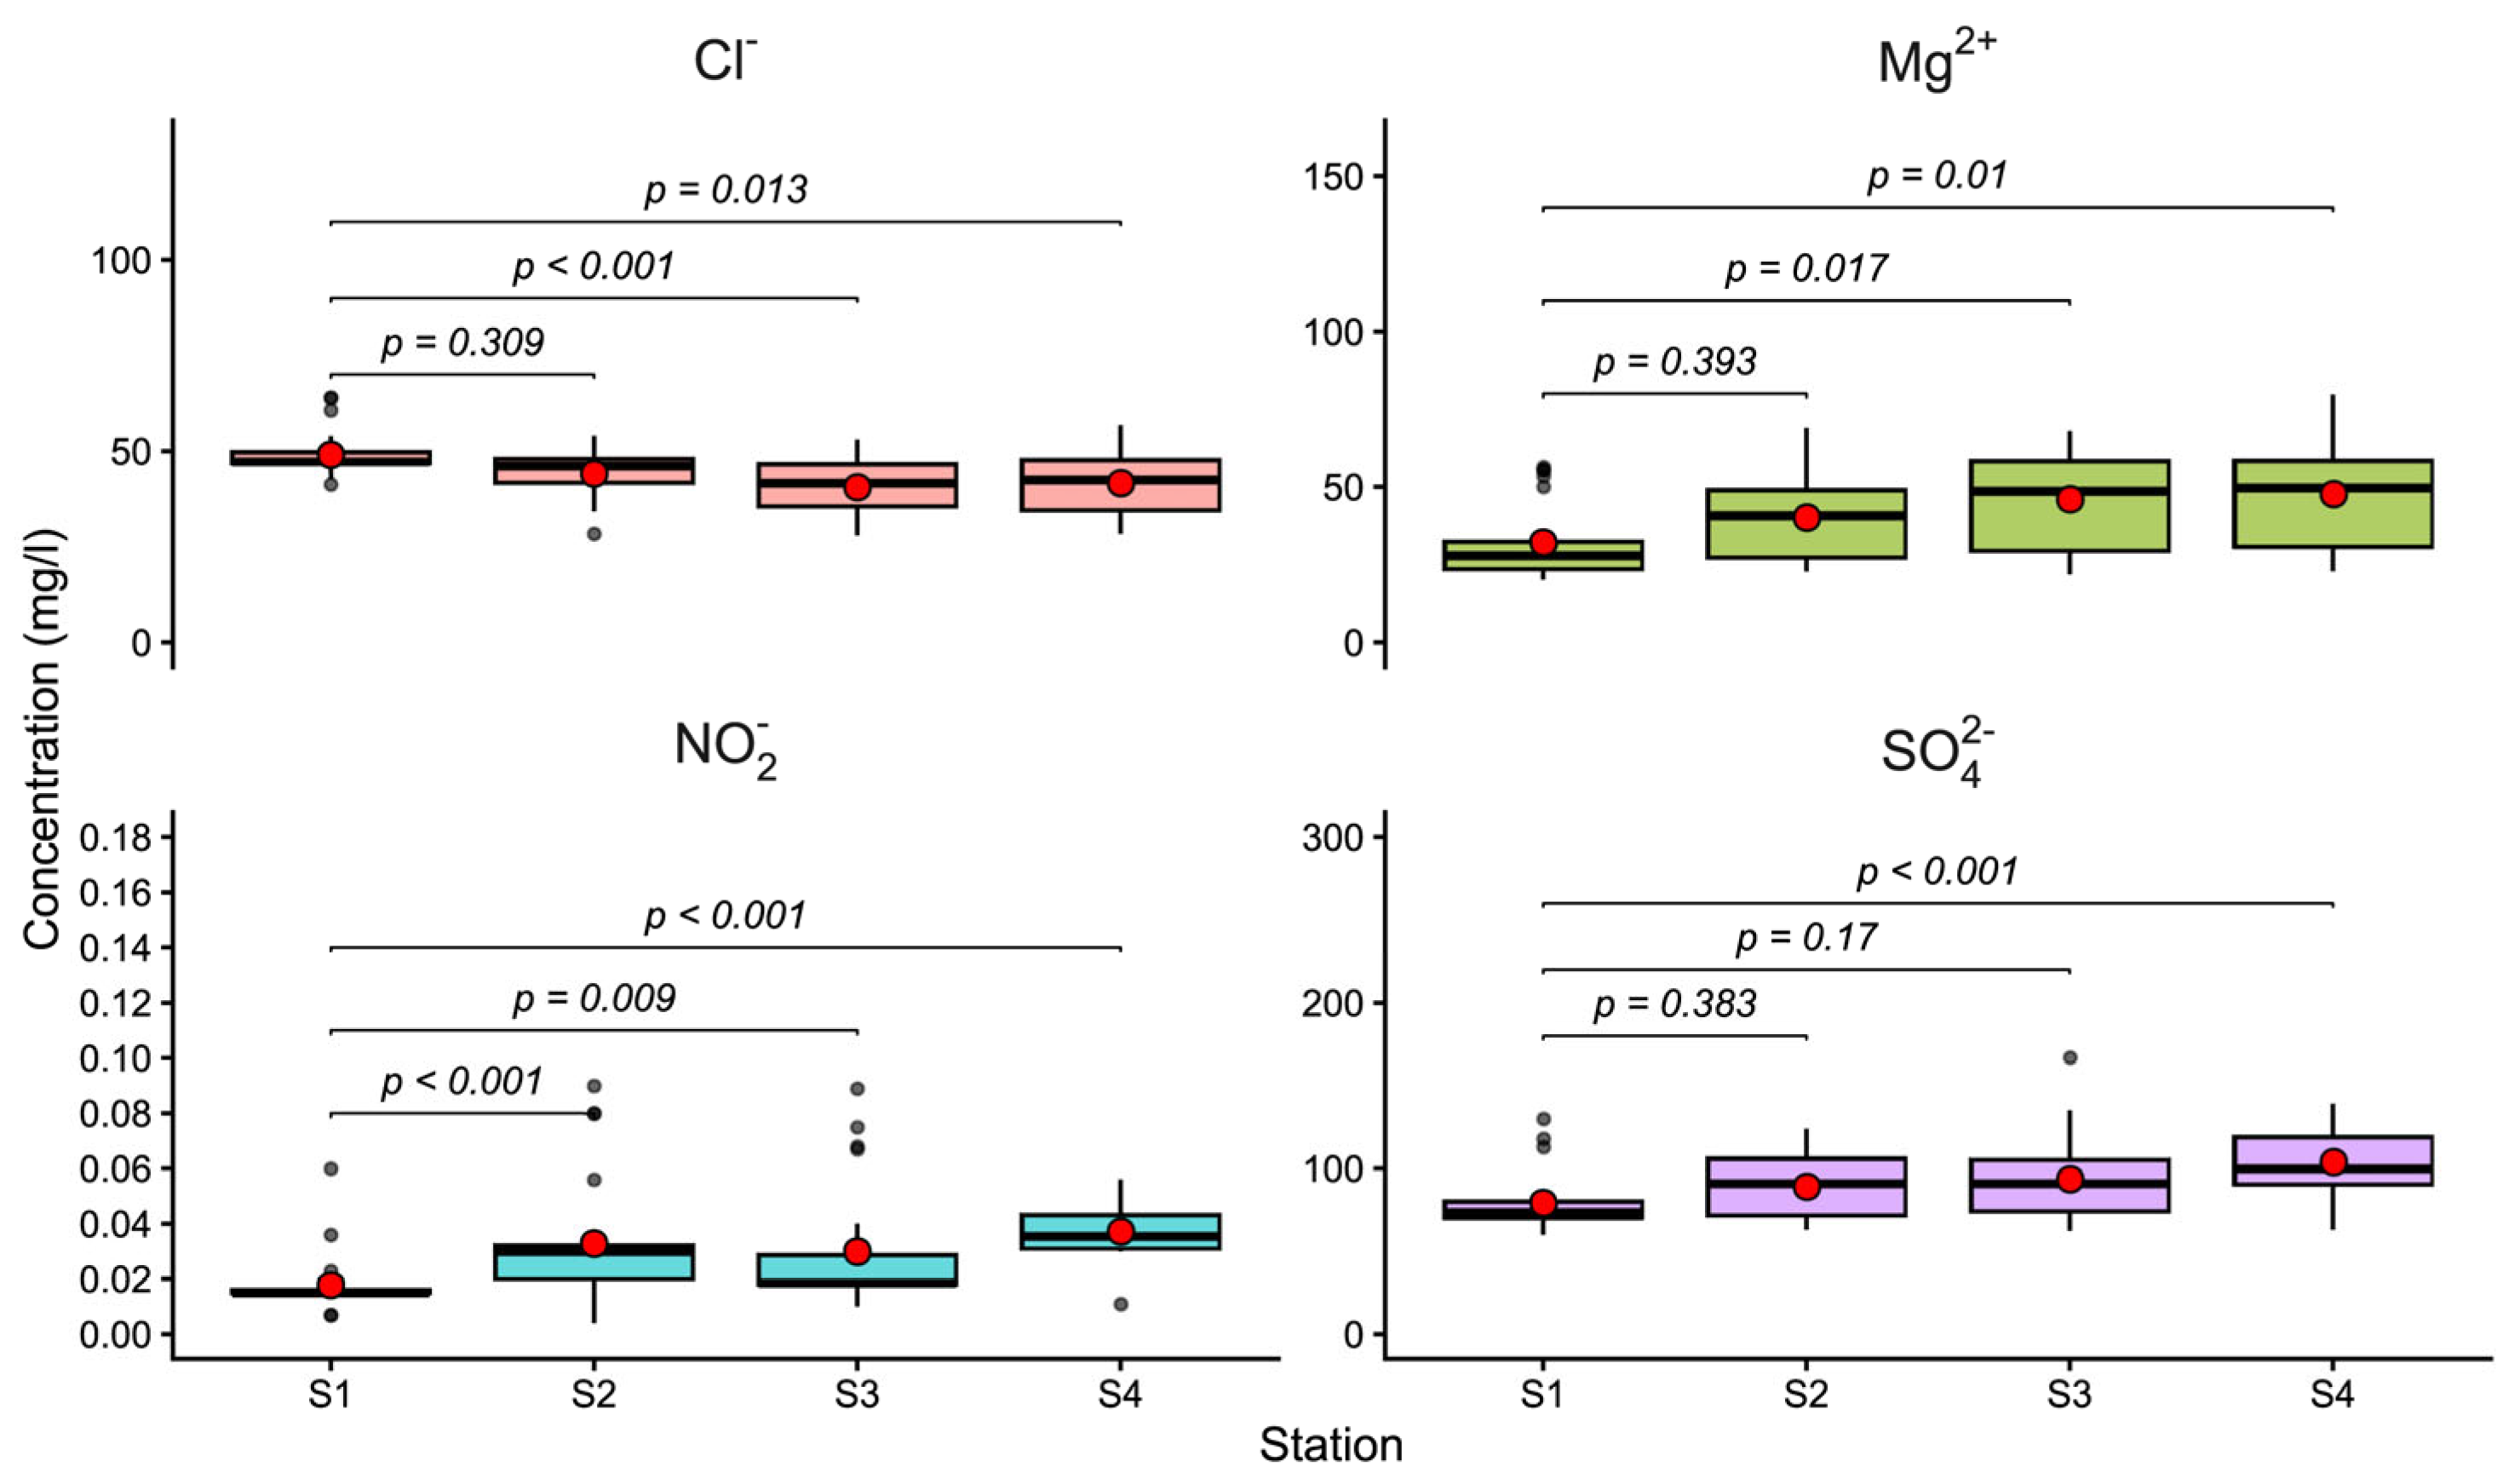
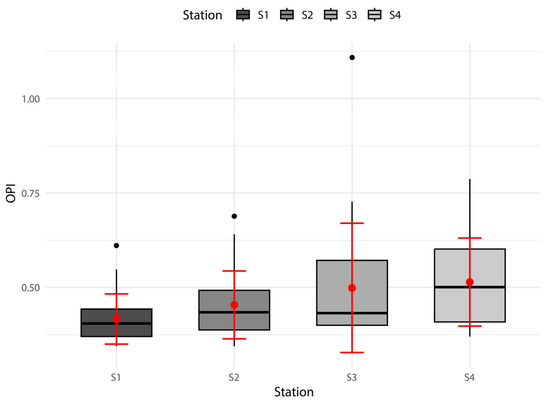
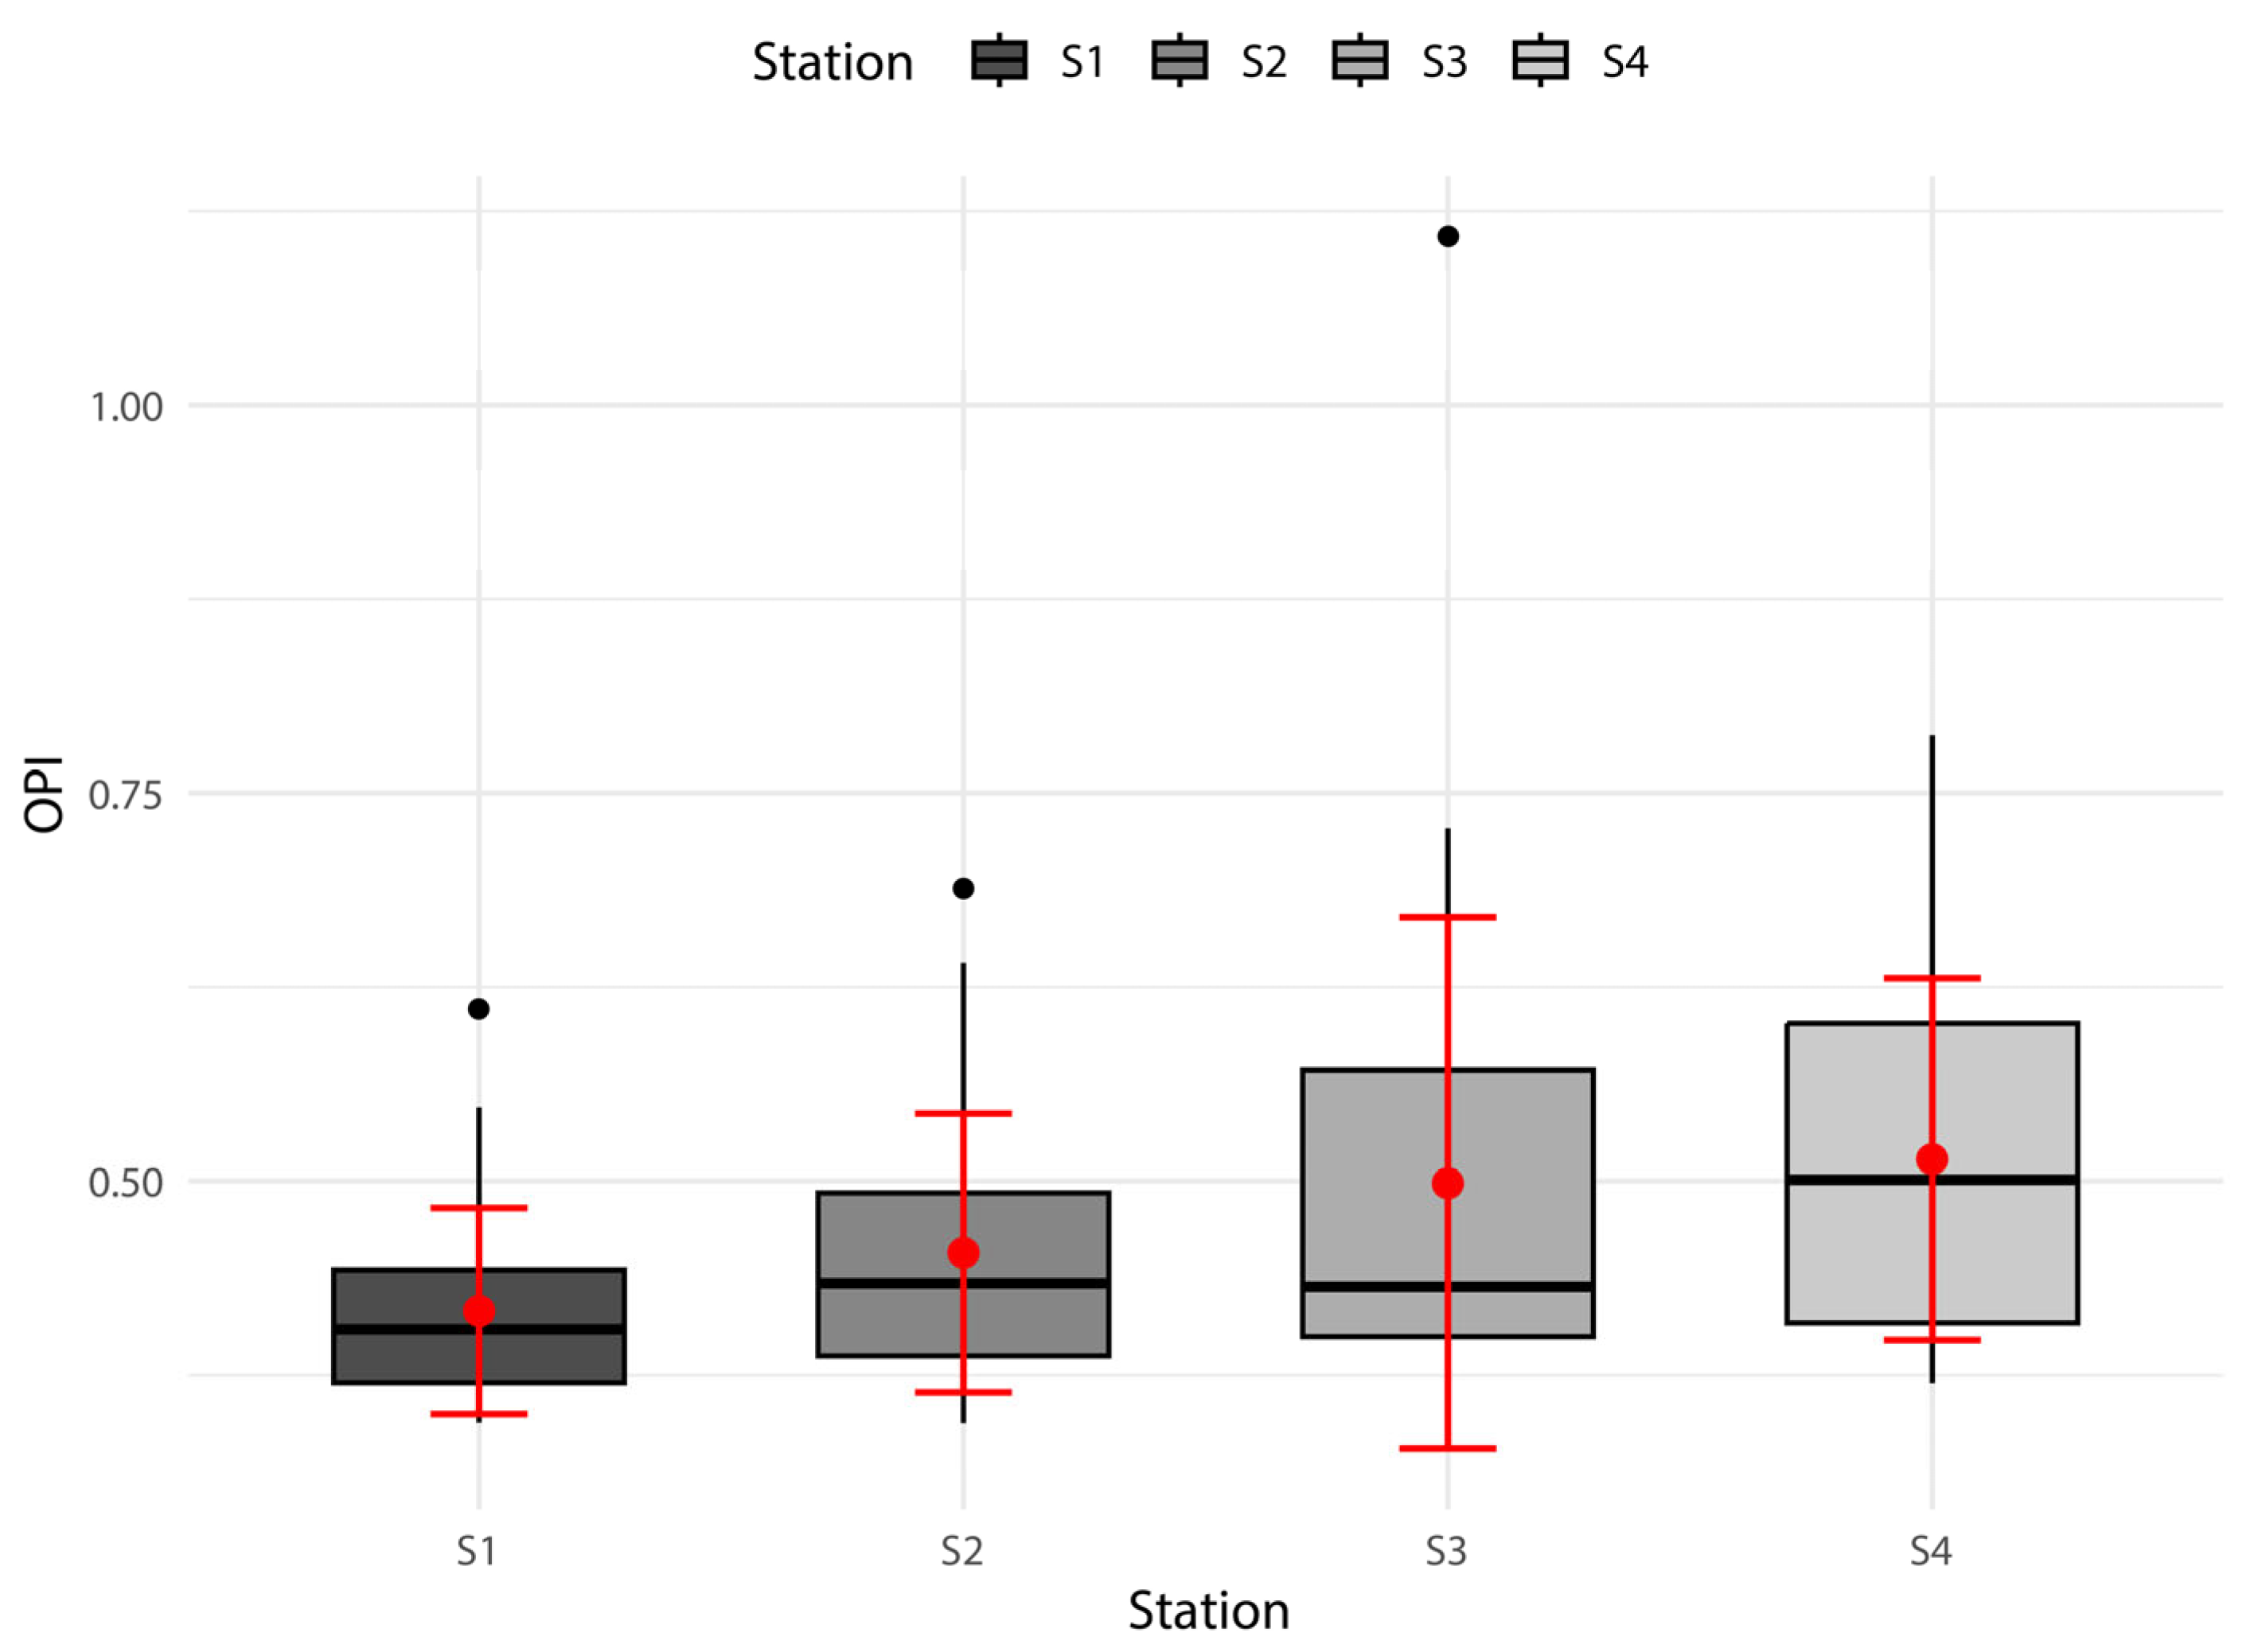
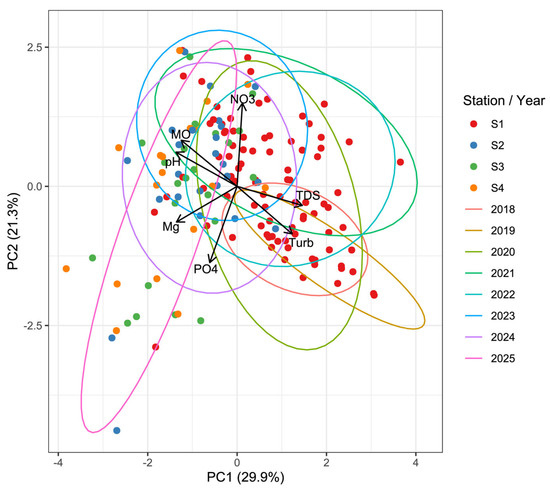
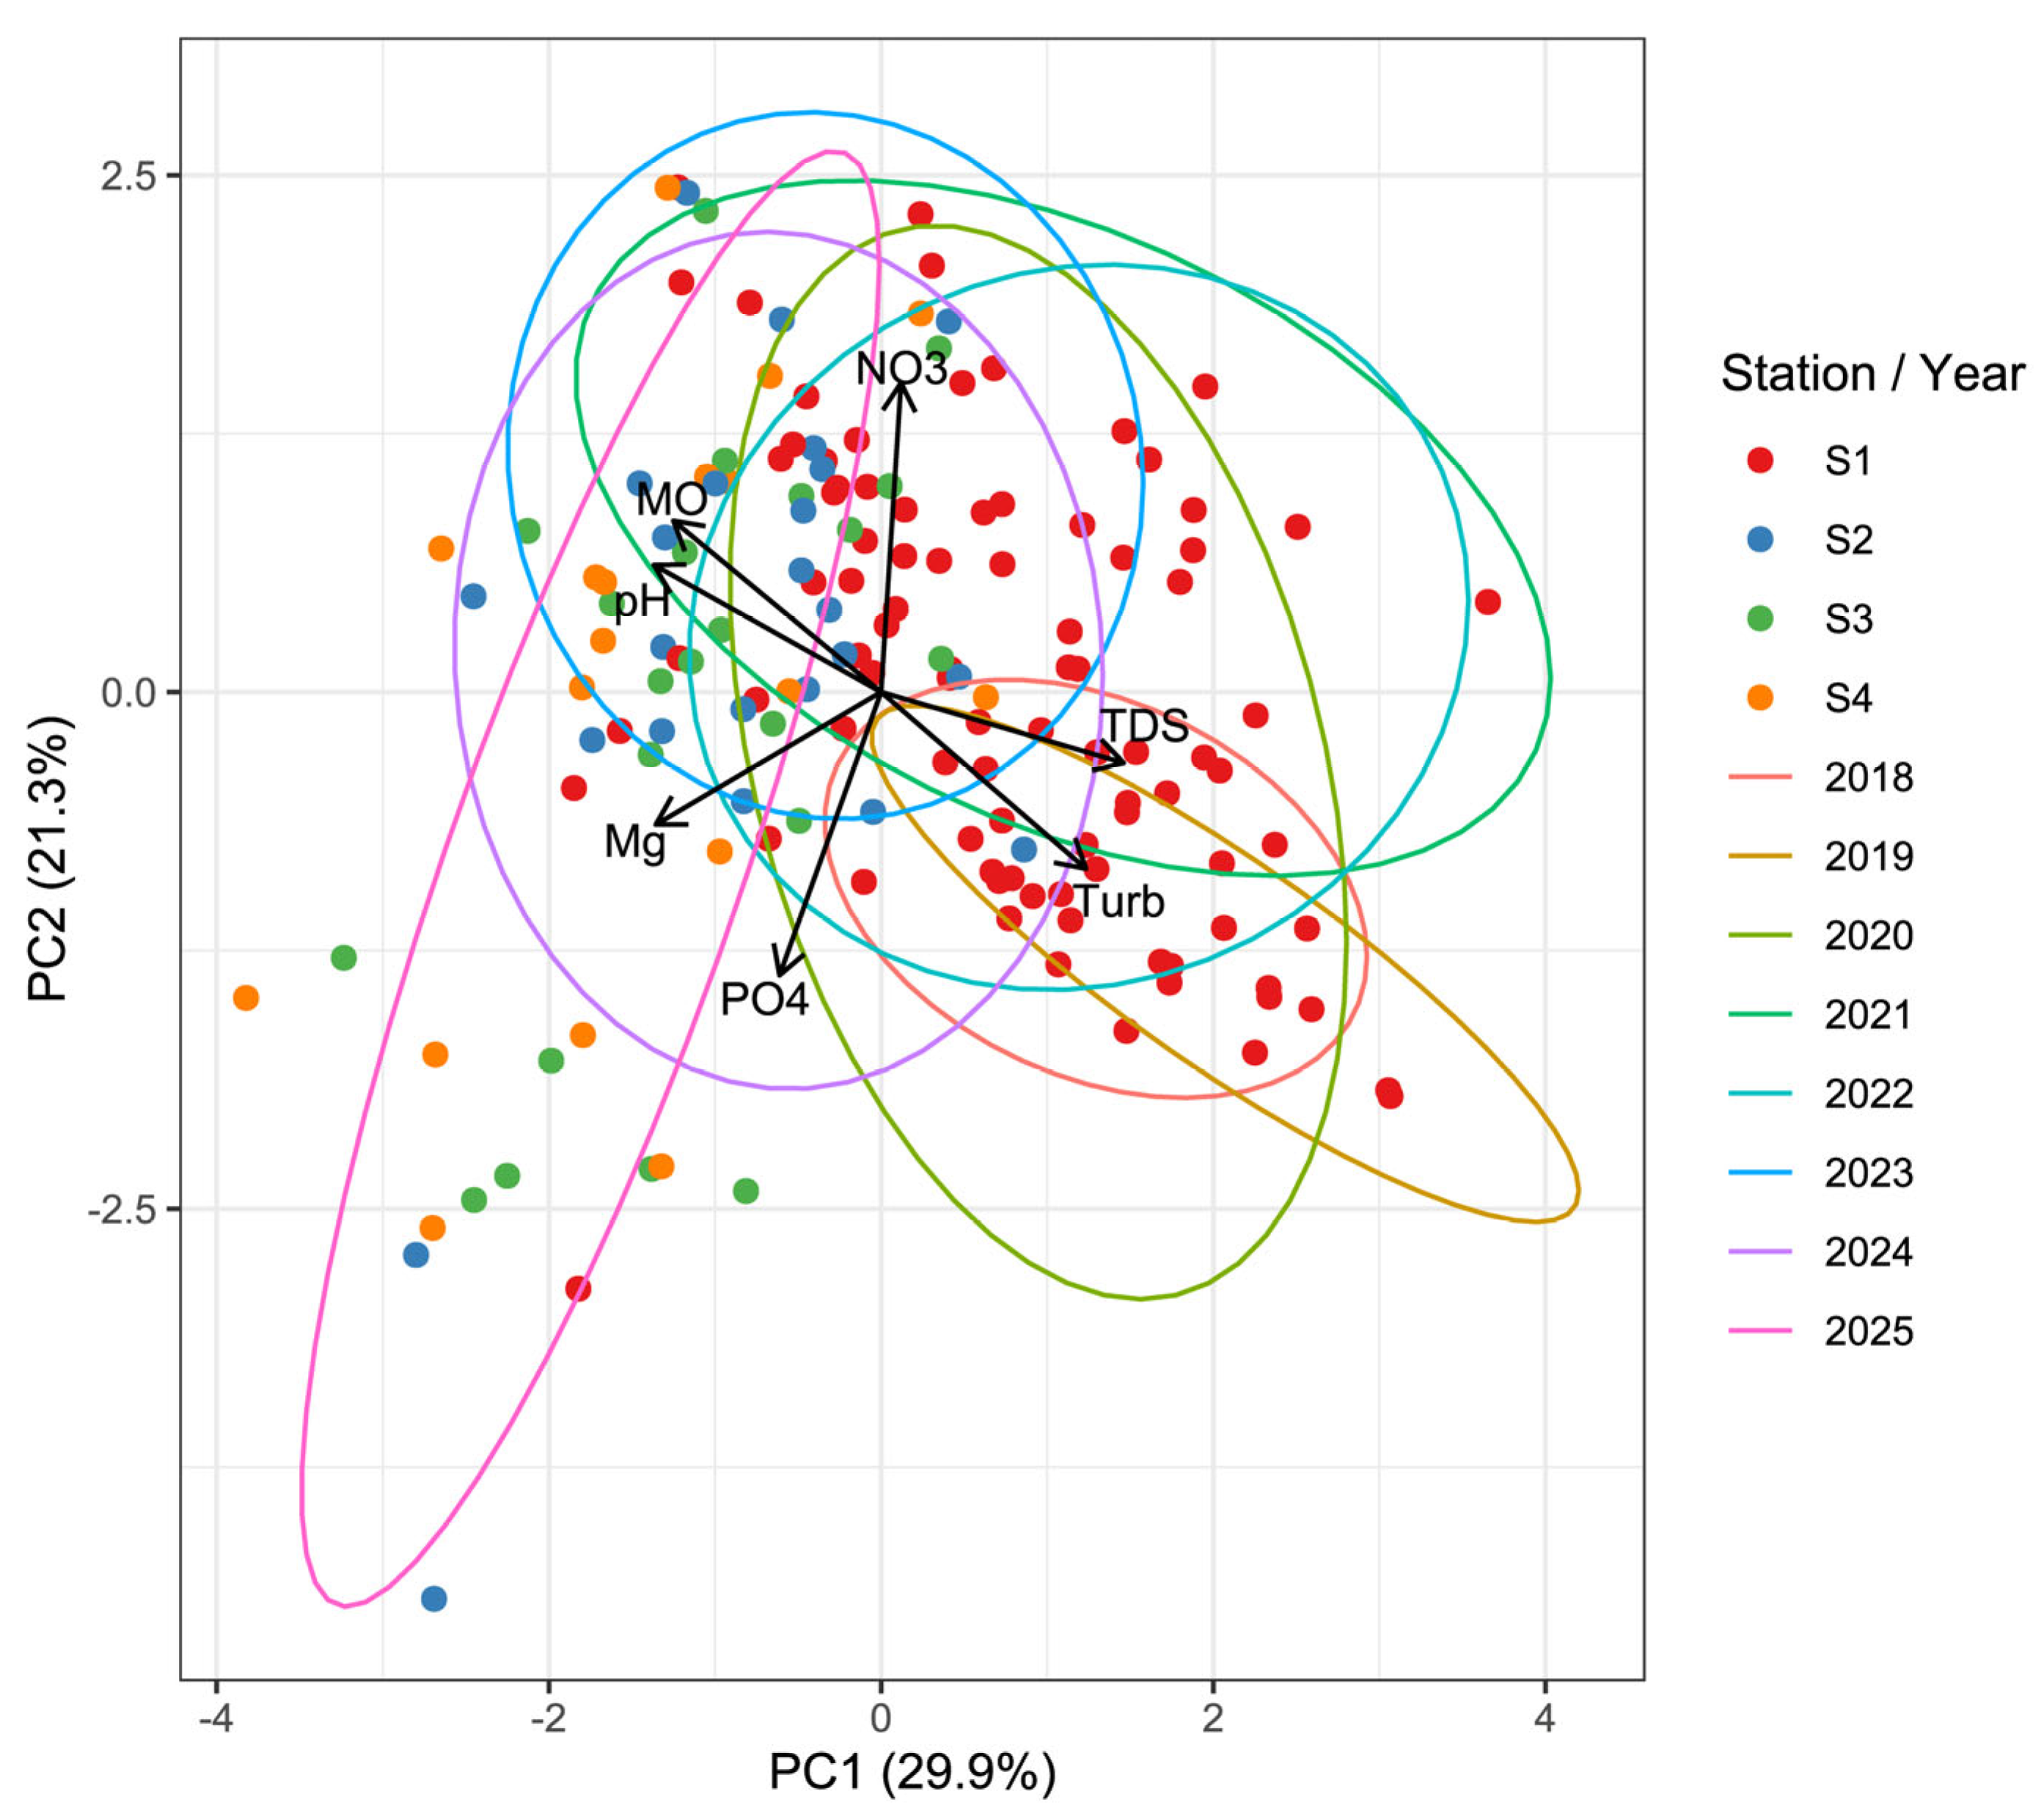
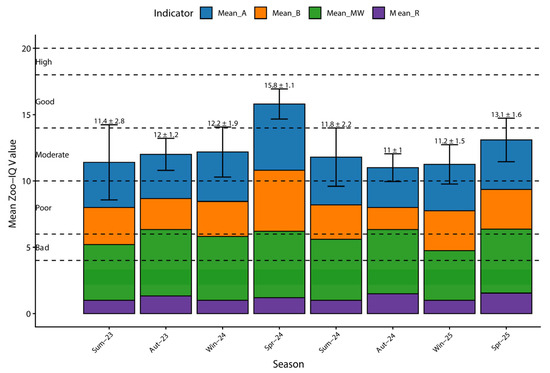
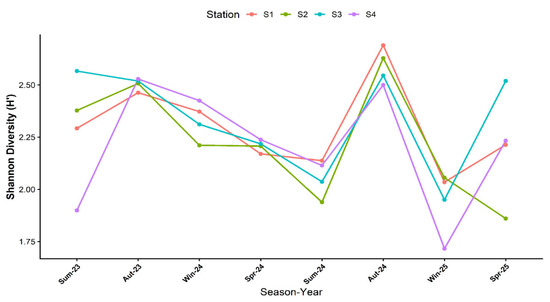
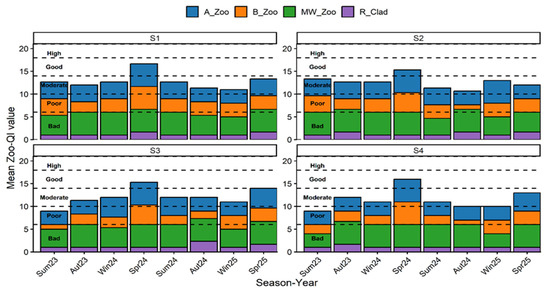
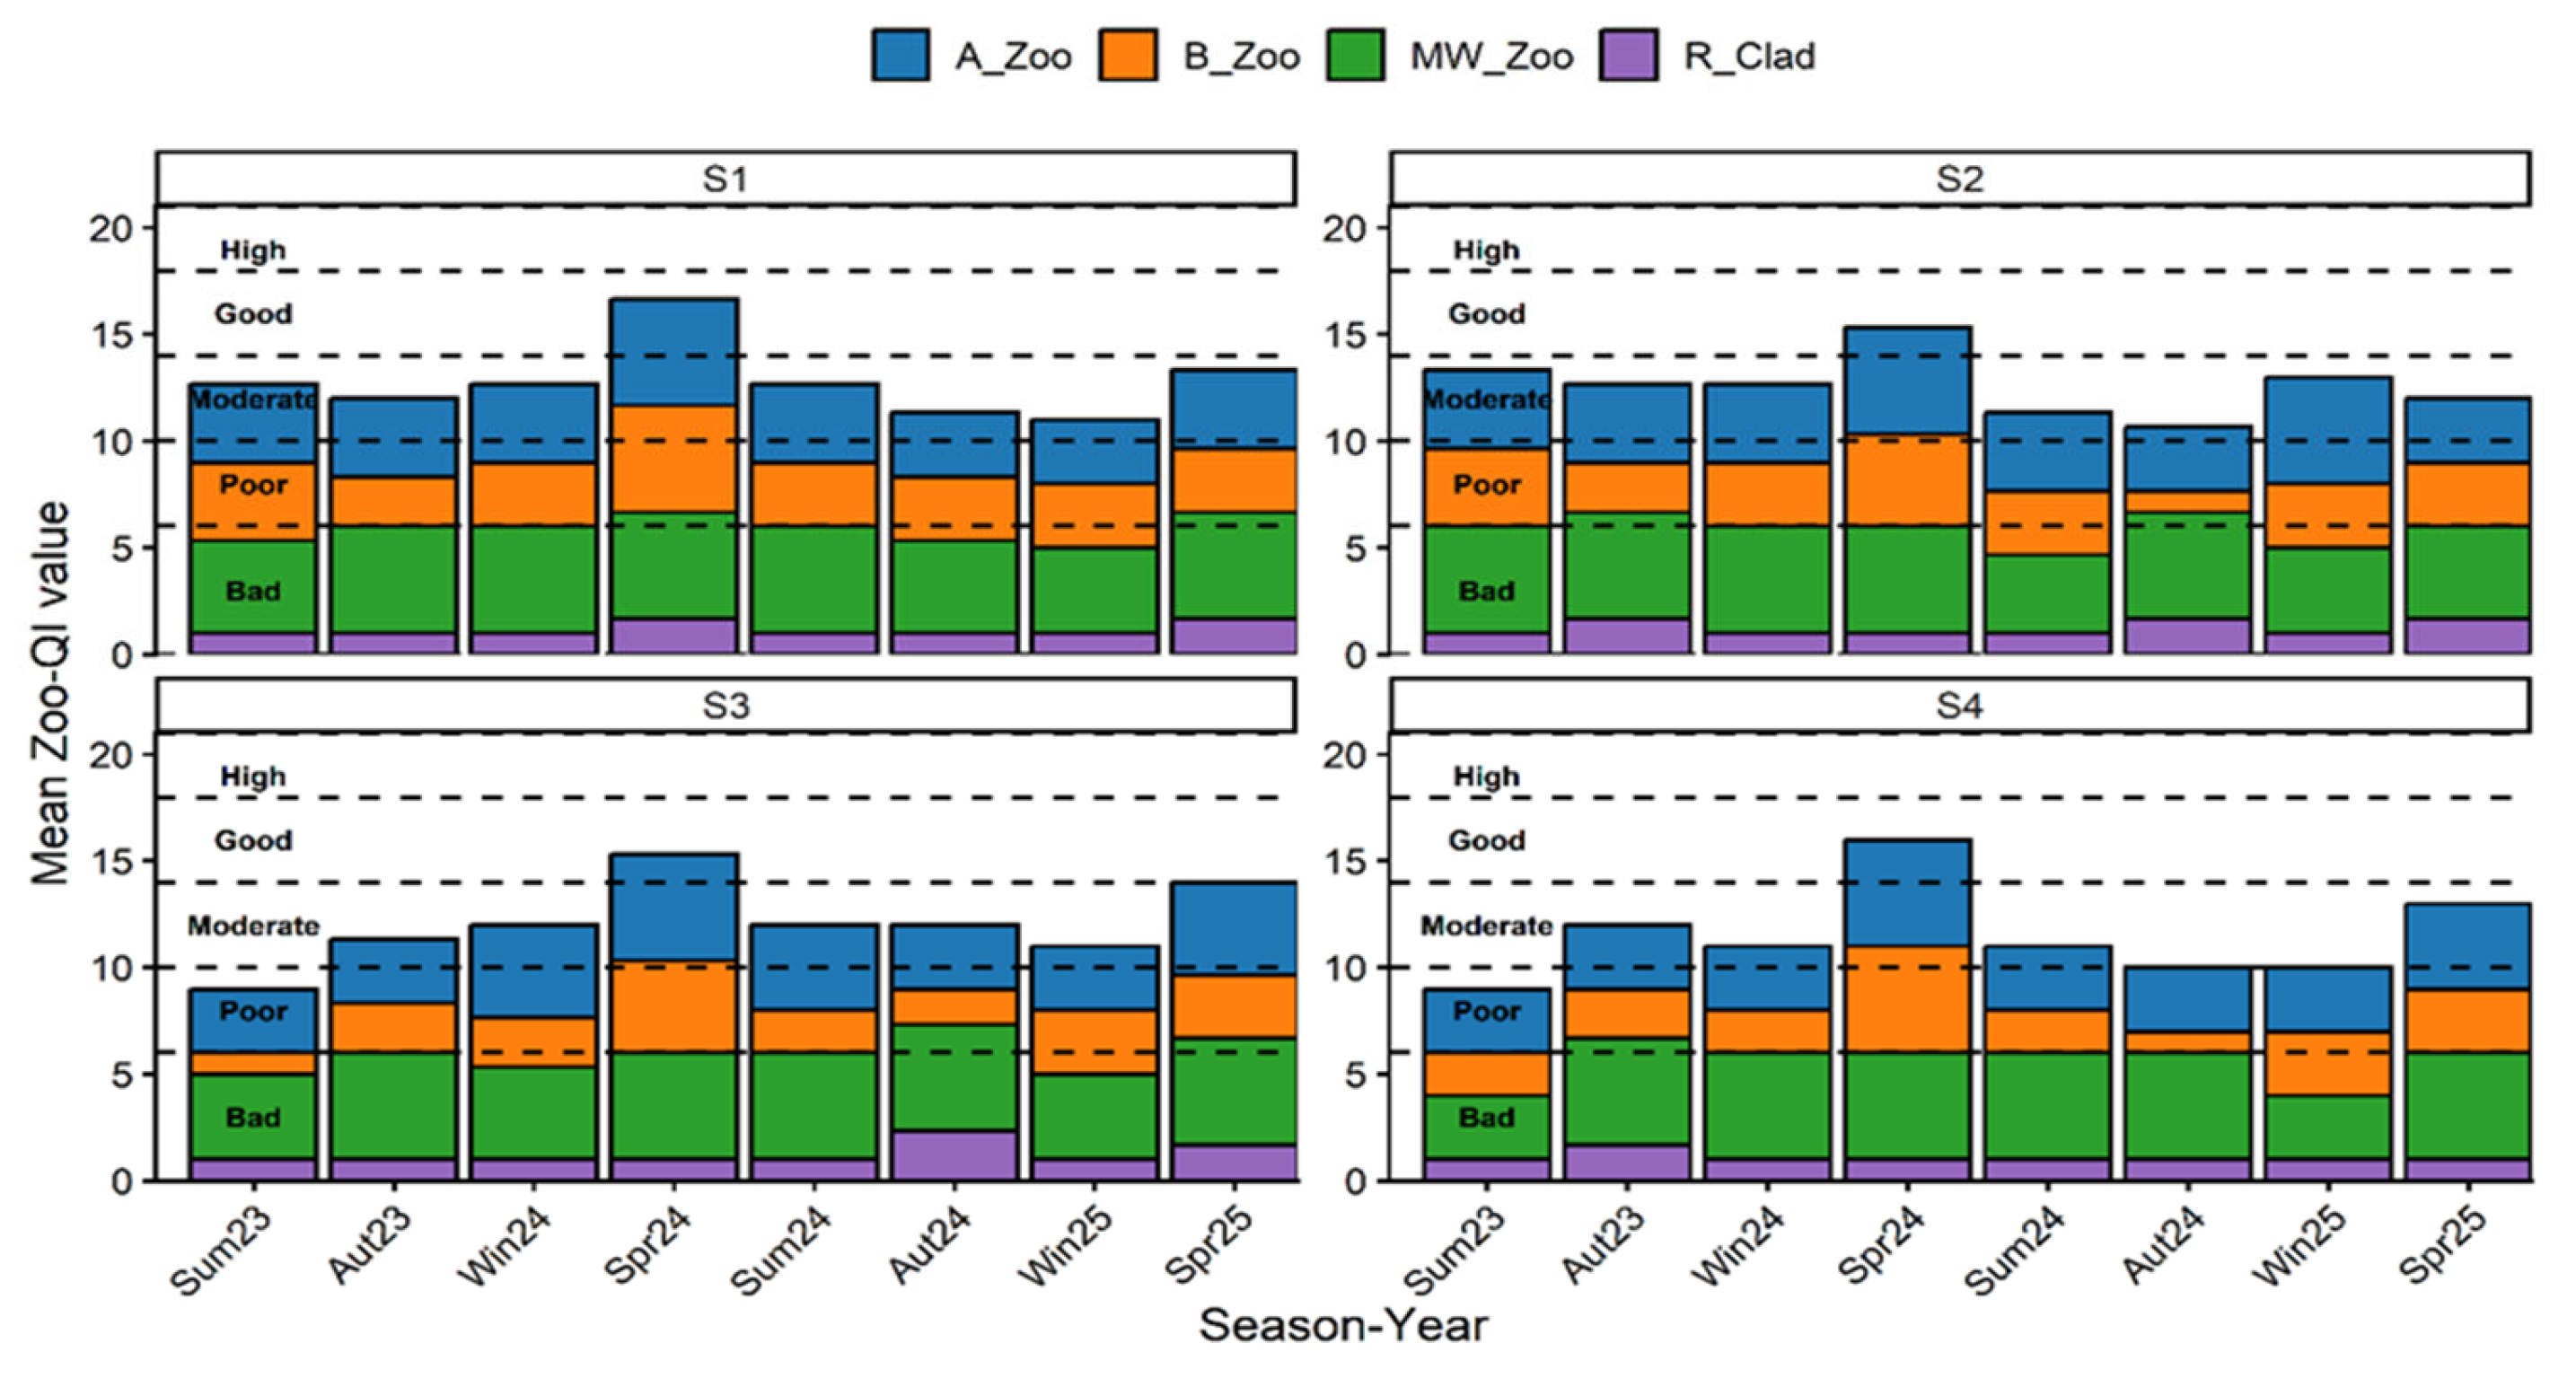
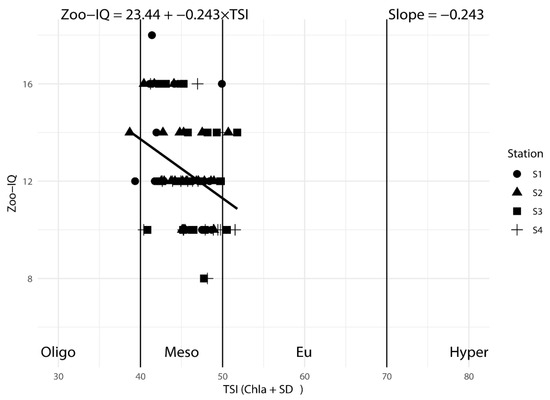
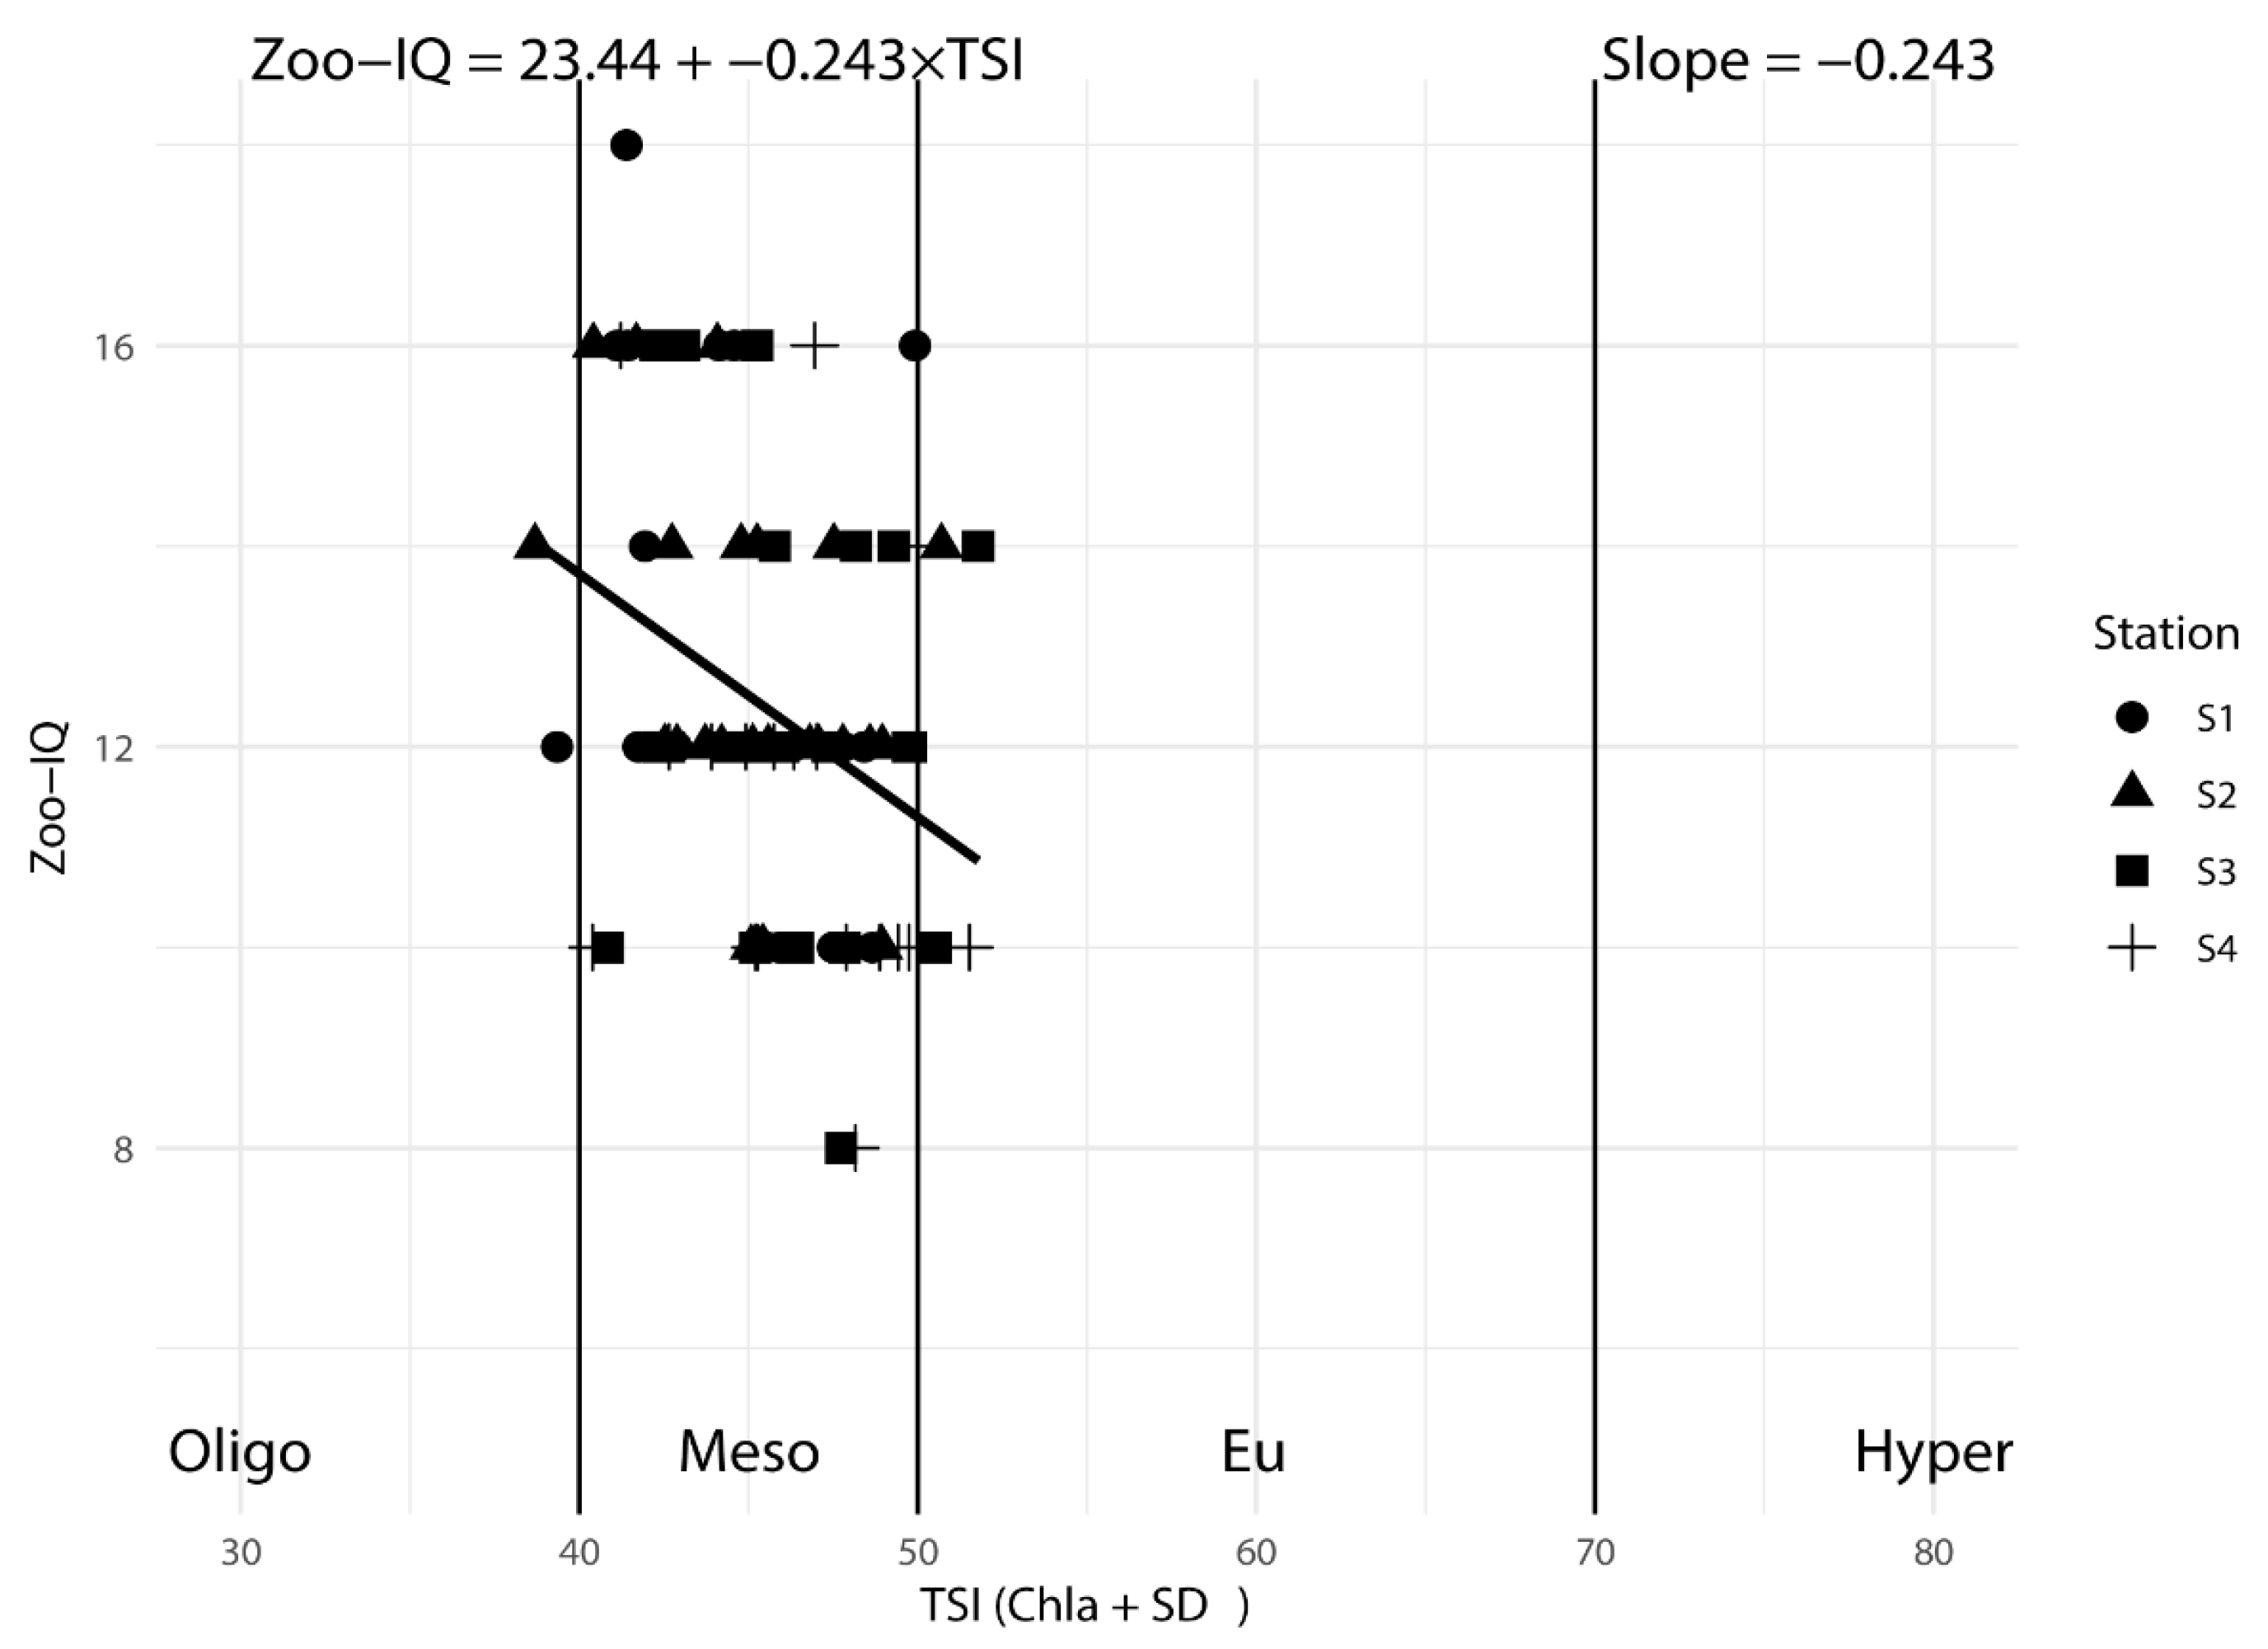
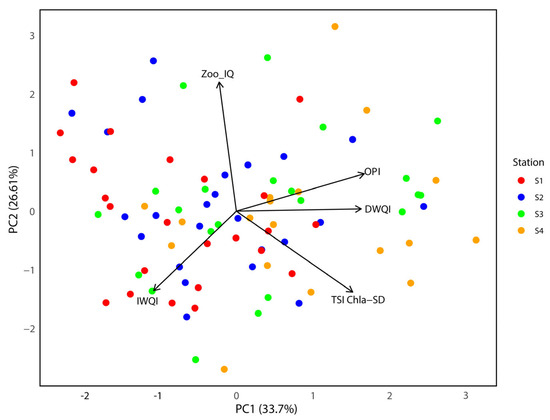
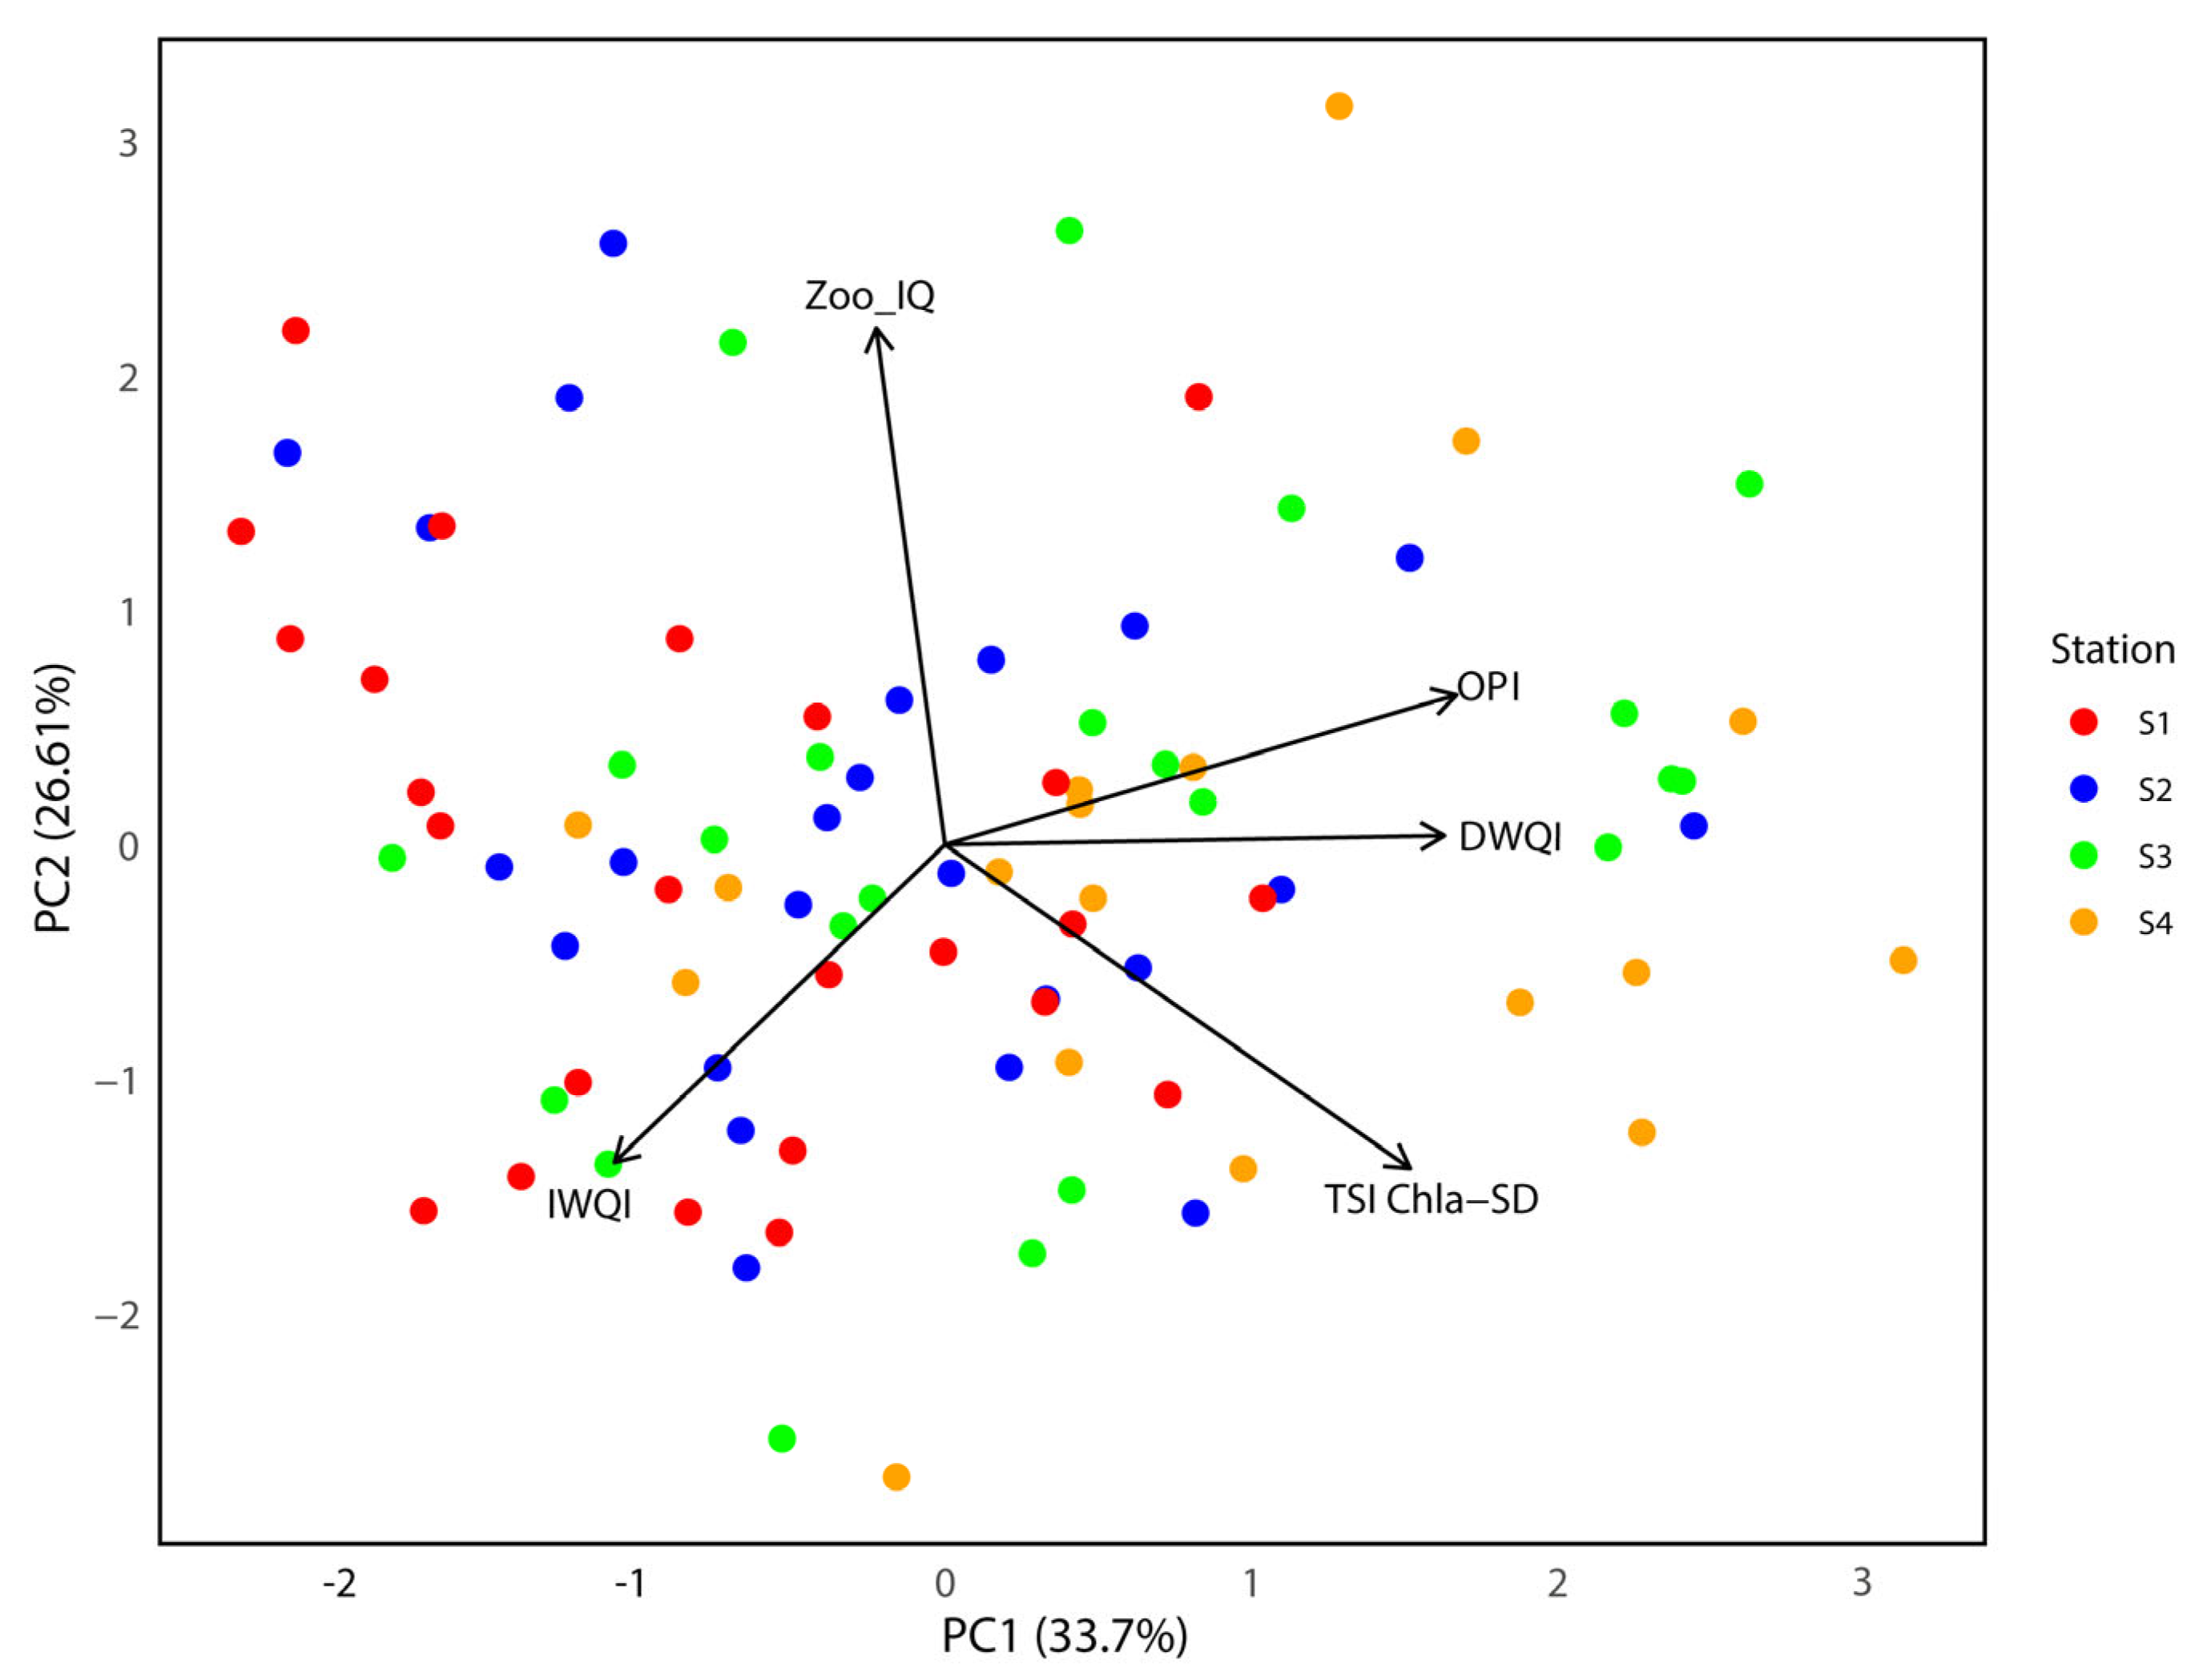

Disclaimer/Publisher’s Note: The statements, opinions and data contained in all publications are solely those of the individual author(s) and contributor(s) and not of MDPI and/or the editor(s). MDPI and/or the editor(s) disclaim responsibility for any injury to people or property resulting from any ideas, methods, instructions or products referred to in the content. |
© 2026 by the authors. Licensee MDPI, Basel, Switzerland. This article is an open access article distributed under the terms and conditions of the Creative Commons Attribution (CC BY) license.