


Highlights
- MBBR and IFAS reactor with 20% cubic polyurethane carriers supported AnAOB growth.
- NOB inhibited above 60 mg NH4-N L−1 reactor concentration.
- IFAS reactor exhibited fewer days of NOB activity compared to MBBR.
- Median N removal of 0.07 kg N m−3 d−1 in IFAS reactor was higher than in MBBR (0.05 kg N m−3 d−1).
- At mainstream-like conditions, higher N removal achieved in IFAS compared to MBBR.
Abstract
Deammonification, which is based on partial nitritation and anammox (PN/A), is a well-established sidestream treatment for nitrogen removal. However, transferring deammonification to mainstream wastewater treatment remains challenging due to low temperatures, the need to retain slow-growing anammox bacteria (AnAOB), and their competition for nitrite with nitrite-oxidizing bacteria (NOB) and heterotrophic denitrifiers. This work investigates cubic polyurethane foam carriers to promote growth and retention of AnAOB. A moving bed biofilm reactor (MBBR) and an integrated fixed-film activated sludge (IFAS) reactor were compared over a three-year experimental period at lab-scale. The feasibility of the biofilm carriers for deammonification was first evaluated under sidestream conditions, followed by a stepwise transition to mainstream operational conditions. The impact of operational parameters, including dissolved oxygen concentration, pH value, and aeration strategy, was evaluated with respect to the activity of aerobic ammonium-oxidizing bacteria (AOB), NOB, and AnAOB, as well as nitrogen removal rates. Deammonification reached nitrogen removal rates of 0.04–0.12 kg N m−3 d−1 (IFAS reactor) and 0.02–0.28 kg N m−3 d−1 (MBBR) at subphases with reactor bulk concentrations above 60 mg NH4-N L−1. Highest nitrogen removal degrees of 77 ± 6% (IFAS) and 76 ± 5% (MBBR) were achieved at reactor bulk concentrations of 96 mg NH4 L−1 and 97 mg NH4 L−1, respectively. Lower concentrations triggered NOB activity in both reactors, leading to an increase in nitrate concentration up to 22 mg NO3-N L−1. AOB and AnAOB activities were on average 6-fold higher on the carriers compared to suspended biomass throughout all experimental phases, demonstrating the feasibility of using cubic polyurethane foam carriers for deammonification. This was also confirmed by fluorescence in-situ hybridization (FISH) measurements. Median nitrogen removal rates over all experimental phases of 0.07 kg N m−3 d−1 for the IFAS reactor and 0.05 kg N m−3 d−1 for the MBBR were achieved, which are comparable to conventional activated sludge systems performing nitrogen removal via nitrification–denitrification. While at lower nitrogen concentrations, the IFAS reactor yielded superior nitrogen removal rates, peak nitrogen removal rates of 0.28 kg N m−3 d−1 were measured in the MBBR configuration. However, controlling NOB activity at lower temperatures and concentrations remains a challenge in MBBR and IFAS configurations. In our study, in the IFAS reactor NOB activities were visible on fewer days than in MBBR. At mainstream-like conditions, higher nitrogen removal rates of IFAS (0.09–0.12 kg N m−3 d−1) were achieved compared to the MBBR (0.06–0.09 kg N m−3 d−1). This demonstrates the advantage of the IFAS reactor in treating mainstream wastewater via deammonification. As an autotrophic nitrogen removal process, the implementation of deammonification in the mainstream of municipal wastewater treatment plants enables enhanced recovery of biogas from sewage organic matter. The latter would otherwise be consumed during the conventional nitrification-denitrification pathway. Consequently, the overall energy balance for wastewater treatment can be improved, contributing to a more environmentally sustainable process.
1. Introduction
Biological nitrogen removal in the mainstream of municipal wastewater treatment plants (WWTPs) commonly relies on nitrification-denitrification. Nitrification is performed by aerobic ammonium (NH4+) oxidizing bacteria (AOB) and nitrite-oxidizing bacteria (NOB), which metabolize NH4+ to nitrite (NO2−) (nitritation) and NO2− to nitrate (NO3−), respectively. Under anoxic conditions (absence of dissolved oxygen), heterotrophic denitrifying bacteria (HB) reduce the produced NO2− or NO3− to elemental nitrogen (N2) through enzymatically mediated reduction steps using organic carbon as the electron donor (referred to as chemical oxygen demand: COD). Deammonification combines partial nitritation with the anammox (anaerobic ammonium oxidation) process (Equations (1) and (2) [1]). Partial nitritation aims to convert only a part of NH4+ into NO2−, providing both required substrates for the anammox bacteria (AnAOB). In the anammox process, NH4+ and NO2− are converted to N2, with a smaller fraction oxidized to NO3−, without the consumption of COD [2,3].
| Nitritation: NH4+ + 1.5 O2 ↔ NO2− + 2 H+ + H2O | (1) |
| Deammonification: 1 NH4+ + 1.146 NO2− + 0.071 HCO3− + 0.057 H+ ↔ 0.986 N2 + 0.161 NO3− + 2.002 H2O + 0.071 CH1.74O0.31N0.2 | (2) |
In municipal wastewater treatment, deammonification is well established in the sidestream treatment of the effluent resulting from dewatering of anaerobic digested sludge (sludge dewatering effluent—SDE), which is rich in NH4+ but poor in readily biodegradable COD. By 2014, over 100 full-scale sidestream treatment plants employing deammonification had been implemented worldwide [4], and number of installations has continued to increase since then. The application of the anammox process in the mainstream line of wastewater treatment, as an alternative to conventional nitrification/denitrification, has also been a focus of research in recent years [5,6,7,8]. While reducing COD demand for nitrogen removal, deammonification would enable increasing the COD load removed in primary clarification and sent to anaerobic sludge digestion, enhancing methane production. The estimated higher methane production would account for approximately 4.5 kg COD per kg N removed, compared to conventional nitrification-denitrification [9]. Thus, deammonification would help establish an energy-positive wastewater treatment concept.
Deammonification as a mainstream treatment faces some challenges, compared to sidestream application, including performing partial nitritation at low concentrations and lower temperatures, seasonal fluctuations, and the enrichment of the slow-growing AnAOB [8,10]. For stable deammonification, only about half of the NH4+ needs to be oxidized to NO2−. In sidestream applications, the alkalinity in the SDE is typically consumed when approximately 50% of NH4+ is converted, and the drop in pH value inhibits further nitritation [11,12]. In mainstream applications, higher alkalinity may be available; therefore, partial nitritation cannot be reached with limited alkalinity alone and must be maintained through a tailored aeration strategy [13,14].
One of the biggest challenges in mainstream applications is to establish stable nitritation on a long-term, suppressing the further NO2− oxidation step to NO3−. This can be achieved either by applying short sludge age to promote NOB washout and/or by inhibiting NOB growth [15,16]. Reduced sludge age leads to a selective wash out of NOB, as NOB have a lower specific growth rate compared to AOB at temperatures higher than 18 °C and 5 mg NH4-N L−1 (0.91–1.31 d−1 for NOB, 1.05–1.4 d−1 for AOB, tested with a sludge retention time of 2–5 days) [15,16,17]. This is effective in sidestream treatment but not at the lower temperatures of the mainstream. In addition, controlling NOB growth only by lowering the sludge age is difficult in one-stage systems, as AnAOB require a high sludge age to be enriched in the system. When biofilm carrier materials are used to support AnAOB growth and retention, further operational measures are required to limit NOB growth and activity. These methods [16] include dosage of inhibiting chemicals, hydrazine [18], FA (NH3, free ammonia) or FNA (HNO2, free nitrous acid) shock treatment [19,20,21], and decreasing dissolved oxygen (DO) availability by aeration strategy combined with pH control [4,6,22,23]. In mainstream systems, the lower FA and FNA concentrations compared to sidestream conditions reduce the inhibitory effect on NOB, making effective NOB control more challenging. In MBBR (moving bed biofilm reactor) systems, a FA shock treatment solution for suppression of NOB has already been successfully tested on AnoxKaldnes K5 carriers [21]. Also, combined inhibition strategies with low DO, periodical activated sludge exposure to high FNA, as well as operation at high residual NH4+ concentration (about 8 mgN L−1) have already been applied in a pilot-scale IFAS (integrated fixed-film activated sludge) deammonification system with K5 carriers [24].
Literature evidence indicates that the first biofilm carrier-based full-scale deammonification systems under mainstream conditions still face further challenges beyond controlling NOB activity, as interference by heterotrophic bacteria, augmentation of activities of AnAOB and AOB under low N/COD ratio, seasonal temperature variations, and final polishing of effluents [25,26]. In previous investigations, mainly flat biofilm carriers were employed. In the present study, a substantially different carrier type, cubic polyurethane foam carriers, was used. Due to their three-dimensional structure, pronounced DO gradients can be expected within the carrier matrix, with lower DO concentrations in the center of the carrier, potentially creating favorable conditions for AnAOB over NOB. Additionally, AnAOB are protected from shear forces inside the cubic carrier, supporting adhesion and retention of the bacteria in the biofilms. Mainstream deammonification at lab-scale has been successfully tested with synthetic wastewater in different reactor configurations like upflow membrane-aerated biofilm reactor [5] and with cubic polyurethane foam carriers in plug flow fixed-bed [27,28,29] or anaerobic sequence batch biofilm reactors [30]. In the present study, both an MBBR and an IFAS process were employed. The short sludge age of the suspended biomass in MBBRs may be useful to select bacteria that can grow on the carriers and potentially control NOB enrichment in the system. In contrast to the MBBR, the IFAS process combines biofilm growth on carriers with suspended activated sludge that is returned to the reactor from the secondary clarifier. By providing adequate sludge age for AOB growth in suspended flocs, while allowing AnAOB to develop in the biofilm carriers, process conditions for AOB and AnAOB growth can be optimized [31,32]. One of the research questions was to elucidate whether controlling the sludge age may support AOB activity on the flocculent sludge and help control NOB growth.
Another challenge to be faced is the different temperature dependency of AnAOB compared to AOB, with decreasing temperatures leading to a higher AOB to AnAOB ratio. DO adjustment may balance NO2− production by AOB with the NO2− uptake by AnAOB. Lotti et al. also found that AnAOB cultivated in biofilm systems seems to be less influenced by decreasing temperature than AnAOB grown in suspension [33]. Biofilm suitability for mainstream treatment facing low temperatures was shown by Laureni et al. [34]. Laureni et al. demonstrated over 5 months process stability in 12 L sequencing batch reactors (MBBR and Hybrid-MBBR) at mainstream conditions at low temperatures around 15 °C with removal rates and effluent quality similar to conventional treatment for biological nutrient removal [34]. Statistical analysis by Li et al. showed temperature as one of two factors (the other one being the N/COD ratio) influencing the nitrogen removal pathway [35]. Their study was based on experiments of an upflow double-blanket filter filled with cubic polyurethane carriers and fed with synthetic and synthetic-municipal wastewater mix [35].
The presence of biodegradable COD in mainstream applications, compared to sidestream systems, increases process complexity. Moderate COD concentrations (high N/COD ratios) may support the control of NOB activity, since moderate heterotrophic activity may reduce DO concentration and AOB exhibit a higher affinity for DO than NOB. However, heterotrophic bacteria may also compete with AnAOB for NO2− in anoxic niches. At low N/COD ratios, heterotrophic activity increases and may dominate over anammox activity as heterotrophic bacteria grow faster than AnAOB [31,35]. For a CANON (completely autotrophic nitrogen removal over nitrite) process in membrane bioreactors, Zhang et al. found that below a threshold of 0.59 N/COD ratio, AnAOB were suppressed and nitrogen removal decreased [36]. In mainstream deammonification, COD concentration is higher than in sidestream, and therefore N/COD needs to be considered to establish a stable deammonification in mainstream over a long time period. This aspect was a key focus of the present study, in which different N/COD ratios were obtained by mixing real municipal wastewater with SDE.
To summarize, the major challenges for the application of deammonification in mainstream are low water temperature, low ammonia (NH3) and NO2− concentrations (not favorable to control NOB activity), low N/COD-ratio in the influent, as well as the enrichment and retention of AnAOB biomass [37,38].
The objective of the study was to investigate the feasibility of cubic polyurethane foam carriers to support deammonification under mainstream conditions in an MBBR and in an IFAS configuration, while examining how different reactor configurations influence the growth and competition of AOB, AnAOB, and NOB in these systems.
Cubic polyurethane foam carriers were chosen for their three-dimensional structure, which promotes pronounced DO gradients. The study aimed to assess whether these oxygen gradients within the cubic carriers provide suitable conditions for AOB and AnAOB growth and help to outcompete NOB. This was also demonstrated by fluorescence in-situ hybridization (FISH) measurements.
Polyurethane foam carriers have already been studied in previous studies with synthetic wastewater in upflow anaerobic sludge blanket and sequencing batch reactors [39,40]. The novelty of the present work also relies on (i) the use of real wastewater instead of synthetic water, and (ii) the experimental approach with stepwise decrease of the influent NH4+ concentrations in SDE, therefore transitioning deammonification from sidestream to mainstream conditions. This approach allowed us to identify threshold concentrations for NOB activity. In the second half of the experimental period, real municipal sewage was added to the influent to evaluate process operation changes due to a lower N/COD ratio and the impact on nitrogen removal performance.
A key strength of the study is also the extended duration of the continuous lab-scale investigations over 3 years, providing a robust data set that is suitable for understanding the dynamics of biofilm systems.
The results provide valuable insights into the process dynamics and operational challenges, representing an important contribution toward the further development of treatment technologies aimed at achieving stable deammonification performance in the mainstream of municipal WWTPs.
2. Materials and Methods
2.1. Experimental Set-Up
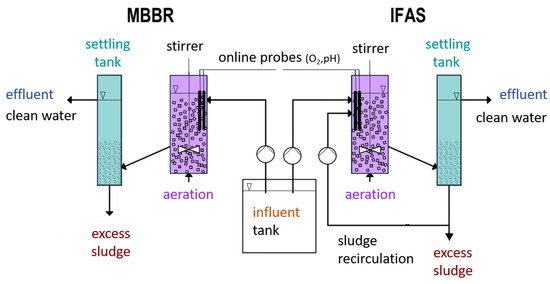
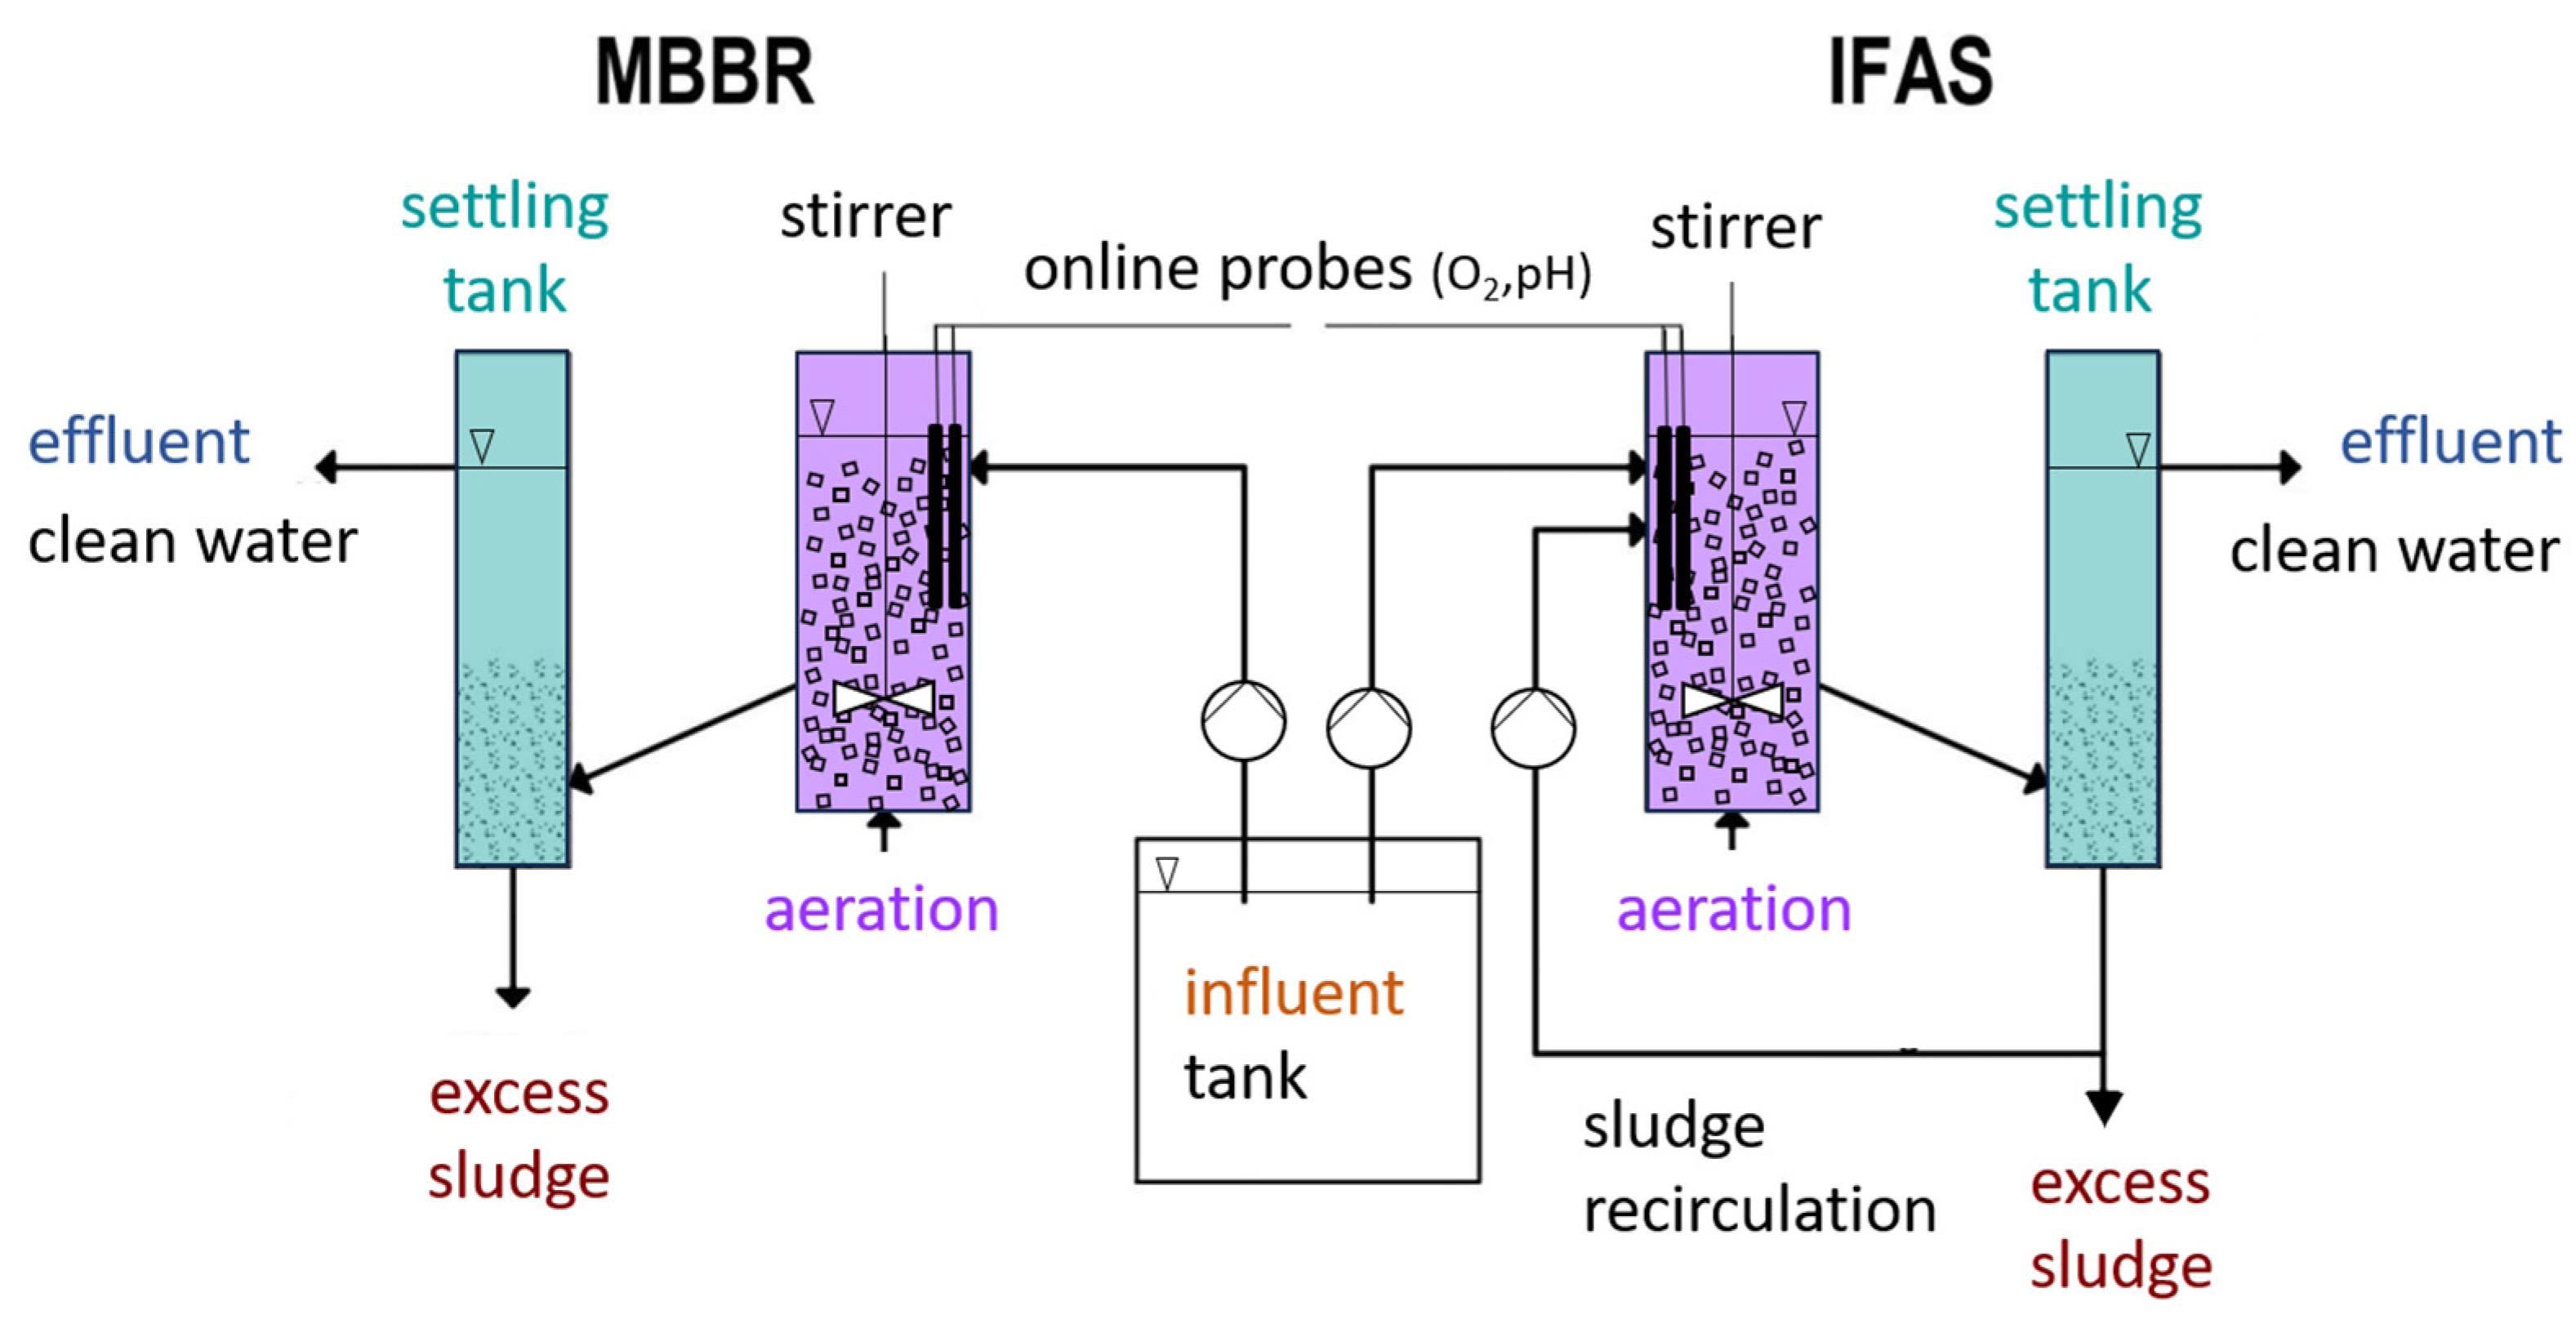
Two lab-scale set-ups (behrotest® KLD 4N, Behr Labor-Technik GmbH, Düsseldorf, Germany) were operated in parallel over 1000 days, one configured as MBBR, the other as an IFAS process (Figure 1). In each system, the influent wastewater was fed by a peristaltic pump in a cylindrical aerated tank (4 L) filled with cubic polyurethane foam carriers (Linpor®, Strabag SE, Wien, Austria): 40 pores per Inch, totally open porous, 20% volumetric filling degree. The Linpor® carriers had been pre-cultivated in a lab-scale deammonification MBBR treating the effluent of anaerobic sludge dewatering (SDE) of a real municipal WWTP and were transferred to the aerated tanks at experimental day 0. Depending on the experimental phase, the feeding strategy relied either on a set pH value in the aerated tank or on fixed time intervals. From the aerobic tank, the water flew over a connecting pipe into a cylindrical settler (2.5 L), where treated water and activated sludge flocs were separated. In the IFAS configuration, the settled sludge was pumped back to the aerated tank with a recycling ratio of about 200%. Sludge age ranged from 5 to 8 days and was adjusted by taking excess sludge out of the mixed tank reactor three to five times a week. In the MBBR configuration, excess sludge was disposed of regularly. SDE provided by a municipal wastewater treatment plant (190,000 PE) was used as influent, in some experimental phases diluted with tap water, in others mixed with real pre-settled municipal sewage. In this way, the N (sum of NH4-N, NO2-N, and NO3-N) and COD concentrations could be changed in the experimental phases. The composition of both the SDE and the mixture with municipal sewage is provided in Table 1. Influent concentrations of N and COD were quantified at least once per week. NH4-N, NO2-N, and NO3-N concentrations in the effluent were analyzed with a minimal sampling frequency of two days a week. COD, N, total suspended solids (TSS), and volatile suspended solids (VSS) were measured on a regular basis as well. The temperature in the tanks was not controlled and varied with room temperature between 21 and 27 °C (10% and 90% percentile). Temperature (WTW FDO® 925, Xylem Analytics Germany Sales GmbH & Co. KG, Weilheim, Germany), pH value (HI1230B, Hanna Instruments GmbH, Graz, Austria), and oxygen concentrations (WTW FDO® 925, Xylem Analytics Germany Sales GmbH & Co. KG, Weilheim, Germany) were measured online in each aerated tank. In addition to the regular analytical program, ex-situ activity tests for aerobic (AOB) and anaerobic (AnAOB) bacteria and FISH (fluorescence in situ hybridization, Nitri-VIT®, VIT® Anammox, vermicon AG, Hallbergmoos, Germany) measurements were conducted.
Figure 1.
The cylindrical aerated tank with stirrer, used as MBBR or IFAS reactor, had a volume of 4 L, the cylindrical settler 2.5 L. Tanks are made from glass, and peristaltic pumps for the influent, recirculation, and excess sludge were used. Online probes for oxygen and pH were integrated in a process control system.
Table 1.
Composition of influent wastewater within the experimental phases (mean values).
2.2. Experimental Phases, Feeding and Aeration Strategies
The experiment was conducted in three phases, A (marked red in tables and figures), B (marked yellow), and C (marked blue), each containing subphases (A1–A3, B1–B3, and C1–C3, see Table 2). Throughout the whole experiment, the reactors were operated without pause. Switching from one phase to the next one was achieved by adjusting the operational conditions as described in Table 2. Phase A investigated the influence of decreasing influent N concentration (from 590 to 100 mg NH4+ L−1) with the question at which N concentration from side-to-mainstream NOB activity will occur. Due to increased NOB activity in phase A3, in subphase B1, reactors were emptied, cleaned, and refilled with new carriers from the same lab-scale sidestream MBBR deammonification reactor on day 472 (MBBR) and 473 (IFAS), respectively. To remove NOB completely, suspended sludge was discharged, and reactors were filled with new influent wastewater. As a pH-based feeding strategy in Phase A (pH upper limit 7.5–7.7) led to some load reduction, starting with Phase B, a time-based feeding program was used to guarantee a constant influent load. An upper pH limit of 7.9 also stopped influent dosage during the time-based feeding strategy. Furthermore, decreased N/COD-ratios from 1.7 to 0.3 of the influent and the effect thereof on nitrogen removal and activity of bacteria groups was investigated in Phase B. In Phase C, influent N concentration was further decreased, and N/COD-ratio decreased to reach mainstream-like conditions.
Table 2.
Experimental phases and subphases.
In phases A and B1, the aeration strategy relied on time-based aeration and non-aeration periods with a maximum oxygen concentration in the aerated phase, where aeration was stopped. Starting with phase B2, we established a fixed non-aerated period of 15 min with an oxygen concentration below 0.3 mg O2 L−1. This supports AOB over NOB, as AOB resumes activity faster than NOB (shorter lag phase in the nitrogen metabolism) after an anoxic phase of at least 15 min [22]. In phases with sewage addition to the influent, the aerated phases were prolonged to cope with higher loadings of biodegradable COD.
2.3. Analytical Methods and Process Control
A HI1230B pH probe (Hanna Instruments GmbH, Graz, Austria) was used to measure pH. Oxygen concentration and temperature were measured by a WTW FDO® 925 probe (Xylem Analytics Germany Sales GmbH & Co. KG, Weilheim, Germany). At a filling ratio of 20%, the carriers floated freely in the reactor, and comparing measurements at different points in the reactor yielded constant oxygen concentrations throughout the reactor. All probes were integrated into a process control system (Siemens LOGO! Soft Comfort V8, Siemens Aktiengesellschaft, München, Germany), and values were stored in a 30 s interval in a database. The analytical methods for COD, N, TSS, VSS, NH4-N, NO2-N, and NO3-N are displayed in Appendix A Table A1.
2.4. Aerobic Activity Test
Ex-situ aerobic batch activity tests were performed in 300 mL cylindrical reactors in triplicate according to Svardal et al. (1997) [41]. 1 L suspension (without carriers) from MBBR and IFAS reactor was taken and shaken to enrich oxygen saturation. The cylindrical reactor was completely filled with the oxygen-saturated suspension and closed hermetically. Oxygen concentration was monitored by an online oxygen probe (WTW FDO® 925) while stirring. In phases with SDE only activity of AOB (AOBact) was estimated as oxygen consumption (mgO2(t) − mgO2(0)) per liter and hour (Equation (3)). This test was performed without carriers for the activity in the suspended biomass and with 27 cubic carriers for the activity with biomass on the carriers. ATH dosage to distinguish between AOB/NOB and HB was not possible, as carriers were given back into the reactors (MBBR and IFAS) after the experiment. Hence, in phases with NOB activity and in the ones with sewage dosage, these ex-situ activity tests only allow an estimation of overall aerobic activity.
AOBact = (mgO2/L(t) − mgO2/L(0))/(t − 0)
2.5. AnAOB Activity Test
Ex-situ AnAOB batch activity tests were conducted in 500 mL reactors in duplicates according to [42]. 1 L suspension of each the MBBR and IFAS reactor was taken, and 30 mg NO2-N was added before the suspension was filled into the small batch reactors. N2 was bubbled through the batch test reactors to guarantee an oxygen-free environment. While shaking at 160 U min−1, grab samples were taken every 15 min over a time span of one hour and analyzed for NH4+, NO3−, and NO2− as described above. These tests were carried out without carriers for activity measurement of suspended biomass and with 25 cubic carriers for activity measurement of biomass on carriers. AnAOB activity was calculated for NH4+ and NO2− separately according to Equations (4) and (5).
AnOBact,NH4 = (mgNH4+-N/L(t) − mgNH4+-N/L(0))/(t − 0)
AnOBact,NO2 = (mgNO2−-N/L(t) − mgNO2−-N/L(0))/(t − 0)
2.6. Calculations
NOB activity was estimated in-situ in each reactor as NO3-ratio of theoretically produced (via anammox in the deammonification process) to actually produced NO3− as given in Equation (6). As stoichiometric coefficients, the ones given above in Equation 2 are used [1]. If more NO3− is produced as AnAOB would stoichiometrically do while removing nitrogen, the ratio will be below 1. At a ratio below 0.5, more than half of the produced NO3− cannot be explained via nitrogen removal of anammox, and therefore it is assumed to be produced by NOB. In this study, NOB activity describes a NO3− ratio below 0.5, according to Wu et al. (2025) [6]. Values for Nin, Nout, NO3,in and NO3,out were measured in mg N L−1 and inserted in this calculation in mg N L−1. If the ratio is above 1, denitrification is present.
NO3-ratio = ((Nin − Nout)/(2 × 0.986) × 0.161)/(NO3−,out − NO3−,in)
Removal efficiency was calculated in two different ways. Nitrogen removal degree in percentage of influent nitrogen is calculated according to Equation (7) (Nrem,%). The difference between influent nitrogen (Nin) and effluent nitrogen concentration (Neff) is related to Nin. Equation (8) calculates the volume-specific nitrogen removal rate (Nrem in kg N m−3 d−1). Nitrogen influent and effluent concentrations (mg L−1) are multiplied by influent flowrate (Qin as L d−1) and divided by the reactor volume (Vreactor in L).
Nrem,% = (Nin − Neff)/Nin × 100
Nrem = (Nin − Neff) × Qin/(1000 × Vreactor)
FA and FNA concentrations were calculated according to Anthonisen et al. [43] as shown in Equations (9) and (10), respectively. T represents temperature in Kelvin.
NH3 = NH4+ × 10pH/(e(6344/T) + 10pH)
HNO2 = NO2−/(e(−2300/T) × 10pH)
2.7. FISH—Fluorescence In-Situ Hybridisation
FISH analysis was carried out in suspended sludge, on the carrier itself, including the biofilm attached to the carrier and in sludge washed out of the pores of the carrier (“carrier-sludge”). Measurements were carried out at least every 6 months with VIT® ANAMMOX test kits (Nitri-VIT®, VIT® Anammox (AMX SE2), vermicon AG, Hallbergmoos, Germany). The visual comparison of samples from the same day was carried out via fluorescence microscopy to identify where AOB, NOB, and AnAOB were located.
3. Results and Discussion
To assess whether deammonification can be implemented as an IFAS or MBBR process configuration in the mainstream treatment line of municipal WWTPs, investigations at lab-scale have been performed with real wastewater over an extended temporal scale of 1000 days. The experimental approach was to start at NH4+ concentrations typical for the sidestream and then reduce them stepwise to mainstream levels to determine the lowest concentration at which the deammonification process remains stable. The impact of reactor design (MBBR or IFAS) on NOB activity, nitrogen removal efficiency, and process stability was observed on a long-term basis.
3.1. Impact of Influent Composition
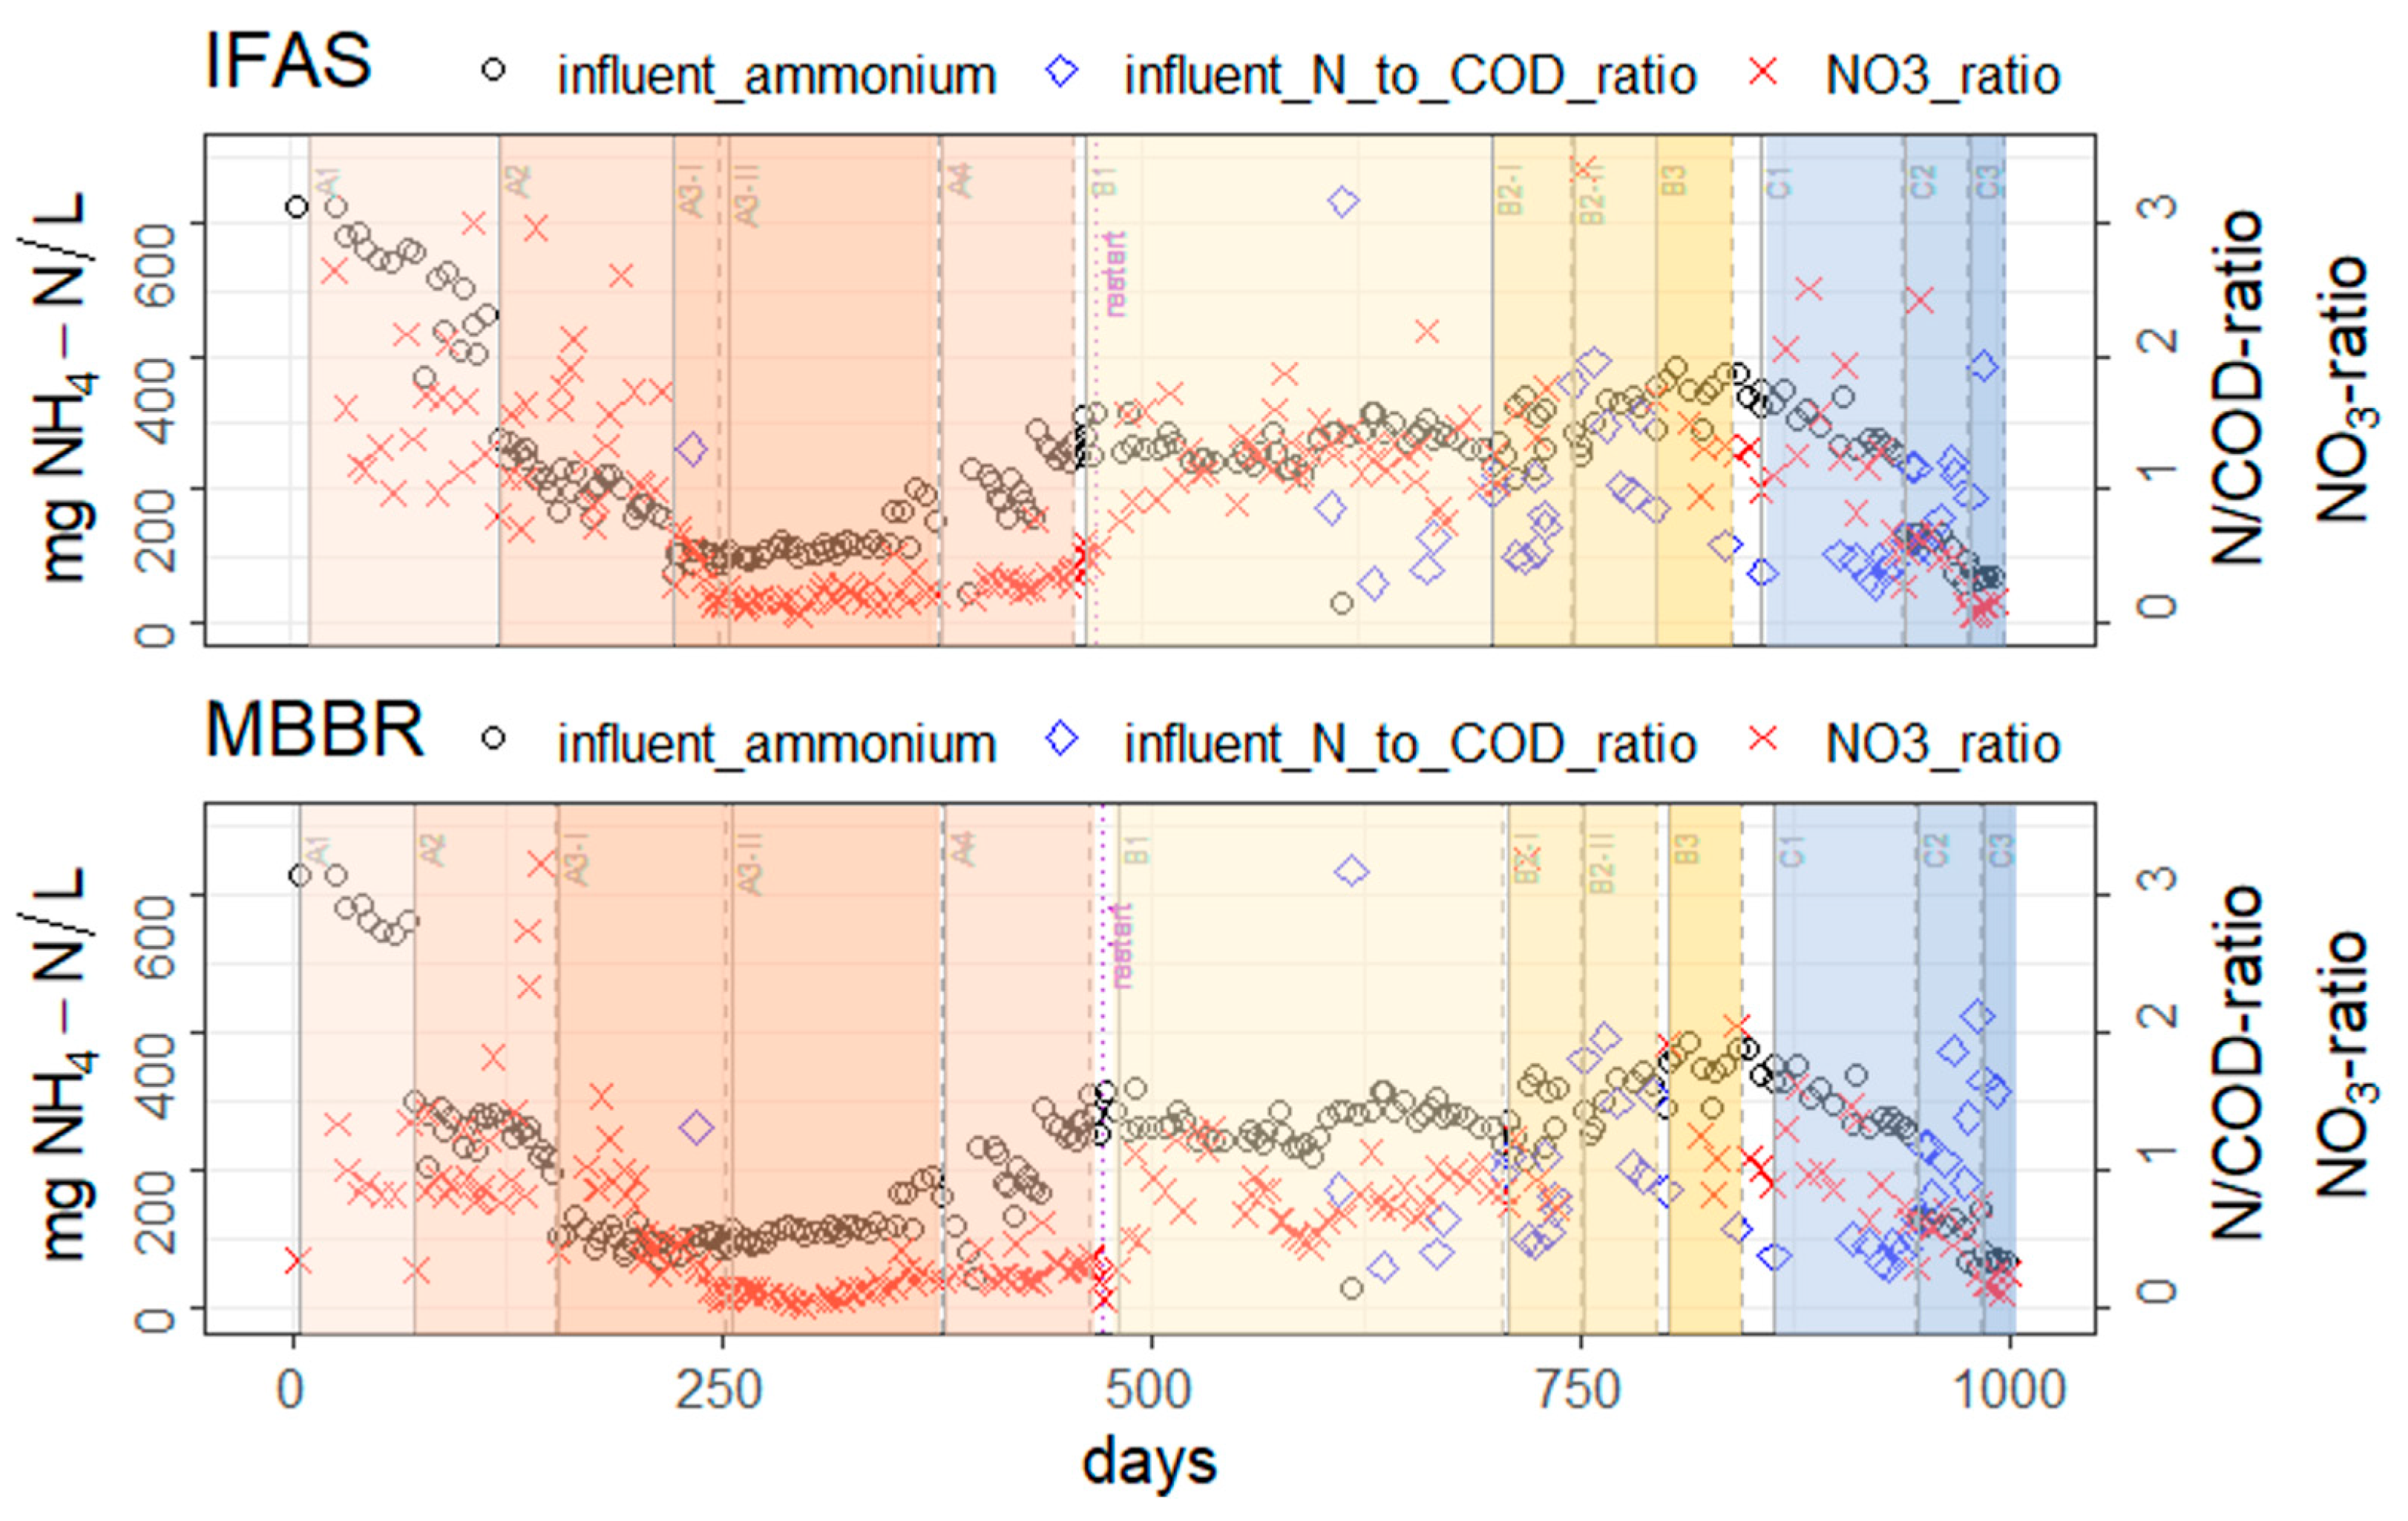
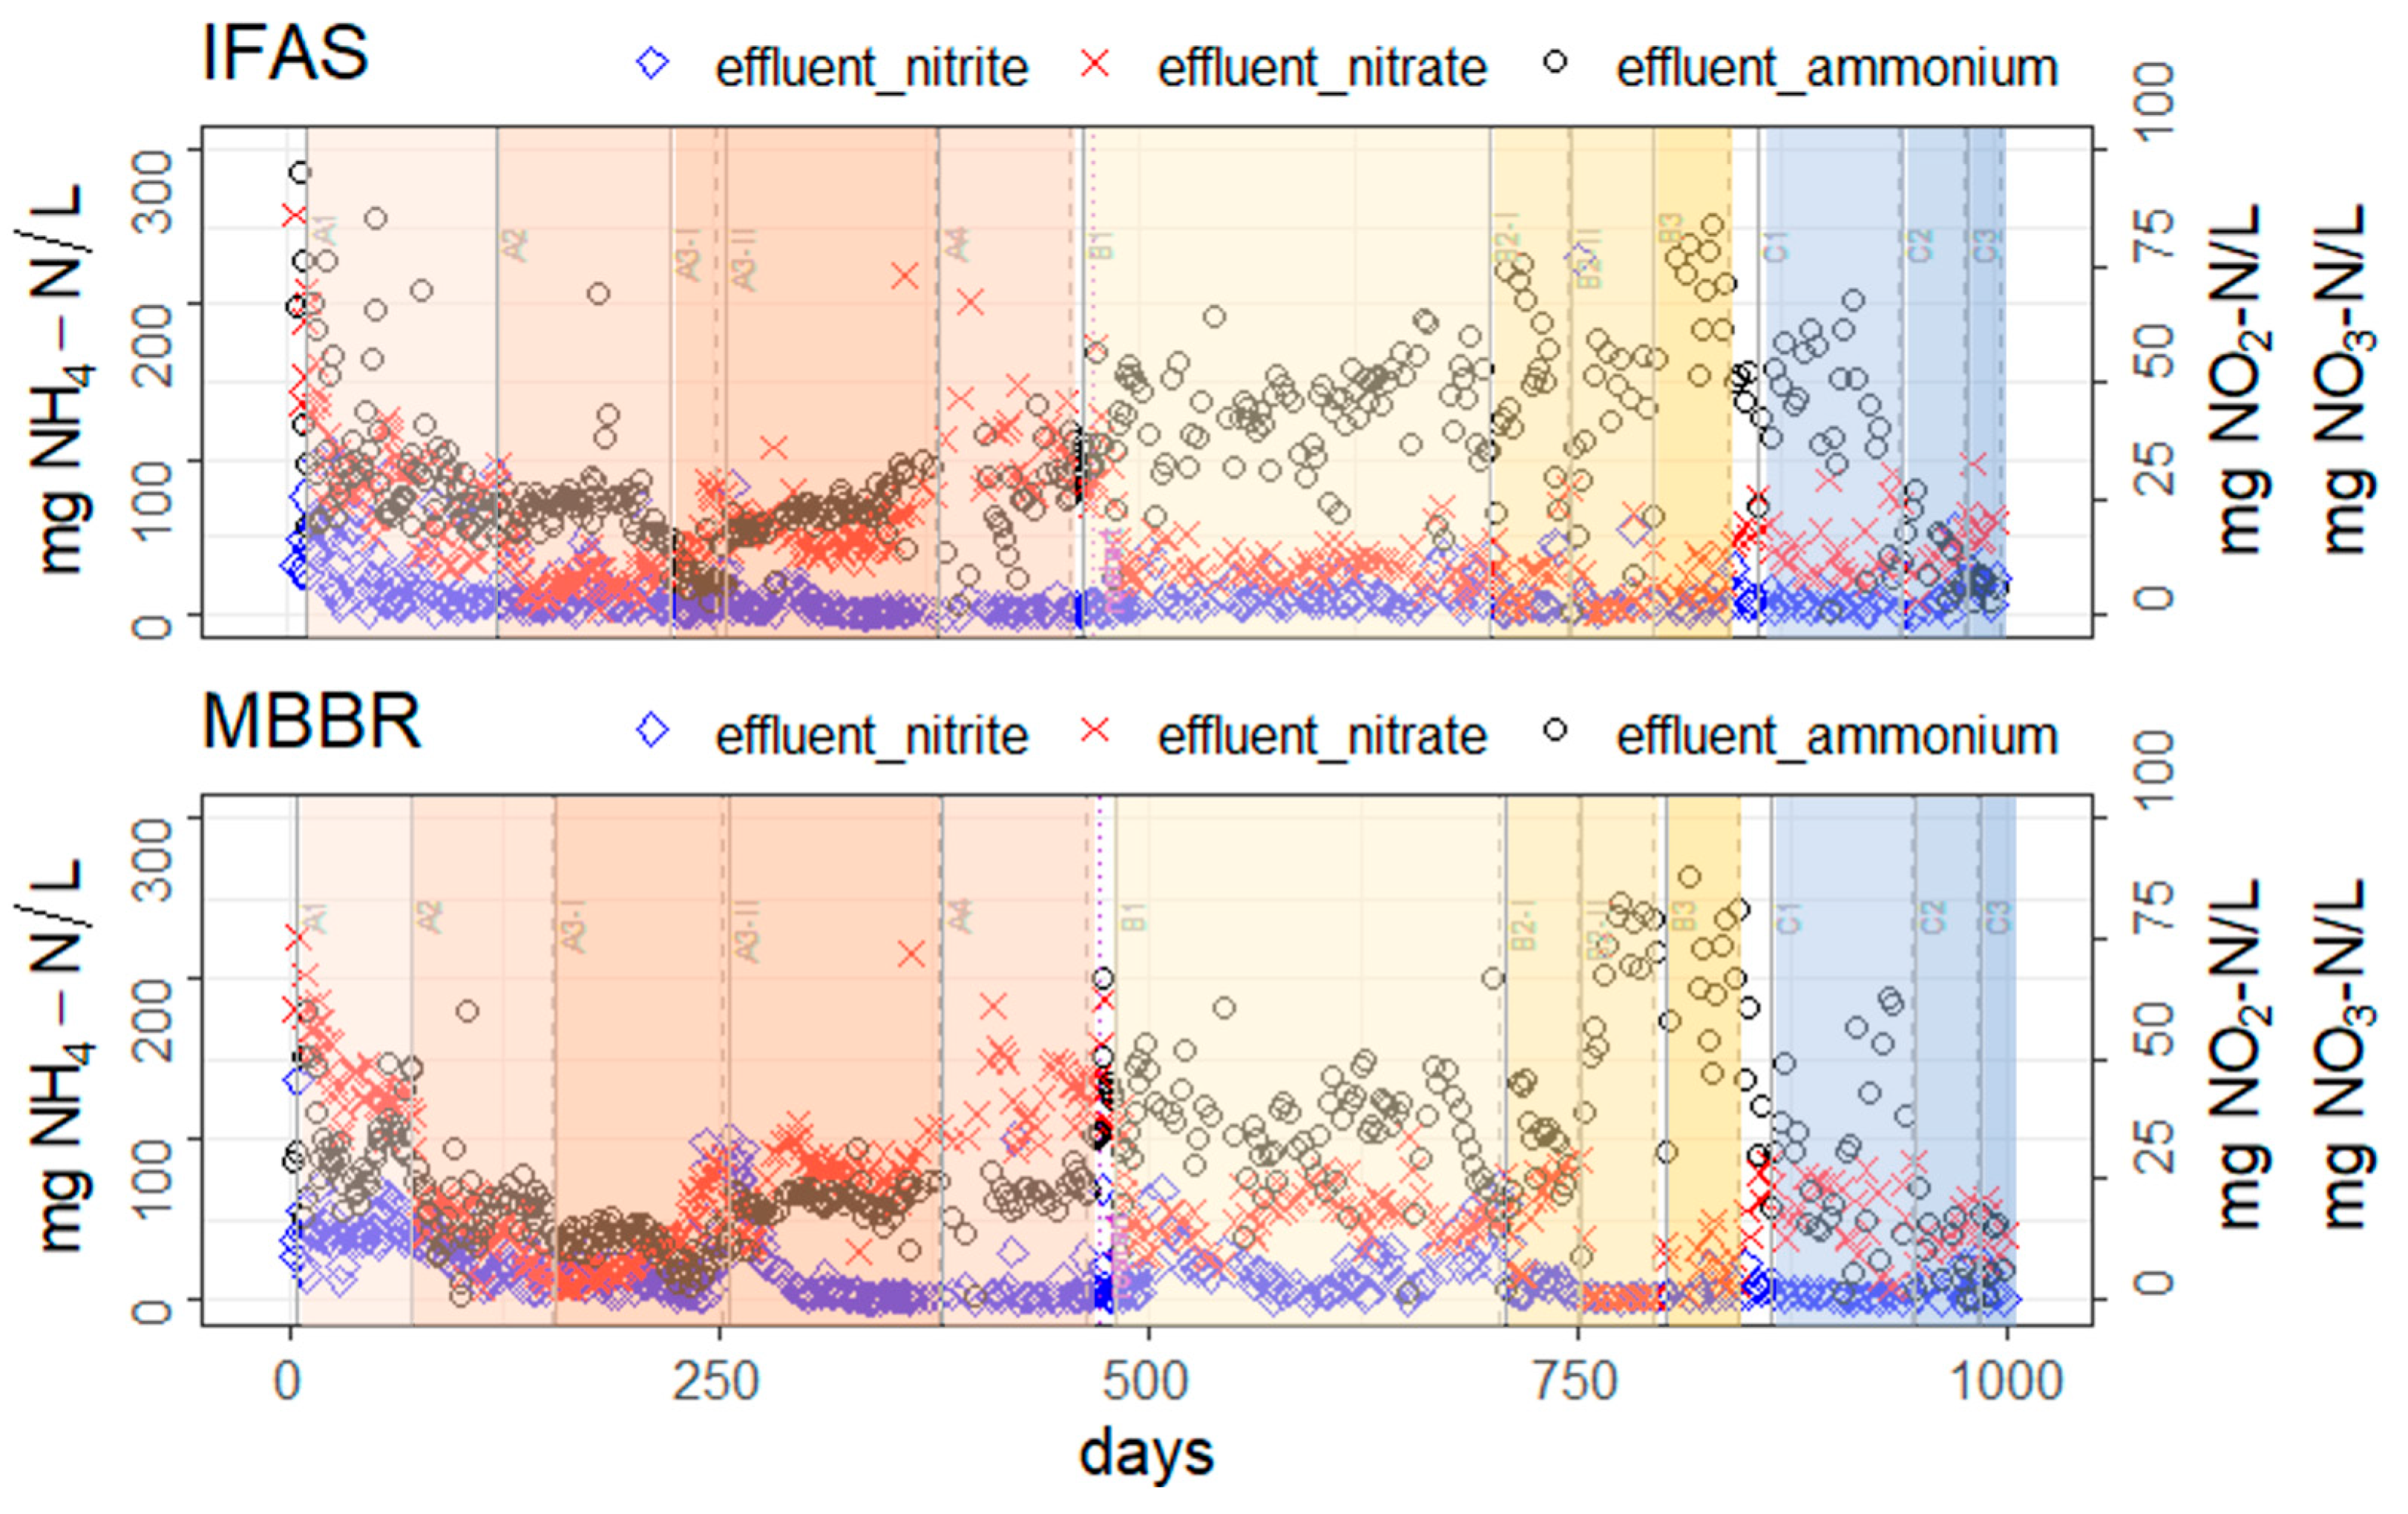
The experiment was structured into three distinct operation phases, A, B, and C, as outlined in Section 2. Measured influent concentrations are presented in Figure 2, while effluent concentrations are depicted in Figure 3 and Figure A1 (Appendix A).
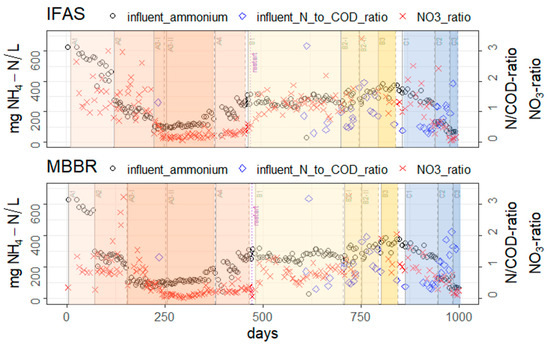
Figure 2.
Influent NH4+ concentration of MBBR and IFAS reactor, as well as N/COD ratio in influent and NO3-ratio in the reactors, is shown over 1000 days of operation. In subphases A1 to A3 (red), influent NH4+ concentration was varied by diluting SDE. In subphases B1 to B3 (yellow), different N/COD ratios in the influent have been applied by adding sewage to diluted SDE, and in phase C (blue), the influent with fixed SDE-to-sewage ratio was diluted stepwise to mainstream-like conditions.
Figure 3.
Effluent NH4+ concentration of MBBR and IFAS reactor, as well as pH in the reactors, is shown over 1000 days of operation. Mean values of each subphase are given in Table 3. Experimental phases are marked with colors: A (red), B (yellow), C (blue).
During the initial experimental phase (Phase A), diluted SDE sourced from a full-scale WWTP was used as influent. Influent NH4+ concentrations were stepwise reduced from side-stream to main-stream conditions (Figure 2). The influent load was controlled in phase A by setting upper limits for the pH value in the reactors, leading in phase A1 to average values of 7.6 and 7.7 in IFAS and MBBR respectively. The highest dilution step in phase A yielded reactor concentrations around 30 mg NH4-N L−1 with average oxygen concentrations of 2.3 ± 1 mg O2 L−1 in the aerated phases (subphase A3-I, Table 3). Subsequent reduction of the upper pH limit resulted in lower loading, which led to lower reactor concentrations (26 ± 11 mg NH4-N L−1 in the IFAS reactor and 33 ± 10 mg NH4-N L−1 in the MBBR). Due to the low NH4+ concentration, NOB activity increased in subphase A3. As a result, N removal rates decreased from above 75% in subphase A1 to about 30% in subphase A3.
Table 3.
Average values for pH, nitrogen removal rate, influent and effluent concentrations of subphases.
The pH-values within both reactors ranged from 7.4 to 7.7, aligning with the typical operational range of AnAOB (6.8 to 8.3) and AOB (e.g., for nitrosomona eutropha and nitrosomona europaea species 7.4 to 7.8) [44,45,46]. Alkalinity, biological activity, and the concentrations of NH4+ and NO2− ions in SDE determine the pH value in the reactor. At higher pH-values, the dissociation equilibrium shifts from NH4+ to FA and H+, potentially increasing inhibition by FA, especially on NOB. According to literature, the inhibiting threshold for FA on AOB is higher (nitrosomonas: 10 to 150 mg FA L−1) compared to NOB (nitrobacter: 0.1 to 1.0 mg FA L−1) [43], and AOB recover faster than NOB from high FA concentrations [21]. In subphase A3-I, it is argued that the lower FA concentrations of 0.4 ± 0.3 mg L−1 (IFAS) and 0.6 ± 0.3 mg L−1 (MBBR) allowed for increasing NOB activity with NO3-ratio below 0.5 (Figure 2). In subphase A3-II, an elevated upper pH limit resulted in slightly higher pH values and elevated FA concentrations of 1.2 ± 0.4 mg L−1 (IFAS) and 1.0 ± 0.5 mg L−1 (MBBR). This adjustment failed in decreasing NOB activity as NO3-ratio stayed below 0.5 during the whole subphase A3-II. It is plausible that the seed sludge had acclimated to higher FA concentration, given its origin from a lab-scale sidestream deammonification reactor with mean FA concentration of 1.7 mg L−1. Continued NOB activity points to an adaptation of NOB to the existing FA concentration, as also found in An et al. (2021) [47]. Continuous exposure to FA in An et al. (2021) [47] led to activity loss of NOB of less than 25%, even at concentrations of 11 mg FA L−1. In addition, NOB could have enlarged their population in phase A3-I and thus have a similar activity in phase A3-II, even if partly inhibited.
If not inhibited by FA, NOB could also be inhibited by FNA. FA and FNA are both substances that are present in the system without external chemical dosage. The concentration of FNA rises at decreasing pH values. Notably, at pH-values below 6.5 and NO2− concentrations below 100 mgN L−1, both NO2− and FNA exist, which exhibit inhibitory effects on both AOB and NOB [43]. In subphase A3, despite maintaining a pH above 7 and achieving a concentration of at least 1.2 NO2-N mg L−1, the levels of FNA remain below 0.01 mg L−1. Given that a complete inhibition via FNA requires concentrations above 0.02 mg FNA L−1 [19,43,48], the FNA concentration within the reactors was insufficient to induce inhibitory effects.
Notably, in phase A3-I with the lowest NH4+ reactor concentration (26 ± 11 mg NH4+ L−1 in IFAS and 33 ± 10 mg NH4+ L−1 in MBBR), the time until NOB activity (NO3-ratio below 0.5) occurred was longer in MBBR (97 days) than in IFAS (27 days). This might be due to enhanced washout effects in MBBR compared to IFAS. The hydraulic retention time of MBBR in A3-I was lower, with 1.2 days, compared to the IFAS reactor sludge age of 6 days. In subphase C1, hydraulic retention time in MBBR was higher, with 3.7 days (IFAS stayed in the same range as in A3-I with 5.6 days). With similar suspended biomass retention in C1, no difference in NOB activity uptake depending on sludge age was observed.
In phase A4, FA inhibition of NOB was increased by using similar nitrogen influent concentration as in subphase A2, where no NOB activity was observed (refer to Figure 2 and Table 3). However, despite these efforts, NOB remained active. This supports the hypothesis that NOB adapted to the present FA concentration and remained active as described above. This led to a restart of the MBBR and IFAS reactors with new seed sludge and higher influent NH4+ concentrations at the onset of subphase B1 (IFAS: day 473, MBBR: day 472). FA levels ranged from 1–7 mg L−1 in phases B1 to C1.
In subphase B2, municipal sewage was added to the influent to investigate the impact of biodegradable COD on the nitrogen removal efficiency (COD in SDE is predominantly refractory). Higher COD levels could lead to enhanced oxygen uptake by heterotrophs, resulting in lower oxygen concentration in the sludge flocks and biofilm. Lowered oxygen concentration could help improve NOB activity control. At the same time, heterotrophs could compete with AnAOB for the available NO2−. To guarantee NO2− production, the aerated time was prolonged in phase B2. Mean oxygen concentration stayed below 1 mg L−1. Lowered N/COD ratio had neither an effect on nitrogen removal rate nor NOB activity. In IFAS subphase B2, the NO3-ratio is above 1, indicating that denitrification also took place. In MBBR, the NO3-ratio is below 1 and therefore does not show signs of denitrification. This is in line with the higher sludge age of 5–8 days in IFAS compared to MBBR with a hydraulic retention time of about 2.5 days, which might be too short to build up a stable heterotrophic bacteria community for denitrification, if not attached to the biofilm carrier. When sewage addition was stopped in phase B3, this did not impact nitrogen removal rate or NO3-ratio significantly. In our experiments, variation of N/COD ratio in the range applied had no significant effects on nitrogen removal rate, as also seen in long-term (120 d) experiments with granules by Le et al. (2019) [49].
In phase C, sewage addition was started again, and influent concentrations were lowered in each subphase. The N/COD ratio subsequently decreased from subphase C1 (2.6) and C2 (1.2 ± 0.5 IFAS reactor and 0.9 ± 0.3 MBBR) to C3 (0.5 ± 0.4 IFAS reactor and 0.4 ± 0.2 MBBR). Towards the latter days of phase C2, NOB activity was observed and persisted throughout subphase C3. The stepwise dilution of influent concentrations resulted in lower FA concentrations of 0.4 mg L−1 (IFAS) and 0.5 mg L−1 (MBBR) and potentially allowed higher NOB activity starting in phase C2 (day 974—IFAS reactor and day 975—MBBR). FA concentrations in phase C2 are similar to those measured in phase A3-I, where the first NOB activity occurred. Nitrogen removal degree decreased from C1 and C2 for IFAS from 57 ± 17% to 34 ± 12% and for MBBR from 69 ± 16% to 38 ± 20%. In subphase C3, nitrogen removal rate declined below 0.06 kg N m−3 d−1 in activated suspended sludge reactor with nitrification/denitrification [50] in both reactors. This could be attributed to a combination of NOB activity and lower N/COD-ratio, leading to intensified competition between AnAOB, NOB, and heterotrophic bacteria on NO2−. An increased NOB activity was observed also by higher NO3-N concentration in IFAS reactor (C1: 14 ± 7 mg L−1, C2: 13 ± 5 mg L−1 to C3: 21 ± 5 mg L−1). Also, increased NO2-N concentrations were observed, which could be attributed to decreased AnAOB activity, while heterotrophic bacteria also did not completely reduce available NO2−. Increased NO3− and NO2− concentrations coupled with decreased NH4+ concentrations resulted also in a lower pH value. These effects could be seen in IFAS more distinctly than in MBBR. In MBBR, a lower removal rate might be an effect of lower retention time compared to IFAS sludge age (9–8 days in C2-C3). In MBBR, hydraulic retention time is even more reduced in subphase C2 (0.7 days) and C3 (0.5 days) due to elevated flow to maintain similar influent loading rate (kg N m−3 d−1) at lower nitrogen concentration. Lower retention time facilitates biomass washout and thus can support activity loss.
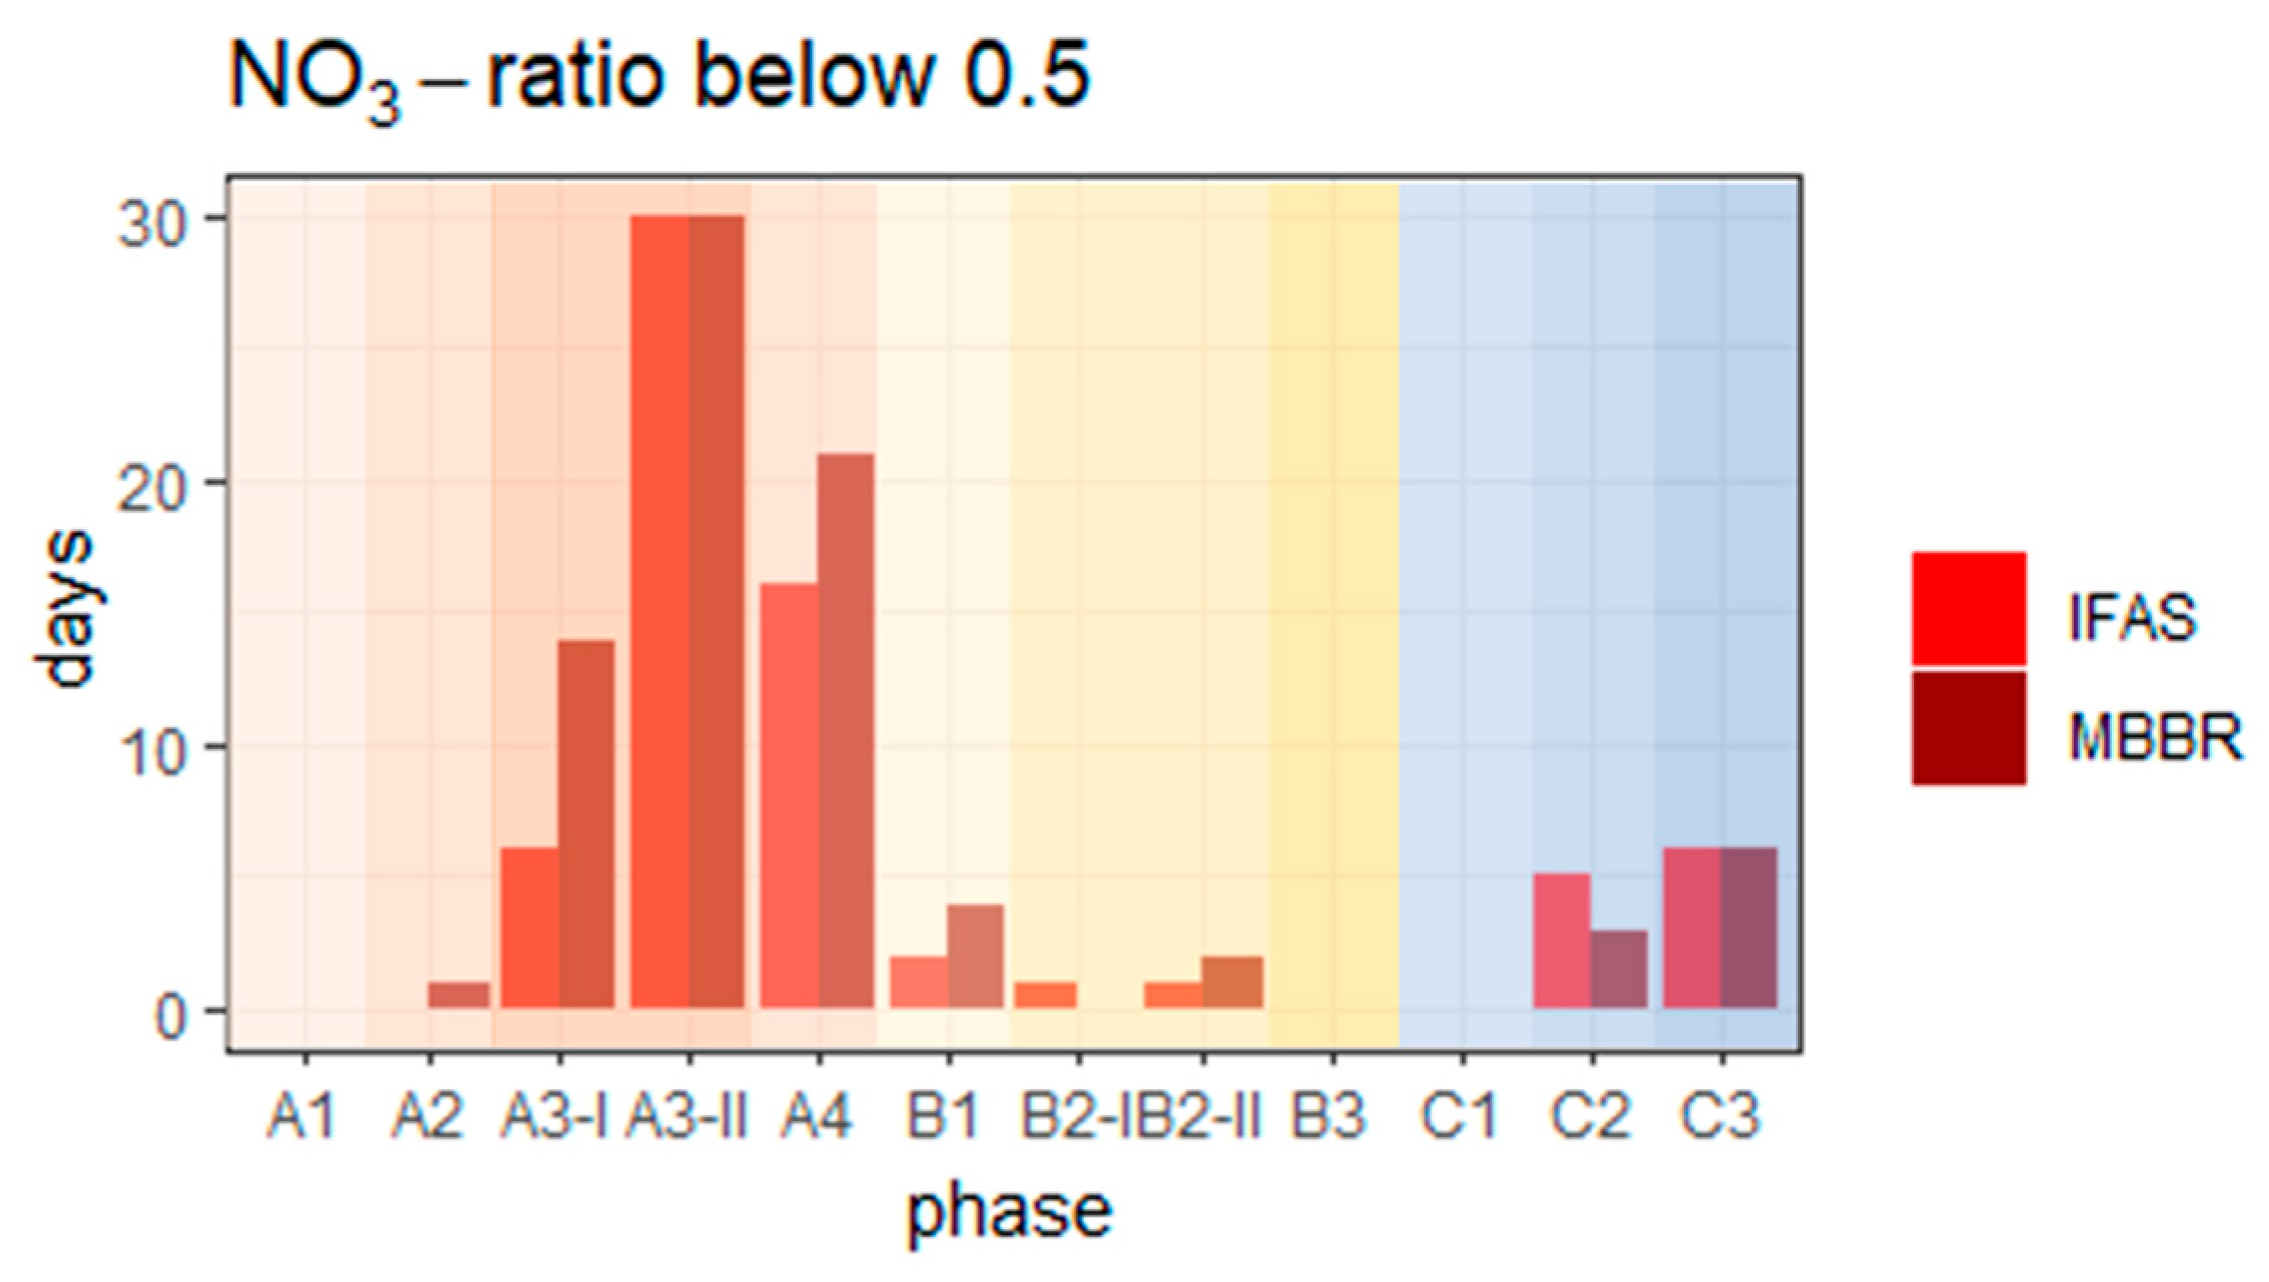
In the IFAS reactor, a NO3-ratio below 0.5 was observed on some days (72 compared to 89). Consequently, the IFAS process is considered more stable in terms of NOB activity. Given that NOB typically exhibit higher nitrogen turnover rates compared to AOB at 15 °C, NOB can theoretically exhaust all NO2− produced by AOB if NOBs are present in the biofilm, thus limiting the availability of this substrate for AnAOB [17].
In this study, temperatures within the reactors were not controlled and ranged from 21 to 27 °C (10% and 90% percentile). AOB growth rate is higher than NOB growth rate above 20 °C, whereas between 10 and 20 °C, NOB growth rate exceeds AOB growth rate [51,52], thus making it more difficult to control NOB activity below 20 °C. The optimal temperature range for AnAOB, with 30–37 °C [11], is even higher than that for AOB. In the present study, the temperature remained above 15 °C. Below 15 °C, AnAOB activity drops more than for AOB, thus making it more difficult to balance AnAOB and AOB activity [33]. Established relative activity of AOB, NOB, and AnAOB in this study should be stable given the small and relatively high temperature range (21–27 °C).
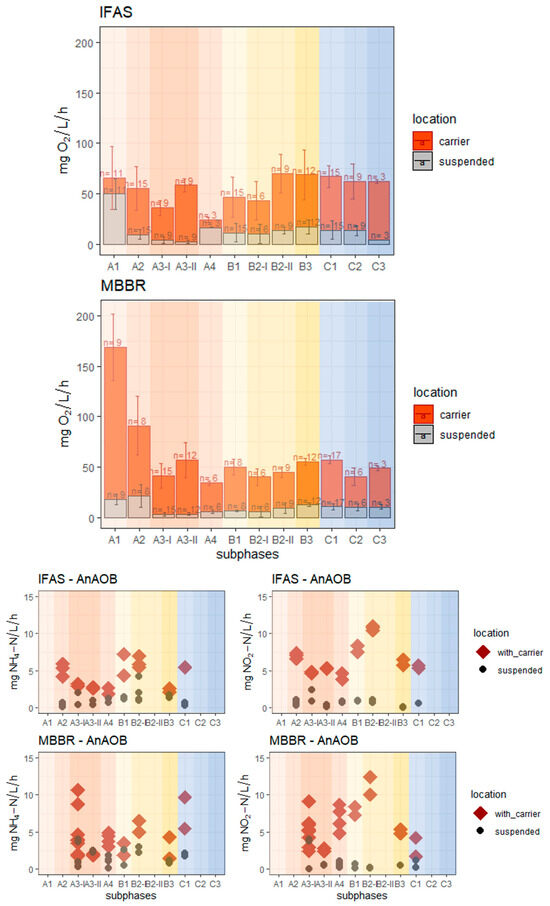
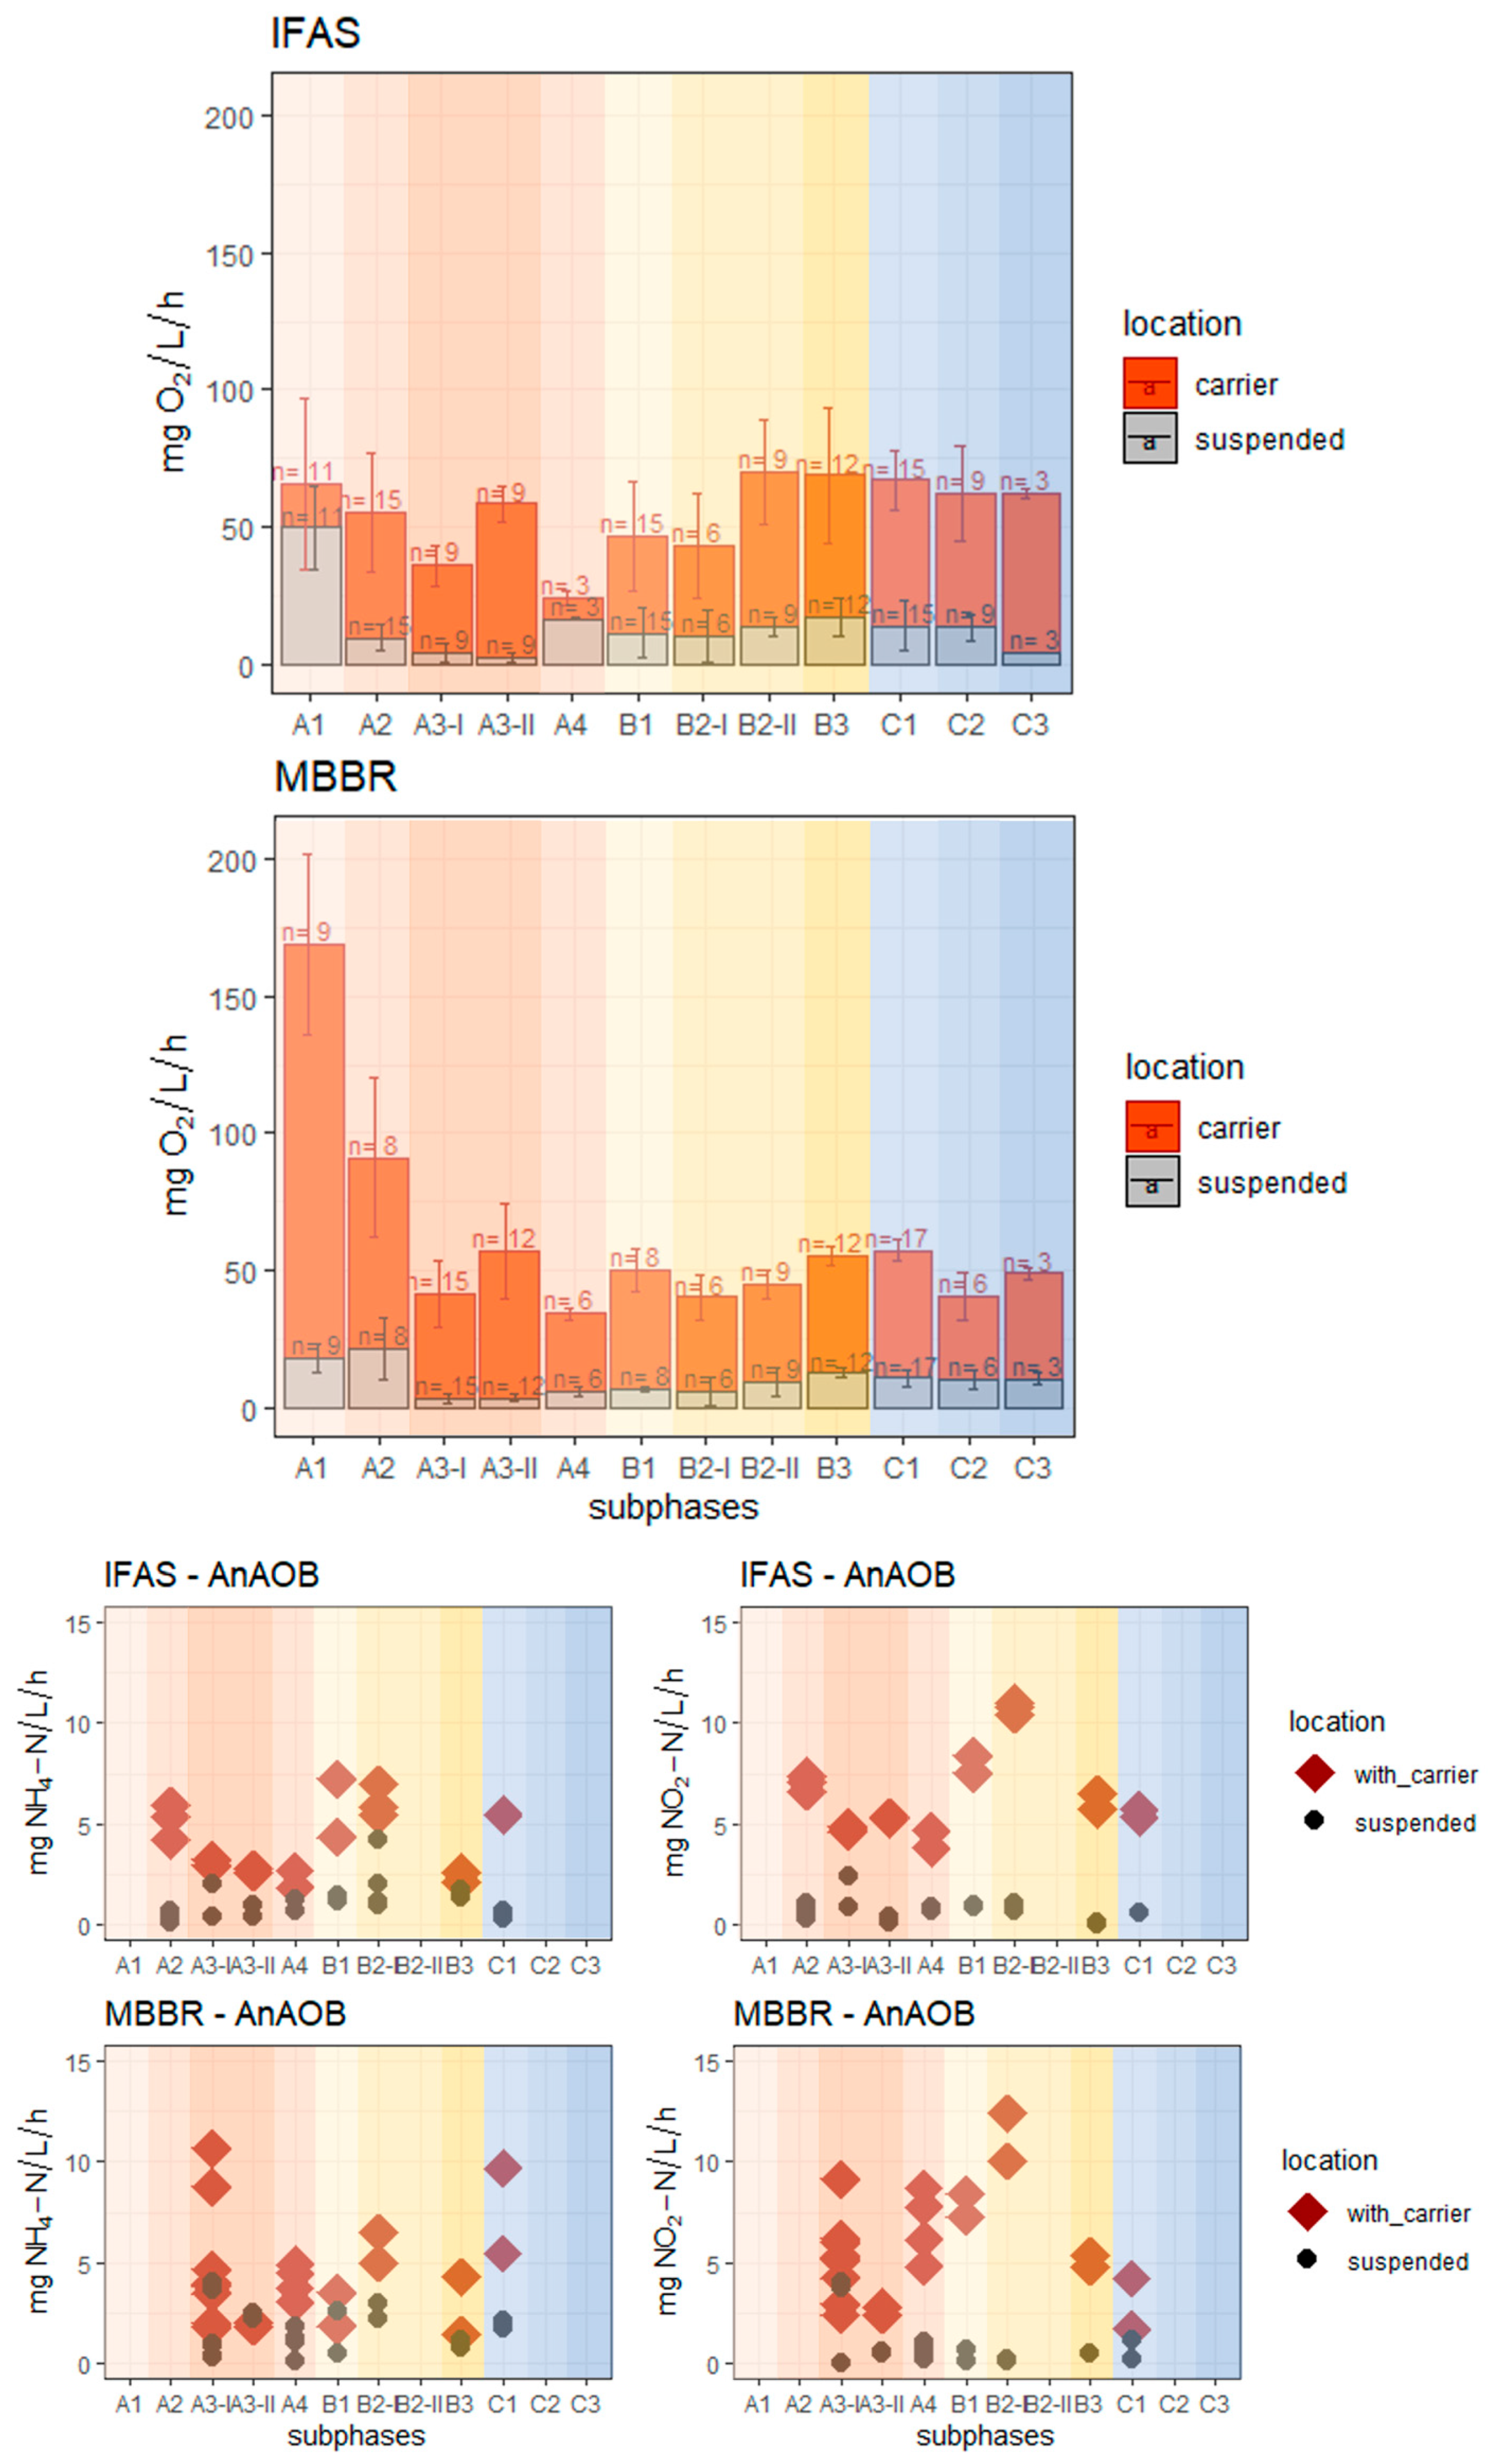
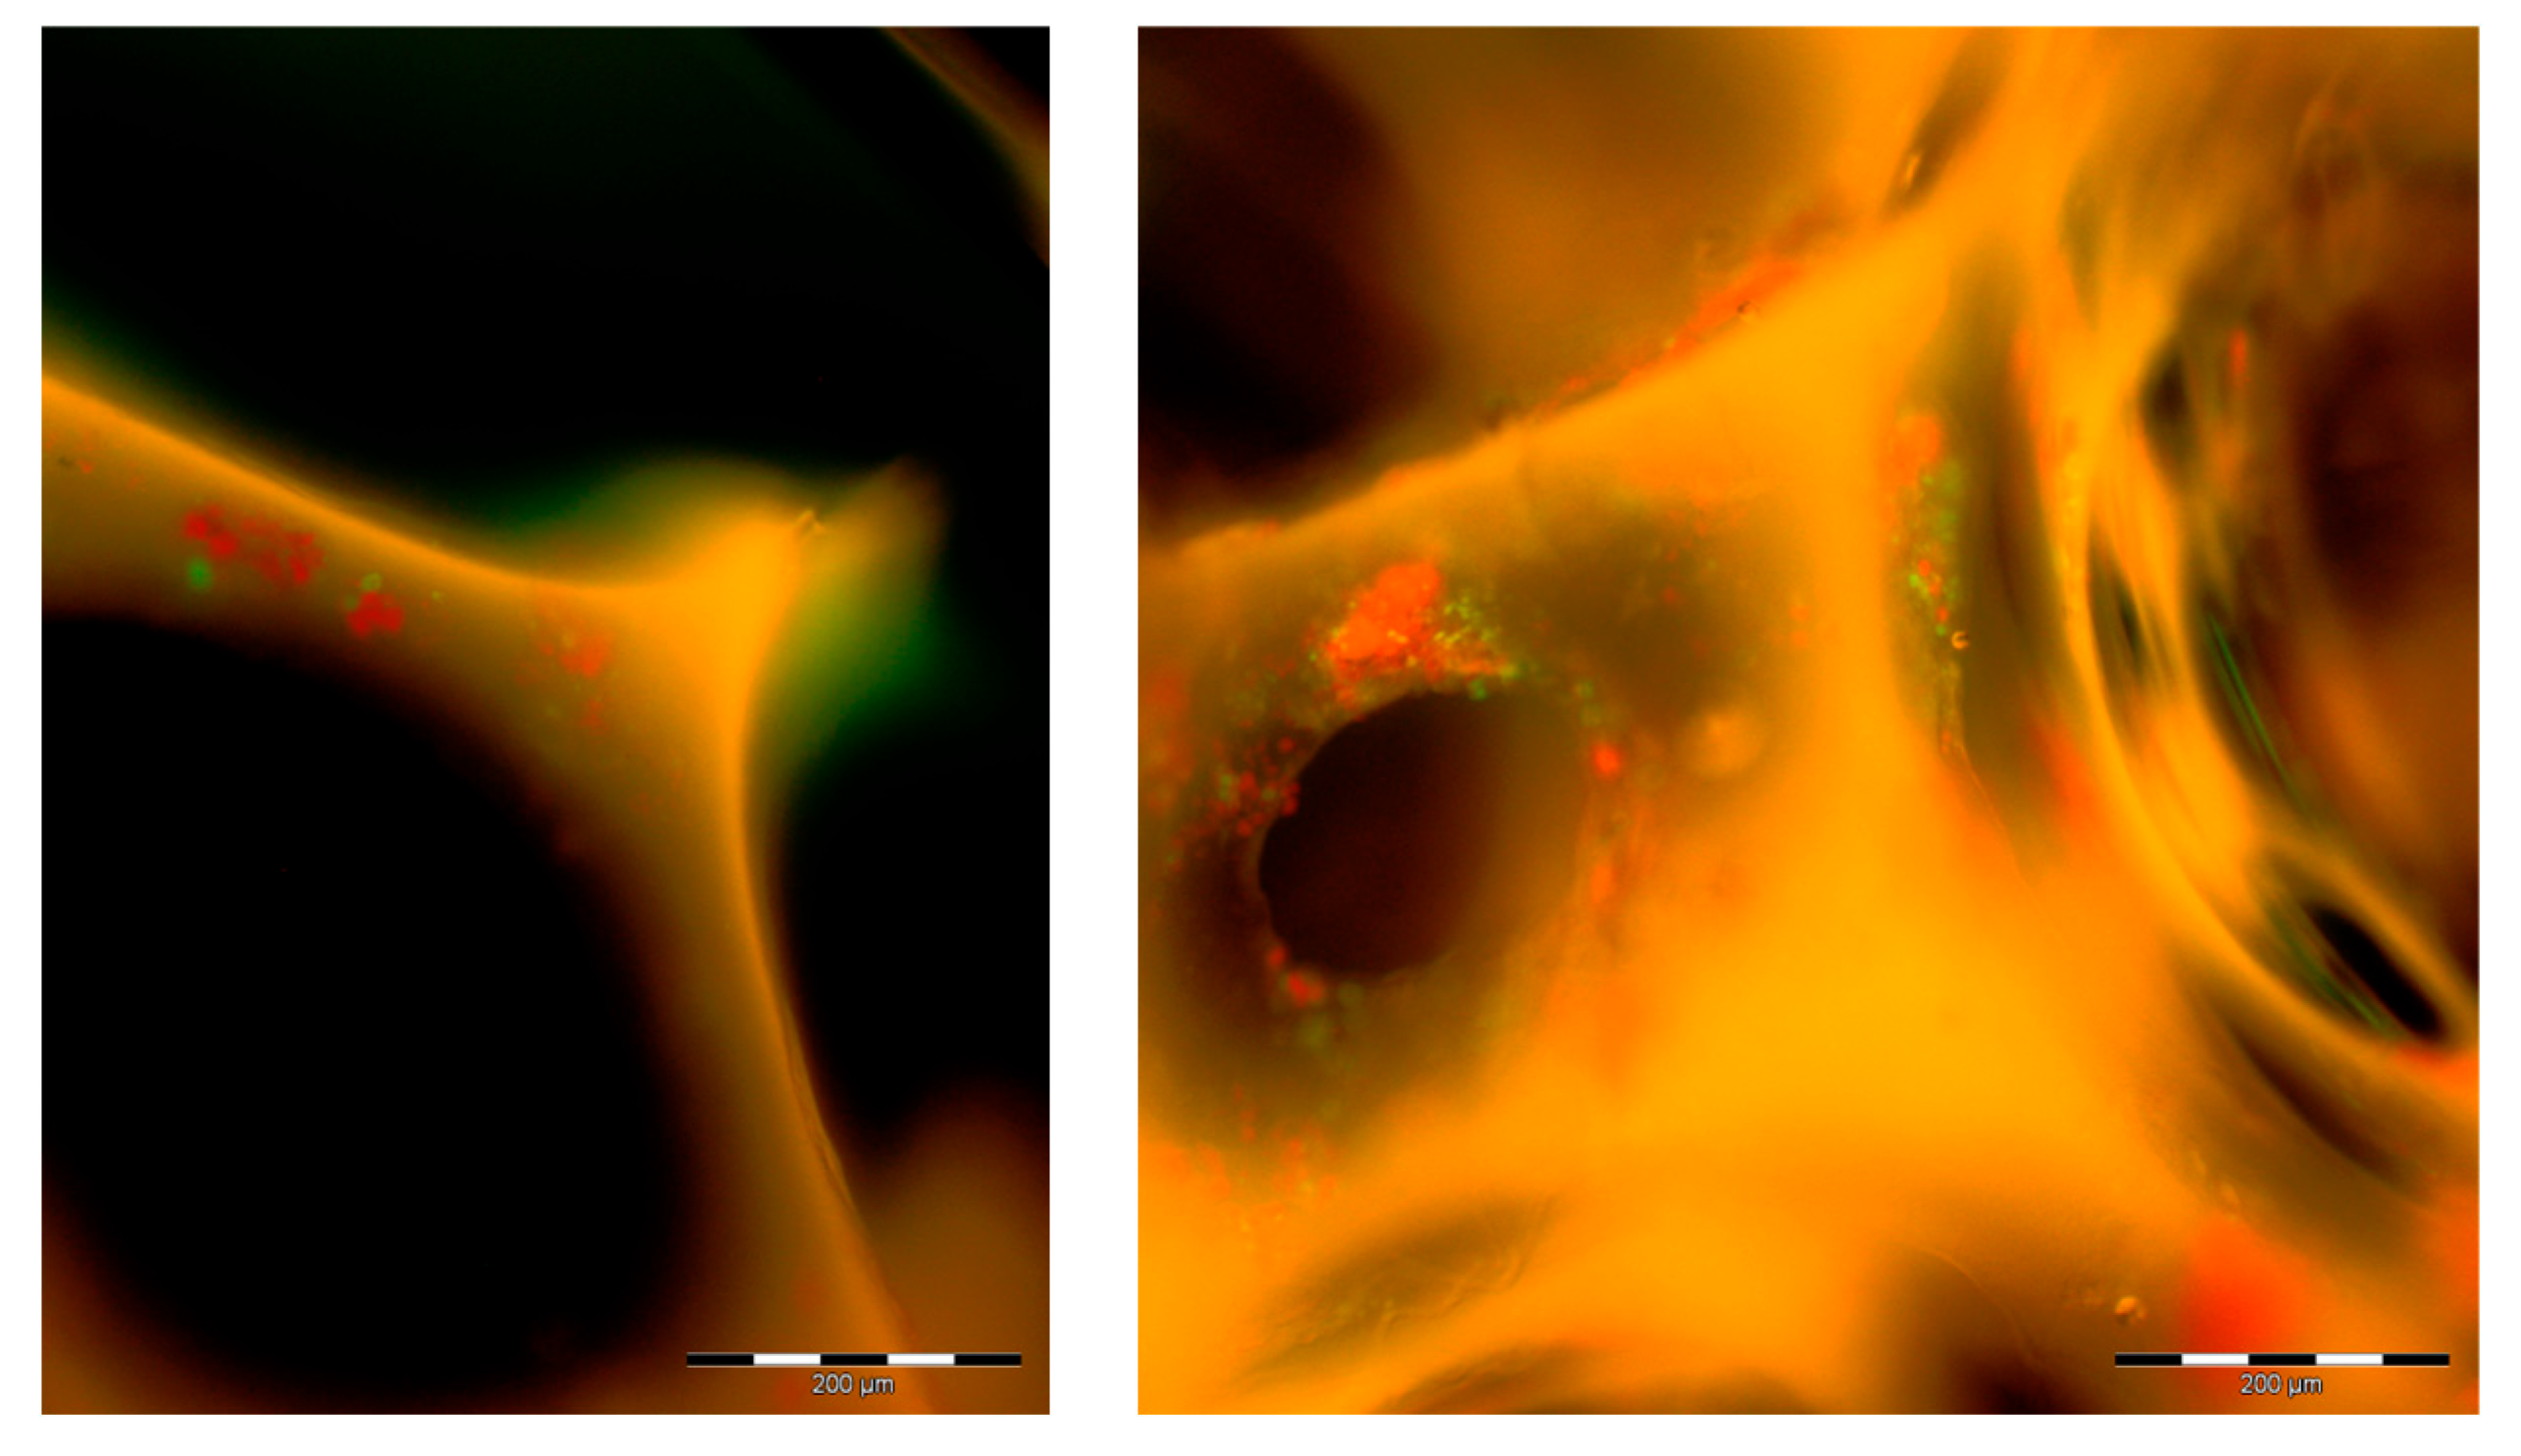
Aerobic bacteria activity and AnAOB activity were measured in each subphase (Figure 4). Aerobic respiration tests included AOB, NOB, and HB. In phases with low NOB and HB activity (e.g., at high NH4+ concentrations and no addition of municipal wastewater), respiration can be mainly attributed to AOB activity. In most subphases, aerobic activity was notably higher in tests involving carriers compared to those without carriers (mean: 600%). However, exceptions were noted in subphases A1 and A4 in the IFAS reactor. In subphase A4, aeration was reduced to favor AOB over NOB, resulting in a decrease in aerobic activity, particularly on the carriers where oxygen diffusion might be limited due to lower oxygen concentration. AnAOB activity on the carriers exceeded AnAOB activity in suspended biomass in all measurements (average MBBR: 2.6 mg NH4-N L−1 h−1, average IFAS: 2.9 mg NH4-N L−1 h−1). Both active aerobic bacteria and AnAOB were primarily situated on the carrier material, as evidenced by the enhanced activity observed in measurements involving carriers compared to suspended biomass only. Furthermore, the presence of AnAOB on the carrier material was confirmed through FISH measurements (see Figure 5). Microscopic examination consistently revealed a mixture of AOB and AnAOB within the biofilm, whereas NOB visibility coincides with NOB activity (both in bulk and biofilm). Notably, free suspended biomass contained a greater proportion of AOBs compared to AnAOBs, which aligns with expectations considering the higher oxygen concentration typically found in suspended biomass compared to the biofilm.
Figure 4.
Activity measurements in MBBR and IFAS reactor in suspended biomass and with carrier (filling ratio of 20%) in ex-situ batch tests. Experimental phases are marked with colors: A (red), B (yellow), C (blue).
Figure 5.
FISH labeled bacteria AnAOB in red and AOB in green on cubic carrier in orange ((left) IFAS reactor, (right) MBBR).
3.2. Nitrogen Removal Efficiency
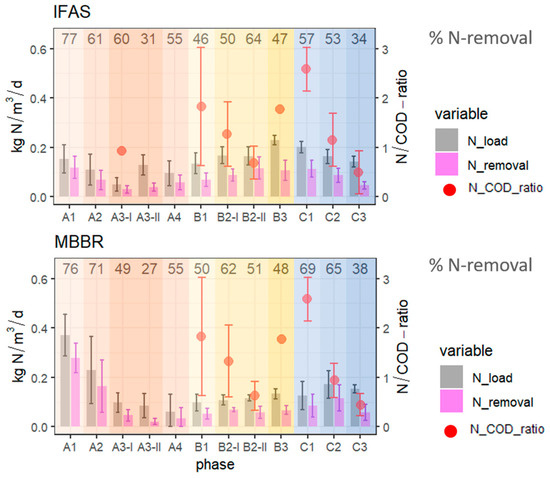
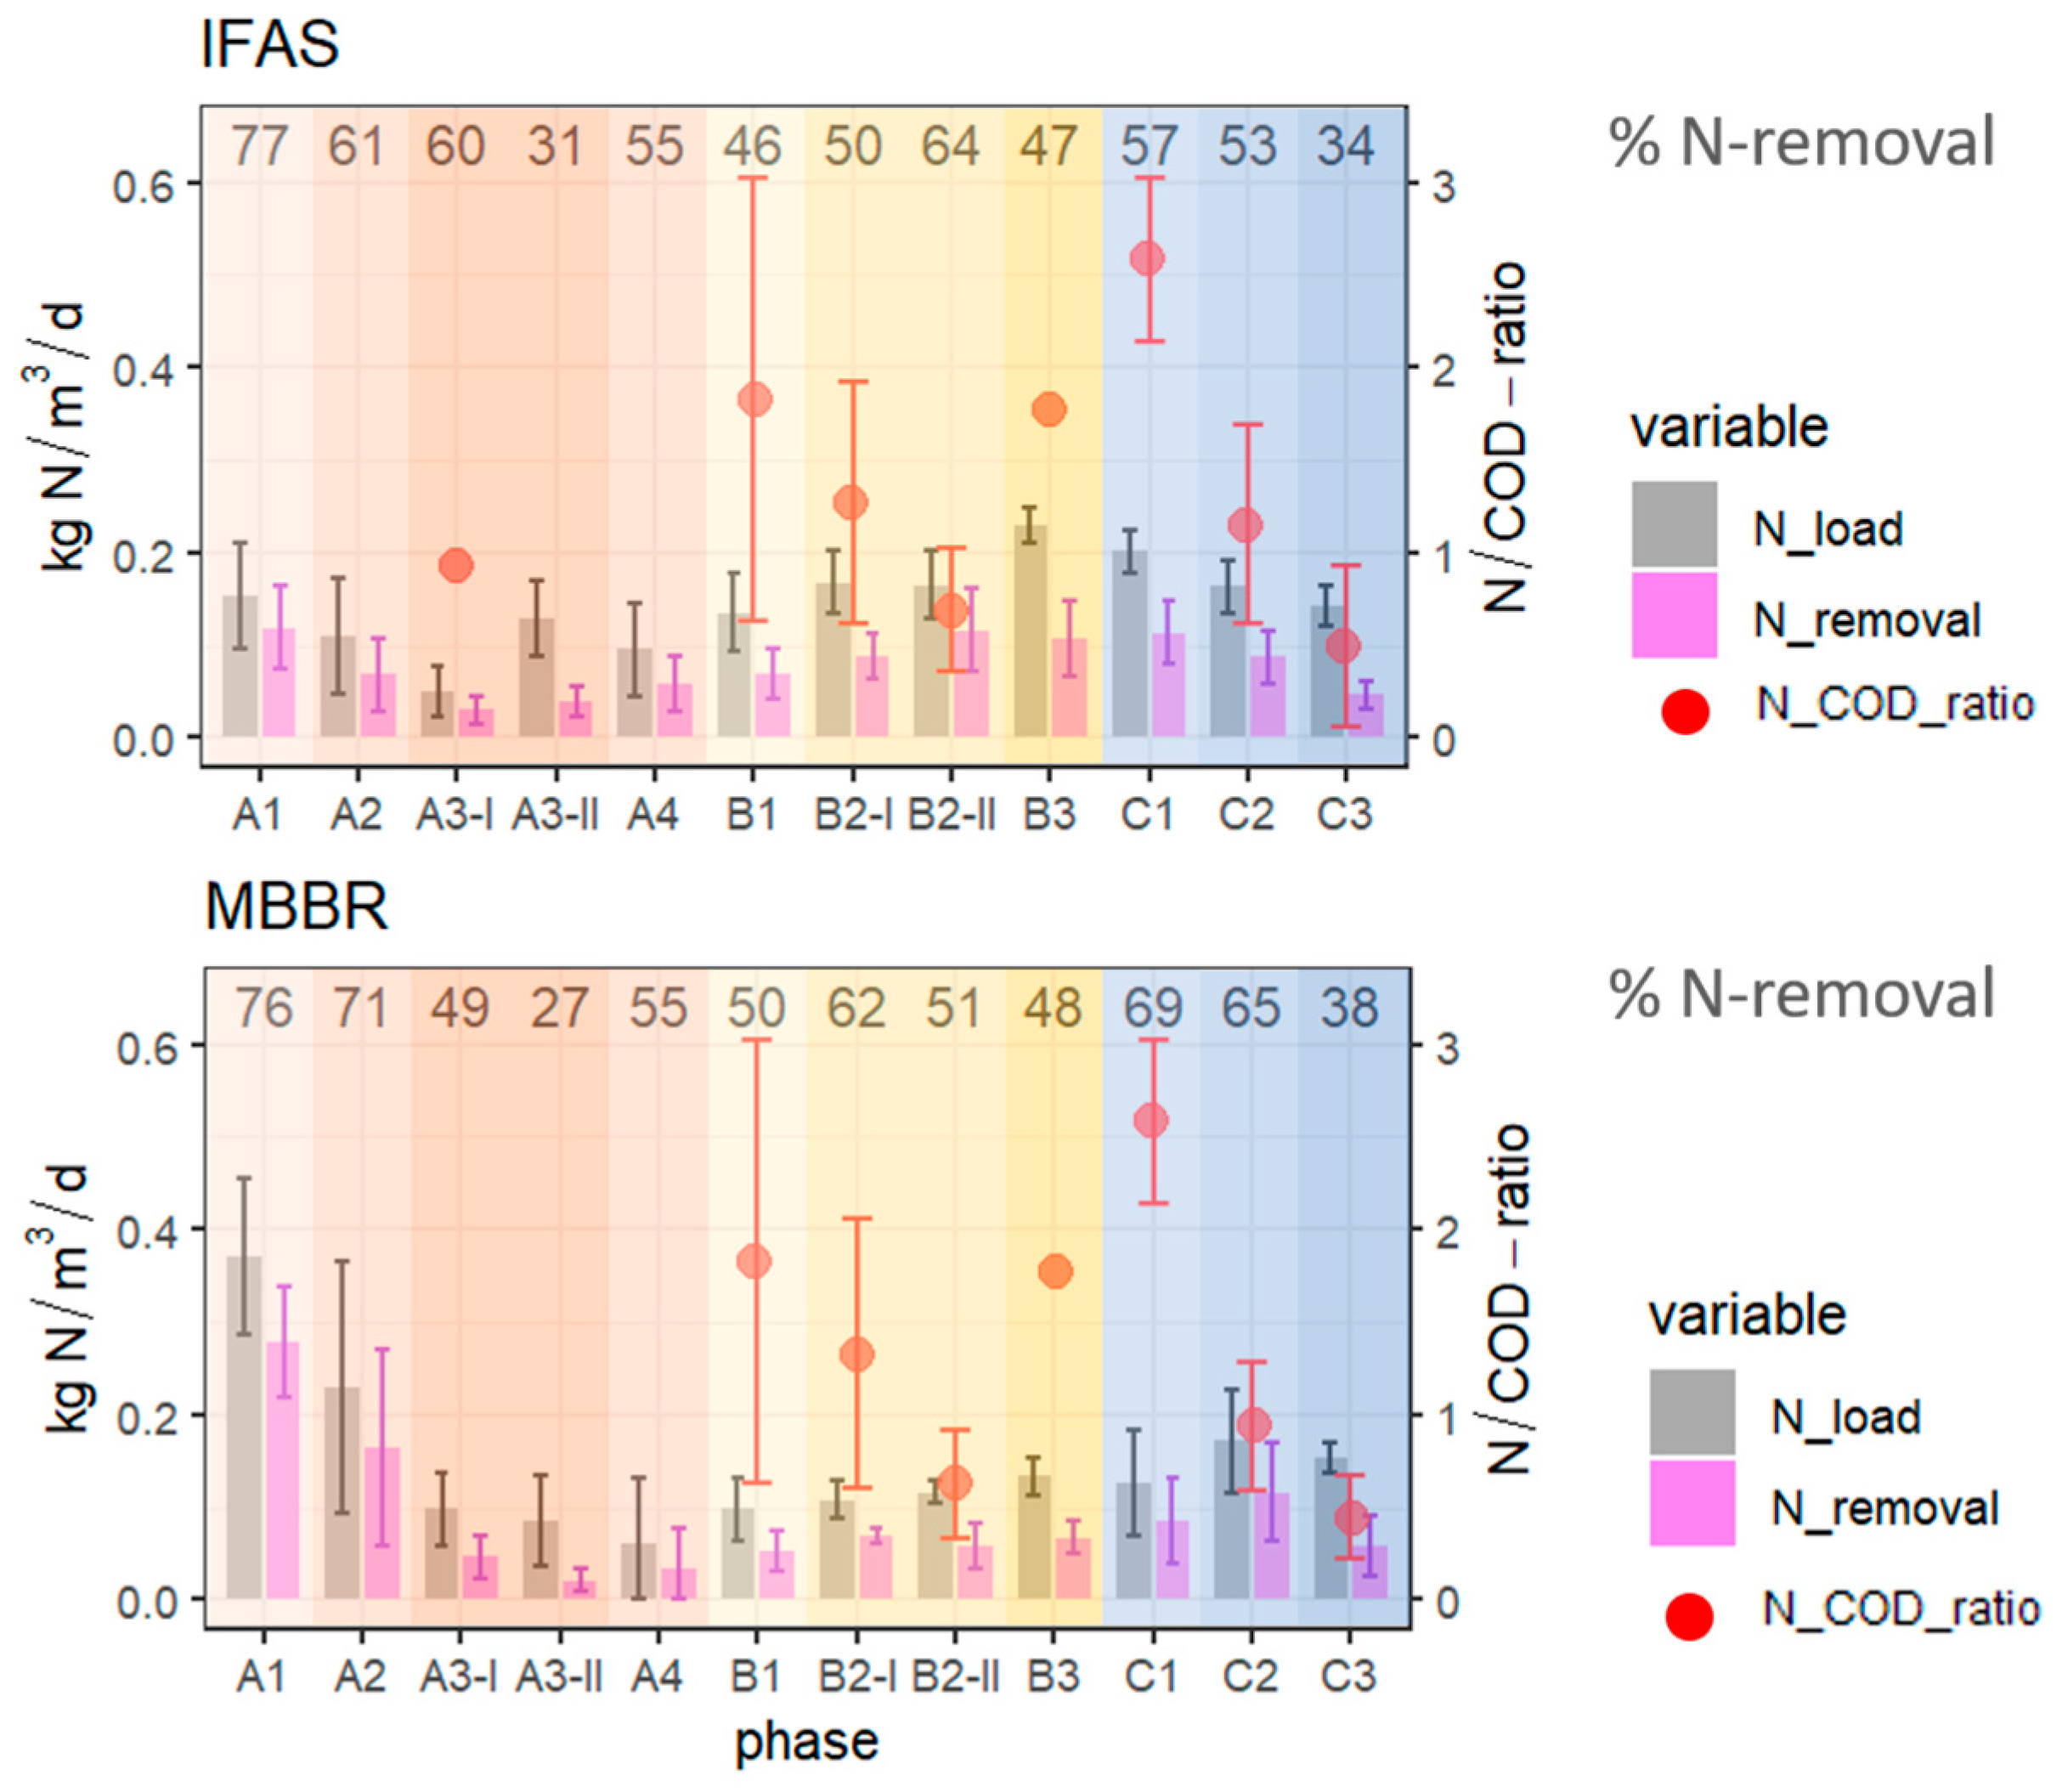
With conventional nitrification-denitrification, a lab-scale MBBR achieved a nitrogen removal rate of 0.03 kg N m−3 d−1 at 10% carrier filling ratio and 0.18 kg N m−3 d−1 at 50% carrier filling ratio [53]. This is similar to activated sludge nitrification-denitrification rates of 0.06 kg N m−3 d−1 [50]. This study observed a maximum nitrogen removal rate in the MBBR (subphase A1: 0.28 kg N m−3 d−1—refer to Figure 6). On average, N removal rate of MBBR and IFAS reactor was 0.07 kg N m−3 d−1. While MBBR surpasses the rate of 0.06 kg N m−3 d−1 achieved by conventional one-stage nitrification-denitrification in half of the subphases, IFAS reactor exceeded the nitrogen removal rate of 0.06 kg N m−3 d−1 in 9 out of 12 phases compared to MBBR. In subphases relevant for mainstream application (B2 and C1) characterized by the absence of NOB activity and lower nitrogen concentrations, the IFAS reactor yielded higher nitrogen removal rates (0.09–0.12 kg N m−3 d−1) compared to the MBBR (0.06–0.09 kg N m−3 d−1).
Figure 6.
Nitrogen removal rate in kg N m−3 d−1 for IFAS reactor (top) and MBBR (bottom) over subphases A1–C3. Experimental phases are marked with colors: A (red), B (yellow), C (blue).
Nitrogen removal rates decreased in the IFAS reactor from 0.12 kg N m−3 d−1 (subphase A1) to 0.03 kg N m−3 d−1 (subphase A3-I) and in the MBBR from 0.28 kg N m−3 d−1 (subphase A1) to 0.02 kg N m−3 d−1 (subphase A3-II) at a temperature range from 21–27 °C (10–90% percentile). Decreased influent load due to pH-controlled influent dosage (as described in Section 2.2 and Section 3.1) led to decreased removal rates in phase A1–A3-I while keeping comparable removal degrees. In phase B, time-based influent dosage resulted in increased nitrogen load and a rising nitrogen removal rate.
In a simultaneous nitritation, anammox, and denitrification process, lower N/COD ratios lead to an enhanced competition of aerobic heterotrophic bacteria and AOB. This results in a decreased nitritation performance and thus in less NO2− as a substrate for AnAOB. Nitrogen removal efficiency declines with lower N/COD ratios starting from 0,5 downwards and limited oxygen availability. In addition, anoxic heterotrophic bacteria outcompeted AnAOB at higher concentrations of biodegradable COD (lower N/COD ratios) [54]. In our study, nitrogen removal rate and nitrogen removal degree declined with a N/COD ratio of 0.6 ± 0.3 in the MBBR (Figure 6) at a reactor concentration of 190 ± 62 mg NH4-N L−1. With an elevated N/COD ratio in phase B3, nitrogen removal rate and nitrogen removal degree stayed low, probably due to the enhanced NOB activity (explained in Section 3.1). In IFAS reactor, nitrogen removal decreased even at higher N/COD-ratios in subphase C2 of 1.2 ± 0.5 at lower nitrogen concentrations compared to B2-II in MBBR. Subsequently, in subphase C3, nitrogen removal rates declined for both reactors to below 0.06 kg N m−3 d−1 at N/COD-ratios of 0.5 ± 0.4 (IFAS) and 0.4 ± 0.2 (MBBR), similar to decreasing nitrogen removal rates found in literature [54]. The nitrogen removal degree declined from 53% (IFAS), 65% (MBBR) at N/COD-ratios above 0.5 (subphase C2) to 34% (IFAS), 38% (MBBR) at N/COD-ratios of below 0.5 (subphase C3). This trend is also similar to a reported study of a bench-scale sequencing bed reactor fed with synthetic wastewater, where N removal decreased from 79% to 40% (NH4+ removal efficiency dropped by 85%) with decreasing N/COD ratio from 1 to 0.5 [55]. These findings underscore the necessity of utilizing influent with a high N/COD ratio for anammox processes, as advocated in the literature [56].
3.3. MBBR vs. IFAS Configuration
Wastewater treatment in the mainstream treatment line requires stable nitrogen removal to ensure compliance with effluent limit values. Average nitrogen removal over all phases was 0.07 kg N m−3 d−1 for both reactors. Median values were 0.07 kg N m−3 d−1 for IFAS and 0.05 kg N m−3 d−1 for MBBR. The IFAS reactor demonstrated greater operational performance and stability, regarding nitrogen removal rates and a lower number of days with NOB activity shown as NO3-ratio below 0.5 (Figure 7). The more days NO3-ratio is below 0.5, the more days NOB compete with AMOX for NO2−, which is also seen in a sinking removal rate (Figure 6). Particularly in subphases A3-I, throughout phase B, and C1, IFAS achieved higher removal rates in kg N m−3 d−1. Only subphase C2 showed higher days of NOB activity in IFAS reactor compared to MBBR (Figure 7). The simulation of an IFAS and MBBR system in Trojanowicz et al. (2021) [17] supports the advantage of IFAS over MBBR systems for AnAOB. The simulation of 1 mm biofilm systems showed elevated concentration in the bulk of FNA compared to MBBR due to greater amounts of NO2− produced by AOB in activated sludge. Due to higher affinity to FNA of AnAOB compared to NOB, AnAOB could use more of the substrate NO2− in the biofilm if anaerobic zones are present.
Figure 7.
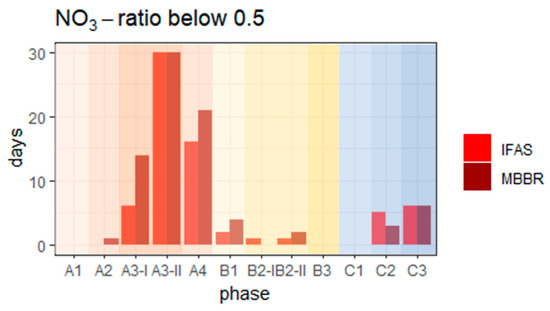
Number of days with NO3-ratio below 0.5. Phases are marked with colors: A (red), B (yellow), C (blue).
4. Conclusions
This study provides new insights into the comparison of an IFAS reactor and an MBBR for the use of deammonification in the transition from sidestream to mainstream. Due to a high sludge retention in biofilm systems, at least half a year of study is necessary to gain reliable results. Lab-scale reactors in this study were operated for over 1000 days. Our research underlines the importance of FA inhibition on NOB when transitioning from sidestream to mainstream. In our study, NOB activity manifested in experimental phases with low nitrogen concentrations. IFAS configuration exhibited greater stability compared to the MBBR, with fewer days of NOB activity. In addition, at mainstream-like temperature and concentration conditions, IFAS reactor yielded higher nitrogen removal rates compared with MBBR. This may be due to higher flexibility in operation of IFAS reactors resulting from the presence of suspended biomass in addition to the biofilm on the carriers. The deammonification process with the newly tested cubic polyurethane carriers in both the MBBR and IFAS reactor achieved stable nitrogen removal rates. AnAOB were predominantly situated on the carriers rather than in suspended biomass in both reactors, as indicated by ex-situ activity and FISH measurements, underscoring the ability of carriers in retaining AnAOB within the system. The present study has only explored lab-scale conditions. Results obtained need to be confirmed and further improved, e.g., in pilot-scale applications.
Given the low in-situ inhibition of FA at reactor concentrations below 50 mg NH4-N L−1 (1 mg FA L−1) shown in our study, we recommend maintaining a reserve biomass for restarting or inoculating deammonification in the mainstream, if NOB should take over. An important issue to address is the long-term impact of biomass adaptation to operational conditions. Future research should focus on the development of an appropriate operational framework for mainstream anammox with an approach of in-situ NOB inhibition, preferably without external inhibition substances. Exploring selective suppression strategies and optimizing aeration control are key approaches to further assess the potential of IFAS reactors.
Author Contributions
Conceptualization, H.J. and V.P.; methodology, H.J., N.K., V.P. and E.S.; software, K.S.; validation, V.P., K.S. and J.K.; formal analysis, J.K.; investigation, H.J. and E.S.; resources, J.K.; data curation, H.J.; writing—original draft preparation, H.J.; writing—review and editing, H.J., V.P., K.S. and J.K.; visualization, H.J. and V.P.; supervision, V.P., K.S. and J.K.; project administration, V.P.; funding acquisition, V.P. and J.K. All authors have read and agreed to the published version of the manuscript.
Funding
This research was funded by FFG, grant number 868048: B1: Hauptstrom-Deammonifikation mit Linpor®-Aufwuchsträgern im IFAS-Verfahren (LINPOR-HD).
Data Availability Statement
The original contributions presented in this study are included in the article. Further inquiries can be directed to the corresponding author.
Acknowledgments
The authors would like to acknowledge Zdravka Saracevic, Ernis Saracevic, and Helmuth König for their great support in analysis lab work, reactor design and improvements, and their feedback on measurements. Thanks to Nadja Schroll for providing the basis for the sketch of Figure 1 and for undertaking part of the lab work in her bachelor’s thesis. Big thanks to Eva Honemann (former Walcher), who also supported our lab work as an employee of the institute. Another thank you goes to Bianca Flesch, who supported lab work with operation of the reactors. ChatGPT-5.2 (OpenAI) was used to improve the grammar of some parts of the manuscript. The authors reviewed and edited all generated text, taking full responsibility for the final content.
Conflicts of Interest
The authors declare no conflict of interest. The funders had no role in the design of the study; in the collection, analyses, or interpretation of data; in the writing of the manuscript, or in the decision to publish the results.
Abbreviations
The following abbreviations are used in this manuscript:
| AOB | Ammonium oxidizing bacteria |
| AnAOB | Anaerobic ammonium oxidizing bacteria—anammox bacteria |
| COD | Chemical oxygen demand |
| DO | Dissolved oxygen |
| FA | Free ammonia |
| FISH | fluorescence in-situ hybridization |
| FNA | Free nitrous acid |
| IFAS | Integrated fixed film activated sludge |
| MBBR | Moving bed biofilm reactor |
| N2 | Elemental nitrogen |
| NH4+ | ammonium |
| NH4-N | Nitrogen contained in ammonium |
| NO3− | Nitrate |
| NO3-N | Nitrogen contained in nitrate |
| NO2− | Nitrite |
| NO2-N | Nitrogen contained in nitrite |
| NH3 | Ammonia |
| NOB | Nitrate oxidizing bacteria |
| SDE | Sludge dewatering effluent |
| N | Nitrogen as sum of NH4-N, NO2-N and NO3-N |
| TSS | Total suspended solids |
| VSS | Volatile suspended solids |
| WWTP | Wastewater treatment plant |
Appendix A
Figure A1.
Effluent NO2− and NO3− concentration of MBBR and IFAS reactor over 1000 days of operation. Phases are marked with colors: A (red), B (yellow), C (blue).
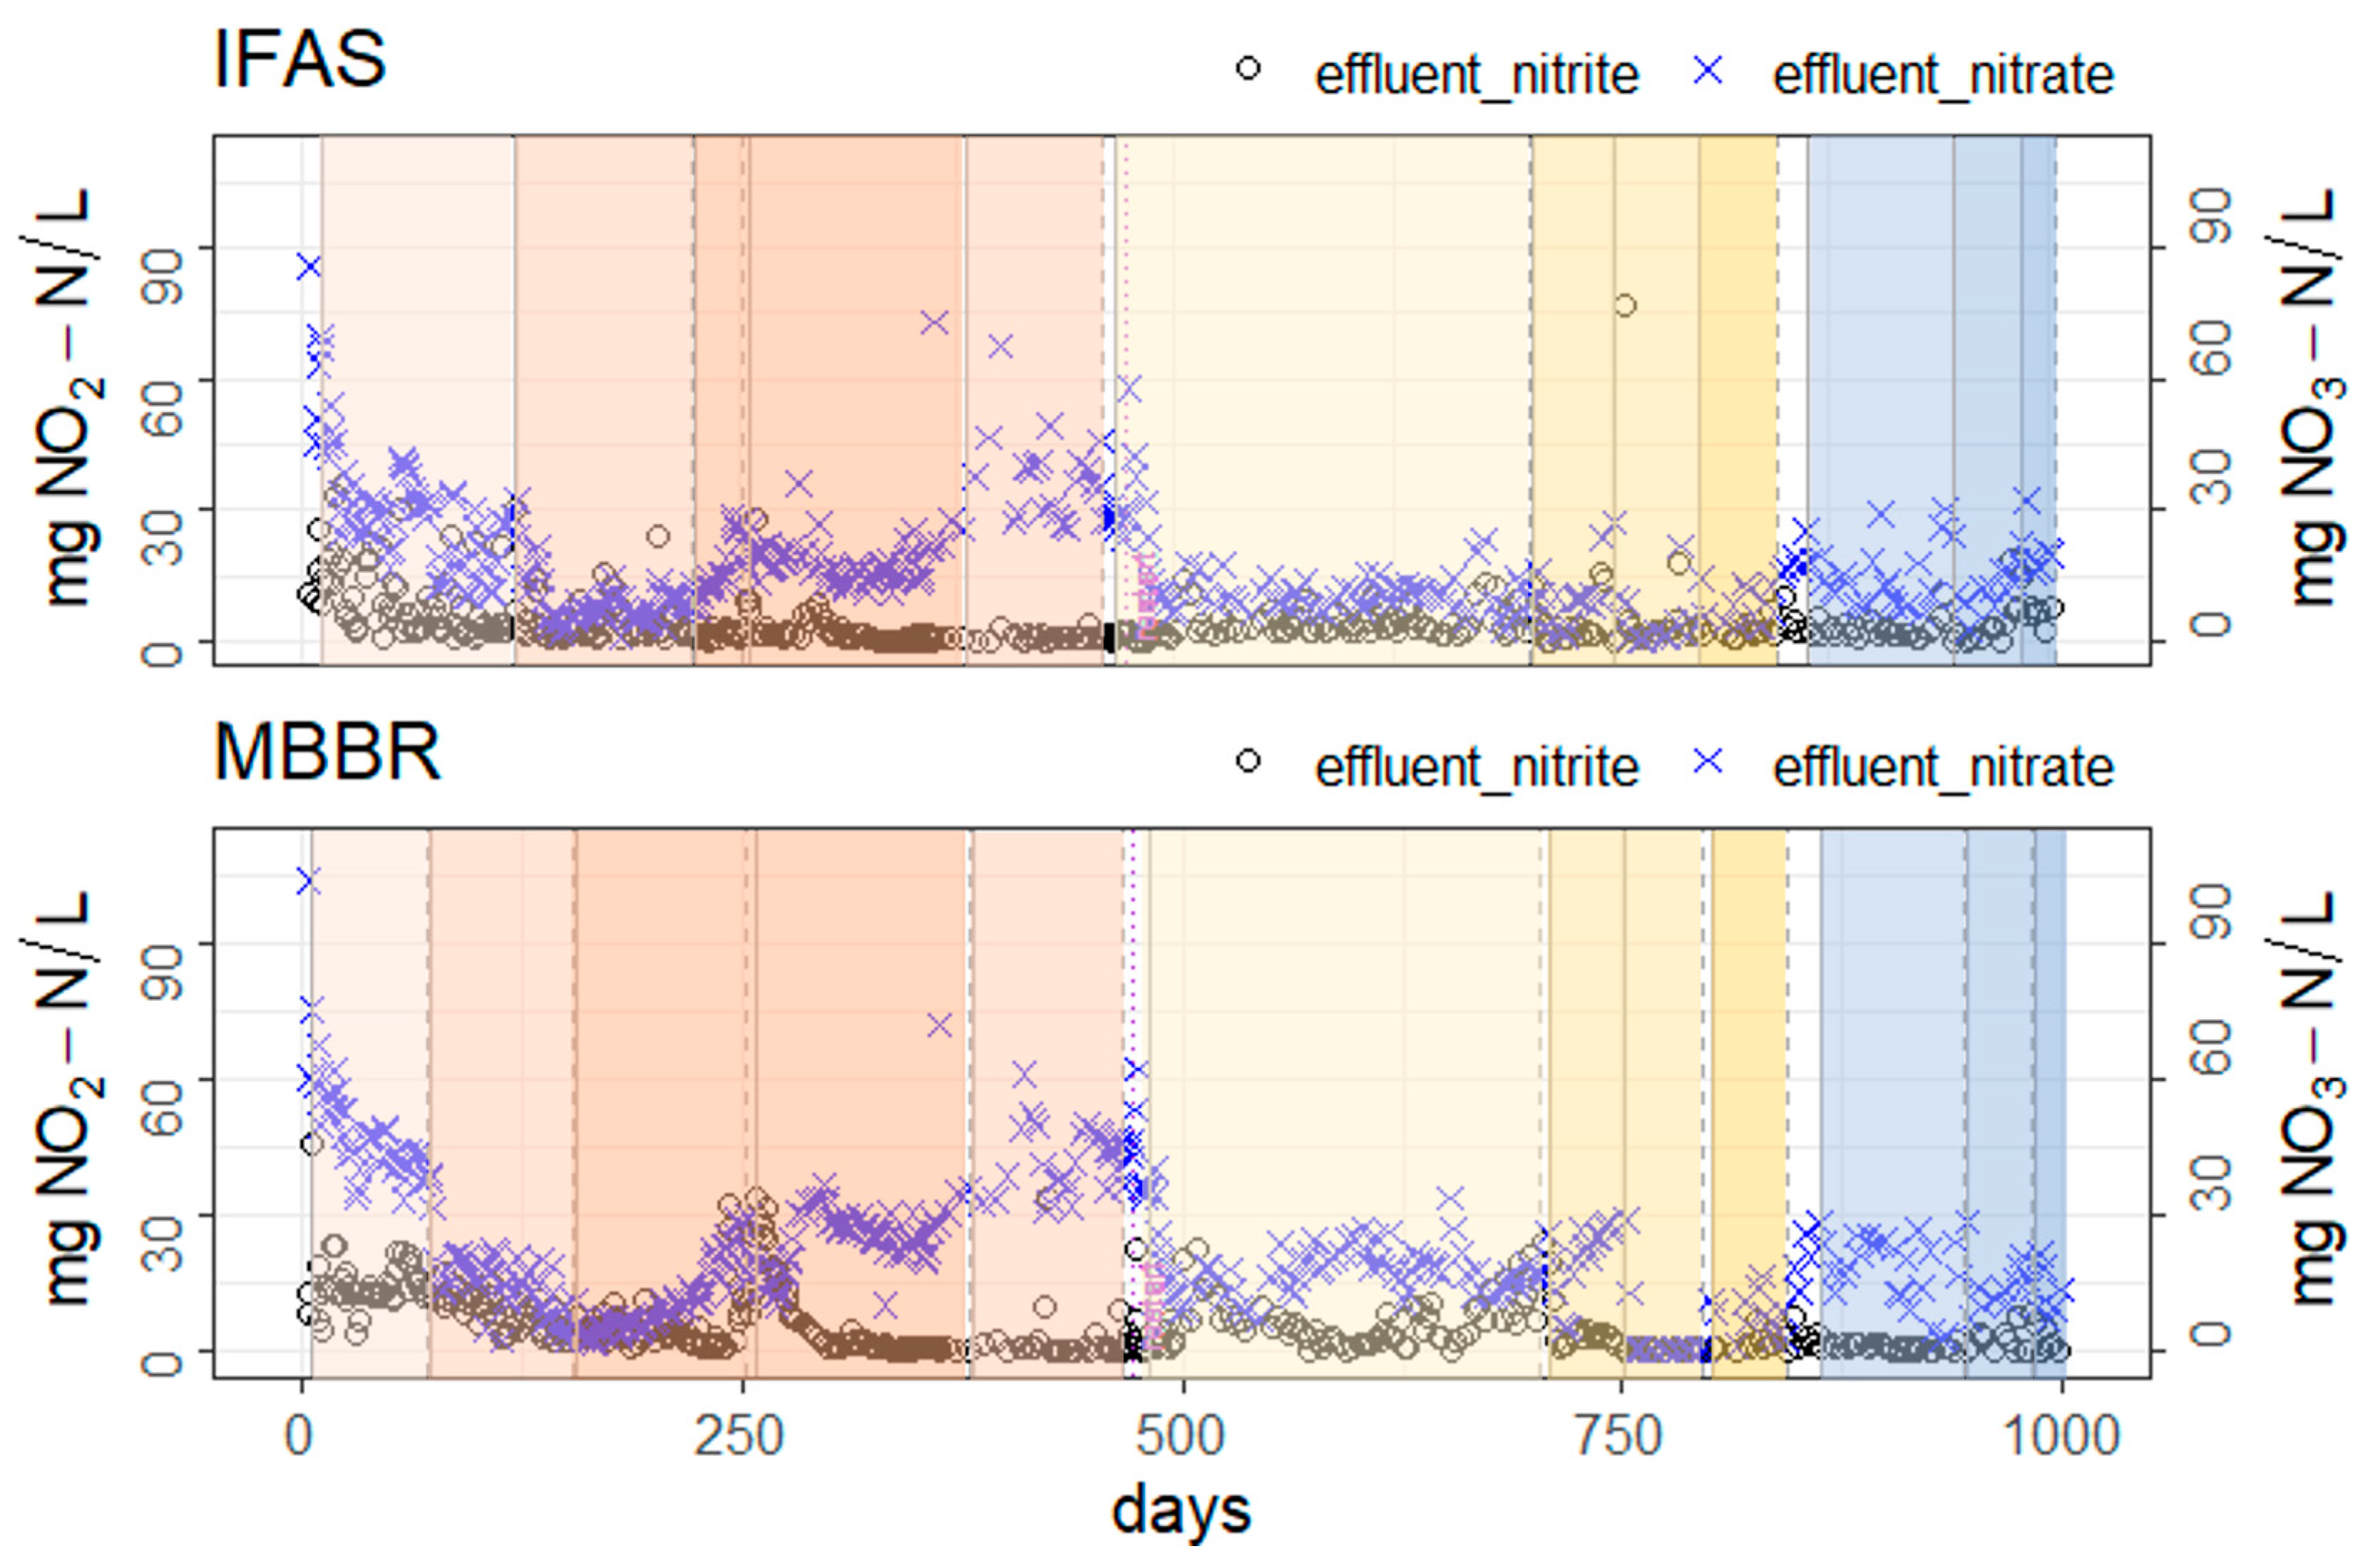
Table A1.
Analytical methods used for COD and nitrogen concentrations.
References
- Lotti, T.; Kleerebezem, R.; Lubello, C.; van Loosdrecht, M.C.M. Physiological and Kinetic Characterization of a Suspended Cell Anammox Culture. Water Res. 2014, 60, 1–14. [Google Scholar] [CrossRef] [Scilit]
- Mulder, A.; Graaf, A.A.; Robertson, L.A.; Kuenen, J.G. Anaerobic Ammonium Oxidation Discovered in a Denitrifying Fluidized Bed Reactor. FEMS Microbiol. Ecol. 1995, 16, 177–184. [Google Scholar] [CrossRef]
- Strous, M.; Kuenen, J.G.; Jetten, M.S.M. Key Physiology of Anaerobic Ammonium Oxidation. Appl. Environ. Microbiol. 1999, 65, 3248–3250. [Google Scholar] [CrossRef] [Scilit] [PubMed]
- Lackner, S.; Gilbert, E.M.; Vlaeminck, S.E.; Joss, A.; Horn, H.; van Loosdrecht, M.C.M. Full-Scale Partial Nitritation/Anammox Experiences—An Application Survey. Water Res. 2014, 55, 292–303. [Google Scholar] [CrossRef] [Scilit] [PubMed]
- Pitol, C.S.; Fernandes, A.T.; Menegon, C.G.; Carneiro, G.P.A.; Bicelli, L.G.; Cano, V.; De Souza, T.S.O. Enhancing Deammonification in a Membrane-Aerated Biofilm Reactor: Intermittent Aeration and Ammonia Loading Rate Control as Key Strategies for NOB Inhibition in Low-Strength Nitrogen Wastewater. J. Water Process Eng. 2025, 79, 108861. [Google Scholar] [CrossRef] [Scilit]
- Wu, S.; Gao, F.; Lin, C.; Quan, Y.; Wei, Y.; Liu, Z.; Yu, H.; Sanjaya, E.H.; Din, M.F.M.; Chen, H. A Critical Review of Oxygen Supply and Control Strategies in Single-Stage Partial Nitritation-Anammox System for Autotrophic Nitrogen Removal from Wastewater. J. Environ. Chem. Eng. 2025, 13, 117613. [Google Scholar] [CrossRef] [Scilit]
- Du, Z.; Wang, J.; Kong, Y.; Peng, M.; Zhang, Y.; Lu, H.; Qu, D.; Zhang, F.; Peng, Y. Mainstream Anammox Achieved in a Two-Stage Acidophilic Partial-Nitrification/Anammox System: Ultra-High Enrichment of Anammox Bacteria and Identification of a Potential Novel Acidophilic Ammonia-Oxidizing Bacterium. Water Res. 2026, 291, 125218. [Google Scholar] [CrossRef] [Scilit]
- Im, H.; Jeong, S.; Kim, H.; Yoon, S.; Yu, J.; Ni, S.-Q.; Chung, J.; Lee, T. Mainstream Application of the Partial Denitrification-Anammox Process for Carbon-Neutral Wastewater Treatment: A Review. J. Water Process Eng. 2025, 72, 107558. [Google Scholar] [CrossRef] [Scilit]
- Gonzalez-Martinez, A.; Muñoz-Palazon, B.; Rodriguez-Sanchez, A.; Gonzalez-Lopez, J. New Concepts in Anammox Processes for Wastewater Nitrogen Removal: Recent Advances and Future Prospects. FEMS Microbiol. Lett. 2018, 365, fny031. [Google Scholar] [CrossRef] [Scilit] [PubMed]
- Zuo, F.; Yue, W.; Gui, S.; Sui, Q.; Wei, Y. Resilience of Anammox Application from Sidestream to Mainstream: A Combined System Coupling Denitrification, Partial Nitritation and Partial Denitrification with Anammox. Bioresour. Technol. 2023, 374, 128783. [Google Scholar] [CrossRef] [Scilit]
- Jetten, M.S.M.; Wagner, M.; Fuerst, J.; Van Loosdrecht, M.; Kuenen, G.; Strous, M. Microbiology and Application of the Anaerobic Ammonium Oxidation (‘Anammox’) Process. Curr. Opin. Biotechnol. 2001, 12, 283–288. [Google Scholar] [CrossRef] [Scilit]
- Rodriguez-Sanchez, A.; Gonzalez-Martinez, A.; Martinez-Toledo, M.; Garcia-Ruiz, M.; Osorio, F.; Gonzalez-Lopez, J. The Effect of Influent Characteristics and Operational Conditions over the Performance and Microbial Community Structure of Partial Nitritation Reactors. Water 2014, 6, 1905–1924. [Google Scholar] [CrossRef] [Scilit]
- Wang, Z.; Zheng, M.; Meng, J.; Hu, Z.; Ni, G.; Guerrero Calderon, A.; Li, H.; De Clippeleir, H.; Al-Omari, A.; Hu, S.; et al. Robust Nitritation Sustained by Acid-Tolerant Ammonia-Oxidizing Bacteria. Environ. Sci. Technol. 2021, 55, 2048–2056. [Google Scholar] [CrossRef] [Scilit]
- Fux, C.; Velten, S.; Carozzi, V.; Solley, D.; Keller, J. Efficient and Stable Nitritation and Denitritation of Ammonium-Rich Sludge Dewatering Liquor Using an SBR with Continuous Loading. Water Res. 2006, 40, 2765–2775. [Google Scholar] [CrossRef] [Scilit]
- Munz, G.; Lubello, C.; Oleszkiewicz, J.A. Factors Affecting the Growth Rates of Ammonium and Nitrite Oxidizing Bacteria. Chemosphere 2011, 83, 720–725. [Google Scholar] [CrossRef] [Scilit]
- Yu, H.; Zhu, J.; Liu, Y.; Sun, F.; Jin, W.; Chen, C. A Comprehensive Review of Stabilization Control Strategies for Partial Nitritation Processes. J. Environ. Chem. Eng. 2025, 13, 117407. [Google Scholar] [CrossRef] [Scilit]
- Trojanowicz, K.; Trela, J.; Plaza, E. Possible Mechanism of Efficient Mainstream Partial Nitritation/Anammox (PN/A) in Hybrid Bioreactors (IFAS). Environ. Technol. 2021, 42, 1023–1037. [Google Scholar] [CrossRef] [Scilit] [PubMed]
- Liu, W.; Shen, C.; Liu, C.; Zhang, S.; Hao, S.; Peng, Y.; Li, J. Achieving Stable Mainstream Nitrogen and Phosphorus Removal Assisted by Hydroxylamine Addition in a Continuous Partial Nitritation/Anammox Process from Real Sewage. Sci. Total Environ. 2021, 794, 148478. [Google Scholar] [CrossRef] [Scilit]
- Pedrouso, A.; Val Del Río, Á.; Morales, N.; Vázquez-Padín, J.R.; Campos, J.L.; Méndez, R.; Mosquera-Corral, A. Nitrite Oxidizing Bacteria Suppression Based on In-Situ Free Nitrous Acid Production at Mainstream Conditions. Sep. Purif. Technol. 2017, 186, 55–62. [Google Scholar] [CrossRef] [Scilit]
- Abeliovich, A. The Nitrite Oxidizing Bacteria. In The Prokaryotes: Volume 5: Proteobacteria: Alpha and Beta Subclasses; Dworkin, M., Falkow, S., Rosenberg, E., Schleifer, K.-H., Stackebrandt, E., Eds.; Springer: New York, NY, USA, 2006; pp. 861–872. [Google Scholar]
- Wang, Z.; Zheng, M.; Xue, Y.; Xia, J.; Zhong, H.; Ni, G.; Liu, Y.; Yuan, Z.; Hu, S. Free Ammonia Shock Treatment Eliminates Nitrite-Oxidizing Bacterial Activity for Mainstream Biofilm Nitritation Process. Chem. Eng. J. 2020, 393, 124682. [Google Scholar] [CrossRef] [Scilit]
- Gilbert, E.M.; Agrawal, S.; Brunner, F.; Schwartz, T.; Horn, H.; Lackner, S. Response of Different Nitrospira Species To Anoxic Periods Depends on Operational DO. Environ. Sci. Technol. 2014, 48, 2934–2941. [Google Scholar] [CrossRef] [Scilit] [PubMed]
- Luo, Z.; Rong, C.; Wang, T.; Qin, Y.; Wu, J.; Guo, Y.; Hu, Y.; Kong, Z.; Hanaoka, T.; Sakemi, S.; et al. Operational Control Mechanism and Pilot-Scale Demonstration of Integrated Fixed-Film Activated Sludge Partial Nitritation/Anammox System. Bioresour. Technol. 2026, 449, 134348. [Google Scholar] [CrossRef] [Scilit] [PubMed]
- Zheng, M.; Li, H.; Duan, H.; Liu, T.; Wang, Z.; Zhao, J.; Hu, Z.; Watts, S.; Meng, J.; Liu, P.; et al. One-Year Stable Pilot-Scale Operation Demonstrates High Flexibility of Mainstream Anammox Application. Water Res. X 2023, 19, 100166. [Google Scholar] [CrossRef] [Scilit]
- Wang, Z.-B.; Liu, X.-L.; Bu, C.-N.; Ni, S.-Q.; Sung, S. Microbial Diversity Reveals the Partial Denitrification-Anammox Process Serves as a New Pathway in the First Mainstream Anammox Plant. Sci. Total Environ. 2021, 764, 142917. [Google Scholar] [CrossRef] [Scilit] [PubMed]
- Zhang, S.; Li, Q.; Gu, P.; Lv, X.; Han, X.; Li, K.; Wang, Z.; Qu, Z.; Li, J.; Wang, C.; et al. Full-Scale Mainstream Partial Nitritation/Anammox Process: A Three-Year Demonstration for Municipal Wastewater Treatment. Water Res. X 2025, 29, 100419. [Google Scholar] [CrossRef] [Scilit]
- Li, Y.; Xiang, T.; Liang, H.; Wang, P.; Gao, D. Achieving Rapid Mainstream Deammonification through Inoculating Long-Term Refrigerated Sidestream Sludge in Plug-Flow Fixed-Bed Biofilm Reactor. Sci. Total Environ. 2022, 806, 151415. [Google Scholar] [CrossRef] [Scilit]
- Peng, Z.; Gao, D.; Xiang, T.; Wang, X. Achieving Stable and Efficient Single-Stage Deammonification Using Plug Flow Reactor. Environ. Sci. Pollut. Res. 2019, 26, 28031–28039. [Google Scholar] [CrossRef] [Scilit]
- Li, Y.; Liang, H.; Yang, W.; Cheng, L.; Gao, D. The Enhanced Biomass Attachment of Novel Functional Carriers and Its Effect on Facilitating the Start-up of Mainstream Deammonification at Ambient Temperature. Chem. Eng. J. 2024, 480, 148001. [Google Scholar] [CrossRef] [Scilit]
- Chen, J.; Hai, Y.; Zhang, W.; Zhou, X. Insights into Deterioration and Reactivation of a Mainstream Anammox Biofilm Reactor Response to C/N Ratio. J. Environ. Manag. 2022, 320, 115780. [Google Scholar] [CrossRef] [Scilit]
- Azari, M.; Aslani, A.; Denecke, M. The Effect of the COD: N Ratio on Mainstream Deammonification in an Integrated Fixed-Film Activated Sludge Sequencing Batch Reactor. Chemosphere 2020, 259, 127426. [Google Scholar] [CrossRef] [Scilit]
- Malovanyy, A.; Trela, J.; Plaza, E. Mainstream Wastewater Treatment in Integrated Fixed Film Activated Sludge (IFAS) Reactor by Partial Nitritation/Anammox Process. Bioresour. Technol. 2015, 198, 478–487. [Google Scholar] [CrossRef] [Scilit] [PubMed]
- Lotti, T.; Kleerebezem, R.; van Loosdrecht, M.C.M. Effect of Temperature Change on Anammox Activity. Biotechnol. Bioeng. 2015, 112, 98–103. [Google Scholar] [CrossRef] [Scilit] [PubMed]
- Laureni, M.; Falås, P.; Robin, O.; Wick, A.; Weissbrodt, D.G.; Nielsen, J.L.; Ternes, T.A.; Morgenroth, E.; Joss, A. Mainstream Partial Nitritation and Anammox: Long-Term Process Stability and Effluent Quality at Low Temperatures. Water Res. 2016, 101, 628–639. [Google Scholar] [CrossRef] [Scilit]
- Li, Y.; Xiang, T.; Liang, H.; Gao, D.; Wang, P. Achieving Stable Mainstream Deammonification Process by a Novel Combinatorial Control Strategy. Bioresour. Technol. 2020, 318, 124275. [Google Scholar] [CrossRef] [Scilit] [PubMed]
- Zhang, X.; Zhang, H.; Ye, C.; Wei, M.; Du, J. Effect of COD/N Ratio on Nitrogen Removal and Microbial Communities of CANON Process in Membrane Bioreactors. Bioresour. Technol. 2015, 189, 302–308. [Google Scholar] [CrossRef] [Scilit]
- Trinh, H.P.; Lee, S.-H.; Jeong, G.; Yoon, H.; Park, H.-D. Recent Developments of the Mainstream Anammox Processes: Challenges and Opportunities. J. Environ. Chem. Eng. 2021, 9, 105583. [Google Scholar] [CrossRef] [Scilit]
- Qiu, S.; Li, Z.; Hu, Y.; Shi, L.; Liu, R.; Shi, L.; Chen, L.; Zhan, X. What’s the Best Way to Achieve Successful Mainstream Partial Nitritation-Anammox Application? Crit. Rev. Environ. Sci. Technol. 2021, 51, 1045–1077. [Google Scholar] [CrossRef] [Scilit]
- Peng, Z.; Lei, Y.; Liu, Y.; Wan, X.; Yang, B.; Pan, X. Fast Start-up and Reactivation of Anammox Process Using Polyurethane Sponge. Biochem. Eng. J. 2022, 177, 108249. [Google Scholar] [CrossRef] [Scilit]
- Verma, S.; Daverey, A.; Lin, J.-G. Successful Start-up of Anammox Process from Activated Sludge and Anaerobic Sludge in a Sequencing Batch Reactor Using an Unconventional Strategy. Int. Biodeterior. Biodegrad. 2021, 156, 105132. [Google Scholar] [CrossRef] [Scilit]
- Svardal, K. Durchführung und Interpretation von Atmungsmessungen für den Betrieb von Belebungsanlagen. In Neue Entwicklungen in der Abwassertechnik: ÖWAV-Seminar TU-Wien 22./23. Mai 1997 Wirtschaftskammer Österreich; Institut für Wassergüte und Ressourcenmanagement: Vienna, Austria, 1997. [Google Scholar] [CrossRef]
- Sliekers, A. Completely Autotrophic Nitrogen Removal over Nitrite in One Single Reactor. Water Res. 2002, 36, 2475–2482. [Google Scholar] [CrossRef] [Scilit]
- Anthonisen, A.C.; Loehr, R.C.; Prakasam, T.B.S.; Srinath, E.G. Inhibition of Nitrification by Ammonia and Nitrous Acid. J. Water Pollut. Control Fed. 1976, 48, 835–852. [Google Scholar]
- Cho, S.; Kambey, C.; Nguyen, V. Performance of Anammox Processes for Wastewater Treatment: A Critical Review on Effects of Operational Conditions and Environmental Stresses. Water 2019, 12, 20. [Google Scholar] [CrossRef] [Scilit]
- Claros, J.; Jiménez, E.; Aguado, D.; Ferrer, J.; Seco, A.; Serralta, J. Effect of pH and HNO2 Concentration on the Activity of Ammonia-Oxidizing Bacteria in a Partial Nitritation Reactor. Water Sci. Technol. 2013, 67, 2587–2594. [Google Scholar] [CrossRef] [Scilit] [PubMed]
- Jiménez, E.; Giménez, J.B.; Ruano, M.V.; Ferrer, J.; Serralta, J. Effect of pH and Nitrite Concentration on Nitrite Oxidation Rate. Bioresour. Technol. 2011, 102, 8741–8747. [Google Scholar] [CrossRef] [Scilit]
- An, Z.; Kent, T.R.; Sun, Y.; Bott, C.B.; Wang, Z.-W. Free Ammonia Resistance of Nitrite-Oxidizing Bacteria Developed in Aerobic Granular Sludge Cultivated in Continuous Upflow Airlift Reactors Performing Partial Nitritation. Water Environ. Res. 2021, 93, 421–432. [Google Scholar] [CrossRef] [Scilit] [PubMed]
- Zhou, Y.; Oehmen, A.; Lim, M.; Vadivelu, V.; Ng, W.J. The Role of Nitrite and Free Nitrous Acid (FNA) in Wastewater Treatment Plants. Water Res. 2011, 45, 4672–4682. [Google Scholar] [CrossRef] [Scilit]
- Le, T.; Peng, B.; Su, C.; Massoudieh, A.; Torrents, A.; Al-Omari, A.; Murthy, S.; Wett, B.; Chandran, K.; DeBarbadillo, C.; et al. Impact of Carbon Source and COD/N on the Concurrent Operation of Partial Denitrification and Anammox. Water Environ. Res. 2019, 91, 185–197. [Google Scholar] [CrossRef] [Scilit] [PubMed]
- Svardal, K.; Baumgartner, T. Variantenvergleich Zum Ein-Oder Zweistufigen Ausbau von Kläranlagen. In Wiener Mitteilungen; Krampe, J., Kreuzinger, N., Eds.; Institut für Wassergüte, Ressourcenmanagement und Abfallwirtschaft: Vienna, Austria, 2018; pp. 149–162. Available online: http://hdl.handle.net/20.500.12708/62461 (accessed on 13 April 2026).
- Shourjeh, M.S.; Kowal, P.; Lu, X.; Xie, L.; Drewnowski, J. Development of Strategies for AOB and NOB Competition Supported by Mathematical Modeling in Terms of Successful Deammonification Implementation for Energy-Efficient WWTPs. Processes 2021, 9, 562. [Google Scholar] [CrossRef] [Scilit]
- Xu, G.; Zhou, Y.; Yang, Q.; Lee, Z.M.-P.; Gu, J.; Lay, W.; Cao, Y.; Liu, Y. The Challenges of Mainstream Deammonification Process for Municipal Used Water Treatment. Appl. Microbiol. Biotechnol. 2015, 99, 2485–2490. [Google Scholar] [CrossRef] [Scilit]
- Lima, P.S.; Inacio, A.T.; Moreira, Y.C.; César, D.E.; Dias, R.J.P.; Dezotti, M.; Bassin, J.P. Upgrade of a Suspended Biomass Reactor with Limited Nitrification to a Biofilm System: Addressing Critical Parameters and Performance in Different Reactor Configurations. Biochem. Eng. J. 2021, 170, 107987. [Google Scholar] [CrossRef] [Scilit]
- Singh, V.; Ormeci, B.; Mishra, S.; Hussain, A. Simultaneous Partial Nitrification, ANAMMOX and Denitrification (SNAD)—A Review of Critical Operating Parameters and Reactor Configurations. Chem. Eng. J. 2022, 433, 133677. [Google Scholar] [CrossRef] [Scilit]
- Al-Hazmi, H.; Grubba, D.; Majtacz, J.; Kowal, P.; Makinia, J. Evaluation of Partial Nitritation/Anammox (PN/A) Process Performance and Microorganisms Community Composition under Different C/N Ratio. Water 2019, 11, 2270. [Google Scholar] [CrossRef] [Scilit]
- Cao, Y.; Van Loosdrecht, M.C.M.; Daigger, G.T. Mainstream Partial Nitritation–Anammox in Municipal Wastewater Treatment: Status, Bottlenecks, and Further Studies. Appl. Microbiol. Biotechnol. 2017, 101, 1365–1383. [Google Scholar] [CrossRef] [Scilit] [PubMed]
- ÖNORM ISO 15705:2002; Water Quality—Determination of the Chemical Oxygen Demand Index (ST-COD)—Small-Scale Sealed Tube Method (ISO 15705:2002). Österreichisches Normungsinstitut: Wien, Austria, 2003.
- ÖNORM EN ISO 11732:2005; Water Quality—Determination of ammonium nitrogen—Method by flow analysis (CFA and FIA) and spectrometric detection (ISO 11732:2005). Österreichisches Normungsinstitut: Wien, Austria, 2005.
- ÖNORM EN ISO 13395:1996; Water Quality—Determination of nitrite nitrogen and nitrate nitrogen and the sum of both by flow analysis (CFA and FIA) and spectrometric detection (ISO 13395:1996). Österreichisches Normungsinstitut: Wien, Austria, 1997.

Disclaimer/Publisher’s Note: The statements, opinions and data contained in all publications are solely those of the individual author(s) and contributor(s) and not of MDPI and/or the editor(s). MDPI and/or the editor(s) disclaim responsibility for any injury to people or property resulting from any ideas, methods, instructions or products referred to in the content. |
© 2026 by the authors. Licensee MDPI, Basel, Switzerland. This article is an open access article distributed under the terms and conditions of the Creative Commons Attribution (CC BY) license.