


Highlights
- Water temperature exhibited greater spatial variability than air temperature along the longitudinal gradient.
- Hysteresis loops showed distinct patterns between warming (May–July) and cooling (Aug–Oct) phases.
- Air–water temperature differences were larger in streams during the warming phase, whereas they were smaller during the cooling phase.
- Thermal sensitivity and elasticity varied spatially, with elasticity decreasing from streams to rivers.
Abstract
We examined changes in water temperature in relation to air temperature in the two upper, two middle and lower reaches of the Han River basin, Republic of Korea. Air and water temperatures were monitored from 2020 to 2025, with analyses restricted to the May–October period of each year. TW exhibited pronounced spatial variability, whereas TA exhibited relatively low spatial variability. Hysteresis loops were analyzed separately for the warming (May–July) and cooling (August–October) phases using the air–water temperature relationship. Distinct phase-dependent patterns in air–water temperature differences were observed. Air–water temperature differences were greater in streams than in rivers, with values 4–5 °C higher during the warming phase and 4–6 °C lower during the cooling phase. Water temperature responses to air temperature showed phase-dependent spatial patterns, with regression slopes varying across stream and river systems and temperature elasticity decreasing from streams to rivers. Therefore, the results indicate that water temperature responses to air temperature vary both spatially and temporally, with sensitivity differing along the longitudinal gradient.
1. Introduction
Stream thermal regimes are influenced by climatic drivers, stream morphology, groundwater inputs, and riparian canopy conditions [1,2]. In addition, water temperature (TW) at any location along a stream reflects both the initial influence of the source water (e.g., groundwater seep, spring, lake, pond, wetland, or glacier) and the subsequent effects of energy and water exchanges across the water surface, stream bed, and banks as water flows downstream [3,4]. For example, Assel et al. [5] showed that mid-latitude lakes exhibit distinct thermal regimes characterized by one or more annual isothermal mixing events, owing to the maximum density of freshwater at 3.98 °C and varying degrees of ice formation depending on regional winter air temperature (TA) and lake depth. Thus, it is necessary to evaluate the spatial and temporal variation in TA, even though TW data in streams are generally scarcer, more difficult to obtain than TA data and rarely studied systematically [6,7].
TW varies both temporally [8] and spatially across watershed networks [9], and it plays critical roles as both a driver and an indicator of water quality. Conceptualizing a unique TW time series at every point in a watershed provides a full suite of spatially and temporally variable thermal conditions across the network [7,10]. Effective water resource management should therefore consider the links in TW variability between streams and rivers as part of an integrated management strategy [11,12,13]. Changes in TW can substantially affect water quality and aquatic ecosystems within watershed networks [14,15]. Additionally, TW is of particular importance in regulating biological processes within watersheds, e.g., [2] and has been identified as a critical factor in the restoration of freshwater aquatic ecosystems and water supplies, e.g., [16]. Therefore, understanding the relative importance of the factor controlling TW is essential for developing effective mitigation and adaptation strategies to address water warming under projected climate change.
When TW responses to TA changes are examined, the seasonal patterns of temporal variability during the observation period are critical for understanding increases or decreases in each stream or river, e.g., [17,18]. Previous studies, e.g., [19,20,21] investigating TW dynamics have been conducted in streams and rivers. Additionally, Pekarova et al. [22] showed that TW in rivers exhibits a hysteresis loop in response to decreasing TA. Thus, hysteresis loop analysis can be a useful approach for characterizing the way in which TW responds to climatic variability [23]. Furthermore, Rajwa et al. [24] reported that hysteresis loops can vary in shape and size depending on the hydrological conditions and season.
Despite these advances, most previous studies, e.g., [4,25,26,27] have focused on site-specific analyses or simple TA–TW relationships, limiting our understanding of longitudinal variation and dynamic thermal responses along stream-river continua. Moreover, TW responses to TA have not been comprehensively examined using an integrated framework that captures both phase-dependent hysteresis behavior and spatial variability across watershed networks.
In the Republic of Korea (ROK), 62.7% of the land area is forested, and tertiary streams comprise 88.9% of the total stream length [28,29]. The Han River, located in the geographic center of the ROK, is 469.7 km long and drains a watershed of 26,219 km2 [30]. It is an important source of water for drinking, irrigation, navigation, and, more recently, recreation for more than 20 million people [30,31]. Therefore, maintaining high water quality in this region is particularly important, e.g., [30,32].
The upper Han River basin contains extensive forest cover and serves as an important water source area [33]. Streams in the upper catchment generally have relatively low flow rates and include ephemeral streams compared with rivers and lakes in the lower catchment [34,35]. Moreover, Park and Lee [36] noted that water from streams meeting first-class water quality standards, flows into downstream rivers and lakes, thereby affecting drinking water supplies. Therefore, to develop effective water management systems for watershed networks, it is necessary to identify the relationships between streams and rivers in terms of the spatial dynamics of TW.
To characterize TW in flowing water across a watershed network, we applied an elasticity-based approach, termed temperature elasticity, in combination with hysteresis loop analysis from streams to rivers across the upper to lower reaches of the watershed. This approach can help reveal the direction and magnitude of TW responses to climatic variables such as TA using direct observational data, e.g., [37]. Elasticity has been widely used in hydrology, particularly in the form of precipitation elasticity of streamflow, which is defined as the proportional change in streamflow in response to a proportional change in precipitation [38,39,40]. By analogy, temperature elasticity provides a unitless and scalable metric for evaluating TW sensitivity to atmospheric forcing.
Therefore, the objectives of this study were to: (1) determine the temporal variation in TW responses to TA changes and (2) identify the spatial distribution of changes in TW from upper to lower reaches within a watershed. The primary contribution of this study is the integrated analysis of longitudinal variation and hysteresis in TA and TW relationships across the stream-river continuum. Specifically, this study provides a novel application of the elasticity framework to characterize spatial variability in TW responses along the longitudinal gradient from streams to river reaches, an aspect that has not been addressed in previous studies focused on site-specific analyses or limited spatial comparisons of TA–TW relationships [27,41].
2. Materials and Methods
2.1. Study Area
The study was conducted at five sites located in the upper (two sites), middle (two sites), and lower (one site) reaches, with longitudinal distances ranging from 71.6 to 287.4 km from the upper Han River basin in the Seorak region to each monitoring point in the northwestern Seoul metropolitan area, ROK (Figure 1, Table 1). The Han River is the longest river and has the largest basin in the ROK, with a total length of 469.7 km, a drainage area of 26,219 km2, and a mean water depth of approximately 6 m at the river center [30,42]. Among the five reaches within the Han River basin, two forested streams (upper reaches; Inje 1 and Inje 2 sites) have areas of 1.06 and 1.99 km2, respectively; three rivers (i.e., the two middle reaches; Chuncheon and Gapyeong sites) have areas of 4462.41 and 7149.71 km2, respectively; and one lower reach (Guri site) has an area of 20,865.70 km2 (Figure 1, Table 1). The streamside vegetation consists of forest cover and an understory that changes to open or closed types with a seasonal distribution in two streams, whereas, in three rivers, the riverside patches consist of unforested land, and the canopy remains open regardless of season, e.g., [40]. Based on the Köppen–Geiger classification system [43,44], the climate types of the study sites are Dwb (snow, winter dry, warm summer) at Inje 1 site, Dfb (snow, fully humid, warm summer) at Inje 2 site, and Dwa (snow, winter dry, hot summer) at Chuncheon, Gapyeong, and Guri sites. Climate classes are further subclassified according to precipitation and temperature conditions [45]. The study area is influenced by the East Asian monsoon, characterized by distinct summer (June–September) and winter (December–March) seasons, which strongly affect the seasonal patterns of temperature and precipitation [46,47].
Inje 1 (37°58′ N, 128°22′ E) drains forests located in the Inje-gun of northeastern ROK, and is situated in the uppermost reaches of the Han River basin and is located downstream of the Inje 2 site. The mean annual precipitation (mm ± standard deviation (SD)) over 20 years (2006–2025 years) at the Gilin AWS (Automatic Weather Station) is 1119.9 ± 215.1 mm (699.5–1522.5 mm). The mean annual temperature ± SD was 10.2 ± 0.6 °C (9.0–11.5 °C). The elevation ranges from 490 to 845 m above sea level (m a.s.l.). The soil is a slightly dry brown forest soil with underlying igneous rock. The stream channels have a length of 1.52 km and a slope of 0.23 m/m.
Inje 2 (38°04′ N, 128°22′ E) drains forests located in the Inje-gun of northeastern ROK, in the uppermost reaches of the Han River basin. The mean annual precipitation (mm ± SD) over 20 years at the Osaeg AWS is 1502.9 ± 310.6 mm (minimum–maximum values: 1058.5–2415.5 mm). The mean annual temperature ± SD is 11.5 ± 0.8 °C (10.2–12.8 °C). The elevation ranges from 580 to 1155 m a.s.l. The soil is a slightly dry brown forest soil with underlying igneous rock. The stream channels have a length of 3.16 km and a slope of 0.18 m/m.
Chuncheon (37°52′ N, 127°40′ E) is a lowland river located in the Chuncheon-si of mid-eastern ROK, situated in the upper region of the capital (Seoul) and the Han River basin, and holds important multiregional water sources, e.g., [48]. The mean annual precipitation ± SD over 20 years at the Chuncheon Automated Synoptic Observing System (ASOS) is 1365.3 ± 323.6 mm (674.4–2029.3 mm), and the mean annual temperature ± SD is 11.8 ± 0.7 °C (10.7–13.3 °C). The elevation ranges from 50 to 1708 m a.s.l. The river channels have a length of 137.35 km and a slope of 0.0077 m/m.
Gapyeong (37°39′ N, 127°22′ E) is a lowland river located in the Gapyeong-gun of central ROK, situated on the north branch of the Han River basin. The mean annual precipitation ± SD over 20 years at the Cheongpyeong AWS is 1403.2 ± 363.7 mm (737.0–1987.0 mm), and the mean annual temperature ± SD is 11.6 ± 0.7 °C (10.4–13.2 °C). The elevation ranges from 40 to 1708 m a.s.l. The channels have a length of 190.52 km and a slope of 0.0054 m/m.
Guri (37°33′ N, 127°06′ E) is a lowland river located in the Guri-si immediately east of Seoul, and is bordered by the Han River basin. The mean annual precipitation ± SD over 20 years at the Gangdong AWS is 1348.5 ± 357.1 mm (808.5–2029.5 mm), and the mean annual temperature ± SD was 13.2 ± 0.7 °C (12.0–14.8 °C). The elevation ranges from 14 to 1708 m a.s.l. The channels have a length of 233.49 km and a slope of 0.0045 m/m.
Figure 1.
Study sites in the Han River basin, Republic of Korea, including streams in the upper reaches (Inje 1 and Inje 2), rivers in the middle reaches (Chuncheon and Gapyeong), and the lower-reach river (Guri). The elevation of Mt. Seorak is 1708 m a.s.l.
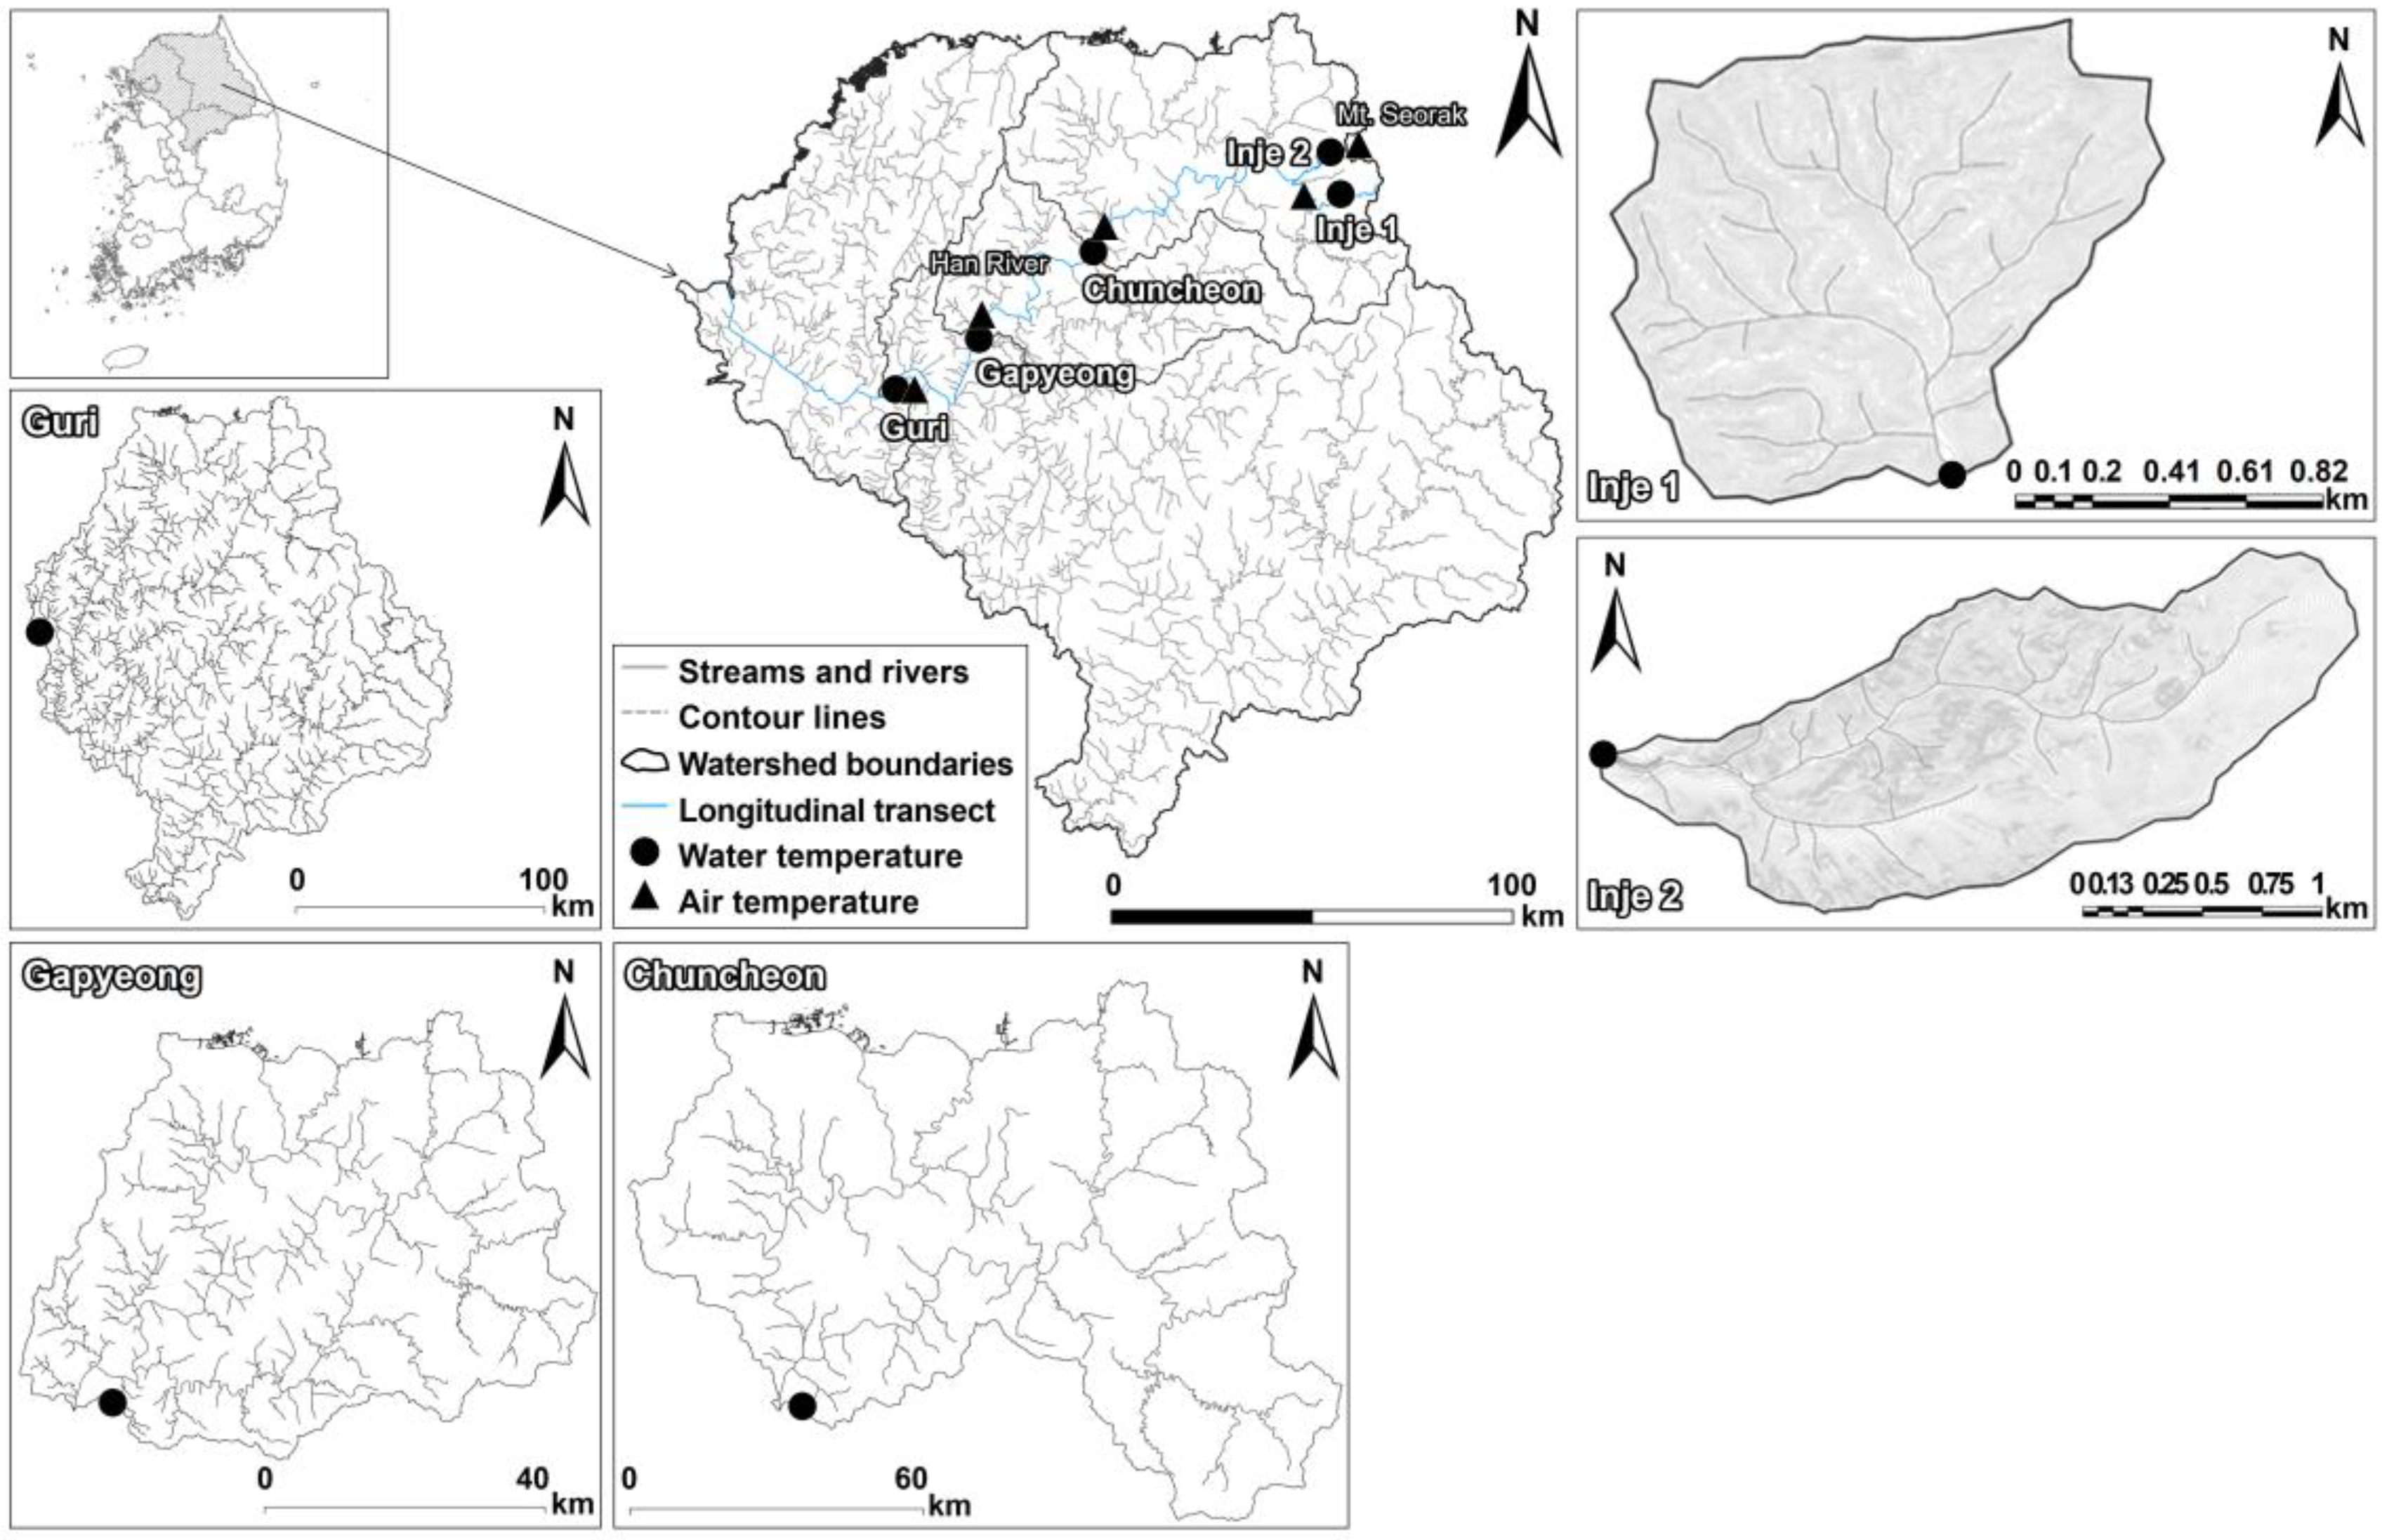
Table 1.
Summary of the observed sites from upper to lower reaches.
2.2. Field Monitoring and Data Analysis
Field monitoring was conducted from 2020 to 2025, with analyses restricted to the May–October period of each year. Monitoring was not conducted during winter or early spring (i.e., December to March) because the stream and river watersheds are frozen during this period. TW at upper reaches was measured using capacitance water stage data loggers (OTT-Orpheus Mini Water Level Logger, OTT Messtechnik, Kempten, Germany) at 10 min intervals. TW was monitored at 5 min intervals at middle and lower reaches using YSI EXO2 multiparameter sondes at the Chuncheon and Gapyeong sites and a YSI 6600 multiparameter sonde at the Guri site. TW data for the three river sites were obtained from the Uiam, Gapyeong, and Guri stations of the National Institute of Environmental Research. These datasets were comparable in terms of measurement depth and temporal resolution, and consistency across sources was ensured through sensor calibration and outlier screening. TA data were obtained from Gilin AWS in Inje 1 site, Osaeg AWS in Inje 2 site, Chuncheon ASOS in Chuncheon site, Cheongpyeong AWS in Gapyeong site, and Gangdong AWS in Guri site (Figure 1). Weather stations used for TA monitoring were selected based on proximity to TW measurement sites (2.7–9.7 km) and are managed by the Korea Meteorological Administration Weather Data Service.
To analyze the relationship between TA and TW across the upper (two forested streams), middle (two rivers), and lower (one river) reaches, hysteresis loops were constructed based on the TA and TW time series, following the methods used in previous studies [49,50,51]. TA and TW data from 2020 to 2025 were classified into warming (May–July) and cooling (August–October) phases based on previous studies of seasonal variation in TA and TW [50,52,53]. The air–water temperature difference (AWTD) was calculated as the difference between the daily TA and TW values, e.g., [54].
The temperature elasticity approach may be defined as the proportional change in TW resulting from a change in TA at any given time [37,55]. In reality, the term elasticity used in a previous study, which originated in economics (e.g., price elasticity of demand), was subsequently adopted by many disciplines as a measure of responsiveness [56] and has become a popular tool among empiricists because of its independent units and simplified data analysis. A well-known aspect of elasticity in hydrology is the precipitation elasticity of streamflow, which is defined as the proportional change in river flow in response to a proportional change in precipitation [38,39,40]. Thus, we designed temperature elasticity of the nonparametric estimator, e.g., [38] for TW with respect to TA (mean daily dataset) on the hysteresis loop (as warming and cooling phases), as follows:
where TA and TW denote the air and water temperatures at a given time, respectively, and and denote the daily mean air (TA) and water (TW) temperatures during the May–October observation period.
The temperature elasticity approach has some merits over other techniques, including that the whole function of temperature elasticity is characterized by its median value, which minimizes the impact of outliers (i.e., flood and drought). The median is used to minimize the impact of outliers, such as extreme events, which have the greatest effect on biota [37,57]. temperature elasticity is also dimensionless, which simplifies data analysis.
Statistical analyses were conducted via one-way analysis of variance followed by the Kruskal–Wallis test, depending on the assumptions of normality and variance equality, e.g., [58], to compare the mean differences in TW and TA among the five reaches during the observation period. All statistical analyses were performed using IBM SPSS Statistics 30 (IBM Corp., Armonk, NY, USA) and R version 4.1.2 (R Foundation for Statistical Computing, Vienna, Austria).
3. Results
3.1. Water Temperatures Responses to Air Temperature Changes
The daily mean TA and TW during the observation period ranged from 4.5 to 32.3 and 6.9 to 30.6 °C, respectively, across the upper (Inje 1 and Inje 2 sites), middle (Chuncheon and Gapyeong sites), and lower (Guri site) reaches (Figure 2a,b). TW exhibited clear spatial variation, whereas TA showed relatively limited spatial variation (Figure 2).
The daily mean TA (±SD) among the five reaches was similar, ranging from 19.2 to 22.0 °C (±5.1–5.4 °C). There was a significant difference in mean TA among the upper, middle, and lower reaches at the 99% confidence level (p < 0.001) (Table 2; Figure 2). The daily mean TW among the five reaches was lowest in the upper reaches (14.6 ± 3.2 and 14.3 ± 2.9 °C), followed by the middle reaches (20.6 ± 3.9 and 21.0 ± 3.5 °C), and highest in the lower reaches (21.9 ± 3.7 °C) (Table 2; Figure 2). There was a significant difference in the mean TW between the upper, middle, and lower reaches at the 99% confidence level (p < 0.001) (Figure 2b). The TW responses in the upper reaches (Inje 1 and Inje 2 sites) were distributed over a relatively wide range, whereas those from the middle (Chuncheon and Gapyeong sites) to the lower (Guri sites) reaches exhibited a narrower range.
The mean AWTD over the 6-year period ranged from −0.6 to 5.5 °C (±3.2–3.6) °C across the upper, middle, and lower reaches, spanning longitudinal distances of 71.6 to 287.4 km from the upper Han River basin in the mountainous region to each monitoring point (Figure 3). The mean AWTDs in the two upper reaches (Inje 1 and Inje 2 sites) were 4.6 and 5.5 °C (±3.2 and 3.6 °C), whereas there was no difference between TA and TW in the middle or lower reaches (Figure 3). The AWTD differed significantly between the upper, middle, and lower reaches at the 99% confidence level (p < 0.001), with a significant difference also observed between the middle (Gapyeong site) and lower (Guri site) reaches.
Table 2.
Summary of daily mean air and water temperatures at the five reaches.
Figure 2.
Box plots of (a) daily mean air (TA) and (b) water (TW) temperature at all sites during the observation period. The upper and lower hinges represent the first and third quartiles, respectively (25th and 75th percentiles, respectively). Whiskers extend to 1.5 times the interquartile range, and data points beyond the whiskers represent outliers. Different letters (a, b, c, and d) denote statistically significant differences among periods (p < 0.001).
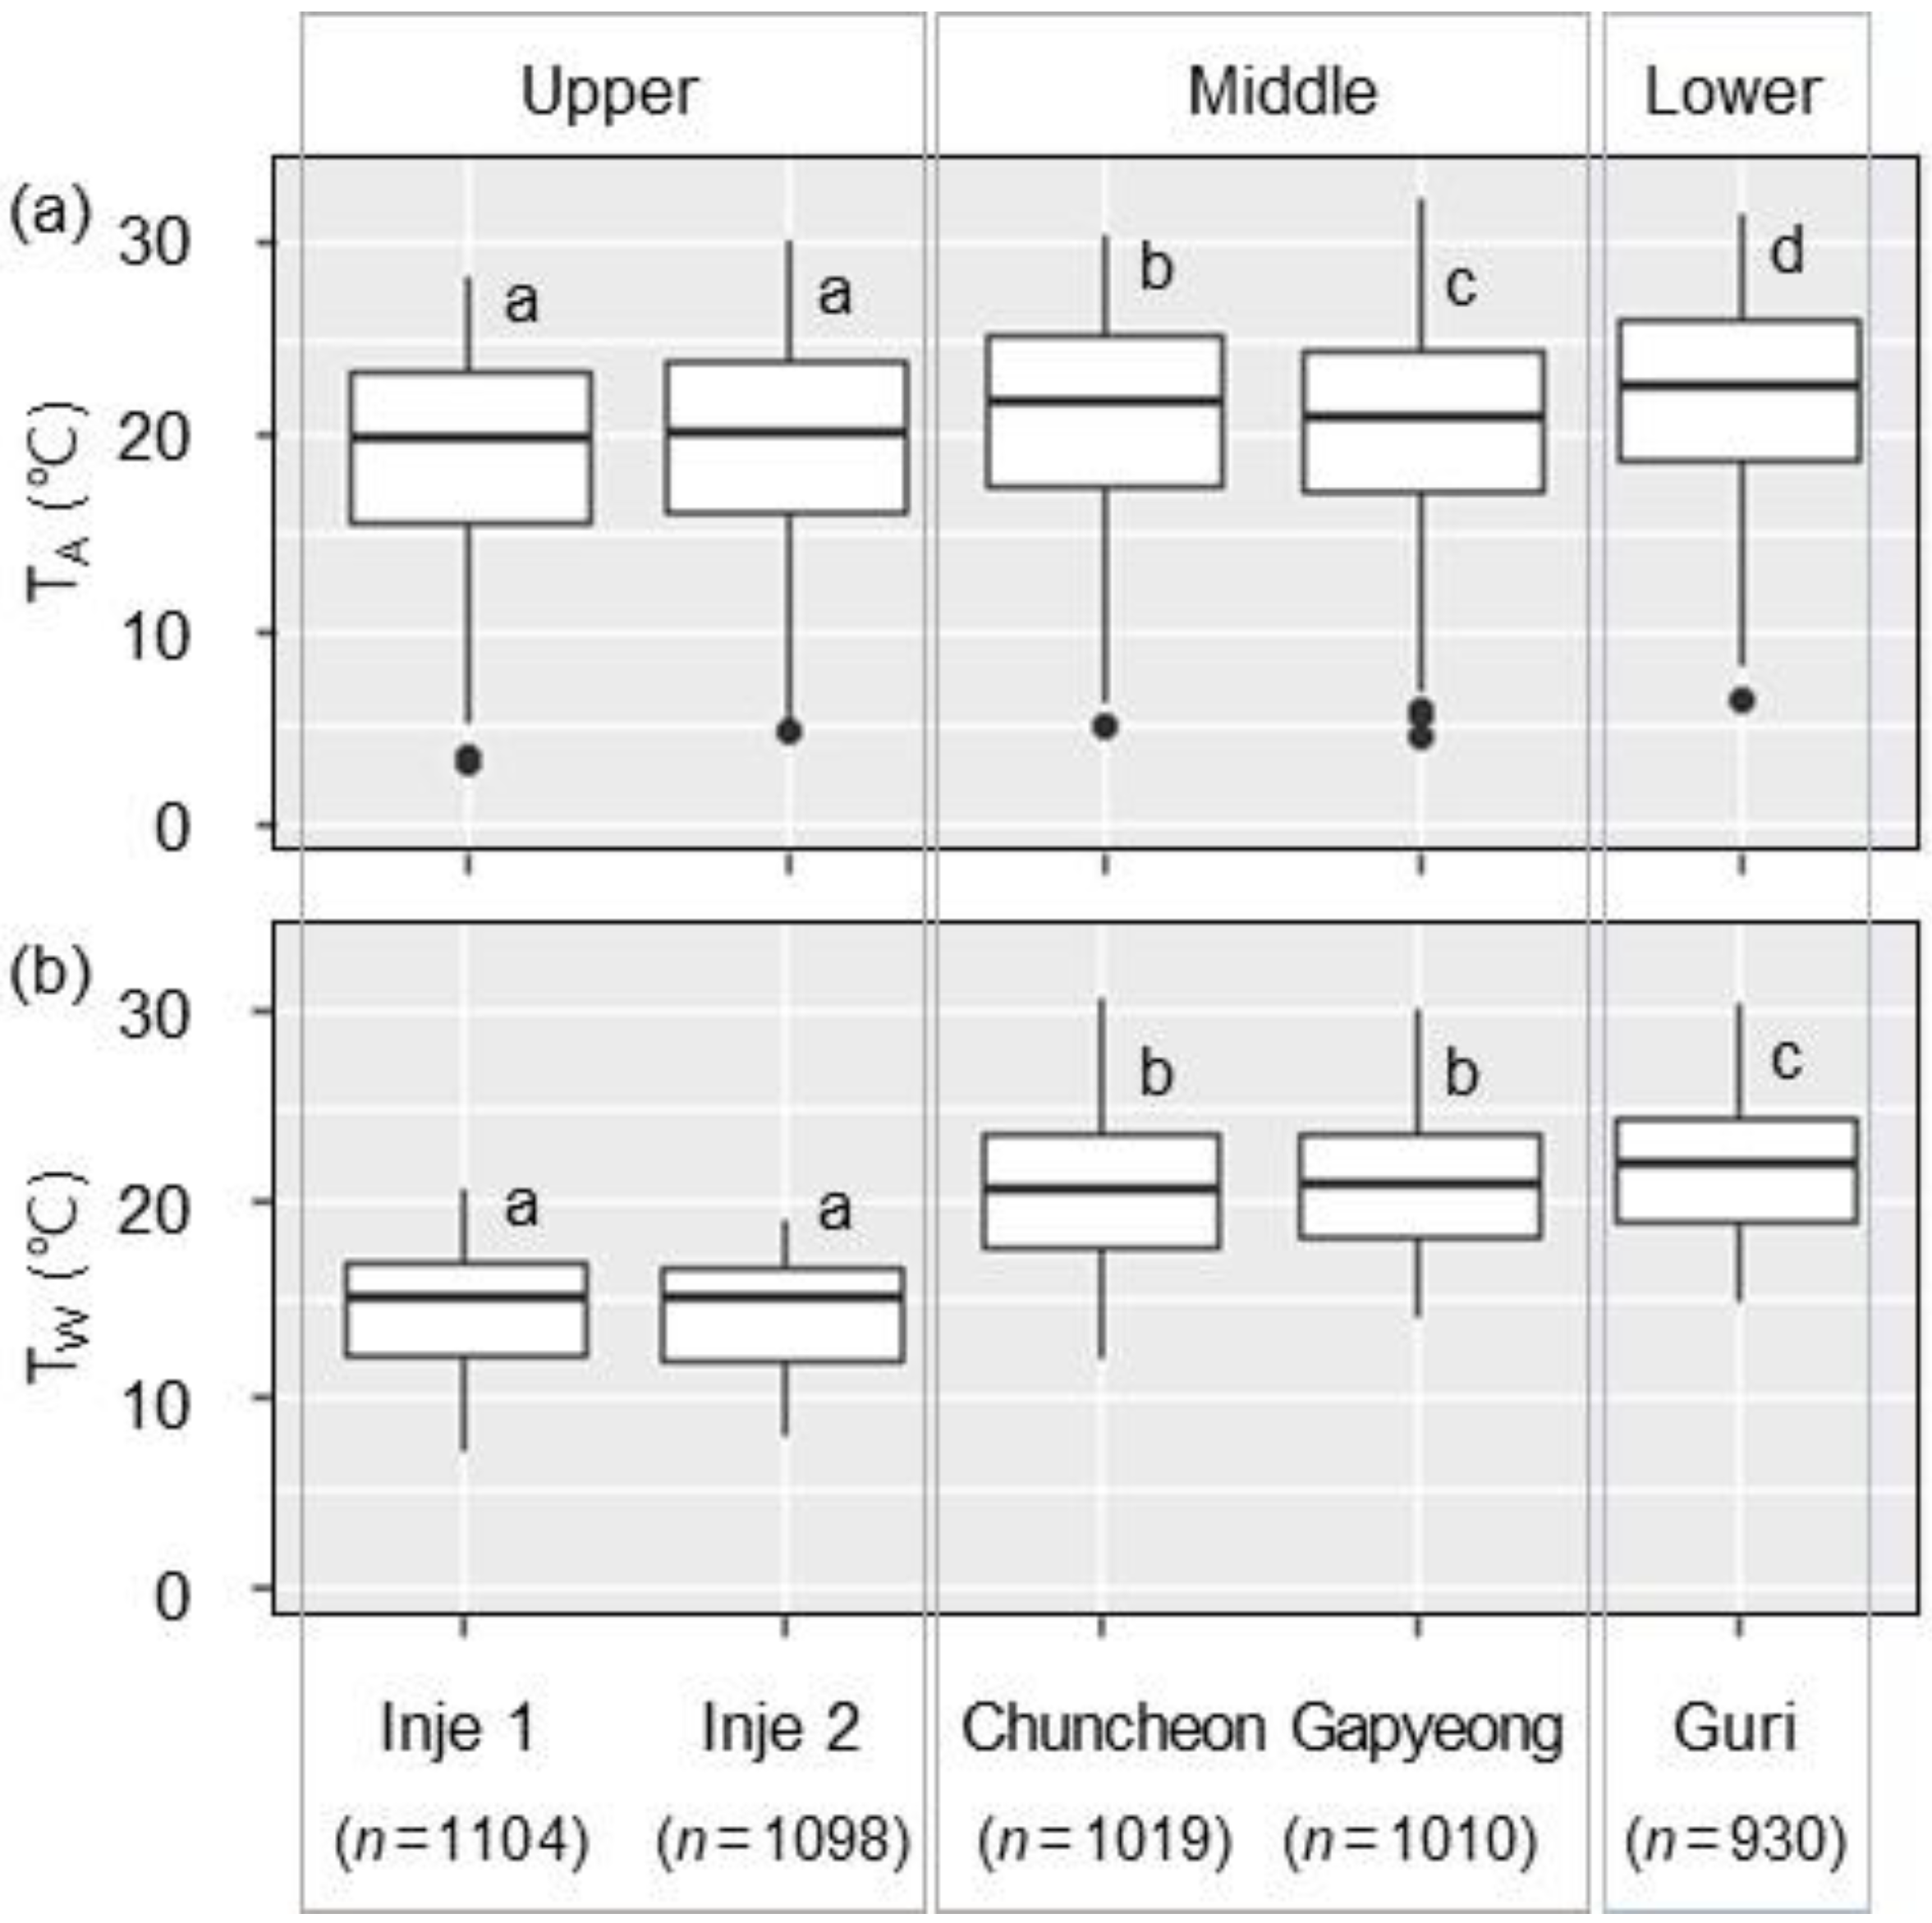
Figure 3.
Maximum (◆), minimum (▲), and mean (◯) values for air–water temperature difference (AWTD; TA–TW) in upper (Inje 1 and Inje 2 sites), middle (Chuncheon and Gapyeong sites) and lower (Guri site) reaches from the upper Han River basin in the Seorak region to each monitoring point.
3.2. Hysteresis Loop Analysis Between Air and Water Temperatures
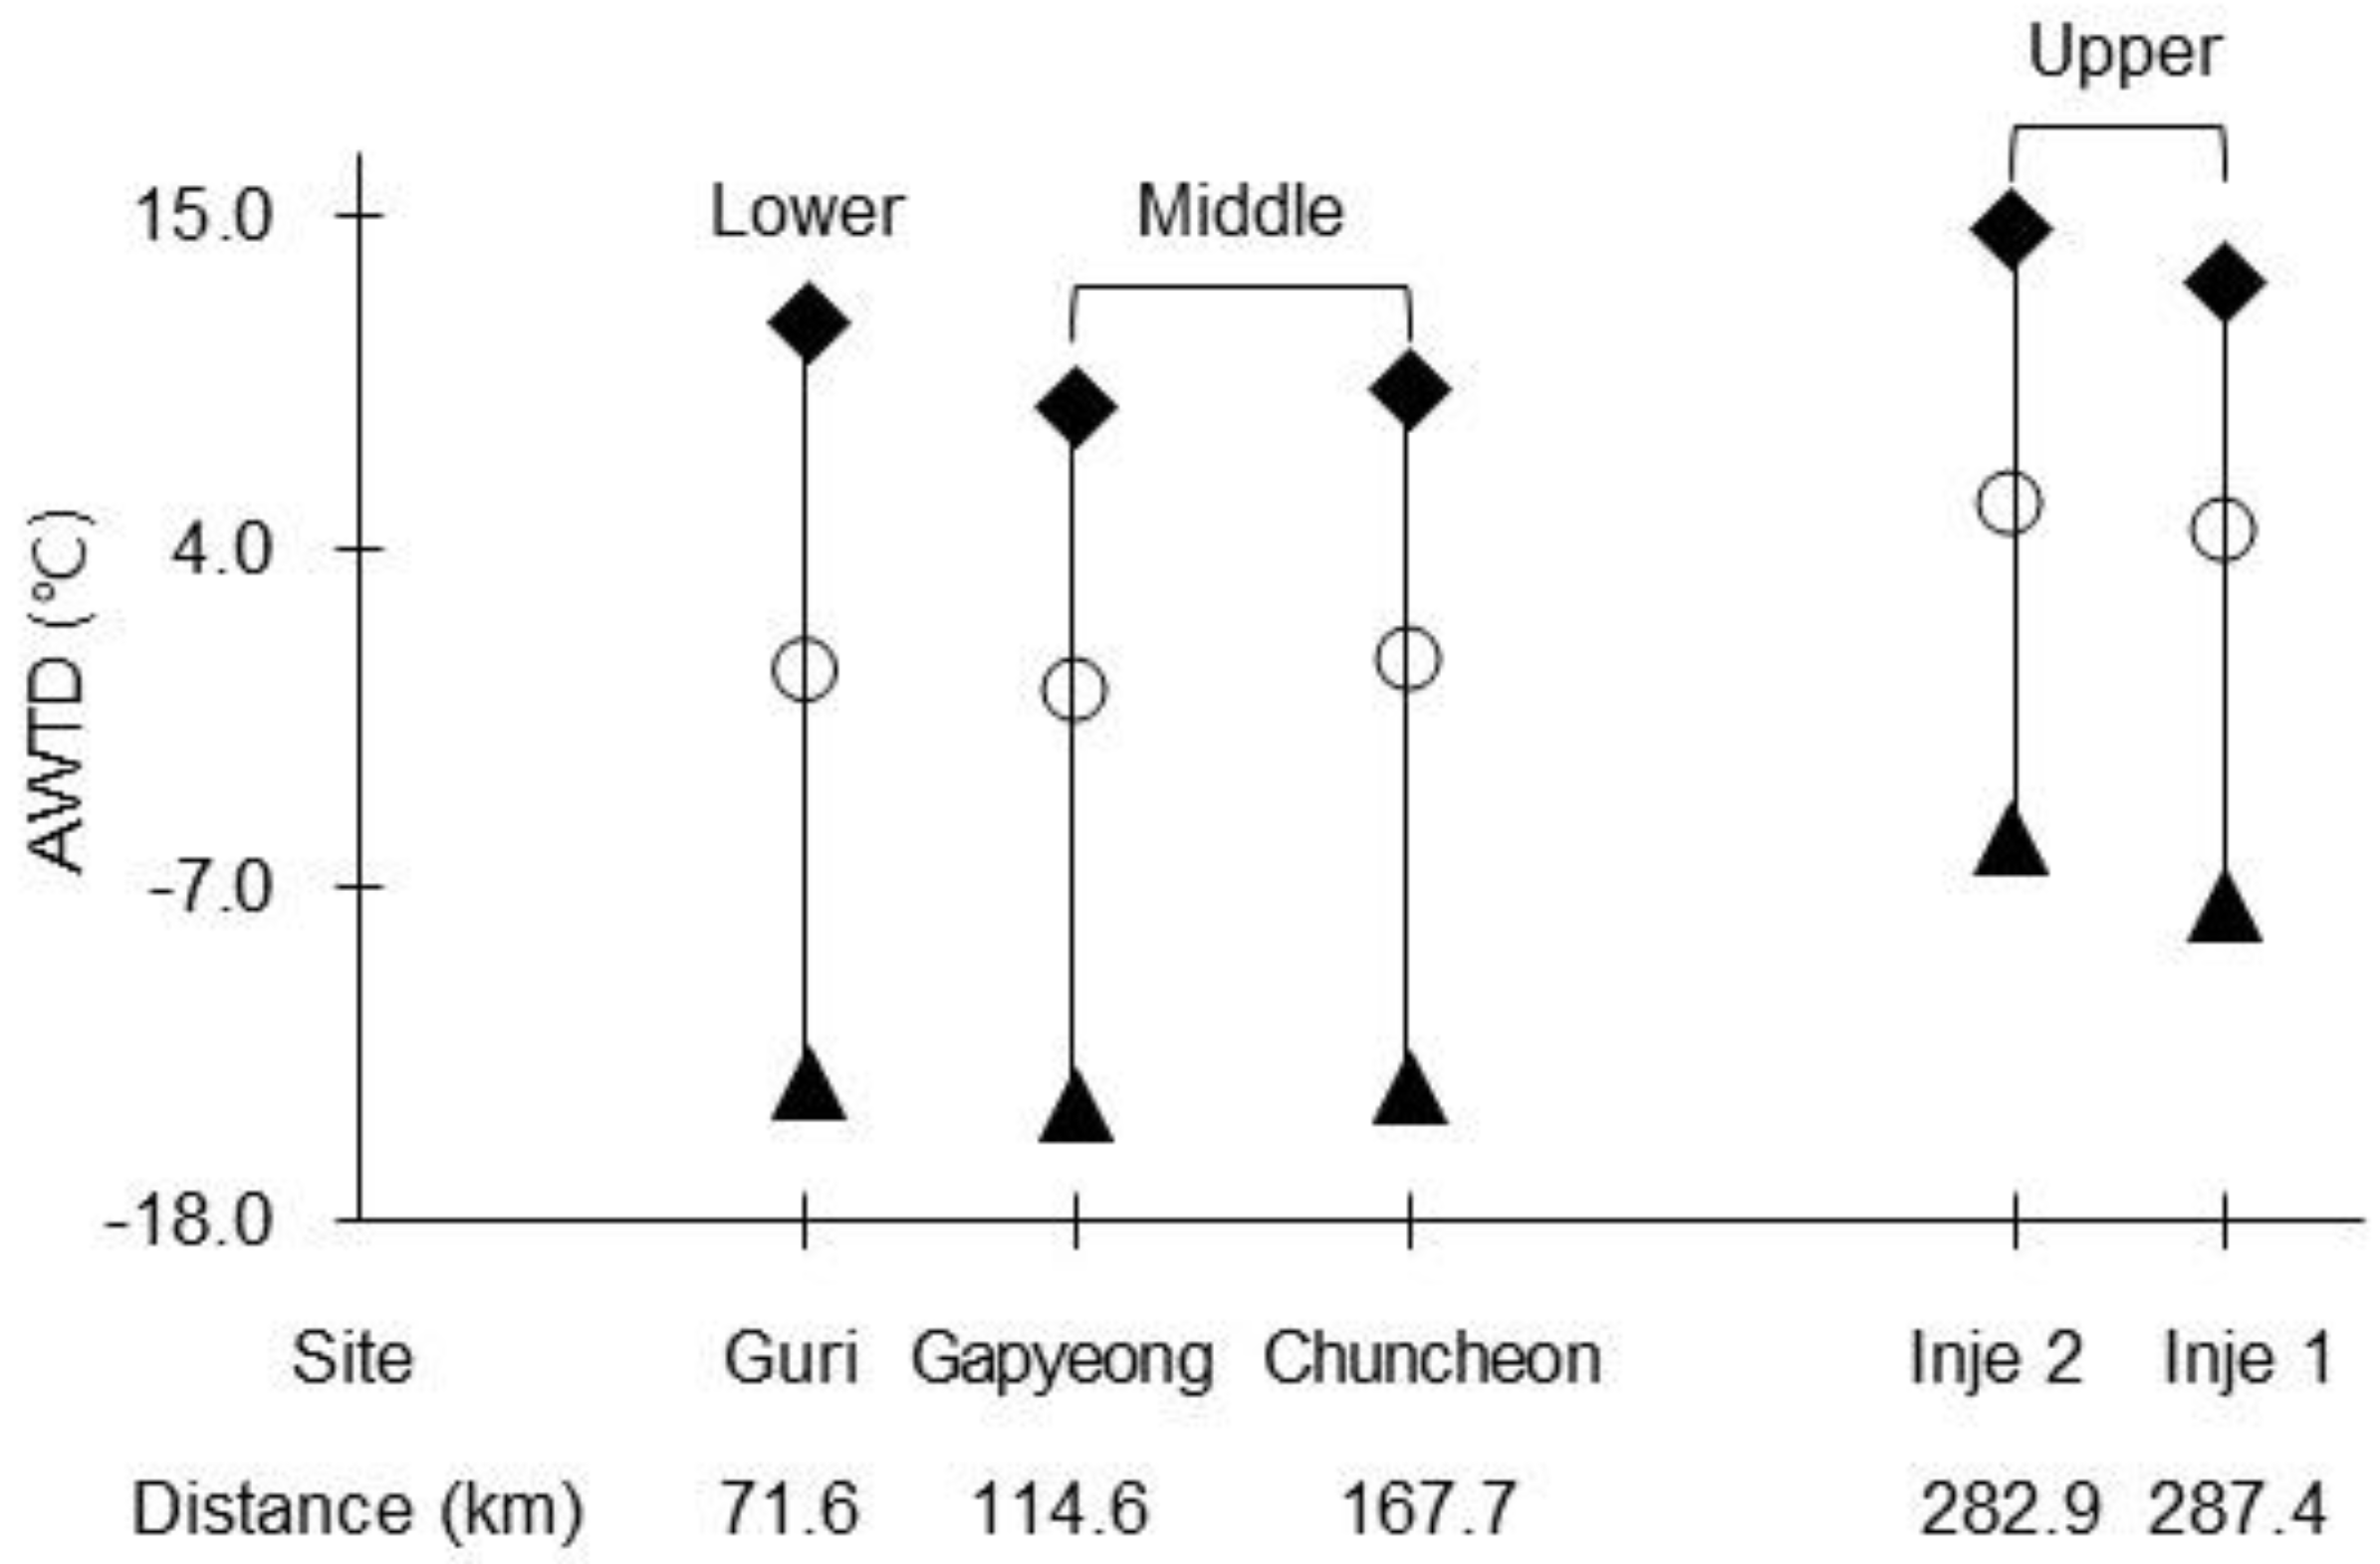
The TW changes in response to TA variations formed distinct curve shapes, indicating a hysteresis loop between TA and TW. From the hysteretic loops, the relationship between TA and TW was analyzed by separating the observation period (excluding winter) into warming (May–July) and cooling (August–October) phases (Figure 4). As shown in Figure 4a–e, in the upper reaches (Inje 1 and Inje 2 sites), TW exhibited a lower temperature response than TA during the warming phase, whereas TW and TA exhibited similar responses during the cooling phase (Figure 4f–i). Compared with the middle and lower reaches (Chuncheon, Gapyeong, and Guri sites), the upper reaches (Inje 1 and Inje 2) showed a greater TA–TW difference during the warming phase (approximately 4–5 °C), while the difference became smaller during the cooling phase (approximately 4–6 °C) (Figure 4).
The relationships between TA and TW were strong (R2 values of 0.52–0.88) and were significant at all sites in both periods (p < 0.001) (Figure 4, Table 3). Because the analysis is based on daily time series data, some degree of autocorrelation may be present, potentially affecting the magnitude of statistical metrics such as the F-values reported in Table 3. However, given the large sample size and the consistency of patterns across sites, the overall relationships are considered robust. The regression slopes showed distinct temporal and spatial variations in thermal sensitivity (Table 3). In both phases, TW increased with increasing TA, exhibiting a linear relationship. However, the slope during the warming phase (0.428–0.722) was steeper than that during the cooling phase (0.459–0.620) (Table 3). A comparison of the five reaches showed that the slope in the middle reaches was the steepest in the warming phase (0.722 and 0.661, respectively), whereas the slopes became similar across all reaches during the cooling phase (0.459–0.620). Moreover, the upper reaches showed the lowest slopes (0.428–0.520) during both phases (Table 3). As shown in Figure 4a–j, the maximum correlation between TA and TW differed between the two phases, with correlation coefficients ranging from 0.724 to 0.936 across all sites (p < 0.001). TA and TW were most strongly correlated with the cooling phase, with a correlation coefficient of 0.936 (p < 0.001) for a site in the upper reach (Inje 1 site) and 0.909 (p < 0.001) for the site in the lower reach (Guri site) (Figure 4f,j).
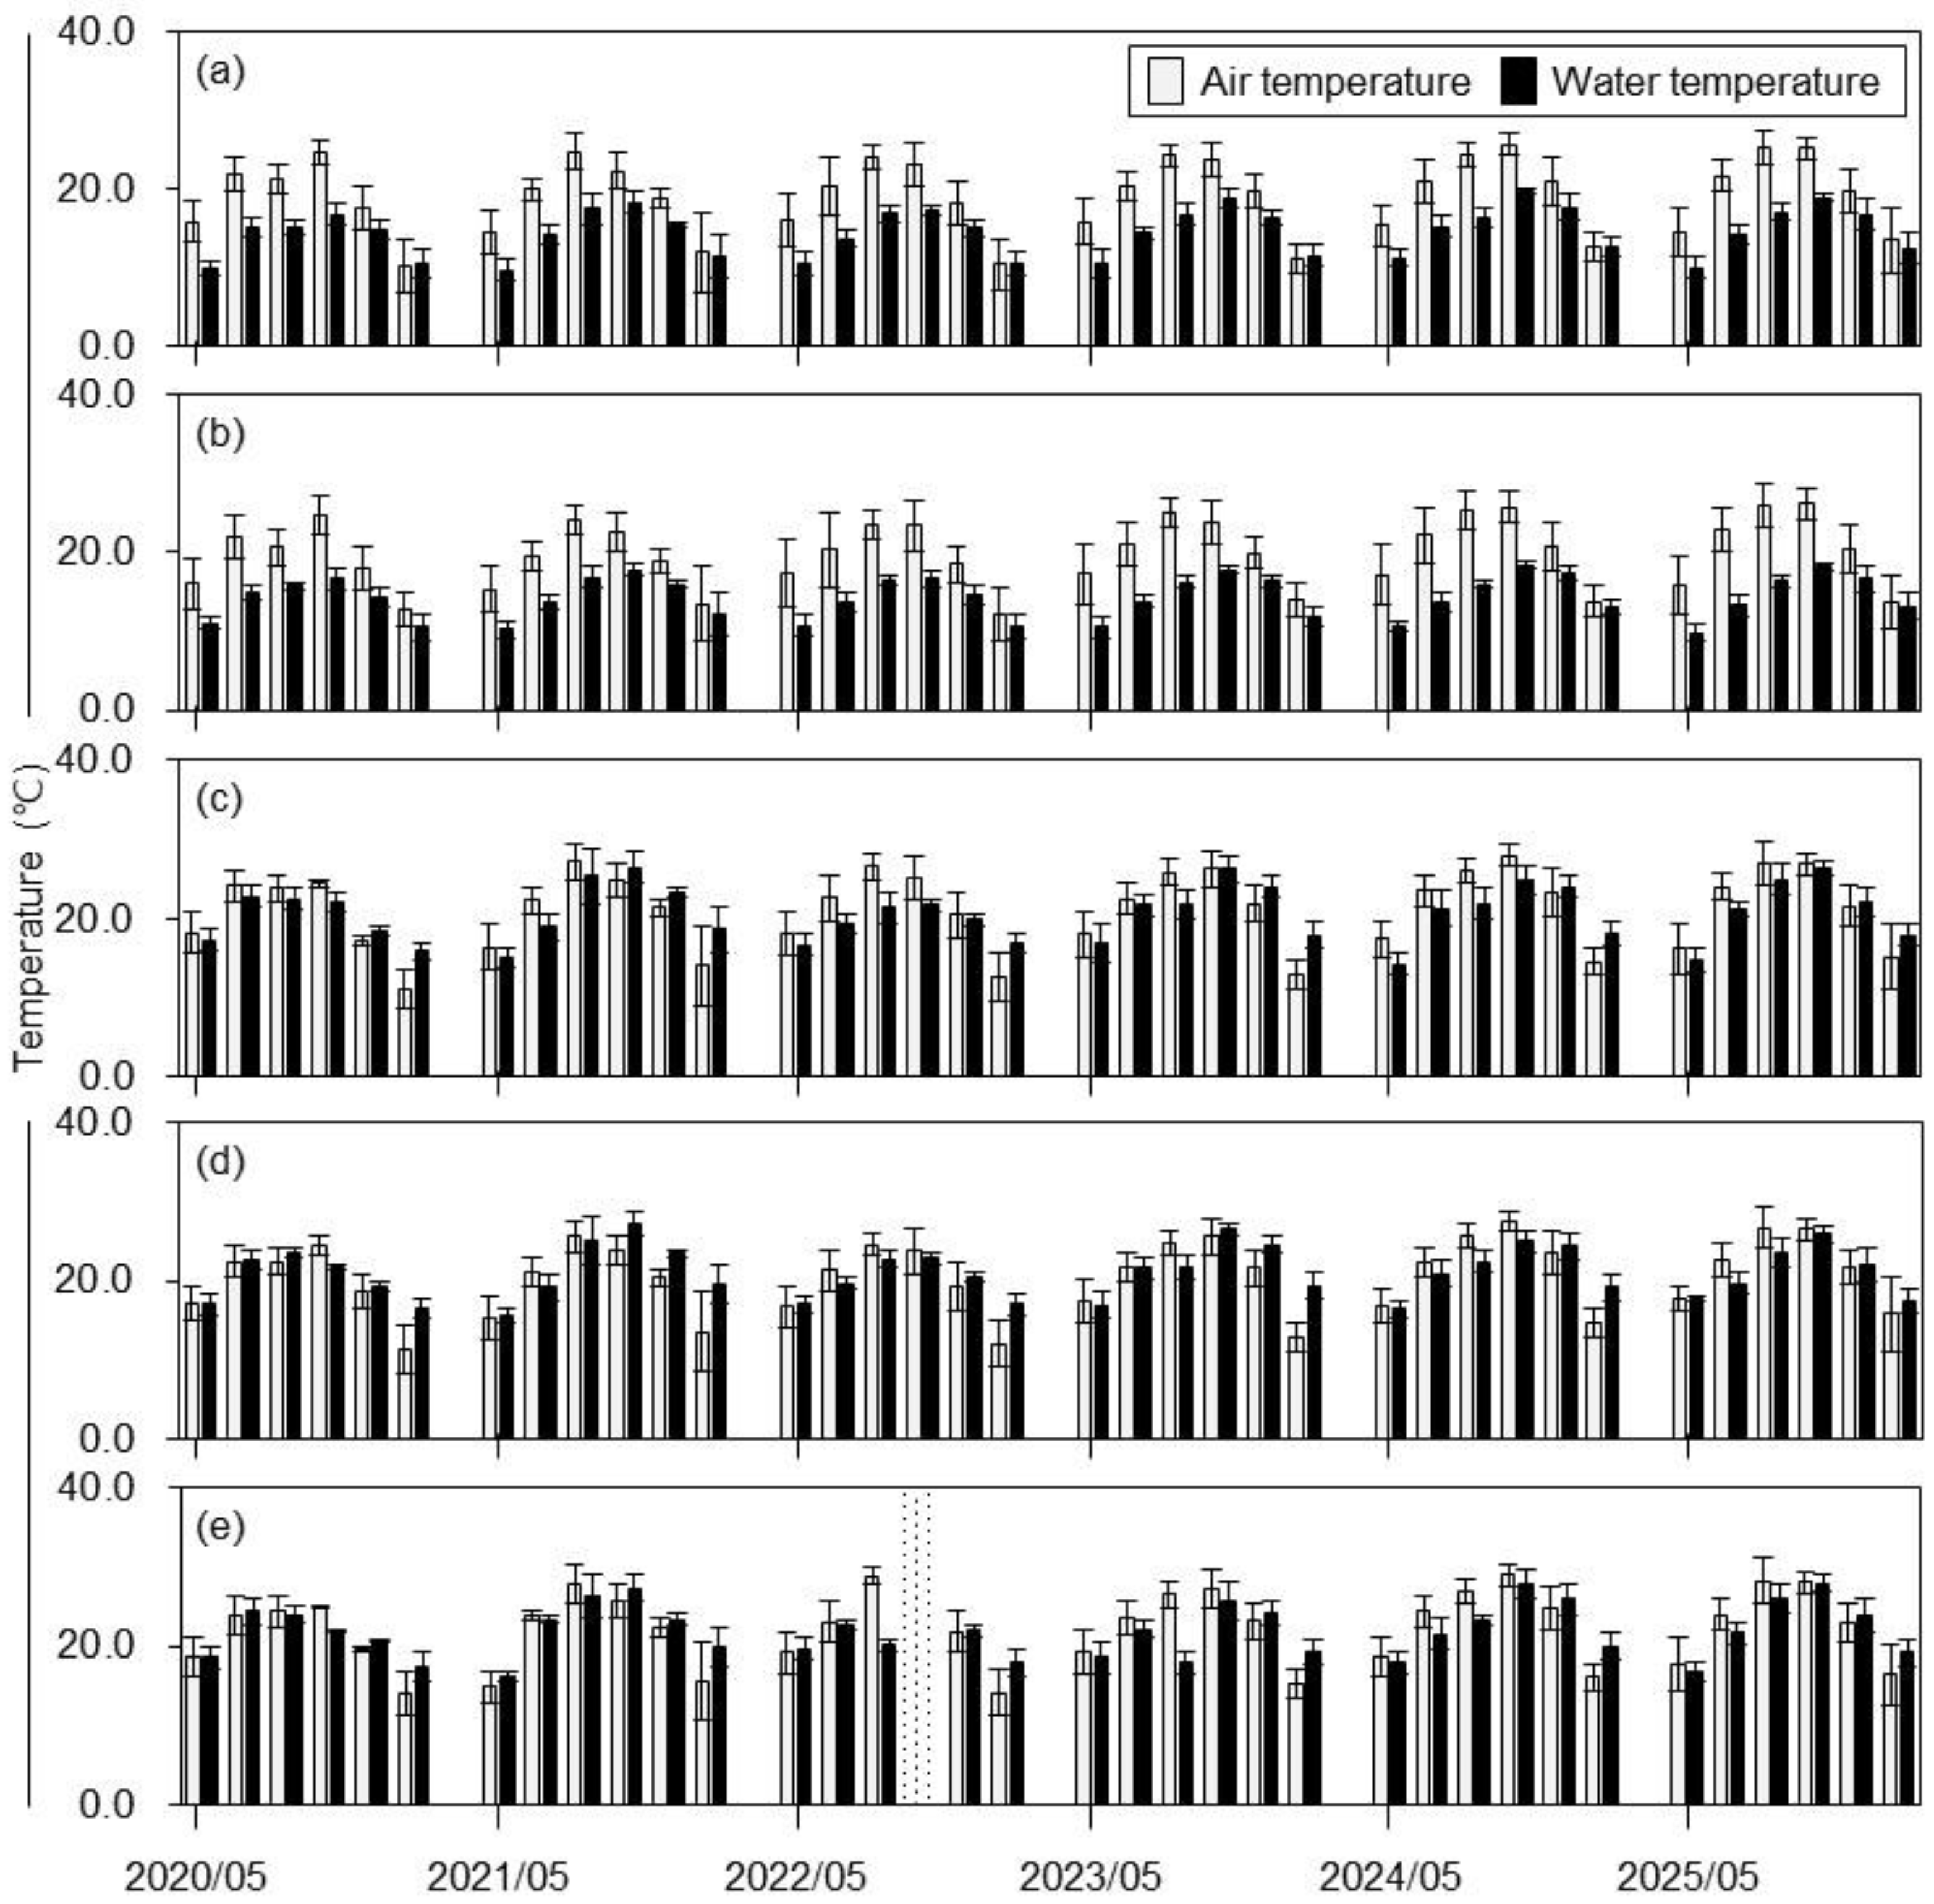
Regarding the relationship between monthly mean TA and TW (i.e., its primary controlling factor), TA, the minimum and maximum fluctuations in TA exhibited similar patterns between the two phases across all five reaches. In contrast, TW showed larger minimum and maximum fluctuations during the warming phase than during the cooling phase (Figure 5a–e). The five reaches exhibited relatively narrow ranges of minimum and maximum TW fluctuations (approximately 6–7 °C) in both phases. Notably, phases-dependent differences in TW fluctuations were not pronounced in middle and lower reaches (Chuncheon, Gapyeong, and Guri sites) (Figure 5c,d). In contrast, the upper reaches (Inje 1 and Inje 2 sites) showed a distinct reach-dependent pattern, with TW fluctuations during the warming phase occurring at lower temperature ranges than those during the cooling phase, indicating a clear hysteretic response (Figure 5a,b).
Table 3.
Summary of the regression analyses for daily mean air and water temperatures.
Figure 4.
Relationships between daily mean air (TA) and water (TW) temperatures determined by the hysteresis loop: (a–e) warming and (f–j) cooling phases in upper (Inje 1 and Inje 2 sites) and middle (Chuncheon and Gapyeong sites), and lower (Guri site) reaches during each observation period. Thick lines represent linear fits estimated by regression analysis for the hysteresis loop. r and p values indicate the correlation coefficient and significance, respectively.
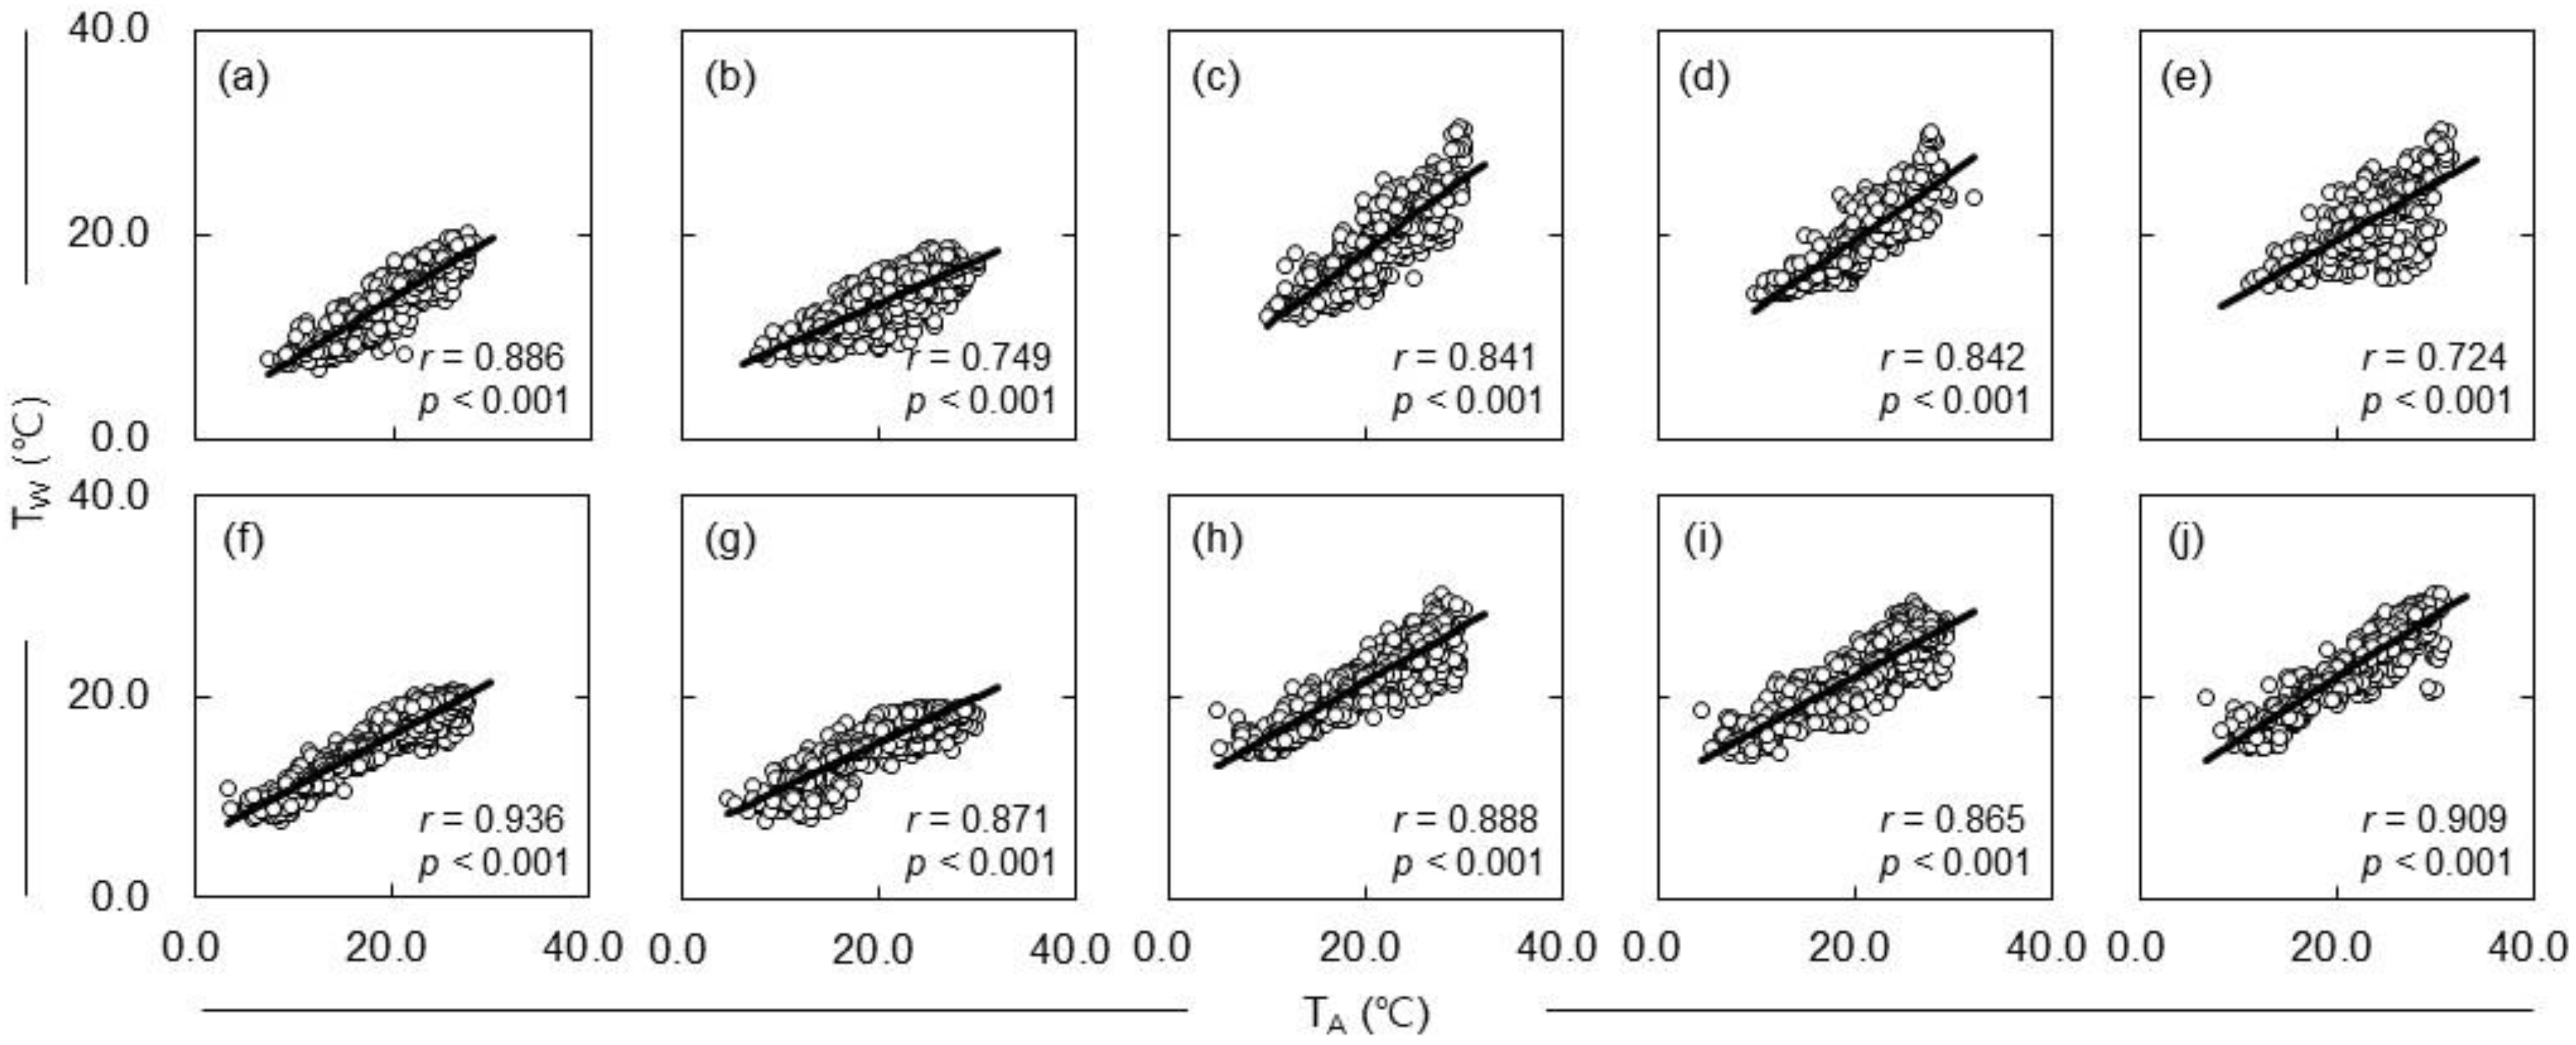
Figure 5.
Monthly mean air (TA) and water (TW) temperatures showing the range between maximum and minimum values at five sites: (a,b) upper (Inje 1 and Inje 2 sites), (c,d) middle (Chuncheon and Gapyeong sites), and (e) lower (Guri site) reaches. The dotted area indicates no data.
3.3. Approach of Temperature Elasticity on the Hysteresis Loop
For spatial interpretation along the longitudinal gradient, the five monitoring sites were grouped into three reaches: upper, middle, and lower reaches. The temperature elasticity was then calculated for each of the three reaches using monthly observations during the study period (Figure 6). Temperature elasticity value across the three reaches ranged from −0.940 to 1.814 over the 36-month observation period. The temperature elasticity values were predominantly positive across all three reaches; however, those in the middle and lower reaches tended to be lower than those in the upper reaches, and occasionally exhibited negative excursions (Figure 6a–c). Negative temperature elasticity values were occasionally observed, indicating a temporary decoupling between TA and TW.
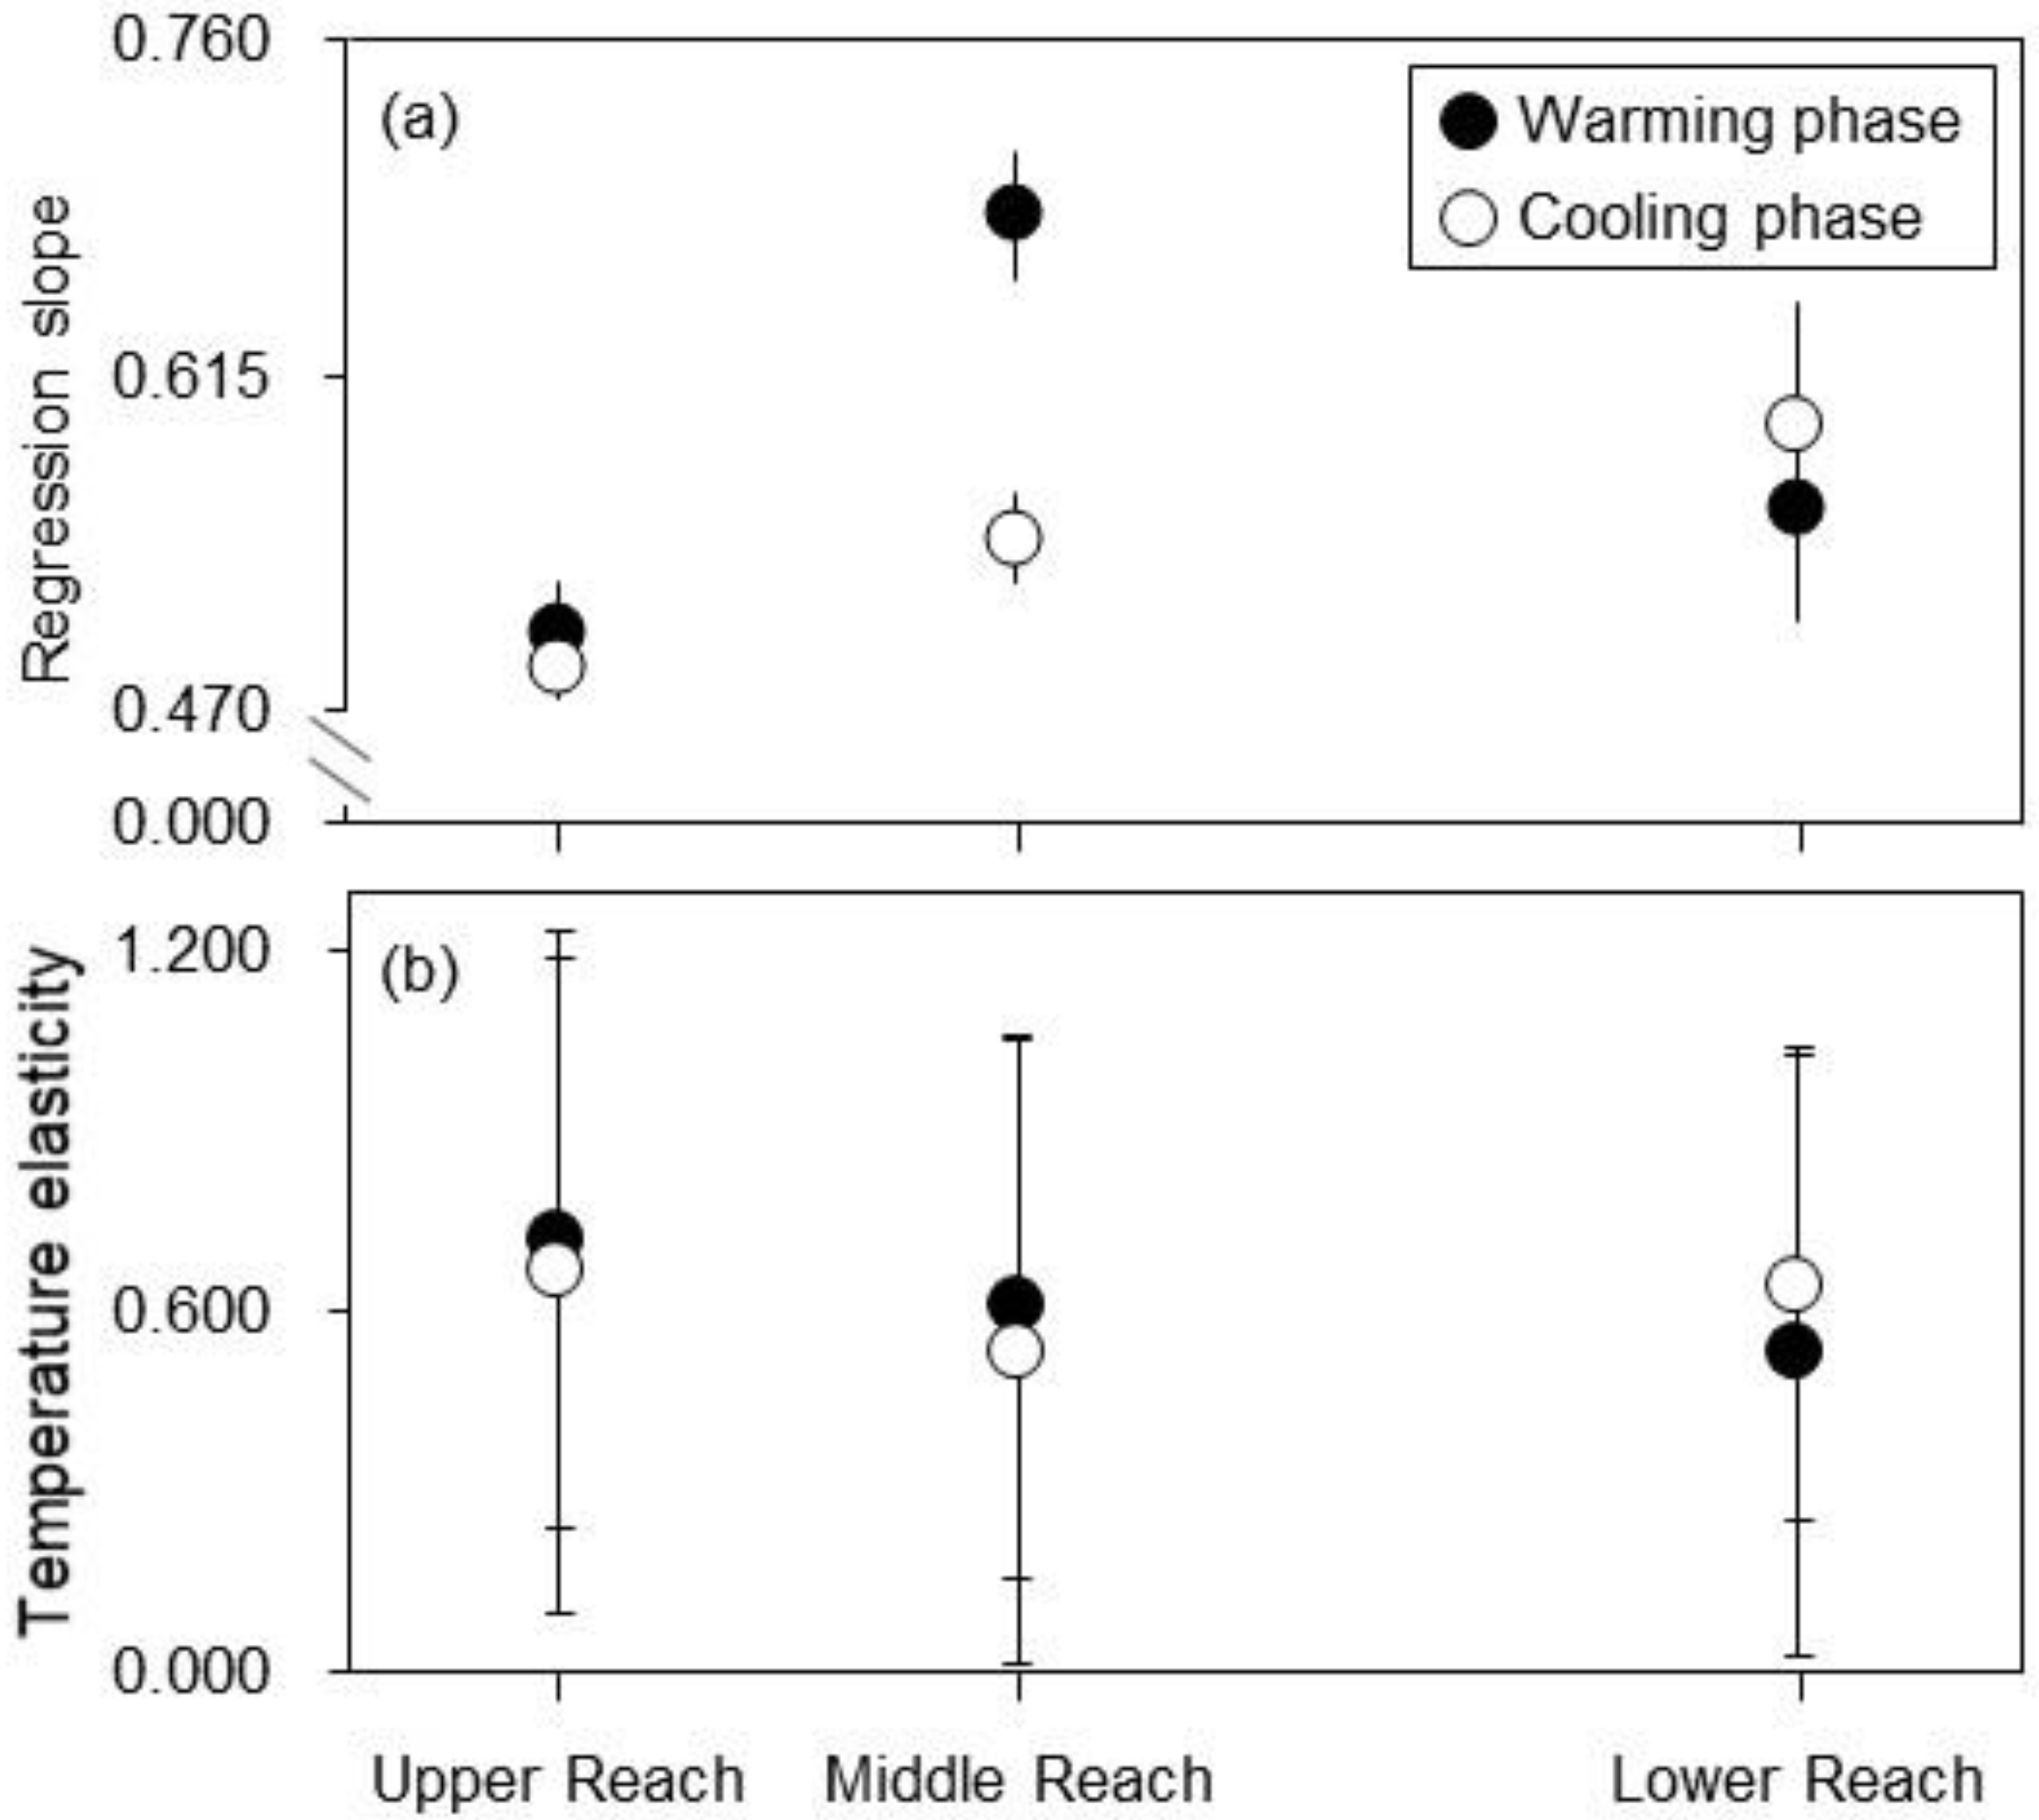
Spatial changes in TW responses to TA from upper to the lower reaches showed opposite patterns, separated into two different phases (Table 4; Figure 7). The regression slope increased toward the lower reach, whereas the temperature elasticity decreased, with the most pronounced changes observed in the slope during the cooling phase (0.489–0.620) and the temperature elasticity during the warming phase (0.714–0.532).
Under these conditions, the regression slope was steepest in the Middle Reach (0.684) of the warming phase and in the lower reach (0.620) of the cooling phase (Table 4; Figure 7a). The regression slope during the warming phase increased from the upper to the middle reaches and slightly decreased toward the lower reach (0.505–0.557), in particular the regression slope of the cooling phase increased progressively from the upper to lower reaches (0.489–0.545) (Figure 7a). From the hysteresis loops, the mean temperature elasticity (±SD) was 0.532–0.714 (±0.452–0.507) and 0.533–0.667 (±0.388–0.567) in the warming and cooling phases, respectively (Table 4; Figure 7b). The temperature elasticity showed relatively small spatial differences among the reaches (Figure 7b). Here, during the warming phase, the temperature elasticity decreased from the upper to the lower reaches (0.714–0.532), besides the temperature elasticity decreased from the upper to the middle reaches and slightly increased toward the lower reach (0.667–0.641) (Figure 7b).
Figure 6.
Temperature elasticity in (a) upper (Inje 1 and Inje 2 sites), (b) middle (Chuncheon and Gapyeong sites), and (c) lower (Guri site) reaches during the warming and cooling phases throughout the observation period. The horizontal dashed lines indicate the mean temperature elasticity value. The dotted area indicates no data.
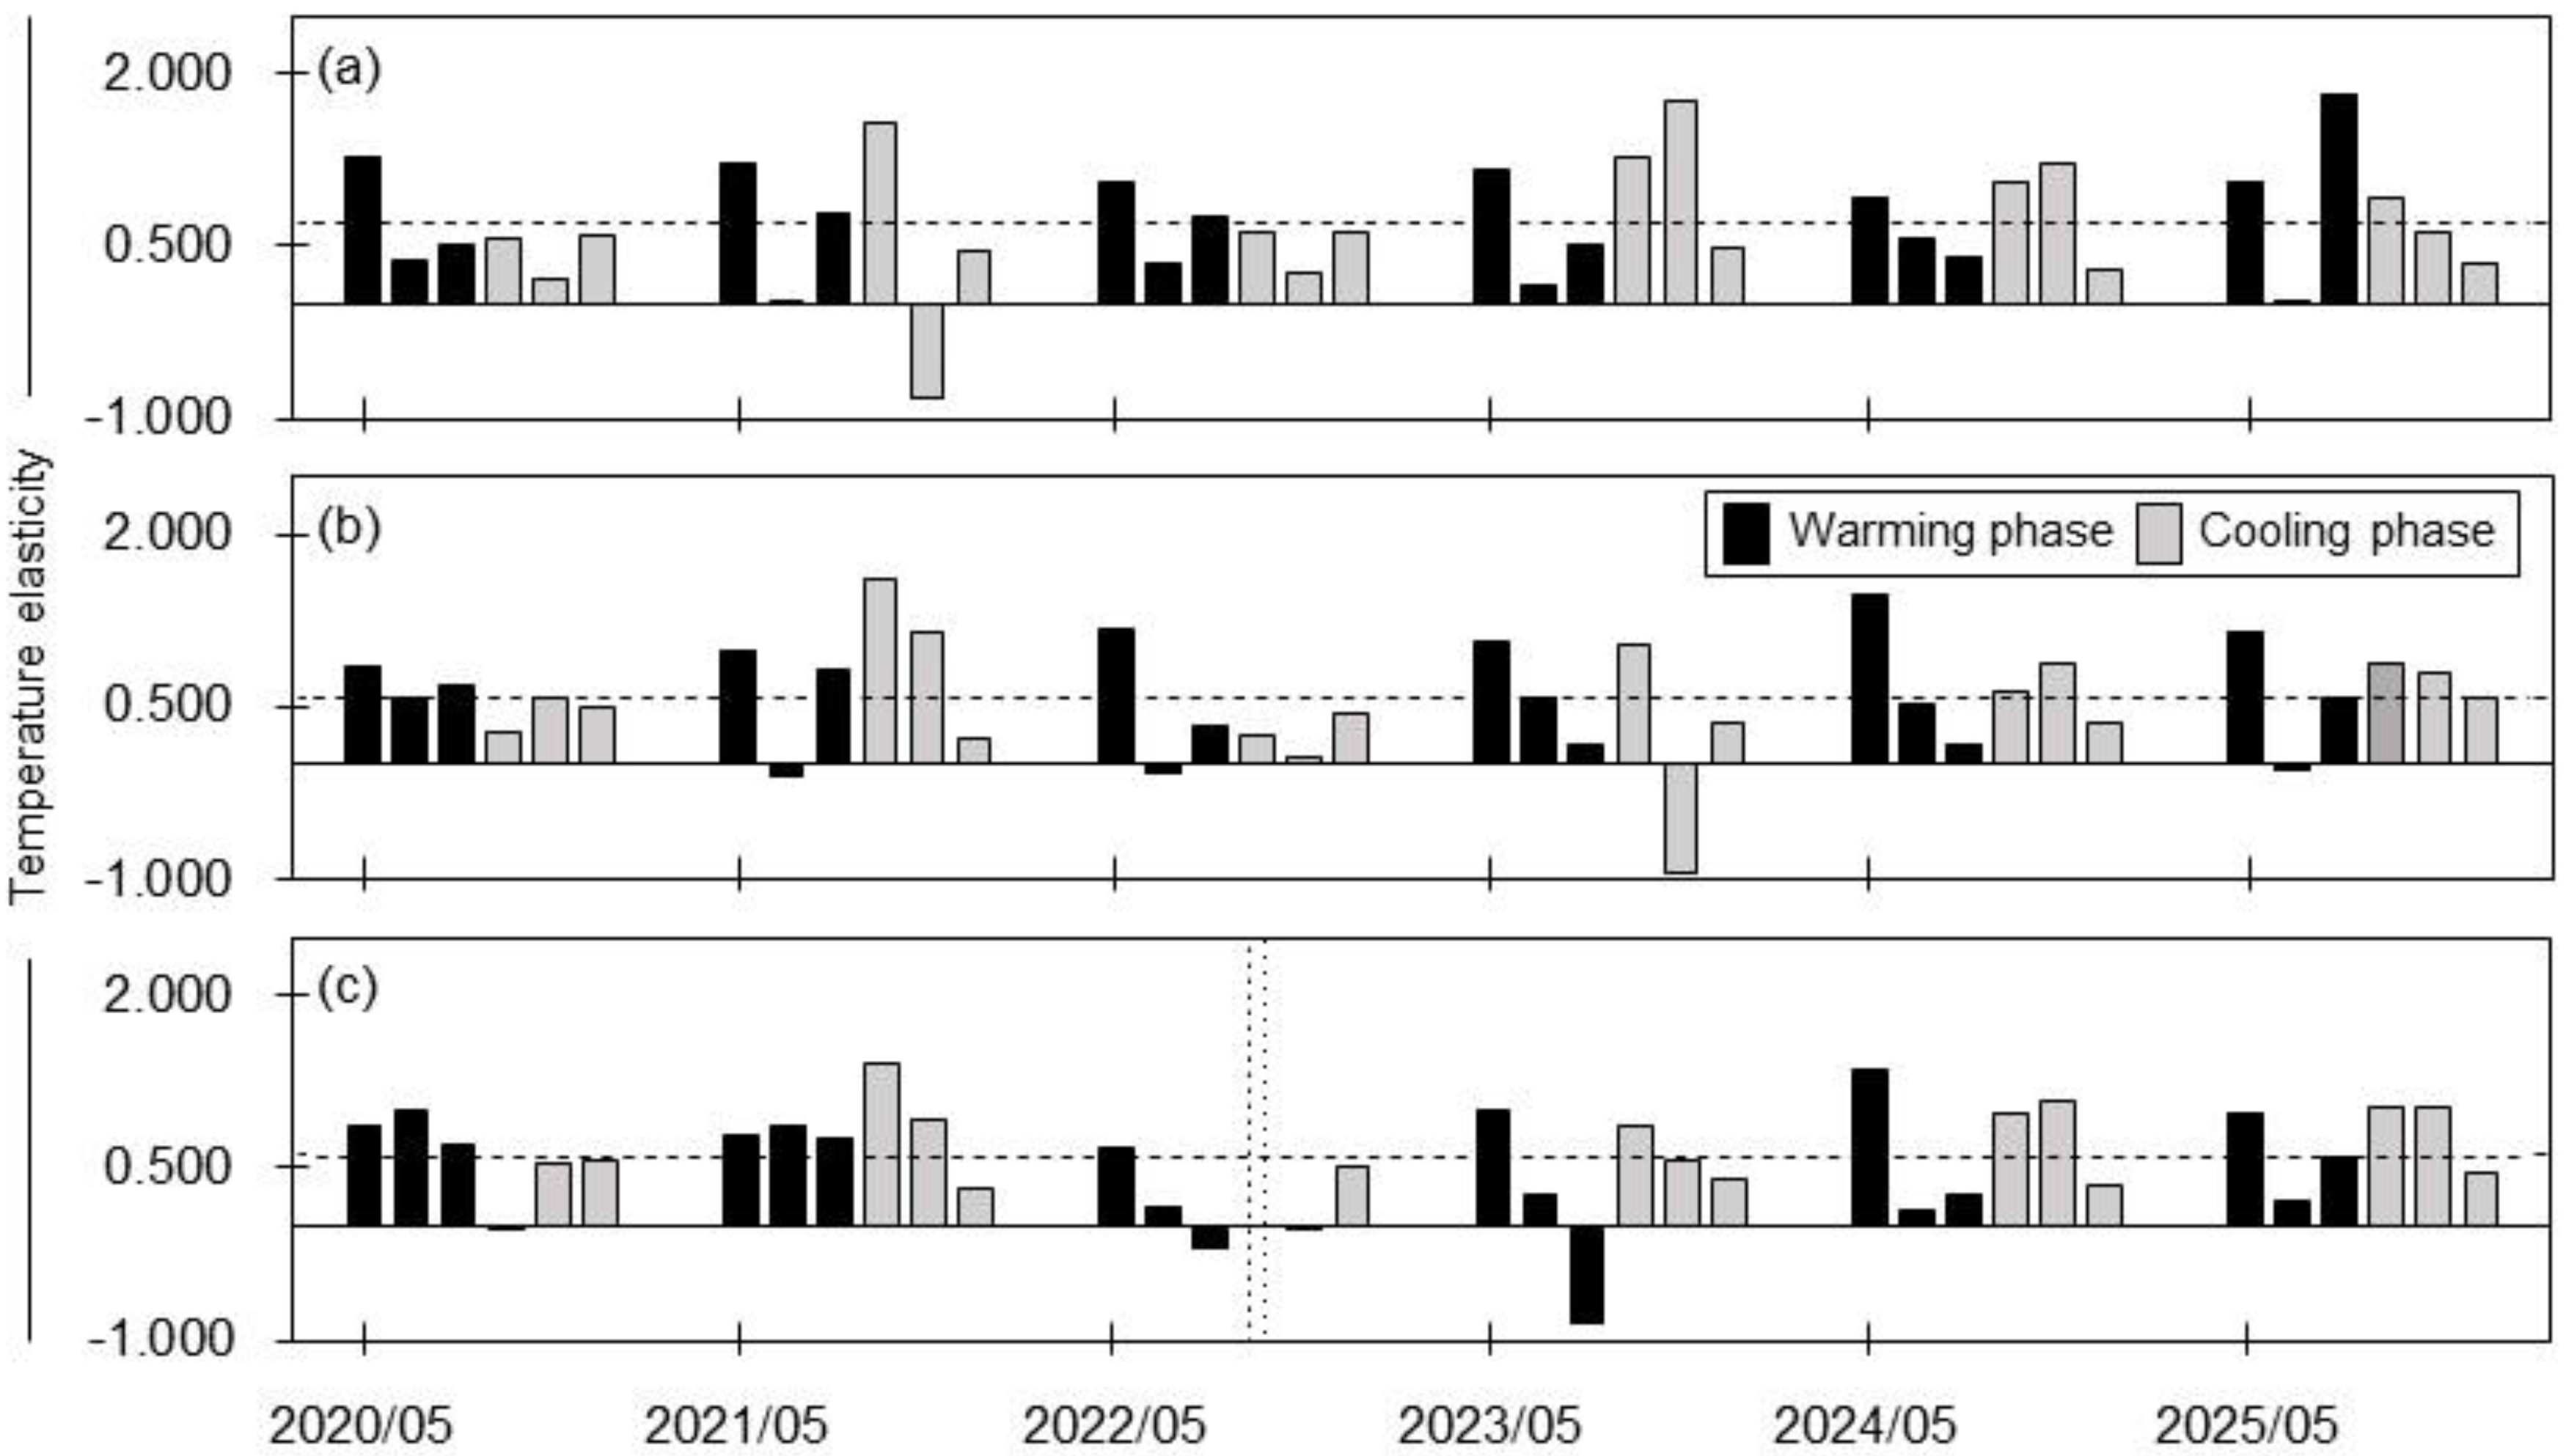
Table 4.
Distribution of regression slope and temperature elasticity across the upper, middle, and lower reaches during warming and cooling phases.
Figure 7.
Relationships between the warming and cooling phases for: (a) the regression slope; and (b) temperature elasticity across the upper, middle, and lower reaches of the watershed. Error bars show the 95% confidence intervals for the regression slopes in (a) and the standard deviation for temperature elasticity in (b).
4. Discussion
4.1. Temporal Characteristics of Water Temperature Responses to Air Temperature
In the streams (upper reach) and the rivers (middle and lower reaches), increases in TA were consistently associated with increases in TW. However, the magnitude of TW variation was smaller than that of TA variation, which may be attributed to the higher specific heat capacity of water than that of air [19,59]. Regarding the response of TW to TA changes, Moore et al. [3] reported that an increase in TA led to an increase in mean TW of up to approximately 1.4 °C in a catchment in British Columbia. Similarly, Lane et al. [21] found that TW increased when TA exceeded 30 °C and decreased when TA dropped below 12 °C at the mouth of the Mississippi River. In addition, monsoon-driven hydroclimatic responses have been reported in East Asia; for example, in the Nakdong River basin, Park et al. [60] observed that mean TW increased by 0.2–0.7 °C in June, when TA was increasing, and decreased by 0.2–1.1 °C in September, when TA was decreasing. Yu et al. [61] reported that monthly mean TW exhibited a weaker increasing trend than TA, with greater increases in August than in July and a continued increase into September in Lake Paldang. Cui et al. [62] also showed that surface TW exhibited hysteresis behavior in relation to TA in the Poyang Lake.
The response of TW to TA was more pronounced during the TA-increasing period (May–July) than during the TA-decreasing period (August–October). This pattern reflects the characteristic seasonal variation in TW in the ROK, where TA increases from spring to early summer and decreases from late summer to autumn. In summer, the water surface undergoes experiences greater latent heat loss through evaporation than in winter, and the contributions of groundwater inflow or snowmelt to streamflow also vary seasonally [6,14]. Consequently, during the TA-increasing phase, TW tended to increase from a relatively low baseline, whereas during the TA-decreasing phase, elevated TW was maintained for a certain period before decreasing, reflecting thermal inertia [53,60]. Similarly, An and Lee [51] reported a delayed TW response relative to changes in TA, manifested as a hysteresis loop, which they attributed to the higher specific heat capacity of water than of air.
To analyze the response of TW to temporal variations in TA, hysteresis loop analysis was applied, in which TW followed different trajectories during the increasing and decreasing phases of TA (Figure 4 and Figure 5). Additionally, the correlation between TA and TW was stronger during the cooling phase. This stronger correlation likely reflects increased thermal inertia and delayed heat exchange between air and water. Because the rates of increase and decrease in TW differed between the warming and cooling phases of TA [52], the slope during the warming phase (0.428–0.722) was steeper than that during the cooling phase (0.459–0.620). In contrast, the coefficient of determination (R2) was higher during the cooling phase (0.75–0.88) than during the warming phase (0.52–0.79). Similar patterns were reported by Nam et al. [27], who found that the slope of the linear relationship between TA and TW was slightly steeper during summer (0.763) than during the fall season (0.736); whereas the R2 value was higher during the fall (0.834).
4.2. Relative Influence of Spatial Distribution on Water Temperature from Stream to River
The principal component representing the temporal characteristics of TW exhibited a response pattern similar to that of TA. However, the indicator describing TW variability, namely AWTD, showed either lower or higher values in the streams (upper reaches) than in the rivers (middle and lower reaches). Here, canopy cover and topographic characteristics, including altitude, channel length, channel slope, and longitudinal position, were quantified using site-specific data (Table 1). However, groundwater influence and drainage winds were not directly measured and therefore are discussed only as potential explanatory factors based on site characteristics. From the site characteristics, this difference may be attributed to the relatively high elevation of the streams (upper reaches; 490–1155 m a.s.l.) and to variations in riparian forest cover and understory vegetation conditions along the streamside, which range from open to closed canopies (Table 1). These factors regulate the amount of solar radiation reaching the water surface through differences in canopy shading [2,10,63,64]. Additionally, spatial heterogeneity in topography between the streams (upper reaches) and the rivers (middle and lower reaches) likely altered flow paths and channel hydraulics, thereby contributing to differences in the extent to which controlling factors influenced TW responses [65,66].
In this study, although the responses of TW to TA exhibited similar overall patterns across the two phases, distinct differences were observed between reaches. During the warming phase, TW in the streams (upper reaches) remained consistently lower than TA, whereas in the cooling phase, TW in the rivers (middle and lower reaches) remained higher than TA (Figure 2, Figure 3 and Figure 4). For the lowland rivers in the middle and lower reaches, this pattern is consistent with previous studies attributing such behavior to differences in heat capacity between TA and TW, e.g., [7,51,59]. In contrast, the streams in the present study are adjacent to steep hillslopes and are strongly influenced by shaded riparian zones, which provide solar-radiation blocking as well as cooling and humidifying effects. Consequently, TW variation in response to TA changes was greater in streams than in rivers, leading to a larger difference between TA and TW during the warming phase, particularly in summer, e.g., [52,67]. Moreover, because the study sites are streams constrained by steep side slopes, the riparian zone may be narrow or poorly developed, e.g., [68,69]. Thus, in the streams examined in the present study, the combined effects of a narrow riparian zone and adjacent steep side slopes led temporal variations in the difference between minimum and maximum TW that differed markedly from those in the rivers (Figure 5 and Figure 7).
A similar pattern was evident in temperature elasticity, which characterizes the TW response to TA, along the longitudinal continuum from the streams (upper reaches) to the two river reaches (middle and lower reaches) in the Han River basin. Shon et al. [70] also reported that temperature elasticity increased from the upper to lower reaches in the Nakdong River watershed, primarily because of the combined effects of flow velocity and water surface area. Consistent with Shon et al. [70], higher temperature elasticity values were observed in the upper reaches than in the middle and lower reaches. These geomorphic characteristics may reduce flow velocity, thereby enhancing the sensitivity of TW to TA variability. However, the streams (upper reaches) within the forested watershed differ from the rivers (middle and lower reaches) in terms of channel length (1.52 and 3.16 km, respectively) and slope (0.23 and 0.18 m/m, respectively) (Table 1). These geomorphic contrasts, together with hydrologic conditions in the riparian zone, likely influenced the magnitude of temperature elasticity, e.g., [20]. Moreover, only one site represented the lower reach in this study, reflecting the available monitoring configuration along the Han River continuum. Thus, the results should be interpreted as indicating relative longitudinal patterns rather than being fully representative of lower reach conditions. Temperature elasticity represents the sensitivity of TW to changes in TA [37,57]. Higher temperature elasticity indicates a stronger response to atmospheric forcing and limited thermal buffering capacity, whereas lower temperature elasticity reflects greater resistance to TA changes due to buffering processes such as groundwater inflow, channel morphology, and riparian shading [71]. In addition, variations in temperature elasticity may reflect differences in forest structure and composition, which can influence the capacity of stream systems to adapt to changing climatic conditions [72].
Streams located in the upper parts of the catchments generally have relatively low flow rates and may be ephemeral compared with rivers and lakes in the lower catchment [34,35]. Additionally, summer (mid-June to mid-September), which accounts for 90% of the total rainfall, coincides largely with the East Asian monsoon (late June to mid-September) and typhoon season (late July to mid-September) in the ROK [73,74,75]. Therefore, because winter months were excluded due to freezing conditions and the absence of measurable flow, TW, TA, and elasticity values may be slightly overestimated and should be interpreted as representative of the non-freezing period rather than the full annual cycle. The phase boundaries were defined based on observed seasonal temperature patterns, and the results should be interpreted within this seasonal framework.
Therefore, the observed changes in TW may be attributed largely to variations in TA within the forested ecosystem under the hydrological conditions of the present study. For example, Kelleher et al. [71] noted that linear regression between TA and TW can be used to indicate general TA–TW sensitivity, with TA used as a surrogate for all the cumulative atmospheric controls on TW. Similarly, Beaufort et al. [7] explained that thermal sensitivity reflects the cumulative buffering effects of landscape characteristics on TW. Consistent with this perspective, Ptak et al. [76] reported that, in the context of global climate change, increasing attention has been directed toward long-term variations in stream thermal regimes in forested catchments, with TA acting as a dominant controlling factor. These variations in thermal sensitivity may have ecological implications, as changes in TW can alter aquatic habitat conditions [77,78] and impose thermal stress on fish communities [79], although these effects were not directly examined in the present study. From a management perspective, the higher thermal sensitivity of upper reaches during the warming phase suggests that these areas should be prioritized for targeted mitigation under climate warming. Because this study was based on field observations, some missing data led to unequal sample sizes across sites and periods, and complete temporal pairing was not always possible. Therefore, the results should be interpreted primarily in terms of overall spatial and seasonal patterns rather than exact one-to-one comparisons.
5. Summary and Conclusions
The characteristics of air and water temperatures were investigated in streams and rivers of the Han River basin from 2020 to 2025, with analyses restricted to the May–October period. Using hysteresis loop analysis, we identified clear phase-dependent differences in the relationships between air and water temperatures during the warming and cooling phases. The main findings were as follows: (1) the air–water temperature difference was statistically significant across all monitored reaches during both phases (p < 0.001); (2) water temperature increased linearly with air temperature during both phases, with steeper regression slopes during the warming phase (0.428–0.722) than in the cooling phase (0.459–0.620); (3) longitudinal patterns of water temperature responses to air temperature differed between two phases; (4) the regression slopes during the cooling phase increased from the upper to the lower reaches (0.489–0.545); and (5) temperature elasticity during the warming phase decreased from the upper to the lower reaches (0.714–0.532). Overall, these results demonstrate that water temperature responses to air temperature exhibit clear phase-dependent spatial patterns, with the regression slopes varying across streams and rivers and temperature elasticity decreasing from streams to rivers. Thermal sensitivity was greater in streams, particularly during the warming phase, and diminished during the cooling phase. This study is limited by restricted site coverage and the lack of direct measurements of key controlling factors, such as groundwater inputs and riparian shading, which should be addressed in future studies. The elasticity framework could also be integrated into real-time water quality management systems to support adaptive management of stream thermal regimes under climate change.
Author Contributions
Conceptualization, S.N. and S.J.; methodology, S.N., H.L. and S.J.; software, S.N. and H.L.; validation, S.N. and E.-J.K.; formal analysis, S.N. and S.J.; investigation, H.L. and S.J.; resources, H.L. and H.T.C.; data curation, S.N.; writing—original draft preparation, S.N. and J.L.; writing—review and editing, S.N. and E.-J.K.; visualization, S.N.; supervision, H.T.C.; project administration, H.T.C. and J.L. funding acquisition, S.N. All authors have read and agreed to the published version of the manuscript.
Funding
This study was carried out with the support of the “Program for Forest Science Technology (Project No. FE0100-2025-04-2026)” provided by the National Institute of Forest Science and National Research Foundation (NRF) grant funded by the “Korea government (MSIT) (No. NRF-2020R1A6A3A01099801)”.
Data Availability Statement
The data presented in this study are available on request from the corresponding author. The data are not available publicly as they are from a project for obtaining specific research results and because of the intellectual property rights at the National Institute of Forest Science.
Conflicts of Interest
The authors declare no conflicts of interest.
References
- Caissie, D. The thermal regime of rivers: A review. Freshw. Biol. 2006, 51, 1389–1406. [Google Scholar] [CrossRef] [Scilit]
- Webb, B.W.; Hannah, D.M.; Moore, R.D.; Brown, L.E.; Nobilis, F. Recent advances in stream and river temperature research. Hydrol. Process. 2008, 22, 902–918. [Google Scholar] [CrossRef] [Scilit]
- Moore, R.D. Stream temperature patterns in British Columbia, Canada, based on routine spot measurements. Can. Water Resour. J. 2006, 31, 41–56. [Google Scholar] [CrossRef] [Scilit]
- Hare, D.K.; Benz, S.A.; Kurylyk, B.L.; Johnson, Z.C.; Terry, N.C.; Helton, A.M. Paired air and stream temperature analysis (PASTA) to evaluate groundwater influence on streams. Water Resour. Res. 2023, 59, e2022WR033912. [Google Scholar] [CrossRef] [Scilit]
- Assel, R.; Cronk, K.; Norton, D. Recent trends in Laurentian Great Lakes ice cover. Clim. Change 2023, 57, 185–204. [Google Scholar] [CrossRef] [Scilit]
- Stefan, H.G.; Preud’homme, E.B. Stream temperature estimation from air temperature. J. Am. Water Resour. Assoc. 1993, 29, 27–45. [Google Scholar] [CrossRef] [Scilit]
- Beaufort, A.; Moatar, F.; Sauquet, E.; Loicq, P.; Hannah, D.M. Influence of landscape and hydrological factors on stream–air temperature relationships at regional scale. Hydrol. Process. 2020, 34, 583–597. [Google Scholar] [CrossRef] [Scilit]
- Arismendi, I.; Johnson, S.L.; Dunham, J.B.; Haggerty, R. Descriptors of natural thermal regimes in streams and their responsiveness to change in the Pacific Northwest of North America. Freshw. Biol. 2013, 58, 880–894. [Google Scholar] [CrossRef] [Scilit]
- Fullerton, A.H.; Torgersen, C.E.; Lawler, J.J.; Faux, R.N.; Steel, E.A.; Beechie, T.J.; Ebersole, J.L.; Leibowitz, S.G. Rethinking the longitudinal stream temperature paradigm: Region-wide comparison of thermal infrared imagery reveals unexpected complexity of river temperatures. Hydrol. Process. 2015, 29, 4719–4737. [Google Scholar] [CrossRef] [Scilit]
- Steel, E.A.; Sowder, C.; Peterson, E.E. Spatial and temporal variation of water temperature regimes on the Snoqualmie River network. J. Am. Water Resour. Assoc. 2016, 52, 769–787. [Google Scholar] [CrossRef] [Scilit]
- Benda, L.; Miller, D.; Dunne, T.; Poff, L.; Reeves, G.; Pollock, M.; Pess, G. Network dynamics hypothesis: Spatial and temporal organization of physical heterogeneity in rivers. Bioscience 2004, 54, 413–427. [Google Scholar] [CrossRef] [Scilit]
- Rivers-Moore, N.A.; Jewitt, G.P.W. Adaptive management and water temperature variability within a South Africa river system: What are the management options? J. Environ. Manag. 2007, 82, 39–50. [Google Scholar] [CrossRef] [Scilit]
- Alcamo, J.; Vörösmarty, C.; Naiman, R.J.; Lettenmaier, D.; Pahl-Wostl, C. A grand challenge for freshwater research: Understanding the global water system. Environ. Res. Lett. 2008, 3, 010202. [Google Scholar] [CrossRef] [Scilit]
- Stefan, H.G.; Sinokrot, B.A. Projected global climate change impact on water temperatures in five north central US stream. Clim. Change 1993, 24, 353–381. [Google Scholar] [CrossRef] [Scilit]
- Eaton, J.G.; Scheller, R.M. Effects of climate warming on fish thermal habitat in streams of the United States. Limnol. Oceanogr. 1996, 41, 1109–1115. [Google Scholar] [CrossRef] [Scilit]
- Olden, J.D.; Naiman, R.J. Incorporating thermal regimes into environmental flows assessments: Modifying dam operations to restore freshwater ecosystem integrity. Freshw. Biol. 2010, 55, 86–107. [Google Scholar] [CrossRef] [Scilit]
- Macan, T.T. Freshwater Ecology, 2nd ed.; Longman Group: London, UK, 1974. [Google Scholar]
- Webb, B.W. Trends in stream and river temperature. Hydrol. Process. 1996, 10, 205–226. [Google Scholar] [CrossRef]
- Webb, B.W.; Nobilis, F. Long term perspective on the nature of the air-water temperature relationship: A case study. Hydrol. Process. 1997, 11, 137–147. [Google Scholar] [CrossRef]
- Moore, R.D.; Spittlehouse, D.L.; Story, A. Riparian microclimate and stream temperature response to forest harvesting: A review. J. Am. Water Resour. Assoc. 2005, 41, 813–834. [Google Scholar] [CrossRef]
- Lane, R.; Day, J.W.; Marx, B.; Reyes, E.; Hyfield, E.; Day, J.N. The effects of riverine discharge on temperature, suspended sediments, and chlorophyll a in a Mississippi delta estuary measured using a flow-through system. Estuar. Coast. Shelf Sci. 2007, 74, 145–154. [Google Scholar] [CrossRef] [Scilit]
- Pekarova, P.; Halmova, D.; Miklanek, P.; Onderka, M.; Pekar, J.; Skoda, P. Is the water temperature of the Danube River at Bratislava, Slovakia, rising? J. Hydrometeorol. 2008, 9, 1115–1122. [Google Scholar] [CrossRef] [Scilit]
- Rajwa-Kuligiewicz, A.; Bialik, R.J.; Rowiński, P.M. Dissolved oxygen and water temperature dynamics in lowland rivers over various timescales. J. Hydrol. Hydromech. 2015, 63, 353–363. [Google Scholar] [CrossRef] [Scilit]
- Rajwa, A.; Rowiński, P.M.; Bialik, R.J.; Karpiński, M. Stream diurnal profiles of dissolved oxygen—Case studies. In Proceedings of the 3rd IAHR Europe Congress, Porto, Portugal, 14–16 April 2014. [Google Scholar]
- Hilderbrand, R.H.; Kashiwagi, M.T.; Prochaska, A.P. Regional and local scale modeling of stream temperatures and spatio-temporal variation in thermal sensitivities. Environ. Manag. 2014, 54, 14–22. [Google Scholar] [CrossRef] [Scilit]
- Johnson, M.F.; Wilby, R.L.; Toone, J.A. Inferring air–water temperature relationships from river and catchment properties. Hydrol. Process. 2014, 28, 2912–2928. [Google Scholar] [CrossRef] [Scilit]
- Nam, S.; Jang, S.; Kim, S.; Lee, Y.; Chun, K. Estimated headwater stream temperature using environmental factors with seasonal variations in a forested catchment. Korean J. Environ. Ecol. 2020, 34, 55–62. (In Korean) [Google Scholar] [CrossRef] [Scilit]
- Kim, I.J.; Han, D.H. A Small Stream Management Plan to Protect the Aquatic Ecosystem; Korea Environment Institute Report (No. RE-09); Korea Environment Institute (KEI): Sejong-Si, Republic of Korea, 2008; pp. 1–149. (In Korean) [Google Scholar]
- Korea Forest Service (KFS). Statistical Yearbook of Forestry 2021; Korea Forest Service: Daejeon, Republic of Korea, 2021; No. 23; pp. 13–14. (In Korean) [Google Scholar]
- Kim, L.H.; Choi, E.; Gil, K.I.; Stenstrom, M.K. Phosphorus release rates from sediments and pollutant characteristics in Han River, Seoul, Korea. Sci. Total Environ. 2004, 321, 115–125. [Google Scholar] [CrossRef] [Scilit] [PubMed]
- Chang, H. Spatial analysis of water quality trends in the Han River basin, South Korea. Water Res. 2008, 42, 3285–3304. [Google Scholar] [CrossRef] [Scilit]
- Cho, Y.C.; Im, J.K.; Han, J.; Kim, S.H.; Kang, T.; Lee, S. Comprehensive water quality assessment using Korean water quality indices and multivariate statistical techniques for sustainable water management of the Paldang reservoir, South Korea. Water 2023, 15, 509. [Google Scholar] [CrossRef] [Scilit]
- Park, S.R.; Hwang, S.J.; An, K.; Lee, S.W. Identifying Key Watershed Characteristics That Affect the Biological Integrity of Streams in the Han River watershed, Korea. Sustainability 2021, 13, 3359. [Google Scholar] [CrossRef] [Scilit]
- Robinson, C.T.; Tonolla, D.; Imhof, B.; Vukelic, R.; Uehling, U. Flow intermittency, physico-chemistry and function of headwater streams in an Alpine glacial catchment. Aquat. Sci. 2016, 78, 327–341. [Google Scholar] [CrossRef] [Scilit]
- Kim, D.Y. Effect of regional climate change on precipitation in the 21st century. J. Korean Soc. Environ. Technol. 2020, 21, 205–210. (In Korean) [Google Scholar] [CrossRef] [Scilit]
- Park, J.C.; Lee, H.H. Variations of stream water quality caused by discharge change-At a watershed in Mt. Palgong. J. Korean Soc. For. Sci. 2000, 89, 342–355. (In Korean) [Google Scholar]
- Jiang, J.; Sharma, A.; Sivakumar, B.; Wang, P. A global assessment of climate–water quality relationships in large rivers: An elasticity perspective. Sci. Total Environ. 2014, 468–469, 877–891. [Google Scholar] [CrossRef] [Scilit]
- Sankarasubramanian, A.; Vogel, R.M.; Limbrunner, J.F. Climate elasticity of streamflow in the United States. Water Resour. Res. 2001, 37, 1771–1781. [Google Scholar] [CrossRef] [Scilit]
- Chiew, F.H.S. Estimation of rainfall elasticity of streamflow in Australia. Hydrol. Sci. J. 2006, 51, 613–625. [Google Scholar] [CrossRef] [Scilit]
- Yang, Z.F.; Liu, Q. Response of streamflow to climate changes in the yellow river basin, China. J. Hydrometeorol. 2011, 12, 1113–1126. [Google Scholar] [CrossRef]
- Nam, S.; Jang, S.J.; Chun, K.W.; Lee, J.U.; Kim, S.W. Seasonal water temperature variations in response to air temperature and precipitation in a forested headwater stream and an urban river: A case study from the Bukhan River basin, South Korea. For. Sci. Technol. 2021, 17, 46–55. [Google Scholar] [CrossRef] [Scilit]
- Li, D.; Kim, M.; Shim, W.J.; Yim, U.H.; Oh, J.R.; Kwon, Y.J. Seasonal flux of nonylphenol in Han River, Korea. Chemosphere 2004, 56, 1–6. [Google Scholar] [CrossRef] [Scilit]
- Kottek, M.; Grieser, J.; Beck, C.; Rudolf, B.; Rubel, F. World map of Köppen-Geiger climate classification updated. Meteorol. Z. 2006, 15, 259–263. [Google Scholar] [CrossRef] [Scilit]
- Beck, H.E.; Zimmermann, N.E.; McVicar, T.R.; Vergopolan, N.; Berg, A.; Wood, E.F. Present and future Köppen-Geiger climate classification maps at 1-km resolution. Sci. Data 2018, 5, 180214. [Google Scholar] [CrossRef] [Scilit] [PubMed]
- Ryberg, K.R.; Akyuez, F.A.; Wiche, G.J.; Lin, W. Changes in seasonality and timing of peak streamflow in snow and semi-arid climates of the north-central United States, 1910–2012. Hydrol. Process. 2016, 30, 1208–1218. [Google Scholar] [CrossRef] [Scilit]
- Ho, C.H.; Lee, J.Y.; Ahn, M.H.; Lee, H.S. A sudden change in summer rainfall characteristics in Korea during the late 1970s. Int. J. Climatol. 2003, 23, 117–128. [Google Scholar] [CrossRef] [Scilit]
- Ha, K.J.; Heo, K.Y.; Lee, S.S.; Yun, K.S.; Jhun, J.G. Variability in the East Asian monsoon: A review. Meteorol. Appl. 2012, 19, 200–215. [Google Scholar] [CrossRef] [Scilit]
- Choi, I.C.; Shin, H.J.; Nguyen, T.T.; Tenhunen, J. Water policy reforms in South Korea: A historical review and ongoing challenges for sustainable water governance and management. Water 2017, 9, 717. [Google Scholar] [CrossRef] [Scilit]
- Brown, L.E.; Hannah, D.M.; Milner, A.M. Hydroclimatological influences on water column and streambed thermal dynamics in an alpine river system. J. Hydrol. 2006, 325, 1–20. [Google Scholar] [CrossRef] [Scilit]
- Subehi, L.; Fukushima, T.; Onda, Y.; Mizugaki, S.; Gomi, T.; Terajima, T.; Kosugi, K.; Hiramatsu, S.; Kitahara, H.; Kuraji, K.; et al. Influences of forested watershed conditions on fluctuations in stream water temperature with special reference to watershed area and forest type. Limnology 2010, 10, 33–45. [Google Scholar] [CrossRef] [Scilit]
- An, J.H.; Lee, K.H. Correlation and hysteresis analysis of air-water temperature in four rivers; Preliminary study for water temperature prediction. J. Environ. Policy 2013, 12, 17–32. (In Korean) [Google Scholar]
- Cho, H.Y.; Lee, K.H.; Cho, K.J.; Kim, J.S. Correlation and hysteresis analysis between air and water temperatures in the Coastal Zone–Masan Bay. J. Korean Soc. Coast. Ocean Eng. 2007, 19, 213–221. (In Korean) [Google Scholar]
- Nam, S.; Choi, H.T.; Lim, H. Seasonal variations of stream water temperature and its affecting factors on mountain areas. J. Korean Soc. Water Environ. 2019, 35, 308–315. (In Korean) [Google Scholar]
- Nakamura, F.; Dokai, T. Estimation of the effect of riparian forest on stream temperature based on heat budget. J. Jpn. For. Soc. 1989, 71, 387–394. (In Japanese) [Google Scholar]
- Shon, T.S.; Lee, K.Y.; Im, T.H.; Shin, H.S. Elasticity analyses between water temperature and water quality considering climate changes in Nak-dong River basin. J. Korean Soc. Water Qual. 2011, 27, 830–840. (In Korean) [Google Scholar]
- Png, I. Managerial Economics; Blackwell: Oxford, UK, 1999. [Google Scholar]
- Khan, A.; Jiang, J.; Sharma, A.; Wang, P.; Khan, J. How do terrestrial determinants impact the response of water quality to climate drivers?—An elasticity perspective on the water-land-climate nexus. Sustainability 2017, 9, 2118. [Google Scholar] [CrossRef] [Scilit]
- Xiao, F.; Halbach, T.R.; Simcik, M.F.; Gulliver, J.S. Input characterization of perfluoroalkyl substances in wastewater treatment plants: Source discrimination by exploratory data analysis. Water Res. 2012, 46, 3101–3109. [Google Scholar] [CrossRef] [Scilit]
- Crisp, D.T.; Howson, G. Effect of air temperature upon mean water temperature in streams in the north Pennies and English Lake District. Freshw. Biol. 1982, 12, 359–367. [Google Scholar] [CrossRef] [Scilit]
- Park, J.; Kim, K.; Cho, C.; Kang, M.; Kim, B. Spatio-temporal characteristics of air and water temperature change in the middle reach of the Nakdong River. J. Environ. Policy Adm. 2016, 9, 233–253. (In Korean) [Google Scholar] [CrossRef] [Scilit]
- Yu, S.J.; Ryu, I.G.; Park, M.J.; Im, J.K. Long-term relationship between air and water temperatures in Lake Paldang, South Korea. Environ. Eng. Res. 2021, 26, 200177. [Google Scholar] [CrossRef] [Scilit]
- Cui, Y.; Liu, Y.; Gan, G.; Wang, R. Hysteresis behavior of surface water fluxes in a hydrologic transition of an ephemeral lake. J. Geophys. Res. Atmos. 2020, 125, e2019JD032364. [Google Scholar] [CrossRef] [Scilit]
- Pluhowski, E.J. Hydrologic Interpretations Based on Infrared Imagery of Long Island, New York, U.S.; Survey Water-Supply Paper 2009-B; US Government Printing Office: Washington, DC, USA, 1972; pp. 1–20.
- Becker, M.; Georgian, T.; Ambrose, H.; Siniscalchi, K.; Fredrick, K. Estimating flow and flux of ground water discharge using water. J. Hydrol. 2004, 296, 221–233. [Google Scholar] [CrossRef] [Scilit]
- Huang, M.; Liang, X.; Leung, L.R. A generalized subsurface flow parameterization considering subgrid spatial variability of recharge and topography. J. Hydrometeorol. 2008, 9, 1151–1171. [Google Scholar] [CrossRef] [Scilit]
- Du, X.; Goss, G.; Faramarzi, M. Impacts of hydrological processes on stream temperature in a cold region watershed based on the SWAT equilibrium temperature model. Water 2020, 12, 1112. [Google Scholar] [CrossRef] [Scilit]
- Isaak, D.J.; Wollrab, S.; Horan, D.; Chandler, G. Climate change effects on stream and river temperatures across the northwest U.S. from 1980–2009 and implications for salmonid fishes. Clim. Change 2012, 113, 499–524. [Google Scholar] [CrossRef] [Scilit]
- Richardson, J.S.; Naiman, R.J.; Swanson, F.J.; Hibbs, D.E. Riparian communities associated with Pacific Northwest Headwater Streams: Assemblages, processes, and uniqueness. J. Am. Water Resour. Assoc. 2005, 41, 935–947. [Google Scholar] [CrossRef]
- Jayasuriya, M.T.; Germain, R.H.; Stella, J.C. Applying the “Goldilocks rule” to riparian buffer widths for forested headwater streams across the contiguous US-How much is “just right”? Forests 2022, 13, 1509. [Google Scholar] [CrossRef] [Scilit]
- Shon, T.S.; Lee, Y.G.; Baek, M.K.; Shin, H.S. Analysis for air temperature trend and elasticity of air-water temperature according to climate changes in Nakdong River Basin. J. Korean Soc. Water Qual. 2010, 26, 822–833. (In Korean) [Google Scholar]
- Kelleher, C.; Wagener, T.; Gooseff, M.; McGlynn, B.; McGuire, K.; Marshall, L. Investigating controls on the thermal sensitivity of Pennsylvania streams. Hydrol. Process. 2012, 26, 771–785. [Google Scholar] [CrossRef] [Scilit]
- Creed, I.F.; Spargo, A.T.; Jones, J.A.; Buttle, J.M.; Adams, M.B.; Beall, F.D.; Booth, E.G.; Campbell, J.L.; Clow, D.; Elder, K.; et al. Changing forest water yields in response to climate warming: Results from long-term experimental watershed sites across North America. Glob. Change Biol. 2014, 20, 3191–3208. [Google Scholar] [CrossRef] [Scilit]
- Chang, H.; Franczyk, J.; Im, E.S.; Kwon, W.T.; Bae, D.H.; Jung, I.W. Vulnerability of Korean water resources to climate change and population growth. Water Sci. Technol. 2007, 56, 57–62. [Google Scholar] [CrossRef] [Scilit]
- Bae, S.K.; Kim, Y.H. Estimation of groundwater recharge rate using the NRCS-CN and the baseflow separation methods. J. Environ. Sci. Int. 2006, 15, 253–260. (In Korean) [Google Scholar]
- Lee, J.Y.; Jeon, W.H.; Park, Y.; Lim, H.G. Status and prospect of groundwater resources in Pyeongchang, Gangwon-do. J. Geo. Soc. Korea 2012, 48, 435–444. (In Korean) [Google Scholar] [CrossRef] [Scilit]
- Ptak, M.; Sojka, M.; Szyga-Pluta, K.; Amnuaylojaroen, T. Air and Water Temperature Relationships in Major Polish Rivers and Their Long-Term Changes. Sustainability 2025, 17, 10737. [Google Scholar] [CrossRef] [Scilit]
- Sabo, M.J.; Bryan, C.F.; Kelso, W.E.; Rutherford, D.A. Hydrology and aquatic habitat characteristics of a riverine swamp: I. Influence of flow on water temperature and chemistry. Regul. Rivers Res. Manag. 1999, 15, 505–523. [Google Scholar] [CrossRef] [Scilit]
- Dykema, S.; Hovel, R.; Nelson, S.; Fernandez, I.; Saros, J.E.; Daly, J.; McDowell, W.H. Elevation-mediated cold water refugia in subalpine lakes. Conserv. Sci. Pract. 2026, 8, e70175. [Google Scholar] [CrossRef] [Scilit]
- Atroch, F.; Rangel, L.F.; Ayra-Pardo, C.; Santos, M.J. Climate Change, Fish and Shellfish, and Parasite Dynamics: A Comprehensive Review. J. Mar. Sci. Eng. 2026, 14, 167. [Google Scholar] [CrossRef] [Scilit]
Disclaimer/Publisher’s Note: The statements, opinions and data contained in all publications are solely those of the individual author(s) and contributor(s) and not of MDPI and/or the editor(s). MDPI and/or the editor(s) disclaim responsibility for any injury to people or property resulting from any ideas, methods, instructions or products referred to in the content. |
© 2026 by the authors. Licensee MDPI, Basel, Switzerland. This article is an open access article distributed under the terms and conditions of the Creative Commons Attribution (CC BY) license.