


Abstract
Granular deposition and grading strongly influence pore-space topology and hence hydraulic conductivity in natural and engineered porous media, yet quantitative links between deposition sequence, particle-scale morphology, pore-network descriptors, and permeability anisotropy remain incomplete. Here, we develop a process-based digital porous-media framework that couples discrete element method (DEM) deposition with pore-network characterization and Darcy-scale permeability evaluation. Two deposition sequences—normal grading (coarse-to-fine) and reverse grading (fine-to-coarse)—are simulated using bi-disperse particle sets with controlled size ratios. To further isolate the role of particle morphology, particle irregularity is parameterized by a Perlin-noise-based shape perturbation factor and incorporated into the DEM-generated packings. For each packing, pore networks are extracted and quantified in terms of pore/throat size distributions and connectivity, while pore-space complexity is measured via box-counting fractal dimension. Single-phase flow is solved under imposed pressure gradient, and intrinsic permeability is computed along three orthogonal directions to evaluate anisotropy. Results show that increasing size contrast reduces porosity, shifts pore and throat distributions toward smaller characteristic radii, increases pore-space fractal dimension, and yields a monotonic permeability reduction. For identical size ratios, reverse grading consistently yields higher permeability than normal grading, suggesting that deposition sequence exerts a strong control on the continuity and efficiency of effective flow pathways at the sample scale. Increasing particle irregularity decreases permeability and systematically modifies permeability anisotropy, transitioning from weak horizontal anisotropy toward near-isotropy and, at strong irregularity, toward preferential vertical permeability. The proposed framework provides a reproducible route to relate depositional history and particle morphology to pore-network structure and directional permeability, offering implications for filtration, packed-bed design, and sedimentary reservoir characterization.
1. Introduction
Permeability is a fundamental property governing fluid flow through porous media and underpins a wide spectrum of subsurface and engineering applications, including groundwater seepage, petroleum recovery, contaminant transport, filtration, and packed-bed processes. Classical continuum descriptions relate the pressure gradient to the superficial velocity through Darcy’s law [1], while deviations at higher Reynolds numbers are often represented by Forchheimer-type extensions [2,3,4]. For granular media, decades of research has established empirical or semi-analytical correlations between permeability and porosity/specific surface area, notably the Kozeny–Carman family of models [5,6,7] and the Ergun equation for packed columns [8]. These relations are widely used because they provide convenient macroscopic estimates; however, their predictive power can degrade when pore geometry, particle-size distribution (PSD), particle shape, and depositional history induce complex pore connectivity and tortuosity that are not captured by simple scalar descriptors [9,10,11].
A core difficulty lies in the multiscale nature of pore-space structure. The intrinsic permeability is an emergent outcome of pore–throat topology, pore-size heterogeneity, and connected preferential pathways. Comprehensive treatments emphasize that permeability depends not only on porosity but also on the distribution of hydraulic radii, tortuosity, constrictivity, and connectivity [12]. Modern pore-scale imaging and “digital rock” workflows have made it possible to quantify these geometric factors directly from three-dimensional images (e.g., micro-CT) and to predict flow/transport properties via direct numerical simulation or reduced-order representations [13]. Reviews on pore-scale imaging highlight both the opportunities and the persistent challenges: segmentation uncertainty, representativeness, and translating voxelized pore space into models that preserve hydraulic connectivity across scales [14,15].
Among reduced-order approaches, pore network models (PNMs) provide a computationally efficient representation of pore space as pores connected by throats, enabling rapid predictions of permeability and other transport coefficients while retaining key topological features [16]. A substantial body of work has focused on extracting pore networks from 3D images using medial-axis, maximal-ball, or morphological algorithms, and on validating the extracted networks against permeability computed on the original voxel domains [17,18,19,20]. Landmark developments include network extraction from micro-CT images using maximal-ball methods, skeletonization-based extraction, medial-axis analysis, and later simplified but robust extraction routines for general microtomography datasets [21]. Community toolkits, such as OpenPNM, have further facilitated reproducible network modeling and benchmarking across different porous systems [22]. Despite these advances, most digital rock studies treat the solid matrix as static and focus on predicting permeability from an already-formed microstructure. In many real settings, however, pore space is not “given”—it is created and continuously modified by depositional and post-depositional processes.
Granular deposition, grading, and segregation are among the most important process controls on pore structure in unconsolidated materials. The PSD influences packing density and void-size distribution, and thus permeability, even when average particle size is fixed [23]. Lattice-Boltzmann and Monte-Carlo studies have demonstrated that increasing polydispersity can reduce permeability beyond what is predicted by porosity alone, due to enhanced pore constrictions and altered connectivity [24]. Experimental packed-bed studies similarly show that PSD effects cannot always be collapsed into a single “mean particle diameter” without loss of accuracy [25]. Recent analyses in chromatography/packed columns revisit how PSD affects permeability and emphasize that the appropriate mean diameter (e.g., Sauter mean) can reduce but not eliminate PSD-dependent deviations in permeability correlations [26]. These insights collectively suggest that PSD introduces structural controls that motivate explicit pore-scale characterization rather than reliance on bulk correlations alone.
Equally important is the sequence by which grains deposit. In gravity-driven deposition, size segregation and stratification can occur and imprint a “memory” of the deposition path on pore connectivity [27]. While segregation theory has a long history in granular physics [28], translating deposition sequence into quantitative permeability anisotropy remains challenging. In stratified systems, permeability can become direction-dependent as pore channels align with layering, and preferential pathways emerge that are not predictable from porosity or PSD alone. Therefore, a process-based digital framework that explicitly generates packings under controlled deposition sequences can help isolate how grading history shapes pore networks and directional flow. Particle shape and surface roughness further complicate the permeability response. Non-sphericity, angularity, and surface texture can reduce packing density, increase tortuosity, and modify constrictivity, thus affecting permeability and its anisotropy [29,30]. Numerical studies show that particle irregularity can significantly alter pore structure and transport properties, even at similar porosity levels, by changing interlocking and contact networks [31,32]. Recent work combining experiments and simulations highlights strong coupled effects of particle shape and PSD on void fraction and tortuosity in packed beds [33]. Lattice-Boltzmann investigations focused on shape effects also report systematic permeability variations attributable to particle morphology and the resulting pore geometry [34]. However, many studies treat shape qualitatively (e.g., “rounded vs. angular”) or use a limited set of idealized shapes, making it difficult to define a continuous and reproducible “shape irregularity” control parameter that can be coupled to deposition simulations.
Discrete element method (DEM) modeling offers a natural way to address these gaps because it resolves particle-scale mechanics and can generate realistic packings under specified deposition rules [35]. DEM has been widely adopted since the foundational work of Cundall and Strack and has been used to simulate granular packing, segregation, and contact behavior across a range of particle shapes and interaction laws [36]. When combined with pore characterization and flow solvers, DEM-based digital porous media can establish causal links from deposition parameters to pore topology and permeability. In parallel, fractal descriptors—such as box-counting fractal dimension—have been used to quantify pore-space complexity in natural porous media and relate it to transport [37]. Early evidence that pore space exhibits fractal geometry in sandstones motivated subsequent fractal permeability models for multi-scale porous systems, including bi-disperse media [38,39]. While fractal dimension is not a complete descriptor of permeability, it provides complementary information about pore-space complexity that can enrich pore-network metrics.
However, quantitative links between depositional history, continuously parameterized particle irregularity, pore-network topology, and directional permeability remain insufficiently resolved in existing studies. Motivated by these considerations, this study proposes a process-to-property workflow that couples DEM deposition, pore-network characterization, fractal analysis, and Darcy-scale permeability evaluation. Two open questions are addressed: (i) how deposition sequence (normal vs. reverse grading) under controlled size ratios modifies pore-network statistics and permeability; and (ii) how a continuous particle-irregularity parameter alters permeability and directional anisotropy. To this end, we generate graded porous media via DEM with controlled bi-disperse particle sets and deposition order, and we introduce a Perlin-noise-based shape perturbation strategy to parameterize irregularity reproducibly [40,41]. The resulting digital samples are analyzed using a ball-and-stick pore network representation to extract pore/throat distributions and connectivity, complemented by box-counting fractal dimension of the pore space. Finally, intrinsic permeability is computed along three orthogonal directions using Darcy’s law under an imposed pressure gradient, enabling a consistent assessment of anisotropy. Compared with previous studies that typically treat pore structure as a static outcome, the present work contributes a process-based DEM–pore-network framework that explicitly links deposition order, particle-size contrast, and particle-shape irregularity to pore-structure evolution and directional permeability.
2. Materials and Methods
2.1. Construction of a Three-Dimensional Geometric Model for Complex Porous Media
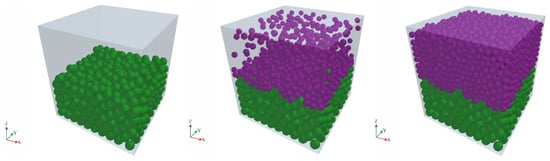
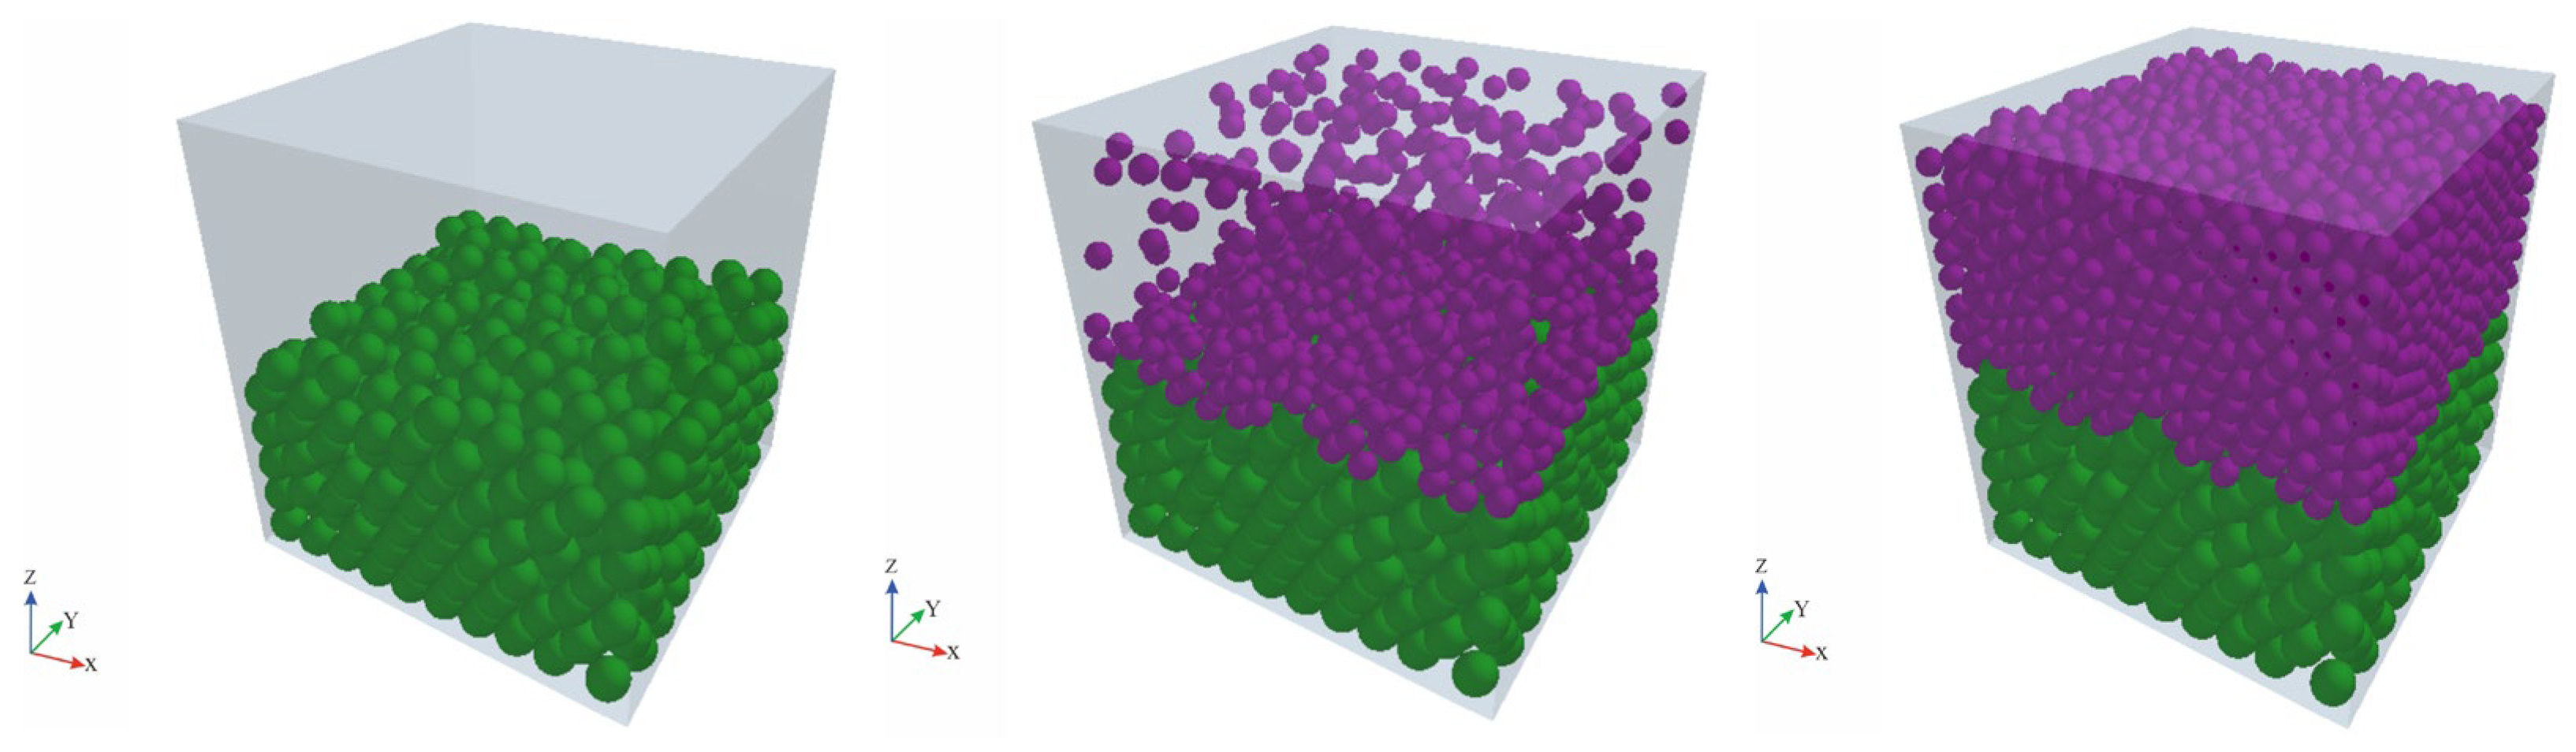
To investigate the influence of complex pore structures induced by deposition on seepage behavior, this study employed a discrete element method (DEM) platform, EDEM 2022 (Altair Engineering, Inc., Troy, MI, USA), to perform process-based modeling. A series of three-dimensional particle packings were generated, and the corresponding pore spaces were extracted and used as the three-dimensional geometric domains for subsequent numerical simulations. This workflow enables a realistic representation of the formation of complex porous media resulting from the deposition of discrete solid particles [42]. Heterogeneity was introduced by controlling the particle size combinations and deposition sequence, as well as by depositing particles with different shapes. The specific procedure for generating porous media with different size combinations and deposition orders is as follows. First, a cubic container with dimensions of 21 mm × 21 mm × 21 mm was defined as the computational domain. Second, the first particle group with a fixed diameter was injected into the domain; under gravity, the particles settled freely and underwent collision, compression, and rearrangement through inter-particle contacts. The injection of this group was terminated when the packing height reached approximately one-half of the container. Finally, the simulation was switched to the second particle group, which continued to settle until the container was filled to the top boundary, yielding a three-dimensional packing characterized by a two-level particle size distribution. Schematic illustrations of the key stages of deposition evolution and the final structure are presented in Figure 1.
Figure 1.
Three-dimensional packing process of particle deposition for different particle-size combinations (green and purple indicate particles with different diameters).
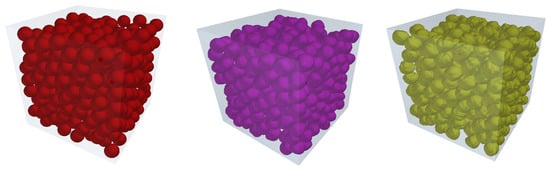
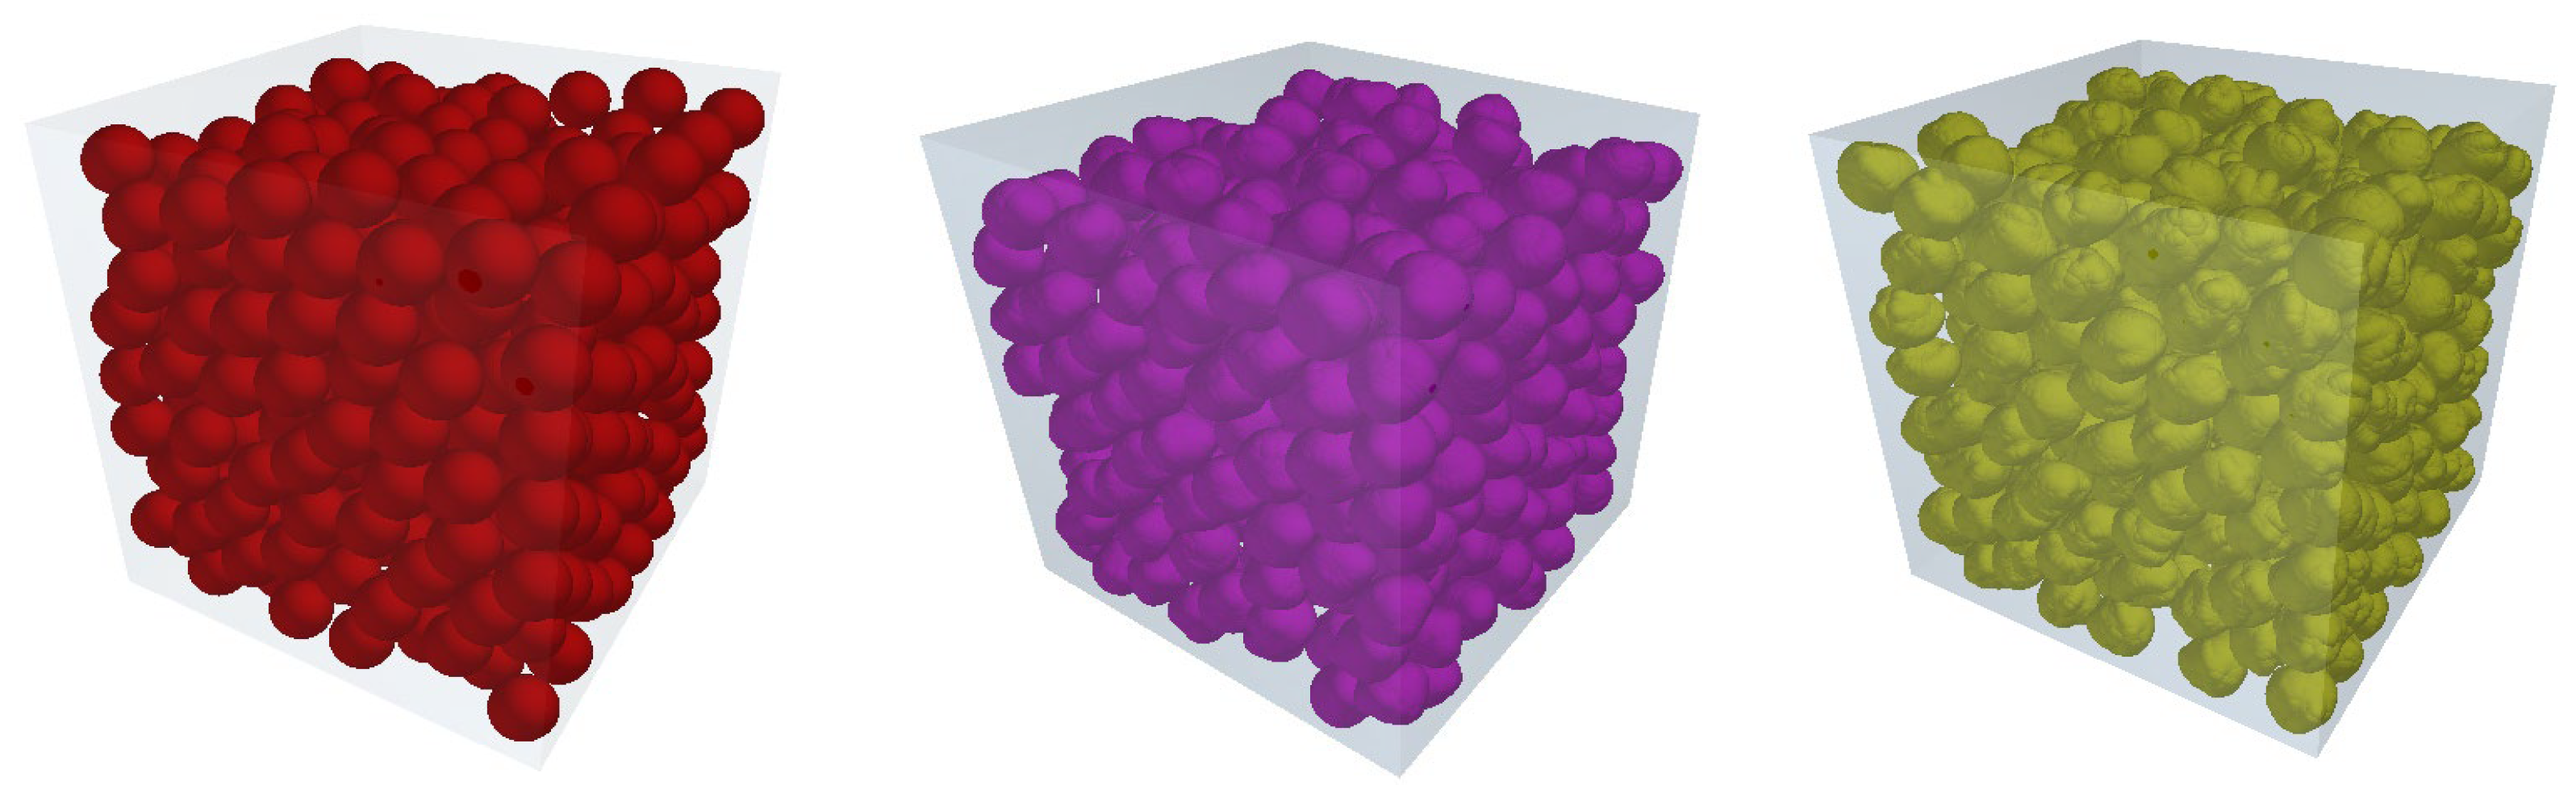
For the structures obtained by depositing particles with different shapes, a cubic container with dimensions of 16 mm × 16 mm × 16 mm was used. The final packed structures formed by particles with distinct morphologies are shown in Figure 2.
Figure 2.
Final three-dimensional packed configurations of particles with different shapes (red: γ = 0.0; purple: γ = 1.0; gold: γ = 2.0).
2.2. Configuration of Key Parameters: Deposition Sequence, Particle-Size Combinations, and Particle Shape
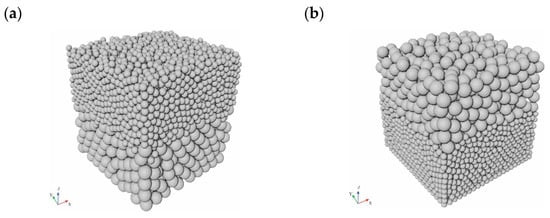
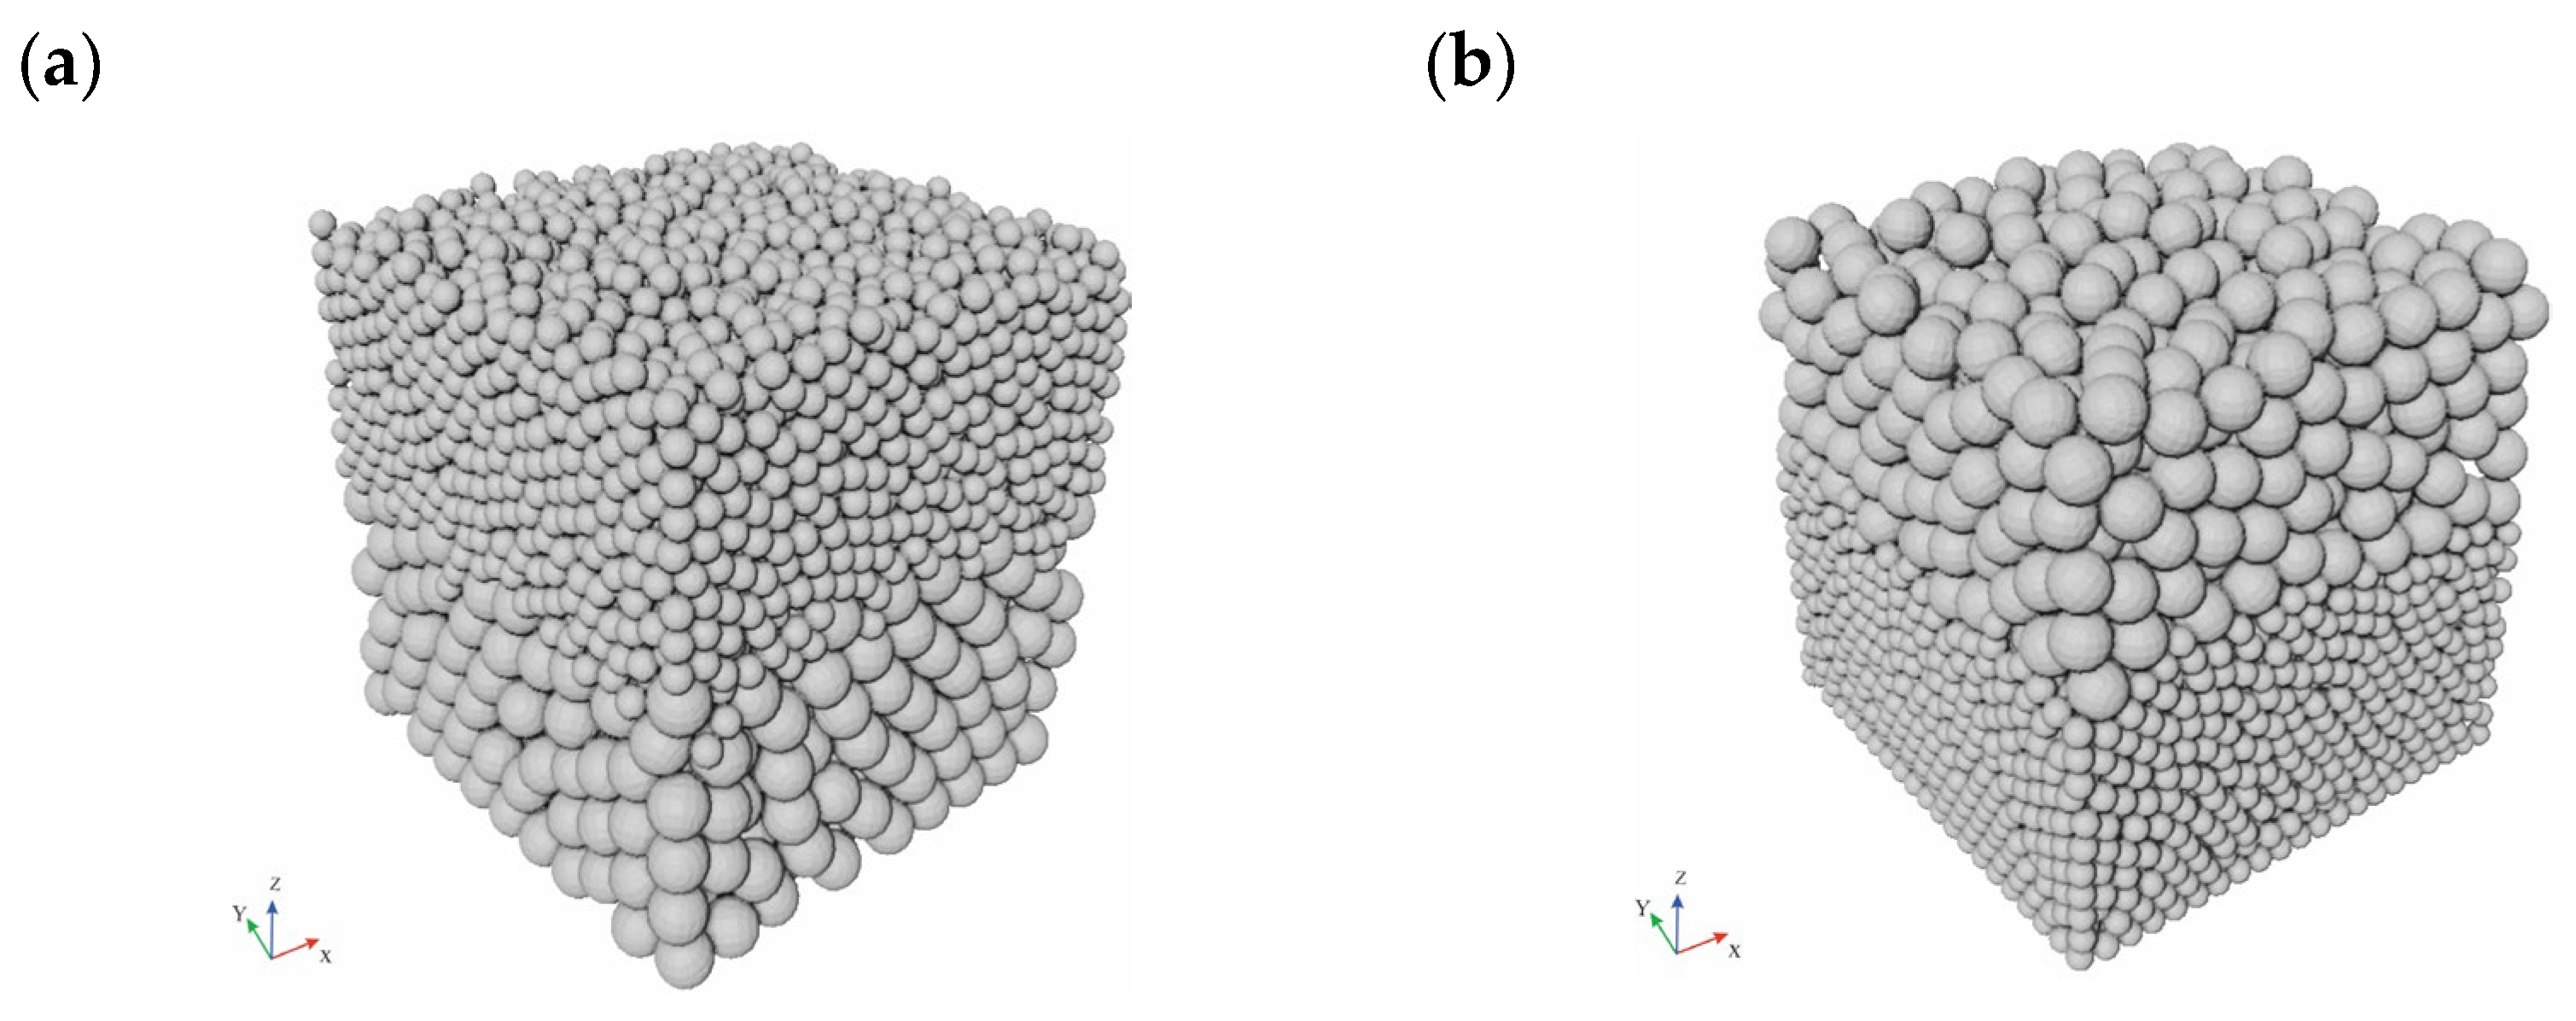
Deposition sequence is widely regarded as a primary driver of pore-structure heterogeneity in granular deposits. To isolate and quantify this effect, we treated the deposition order as the sole control variable and considered two end-member configurations: a normally graded sequence and an inversely graded sequence. The normally graded case corresponds to the preferential emplacement of coarse particles followed by the downward migration and interstitial infilling of fine particles, whereas the inversely graded case reverses this order, with fine particles deposited first and coarse particles subsequently emplaced. For spherical assemblies, the coarse-particle diameter was fixed at , whereas the fine-particle diameter was varied as 1.8, 1.6, 1.4, 1.2, 1.0, 0.8, 0.6, and 0.4 mm. Sequential injection and gravity-driven settling of the two size classes yielded three-dimensional packings exhibiting distinct grading signatures. Representative structures for (, ) are presented in Figure 3a and Figure 3b for the normally graded and inversely graded cases, respectively.
Figure 3.
Depositional packings for the normally graded and inversely graded sequences with particle diameters of 2 mm and 1 mm. (a) Normally graded deposition. (b) Inversely graded deposition.
Models of individual particles with different morphologies were generated using a procedural approach. The implementation primarily involved several key modules, including 3D mesh/voxel representation and collision-detection management, three-dimensional visualization, neighborhood-search algorithms, and the construction of noise functions. The shape control scheme and its mathematical formulation are described as follows. Taking a unit sphere of radius is perturbed by band-limited, multi-scale noise, thereby producing particle surfaces with irregular undulations [40]. Specifically, the perturbed radial (shape) function can be written as:
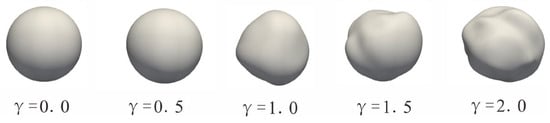
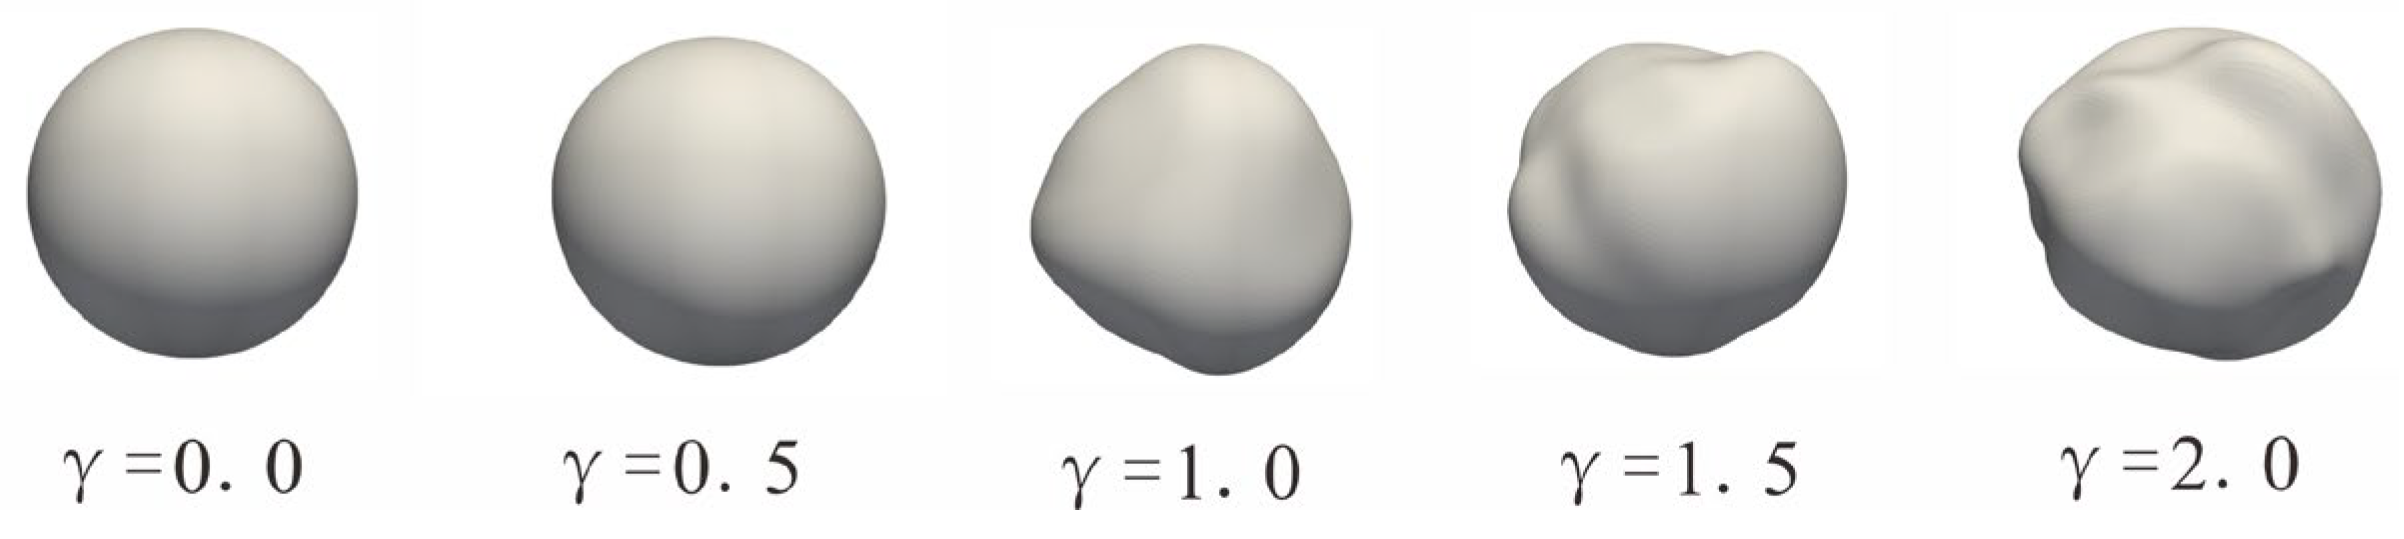
where denotes a two-dimensional noise field with zero mean and normalized amplitude (implemented using Perlin noise), is the attenuation weight, and L is the number of scale levels. The shape-perturbation coefficient controls the strength of surface irregularity: = 0 yields a perfect sphere, and as increases from 0.0 to 2.0, the particle surface progressively develops non-uniform features such as undulations, grooves, and wavy topography.
As shown in Figure 4, the spherical particles generated under different values and their three-dimensional visualizations are presented.
Figure 4.
Single-particle shapes generated with = 0, 0.5, 1.0, 1.5, and 2.0.
2.3. Theoretical Background
To quantitatively characterize the spatial distribution of pore structures within the three-dimensional packings, each individual particle was represented by a volume-equivalent sphere (i.e., an equivalent-sphere model). The corresponding equivalent diameter was calculated using Equation (2).
Fractal dimension is commonly used to quantify the relationship between pore structure and macroscopic properties: a larger fractal dimension indicates a more complex structure and stronger heterogeneity [43,44]. In fractal theory, widely used approaches for estimating fractal dimension include the self-similarity method, model-based inversion, and the box-counting method [45]. Among these, the box-counting method has been extensively applied in porous-media research due to its intuitive implementation, computational efficiency, and good accuracy. In this method, the target image (e.g., CT slices of a core) is covered by square boxes of varying sizes; the number of boxes containing pore pixels/voxels is counted, and the fractal dimension
where denotes the volume of the geometric object, denotes its surface area, is the three-dimensional fractal dimension, and is a constant.
The absolute permeability of the pore-network model was calculated based on Darcy’s law. In the simulations, a driving force was applied to the saturated fluid, the resulting volumetric flow rate was measured, and the permeability was obtained using the following equation:
where is the absolute permeability (in ), is the dynamic viscosity of the fluid, and is the volumetric flow rate (in ).
3. Results and Discussion
3.1. Influence of Deposition Order and Particle-Size Combinations on Pore Structure and Permeability
To quantitatively assess the effect of heterogeneity intensity on subsurface water flow, a suite of three-dimensional complex porous media with controllable parameters was generated following the aforementioned process-based modeling framework. Two categories of independent variables were considered: (1) deposition sequence (normally graded: coarse-first–fine-later; inversely graded: fine-first–coarse-later); and (2) particle-size combinations, in which the coarse-particle diameter was fixed at and paired with eight fine-particle diameters to form coarse–fine mixtures. From each 3D packing, a cubic sub-volume with a voxel size of 500 × 500 × 500 was consistently extracted as the study domain. With a voxel resolution of 40 μm, the physical dimensions of the sub-volume were 20 mm × 20 mm × 20 mm, thereby ensuring consistent spatial scale across all samples.
The pore space of each sample was then statistically characterized using the maximal ball algorithm, yielding a set of geometric and topological descriptors, including the pore equivalent radius , throat equivalent radius , throat length , and coordination number . To cover the parameter space while avoiding redundancy, only four representative normally/inversely graded samples are presented in the main text. These samples were selected based on intervals of the size ratio a low-R range (nearly similar particle sizes), two intermediate ranges, and a high-R range (strongly contrasted size pairing), so as to capture the overall trends of how deposition sequence governs pore structure and seepage characteristics.
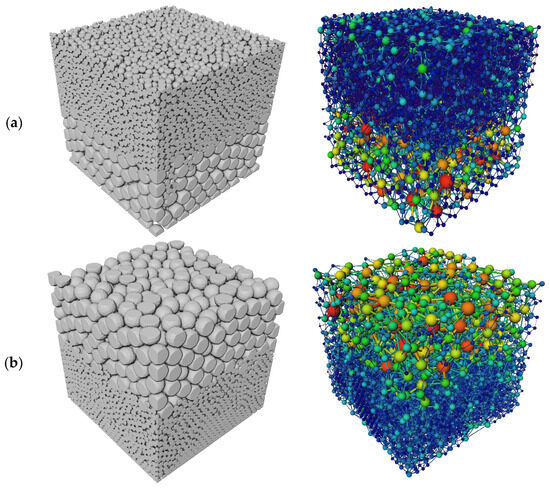
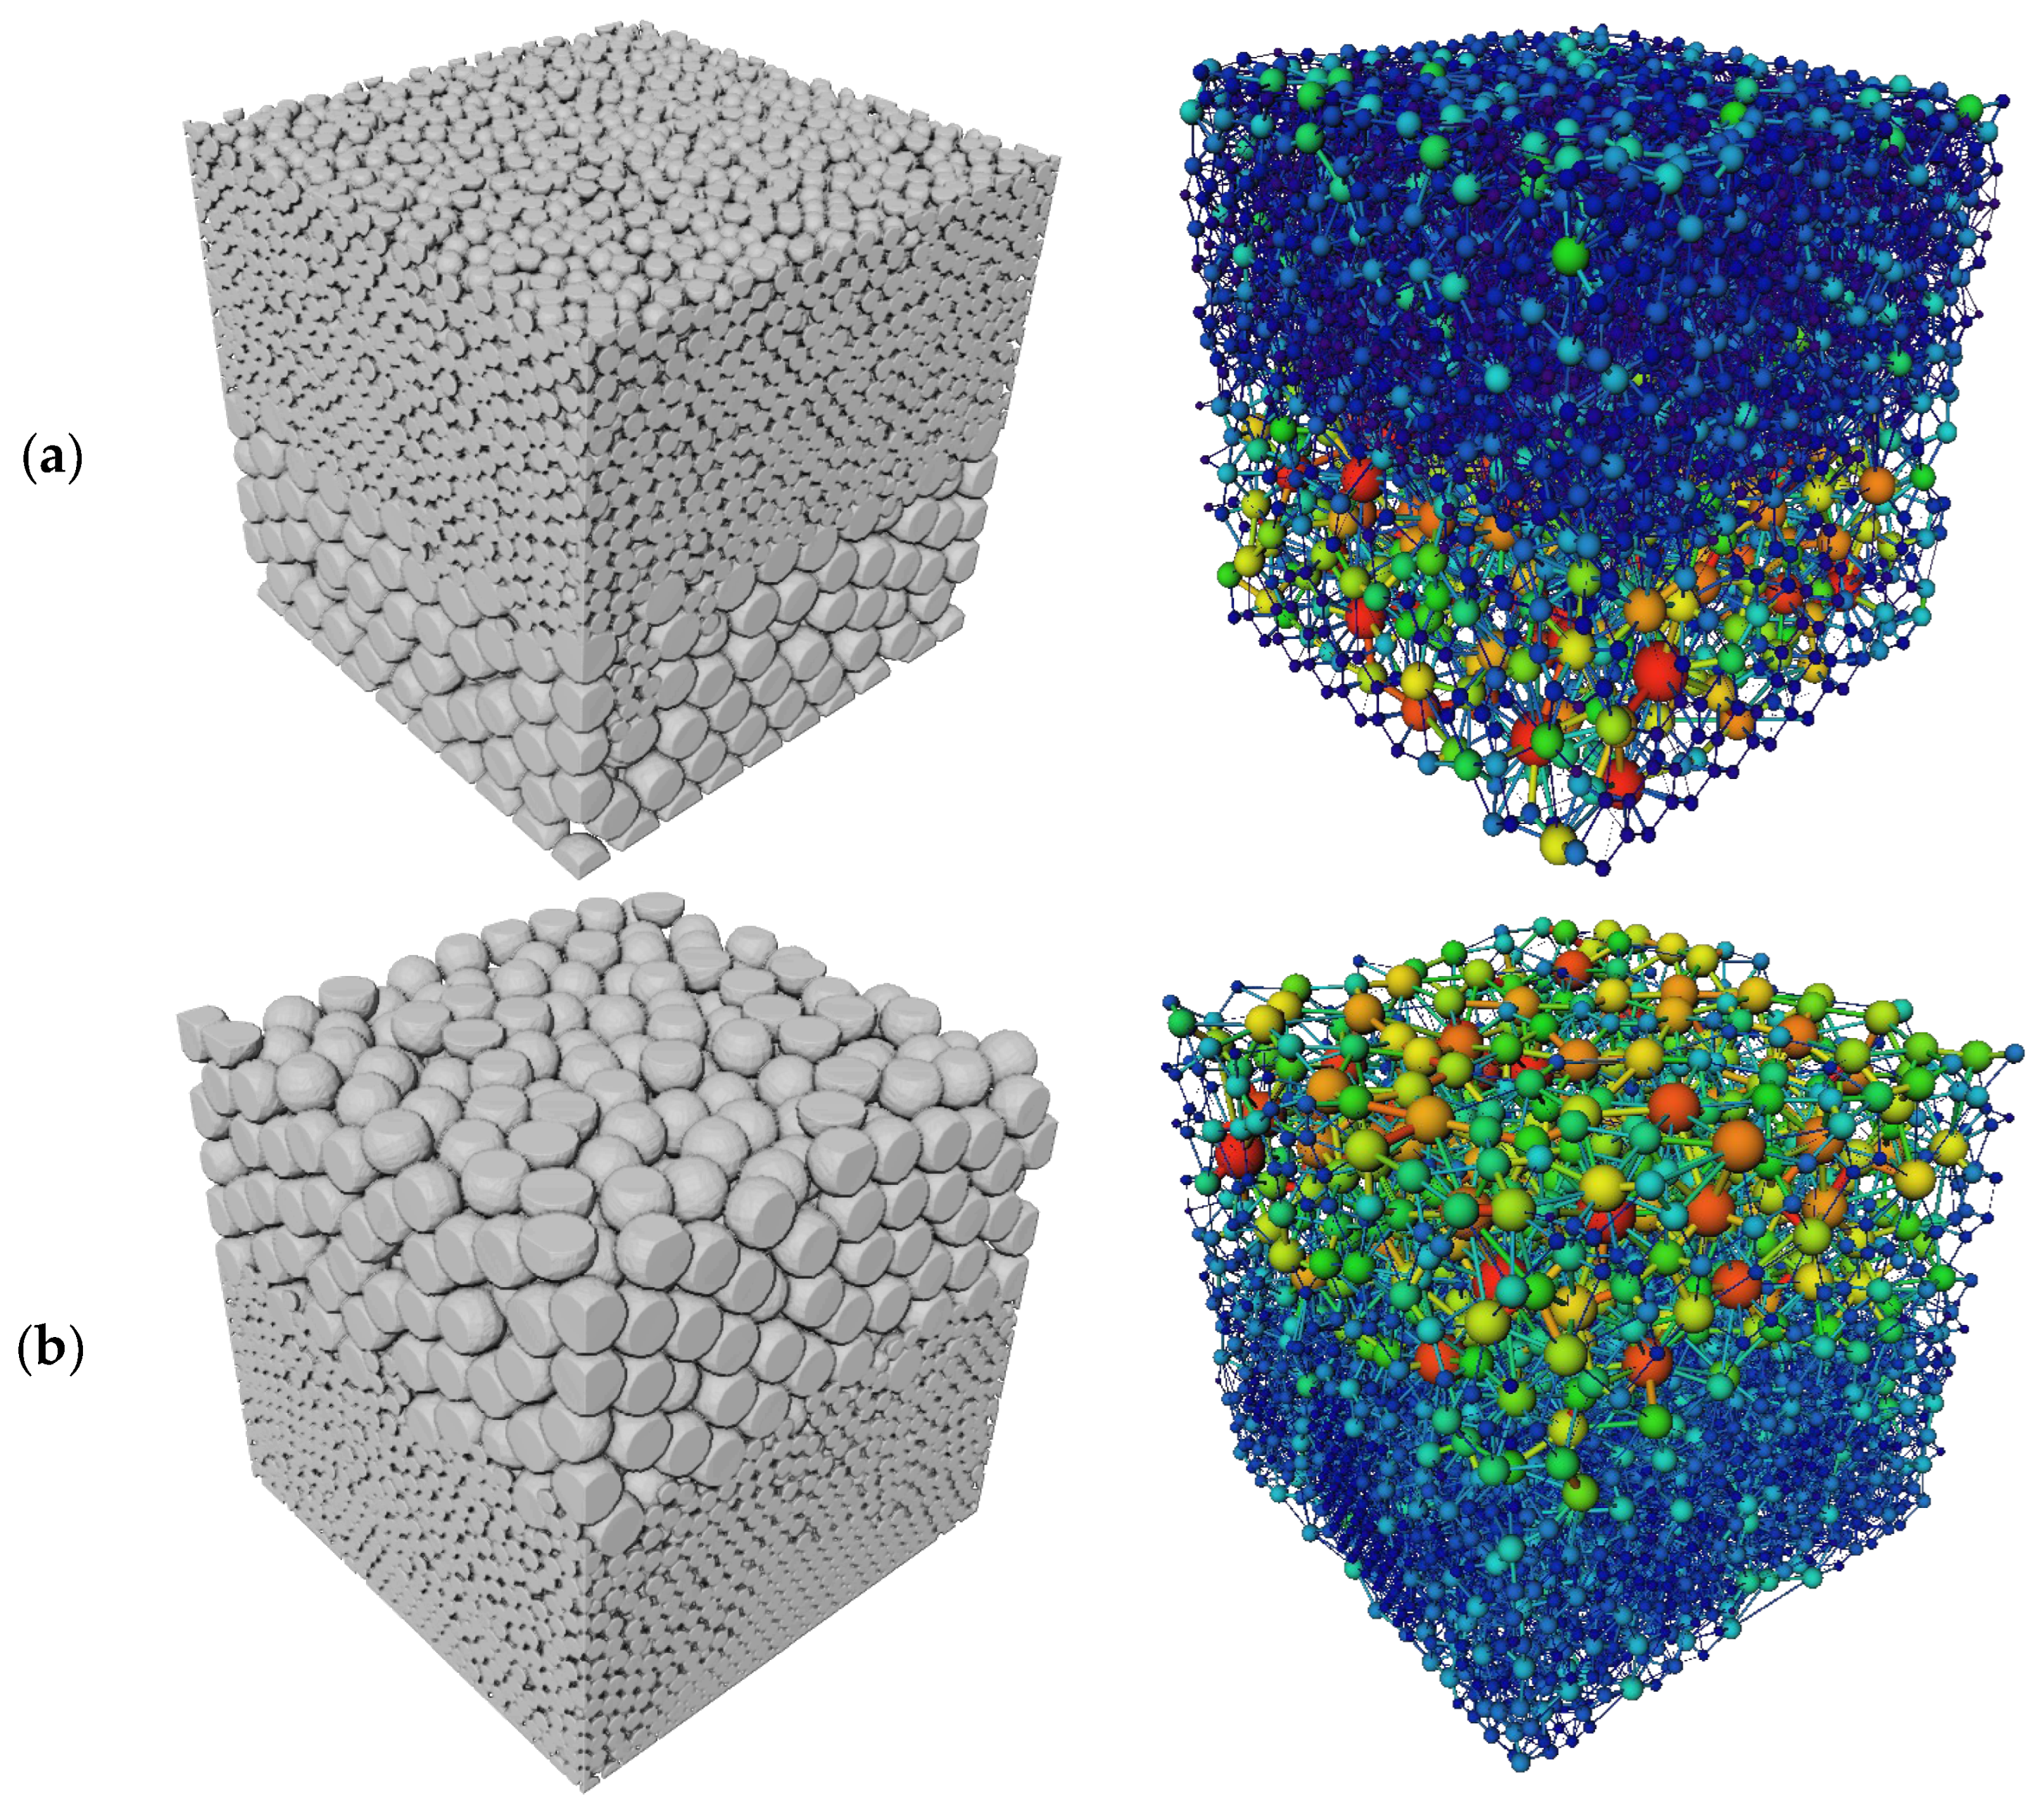
(1) Deposition with a particle-size combination of 2.0 mm–1.6 mm under normally and inversely graded sequences.
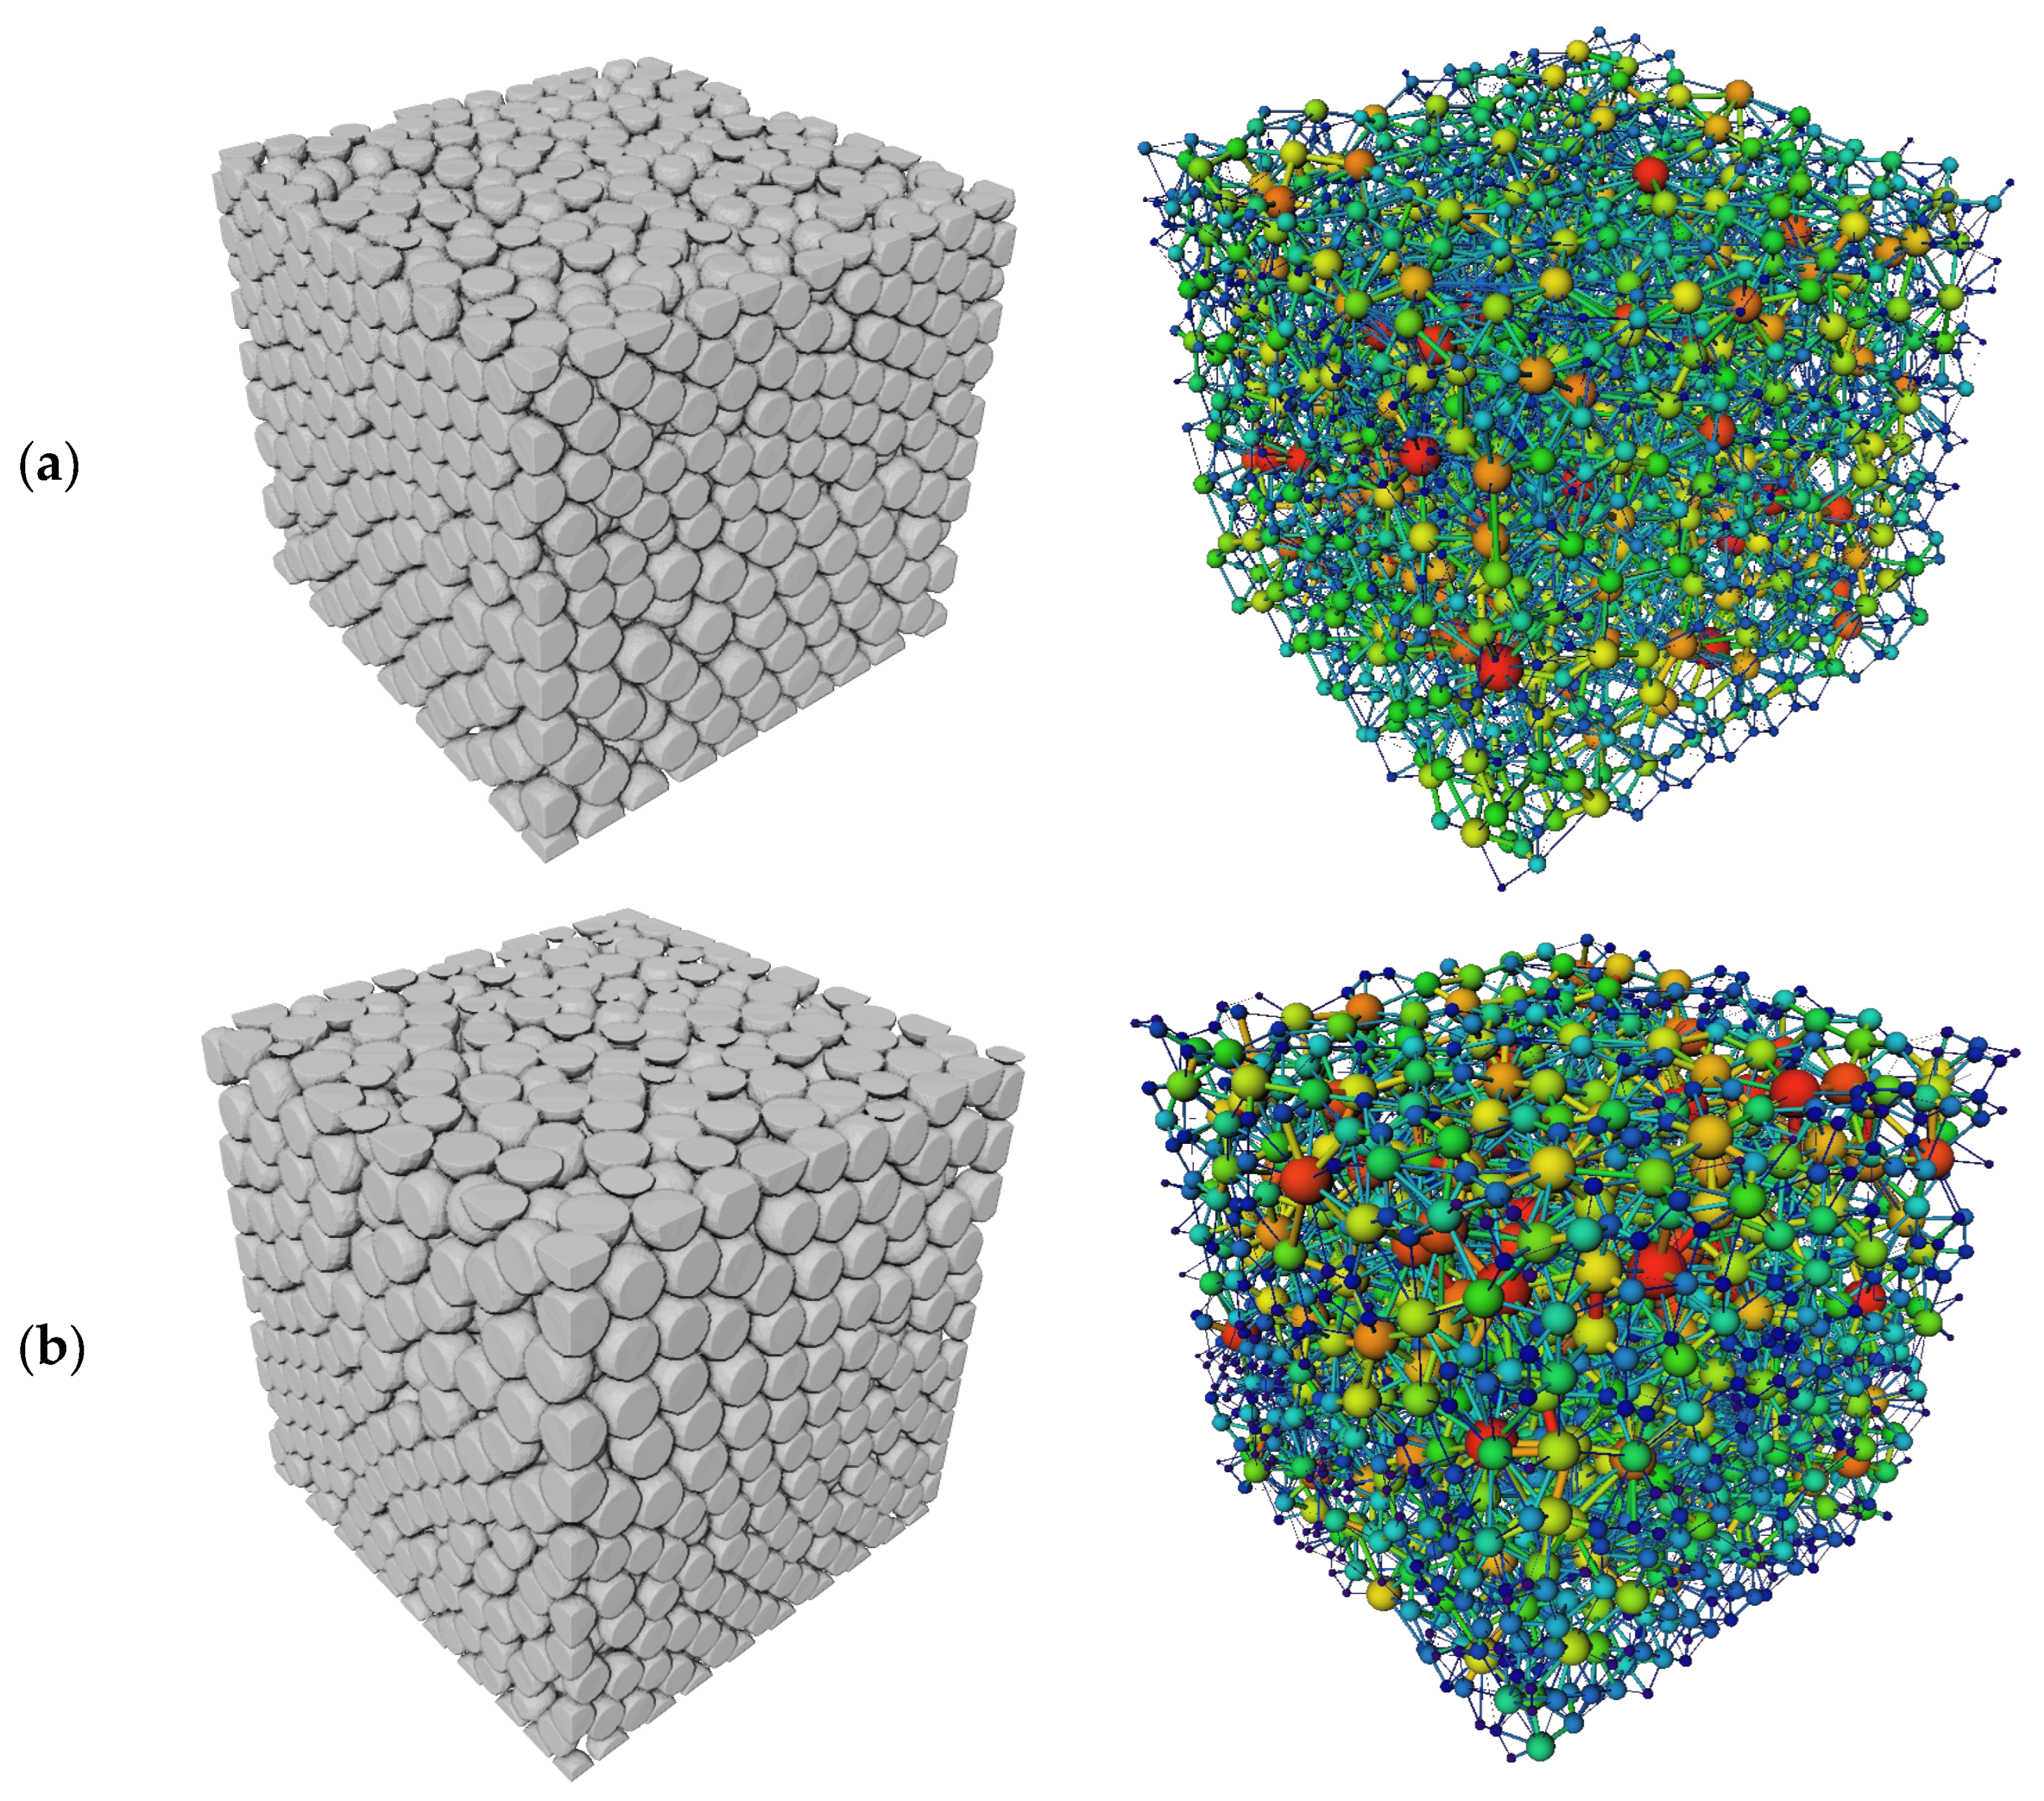
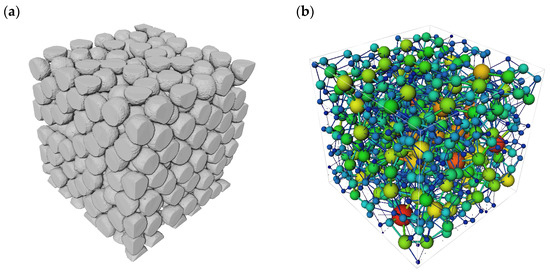
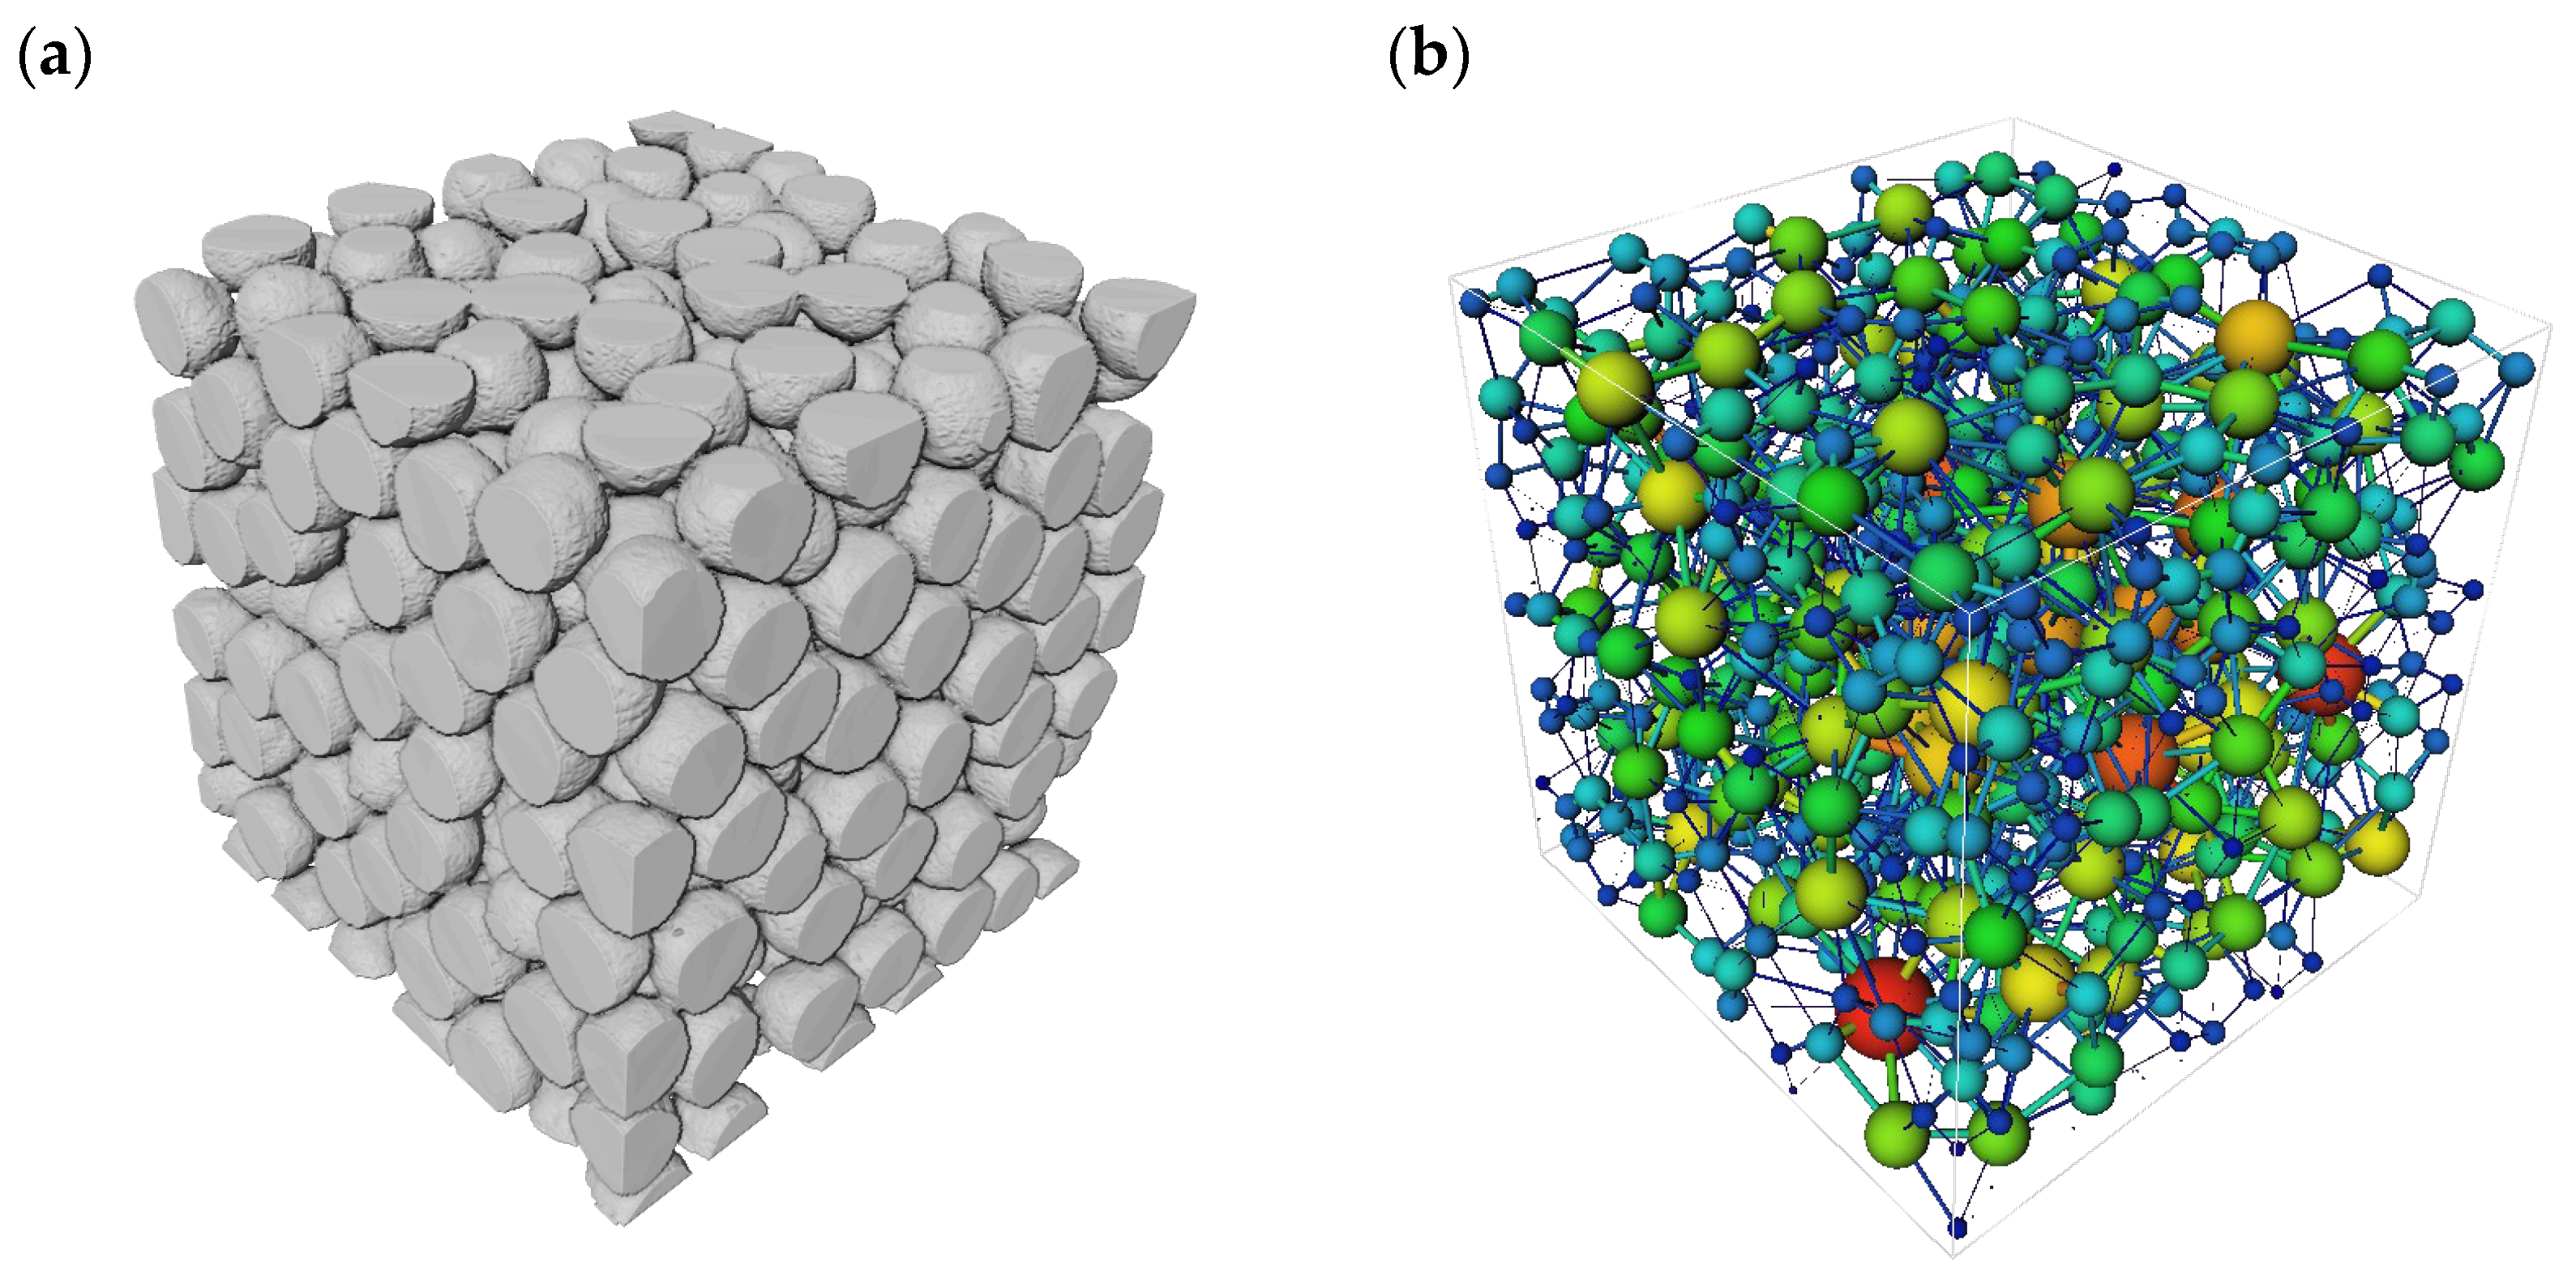
For the 2.0–1.6 mm size pairing, the resulting complex porous medium and the corresponding maximal-ball pore–throat model are shown in Figure 5. The normally graded sequence exhibits a subtle “coarse-over-fine” stratification, whereas the inversely graded sequence shows the opposite arrangement (“fine-over-coarse”). Using the maximal-ball model to quantify pore–throat geometry, the normally graded sample yields an average pore equivalent radius of = 762.3 μm, an average throat equivalent radius of = 302.8 μm, an average throat length of = 2501.1 μm, and a mean coordination number of = 10.23. In contrast, the inversely graded sample has = 626.6 μm, = 1936.1 μm, and = 9.16. Overall, the normally graded configuration exhibits larger pore and throat sizes, longer throats, and higher connectivity than the inversely graded configuration, indicating that the preferential deposition of coarse particles facilitates larger local pore bodies and longer throats in this representative case. However, these local geometric features do not alone determine the effective sample-scale permeability.
Figure 5.
Three-dimensional structures formed under normally and inversely graded deposition for the 2.0 mm–1.6 mm particle-size combination: (a) normally graded sequence—particle packing geometry (left) and maximal-ball pore–throat model (right); (b) inversely graded sequence—particle packing geometry (left) and maximal-ball pore–throat model (right).
(2) Deposition with a particle-size combination of 2.0 mm–1.2 mm under normally and inversely graded sequences.
For the 2.0–1.2 mm size pairing, the resulting complex porous medium and the corresponding maximal-ball model are shown in Figure 6. Statistics derived from the maximal-ball model indicate that the normally graded sample has an average pore equivalent radius of = 735.8 μm, an average throat equivalent radius of = 276.2 μm, an average throat length of = 2336.0 μm, and a mean coordination number of = 10.84. By contrast, the inversely graded sample yields = 578.8 μm, = 223.1 μm, = 1717.2 μm, and = 9.96. Compared with case (1), the normally graded configuration remains clearly advantageous in terms of characteristic size and connectivity. Notably, the late-stage infilling by fine particles primarily provides structural support without markedly constricting the dominant throats.
Figure 6.
Three-dimensional structures formed under normally and inversely graded deposition for the 2.0 mm–1.2 mm particle-size combination: (a) normally graded sequence—particle packing geometry (left) and maximal-ball pore–throat model (right); (b) inversely graded sequence—particle packing geometry (left) and maximal-ball pore–throat model (right).
(3) Deposition with a particle-size combination of 2.0 mm–0.8 mm under normally and inversely graded sequences.
For the 2.0–0.8 mm size pairing, the resulting complex porous medium and the corresponding maximal-ball model are shown in Figure 7. Based on the maximal-ball statistics, the normally graded sample exhibits an average pore equivalent radius of = 477.4 μm, an average throat equivalent radius of = 171.6 μm, an average throat length of = 1386.0 μm, and a mean coordination number of = 11.39. The inversely graded sample yields = 467.4 μm, = 169.3 μm, = 1350.2 μm, and = 11.21. Overall, the differences between the two sequences diminish substantially; however, the normally graded configuration still shows a slight advantage in throat size, throat length, and coordination number, suggesting that the sequence effect weakens at intermediate size contrasts.
Figure 7.
Three-dimensional structures formed under normally and inversely graded deposition for the 2.0 mm–0.8 mm particle-size combination: (a) normally graded sequence—particle packing geometry (left) and maximal-ball pore–throat model (right); (b) inversely graded sequence—particle packing geometry (left) and maximal-ball pore–throat model (right).
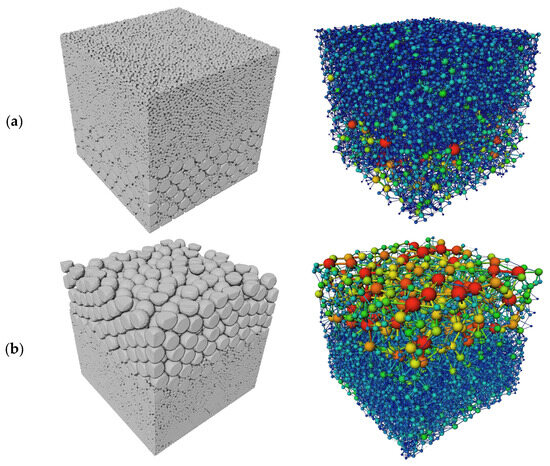
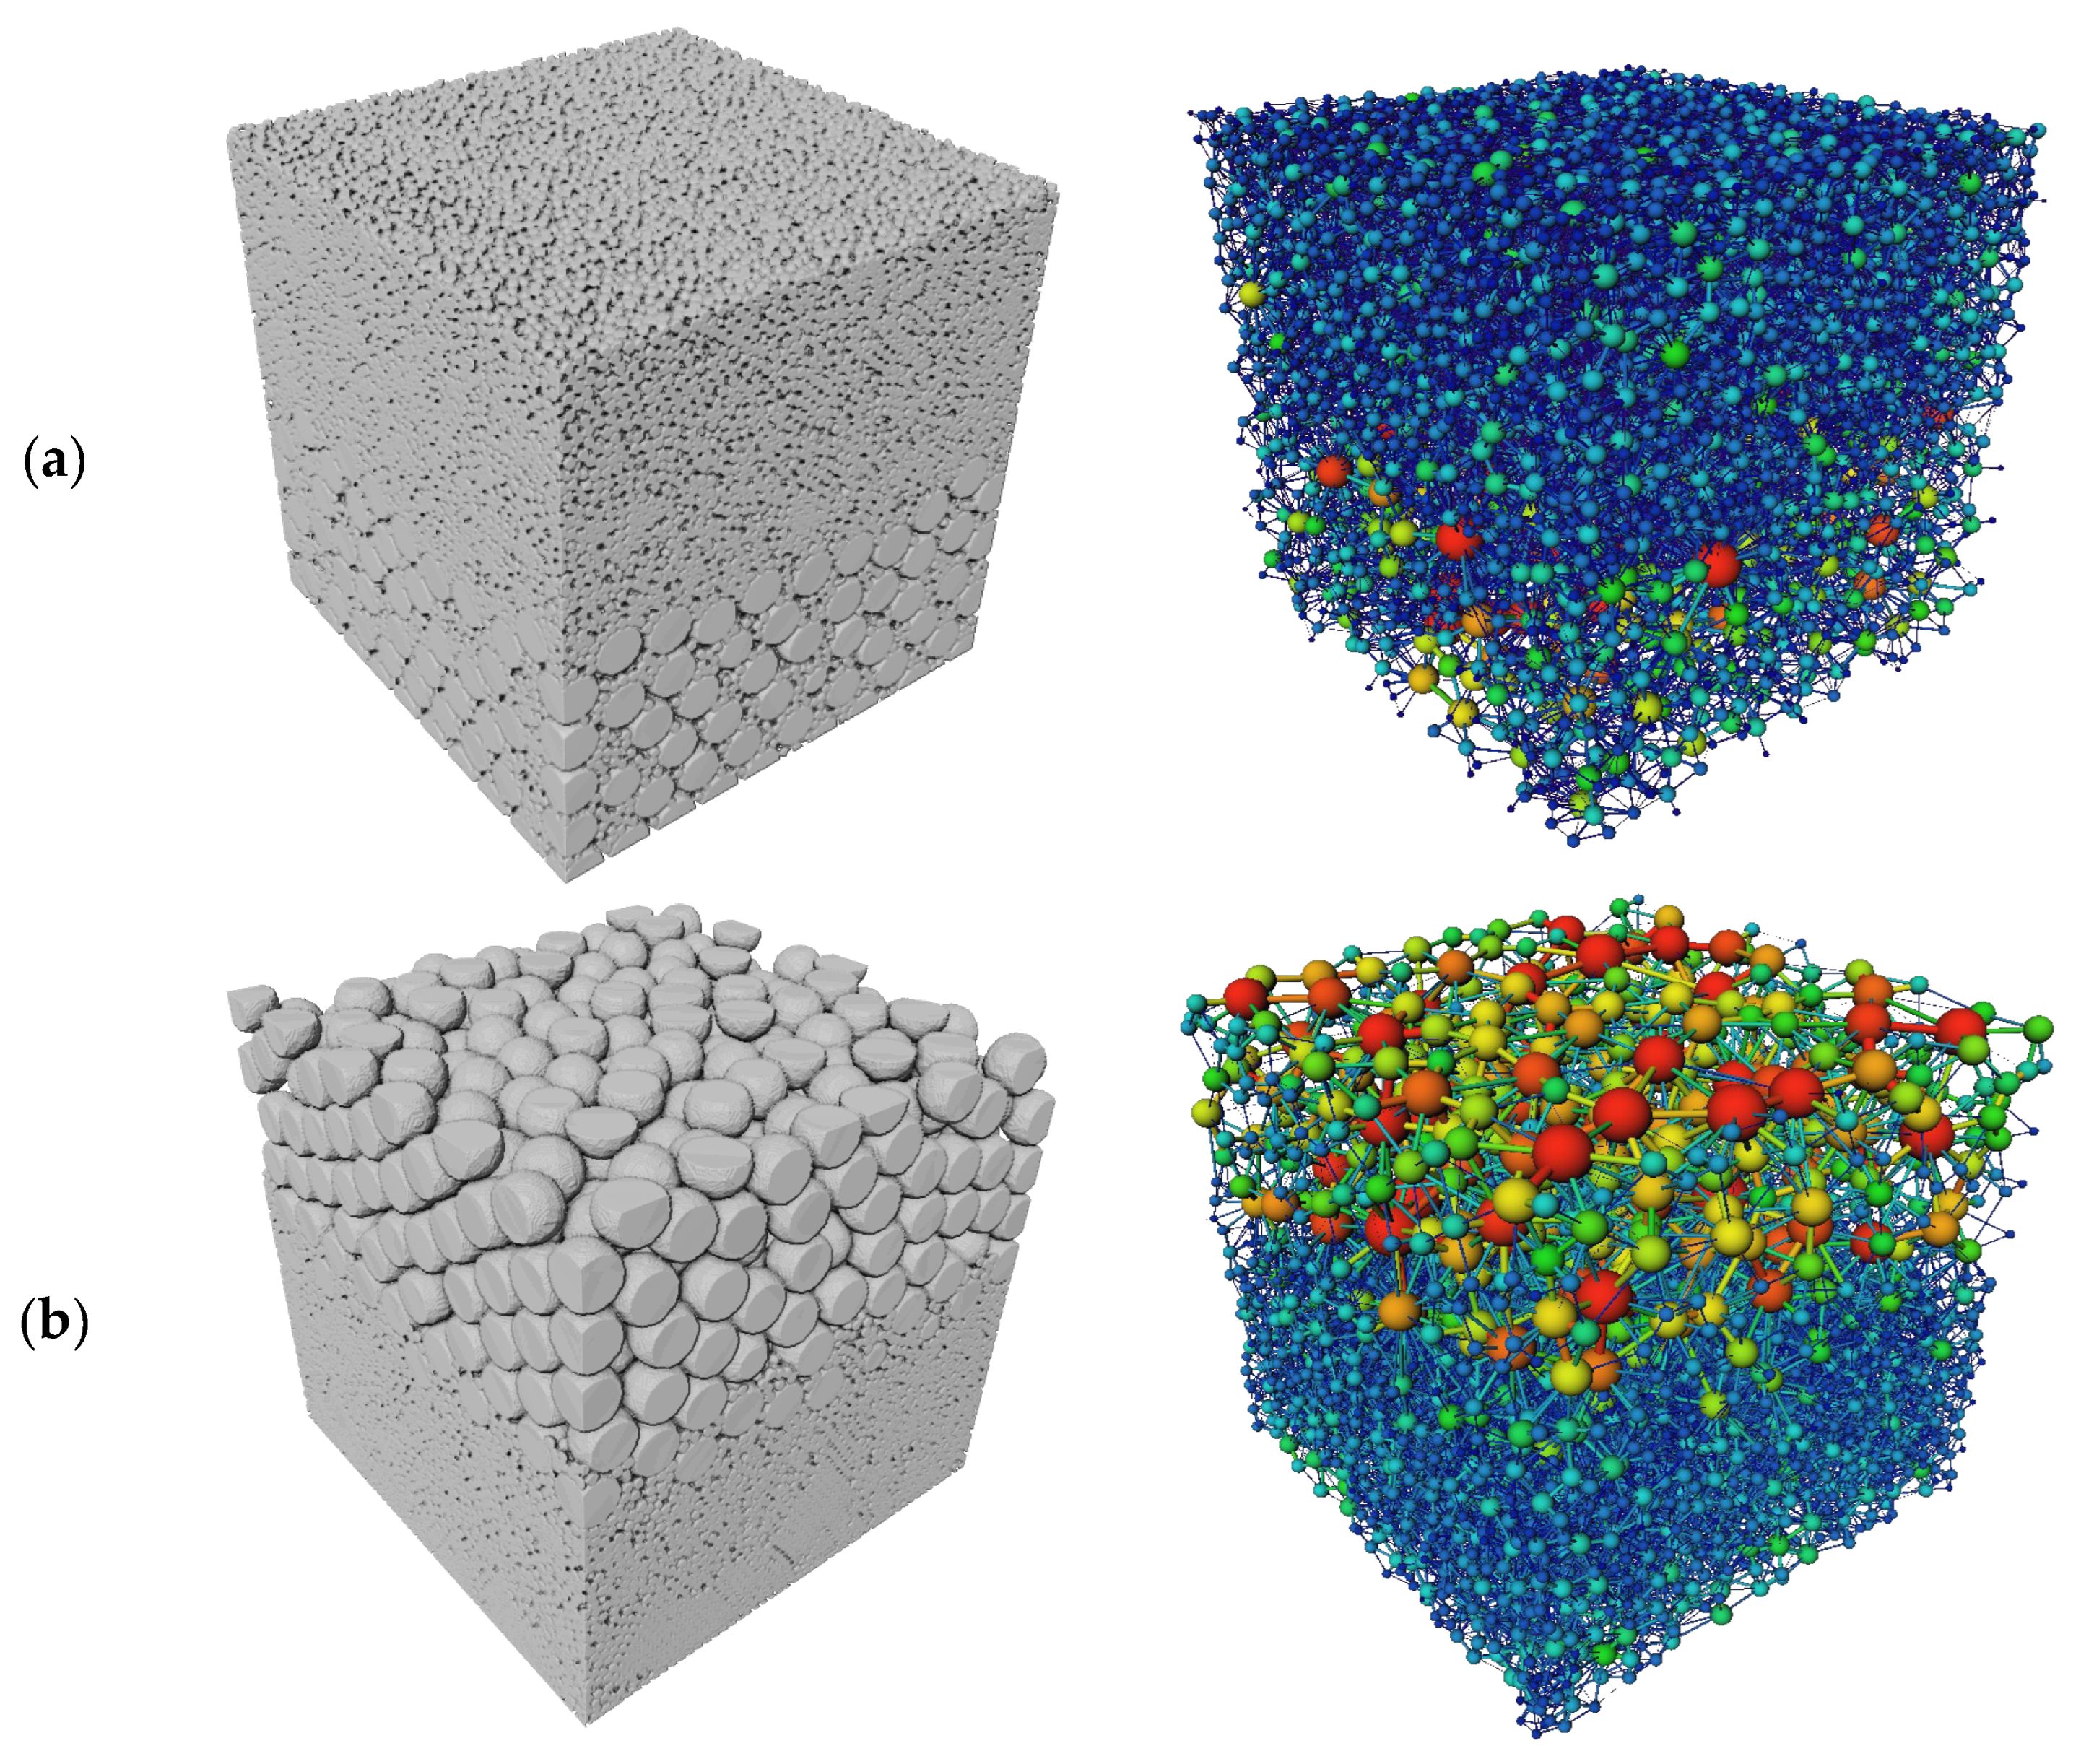
(4) Deposition with a particle-size combination of 2.0 mm–0.4 mm under normally and inversely graded sequences.
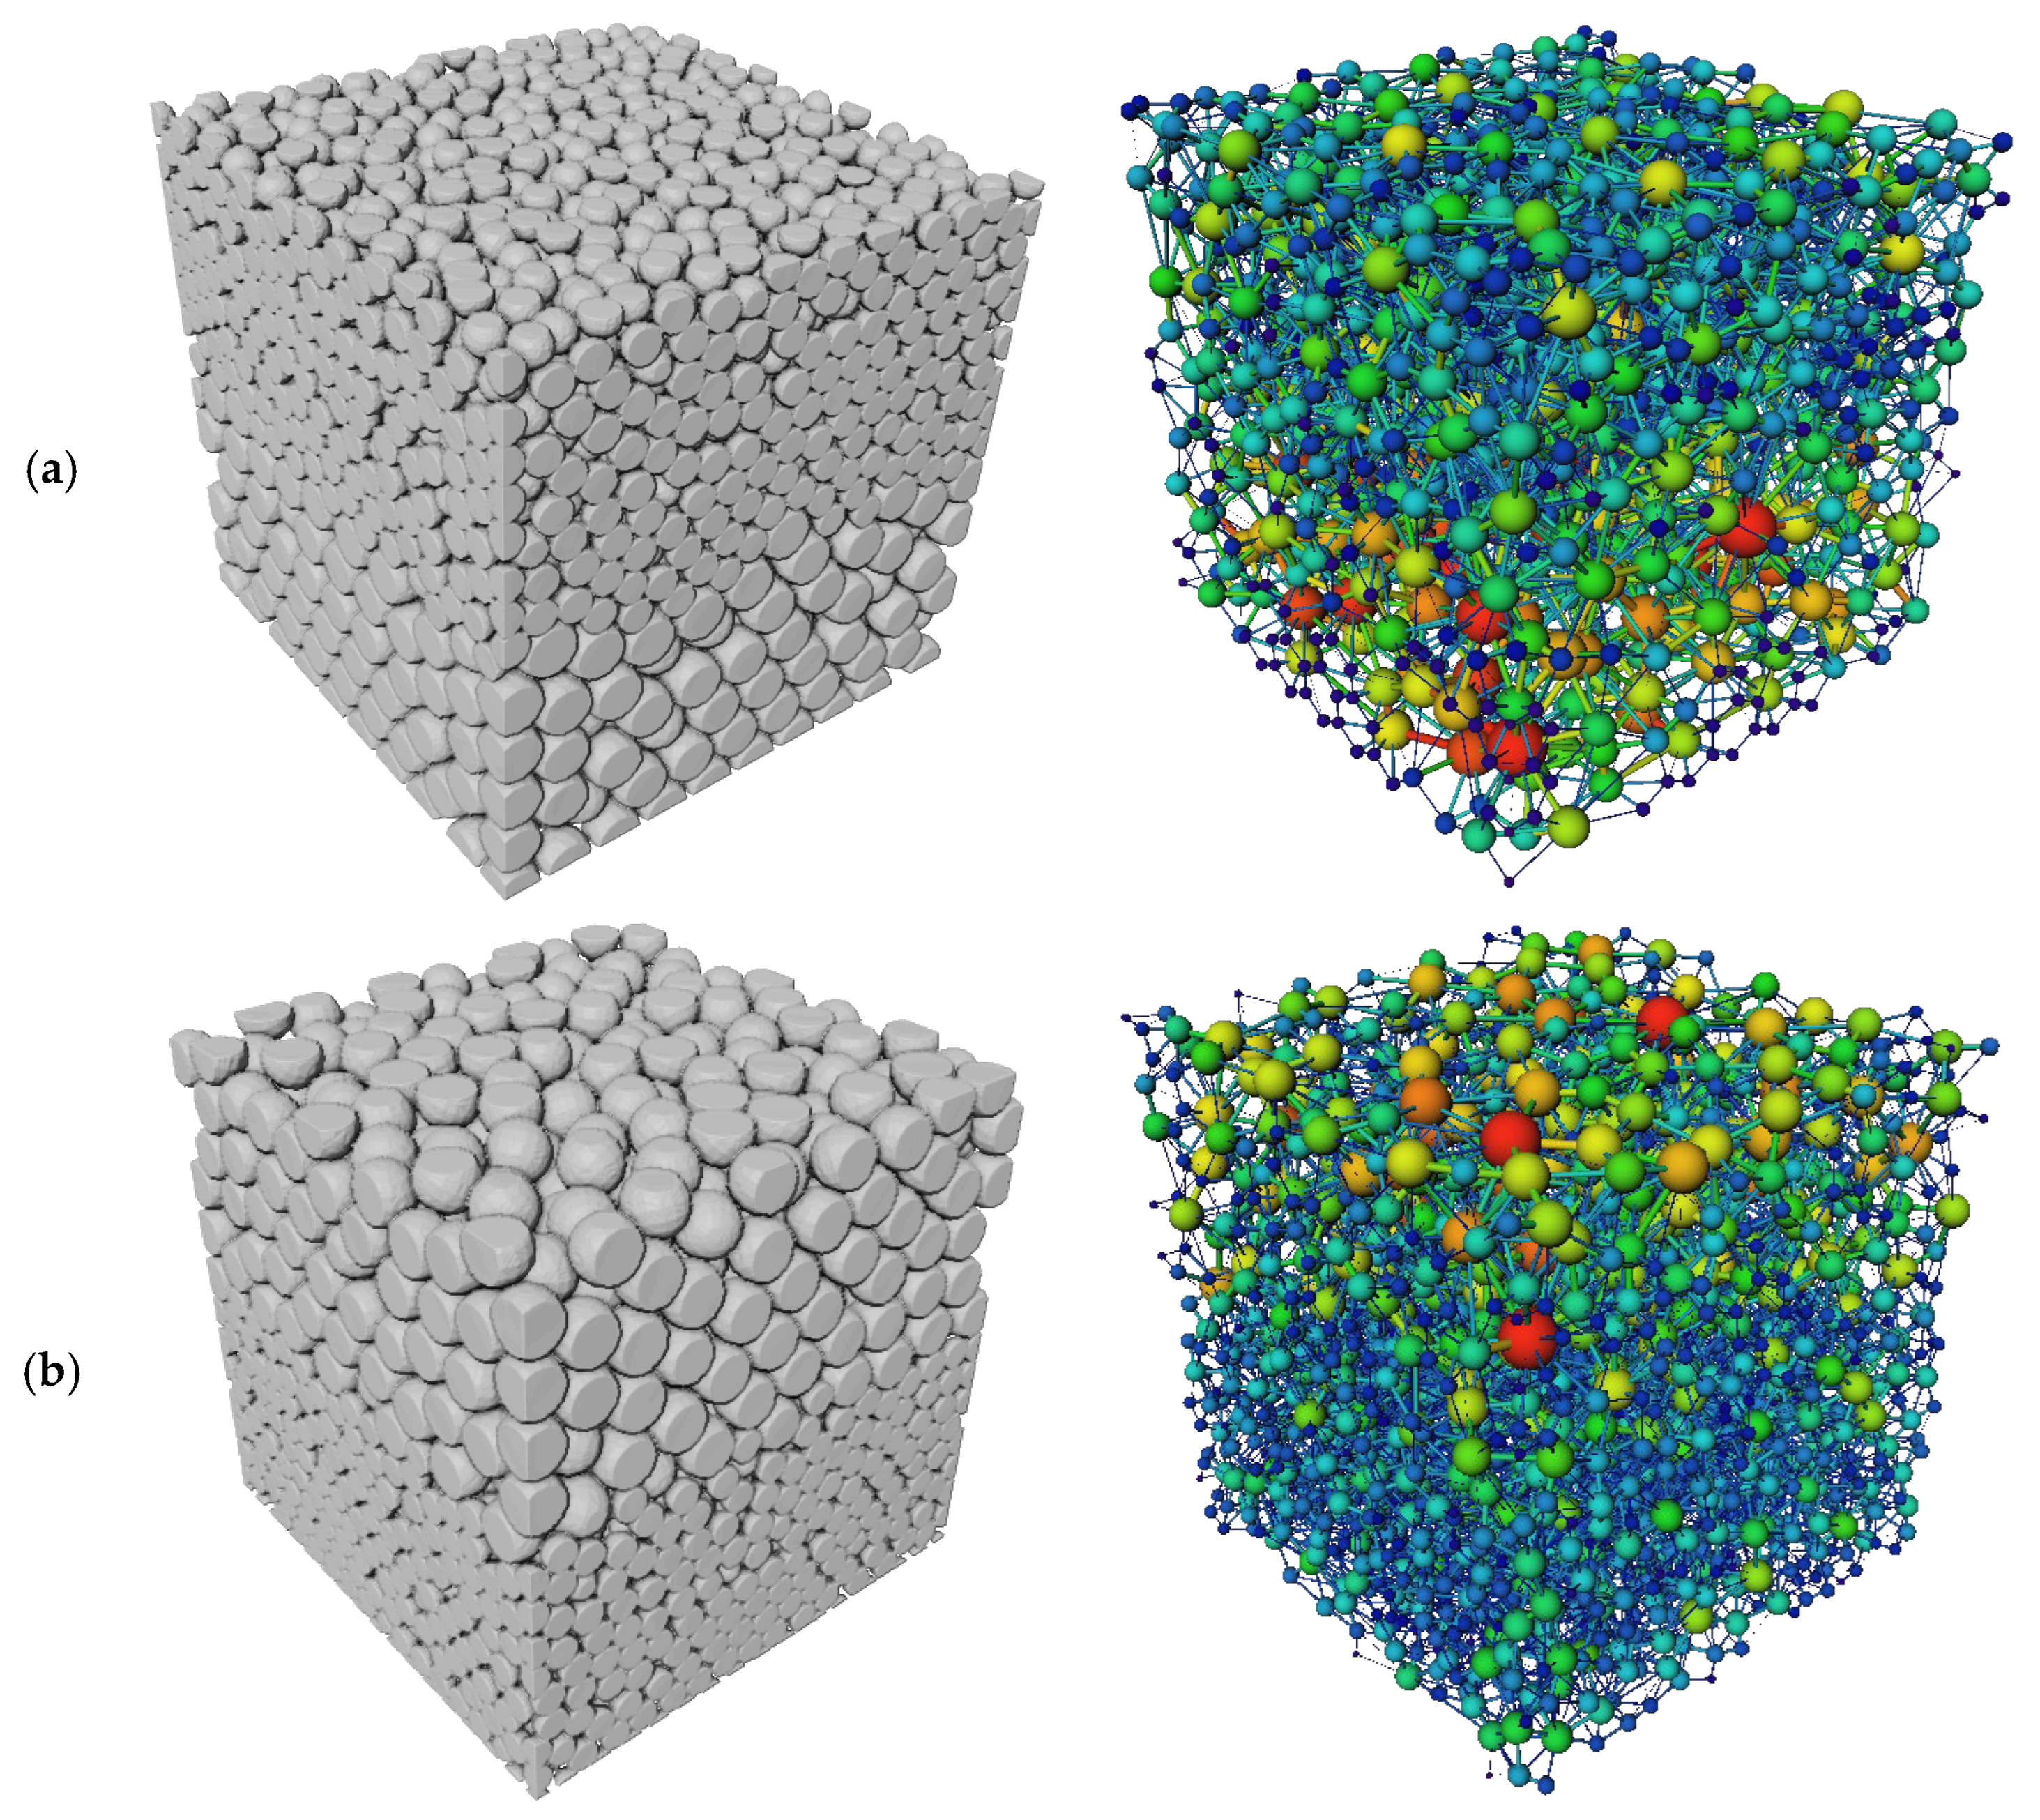
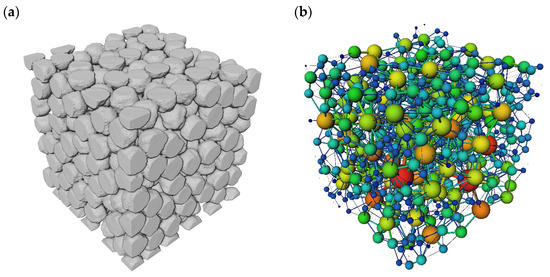
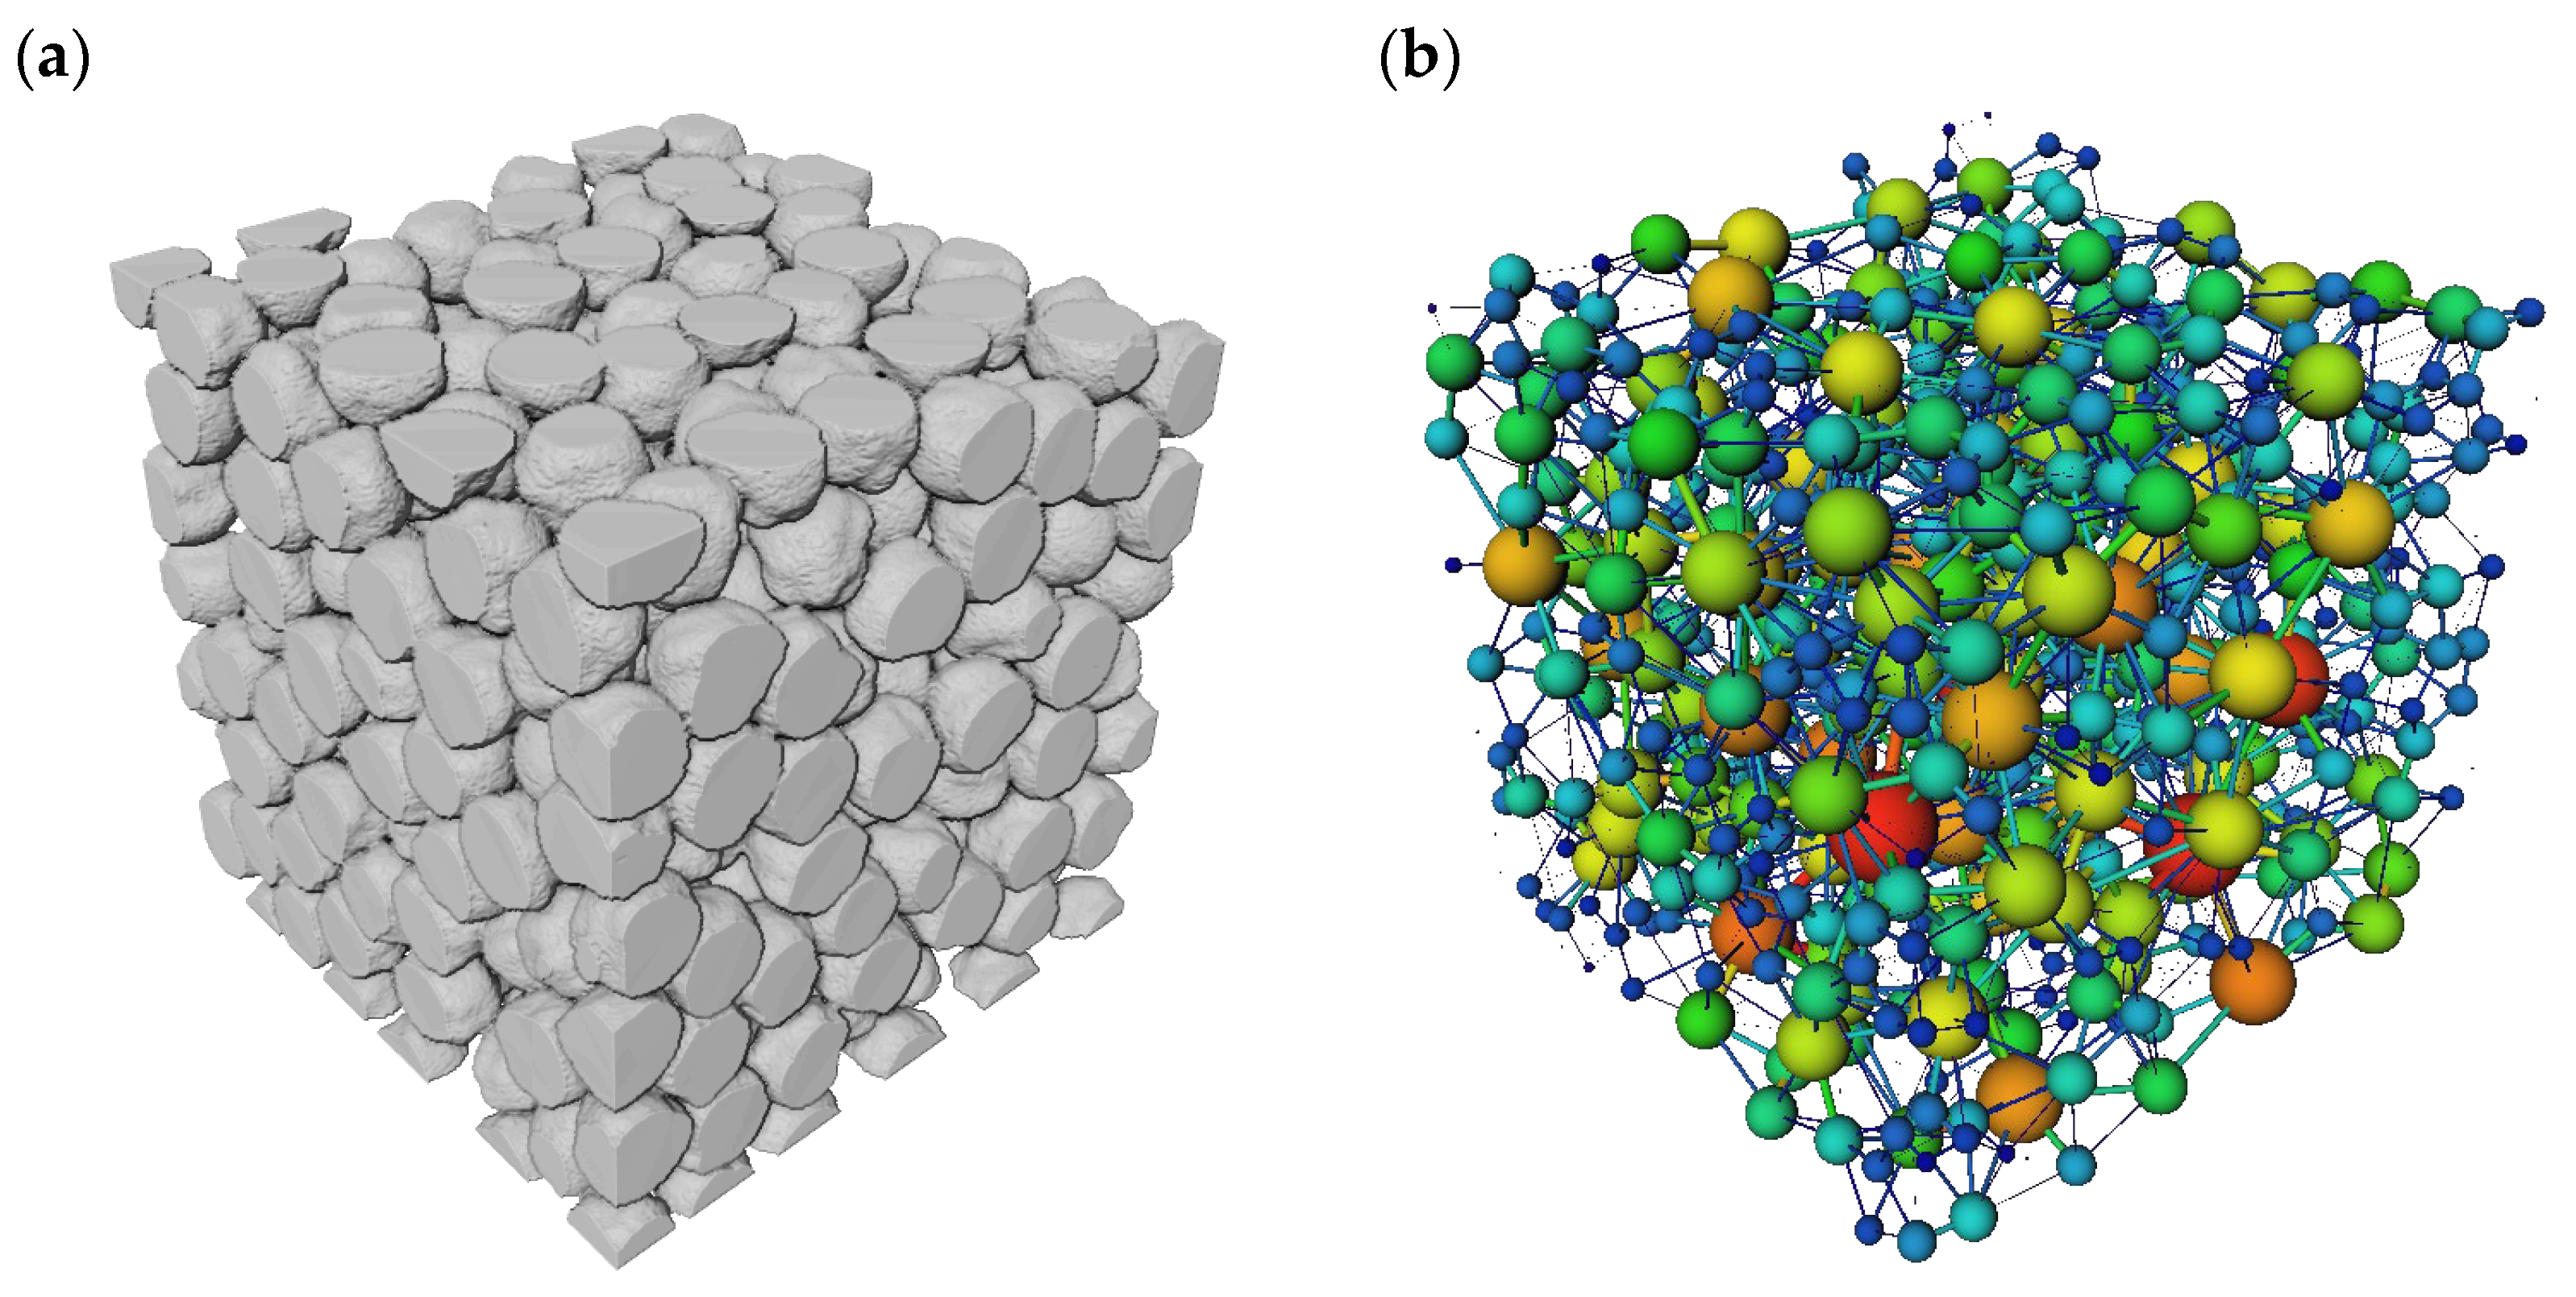
For the 2.0–0.4 mm size pairing, the resulting complex porous medium and the corresponding maximal-ball model are shown in Figure 8. The maximal-ball statistics indicate that the normally graded sample has an average pore equivalent radius of = 199.2 μm, an average throat equivalent radius of = 155.4 μm, an average throat length of = 1252.1 μm, and a mean coordination number of = 12.93. In contrast, the inversely graded sample yields = 432.2 μm, = 166.1 μm, = 1310.9 μm, and = 13.15. At a high size ratio (), a non-monotonic behavior emerges: the inversely graded configuration exhibits slightly larger pore sizes and higher connectivity. A plausible mechanism is that early deposition of fine particles forms a dense basal layer, whereas the subsequent emplacement of coarse particles creates relatively large voids and preferential flow pathways in the upper region, thereby increasing and in the statistics. By contrast, in the normally graded case, late-stage fine-particle infilling more readily constricts the interstitial throats between coarse particles, leading to a reduction in .
Figure 8.
Three-dimensional structures formed under normally and inversely graded deposition for the 2.0 mm–0.4 mm particle-size combination: (a) normally graded sequence—particle packing geometry (left) and maximal-ball pore–throat model (right); (b) inversely graded sequence—particle packing geometry (left) and maximal-ball pore–throat model (right).
Integrating the four cases reveals that, within the low-to-intermediate size-ratio range () the normally graded sequence consistently results in larger pores and throats, longer throats, and a higher coordination number. When the size ratio increases to = 5, the inversely graded sequence becomes dominant in terms of pore size and connectivity, indicating a threshold-type competitive interplay between deposition order and size contrast. From an engineering perspective, this suggests that under strongly contrasted grading, the “fine-first–coarse-later” scenario may promote more conductive preferential pathways in the upper region, whereas the “coarse-first–fine-later” scenario is more susceptible to throat constriction and increased tortuosity due to secondary infilling by fine particles.
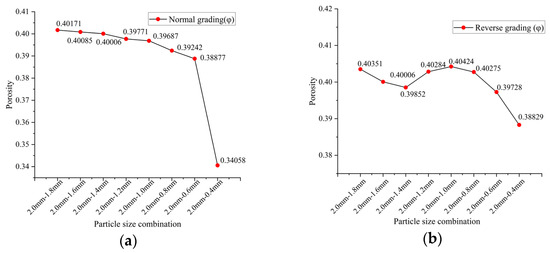
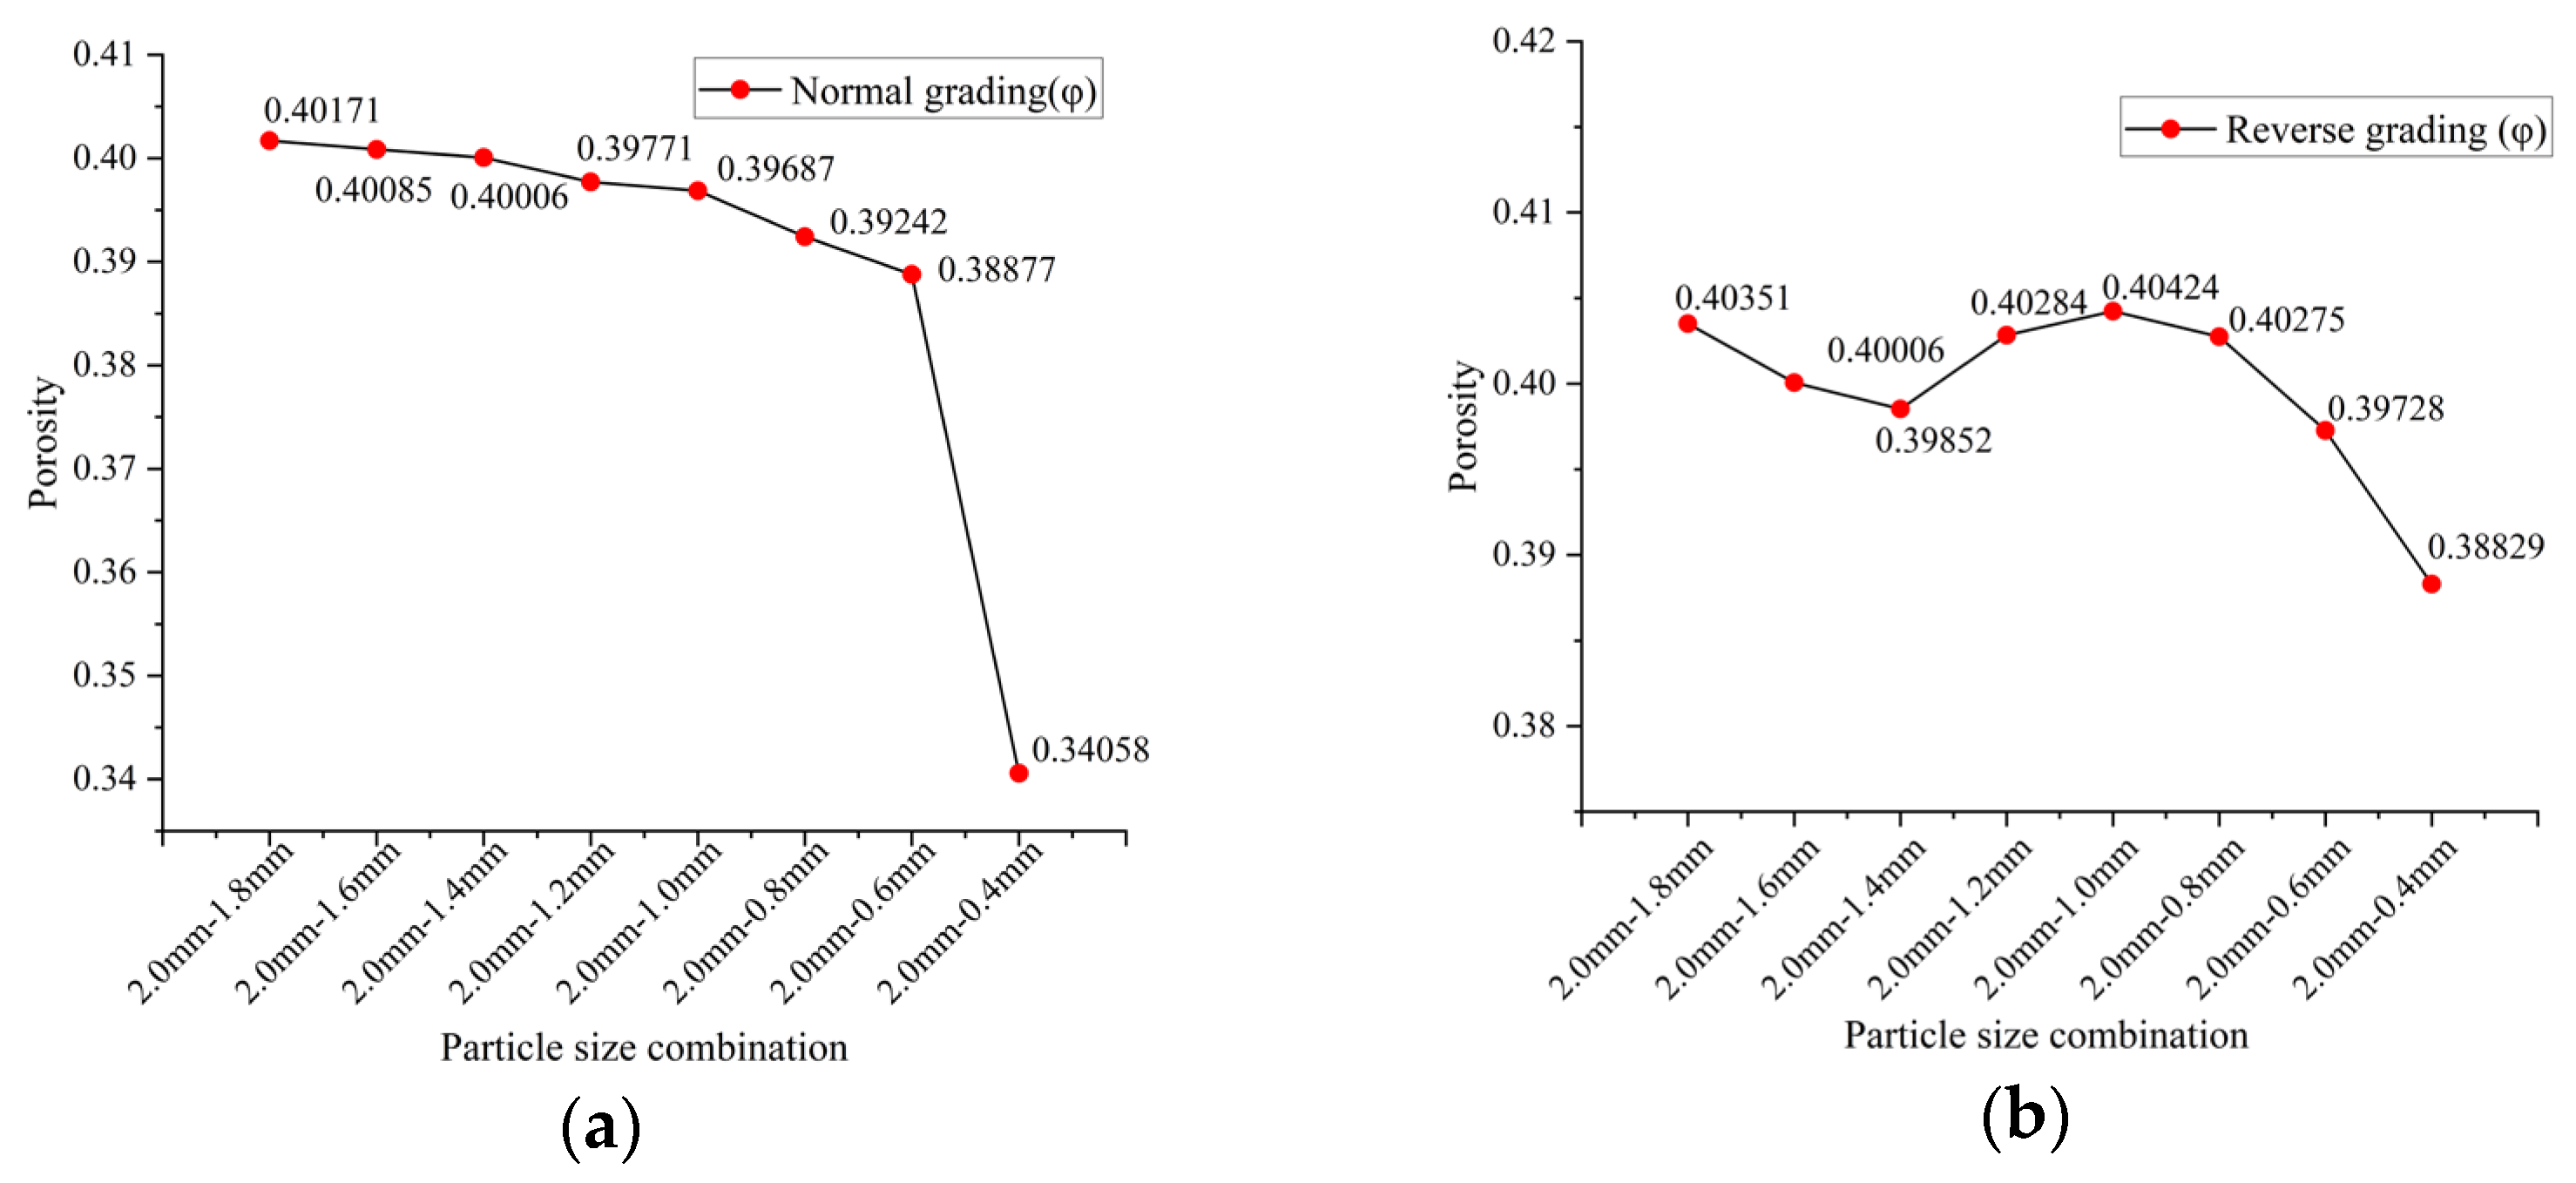
A statistical analysis of porosity was performed for porous media generated under the two opposite deposition sequences across different particle-size combinations. Under the normally graded condition (Figure 9a), the bulk porosity ϕ decreases monotonically with increasing size ratio (i.e., as the fine particles become smaller), with an accelerated decline observed for the strongly contrasted pairing (2.0–0.4 mm). This behavior can be attributed to the fact that, during the late-stage deposition, fine particles more readily penetrate the interstices between coarse particles and induce secondary infilling, which constricts both the pore bodies and throats and shortens the throats. As a consequence, the overall void volume fraction is reduced.
Figure 9.
Comparison of porosity (ϕ) for different particle-size combinations: (a) normally graded sequence; (b) inversely graded sequence.
In contrast, under the inversely graded condition (Figure 9b), the variation of ϕ with R is relatively weak; the curve is smoother and exhibits only a gradual decrease, without a pronounced monotonic trend or abrupt transition. This is because the vertically stratified structure formed in the inversely graded sequence involves two competing, partially compensating effects. Early deposition of fine particles, together with gravitational and contact forces, forms a dense basal layer, leading to local shrinkage of pore bodies and throats in the lower region and thus a reduction in ϕ. Subsequently, coarse particles are deposited on top of this dense base and are mechanically “supported,” which preserves larger pore chambers and relatively straight preferential pathways in the upper region, thereby increasing or offsetting the reduction in ϕ. The competition between these decreasing and increasing contributions yields an approximate balance over a broad range of R, making the macroscopic porosity markedly less sensitive to size contrast than in the normally graded case.
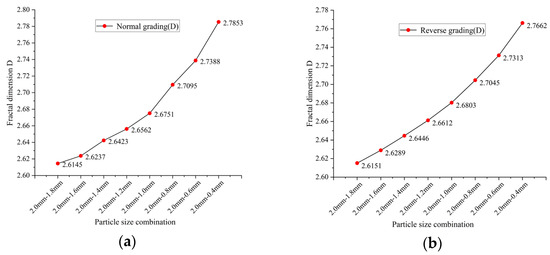
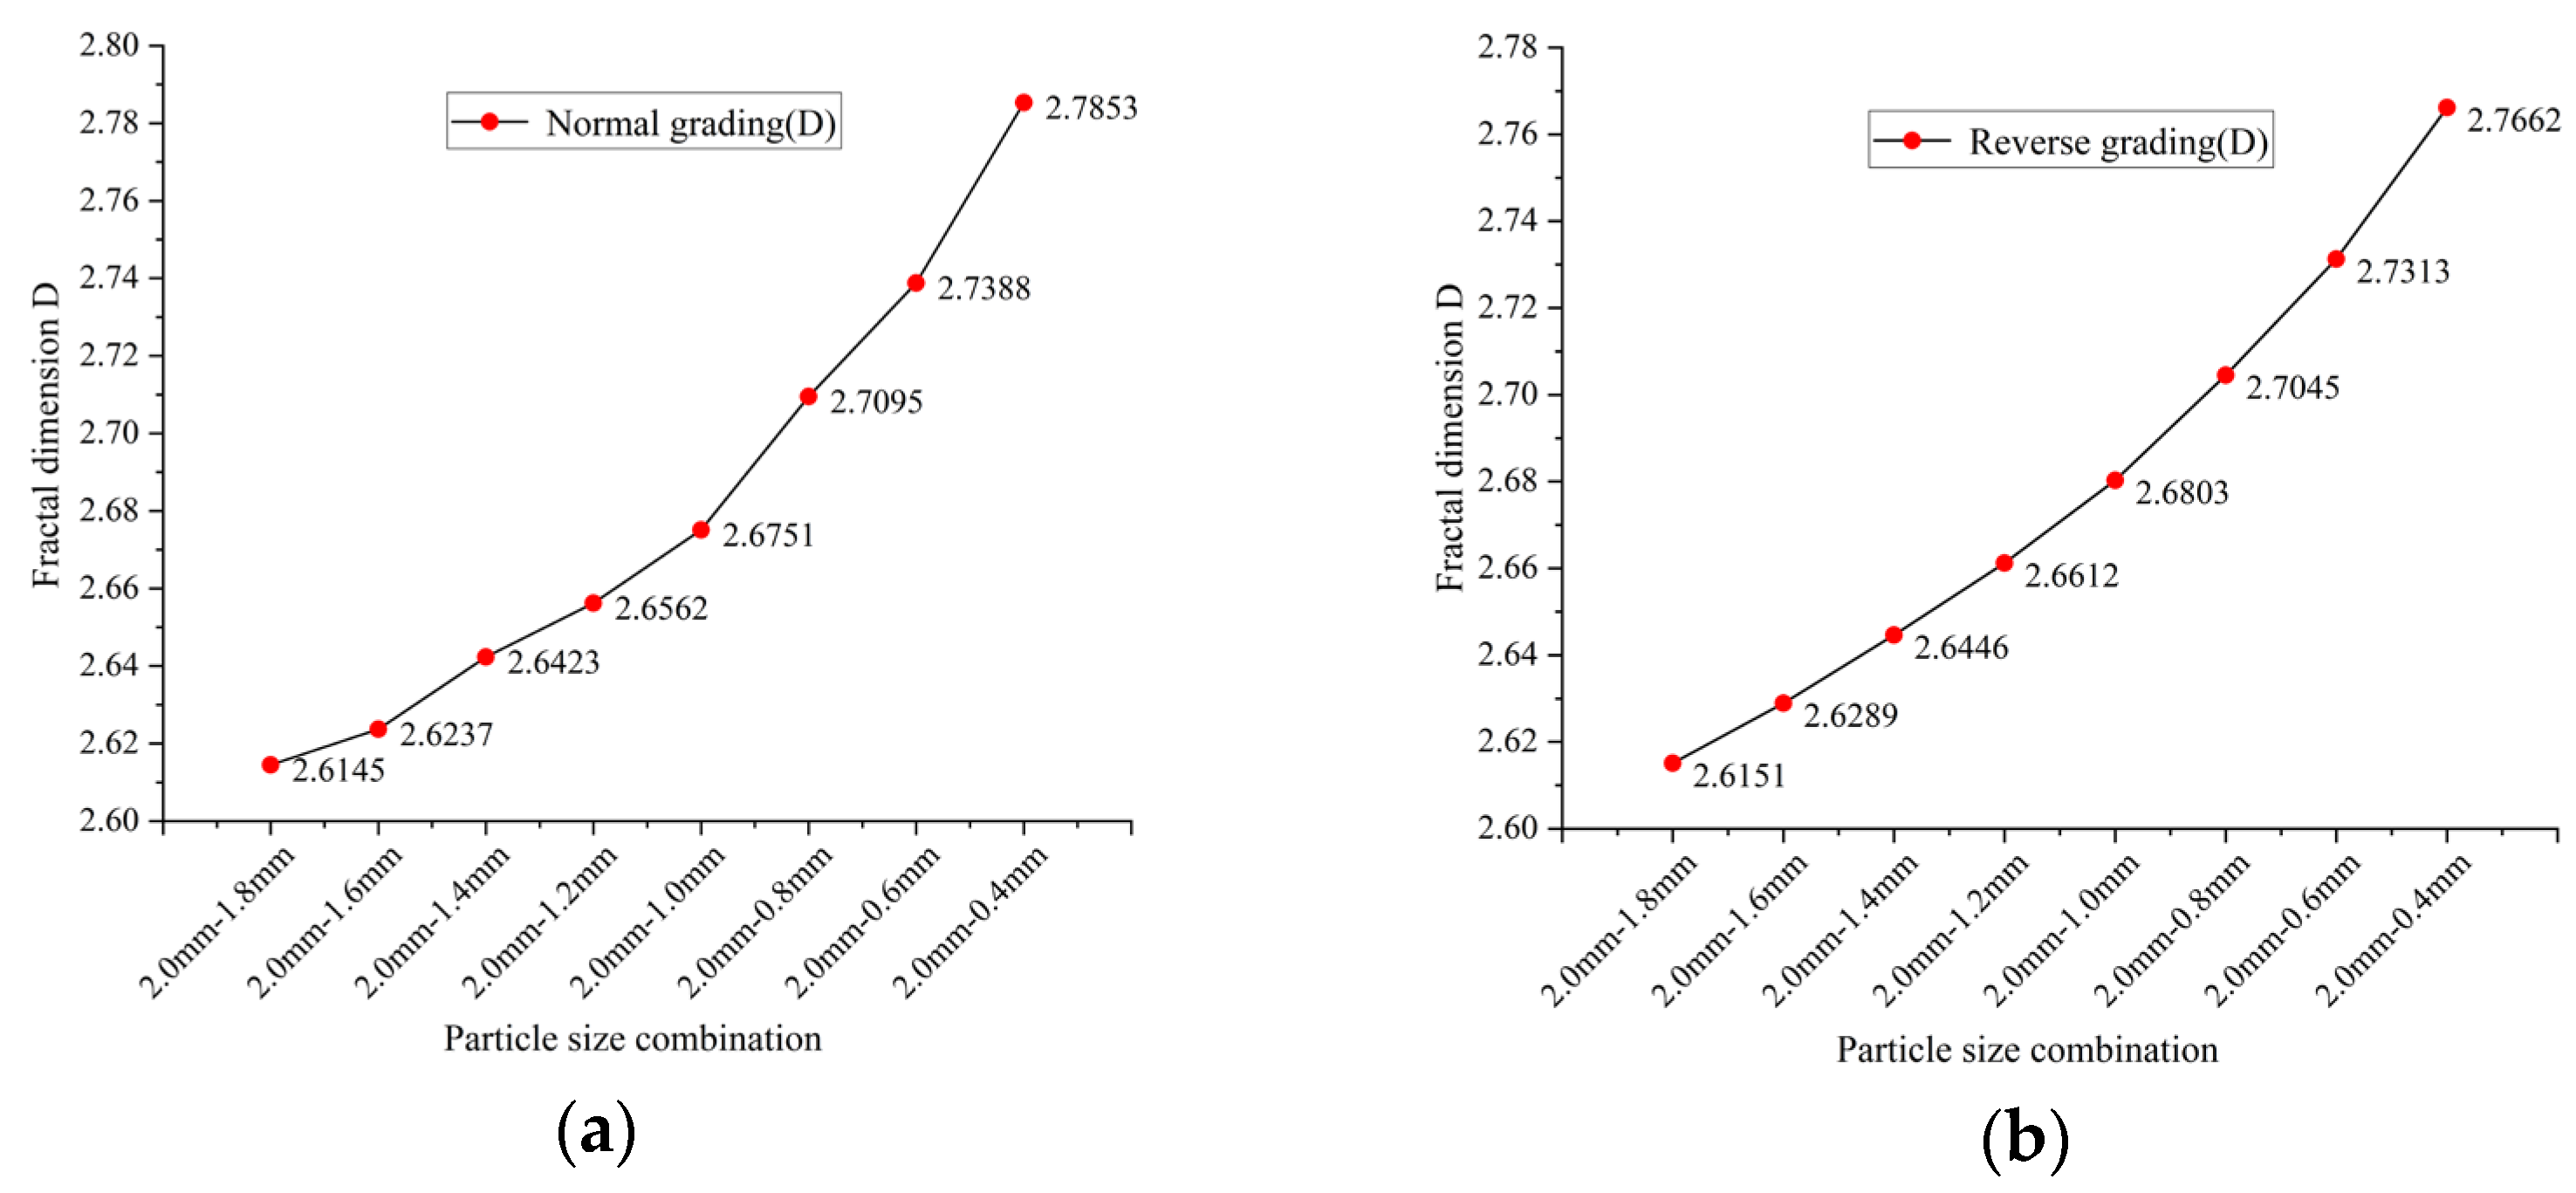
A statistical analysis of the fractal dimension of the porous media generated under the two opposite deposition sequences for different particle-size combinations is presented in Figure 10. Regardless of whether the sequence is normally graded or inversely graded, the fractal dimension D increases monotonically—and overall nonlinearly—with increasing size ratio , indicating that stronger size contrast leads to more pronounced interface roughening.
Figure 10.
Comparison of fractal dimension for different particle-size combinations: (a) normally graded sequence; (b) inversely graded sequence.
Under the normally graded condition (Figure 10a), the curve exhibits an “initially gradual–then steep” trend, with a distinctly accelerated increase at high size contrast. This is primarily attributed to secondary infilling by fine particles during the late stage: fine particles preferentially fill the contact regions between coarse particles and the pore throats, generating multiscale concavities. Consequently, decreases while tortuosity increases, thereby promoting a rapid rise in D. For the inversely graded condition (Figure 10b), D likewise increases with D but in a smoother manner. Early deposition of fine particles forms a dense basal layer, and the overlying coarse particles are mechanically supported, which helps preserve relatively straight large pore chambers and preferential channels and partially offsets the roughening in the lower region. Only when D becomes very large does the coupling between the upper and lower layers strengthen; D continues to increase, yet with a smaller incremental rate than in the normally graded case.
It should be noted that larger mean pore size or higher local coordination number in representative subcases does not necessarily translate directly into higher bulk permeability. The latter is governed by the continuity of effective flow pathways across the entire sample, including bottleneck throat constrictions, vertical connectivity, and the spatial arrangement of stratified pore domains. Therefore, local geometric advantages observed in normally graded structures at low-to-intermediate size ratios may coexist with lower overall permeability if the connected hydraulic pathways are less efficient at the sample scale.
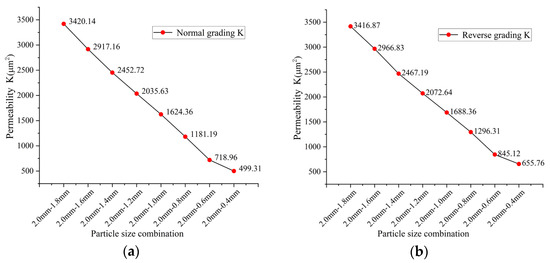
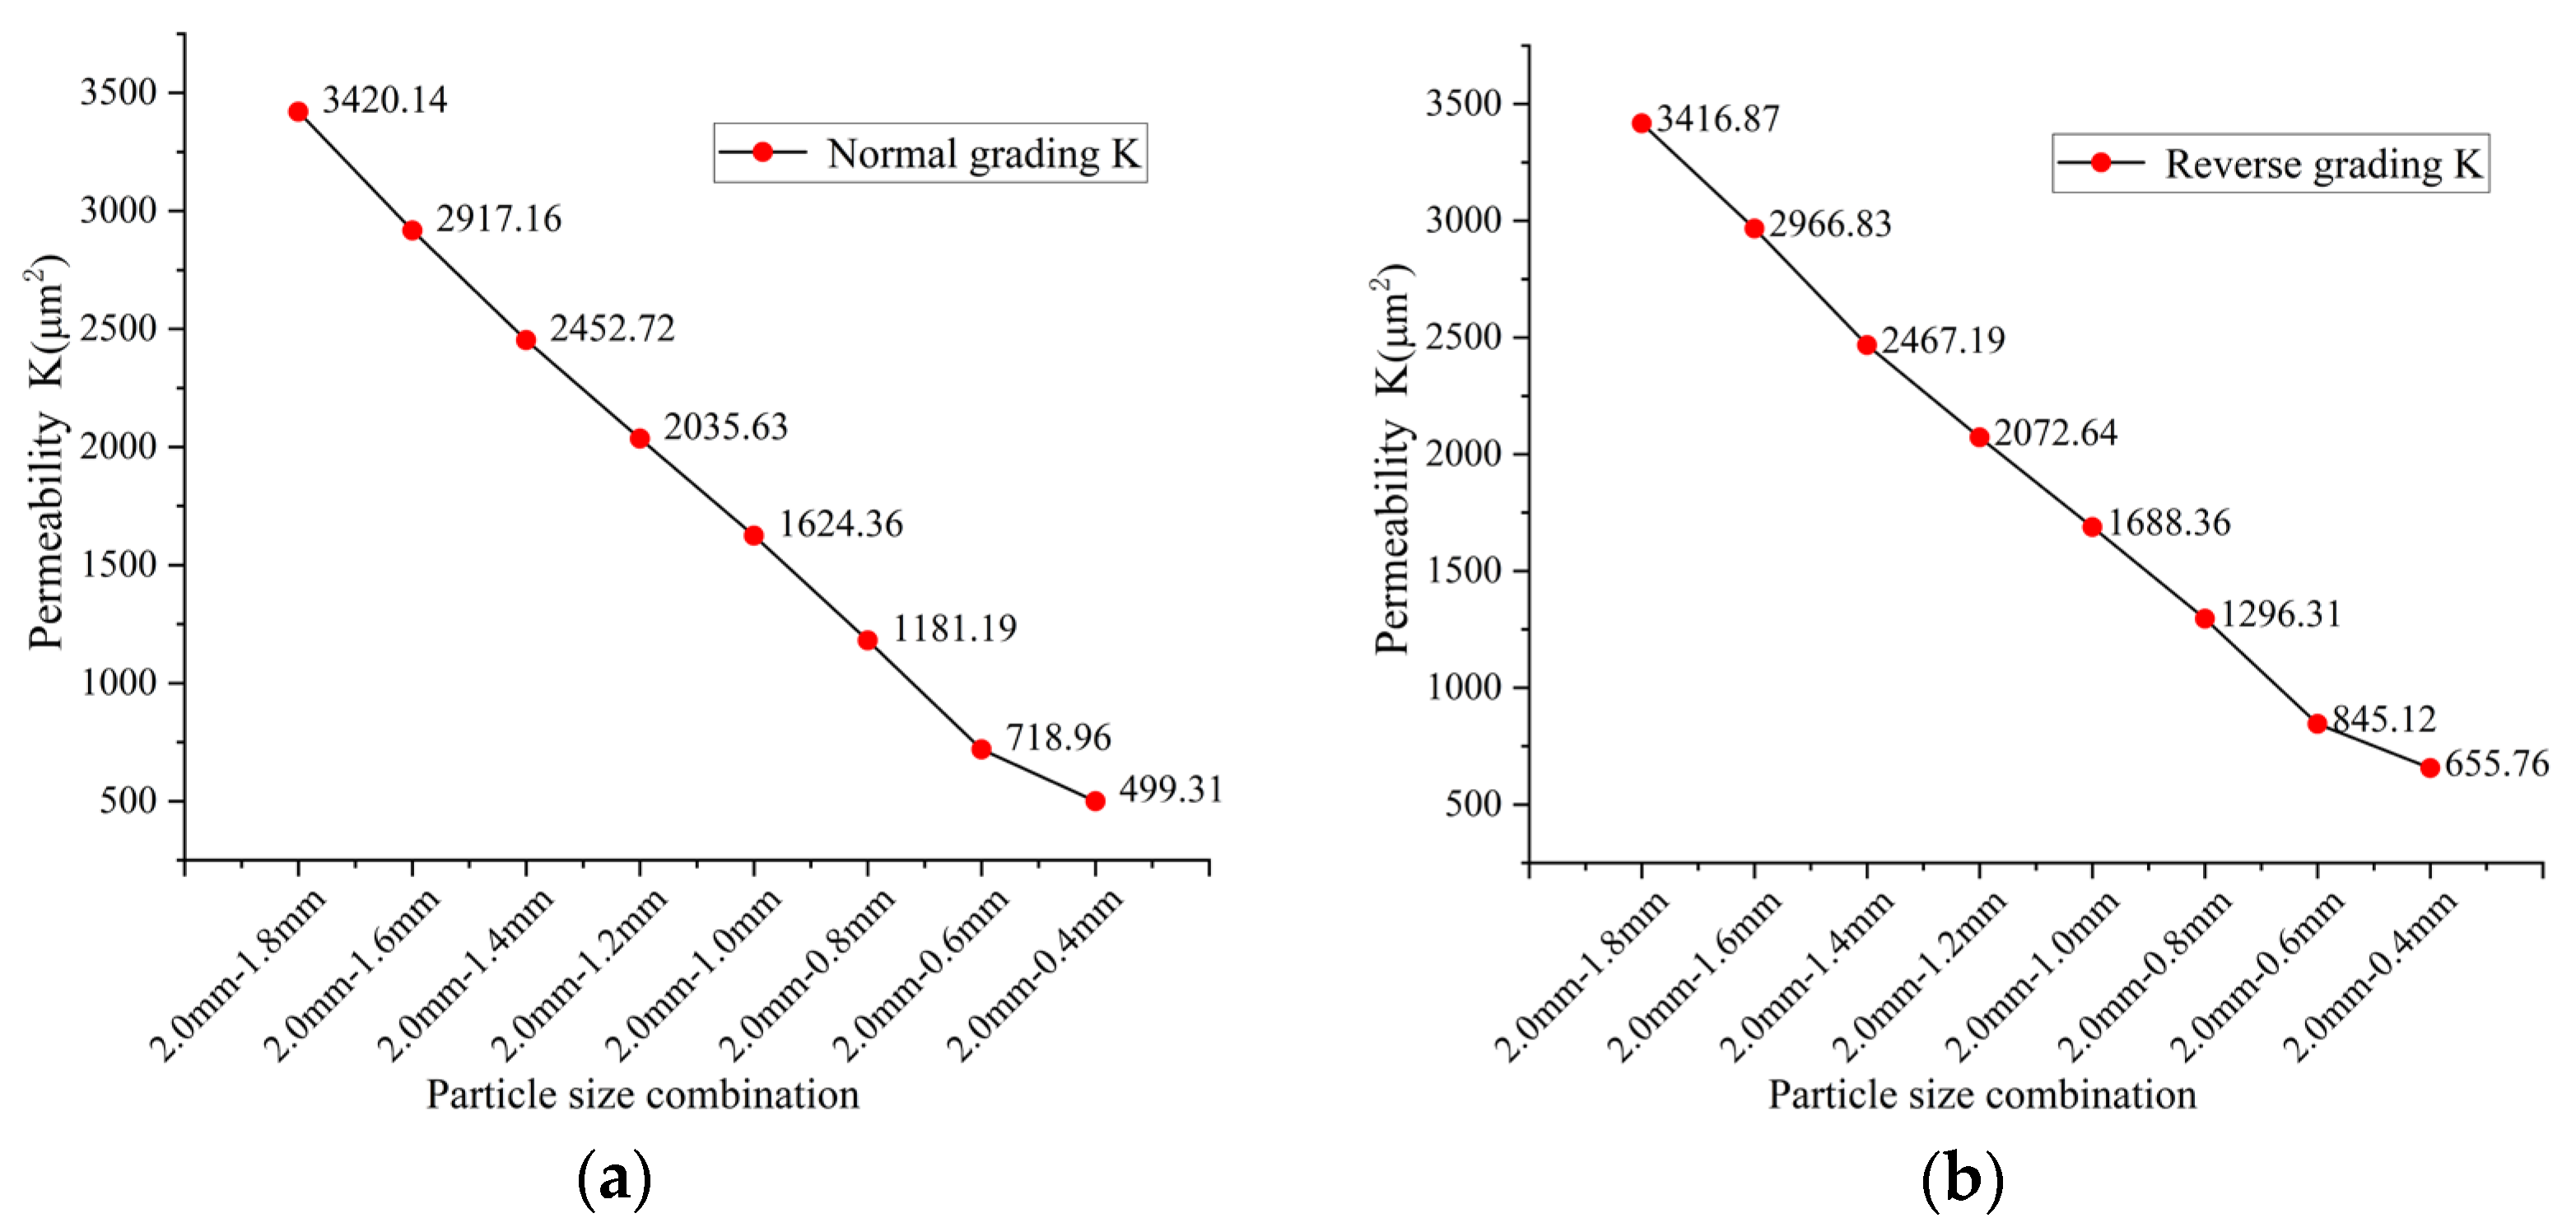
A statistical analysis of the permeability of porous media generated under the two opposite deposition sequences is presented in Figure 11, where Figure 11a corresponds to the normally graded sequence and Figure 11b to the inversely graded sequence. As the particle-size pairing changes from 2.0–1.8 mm to 2.0–0.4 mm, the permeability K decreases steadily and monotonically for both sequences: for the normally graded case, K decreases from 3420.14 μm2 to 499.31 μm2, whereas for the inversely graded case it decreases from 3416.87 μm2 to 655.76 μm2. For the same particle-size combination, K is consistently higher in the inversely graded sequence than in the normally graded sequence, and the discrepancy enlarges as the fine-particle fraction increases. For example, at 2.0–1.2 mm, K is 1181.19 μm2 and 1296.31 μm2 for the normally and inversely graded cases, respectively (a relative increase of ~9.7%), whereas at 2.0–0.4 mm the difference increases to 499.31 μm2 versus 655.76 μm2 (a relative increase of ~31%).
Figure 11.
Comparison of permeability K for different particle-size combinations: (a) normally graded sequence; (b) inversely graded sequence.
These results suggest that particle-size refinement reduces K primarily by constricting throat sizes and increasing flow-path tortuosity. In addition, deposition sequence imposes a “secondary regulation” on channel continuity: in the inversely graded case (fine-first–coarse-later), more continuous load-bearing frameworks and larger effective flow channels are preserved in the upper region, thereby mitigating the permeability reduction when fine particles are abundant. By contrast, in the normally graded case (coarse-first–fine-later), late-stage fine particles are more prone to locally clog the upper part of the pore space, leading to a more pronounced decline in K.
3.2. Influence of Particle Shape on Pore Structure and Permeability
To investigate the influence of irregular particle morphology on the pore-skeleton architecture, we constructed five three-dimensional particle models with identical volume but distinct shapes within a finite cubic domain. To ensure comparability among different morphologies, the volume of each irregular particle was set equal to that of an ideal sphere with a diameter of 2 mm. The particle models were then imported into the deposition–packing simulation framework, where gravity-driven deposition was performed to reproduce the natural packing process, ultimately yielding representative porous-media skeletons.
Due to limitations in computational memory and resources, coarse particles with a diameter of 2 mm were selected for the deposition–packing simulations. After the particle system reached a mechanically stable packing state, a representative elementary volume (REV) with a consistent size was extracted by cropping the interior of the packing into a cubic subdomain of 15 mm × 15 mm × 15 mm, which facilitates subsequent numerical analyses.
(1) Deposition of spherical particles with γ = 0.0.
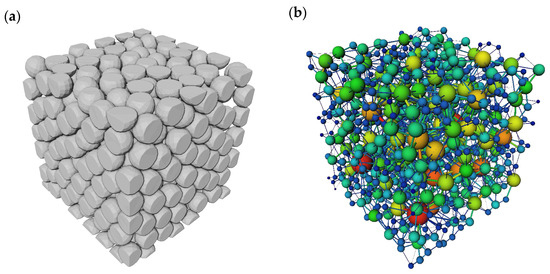
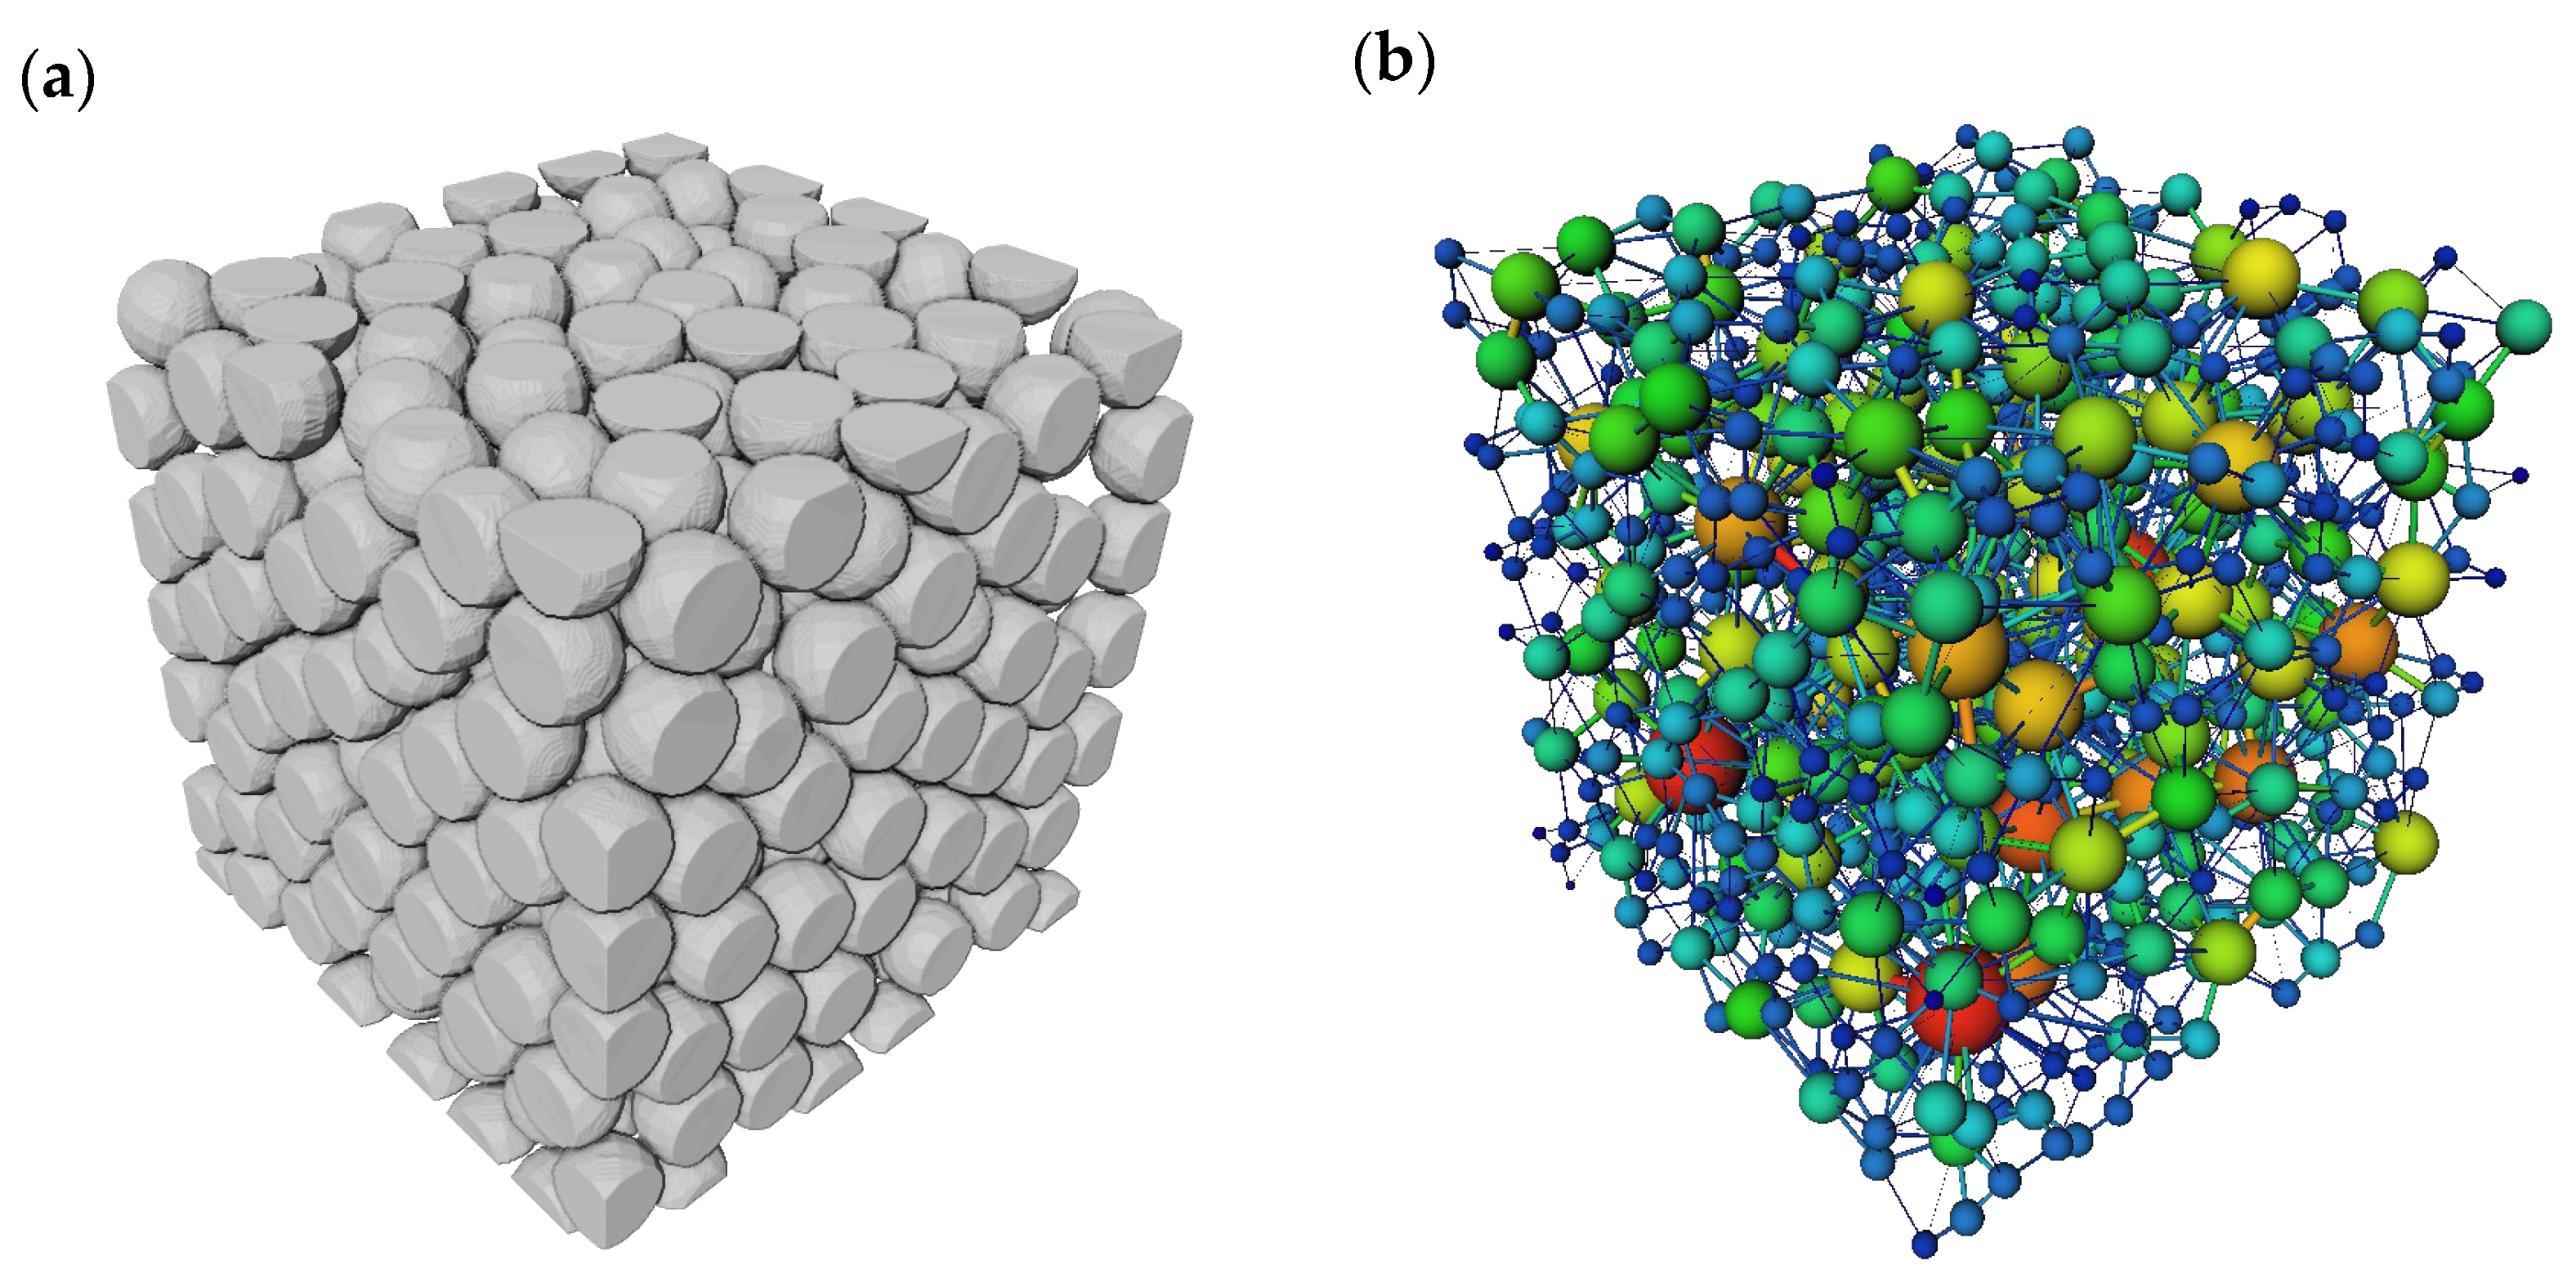
When the shape-perturbation coefficient is set to γ = 0.0, the framework particles can be regarded as ideal spheres. The resulting three-dimensional pore structure of the random packing is shown in Figure 12a, and the corresponding pore–throat network constructed using the maximal-ball model is shown in Figure 12b. The statistics indicate that the mean pore equivalent radius is = 637.87 μm, the mean throat equivalent radius is = 274.27 μm, the mean throat length is = 1934.69 μm, and the mean coordination number is = 8.31, suggesting good connectivity and a relatively high degree of spatial uniformity in the packing.
Figure 12.
Porous medium generated by the deposition of spherical particles with γ = 0.0 (a) and the corresponding maximal-ball pore–throat model (b).
(2) Deposition of weakly irregular particles with γ = 0.5.
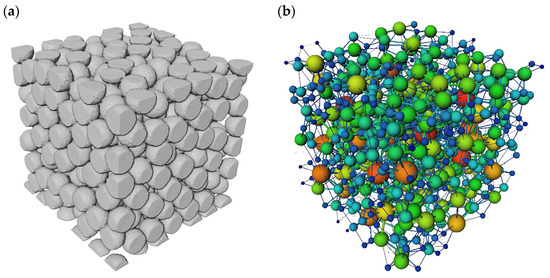
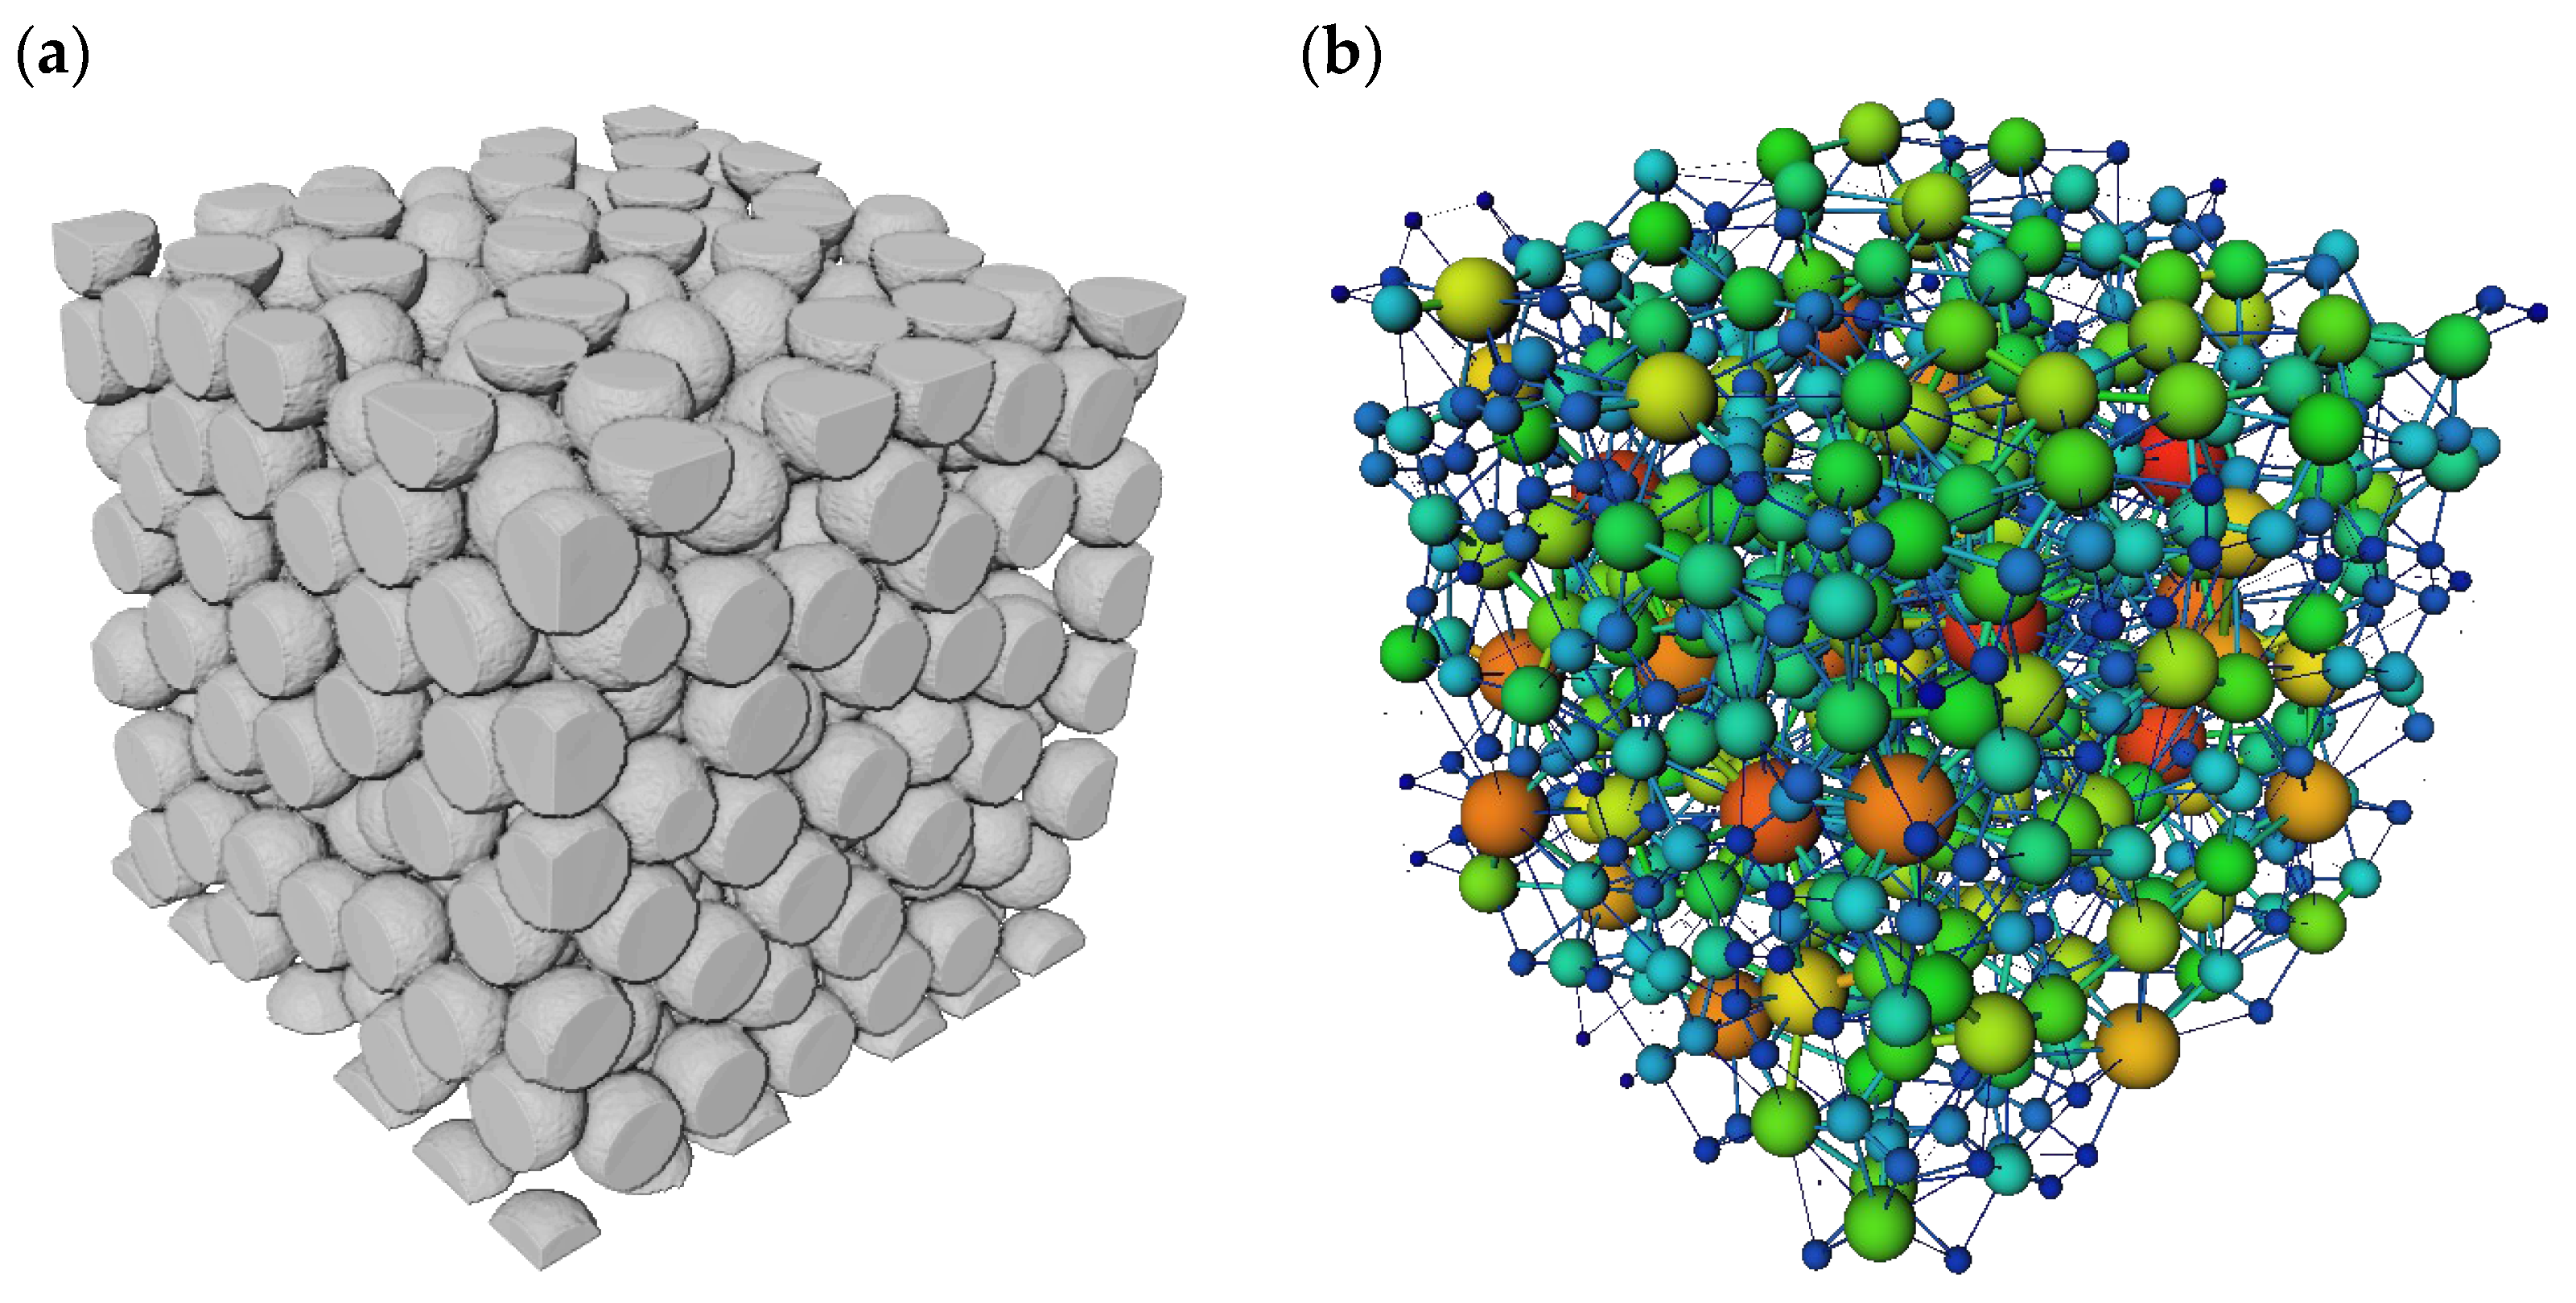
When γ increases to 0.5, slight surface undulations emerge and the local geometry deviates from an ideal sphere. The pore structure generated by the deposition of such particles (Figure 13) was quantified using the maximal-ball pore–throat network. The results show that the mean pore equivalent radius decreases to = 597.37 μm, while the mean throat equivalent radius is = 309.79 μm and the mean throat length is = 2018.69 μm. The mean coordination number is = 6.61. Compared with the γ = 0.0 case, fewer inter-particle contacts are formed, and the spatial uniformity of the pore-size distribution decreases.
Figure 13.
Porous medium generated by the deposition of spherical particles with γ = 0.5 (a) and the corresponding maximal-ball pore–throat model (b).
(3) Deposition of moderately irregular particles with γ = 1.0.
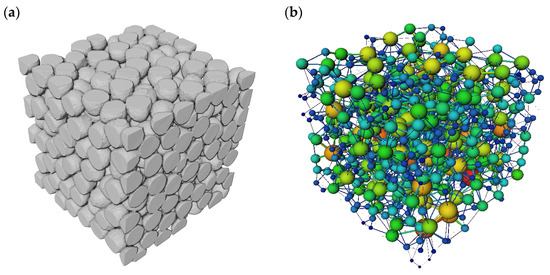
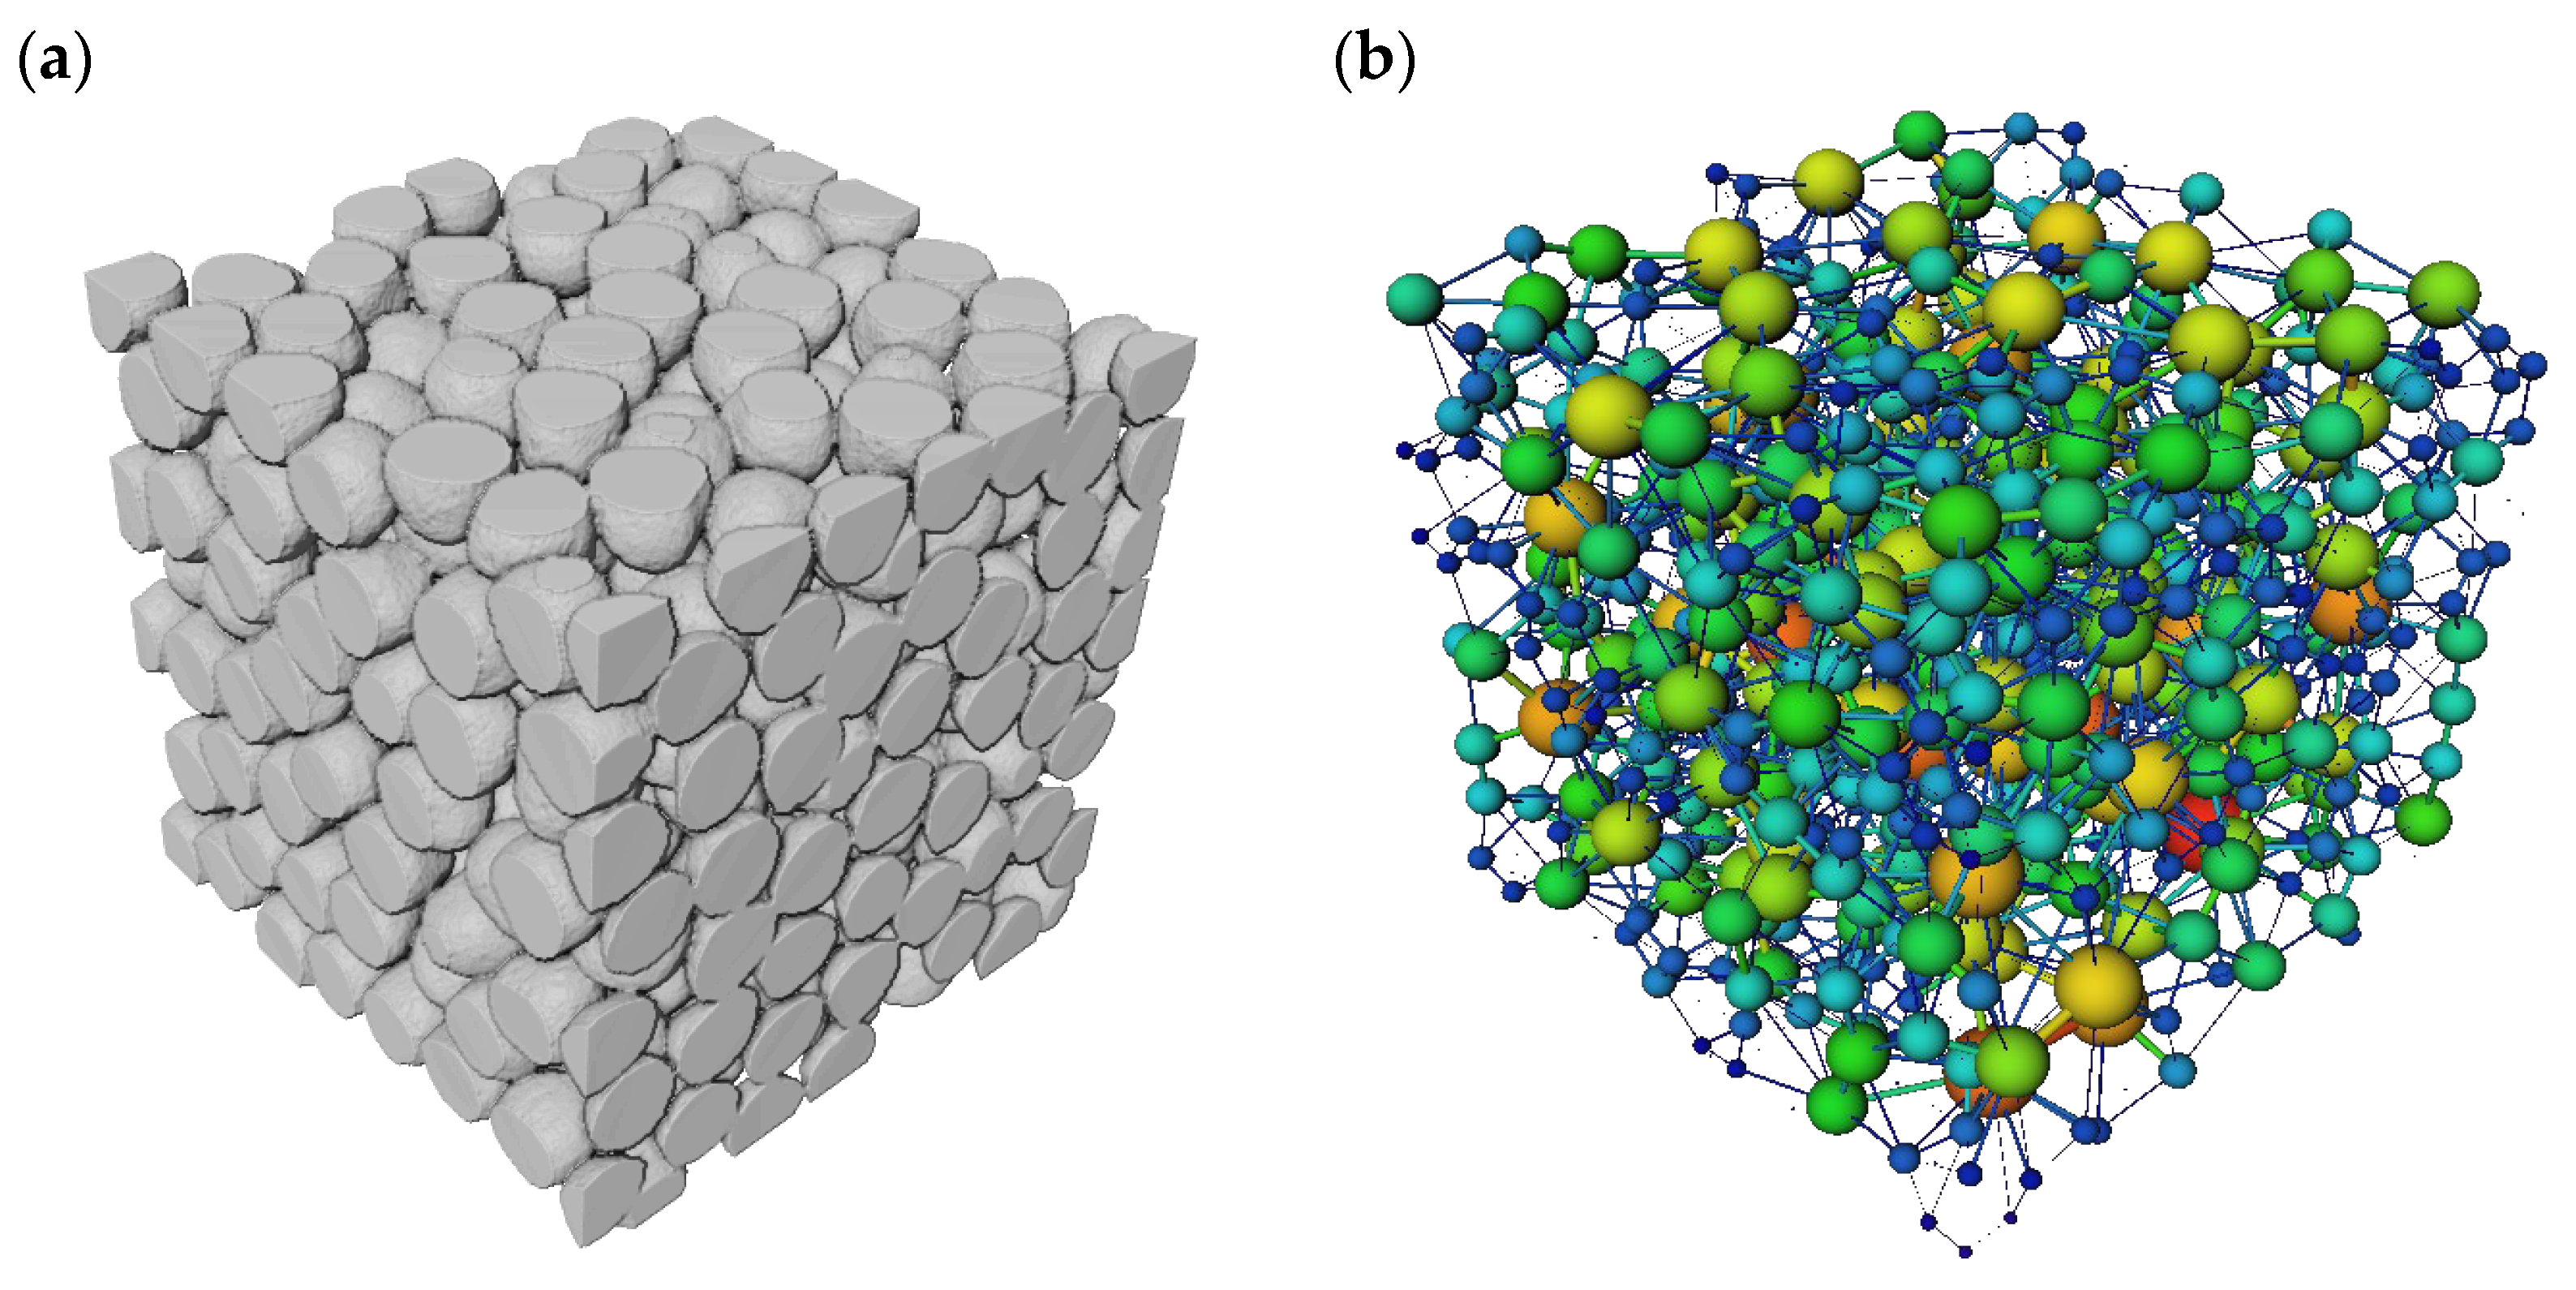
When γ is increased to 1.0, surface undulations and roughness are markedly enhanced, and the particle geometry deviates substantially from a spherical shape (Figure 14). Statistics derived from the maximal-ball pore–throat model show that the mean pore equivalent radius is = 579.54 μm, the mean throat equivalent radius is = 286.94 μm, the mean throat length is = 2021.45 μm, and the mean coordination number is = 6.58. Compared with cases at lower γ, connectivity is further reduced; locally “blocked” regions emerge, the proportion of narrow throats and small pores increases, and flow pathways become more tortuous and constrained.
Figure 14.
Porous medium generated by the deposition of spherical particles with γ = 1.0 (a) and the corresponding maximal-ball pore–throat model (b).
(4) Deposition of highly irregular particles with γ = 1.5.
When the shape-perturbation coefficient γ increases to 1.5, the particle geometry becomes more polyhedral and the surface roughness is substantially enhanced, leading to tighter interlocking and more intimate inter-particle contacts. The resulting pore structure is shown in Figure 15. Statistics from the maximal-ball pore–throat analysis indicate that the mean pore equivalent radius decreases to = 456.39 μm, the mean throat equivalent radius is = 284.27 μm, the mean throat length is = 2008.98 μm, and the mean coordination number drops to = 5.23. Overall, the throat structure becomes further refined, the pore-network topology tends to be more sparse, and local flow pathways become increasingly tortuous; in addition, some pathways become discontinuous. These observations indicate a continued reduction in connectivity and seepage capacity as particle morphology becomes more complex.
Figure 15.
Porous medium generated by the deposition of spherical particles with γ = 1.5 (a) and the corresponding maximal-ball pore–throat model (b).
(5) Deposition of extremely irregular particles with γ = 2.0.
When the shape-perturbation coefficient reaches γ = 2.0, the particle surfaces exhibit pronounced roughening and strong asymmetry, and the overall morphology approaches that of an irregular polyhedron. The resulting porous structure becomes more complex, as shown in Figure 16. Maximal-ball pore–throat analysis indicates that the mean pore equivalent radius is = 421.1 μm, the mean throat equivalent radius is = 278.31 μm, the mean throat length is = 2001.3 μm, and the mean coordination number is = 5.08. Compared with the γ = 1.5 case, the changes in connectivity are relatively limited, suggesting that once surface roughness reaches a sufficiently high level, further increases in γ do not substantially alter the overall network topology. In other words, the pore structure tends to stabilize and the cumulative effect of increasing morphological irregularity gradually approaches saturation.
Figure 16.
Porous medium generated by the deposition of spherical particles with γ = 2.0 (a) and the corresponding maximal-ball pore–throat model (b).
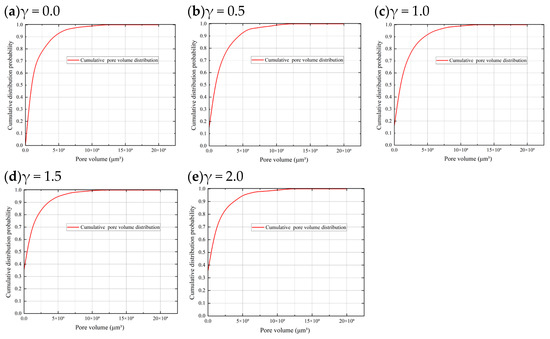
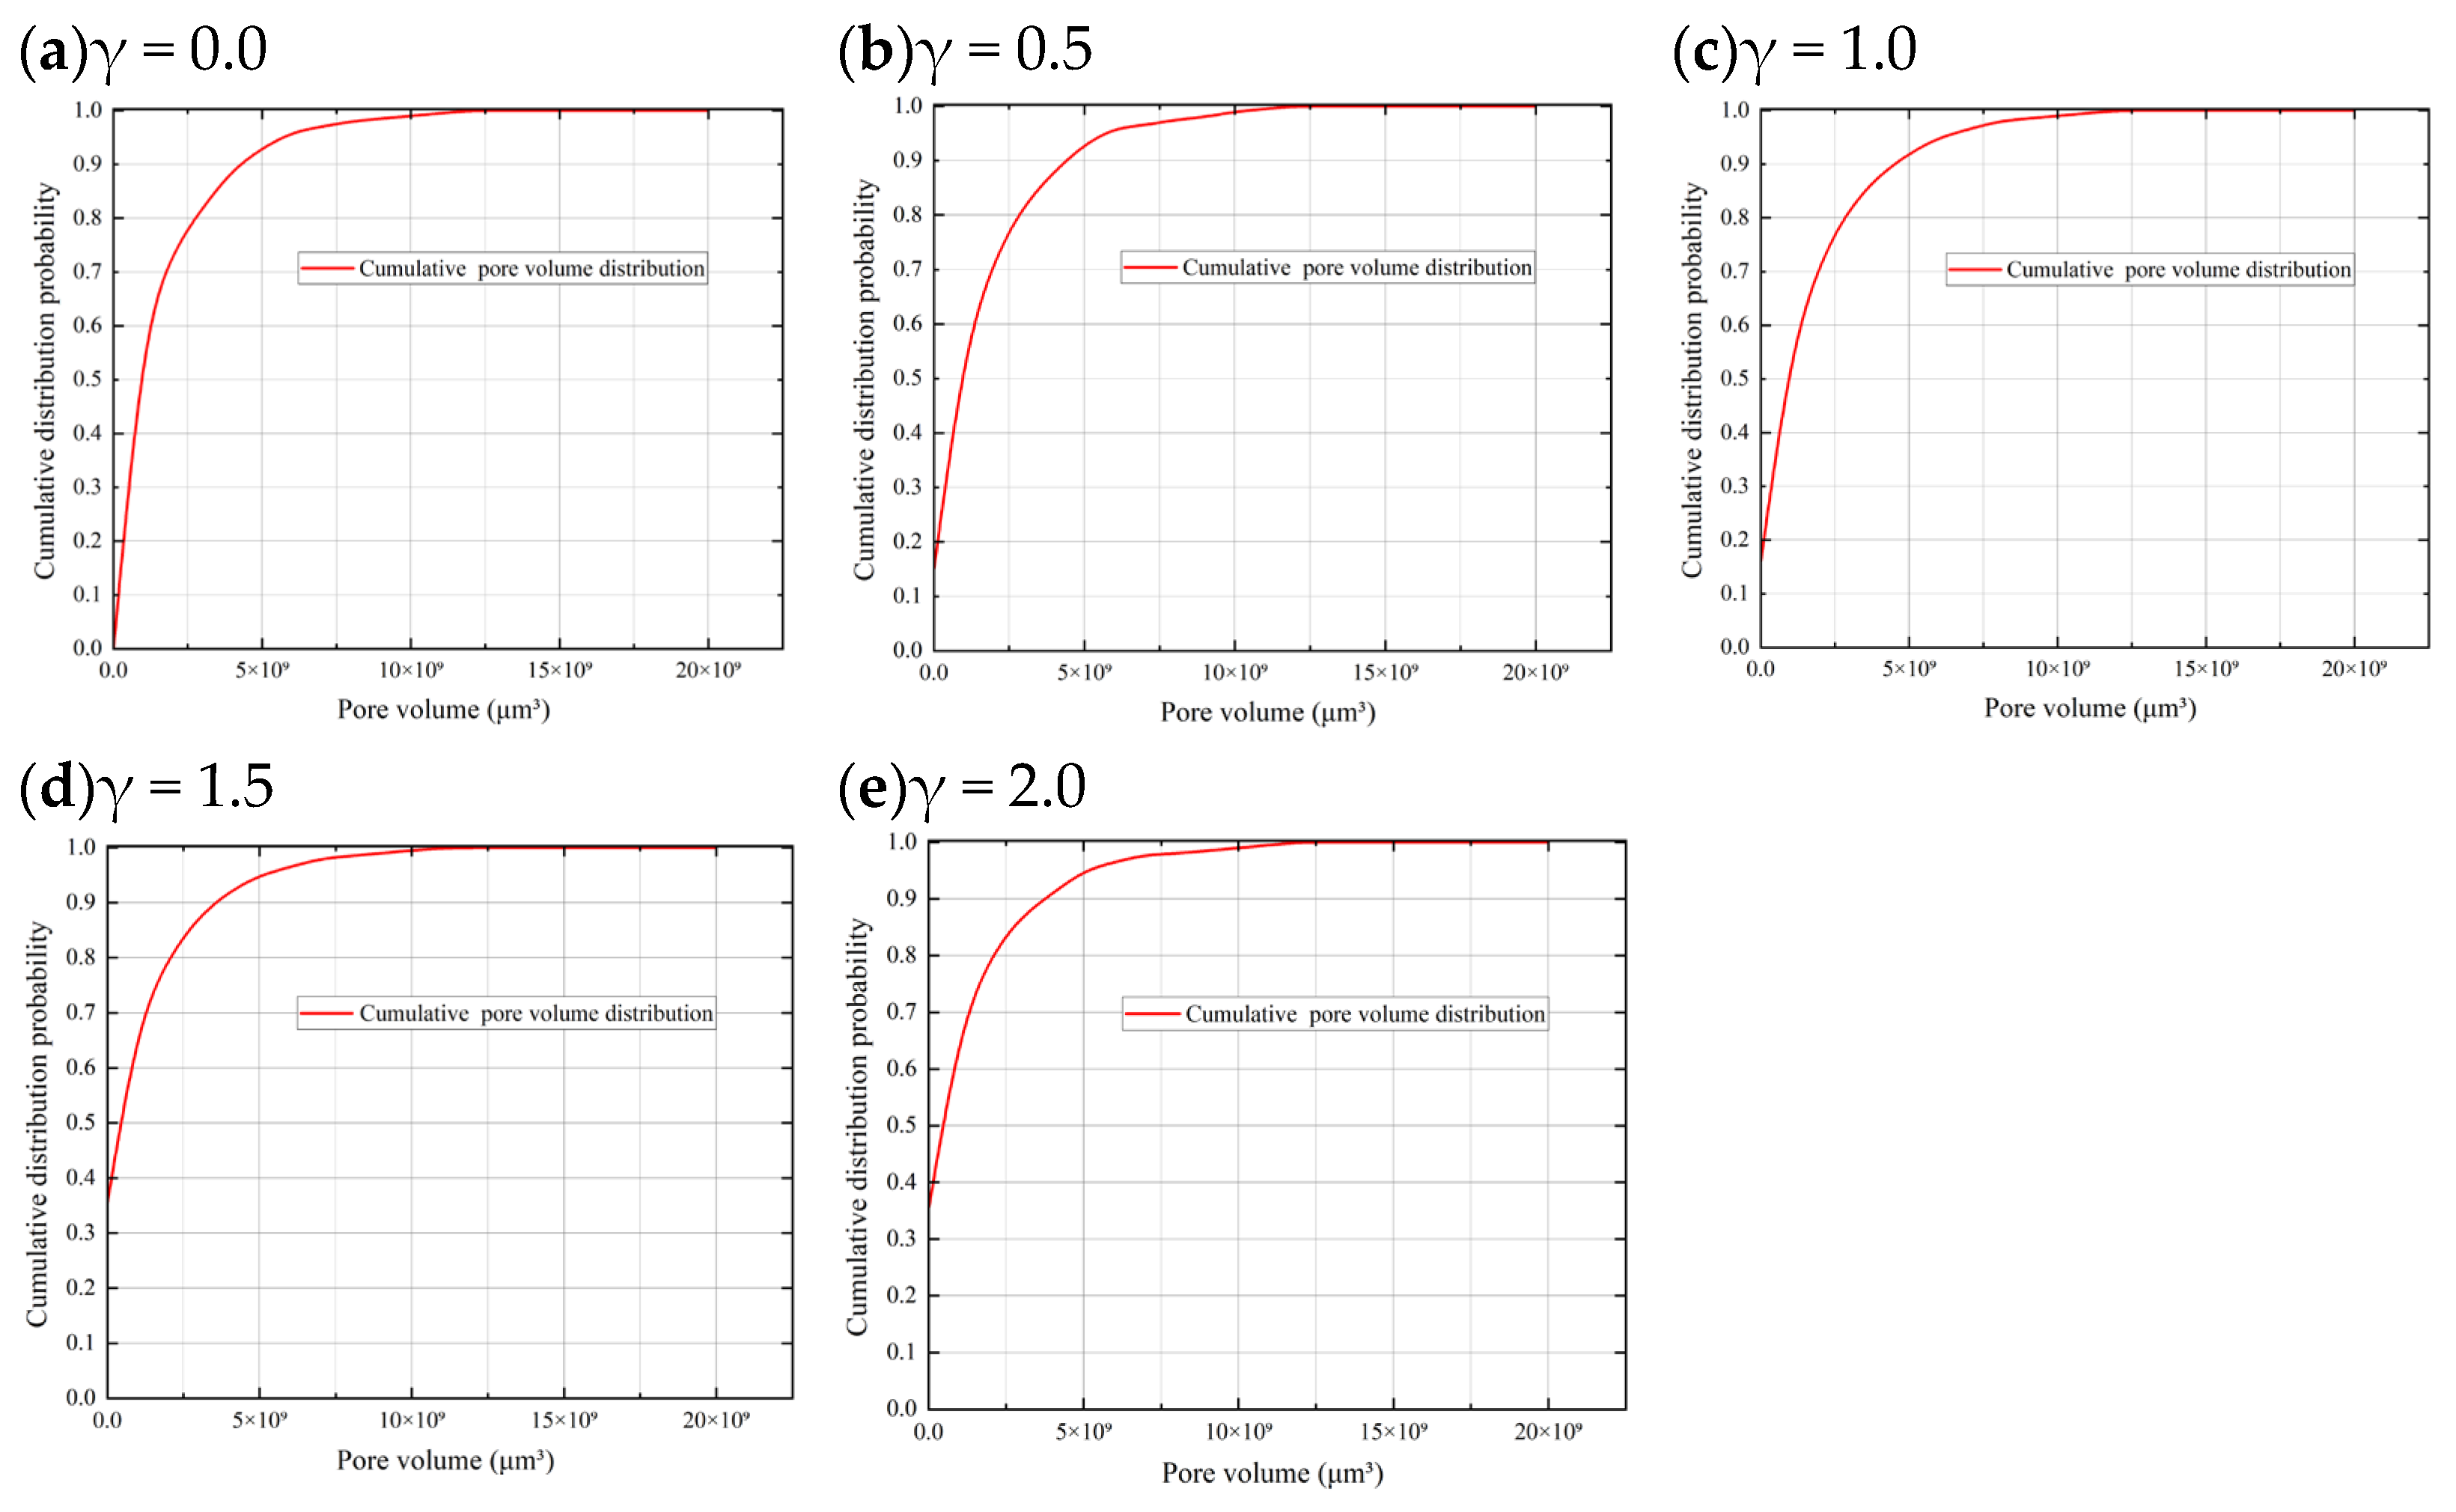
Figure 17 presents the cumulative distribution (probability) of pore-body volume for three-dimensional porous media formed during the deposition of spherical particles with different morphologies. Under identical solid volume fraction and deposition conditions, as particle shape evolves from regular (γ = 0.0) to highly irregular (γ = 2.0), the empirical cumulative distribution curve of pore-body volume shifts upward and to the left. The cumulative probability in the low-to-intermediate volume range increases markedly, and the right tail progressively contracts; nevertheless, a very small fraction of large pores with volumes approaching 10 μm3 is still retained. This indicates that increasing surface irregularity enhances geometric interlocking and packing efficiency during deposition, thereby further subdividing large pores into multiple medium-to-small pores and shifting the pore-size distribution from a broad distribution to a more concentrated one.
Figure 17.
Cumulative distribution probability of pore volume for porous media generated with framework-particle perturbation factors γ = 0.0 (a), 0.5 (b), 1.0 (c), 1.5 (d), and 2.0 (e).
A cross-case comparison further shows that this effect exhibits a diminishing return. When γ increases from 0 to 0.5 (or 1.0), the proportion of pores with volumes not exceeding a given threshold T rises most prominently around T = 106~2 × 106 μm3 (defined herein as the criterion range for “small pores”), implying an increased fraction of small pores and an overall leftward shift in the pore-size distribution. In contrast, when γ is further increased to 1.5–2.0, the changes become much less pronounced, and the cumulative curve approaches a plateau (i.e., further increasing the volume threshold results in only a slow increase in cumulative probability). Only the high-volume tail, represented by the P95–P99 range (95–99% percentiles, corresponding to the upper-volume end where “large pores” reside), still exhibits a minor contribution, suggesting that extremely few large pores persist but at a very low proportion.
Overall, the results imply that a moderate increase in surface irregularity can substantially enhance particle interlocking and spatial filling, thereby fragmenting originally large pores into a larger number of small pores. Once the irregularity exceeds a critical level, however, further increases in surface undulation provide limited additional benefit in compressing the large-pore tail. This is manifested by reduced increments in CDF(T) and smaller increases in P50/P75, with the curve tending toward a plateau; only the upper-percentile tail (P95–P99) remains as a weak residual feature.
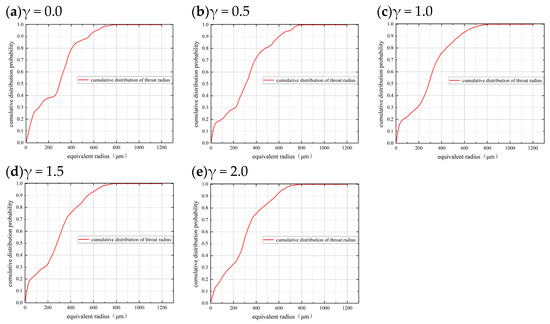
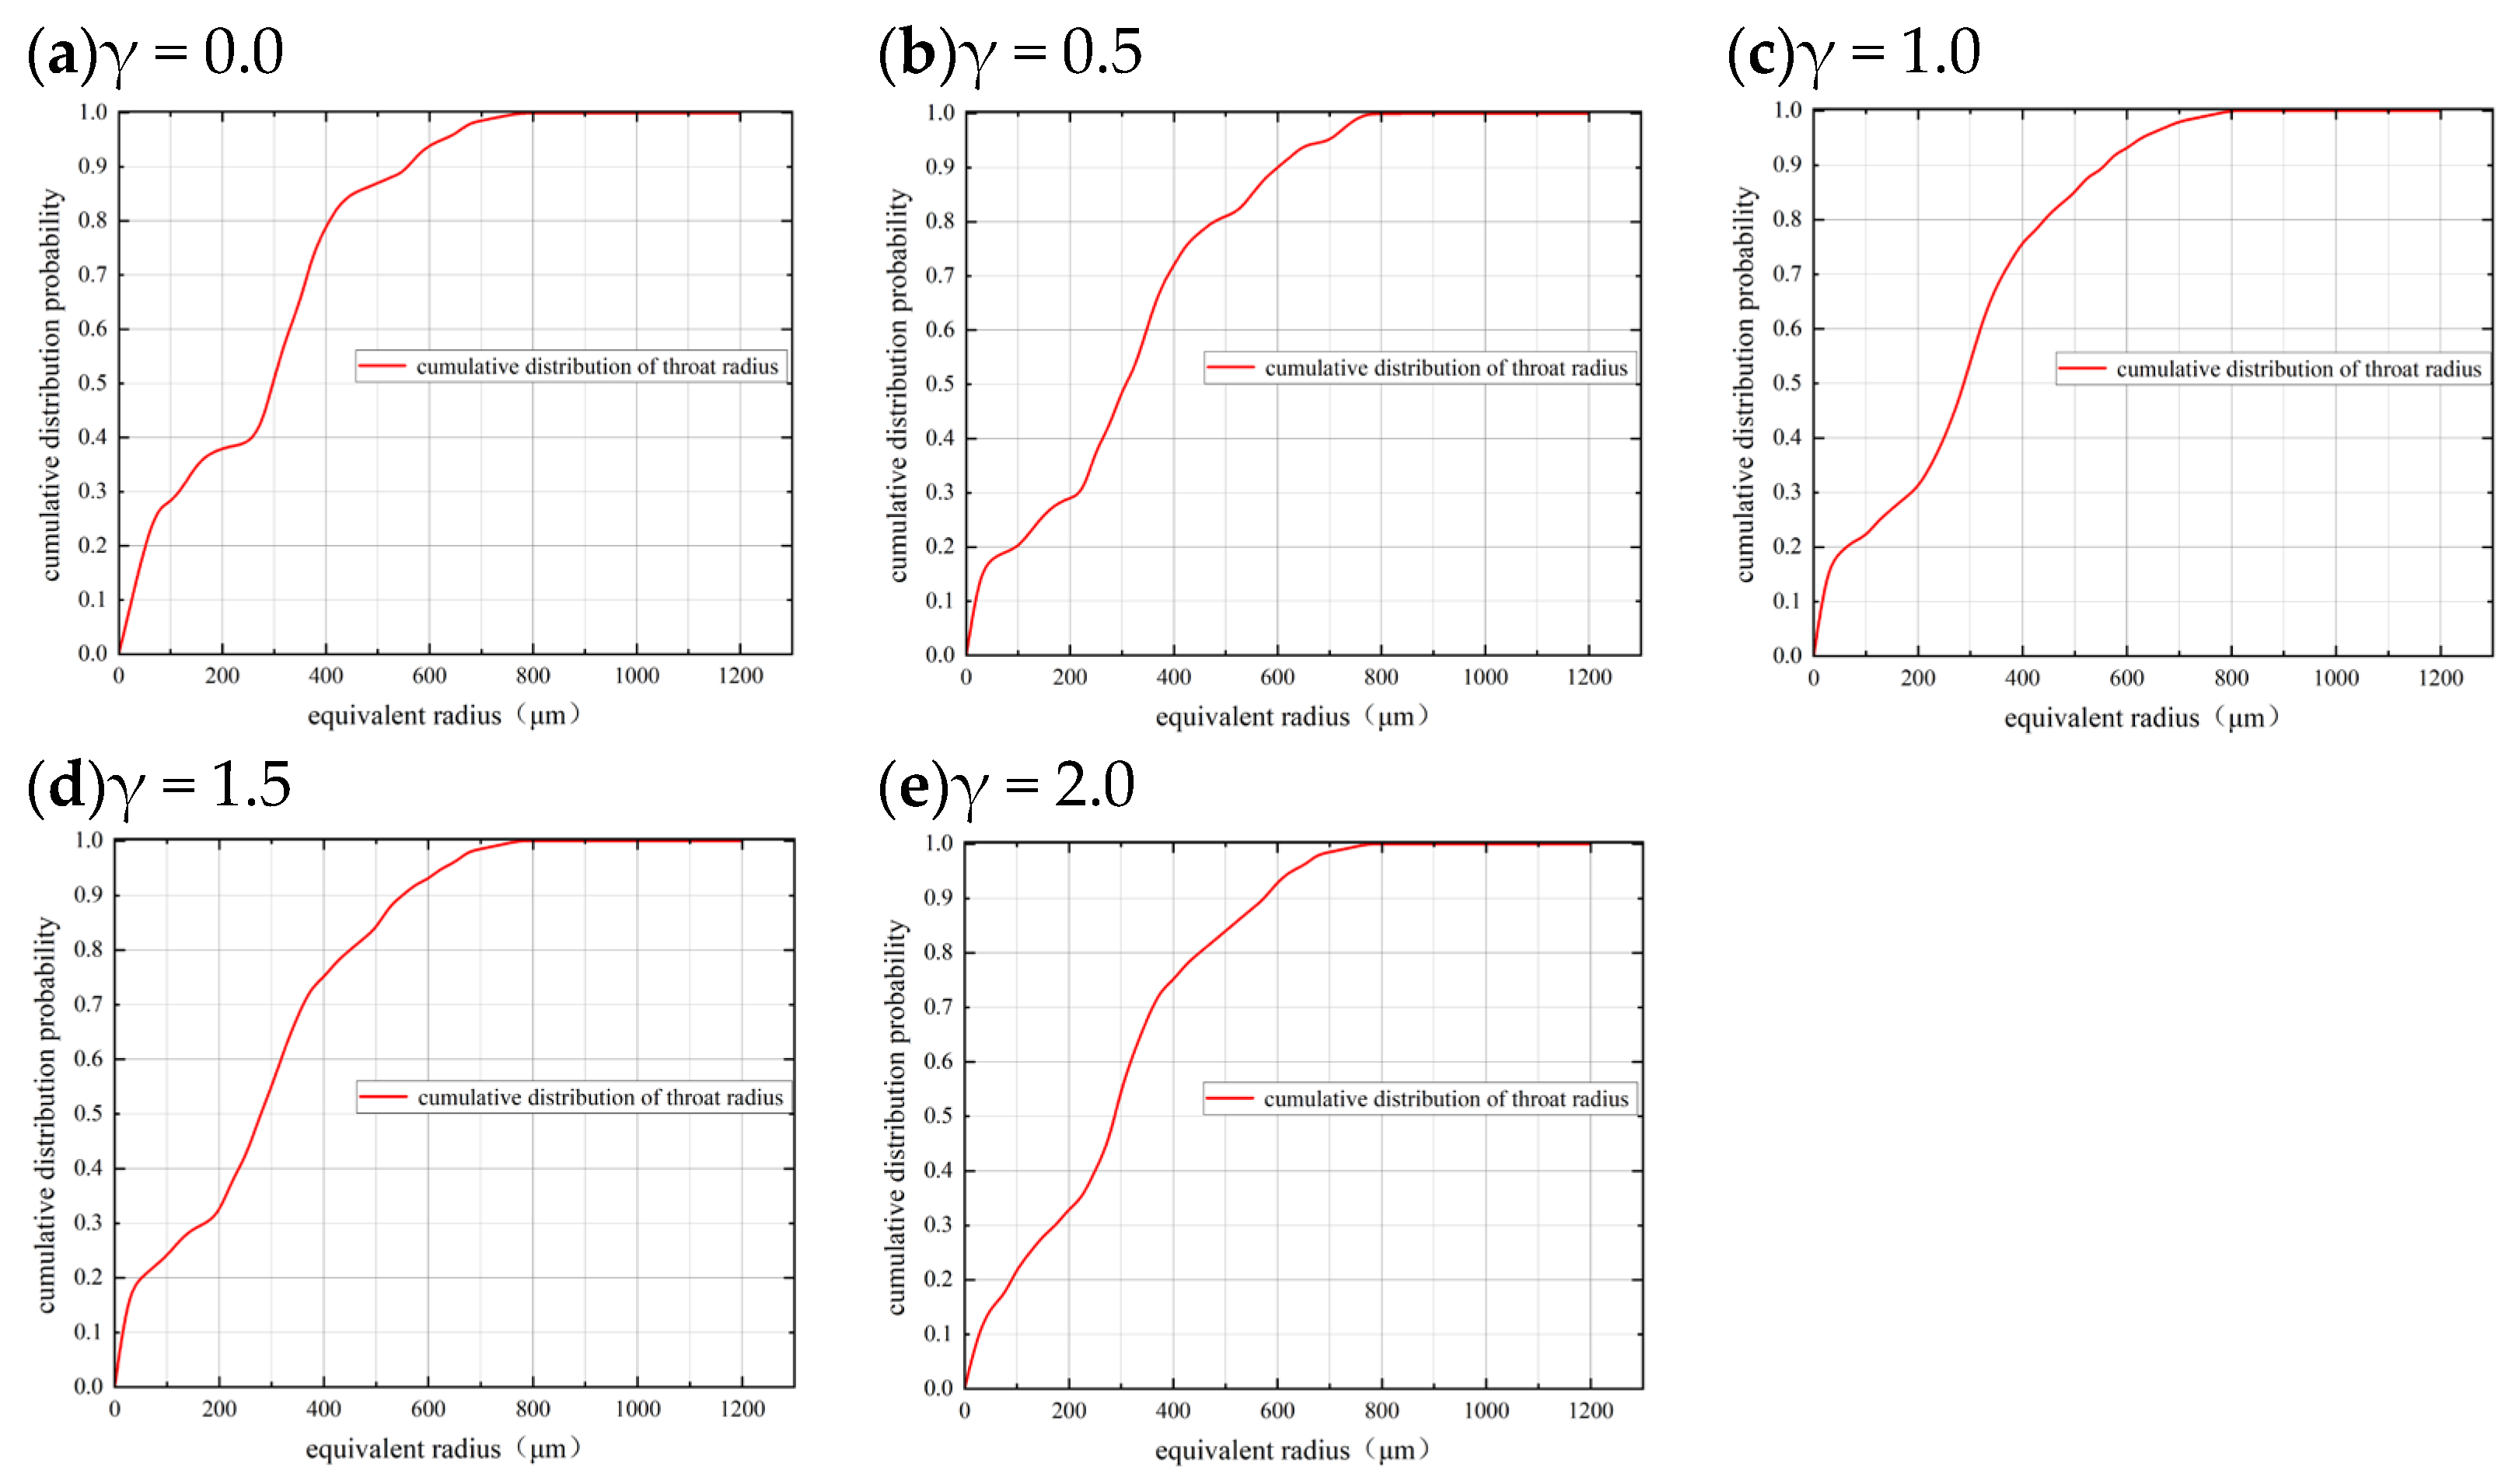
In the comparative analysis of throat-scale distributions, Figure 18 shows the cumulative distribution of the throat equivalent radius under different perturbation factors γ. As γ increases, the empirical cumulative distribution function (CDF) shifts leftward and upward overall. The median and upper-quartile positions (P50 and P75) decrease continuously, indicating a systematic contraction of representative throat radii/widths and an overall reduction in channel cross-sectional area. Meanwhile, the high percentile (P90) and extreme values drop markedly, and the right tail becomes shorter, implying that both the abundance and size of large-aperture throats decrease and that fast-flow pathways are effectively suppressed. Given the power-law amplification of seepage with respect to throat size, the above geometric changes—“moderate contraction coupled with right-tail convergence”—can lead to a pronounced reduction in effective permeability and shift the transport regime from “a few large channels dominating flow” to “multiple small channels acting in parallel.” This effect is most prominent as γ increases from 0.0 to 1.0. When γ ≥ 1.5, the decreases in P50/P75 and the overall CDF uplift become less pronounced; the upper end of the curve approaches a plateau, with only a weak residual tail at high percentiles. This indicates diminishing marginal returns of morphological perturbation on the development of “necking–merging” structures: further increases in surface undulation can hardly continue to compress the cross-scale throughgoing pathways, yet they remain sufficient to weaken the dominance of extremely large throats in governing overall seepage.
Figure 18.
Cumulative distribution curves of throat equivalent radius under different perturbation factors γ.
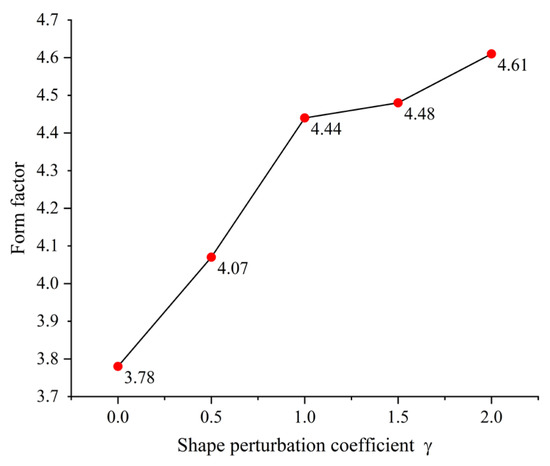
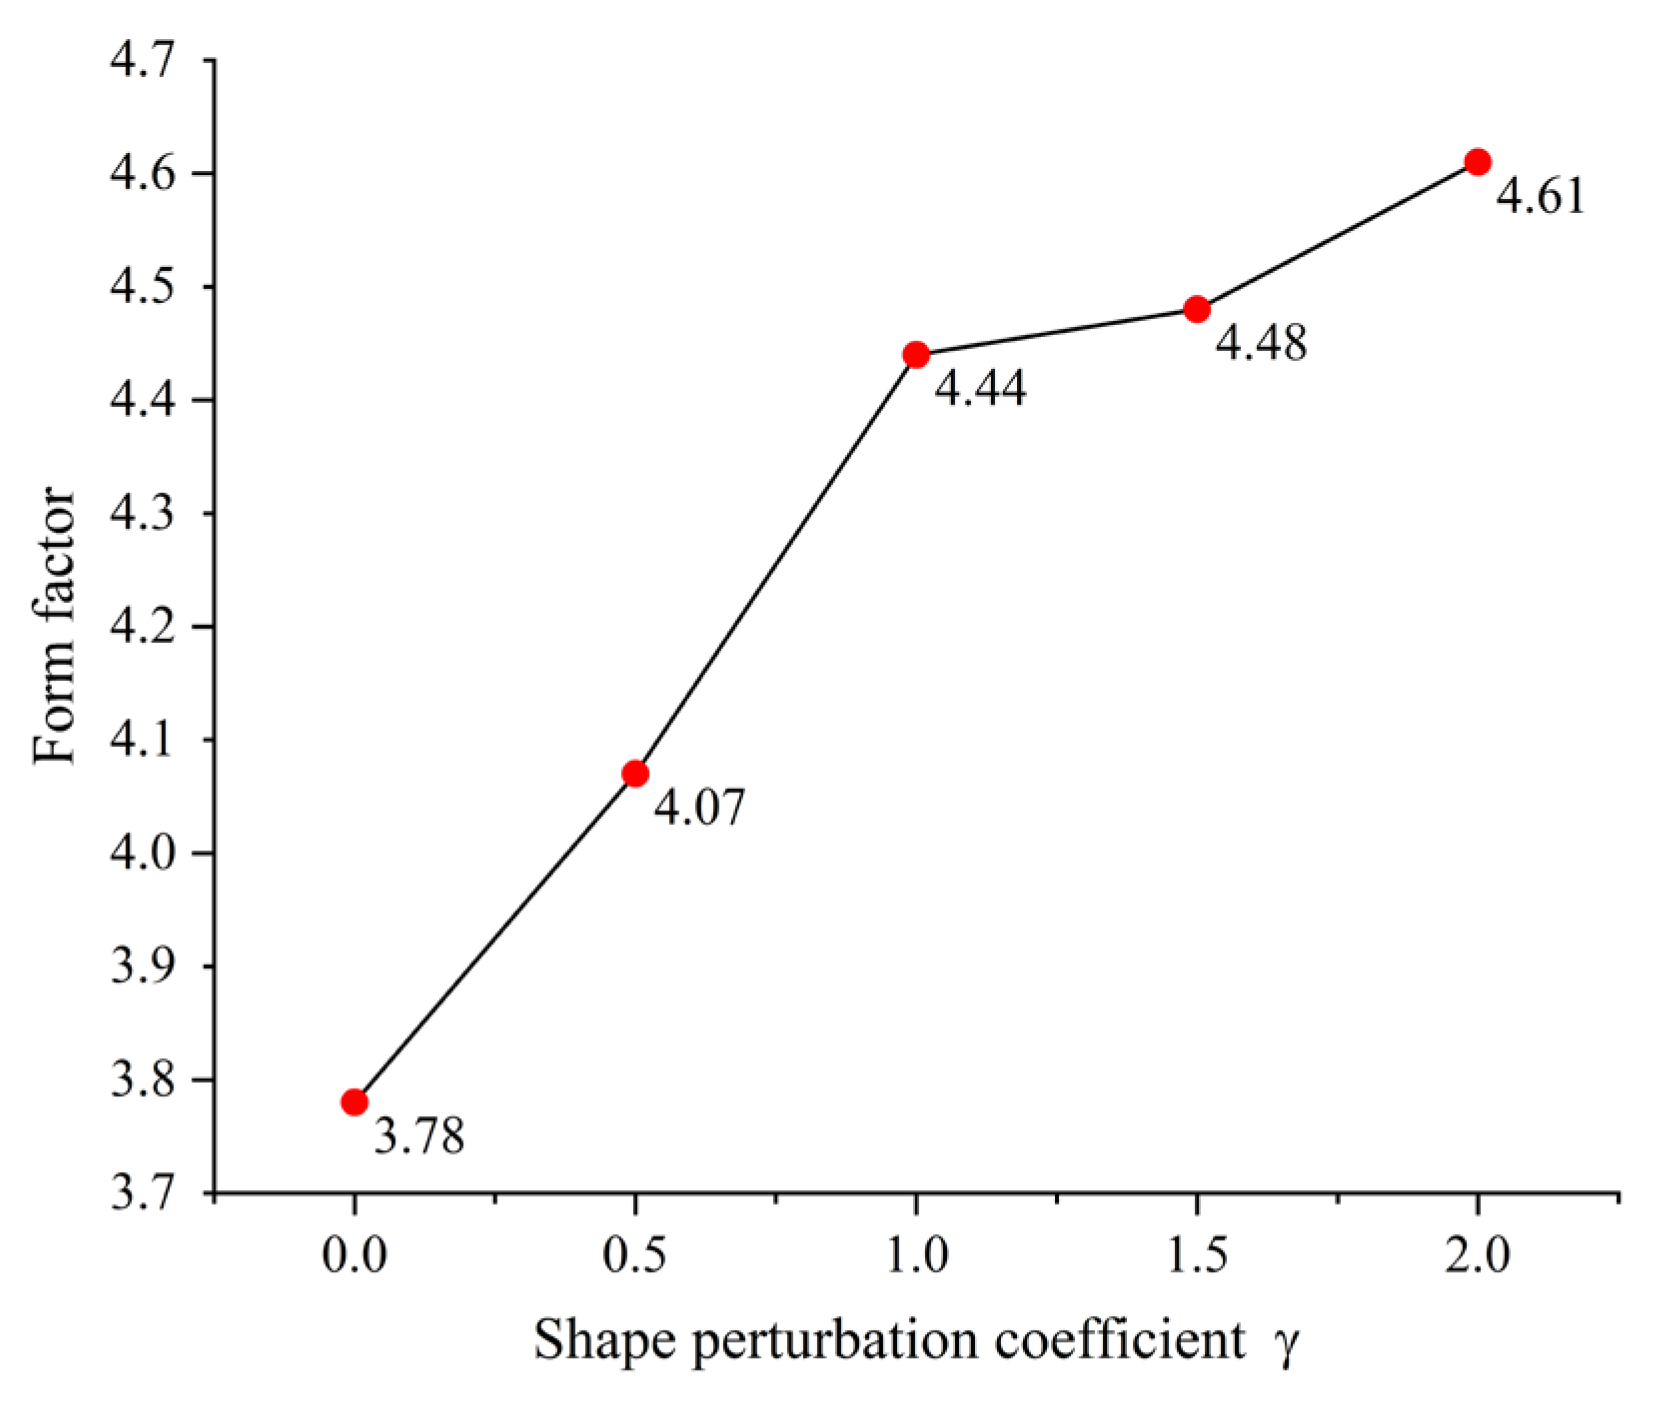
Because particle packings with different morphologies typically generate pores of distinct shapes, a shape factor (as implemented in Avizo) was used to quantify pore irregularity. Figure 19 illustrates the variation in the pore shape factor in the porous media generated under different shape-perturbation coefficients γ. In general, a larger shape-factor value indicates a more irregular pore geometry.
Figure 19.
Mean shape factor under different perturbation factors γ.
As can be seen from Figure 19, the mean shape factor increases with the shape-perturbation coefficient γ. The most pronounced rise occurs as γ increases from 0 to 1.0; the curve then becomes nearly flat between γ = 1.0 and 1.5 (with only a minor increment), followed by a small additional increase at γ = 2.0. This trend indicates that as particle surfaces become more undulated and irregular, the pore surface-area-to-volume ratio increases, and the pore geometry evolves from “nearly spherical/compact” toward “more non-spherical and more open.” Once γ reaches a moderate level, geometric interlocking and space-filling tend to stabilize, leading to diminishing marginal gains in the shape factor; only at higher γ, does further development of local roughness and concave–convex features produce a limited additional increase.
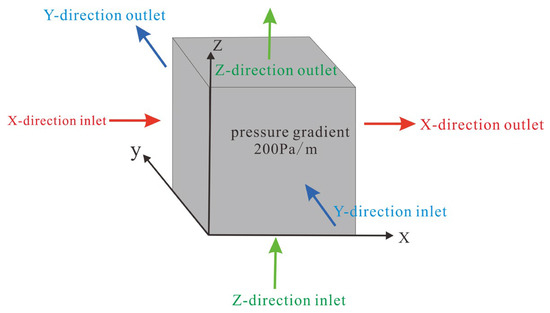
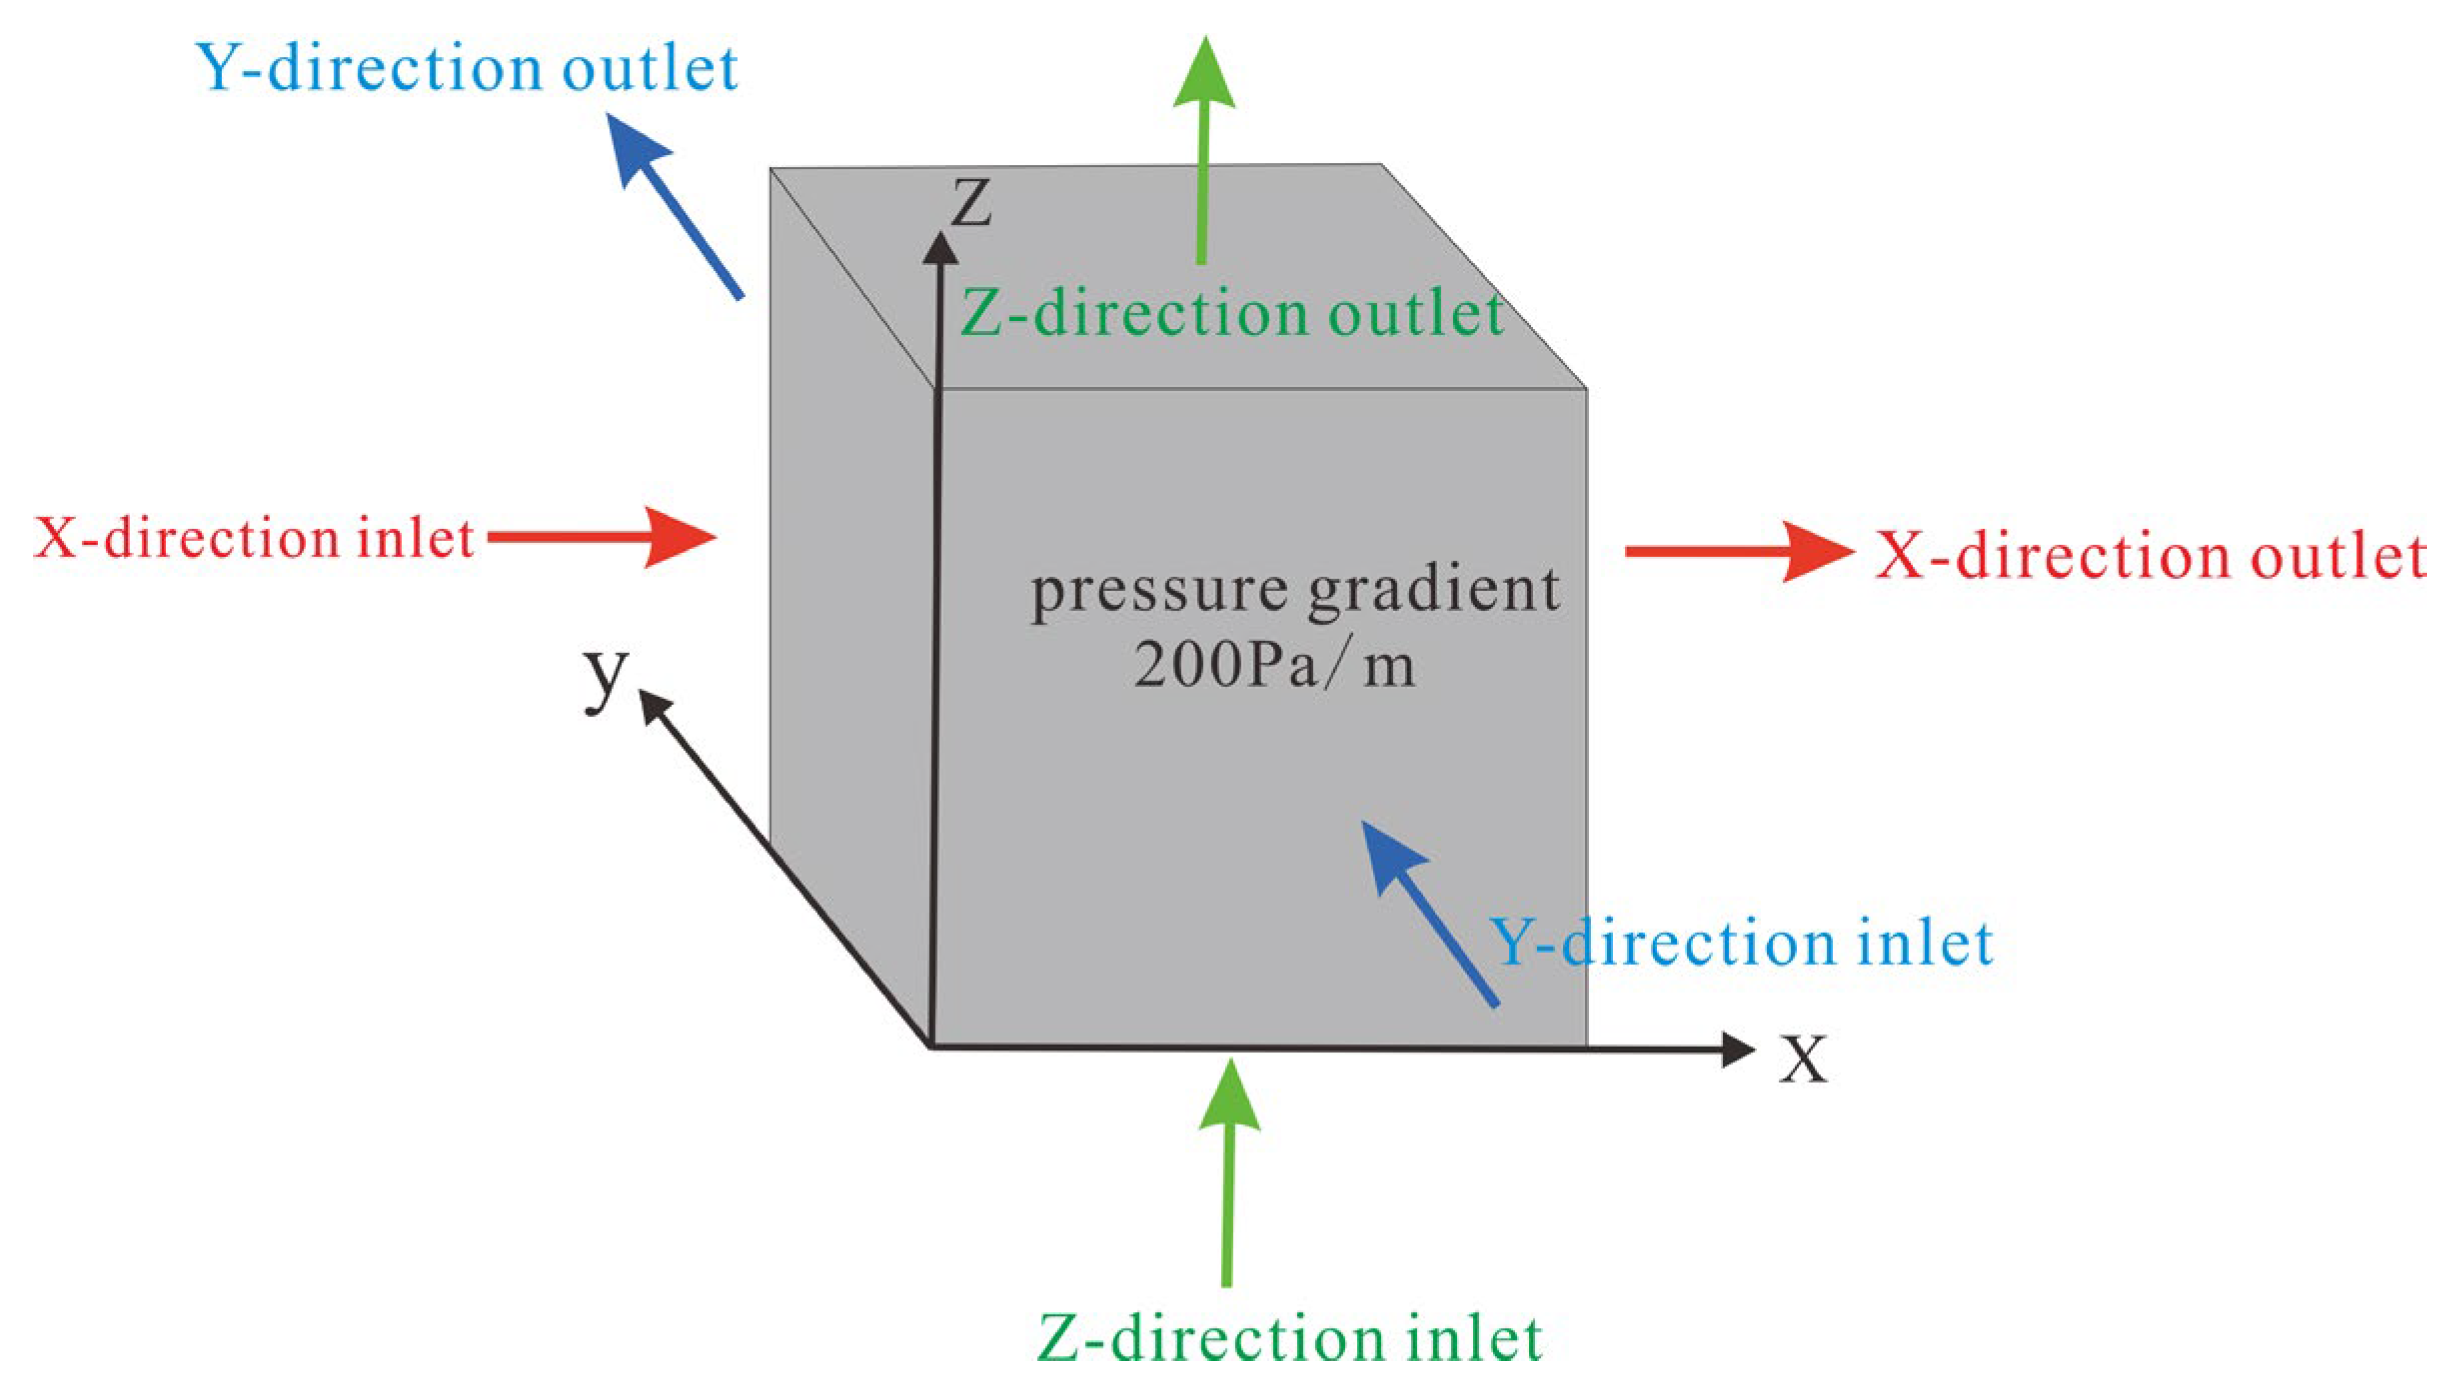
To further quantify the impact of particle morphology on seepage performance, steady-state flow simulations were conducted for the complex porous structures generated under five different γ values. A consistent set of boundary conditions was applied (Figure 20): the imposed pressure gradient was 200 Pa/m, the working fluid was water at 20 °C, under standard conditions, and flow was simulated along the three orthogonal directions (X, Y, and Z).
Figure 20.
Boundary conditions for seepage simulations in the complex porous media.
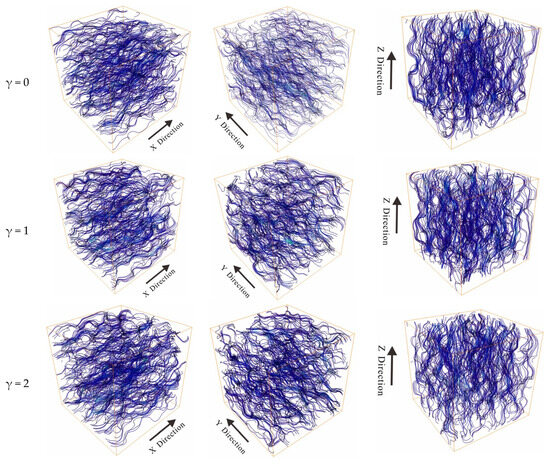
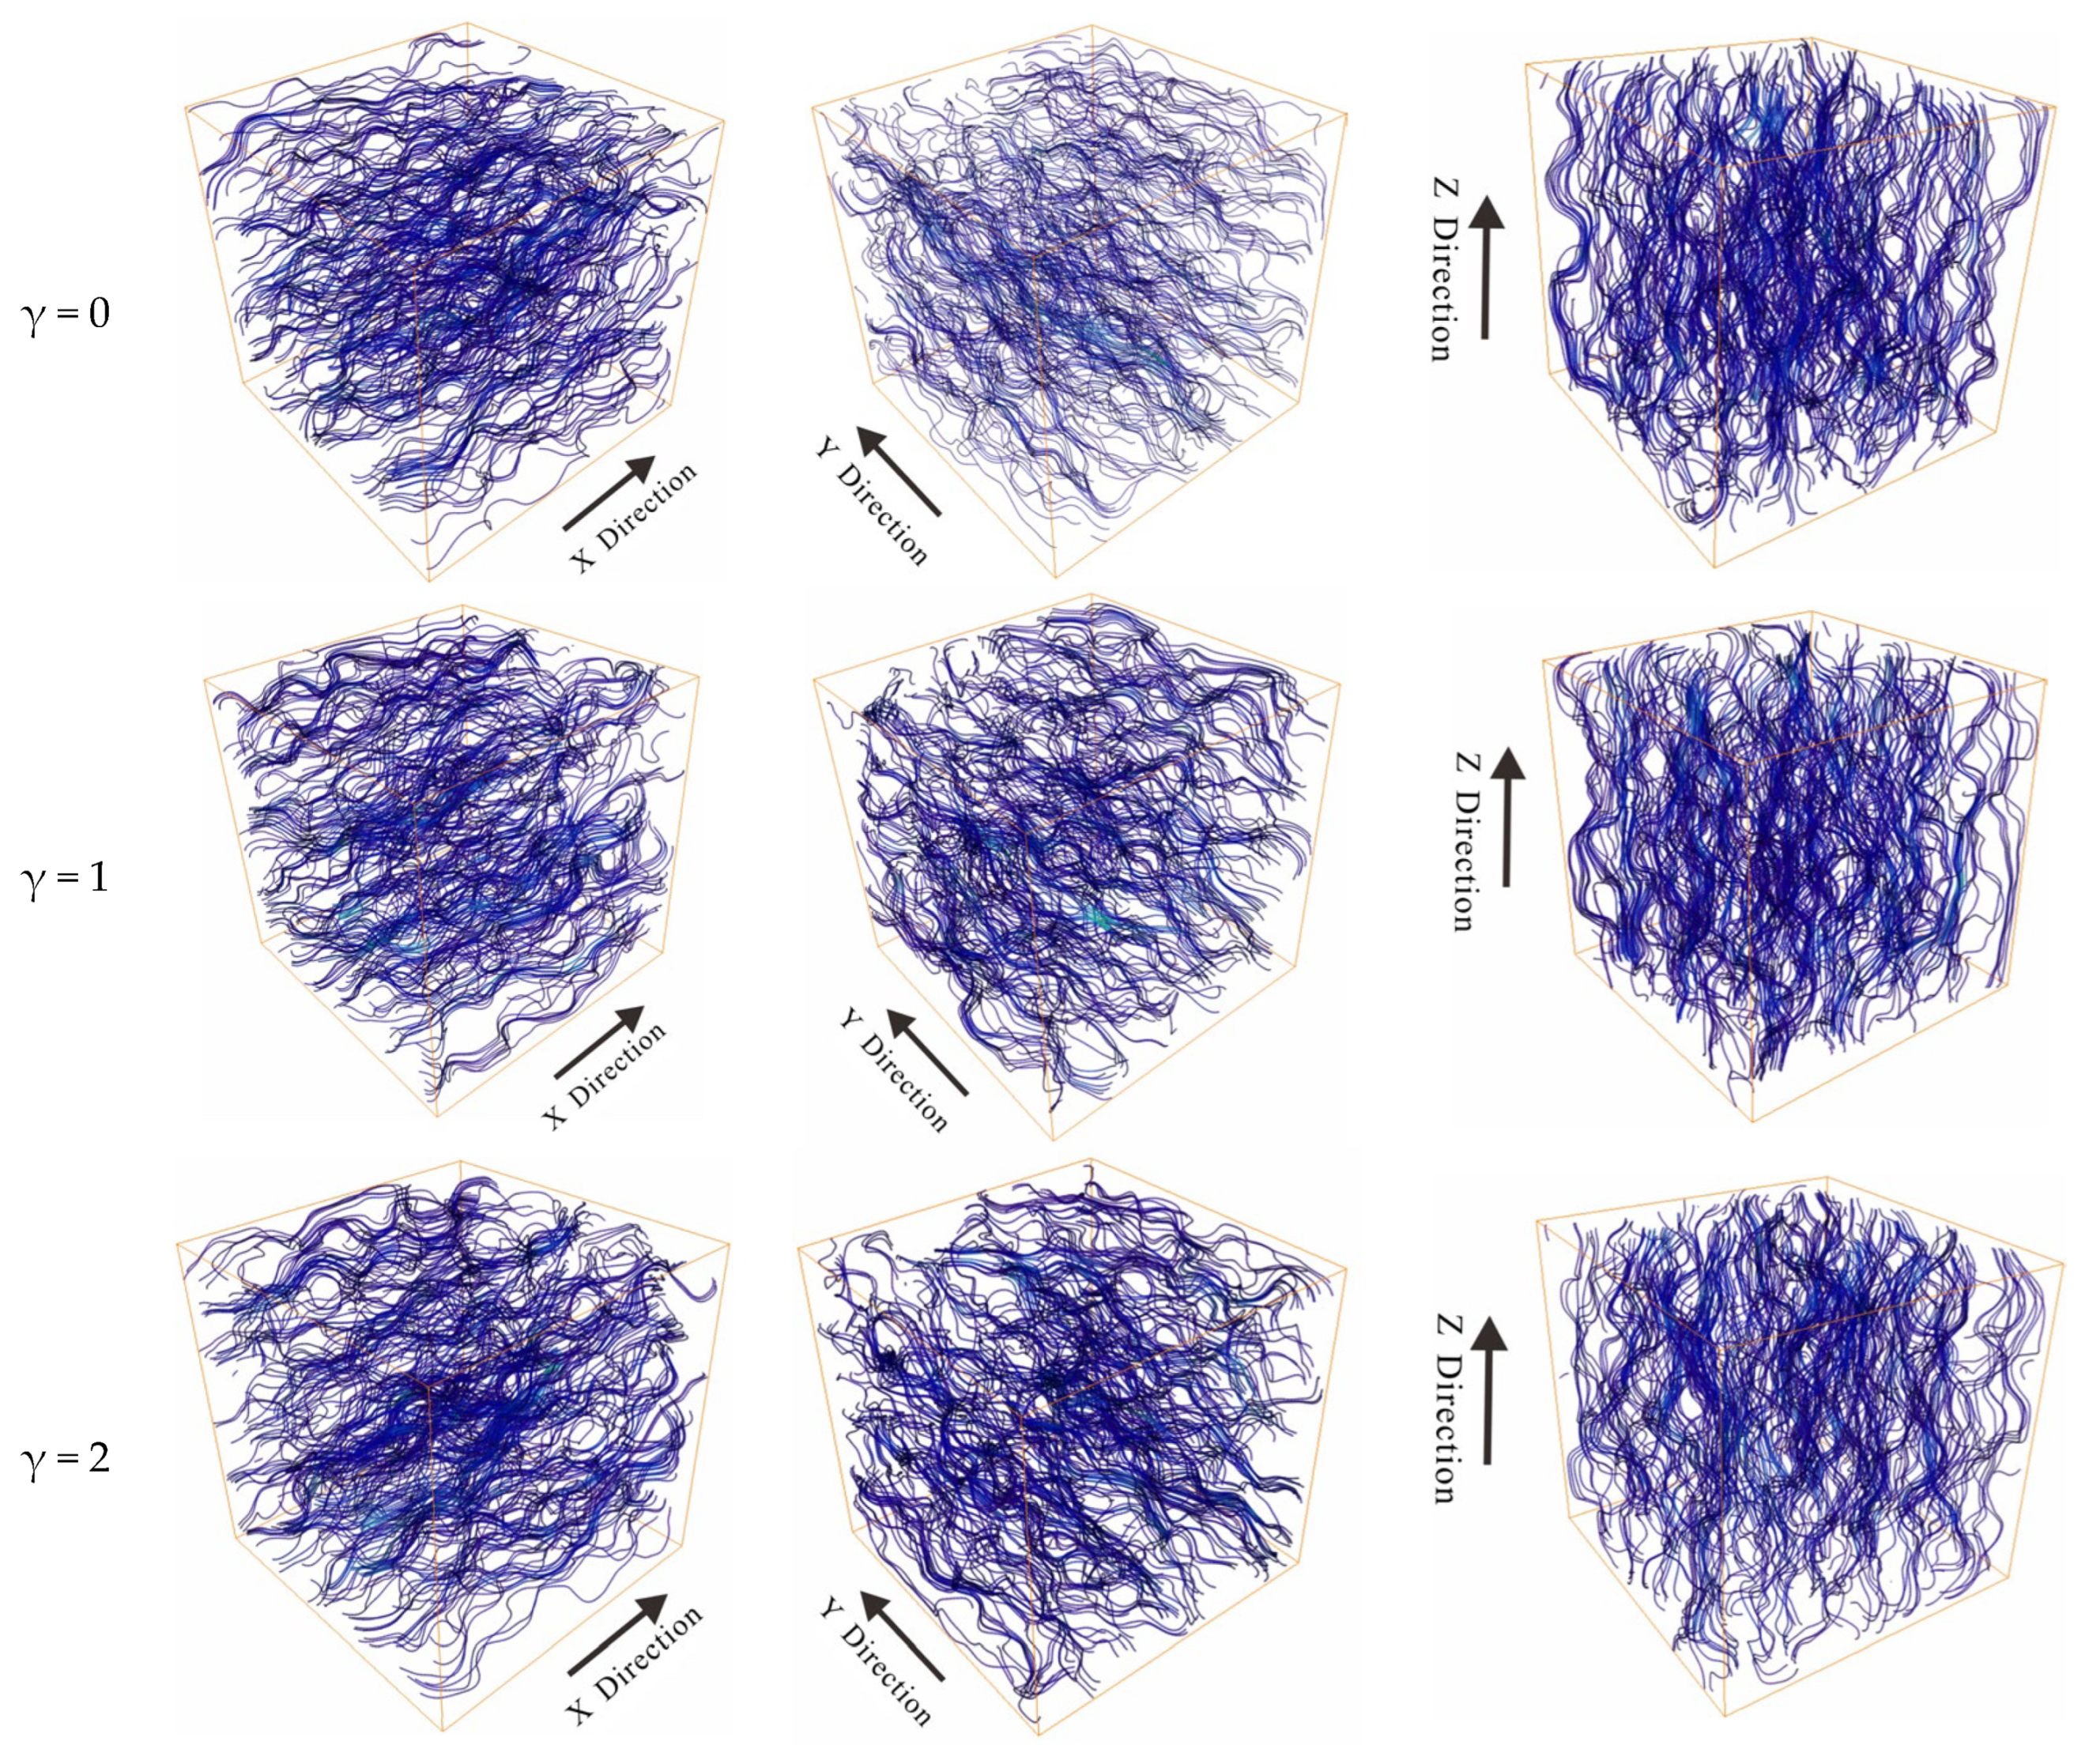
Using the three representative structures with γ = 0.0, γ = 1.0, and γ = 2.0 as examples, the internal streamline distributions are shown in Figure 21. As morphological irregularity increases, the flow pathways become noticeably more complex.
Figure 21.
Streamline distributions along different flow directions within porous media generated by particle deposition with shape-perturbation coefficients γ = 0.0, 1.0, and 2.0.
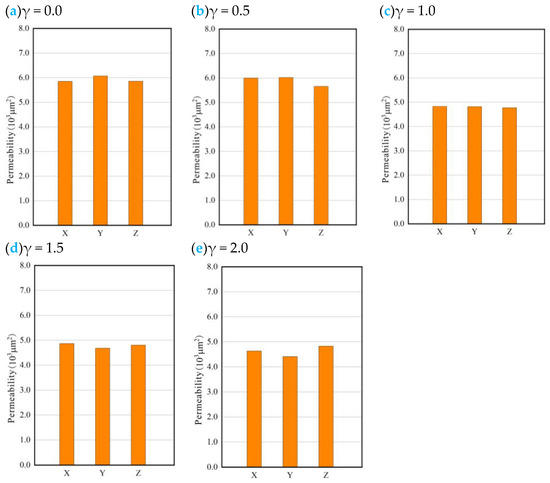
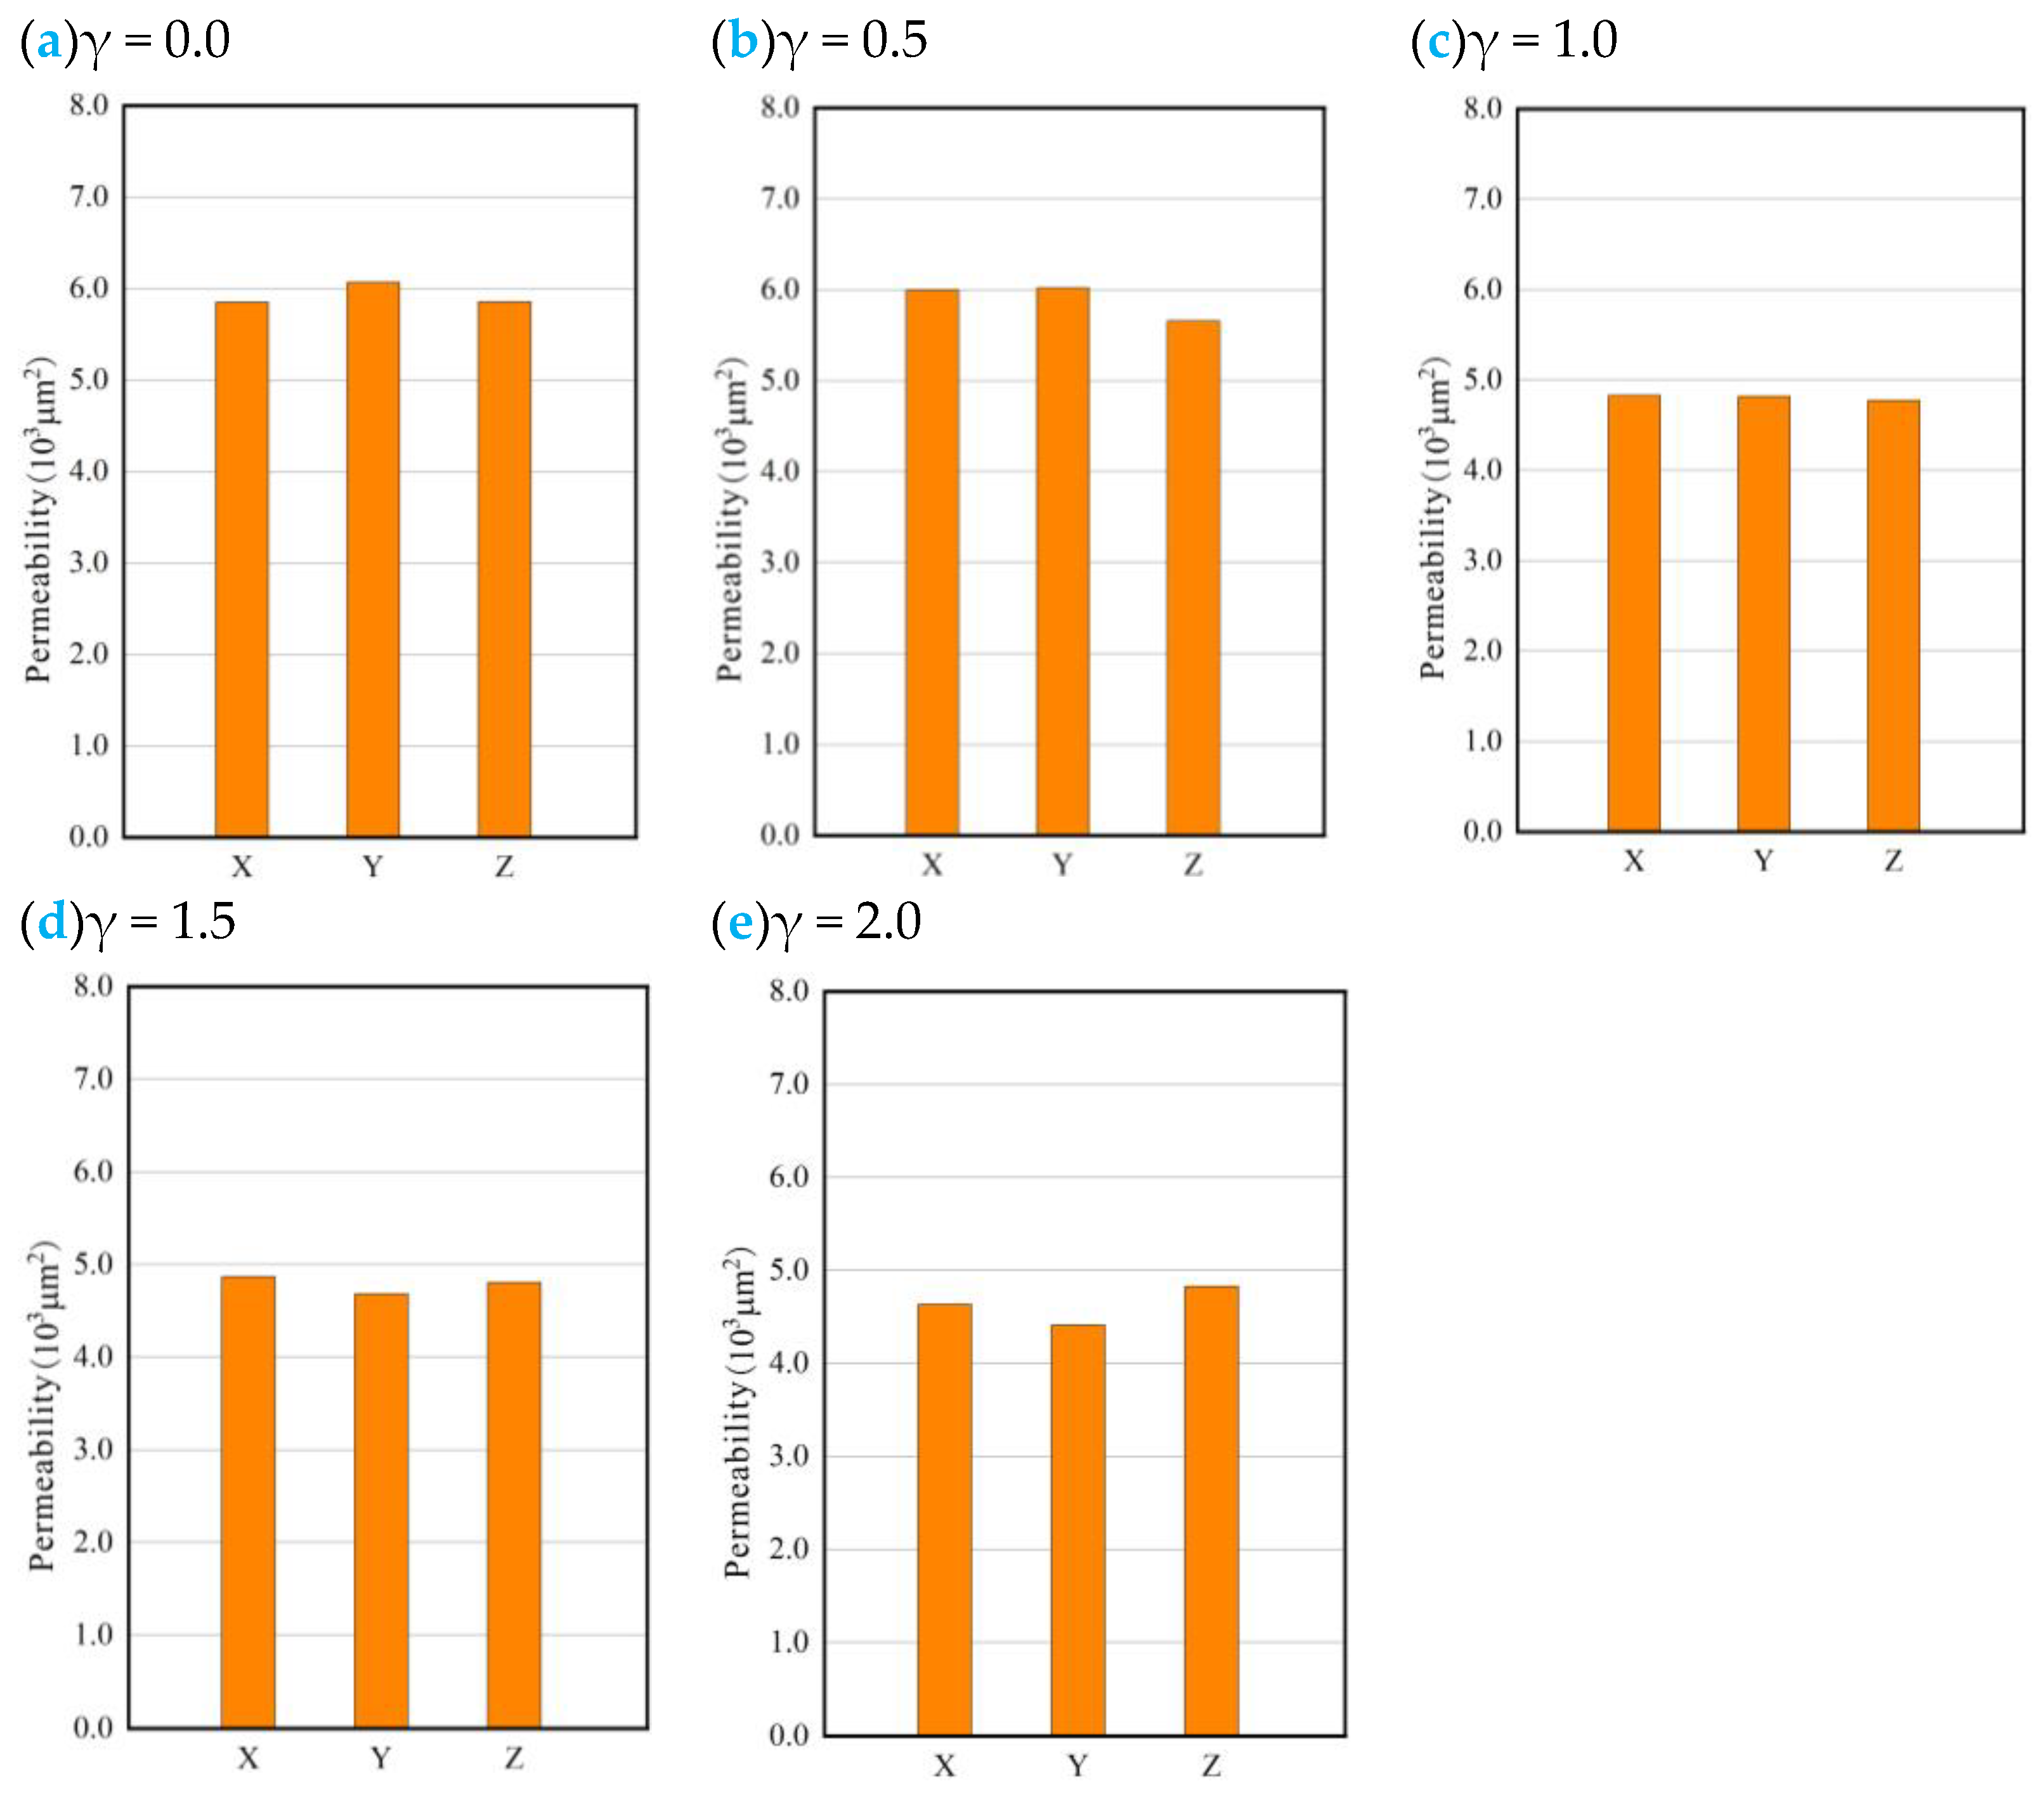
Seepage simulations were performed to compute the permeability of the deposited porous structures under different γ values along the x, y, and z directions. The results are presented in Figure 22.
Figure 22.
Bar chart of permeability along the X, Y, and Z directions for shape-perturbation coefficients γ = 0.0, 0.5, 1.0, 1.5, and 2.0.
3.3. Comparison with Previous Studies
The present numerical results are broadly consistent with previous experimental and simulation-based studies showing that stronger particle-size contrast tends to reduce permeability by promoting pore–throat constriction and increasing flow tortuosity. Likewise, the observed decrease in permeability with increasing particle irregularity agrees with earlier reports that non-sphericity and interlocking modify packing efficiency and connected flow pathways. Compared with earlier studies that mainly focused on static pore structures or isolated geometric effects, the present work provides a process-based interpretation by explicitly linking deposition history, particle-size contrast, and particle irregularity to pore-network evolution and directional permeability. Nevertheless, the current study is based on numerical simulations only, and direct experimental validation will be an important direction for future work.
3.4. Discussion
The present DEM–pore-network framework provides a process-based route for linking depositional history and particle morphology to hydraulic behavior in granular porous media. From a research perspective, the results highlight that bulk permeability cannot always be inferred from porosity or isolated local pore-network descriptors alone; instead, the spatial organization of pore domains, bottleneck throat effects, and pathway continuity at the sample scale must also be considered. This finding is particularly relevant for process–structure–property analyses of sedimentary and engineered porous materials.
From an engineering perspective, the observed sensitivity of permeability to deposition sequence, size contrast, and particle irregularity has potential implications for packed-bed design, granular filtration media, and seepage assessment in heterogeneous unconsolidated materials. In such systems, depositional history may leave a measurable hydraulic “memory,” meaning that materials with similar bulk particle-size distributions may still exhibit different permeability due to different packing pathways and resulting pore connectivity.
In the present study, only single-phase laminar Darcy flow was considered. This simplification was adopted intentionally to isolate the first-order effects of depositional sequence and particle morphology on pore-network structure and effective permeability. In more complex geological and engineering settings, multiphase flow, capillary effects, inertial flow, and non-Darcy behavior may become important. Extending the present framework to these coupled transport regimes represents an important direction for future research.
3.5. Limitations of the Study
Several limitations of the present study should be acknowledged. First, the flow simulations were restricted to single-phase laminar flow under Darcy-scale conditions. This choice was made to isolate the primary effects of deposition sequence and particle irregularity on pore-network structure and intrinsic permeability. However, in many natural and engineering porous-media systems, multiphase flow, capillary forces, inertial effects, and non-Darcy behavior may also play important roles.
Second, the present conclusions are based on numerical simulations and have not yet been directly validated using laboratory experiments or image-based measurements of real packed materials. Experimental validation will therefore be an important next step.
Third, the simulated systems represent controlled idealized granular assemblies with prescribed particle-size combinations and shape perturbation levels. Although this design is useful for isolating key mechanisms, real porous materials may involve broader particle-size distributions, more complex grain morphologies, and additional physicochemical couplings. Future work should therefore extend the framework toward more realistic multiphysics and multiphase conditions.
4. Conclusions
This study developed a reproducible process-based digital porous-media framework that links granular deposition history and particle morphology to pore-network topology and directional permeability. By coupling DEM-generated graded packings with pore-network characterization, box-counting fractal analysis, and Darcy-based permeability evaluation, several conclusions can be drawn:
- (1)
- Size contrast systematically reduces permeability. Increasing the particle-size contrast decreases porosity, shifts pore and throat size distributions toward smaller characteristic radii, increases pore-space complexity (fractal dimension), and produces a monotonic reduction in intrinsic permeability. These trends highlight that permeability degradation is driven not only by reduced void fraction but also by enhanced pore constrictions and altered connectivity.
- (2)
- Deposition sequence leaves a measurable permeability “memory”. For the simulated size-ratio range, reverse grading generally preserves more effective connected flow pathways and consistently yields higher permeability than normal grading, indicating a measurable permeability memory of deposition sequence. This indicates that permeability cannot be inferred from PSD alone; the deposition path that generates stratification and connectivity is a critical control parameter.
- (3)
- Particle irregularity reduces permeability and reorganizes anisotropy. As particle irregularity increases, permeability decreases and the permeability tensor evolves from weak horizontal anisotropy toward near-isotropy and, under strong irregularity, toward preferential vertical permeability. This demonstrates that morphology-induced changes in interlocking and pore-space constrictivity can rival grading effects in controlling permeability anisotropy.
Overall, the proposed DEM–pore-network–fractal workflow provides a mechanistic route to translate deposition sequence and particle morphology into pore-network descriptors and directional permeability. The results offer insights for sedimentary reservoir characterization, filtration media design, and packed-bed engineering where grading history and particle shape cannot be neglected.
Author Contributions
Methodology, Y.H.; Project Administration and Supervision, Y.D., Writing—Original Draft, Y.H. and Y.D.; Visualization and Writing—Review, L.C., N.W., and P.L. All authors have read and agreed to the published version of the manuscript.
Funding
This research was financially supported by the Sichuan Science and Technology Program (No. 2023YFS0408) and the National Natural Science Foundation of China (No. 41172277).
Data Availability Statement
The original contributions presented in this study are included in the article. Further inquiries can be directed to the corresponding author.
Acknowledgments
The authors thank Xu Tian and Hongkun Yang for their valuable comments and suggestions. We also wish to thank the editor and reviewers for their constructive and insightful comments on the manuscript.
Conflicts of Interest
The authors declare no conflicts of interest.
References
- Whitaker, S. Flow in porous media I: A theoretical derivation of Darcy’s law. Transp. Porous Media 1986, 1, 3–25. [Google Scholar] [CrossRef] [Scilit]
- Kresnik, P. Wasserbewegung Durch Boden: Neue Filtrations-Versuche; Spielhagen & Schurich: Vienna, Austria, 1906. [Google Scholar]
- Ruth, D.; Ma, H. On the derivation of the Forchheimer equation by means of the averaging theorem. Transp. Porous Media 1992, 7, 255–264. [Google Scholar] [CrossRef] [Scilit]
- Whitaker, S. The Forchheimer equation: A theoretical development. Transp. Porous Media 1996, 25, 27–61. [Google Scholar] [CrossRef] [Scilit]
- Carman, P.C. Permeability of saturated sands, soils and clays. J. Agric. Sci. 1939, 29, 262–273. [Google Scholar] [CrossRef] [Scilit]
- Dullien, F.A.L. Porous Media: Fluid Transport and Pore Structure; Academic Press: New York, NY, USA, 1979. [Google Scholar]
- Yin, P.; Song, H.; Ma, H.; Yang, W.; He, Z.; Zhu, X. The modification of the Kozeny-Carman equation through the lattice Boltzmann simulation and experimental verification. J. Hydrol. 2022, 609, 127738. [Google Scholar] [CrossRef] [Scilit]
- Ergun, S. Fluid Flow through Packed Columns. Chem. Eng. Prog 1952, 48, 89–94. [Google Scholar] [CrossRef] [Scilit]
- Blunt, M.J.; Bijeljic, B.; Dong, H.; Gharbi, O.; Iglauer, S.; Mostaghimi, P.; Paluszny, A.; Pentland, C. Pore-scale imaging and modelling. Adv. Water Resour. 2013, 51, 197–216. [Google Scholar] [CrossRef] [Scilit]
- Bear, J. Dynamics of Fluids in Porous Media. Soil Sci. 1975, 120, 162–163. [Google Scholar] [CrossRef] [Scilit]
- Sahimi, M. Flow and Transport in Porous Media and Fractured Rock: From Classical Methods to Modern Approaches; VCH: Weinheim, Germany, 1995; 482p. [Google Scholar]
- Wildenschild, D.; Sheppard, A.P. X-ray imaging and analysis techniques for quantifying pore-scale structure and processes in subsurface porous medium systems. Adv. Water Resour. 2013, 51, 217–246. [Google Scholar] [CrossRef] [Scilit]
- Nabipour, I.; Raoof, A.; Cnudde, V.; Aghaei, H.; Qajar, J. A computationally efficient modeling of flow in complex porous media by coupling multiscale digital rock physics and deep learning: Improving the tradeoff between resolution and field-of-view. Adv. Water Resour. 2024, 188, 104695. [Google Scholar] [CrossRef] [Scilit]
- Jiang, Z.; Wu, K.; Couples, G.; van Dijke, M.I.J.; Sorbie, K.S.; Ma, J. Efficient extraction of networks from three-dimensional porous media. Water Resour. Res. 2007, 43, W12S03. [Google Scholar] [CrossRef] [Scilit]
- Liu, J.; Zhang, T.; Sun, S. A new pixel-free algorithm of pore-network extraction for fluid flow in porous media: Flashlight search medial axis. Adv. Geo-Energy Res. 2024, 13, 32–41. [Google Scholar] [CrossRef] [Scilit]
- Xiong, Q.; Baychev, T.G.; Jivkov, A.P. Review of pore network modelling of porous media: Experimental characterisations, network constructions and applications to reactive transport. J. Contam. Hydrol. 2016, 192, 101–117. [Google Scholar] [CrossRef] [Scilit]
- Al-Raoush, R.I.; Willson, C.S. Extraction of physically realistic pore network properties from three-dimensional synchrotron X-ray microtomography images of unconsolidated porous media systems. J. Hydrol. 2005, 300, 44–64. [Google Scholar] [CrossRef] [Scilit]
- Dong, H.; Blunt, M.J. Pore-network extraction from micro-computerized-tomography images. Phys. Rev. E 2009, 80, 036307. [Google Scholar] [CrossRef] [Scilit]
- Piovesan, A.; Achille, C.; Ameloot, R.; Nicolai, B.; Verboven, P. Pore network model for permeability characterization of three-dimensionally-printed porous materials for passive microfluidics. Phys. Rev. E 2019, 99, 033107. [Google Scholar] [CrossRef] [Scilit] [PubMed]
- Rabbani, A.; Jamshidi, S.; Salehi, S. An automated simple algorithm for realistic pore network extraction from micro-tomography images. J. Pet. Sci. Eng. 2014, 123, 164–171. [Google Scholar] [CrossRef] [Scilit]
- Mishra, A.; Ma, L.; Reddy, S.C.; Attanayake, J.; Haese, R.R. Pore-to-Darcy scale permeability upscaling for media with dynamic pore structure using graph theory. Appl. Comput. Geosci. 2024, 23, 100179. [Google Scholar] [CrossRef] [Scilit]
- Gostick, J.; Aghighi, M.; Hinebaugh, J.; Tranter, T.; Hoeh, M.; Day, H.; Sharqawy, M.; Spellacy, B.; Bazylak, A.; Burns, A.; et al. OpenPNM: A Pore Network Modeling Package. Comput. Sci. Eng. 2016, 18, 60–74. [Google Scholar] [CrossRef] [Scilit]
- Li, Y.; Park, C.W. Permeability of Packed Beds Filled with Polydisperse Spherical Particles. Ind. Eng. Chem. Res. 1998, 37, 2005–2011. [Google Scholar] [CrossRef] [Scilit]
- Vidal, D.; Ridgway, C.; Pianet, G.; Schoelkopf, J.; Roy, R.; Bertrand, F. Effect of particle size distribution and packing compression on fluid permeability as predicted by lattice-Boltzmann simulations. Comput. Chem. Eng. 2009, 33, 256–266. [Google Scholar] [CrossRef] [Scilit]
- Konstanty, J.; Tyrala, D. Particle Sizing and Surface Area Measurements: A Comparative Assessment of Commercial Air Permeability and Laser Light Diffraction Instruments. Appl. Sci. 2024, 14, 4802. [Google Scholar] [CrossRef] [Scilit]
- Gritti, F. On the intrinsic effect of the particle size distribution on the permeability of particulate liquid chromatography columns. A theoretical overview. J. Chromatogr. A 2026, 1766, 466601. [Google Scholar] [CrossRef] [Scilit] [PubMed]
- Bancroft, R.S.J.; Johnson, C.G. Drag, diffusion and segregation in inertial granular flows. J. Fluid Mech. 2021, 924, A3. [Google Scholar] [CrossRef] [Scilit]
- Neveu, A.; Larcher, M.; Delannay, R.; Jenkins, J.T.; Valance, A. Particle segregation in inclined high-speed granular flows. J. Fluid Mech. 2022, 935, A41. [Google Scholar] [CrossRef] [Scilit]
- Cho, G.-C.; Dodds, J.; Santamarina, J.C. Particle Shape Effects on Packing Density, Stiffness, and Strength: Natural and Crushed Sands. J. Geotech. Geoenviron. Eng. 2006, 132, 591–602. [Google Scholar] [CrossRef] [Scilit]
- Li, W.; Huang, Z. Effects of Pore Structure Parameters on the Permeability of Porous Media as Simulated by LBM. In Proceedings of the 54th ARMA US. Rock Mechanics/Geomechanics Symposium, ARMA 2020, Golden, CO, USA, 28 June–1 July 2020. [Google Scholar]
- Garcia, X.; Akanji, L.T.; Blunt, M.J.; Matthai, S.K.; Latham, J.P. Numerical study of the effects of particle shape and polydispersity on permeability. Phys. Rev. E Stat. Nonlinear Soft Matter Phys. 2009, 80, 021304. [Google Scholar] [CrossRef] [Scilit] [PubMed]
- Monfared, Z.G.; Hellström, J.G.I.; Umeki, K. Effect of particle irregularity and particle size distribution on the morphology of packed beds of biochar particles. Sci. Rep. 2025, 15, 15086. [Google Scholar] [CrossRef] [Scilit]
- Alasadi, A.; Roshankhah, S. Experimental and Numerical Analyses of Particle Shape Effects on the Mechanical Behavior of Particulate Packs Under Different Loading Conditions. Preprint 2025. [Google Scholar] [CrossRef] [Scilit]
- Sheikh, B.; Pak, A. Numerical investigation of the effects of porosity and tortuosity on soil permeability using coupled three-dimensional discrete-element method and lattice Boltzmann method. Phys. Rev. E 2015, 91, 053301. [Google Scholar] [CrossRef] [Scilit]
- Cundall, P.A.; Strack, O.D.L. A discrete numerical model for granular assemblies. Géotechnique 1980, 30, 331–336. [Google Scholar] [CrossRef] [Scilit]
- Kamrin, K.; Hill, K.M.; Goldman, D.I.; Andrade, J.E. Advances in Modeling Dense Granular Media. Annu. Rev. Fluid Mech. 2024, 56, 215–240. [Google Scholar] [CrossRef] [Scilit]
- Mandelbrot, B.B.; Wheeler, J.A. The Fractal Geometry of Nature. Am. J. Phys. 1983, 51, 286–287. [Google Scholar] [CrossRef] [Scilit]
- Katz, A.J.; Thompson, A.H. Fractal Sandstone Pores: Implications for Conductivity and Pore Formation. Phys. Rev. Lett. 1985, 54, 1325–1328. [Google Scholar] [CrossRef] [Scilit]
- Yu, B.; Cheng, P. A fractal permeability model for bi-dispersed porous media. Int. J. Heat Mass Transf. 2002, 45, 2983–2993. [Google Scholar] [CrossRef] [Scilit]
- Michot-Roberto, S.; Garcia-Hernández, A.; Dopazo-Hilario, S.; Dawson, A. The spherical primitive and perlin noise method to recreate realistic aggregate shapes. Granul. Matter 2021, 23, 41. [Google Scholar] [CrossRef] [Scilit]
- Perlin, K. An image synthesizer. ACM SIGGRAPH Comput. Graph. 1985, 19, 287–296. [Google Scholar] [CrossRef] [Scilit]
- Al Ibrahim, M.; Kerimov, A.; Mukerji, T.; Mavko, G. Particula: A simulator tool for computational rock physics of granular media. Geophysics 2019, 84, F85–F95. [Google Scholar] [CrossRef] [Scilit]
- Liu, D.; Ren, D.; Du, K.; Qi, Y.; Ye, F. Impacts of mineral composition and pore structure on spontaneous imbibition in tight sandstone. J. Pet. Sci. Eng. 2021, 201, 108397. [Google Scholar] [CrossRef] [Scilit]
- Zhao, J.; Zhang, Y.; Zhang, M.; Mao, Z.; Wang, C.; Hu, R.; Yang, L.; Liu, Y. Research on Micro-Pore Structure and 3D Visual Characterization of Inter-Salt Shale Based on X-CT Imaging Digital Core Technology. Processes 2022, 10, 1321. [Google Scholar] [CrossRef] [Scilit]
- Wang, J.; Song, H.; Rasouli, V.; Killough, J. An integrated approach for gas-water relative permeability determination in nanoscale porous media. J. Pet. Sci. Eng. 2019, 173, 237–245. [Google Scholar] [CrossRef] [Scilit]
Disclaimer/Publisher’s Note: The statements, opinions and data contained in all publications are solely those of the individual author(s) and contributor(s) and not of MDPI and/or the editor(s). MDPI and/or the editor(s) disclaim responsibility for any injury to people or property resulting from any ideas, methods, instructions or products referred to in the content. |
© 2026 by the authors. Licensee MDPI, Basel, Switzerland. This article is an open access article distributed under the terms and conditions of the Creative Commons Attribution (CC BY) license.