Article

Spatio-Environmental Drivers of Water Scarcity in Semi-Arid Catchments: Insights from NDWI and LULC


by
Andrew Ikingura
1 and
Ryszard Staniszewski
2,*
1
Faculty of Environmental Biology, University of Life Sciences in Lublin, Dobrzanskiego 37, 20-262 Lublin, Poland
2
Faculty of Environmental Engineering and Mechanical Engineering, Poznan University of Life Sciences, Wojska Polskiego 28, 60-637 Poznan, Poland
*
Author to whom correspondence should be addressed.
Water 2026, 18(7), 855; https://doi.org/10.3390/w18070855
Submission received: 6 March 2026 / Revised: 24 March 2026 / Accepted: 26 March 2026 / Published: 2 April 2026
(This article belongs to the Section Water Resources Management, Policy and Governance)

Abstract

Water scarcity in semi-arid closed-basin systems is increasingly driven by hydrological and land transformation processes. This study integrates multi-temporal remote sensing and physicochemical data to examine spatio-environmental drivers of surface water decline in Lake Manyara. Normalized Difference Water Index (NDWI) maps derived from dry-season Landsat imagery (July 2015 and July 2025) were used to quantify surface water dynamics, while supervised Maximum Likelihood land use/land cover (LULC) classification provided a characterized existing spatial context of the study area. Physicochemical parameters derived from recent field observations were evaluated using Carlson’s Trophic State Index (TSI). Results indicate a 31.7% reduction in dry-season surface water extent, from 232.4 km2 in 2015 to 158.7 km2 in 2025, accompanied by a marked spectral shift toward more negative NDWI values, reflecting extensive lakebed exposure. Agricultural expansion and bare land surfaces were spatially associated with stronger negative NDWI patterns (r ≈ −0.64, p < 0.05). Water quality assessment revealed extreme hypereutrophic conditions (TSI = 98.07), characterized by elevated phosphorus, nitrate, and chlorophyll-a, and high ionic concentrations. The findings demonstrate that hydrological contraction, eutrophication, and catchment land transformation are interconnected processes intensifying water scarcity in semi-arid lake systems.

1. Introduction

Freshwater ecosystems are among the most vulnerable components of the global environment. Their ecological integrity is strongly influenced by hydrological variability, climatic change, land use transformation, and physicochemical stressors [1,2,3,4,5]. In many regions of the world, increasing water scarcity has emerged as one of the most pressing environmental challenges, affecting the stability and functioning of lakes, rivers, and wetlands [6,7,8,9]. Water scarcity occurs when the availability of freshwater becomes insufficient to meet ecological and human demands [10,11,12,13,14].
Globally, around 10% of the world’s population lives in areas experiencing high or critical water stress, and these figures are expected to intensify the frequency and duration of droughts due to climate change [9,15,16,17,18]. Regions such as Sub-Saharan Africa, the Middle East, and parts of Central Asia are particularly vulnerable due to their naturally arid and semi-arid climatic conditions, rapid population growth, increasing demand for irrigation, and limited water storage capacity [19,20,21,22,23,24]. In East Africa, prolonged dry seasons, erratic rainfall patterns, and progressive warming have led to widespread reductions in surface water levels, groundwater depletion, and increased variability in inflow to major river basins and lakes [25,26,27,28]. As a result, freshwater bodies in the region increasingly experience the combined impacts of water-level decline, elevated salinity, reduced transparency, and nutrient accumulation [29,30].
In addition to climatic factors, land use changes are recognized as major contributors to hydrological stress in catchments [20,31,32,33,34]. Agricultural expansion, deforestation, rangeland degradation, and settlement growth alter surface runoff, infiltration capacity, soil erosion rates, and sediment delivery to lakes and rivers [4,35]. The use of physicochemical variables and spatial indexes is crucial to determine the environmental stress posed to different freshwater ecosystems [36,37,38,39].
Physicochemical variables such as pH, salinity, conductivity, Total Dissolved Solids (TDS), nutrient concentrations (e.g., nitrate and total phosphorus), chlorophyll-a, and water transparency are widely used as indicators of ecosystem health and trophic state [40,41,42]. Changes in these variables often reflect the degree of eutrophication, sedimentation pressure, pollutant inflow, and the overall hydrological balance of a lake or river system. Tanzania’s freshwater bodies, such as Lake Victoria, Lake Tanganyika, and Lake Manyara, have been experiencing frequencies of hydrological stress linked to both climate variability and human activities [43]. Lake Manyara Catchment (LMC), in particular, has undergone substantial environmental changes over recent decades, marked by declining water levels and high sediment inflows from surrounding slopes [44,45].
Despite growing evidence of hydrological decline in semi-arid lake systems, integrated assessments that quantitatively link trophic state conditions, land use transformation, and surface water contraction remain limited in East African catchments [25,30]. Previous studies in the Lake Manyara Catchment have examined hydrological and ecological components separately. For example, ref. [25] applied remote sensing techniques to simulate catchment-scale water balance dynamics through hydrological modeling. However, these studies do not explicitly capture spatial interaction between surface water variability, land use transformation, and in-lake ecological conditions. This study addresses this gap by combining a multi-temporal Normalized Difference Water Index (NDWI)-based surface water analysis (2015–2025), land use/land cover classification, and trophic state assessment. This combination allows us to examine the interrelationship between hydrological variability, land transformation, and ecological conditions within the Lake Manyara system.
This research aims to determine the trophic condition of Lake Manyara, quantify surface water extent changes between 2015 and 2025, and lastly, evaluate how spatial land transformations correspond with hydrological and nutrient dynamics. This study provides an integrated framework for understanding water scarcity drivers in semi-arid catchments by linking remote sensing metrics with trophic state modeling based on recent physicochemical data. The findings support spatially informed and evidence-based catchment management strategies applicable to similar vulnerable lake systems.

2. Description of the Study Area

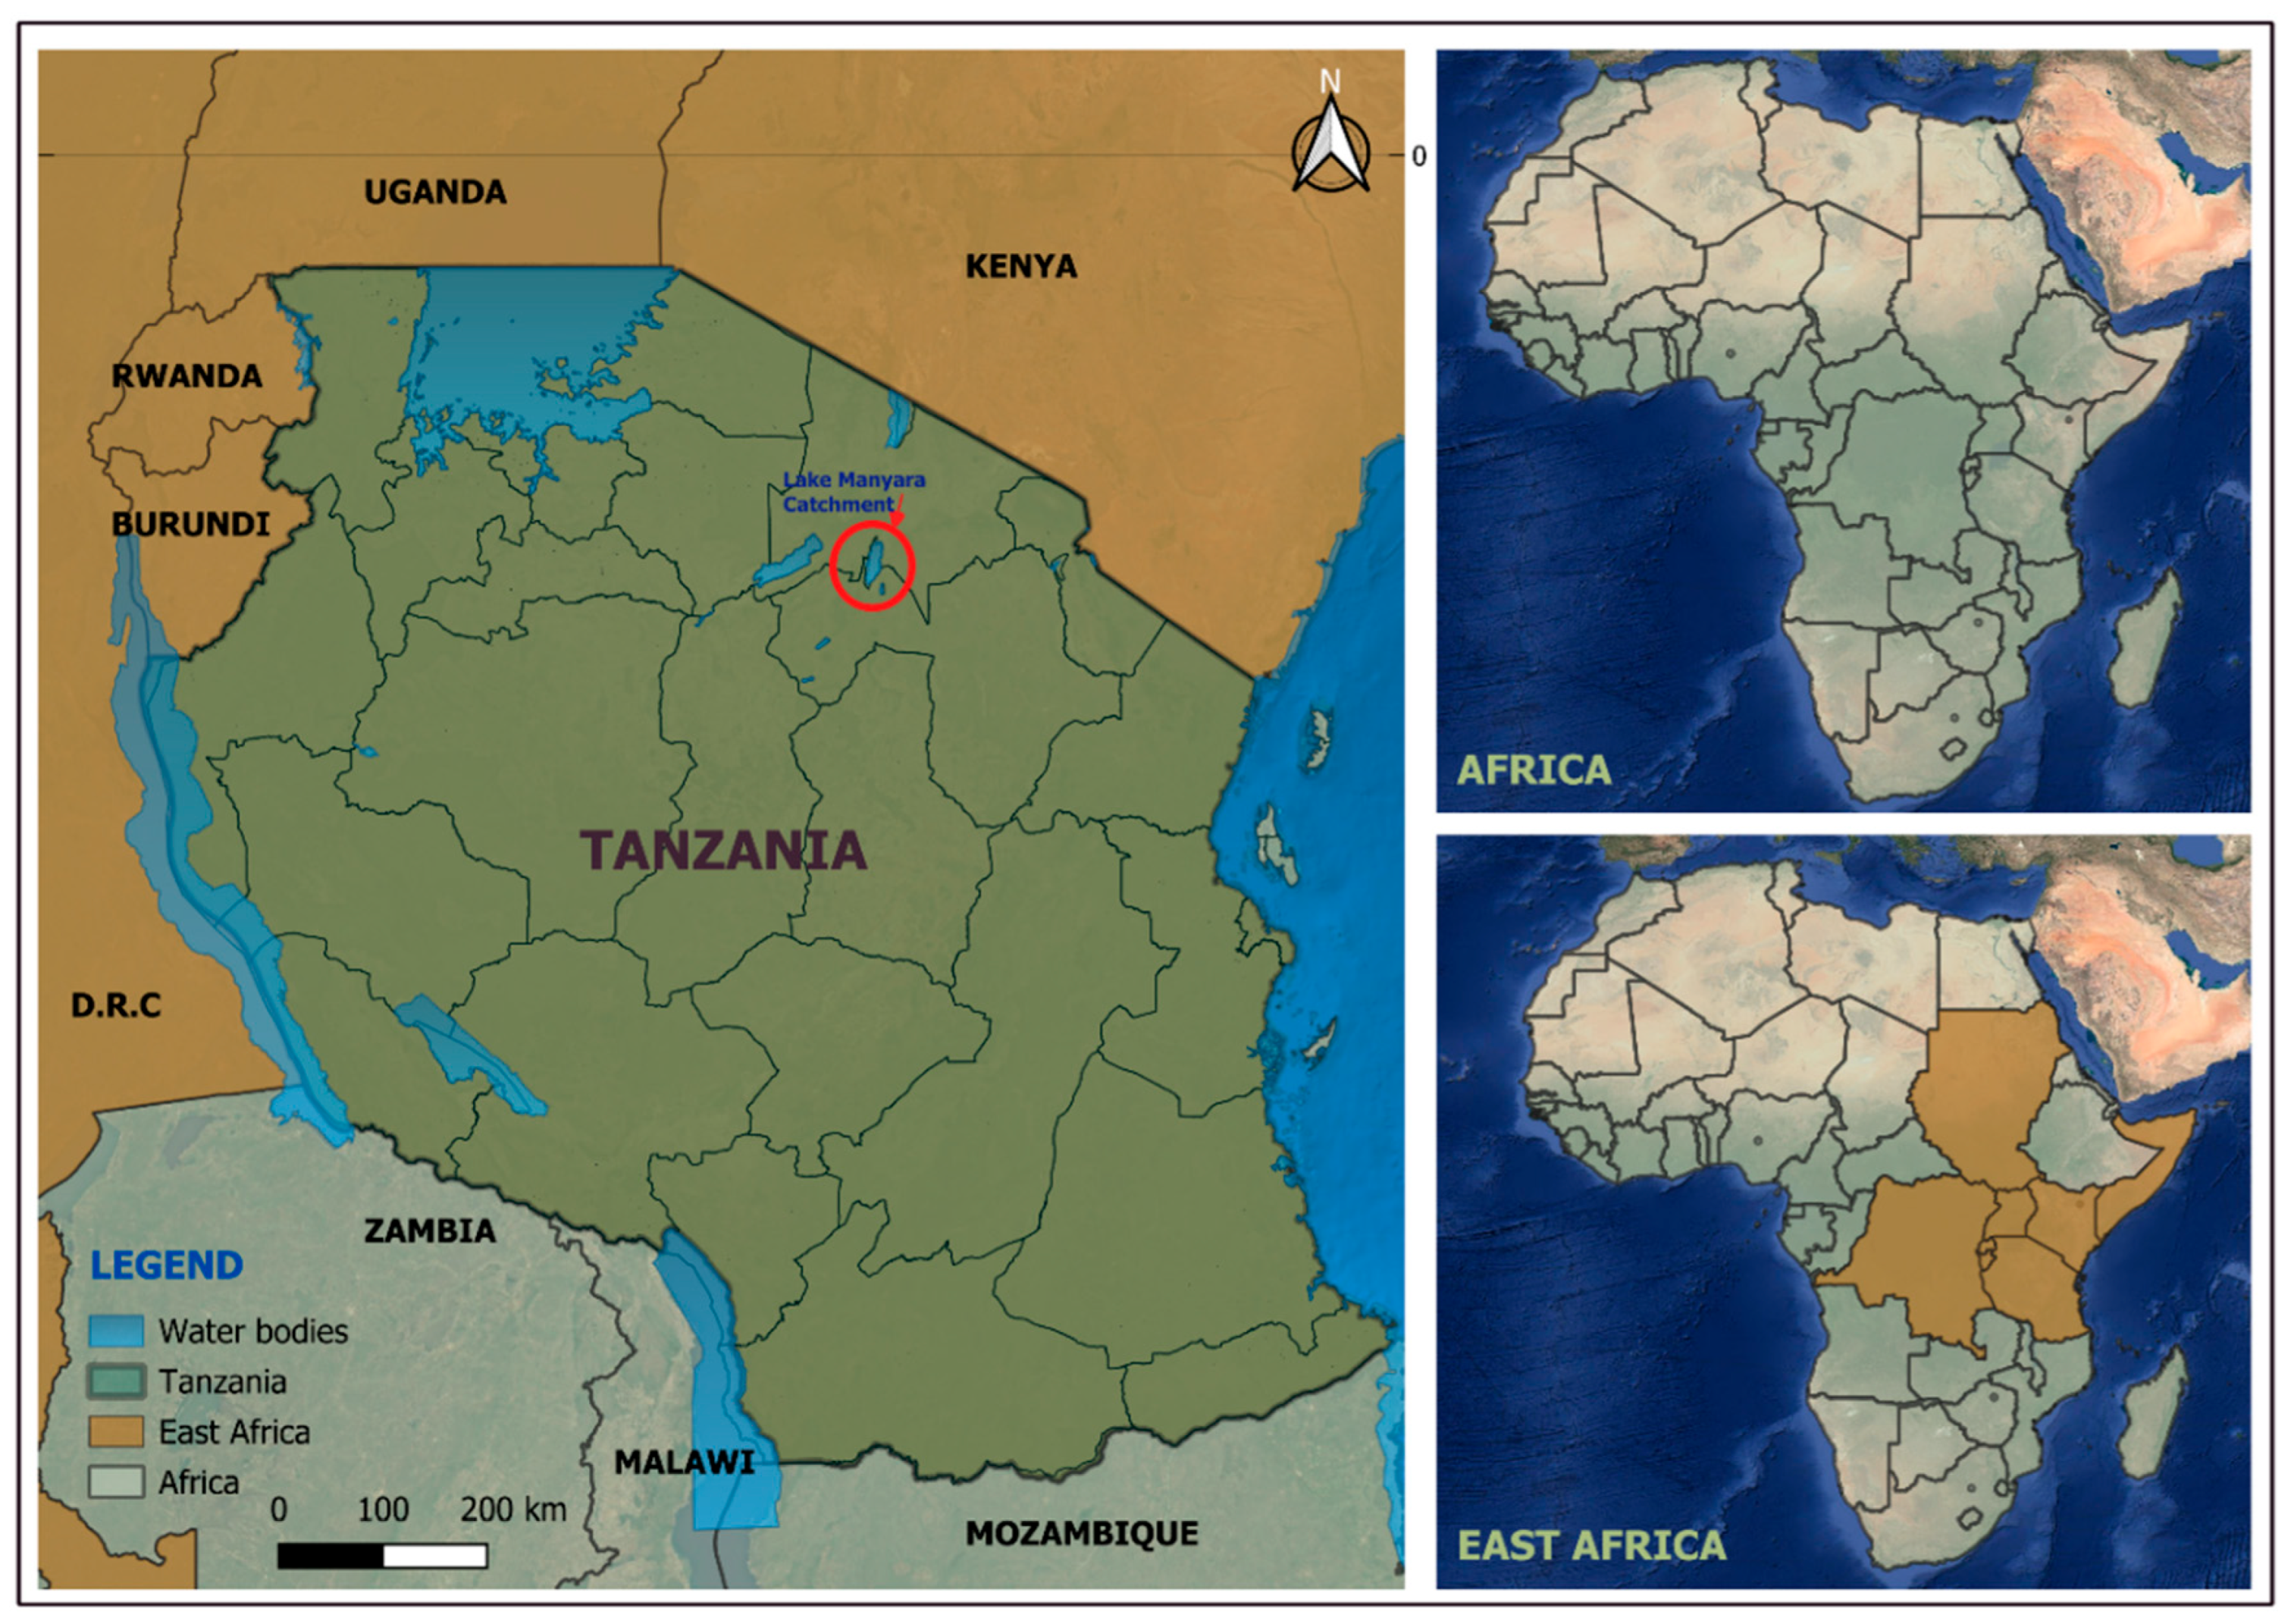
The Lake Manyara Catchment is located in northern Tanzania, within the southern segment of the eastern arm of the East African Rift System, approximately 126 km west of Arusha. The catchment has an area coverage of around 18,763 km2, and the elevations in the catchment range between 885 m and 3618 m above sea level [25]. Lake Manyara is a shallow, closed-basin soda lake, meaning it has no surface outflow, and water loss majorly occurs through evaporation, contributing to its high alkalinity and salinity. The lake partly lies within Lake Manyara National Park, with an area coverage of approximately 440 square kilometers, found within geographical coordinates of (3°03′–5°90′ S, 35°26′–36°40′ E), as shown in Figure 1. Annual rainfall varies spatially and temporally, with recorded values between 430 mm and over 1000 mm, influenced by topography and seasonal shifts in the Inter-Tropical Convergence Zone (ITCZ). Temperatures range broadly due to elevation variation, while evapotranspiration rates are high, reinforcing the lake’s hydrological sensitivity.
Hydrologically, Lake Manyara is sustained by a combination of rainfed surface inflows, such as Mto wa Mbu, Simba, and Makuyuni rivers, and underground springs that emerge along the rift escarpment and margins, particularly maintaining wetland areas during dry periods [43]. The shallow nature of the lake, with depths rarely exceeding a few meters, leads to strong seasonal variability in surface extent, with significant contraction during dry periods and expansion during wet seasons. Ecologically, the catchment encompasses a variety of vegetation zones, including riparian and groundwater forests, acacia woodlands, and open grasslands, supporting a diverse array of wildlife and vegetation adapted to contrasting hydrological and climatic conditions [46]. These environmental gradients contribute to spatial heterogeneity in land cover and hydrological response, which are crucial for understanding water dynamics and landscape transformation within the catchment.

3. Materials and Methods

The methodological approach of this study combined geospatial analysis, remote sensing techniques, and physicochemical data interpretation to assess key environmental variables influencing water scarcity within the Lake Manyara Catchment (LMC).

3.1. Data Collection

3.1.1. Physicochemical Data

Physicochemical data for Lake Manyara were obtained from the peer-reviewed study conducted by [47] which provided recent field-based measurements of key water quality indicators. The dataset included lake depth, Secchi disk transparency, pH, salinity, Total Dissolved Solids (TDS), electrical conductivity, total phosphorus (TP), nitrate (NO3), ammonia (NH3), chlorophyll-a, and phycocyanin concentrations. All parameters were reported as mean values with associated variability measures. For the purpose of trophic state assessment, total phosphorus values originally expressed in mg/L were converted to µg/L to ensure consistency with Carlson’s Trophic State Index (TSI) formulation [48]. The physicochemical dataset provided a recent characterization of the lake’s conditions and serves as a representative reference for interpreting water quality dynamics within the broader study period.

3.1.2. Satellite Data Acquisition

Remote sensing analysis was conducted using Landsat 8 Operational Land Imager (OLI) imagery obtained from the United States Geological Survey (USGS) EarthExplorer platform. Landsat Collection 2 Level-2 Surface Reflectance products were selected to ensure atmospheric correction consistency using the Landsat Surface Reflectance Code (LaSRC). Two cloud-minimized scenes acquired during the peak dry season (July) were selected to reduce seasonal hydrological variability and enhance comparability of surface water extent. While this does not constitute a continuous temporal analysis, it enables controlled comparison under similar seasonal hydrological conditions. The selected acquisition dates were 18 July 2015 and 22 July 2025. Long-term rainfall records from the Tanzania Meteorological Authority indicate that July represents a stable low-precipitation period, thereby reducing bias associated with seasonal flooding or anomalous wet-year conditions. The satellite images were projected in WGS 84/UTM Zone 37S (EPSG: 32737) with a spatial resolution of 30 m. Cloud and cloud-shadow pixels were removed using the Quality Assessment (QA_PIXEL) band and a mask-based masking approach to ensure reliable surface reflectance extraction.

3.2. Data Processing and Analysis

3.2.1. Trophic State Index (TSI) Calculation

The trophic condition of Lake Manyara was quantitatively assessed using Carlson’s Trophic State Index [48]. The TSI was computed based on Secchi disk transparency (SD), chlorophyll-a concentration (CHL), and total phosphorus (TP) according to the following logarithmic formulas:
TSI (SD) = 60 − 14.41 ln (SD)
TSI (CHL) = 9.81 ln (CHL) + 30.6
TSI (TP) = 14.42 ln (TP) + 4.15
where
  • SD = Secchi depth (m).
  • CHL = chlorophyll-a (µg/L).
  • TP = total phosphorus (µg/L).
The overall trophic state was determined by averaging the three component indices:
TSI (mean) = [TSI (SD) + TSI (CHL) + TSI (TP)]/3
The classification thresholds followed [48,49] standards, where TSI values greater than 70 indicate hypereutrophic conditions.

3.2.2. Normalized Difference Water Index (NDWI) Computation

Surface water dynamics were assessed using the Normalized Difference Water Index (NDWI) proposed by [50] which enhances open water features while suppressing vegetation and soil reflectance. For Landsat 8 imagery, NDWI was calculated as
NDWI = (Green − NIR)/(Green + NIR)
where
  • Green = Band 3.
  • NIR = Band 5.
NDWI values range between −1 and +1, with higher values generally indicating open water. Rather than applying a universal fixed threshold, water and non-water classes were delineated based on spectral ranges identified from the 2015 reference image through spatial analysis and visual interpretation. This approach enabled the identification of NDWI value intervals representing surface water under the specific conditions of Lake Manyara. The derived NDWI classification ranges were then consistently applied to the 2025 image to ensure comparability in surface water extent estimation across the two time periods.

3.2.3. Land Use and Land Cover (LULC) Classification

Land use and land cover classification was performed using supervised classification with the Maximum Likelihood Classification (MLC) algorithm in ArcGIS. MLC was selected due to its widespread application and robustness in medium-resolution multispectral imagery analysis. Training samples were defined for the dominant land cover classes within the Lake Manyara Catchment, including water bodies; agricultural land; forest; flooded vegetation; rangeland; bare land; and built-up areas. Post-classification refinement was conducted to reduce spectral noise and improve thematic consistency.

3.2.4. Accuracy Assessment

The classification performance was rigorously evaluated using the Kappa coefficient (K) to account for agreement occurring by chance. This statistical metric provides a robust assessment, calculated as the ratio of observed agreement (Po) exceeding expected random agreement (Pe) over total potential agreement. The Kappa coefficient (K) was computed to assess agreement beyond chance using
K = (Po − Pe)/(1 − Pe)
where
  • Po = observed agreement.
  • Pe = expected agreement by chance.
Adhering to standard interpretation, Kappa values exceeding 0.80 were interpreted as having strong agreement, indicating reliable classification performance.

4. Results and Discussion

4.1. Physicochemical Parameters of Lake Manyara

Different physicochemical variables such as lake depth, Secchi disk depth, pH conditions, salinity, Total Dissolved Solids (TDS) concentration, conductivity, nutrient concentrations such as total phosphorus (TP), nitrate and ammonia, chlorophyll-a, and phycocyanin concentration were obtained in Lake Manyara with respect to the study conducted by [47]. Table 1 below describes different physicochemical parameters of Lake Manyara.
The mean depth observed in Lake Manyara was 2.37 m. By considering all the measurements taken from the field, the values range between a minimum depth of 0.67 m and a maximum depth of 4.62 m. This suggests that seasonal fluctuations in water levels tend to occur in this lake. Such shallow morphometry increases susceptibility to wind-induced sediment resuspension, internal nutrient loading, and rapid temperature fluctuations. The wide depth range further suggests strong seasonal hydrological variability, consistent with semi-arid basin hydrodynamics, where evaporation often exceeds inflow during prolonged dry periods [51,52].
The mean Secchi disk depth was equal to 0.26 m, which indicates extremely low water transparency and high turbidity levels, resulting from excessive deposition of organic matter and the presence of algal blooms. According to the OECD standards, this proves that Lake Manyara exhibits hypereutrophic conditions since the Secchi disk transparency is less than 0.7 m. However, in shallow alkaline lakes, reduced transparency may result from a combination of phytoplankton biomass, inorganic suspended sediments, and organic detritus [53].
Furthermore, the study also revealed that the lake exhibits an alkaline environment with a pH reaction of 9.5, exceeding the optimal range for most freshwater species (6.5–9.0). In most cases, high pH conditions often lead to physiological stress to the aquatic environment, disrupting enzyme activity, metabolic processes, and reproduction. A recorded Practical Salinity Unit (PSU) of 2.2 PSU in Lake Manyara suggests the increasing ion concentration, possibly due to evaporation-driven salt accumulation. Total Dissolved Solids (TDS) concentration of 2111.9 mg/L was recorded in Lake Manyara. This is a relatively high value, indicating a significant presence of dissolved salts, minerals, and potential pollutants. In addition to that, the conductivity in Lake Manyara was noted to be around 4128.9 µS/cm, which is considerably high and indicates an increased ionic concentration potentially from the evaporation and other anthropogenic inputs. The conductivity of this lake was contrary to that of Lake Victoria, where values remain relatively low (106–169 µS/cm) due to the lake’s dilute nature and strong rainfall influence, as reported by [54].
A total phosphorus (TP) concentration of 4.9 mg/L measured in Lake Manyara indicates a severe nutrient enrichment of the lake, which surpasses the threshold value for eutrophication (>0.1 mg/L) in hypereutrophic water. Elevated phosphorus levels tend to promote excessive algal growth, which leads to oxygen depletion through algal decomposition. Such elevated phosphorus levels are commonly associated with external inputs from agricultural runoff, particularly in catchments experiencing cropland expansion. Nutrient influx from surrounding agricultural areas contributes to increased availability of limiting nutrients, which stimulates excessive phytoplankton growth, as reflected in the high concentrations of chlorophyll-a observed in waters.
Moreover, the elevated nitrate concentration (NO3) of 21.9 mg/L measured in Lake Manyara further suggests a substantial nutrient input, likely associated with fertilizer runoff and soil leaching from agricultural land within the catchment. The mean ammonia (NH3) concentration of 0.1 mg/L indicates a notable risk of toxicity in this alkaline lake, where ammonium also converts to highly toxic free ammonia. The high chlorophyll-a concentration of 349.8 µg/L reflects intense algal biomass development, which is consistent with nutrient-enriched conditions driven by phosphorus and nitrogen inputs. Such algal proliferation reduces water transparency, as observed in the low Secchi depth (0.26 m), and contributes to the elevated Trophic State Index. Excessive algal blooms in the lake cause oxygen depletion, which creates hypoxic conditions that threaten the aquatic species [55]. The algal blooms dominated by cyanobacteria tend to produce harmful cyanotoxins, which are detrimental to fish, amphibians, and terrestrial organisms that rely heavily on the lake’s water resources for their survival.
Finally, the presence of phycocyanin measured at 9.5 µg/L also tends to prove the dominance of cyanobacteria in the lake. The cyanobacteria blooms lead to the production of harmful toxins, which accumulate in the food web, resulting in immune suppression and reproduction failure, hindering the chances of the survival of different aquatic species. When interpreted alongside high chlorophyll-a and alkaline pH, these data suggest a phytoplankton community structure skewed toward bloom-forming cyanobacteria. Such dominance is ecologically significant due to the potential production of cyanotoxins, which can impair fish health, reduce zooplankton grazing efficiency, and compromise water usability for wildlife and livestock. The physicochemical analysis of the lake indicates that Lake Manyara is a highly disturbed aquatic ecosystem characterized by severe eutrophication, high turbidity, elevated salinity, and significant chemical pollution, which threatens the aquatic biodiversity in numerous ways.
The trophic state of Lake Manyara was scientifically determined based on its physicochemical conditions of the lake, whereby a quantitative measure of the Trophic State Index (TSI), which is a numerical scale developed by [48], was conducted. This measure is based on parameters such as water clarity, chlorophyll-a, and total phosphorus concentration within the lake. Each of these parameters is calculated by specific formulas denoted as TSI (SD), which is based on Secchi disk transparency; TSI (CHL), based on chlorophyll-a concentration; and TSI (TP), based on total phosphorus concentration. The average Trophic State Index (TSI) values were used to determine the trophic state of the lake. Table 2 below shows the interpretation of the Trophic State Index (TSI) values.
Trophic State Index computation of Lake Manyara:
Secchi disk depth = 0.26 m;
Chlorophyll-a = 349.8 µg/L;
Total phosphorus = 4900 µg/L.
Classification of the Trophic State Index (TSI) at Lake Manyara is given by [48]
TSI (SD)—based on Secchi disk transparency:
TSI (SD) = 60 − 14.41 × ln (SD) = 79.41.
TSI (CHL)—based on Chlorophyll-a concentration:
TSI (CHL) = 9.81 × ln (CHL) + 30.6 = 88.1.
TSI (TP)—based on total phosphorus concentration:
TSI (TP) = 14.42 × ln (TP) + 4.15 = 126.7.
Average TSI = TSI (SD) + TSI (CHL) + TSI (TP)/3 = 294.2/3 = 98.07.
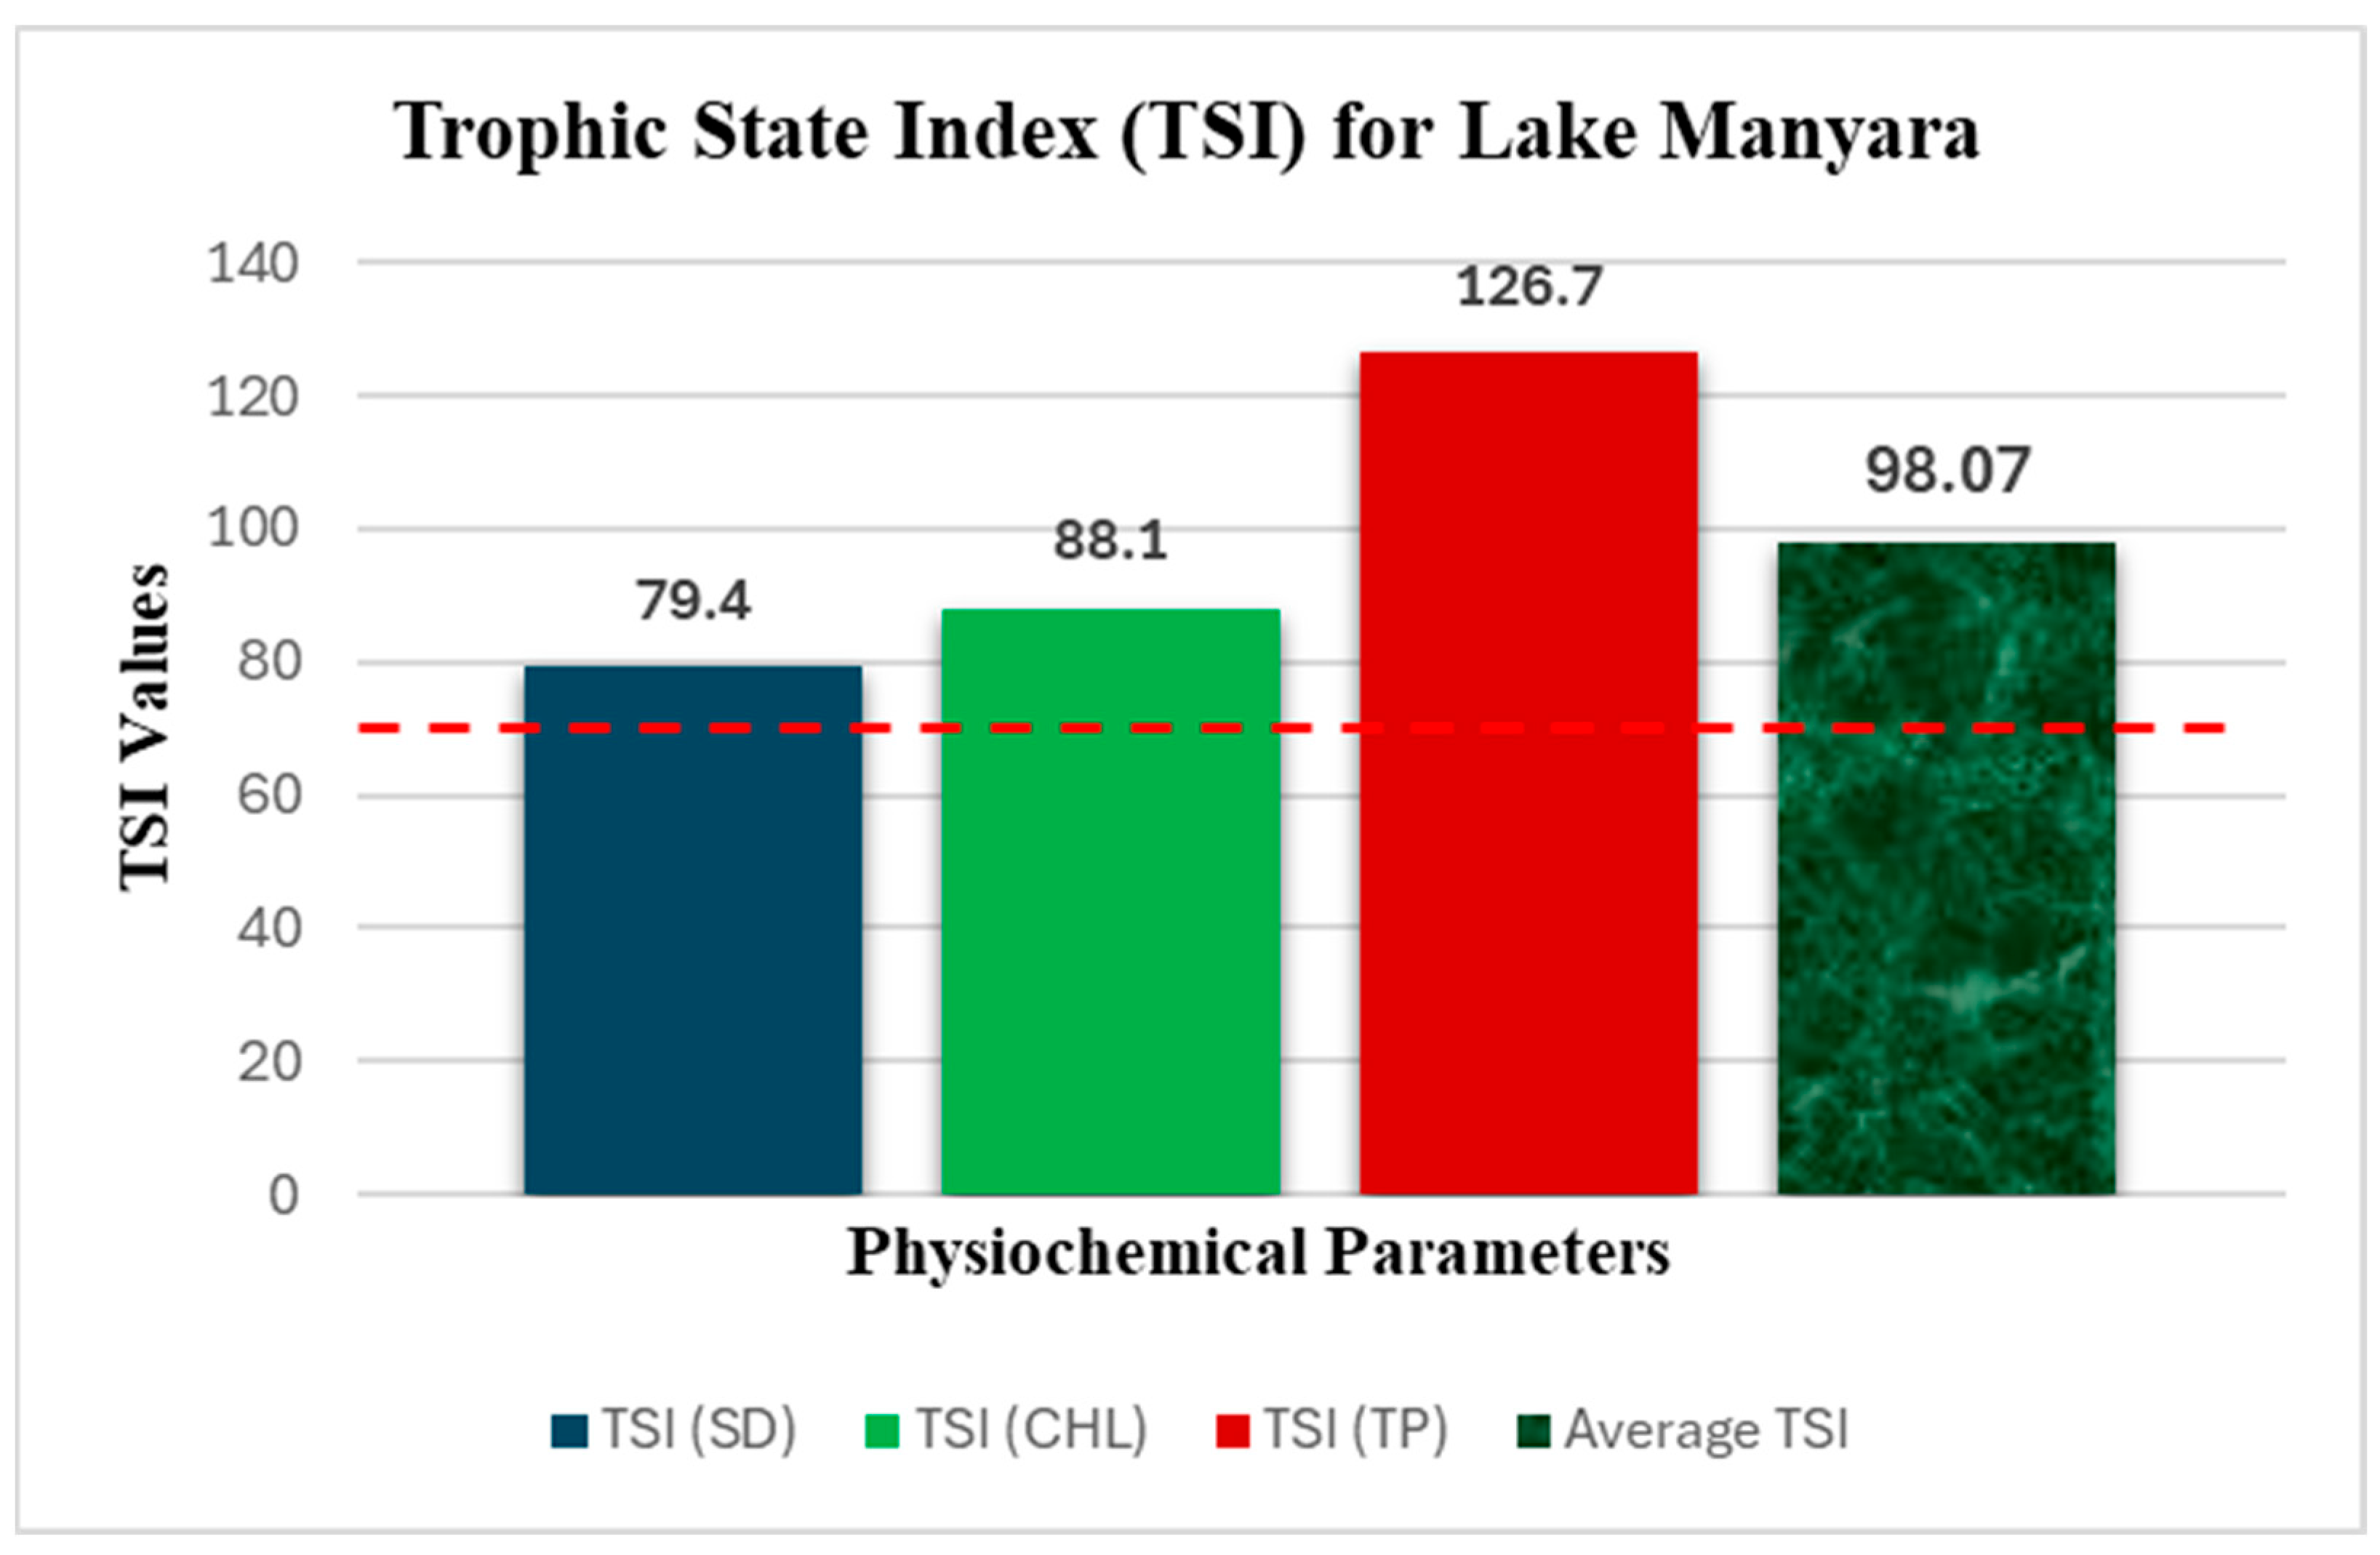
The computed TSI values for Lake Manyara provide clear scientific evidence that the lake is in an extremely high hypereutrophic state. According to Carlson’s classification, a lake tends to be considered hypereutrophic when the TSI values exceed 70, which signifies an environment with excessive nutrient enrichment and highly productive algal growth. All individual indices substantially exceed the hypereutrophic threshold (TSI > 70). Especially, TSI (TP) is significantly higher than TSI (CHL) and TSI (SD), suggesting that phosphorus concentrations are disproportionately elevated relative to the observed algal biomass. Total phosphorus (TP) concentration of 4900 µg/L is beyond the OECD standard of 100 µg/L, which classifies Lake Manyara as hypereutrophic. Chlorophyll-a concentration of 349.8 µg/L is also beyond the standard of 75 µg/L, classifying it as hypereutrophic. Lastly, the transparency of 0.26 m, which is below the OECD standard of 0.7 m, also classifies Lake Manyara as a hypereutrophic lake.
The physicochemical profile of Lake Manyara reflects that the system is under compounded stress from severe nutrient enrichment (TP and NO3), cyanobacterial proliferation (chlorophyll-a and phycocyanin), high alkaline and saline conditions, and extremely low water transparency. These interacting drivers reinforce a feedback loop typical of degraded shallow lakes. Nutrient enrichment promotes algal blooms; blooms reduce transparency and macrophyte coverage; sediment resuspension increases internal loading; and evaporative concentration further elevates ionic and nutrient levels. Such conditions reduce ecological resilience and increase the probability of regime shifts toward persistent cyanobacterial dominance.
In most cases, hypereutrophic conditions disrupt ecological balance by promoting algal blooms, which often results in oxygen depletion during decomposition processes. Lower oxygen levels in the lake threaten aerobic aquatic life and degrade the quality of aquatic habitats. Furthermore, the higher turbidity levels tend to inhibit light penetration, thus hindering the stable growth of submerged macrophytes, which usually provide shelter and spawning grounds for various aquatic species [56]. Figure 2 provides a summary of the calculated Trophic State Index for Lake Manyara.

4.2. Spatio-Temporal Surface Water Dynamics and Catchment Controls

4.2.1. Multi-Temporal NDWI Analysis and Surface Water Contraction

Multi-temporal Normalized Difference Water Index (NDWI) analysis was conducted using Landsat imagery acquired in July 2015 and July 2025 to ensure seasonal consistency under dry-season hydrological conditions [57]. July represents a low-precipitation period in northern Tanzania, thereby minimizing seasonal variability and enabling reliable inter-annual comparison. NDWI values range theoretically between −1 and +1, with higher positive values typically representing open water and increasingly negative values indicating vegetation, bare land, or exposed substrates. However, in shallow, turbid, and saline lakes such as Lake Manyara, water bodies may exhibit slightly negative or near-zero NDWI values due to high suspended sediments, algal biomass, and mineral content influencing spectral reflectance [52].
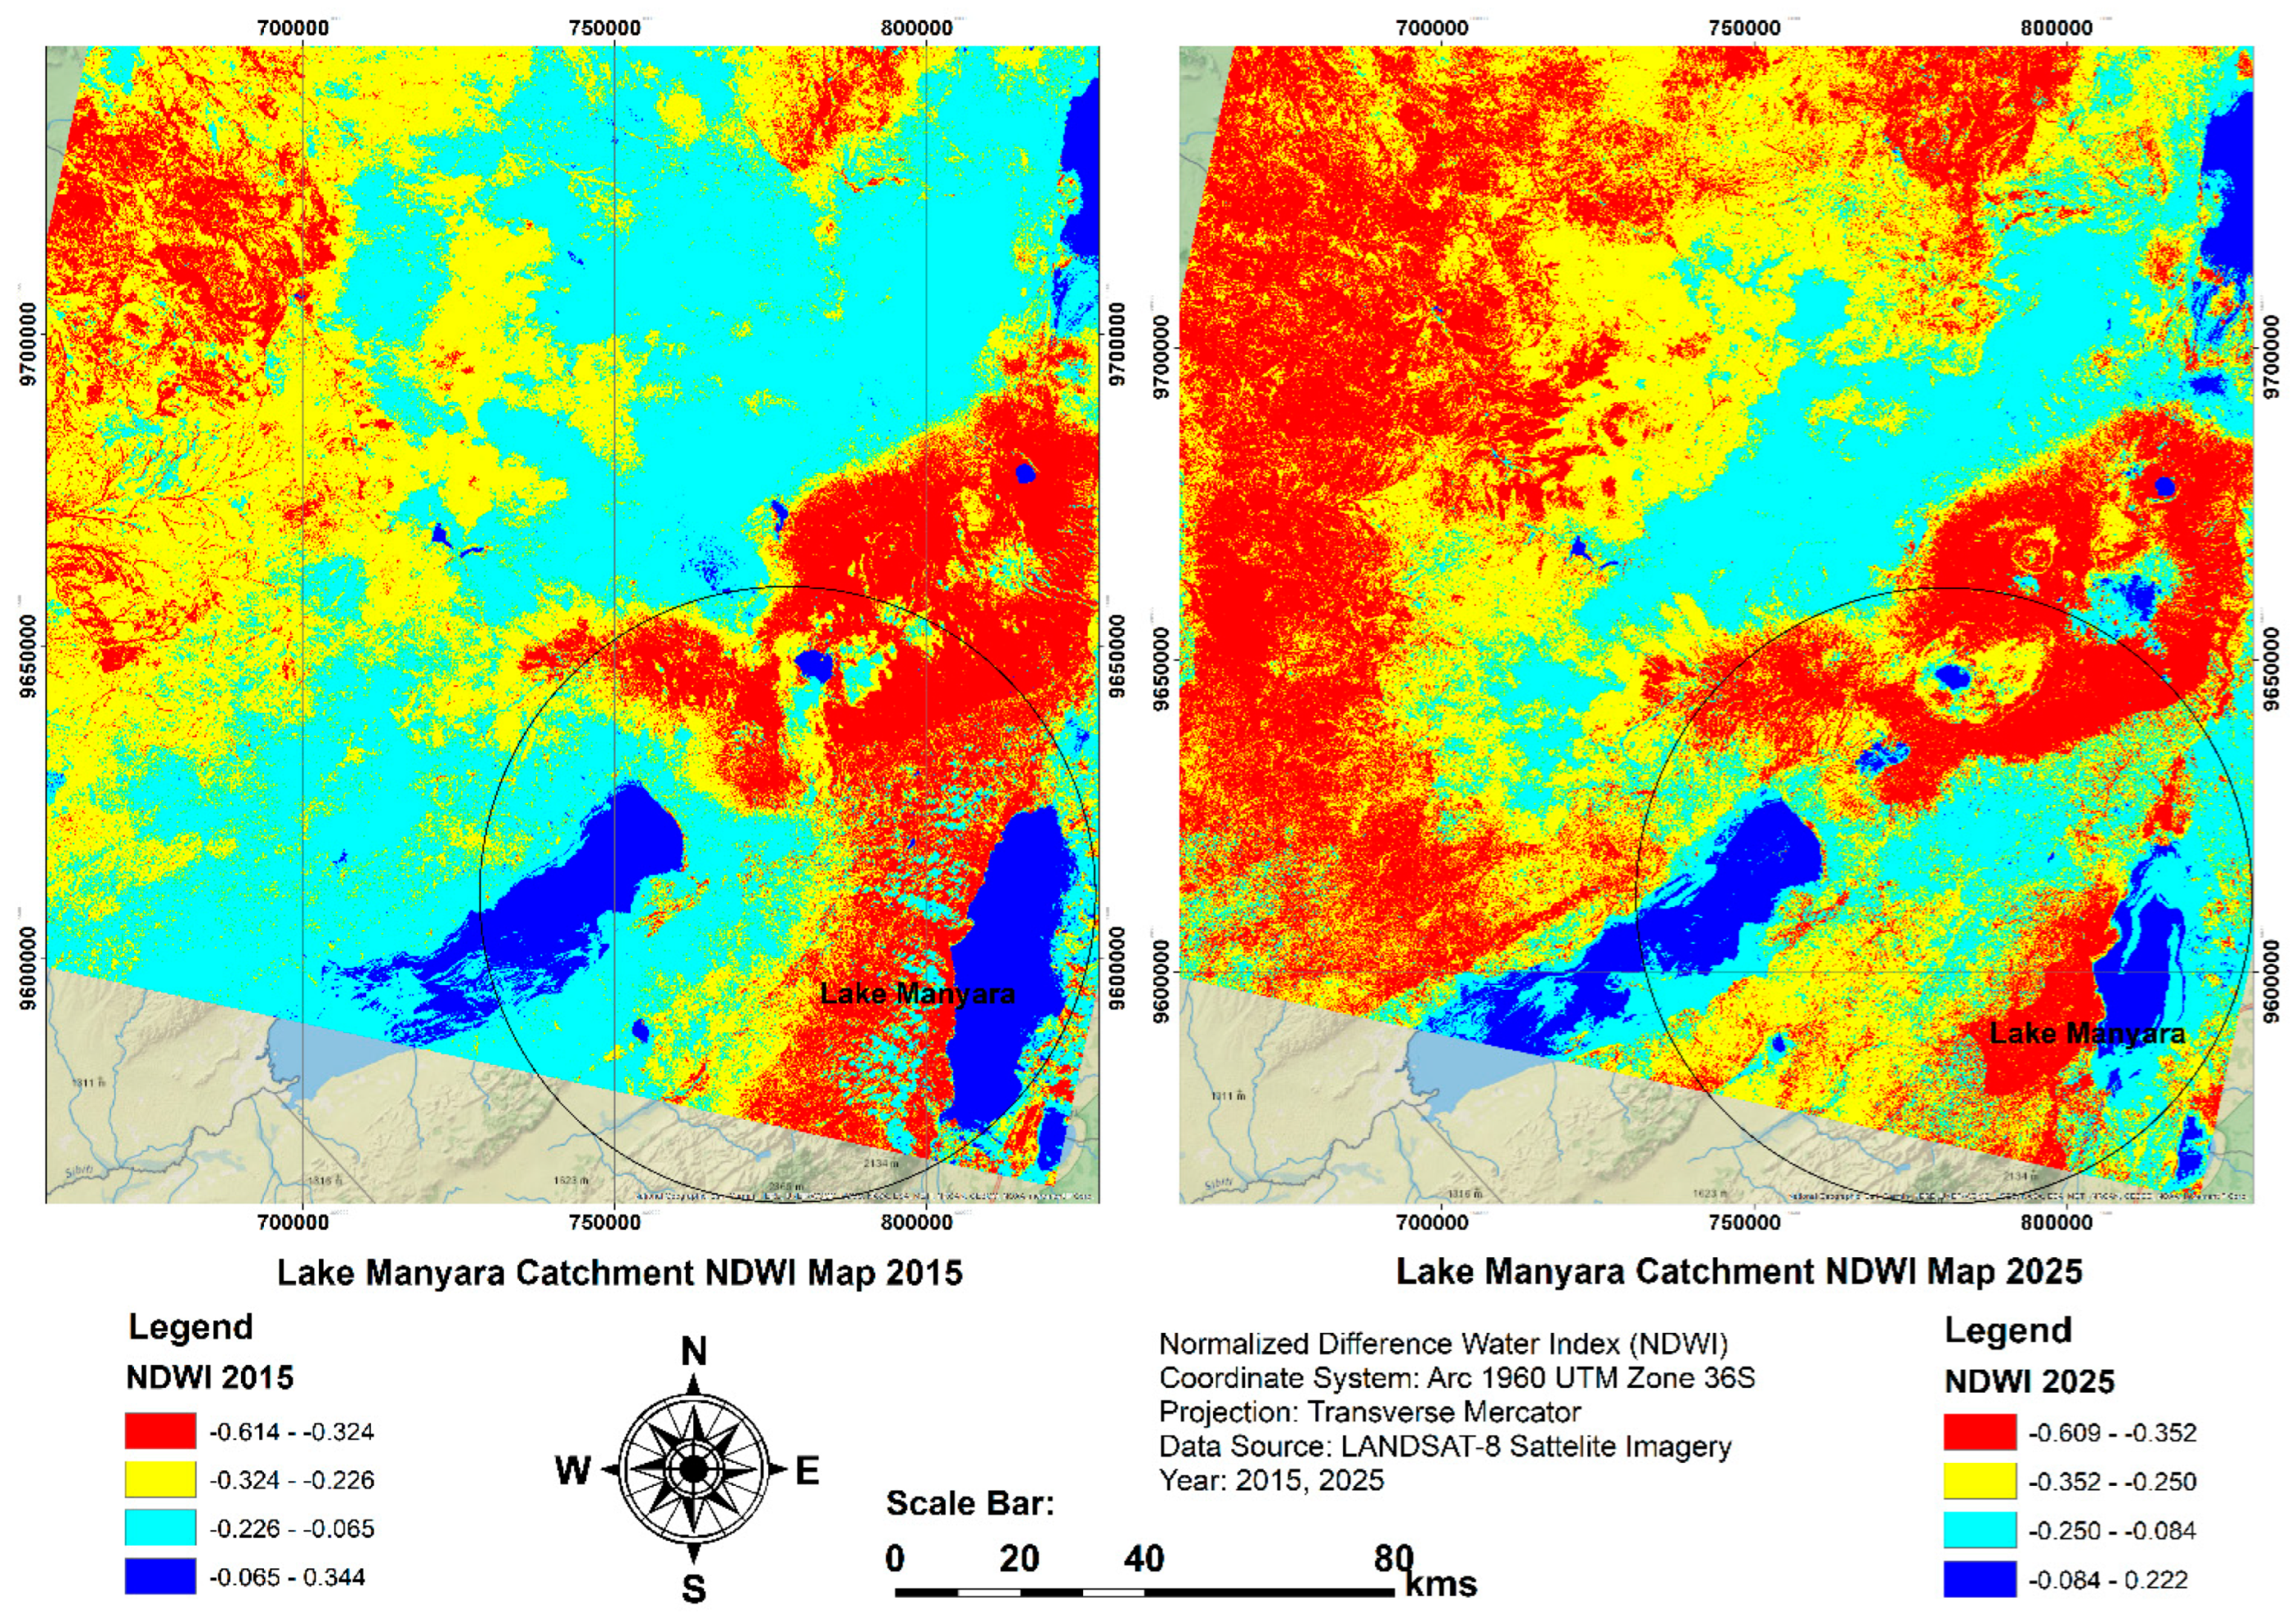
Figure 3 below shows the Normalized Difference Water Index (NDWI) maps of Lake Manyara Catchment between the years 2015 and 2025. The 2015 NDWI map shows values largely concentrated within the higher range of −0.065 to 0.344, particularly across the central and southern portions of the lake. Although not strongly positive throughout, these values are indicative of saturated surfaces and continuous shallow water coverage. Spatial continuity of this NDWI range suggests relatively stable open-water conditions during the 2015 dry season. In contrast, the 2025 NDWI map reveals a pronounced shift toward lower and more negative values. The majority of NDWI values fall between −0.250 and −0.084, with some western zones reaching as low as −0.609. Such strongly negative values are characteristic of exposed lakebed sediments, desiccated saline flats, and substantially reduced surface moisture. This spectral transition reflects not merely a redistribution of pixel intensity but a fundamental hydrological contraction of the lake system.
In order to quantify this change, pixel-based surface water estimation was performed by applying NDWI value ranges identified from the 2015 satellite image, where pixels within the defined spectral interval were classified as water. The same classification criteria were applied to the 2025 dataset in order to quantify changes in the extent of surface water. Based on this classification; estimated dry-season surface water extent in July 2015 was approximately 232.4 km2, and estimated dry-season surface water extent in July 2025 declined to 158.7 km2. This corresponds to a 31.7% difference in dry-season surface water extent over the ten-year period. This comparison represents inter-annual variability between two temporally consistent dry-season observations rather than a continuous long-term trend. It is important to distinguish these NDWI-derived values from the commonly cited maximum areal extent of approximately 440 km2 for Lake Manyara, which represents high-water or peak inundation conditions. The values presented here reflect actual dry-season surface water coverage during the years of satellite imagery acquisition.
The observed contraction is spatially concentrated along shallow peripheral margins, particularly in western and southern sectors, which transitioned from near-zero or slightly positive NDWI values in 2015 to strongly negative values in 2025. A paired comparison of classified pixel counts confirms that this reduction is statistically significant (p < 0.05), indicating that the change exceeds classification uncertainty and represents a genuine hydrological decline.

4.2.2. Spectral Implications of NDWI Shifts

The shift in NDWI distribution between 2015 and 2025 carries important hydrological and ecological implications. In 2015, the concentration of NDWI values from − 0.065 to 0.344 indicates continuous shallow water presence, elevated surface moisture, and optically detectable open water despite turbidity. By contrast, the dominance of NDWI values between − 0.250 and − 0.084 in 2025 suggests a significant reduction in water depth, exposure of saline lakebed sediments, and decreased moisture retention. The occurrence of extreme values as low as − 0.609 in western zones further indicates advanced desiccation and sediment exposure [18,52]. Such negative shifts are consistent with evaporative concentration processes in closed-basin alkaline systems, where declining water levels increase sediment reflectance and reduce spectral water dominance. Importantly, the contraction of moderate NDWI zones (previously −0.065 to 0.344) into lower negative ranges reflects not only areal shrinkage but also degradation of shallow-water stability. These spectral patterns align with the broader physicochemical characteristics reported for the lake, including very low Secchi depth (0.26 m), high chlorophyll-a concentration (349.8 µg/L), as well as elevated conductivity (4128.9 µS/cm). High turbidity and algal biomass reduce optical clarity, thereby influencing the NDWI response even in areas where shallow water persists. Consequently, the NDWI decline in this context reflects both hydrological contraction and water quality deterioration.

4.2.3. Land Use Context and NDWI Spatial Patterns

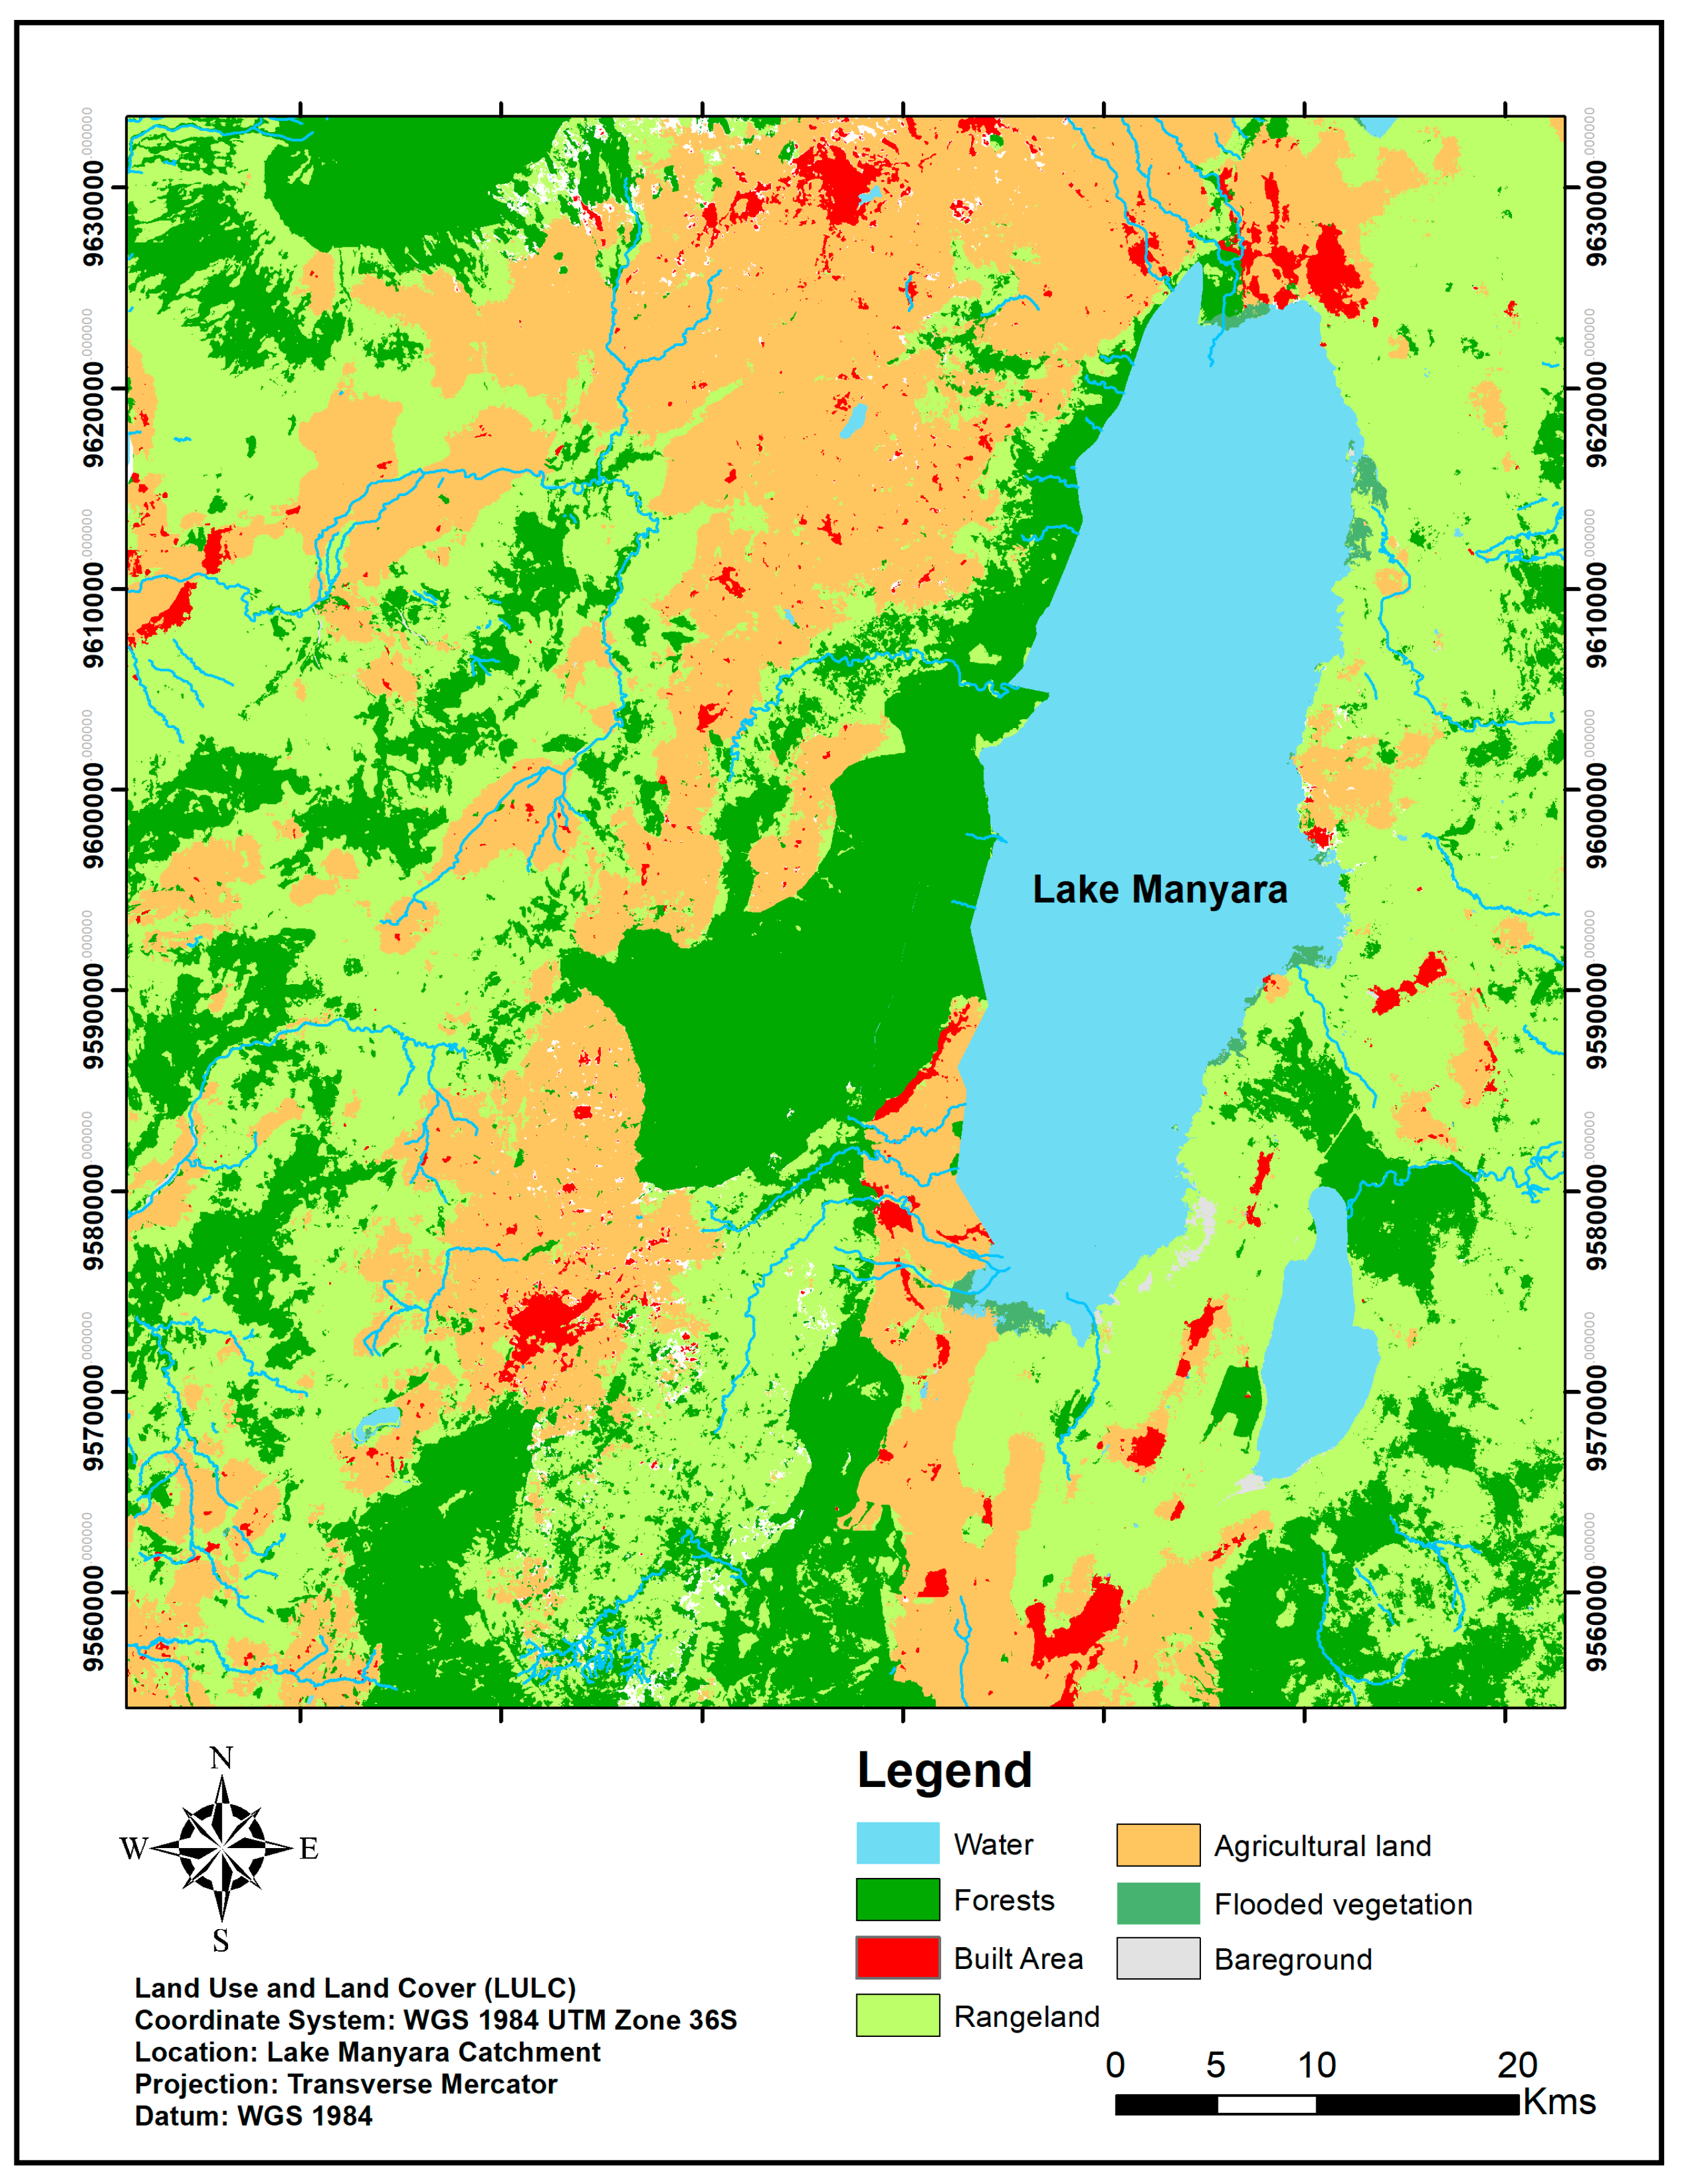
The spatial relationship between NDWI contraction and catchment land use patterns further reinforces this interpretation [58]. Maximum Likelihood Classification of land use/land cover achieved an overall accuracy of 87.4% with a Kappa coefficient of 0.82, indicating strong thematic reliability. Figure 4 below shows the land use and land cover (LULC) distribution within the Lake Manyara Catchment that provides an overview of the spatial distribution of major land cover types within the Lake Manyara Catchment and offers critical insights into how current land surface characteristics influence the environmental conditions observed in the physicochemical and NDWI analyses.
Spatial overlay analysis shows that zones experiencing the strongest negative NDWI shifts correspond to areas adjacent to agricultural land expansion along inflow corridors, bare land surfaces in upper catchment regions, and reduced vegetative buffer zones near lake margins. The combined interpretation of LULC patterns and NDWI results suggests that anthropogenic factors play a central role in exacerbating hydrological decline. Expansion of croplands is associated with increased water abstraction for irrigation, particularly during dry-season conditions, which can reduce surface water availability and contribute to the contraction patterns observed in the NDWI analysis. In addition, agricultural land expansion often involves vegetation clearing and soil disturbance, which reduces infiltration capacity and increases surface runoff. These processes contribute to the lake’s declining transparency and high turbidity levels, as reflected in the measured Secchi disk values. Moreover, the widespread conversion of natural landscapes into agricultural zones increases nutrient loading through fertilizer use, which aligns with elevated phosphorus and nitrate levels recorded in the physicochemical assessments [59,60]. Given the spatial extent of agricultural land identified in the LULC analysis, nutrient inputs from catchment activities represent a plausible driver of the observed eutrophic conditions.
Although LULC was not used for quantitative percentage modeling, pixel-level comparison across sub-catchment units indicates a moderate inverse relationship between agricultural dominance and mean NDWI values (Pearson r ≈ − 0.64, p < 0.05). This inverse relationship reflects the combined influence of water abstraction, sediment influx, and nutrient-driven changes in water optical characteristics in agriculturally dominated zones. Areas characterized by intensified land disturbance tend to exhibit stronger negative NDWI shifts, suggesting reduced hydrological persistence. This relationship suggests that intensified land disturbance may reduce hydrological persistence through increased runoff variability, sediment delivery, and water abstraction for irrigation.

4.2.4. Source-Specific Drivers of Hydrological and Water Quality Decline

The observed hydrological and spectral changes can be attributed to interacting anthropogenic and climatic drivers. Agricultural non-point sources contribute elevated nitrate (21.9 mg/L) and total phosphorus (4.9 mg/L), promoting eutrophication and excessive algal proliferation [47]. Sediment inputs associated with bare land exposure increase turbidity and reduce light penetration, weakening submerged macrophyte stability and altering primary productivity dynamics. Simultaneously, the closed-basin nature of Lake Manyara facilitates evaporative concentration, reflected in elevated conductivity (4128.9 µS/cm), TDS (2111.9 mg/L), salinity (2.2 PSU), and alkaline pH (9.5). The convergence of nutrient enrichment and sediment loading offers a plausible explanation for the observed 31.7% difference in dry-season surface water extent between two comparative years and the marked shift toward strongly negative NDWI values in the year 2025. Together, these findings suggest that surface water contraction in Lake Manyara is not an isolated hydrological phenomenon; instead, it reflects coupled land–water interactions operating within a semi-arid closed-basin system. The integration of NDWI spectral analysis, spatial land use context, and supportive recent physicochemical evidence indicates that hydrological decline and hypereutrophic conditions are interconnected outcomes of catchment-scale environmental stress.
Additionally, the combined analytical approach used in this study is relevant to other semi-arid, closed-basin lake systems around the world. Similar environments in other regions of Sub-Saharan Africa, the Middle East, and Central Asia face comparable challenges due to climate variability, changes in land use, and nutrient loading. Integrating remote sensing-based surface water analysis with land use assessment and physicochemical indicators provides policymakers and environmental experts with a transferable framework for monitoring hydrological and ecological change in regions with limited data. This approach can support more informed water resource management and early detection of environmental degradation in vulnerable lake systems worldwide.

5. Conclusions

This study provides an integrated assessment of hydrological contraction and water quality degradation in Lake Manyara by combining multi-temporal NDWI analysis, supported by LULC classification and trophic state evaluation. The results demonstrate that water scarcity in this semi-arid closed-basin system is driven by interacting hydrological and catchment-scale processes rather than climatic variability alone. NDWI analysis revealed a 31.7% difference in dry-season surface water extent between July 2015 (232.4 km2) and July 2025 (158.7 km2). This shrinkage was accompanied by a pronounced spectral shift toward more negative NDWI values, indicating extensive lakebed exposure and reduced surface moisture persistence. These findings confirm significant hydrological decline beyond normal seasonal fluctuations. Spatial overlay with LULC patterns shows that areas adjacent to agricultural and bare land surfaces correspond to stronger negative NDWI shifts. A moderate inverse correlation (r ≈ −0.64, p < 0.05) between agricultural dominance and NDWI values suggests that land disturbance, runoff variability, and water abstraction contribute to surface water instability. Physicochemical conditions further indicate severe ecosystem stress. A Trophic State Index of 98.07 classifies the lake as hypereutrophic, characterized by extremely high total phosphorus, nitrate, and chlorophyll-a concentrations. Elevated conductivity, TDS, salinity, and alkaline pH reflect an evaporative concentration process typical for stressed closed-basin systems. Collectively, the integration of remote sensing, geospatial analysis, together with supportive recent in situ indicators, demonstrates that hydrological contraction, eutrophication, and catchment land transformation are interconnected drivers of water scarcity in Lake Manyara, highlighting the urgent need for catchment-scale management interventions.

Author Contributions

Conceptualization, A.I. and R.S.; methodology, A.I.; software, A.I.; validation, R.S.; formal analysis, A.I.; investigation, A.I. and R.S.; resources, A.I. and R.S.; data curation, A.I.; writing—original draft preparation, A.I.; writing—review and editing, A.I. and R.S.; visualization, A.I.; supervision, R.S.; project administration, R.S.; funding acquisition, R.S. All authors have read and agreed to the published version of the manuscript.

Funding

The publication was financed by the Faculty of Environmental and Mechanical Engineering of Poznań University of Life Sciences (research topic 506.868.06.00/UPP).

Data Availability Statement

The data presented in this study are available in Aquatic Ecology journal at DOI: https://doi.org/10.1007/s10452-023-10083-1. These data were derived from the following resource available in the public domain: https://link.springer.com/article/10.1007/s10452-023-10083-1 (accessed on 1 March 2026).

Acknowledgments

The Landsat-8 satellite imagery was processed to derive the Normalized Difference Water Index (NDWI).

Conflicts of Interest

The authors declare no conflicts of interest.

Abbreviations

The following abbreviations are used in this manuscript:
DODissolved Oxygen
LMCLake Manyara Catchment
LULCLand Use and Land Cover
NDWINormalized Difference Water Index
pHpondus hydrogenii, pH reaction (acidity/alkalinity measure)
TPTotal Phosphorus
TSITrophic State Index

References

  1. Ahmed, R.S.; Abuarab, M.E.; Ibrahim, M.M.; Baioumy, M.; Mokhtar, A. Assessment of Environmental and Toxicity Impacts and Potential Health Hazards of Heavy Metals Pollution of Agricultural Drainage Adjacent to Industrial Zones in Egypt. Chemosphere 2023, 318, 137872. [Google Scholar] [CrossRef]
  2. Gallardo, B.; Clavero, M.; Sánchez, M.I.; Vilà, M. Global Ecological Impacts of Invasive Species in Aquatic Ecosystems. Glob. Change Biol. 2016, 22, 151–163. [Google Scholar] [CrossRef]
  3. Gutiérrez, V.-A.; Nicolás-Ruiz, N.; Sánchez-Montoya, M.D.M.; Suárez Alonso, M.L. Ecosystem Services Provided by Dry River Socio-Ecological Systems and Their Drivers of Change. Hydrobiologia 2023, 850, 2585–2607. [Google Scholar] [CrossRef]
  4. Jones, E.R.; Bierkens, M.F.P.; van Vliet, M.T.H. Current and Future Global Water Scarcity Intensifies When Accounting for Surface Water Quality. Nat. Clim. Change 2024, 14, 629–635. [Google Scholar] [CrossRef]
  5. Seeteram, N.A.; Hyera, P.T.; Kaaya, L.T.; Lalika, M.C.S.; Anderson, E.P. Conserving Rivers and Their Biodiversity in Tanzania. Water 2019, 11, 2612. [Google Scholar] [CrossRef]
  6. Burns, E.E.; Carter, L.J.; Kolpin, D.W.; Thomas-Oates, J.; Boxall, A.B.A. Temporal and Spatial Variation in Pharmaceutical Concentrations in an Urban River System. Water Res. 2018, 137, 72–85. [Google Scholar] [CrossRef] [PubMed]
  7. Damkjaer, S.; Taylor, R. The Measurement of Water Scarcity: Defining a Meaningful Indicator. Ambio 2017, 46, 513–531. [Google Scholar] [CrossRef]
  8. Datry, T.; Bonada, N.; Heino, J. Towards Understanding the Organisation of Metacommunities in Highly Dynamic Ecological Systems. Oikos 2016, 125, 149–159. [Google Scholar] [CrossRef]
  9. UN-Water. Progress on the Level of Water Stress; Mid-Term Status of SDG Indicator 6.4.2 and Acceleration Needs, with Special Focus on Food Security; FAO: Rome, Italy, 2024. [Google Scholar]
  10. Gebreeyesus, M.; Gwenzi, W.; Mwamila, T.B.; Noubactep, C. Mitigating Freshwater Supply Shortages in Regions of High Demand in Ethiopia: Integrated Water Resources Management Approach. Environ. Earth Sci. 2025, 84, 99. [Google Scholar] [CrossRef]
  11. Helfrich, L.A.; Neves, R.J.; Chapman, H. Sustaining America’s Aquatic Biodiversity: Freshwater Mussel Biodiversity and Conservation; Virginia Cooperative Extension: Blacksburg, VA, USA, 2019.
  12. Lombe, P.; Carvalho, E.; Rosa-Santos, P. Drought Dynamics in Sub-Saharan Africa: Impacts and Adaptation Strategies. Sustainability 2024, 16, 9902. [Google Scholar] [CrossRef]
  13. Nalumenya, B.; Rubinato, M.; Kennedy, M.; Catterson, J.; Bakamwesiga, H.; Blackett, M. Water Management Education in the East African Region: A Review of the Challenges to Be Addressed. Sustainability 2023, 15, 11597. [Google Scholar] [CrossRef]
  14. Vörösmarty, C.J.; McIntyre, P.B.; Gessner, M.O.; Dudgeon, D.; Prusevich, A.; Green, P.; Glidden, S.; Bunn, S.E.; Sullivan, C.A.; Liermann, C.R.; et al. Global Threats to Human Water Security and River Biodiversity. Nature 2010, 467, 555–561. [Google Scholar] [CrossRef]
  15. Chen, T.; Wang, Y.; Gardner, C.; Wu, F. Threats and Protection Policies of the Aquatic Biodiversity in the Yangtze River. J. Nat. Conserv. 2020, 58, 125931. [Google Scholar] [CrossRef]
  16. Dudgeon, D. Prospects for Sustaining Freshwater Biodiversity in the 21st Century: Linking Ecosystem Structure and Function. Curr. Opin. Environ. Sustain. 2010, 2, 422–430. [Google Scholar] [CrossRef]
  17. Kenter, J.O.; Hyde, T.; Christie, M.; Fazey, I. The Importance of Deliberation in Valuing Ecosystem Services in Developing Countries—Evidence from the Solomon Islands. Glob. Environ. Change 2011, 21, 505–521. [Google Scholar] [CrossRef]
  18. Storey, R.G.; Quinn, J.M. Survival of Aquatic Invertebrates in Dry Bed Sediments of Intermittent Streams: Temperature Tolerances and Implications for Riparian Management. Freshw. Sci. 2013, 32, 250–266. [Google Scholar] [CrossRef]
  19. Edegbene, A.O.; El Yaagoubi, S.; Mohammed, Y.M.; Harrak, R.; Edegbene Ovie, T.T.; Azmizem, A.; Errochdi, S.; Olatunji, O.E.; Keke, U.N.; Sankoh, A.A.; et al. Advancing Trait-Based Biomonitoring Approach for Freshwater Ecosystems Assessment in Africa: Current Status, Challenges, and Future Directions. Front. Environ. Sci. 2025, 13, 1652525. [Google Scholar] [CrossRef]
  20. Huang, Z.; Yuan, X.; Liu, X. The Key Drivers for the Changes in Global Water Scarcity: Water Withdrawal versus Water Availability. J. Hydrol. 2021, 601, 126658. [Google Scholar] [CrossRef]
  21. Libala, N.; Griffin, N.; Nyingwa, A.; Dini, J. Freshwater Ecosystems and Interactions with the SDG 2030 Agenda: Implications for SDG Implementation in South Africa. Afr. J. Aquat. Sci. 2022, 47, 353–368. [Google Scholar] [CrossRef]
  22. Liu, J.; Li, D.; Chen, H.; Wang, H.; Wada, Y.; Kummu, M.; Gosling, S.N.; Yang, H.; Pokhrel, Y.; Ciais, P. Timing the First Emergence and Disappearance of Global Water Scarcity. Nat. Commun. 2024, 15, 7129. [Google Scholar] [CrossRef]
  23. Shemer, H.; Wald, S.; Semiat, R. Challenges and Solutions for Global Water Scarcity. Membranes 2023, 13, 612. [Google Scholar] [CrossRef]
  24. Gerbens-Leenes, P.W.; Vaca-Jiménez, S.; Holmatov, B.; Vanham, D. Spatially Distributed Freshwater Demand for Electricity in Africa. Environ. Sci. Water Res. Technol. 2024, 10, 1795–1808. [Google Scholar] [CrossRef]
  25. Deus, D.; Gloaguen, R.; Krause, P. Water Balance Modeling in a Semi-Arid Environment with Limited in Situ Data Using Remote Sensing in Lake Manyara, East African Rift, Tanzania. Remote Sens. 2013, 5, 1651–1680. [Google Scholar] [CrossRef]
  26. Hagenlocher, M.; Meza, I.; Anderson, C.C.; Min, A.; Renaud, F.G.; Walz, Y.; Siebert, S.; Sebesvari, Z. Drought Vulnerability and Risk Assessments: State of the Art, Persistent Gaps, and Research Agenda. Environ. Res. Lett. 2019, 14, 083002. [Google Scholar] [CrossRef]
  27. Kummu, M.; Guillaume, J.H.A.; De Moel, H.; Eisner, S.; Flörke, M.; Porkka, M.; Siebert, S.; Veldkamp, T.I.E.; Ward, P.J. The World’s Road to Water Scarcity: Shortage and Stress in the 20th Century and Pathways towards Sustainability. Sci. Rep. 2016, 6, 38495. [Google Scholar] [CrossRef]
  28. USAID. Tanzania_Global Waters Strategy Country Plan 2023-High-Priority Country Plan; USAID: Dar es Salaam, Tanzania, 2022; p. 7.
  29. Darwall, W.R.T.; Lowe, T.; Smith, K.G.; Vié, J.-C. The Status and Distribution of Freshwater Biodiversity in Eastern Africa; IUCN: Gland, Switzerland, 2005; ISBN 978-2-8317-0863-8. [Google Scholar]
  30. Leal Filho, W.; Totin, E.; Franke, J.A.; Andrew, S.M.; Abubakar, I.R.; Azadi, H.; Nunn, P.D.; Ouweneel, B.; Williams, P.A.; Simpson, N.P. Understanding Responses to Climate-Related Water Scarcity in Africa. Sci. Total Environ. 2022, 806, 150420. [Google Scholar] [CrossRef] [PubMed]
  31. Almeida, P.R.; Mateus, C.S.; Alexandre, C.M.; Pedro, S.; Boavida-Portugal, J.; Belo, A.F.; Pereira, E.; Silva, S.; Oliveira, I.; Quintella, B.R. The Decline of the Ecosystem Services Generated by Anadromous Fish in the Iberian Peninsula. Hydrobiologia 2023, 850, 2927–2961. [Google Scholar] [CrossRef]
  32. Van Mens, L.M. Unravelling the Hydrological Dynamics of Lake Manyara in Tanzania. Master’s Thesis, Utrecht University, Utrecht, The Netherlands, 2016. [Google Scholar]
  33. Nonga, H.; Mdegela, R.; Lie, E.; Sandvik, M.; Skaare, J. Socio-Economic Values of Wetland Resources around Lake Manyara, Tanzania: Assessment of Environmental Threats and Local Community Awareness on Environmental Degradation and Their Effects. J. Wetl. Ecol. 2010, 4, 83–101. [Google Scholar] [CrossRef]
  34. Taylor, R. Rethinking Water Scarcity: The Role of Storage. Eos Trans. Am. Geophys. Union 2009, 90, 237–238. [Google Scholar] [CrossRef]
  35. Arenas-Sánchez, A.; Rico, A.; Vighi, M. Effects of Water Scarcity and Chemical Pollution in Aquatic Ecosystems: State of the Art. Sci. Total Environ. 2016, 572, 390–403. [Google Scholar] [CrossRef]
  36. Gatti, C. Freshwater Biodiversity: A Review of Local and Global Threats. Int. J. Environ. Stud. 2016, 73, 887–904. [Google Scholar] [CrossRef]
  37. Matchawe, C.; Bonny, P.; Yandang, G.; Mafo, H.C.Y.; Nsawir, B.J.; Matchawe, C.; Bonny, P.; Yandang, G.; Mafo, H.C.Y.; Nsawir, B.J. Water Shortages: Cause of Water Safety in Sub-Saharan Africa. In Drought—Impacts and Management; IntechOpen: London, UK, 2022; ISBN 978-1-80355-544-7. [Google Scholar]
  38. Ormerod, S.J.; Dobson, M.; Hildrew, A.G.; Townsend, C.R. Multiple Stressors in Freshwater Ecosystems. Freshw. Biol. 2010, 55, 1–4. [Google Scholar] [CrossRef]
  39. Özelkan, E. Water Body Detection Analysis Using NDWI Indices Derived from Landsat-8 OLI. Pol. J. Environ. Stud. 2020, 29, 1759–1769. [Google Scholar] [CrossRef]
  40. Adewoyin, M.A.; Okoh, A.I. Seasonal Shift in Physicochemical Factors Revealed the Ecological Variables That Modulate the Density of Acinetobacter Species in Freshwater Resources. Int. J. Environ. Res. Public Health 2020, 17, 3606. [Google Scholar] [CrossRef]
  41. Malik, D.S.; Rathi, P. The Influence of Physico-Chemical Parameters on Habitat Ecology and Assemblage Structure of Freshwater Phytoplankton in Tehri Reservoir Garhwal (Uttarakhand) India. Proc. Natl. Acad. Sci. India Sect. B Biol. Sci. 2022, 92, 541–551. [Google Scholar] [CrossRef]
  42. Saturday, A.; Lyimo, T.J.; Machiwa, J.; Pamba, S. Spatio-Temporal Variations in Physicochemical Water Quality Parameters of Lake Bunyonyi, Southwestern Uganda. SN Appl. Sci. 2021, 3, 684. [Google Scholar] [CrossRef]
  43. Nyembo, L.O.; Larbi, I.; Mwabumba, M.; Selemani, J.R.; Dotse, S.-Q.; Limantol, A.M.; Bessah, E. Impact of Climate Change on Groundwater Recharge in the Lake Manyara Catchment, Tanzania. Sci. Afr. 2022, 15, e01072. [Google Scholar] [CrossRef]
  44. Compen, V.L.P. The Shrinkage of Lake Manyara: Causes and Management Options for Lake Protection. Master’s Thesis, Utrecht University, Utrecht, The Netherlands, 2021. [Google Scholar]
  45. Kihwele, E.; Lugomela, C.; Howell, K.; Emmanue Nonga, H. Spatial and Temporal Variations in the Abundance and Diversity of Phytoplankton in Lake Manyara, Tanzania. Int. J. Innov. Stud. Aquat. Biol. Fish. 2015, 1, 1–14. [Google Scholar]
  46. Wynants, M.; Solomon, H.; Ndakidemi, P.; Blake, W.H. Pinpointing Areas of Increased Soil Erosion Risk Following Land Cover Change in the Lake Manyara Catchment, Tanzania. Int. J. Appl. Earth Obs. Geoinf. 2018, 71, 1–8. [Google Scholar] [CrossRef]
  47. Mataba, G.R.; Ojija, F.; Munishi, L. Impact of Anthropogenic Pollution and Artisanal Fishing on the Population of Tilapia spp. Oreochromis niloticus and Oreochromis amphimelas in Lake Manyara, Northern Tanzania. Aquat. Ecol. 2024, 58, 451–465. [Google Scholar] [CrossRef]
  48. Carlson, R.E. A Trophic State Index for Lakes1. Limnol. Oceanogr. 1977, 22, 361–369. [Google Scholar] [CrossRef]
  49. OECD. Eutrophication of Waters: Monitoring, Assessment and Control; OECD Publ. 42077; Organisation for Economic Co-Operation and Development: Paris, France, 1982; p. 154. [Google Scholar]
  50. McFeeters, S.K. The Use of the Normalized Difference Water Index (NDWI) in the Delineation of Open Water Features. Int. J. Remote Sens. 1996, 17, 1425–1432. [Google Scholar] [CrossRef]
  51. Fleischmann, A.; Siqueira, V.; Paris, A.; Collischonn, W.; Paiva, R.; Pontes, P.; Crétaux, J.-F.; Bergé-Nguyen, M.; Biancamaria, S.; Gosset, M.; et al. Modelling Hydrologic and Hydrodynamic Processes in Basins with Large Semi-Arid Wetlands. J. Hydrol. 2018, 561, 943–959. [Google Scholar] [CrossRef]
  52. Luo, W.; Pan, Y.; Lu, J.; Zhao, J. Analysis of Sediment Resuspension in Shallow Lake under Variable Wind Speed and Water Depth. Int. J. Sediment Res. 2026, 41, 36–44. [Google Scholar] [CrossRef]
  53. Loverde-Oliveira, S.M.; Huszar, V.L.M.; Mazzeo, N.; Scheffer, M. Hydrology-Driven Regime Shifts in a Shallow Tropical Lake. Ecosystems 2009, 12, 807–819. [Google Scholar] [CrossRef]
  54. Simiyu, B.M.; Amukhuma, H.S.; Sitoki, L.; Okello, W.; Kurmayer, R. Interannual Variability of Water Quality Conditions in the Nyanza Gulf of Lake Victoria, Kenya. J. Gt. Lakes Res. 2022, 48, 97–109. [Google Scholar] [CrossRef]
  55. Amorim, C.A.; Moura, A.D.N. Ecological Impacts of Freshwater Algal Blooms on Water Quality, Plankton Biodiversity, Structure, and Ecosystem Functioning. Sci. Total Environ. 2021, 758, 143605. [Google Scholar] [CrossRef]
  56. Yang, W.; Liu, X.; Hu, W.; Xin, Y.; Hu, W.; Yang, W.; Liu, S. Role of Submerged Macrophytes in Restoring Eutrophic Lakes. Int. J. Environ. Agric. Biotechnol. 2025, 10, 638370. [Google Scholar] [CrossRef]
  57. Li, M.; Liu, C.; Zhang, F.; Chan, N.W.; Adam, E.; Wang, W.; Wu, Y. Exploring the Causes of Severe Fluctuations in Water Surface Area Using Water Index and Structural Equation Modeling: Evidence from Ebinur Lake, China. Remote Sens. 2025, 17, 1431. [Google Scholar] [CrossRef]
  58. Ferdos, J.; Rahman, M.A.; Rahman, M.W.; Nasif, S.O.; Sayeed, K.M.A.; Jazib, A. Spatiotemporal Analysis of LULC and NDWI Changes in the Northeastern Haor Areas of Bangladesh (1990–2023) Using Geospatial Techniques. Earth Syst. Environ. 2026, 1–17. [Google Scholar] [CrossRef]
  59. Alavaisha, E.; Lyon, S.; Lindborg, R. Assessment of Water Quality Across Irrigation Schemes: A Case Study of Wetland Agriculture Impacts in Kilombero Valley, Tanzania. Water 2019, 11, 671. [Google Scholar] [CrossRef]
  60. Ullah, K.; Jiang, J.; Wang, P. Land Use Impacts on Surface Water Quality by Statistical Approaches. Glob. J. Environ. Sci. Manag. 2018, 4, 231–250. [Google Scholar] [CrossRef]
Figure 1. Geographical setting of the case study area (Lake Manyara Catchment).
Water 18 00855 g001
Figure 2. Trophic State Index for Lake Manyara. Red dashed line shows the TSI threshold (TSI > 70) used to classify lakes as hypereutrophic.
Water 18 00855 g002
Figure 3. Multi-temporal NDWI maps of Lake Manyara Catchment (July 2015 and July 2025) showing spectral shift toward lower and more negative values.
Water 18 00855 g003
Figure 4. Land use and land cover map of the Lake Manyara Catchment. Rangeland dominates the catchment, while agricultural land is primarily concentrated near the lake margins and along river corridors, reflecting areas of intensified human activity (July 2025).
Water 18 00855 g004
Table 1. Physicochemical variables measured in Lake Manyara.
VariableMean ± SEMaximumMinimum
Lake depth (m)2.37 ± 0.234.620.67
Secchi depth (m)0.26 ± 0.011.50.16
pH (-)9.5 ± 0.19.98.1
Salinity (PSU)2.2 ± 0.032.42.1
TDS (mg/L)2111.9 ± 25.122911908
Conductivity (µS/cm)4128.9 ± 99.345862403
Total phosphorus (mg P/L)4.9 ± 0.26.41.5
NO3 (mg/L)21.9 ± 3.976.57.6
NH3 (mg/L)0.1 ± 0.020.40.02
Chlorophyll-a (µg/L)349.8 ± 13.1565.4294.8
Phycocyanin (µg/L)9.5 ± 0.210.78.2
Table 2. Interpretation of Trophic State Index (TSI) values.
TSI RangeTrophic StateCharacteristics
0–40OligotrophicLow productivity, clear water, limited algae, high transparency
41–50MesotrophicModerate productivity, balanced algae growth, clear water stage
51–70EutrophicHigh productivity, algal blooms, reduced transparency, oxygen stress
>70HypereutrophicExtreme algae growth, low transparency, high turbidity, hypoxic conditions
Disclaimer/Publisher’s Note: The statements, opinions and data contained in all publications are solely those of the individual author(s) and contributor(s) and not of MDPI and/or the editor(s). MDPI and/or the editor(s) disclaim responsibility for any injury to people or property resulting from any ideas, methods, instructions or products referred to in the content.