


Abstract
Seasonal tropical wetlands such as the Brazilian Pantanal are increasingly threatened by climate variability and extreme hydrological events, creating a need for robust monitoring tools that capture flood dynamics at high spatial and temporal resolution. This study used Sentinel-1 Synthetic Aperture Radar (SAR) imagery to map and monitor flooding in the northern Pantanal, a Ramsar site renowned for its wildlife, between 2017 and 2020. Ground Range Detected (GRD) VV-polarized scenes were preprocessed using radiometric terrain normalization and speckle filtering (Lee filter, 5 × 5 window) to improve the separability of water and non-water surfaces. Flooded areas were initially extracted with Otsu’s histogram thresholding and validated using high-resolution optical imagery (PlanetScope and Landsat-8). A supervised Random Forest classifier then refined land-cover discrimination into three classes (open water/flood, open land/vegetation, and others), achieving an overall accuracy of 97.70% on the independent testing dataset (n = 6622), while temporal consistency was supported by Cuiabá River hydrological data. The results revealed strong interannual variability in flood extent, with inundation covering 34.7% of the reserve in March 2017 compared with 0.75% in March 2020 and reaching a peak of 79.9% in April 2017. Overall, Sentinel-1 SAR effectively delineated open water and flood-affected surfaces under persistent cloud cover, demonstrating its value for complementing existing products such as MapBiomas, strengthening wetland management, and supporting scalable flood monitoring in other tropical flood-prone Ramsar sites.
1. Introduction
Wetlands are among the planet’s most important natural ecosystems because of their biodiversity integrity, their role within ecological processes, and their numerous benefits to human societies [1,2]. They demonstrate essential hydrological and biogeochemical functions; thus, these environments contribute to water storage, moderation of river and stream flows, groundwater replenishment, sediment trapping, water purification, microclimate regulation, and carbon storage [3,4]. Additionally, wetlands provide other ecosystem services like medicinal plants, fishery resources, agricultural products, drinking water for people and livestock, grazing areas, recreational opportunities, and benefits of ecotourism [5,6]. Furthermore, wetlands help maintain the cultural heritage and livelihoods of many traditional communities while making a major contribution to biodiversity conservation [4,7].
In extensive floodplain wetlands, the duration and magnitude of flood are the essential ecological driver that influences inundation patterns, vegetation dynamics, biodiversity conservation, and ecosystem functioning [1,8]. Hydrology strongly controls the structure and processes of these environments, and knowledge of inundation dynamics is essential for their conservation, restoration, and sustainable use [1,8,9]. Moreover, monitoring such systems solely through field observations is often difficult because of their vast size, seasonal inaccessibility, and high operational costs. For this reason, remote sensing has become a fundamental approach for examining flood dynamics across large wetland landscapes. Optical satellite imagery has been widely applied to map open water and seasonal inundation because it offers wide spatial coverage and valuable spectral information [10,11,12]. However, its usefulness is often reduced by cloud cover, atmospheric effects, and limited ability to detect flooded areas beneath dense vegetation, particularly during the rainy season when flooding is at its peak [13].
Remote sensing has been generally used to study both the hydrology and ecology of large floodplain wetlands [14]. These environments pose several challenges for surface water detection due to canopy cover, dense vegetation, and floating plants that may completely hide the water surface, in addition to water depth and seasonal vegetation changes [15]. Surface water turbidity is also highly variable in floodplains, ranging from sediment-laden waters to phytoplankton-rich conditions, relatively clear waters, depending on river connectivity, water sources, sediment deposition and resuspension, and flushing processes [15].
Hence, different remote sensing techniques provide distinct and complementary strengths. Microwave sensing is better suited for identifying water beneath vegetation cover, while radar altimetry can estimate water-surface elevation [16]. Optical data, among others, provides strong temporal availability and can capture spectral differences related to vegetation types, water properties, and open water surfaces at comparatively fine spatial detail. Furthermore, optical imagery and the associated processing methods are generally more accessible than microwave-based approaches [14,17,18].
Studies have reported results using SAR for flood mapping and monitoring, demonstrating its capacity to identify flooded extent and spatio-temporal inundation patterns [19,20,21]. SAR imagery operates independently of solar energy and is unaffected by cloud cover; therefore, it provides permanent access to flooded environments under a wide range of atmospheric conditions for flood dynamics monitoring and large-scale wetland management support [19,20,22].
However, the effectiveness of SAR-based flood monitoring depends on several methodological and environmental factors, including image quality, preprocessing accuracy, correction of speckle and geometric distortions, interpretation of radar backscatter, and integration with complementary hydrological information [23,24,25]. In large tropical floodplains, additional challenges remain, particularly where inundation patterns vary across open water, flooded vegetation, and mixed land–water surfaces.
Thus, these challenges are especially relevant in the Pantanal, where the spatial and temporal dynamics of flooding cannot be monitored only with field-based observations and optical remote sensing has several limitations [15].
This study evaluates the capacity of Sentinel-1 SAR data, specifically Ground Range Detected (GRD) intensity products, for mapping and monitoring flooding in the Pantanal, addresses the extent to which Sentinel-1 imagery can identify and monitor the spatial and temporal patterns of flooding in the Pantanal wetland, and investigates how these flood patterns relate to hydrological dynamics and rainfall variability over time. Focusing on SAR methods, this study aims to improve the characterization of flood variability during inundation periods and to strengthen the monitoring of large tropical wetlands.
Furthermore, this research extends our previous study [15], which advanced floodplain monitoring through optical remote sensing, water indices, supervised classification, and topographic information. However, that earlier approach remained constrained by the dependence on cloud-free imagery and by difficulties in distinguishing inundated areas from vegetated, mixed surfaces in complex tropical floodplains. We address these remaining limitations by applying Sentinel-1 SAR to improve flood detection under cloudy conditions and to provide a more robust basis for wetland monitoring and adaptive management.
2. Materials and Methods
2.1. Study Area
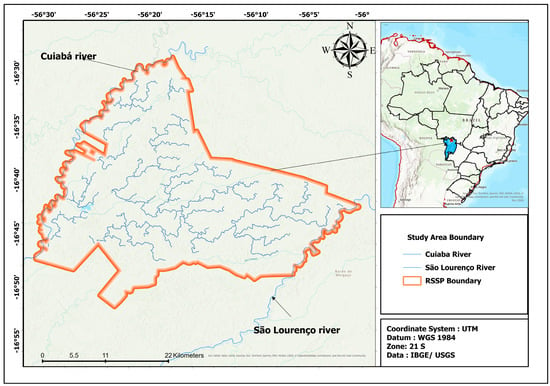
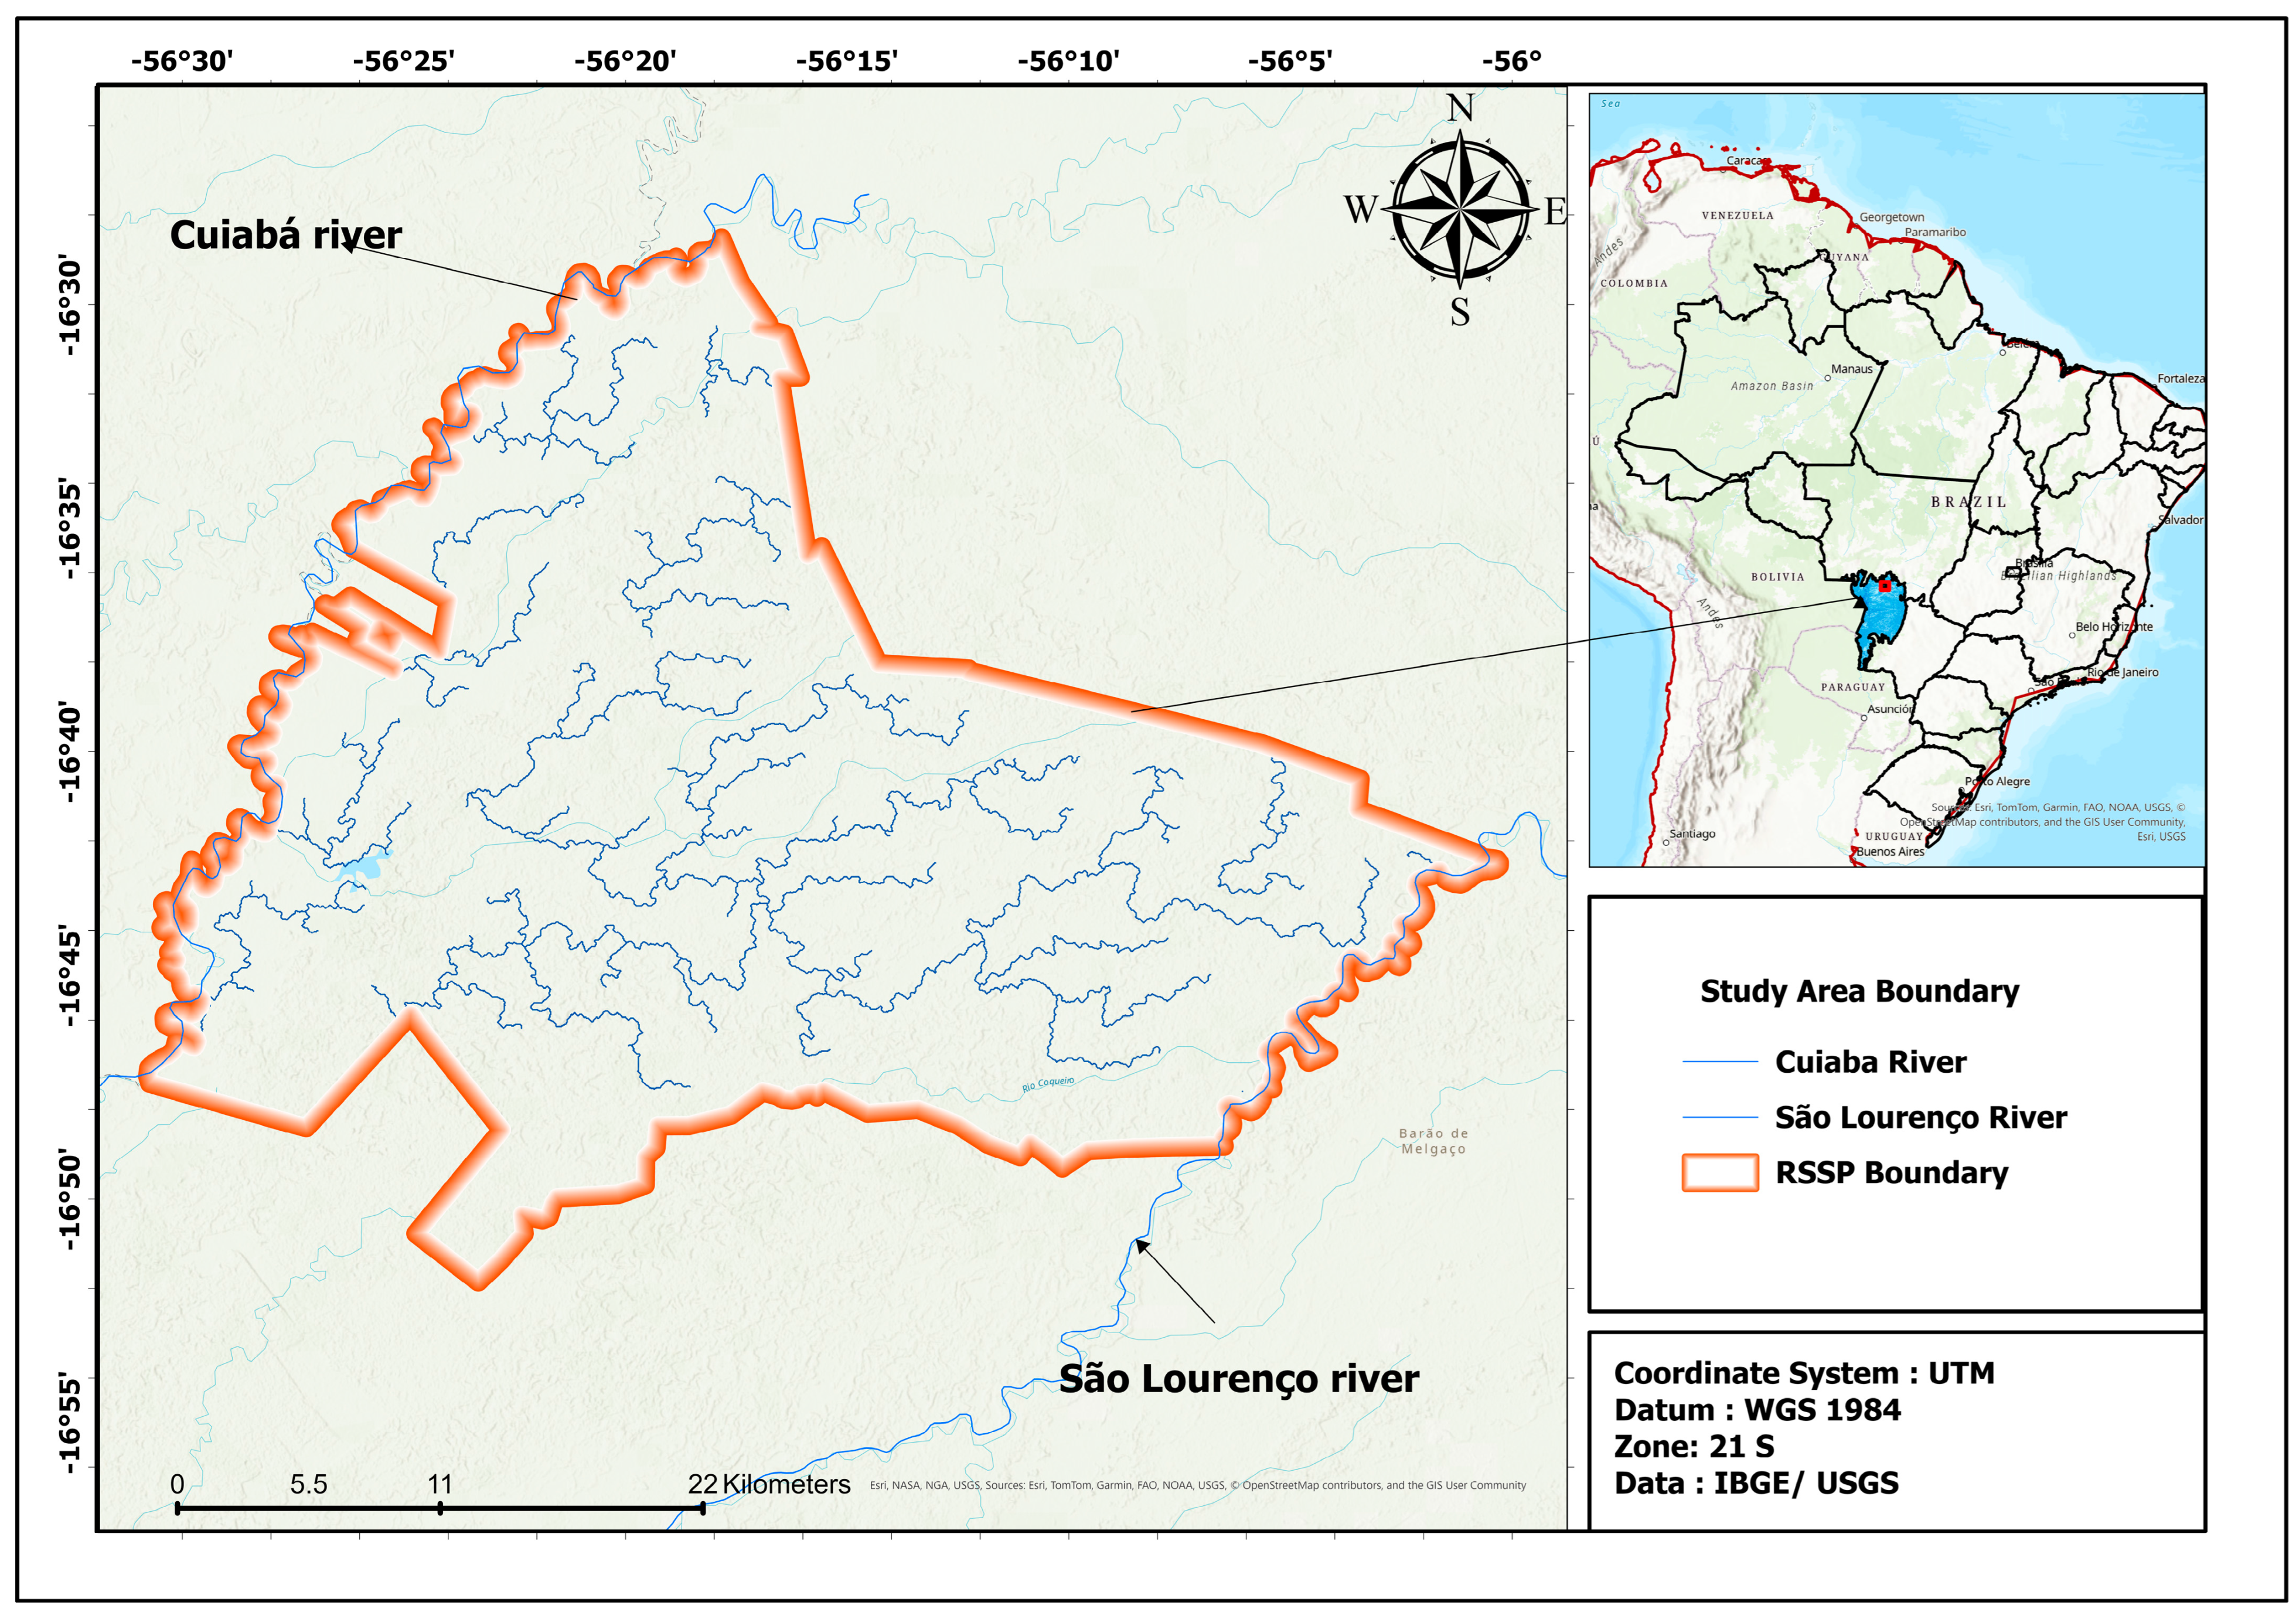
The study area is located within the Ramsar SESC Pantanal site owned by the National Trade Service (Figure 1), in the northern part of the Brazilian Pantanal, where the Cuiabá River, a major tributary of the São Lourenço River, plays a central role in shaping the region’s seasonal flood dynamics. The regional climate is marked by two well-defined seasons: the rainy season and the dry season. Annual rainfall ranges from approximately 1000 to 1500 mm, with most precipitation concentrated between November and March. January is generally the wettest month, with rainfall around 340 mm, whereas June is usually the driest month, with rainfall dropping to approximately 3 mm. The mean annual temperature is around 24–25 °C [26,27].
Figure 1.
Map of the SESC Pantanal study area (left) and its location in the Pantanal (blue region) and South America.
According to [27], the northern portion of the Paraguay River depression is topographically depressed within the regional context and bordered by surrounding elevated terrains. More broadly, the Pantanal consists of a low-relief sedimentary depression, with elevations generally ranging from about 80 to 150 m above sea level, conditions that favor seasonal water accumulation and slow drainage across the floodplain [27,28].
During the rainy season, which generally extends from October to April, rainfall becomes intense and frequent, resulting in a significant rise in water levels in the Cuiabá River in the northern Pantanal. Flooding usually begins between October and December, while the main flood season extends from January to April, when water volume reaches its peak and creates favorable conditions for the reproduction of various aquatic species [29].
In the dry season, from May to September, rainfall decreases dramatically, and long periods without precipitation can occur, usually in July and August. The dry period from June to September is marked by a significant reduction in river levels, making previously flooded areas accessible again [30].
The Cuiabá River forms a depositional system that covers an area of 15,300 km2. This region exhibits significant geomorphological complexity, with various types of sedimentary deposits formed by the actions of the Cuiabá River and other rivers in the area. The influence of the Cuiabá River is fundamental in shaping the landscape and functioning of the Pantanal ecosystem, as the transport of sediments and nutrients plays a crucial role in the biodiversity and natural cycles of this region [31].
2.2. Methods
2.2.1. Availability and Selection of Images
Sentinel-1 was launched in 2016; we utilized all available images from the following time intervals: January 2017 to April 2017 and January 2020 to April 2020. This period was chosen due to the highest flood and drought activity observed over the past decade, according to hydrograph data provided by the ANA (National Water Agency) [15].
Sentinel-1A and Sentinel-1B operate in a coordinated manner to map the Earth every six days, allowing each satellite to capture the same region every 12 days [32]. The resulting images are available at different processing levels, already calibrated and georeferenced using the Sentinel-1 Toolbox. These images were accessed by the European Space Agency (ESA) Copernicus Open-Access browser, available online at https://browser.dataspace.copernicus.eu (accessed on 12 February 2024).
Both Sentinel-1A and Sentinel-1B are equipped with a C-band SAR system (with a frequency of 5.405 GHz) and have the capability to acquire polarimetric SAR data in Interferometric Wide (IW) mode [33]). These GRD images have a spatial resolution of 10 m and are acquired in IW mode [34].
We used the C-band GRD product from Sentinel-1 to extract backscatter information from the images to identify flooded areas. Specifically, we opted for the vertical–vertical (VV) co-polarization mode, which provides suitable backscatter intensity values for wetland areas [35]. Horizontal–horizontal co-polarization has shown greater accuracy than vertical–horizontal polarization and other co-polarization modes for detecting floods in wetland areas [36].
2.2.2. Preprocessing
The Sentinel-1 images underwent a series of preprocessing steps to ensure data accuracy and quality. These preprocessing steps included the calibration of the backscatter coefficient (sigma0) in decibels (dB), thermal noise removal, data calibration, and Range-Doppler terrain correction [37,38].
To maximize information extraction, we performed additional preprocessing of Sentinel-1 images for speckle filtering and radiometric terrain normalization using SNAP version 13.0.0 (Sentinel Application Platform) software [37]. These additional steps aimed to reduce the effect of speckle noise on the images and enhance radiometric consistency across different terrain areas.
2.2.3. Speckle Filtering
Inherently, SAR images are affected by speckle noise. The speckle effect results from the interference of many scattering echoes within a resolution cell [39]. Speckles degrade the quality of image data and interfere with understanding the backscattering responses of surface features. Speckle filtering is an essential part of preprocessing activities in SAR products [40].
The principle of speckle filtering is to reduce the variation in complex speckles and improve the estimation of the scattering coefficient. In this study, the Lee filter with a 5 × 5 window was applied to Sentinel-1 images to reduce speckle noise, a common issue in SAR data that can obscure fine features crucial for flood monitoring. The 5 × 5 window size offers an optimal balance between noise reduction and detail preservation, effectively smoothing out noise while retaining critical landscape features, such as the boundaries of flooded areas. This choice is particularly suitable for monitoring the Pantanal, where seasonal flooding demands accurate delineation of water bodies. The Lee filter enhances the interpretability of water versus non-water areas in the SAR data, making it easier to create reliable flood history records. Additionally, using a 5 × 5 window aligns with established practices in SAR-based flood studies. The Lee filter is a particular case of the Kuan filter, which filters based on the criterion of minimum mean squared error (MMSE). These speckle filters range from a simple blind low-pass filter, such as the boxcar filter, to different adaptive filters, such as the Lee filter [41] the Maximum A-posterior (MAP) Gamma filter [42], the refined Lee filter [43], and the enhanced sigma Lee filter [44].
2.2.4. Radiometric Terrain Normalization
Radiometric normalization for terrain effect correction is a critical step that requires clear justification and detailed explanation, especially in regions where topography can significantly influence SAR backscattering results [45]. This correction is necessary due to the side-looking nature of SAR systems, which map each target on the terrain in the slant range domain [46]. Although Sentinel-1 images available as GRD are already corrected for geometric distortions, radiometric terrain normalization was applied to ensure data accuracy in areas prone to topographic variations. This normalization process masks pixels in regions of active overlap and shadow within the images [46].
In the Pantanal, which has relatively flat topography, topographic effects are less pronounced compared to mountainous areas. However, radiometric normalization remains relevant, as even slight elevations can interfere with radiometric measurements in low-slope environments. For this step, angle-based correction methods were used: one based on volume scattering and the other on surface scattering [47].
For radiometric terrain normalization, there are two angle-based correction methods, one based on volume scattering and the other on surface scattering [38]. The volume scattering model is important for vegetation mapping applications. For wetland applications, as in our case, the surface scattering model based on angles is more appropriate [38].
2.2.5. Water and Non-Water Surface Separation (Binarization)
To identify flooded areas, it is crucial to distinguish between water and non-water surfaces using the binarization technique. Histogram thresholding is one of the most used techniques to convert single-band value images into two distinct classes, such as target and “background” [48]. However, choosing an appropriate threshold is a crucial and challenging step to achieve accurate and reliable binarization. In image analysis, it is necessary to objectively and automatically determine a single threshold to distinguish two relatively homogeneous features in a single-band image, such as land and water, which exhibit a bimodal distribution of pixels.
In this study, we used the Otsu method for image segmentation [49]. The Otsu method is an automatic image binarization technique based on histogram thresholding. It provides a means to automatically find an optimal threshold based on the observed distribution of pixel values. The Otsu method aims to segment an image by minimizing intraclass variation between two distinct homogeneous classes, using a histogram-based approach. The histograms of these classes represent different ranges of intensity values, and the method divides the histogram into two groups using a threshold determined by minimizing the weighted variation between the two homogeneous classes.
The following equation was used to achieve this minimization in intraclass variation [43].
The formula to find the threshold in the Otsu method is based on maximizing the interclass variance, which is equivalent to minimizing the sum of intraclass variances, as shown in Equation (1). The interclass variance is defined as interclass variance = p1* p2* (mean1 − mean2)2, where p1 and p2 are the probabilities of the two classes divided by the threshold, whose value ranges from 0 to 255, and (t) represents the threshold. The means (mean1 and mean2) are the intensity means of the two classes.
The goal of Equation (2) is to find the threshold that maximizes this interclass variance to obtain the desired segmentation.
The average digital number in class k, denoted by µk, is calculated as the mean of pixel values belonging to that class. The average digital number of the entire dataset is represented by l. Class k is defined by each class value less than a certain threshold t. In this context, we are estimating the threshold that maximizes the Between-Class Sum of Squares (BSS). Since we have two classes (water and land), the value of p is equal to 2. The BSS is calculated using the following formula [50].
Equation (3), describing the calculation of BSS, involves several variables. The variable i refers to the observations (pixels) in each class, j refers to the classes (water and non-water), and ni represents the number of observations in class i. The variable C denotes the global mean of the values, with VV being the specific variable under consideration (e.g., intensity). The mean for theclass and the global mean (C) are used in the calculation of BSS.
The global mean C is denoted as follows:
In Equation (4), N represents the total number of observations across both classes, water and land. The measure evaluates the separation between the mean values of these two classes while accounting for the squared sum of all observations in each class normalized by N. Thus, for each Sentinel-1 image, the BSS corresponds to the squared sum associated with the water and land classes.
For each individual cluster (water and non-water), the probability is estimated using the cluster probability equation expressed as follows Equation (5):
where p(i) is calculated as the ratio of the number of observations in the cluster (ni) to the total number of pixels in the image (n). This probability p(i) indicates the proportion of the cluster relative to the total number of pixels in the image. It is a relative measure that reflects the presence of the specific cluster relative to the complete set of pixels in the image.
2.2.6. Field Validation
In the literature, the confusion matrix is widely used as a measure of accuracy evaluation, which was employed to estimate the accuracy of binarization for separating water and land. For this purpose, randomly generated point observations were used as a test set. The classes of the ground truth points were determined based on the visual interpretation of high-resolution optical images (Planet scope with approximately 3 m resolution) and Landsat-8 images captured in Google Earth. In total, 150 water truth points and 150 non-water truth points were identified. The VV backscattering of different features, such as buildings, channel beds, floodplains, and water bodies, was analyzed in sampling areas within and around the SESC Pantanal Ramsar Site to better understand the spectral confusion between these features, which will be discussed in the next section of this study.
2.2.7. Accuracy
A Random Forest classifier was trained to map three land-cover classes (water/flood, open land, and others) and was evaluated using cross-validation and an independent testing dataset. Overall performance on the testing dataset was high, with 97.70% correct predictions (n = 6622), RMSE = 0.2396, and a small bias = −0.0187. Class-wise accuracy and precision were consistently high across classes, although the open land class was under-represented in the testing data (2.17%), which can affect per-class uncertainty.
2.2.8. Hydro-Climatic Data
To define the timing and magnitude of floods in the study area, we used rainfall and river flow data from the National Water Agency (ANA), which were obtained from the agency’s website (https://www.snirh.gov.br/hidroweb/serieshistoricas) (accessed on 23 October 2023). Since our study area is delimited by the Cuiabá River, it was necessary to download river flow data for it. The chosen station was Porto Cercado on the Cuiabá River (river gauge station code 66340000 and rainfall station code 1656001).
3. Results
3.1. Hydrological and Rainfall Patterns at the Porto Cercado Station (2017–2020) and Variability in the Cuiabá River
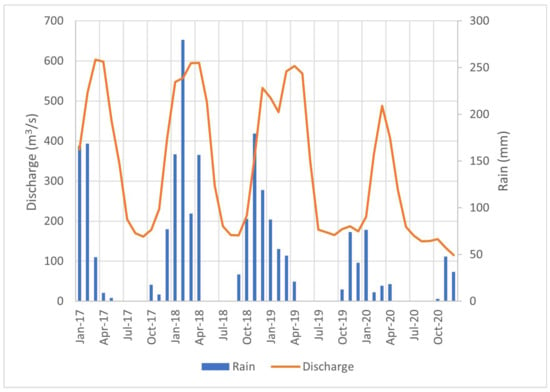
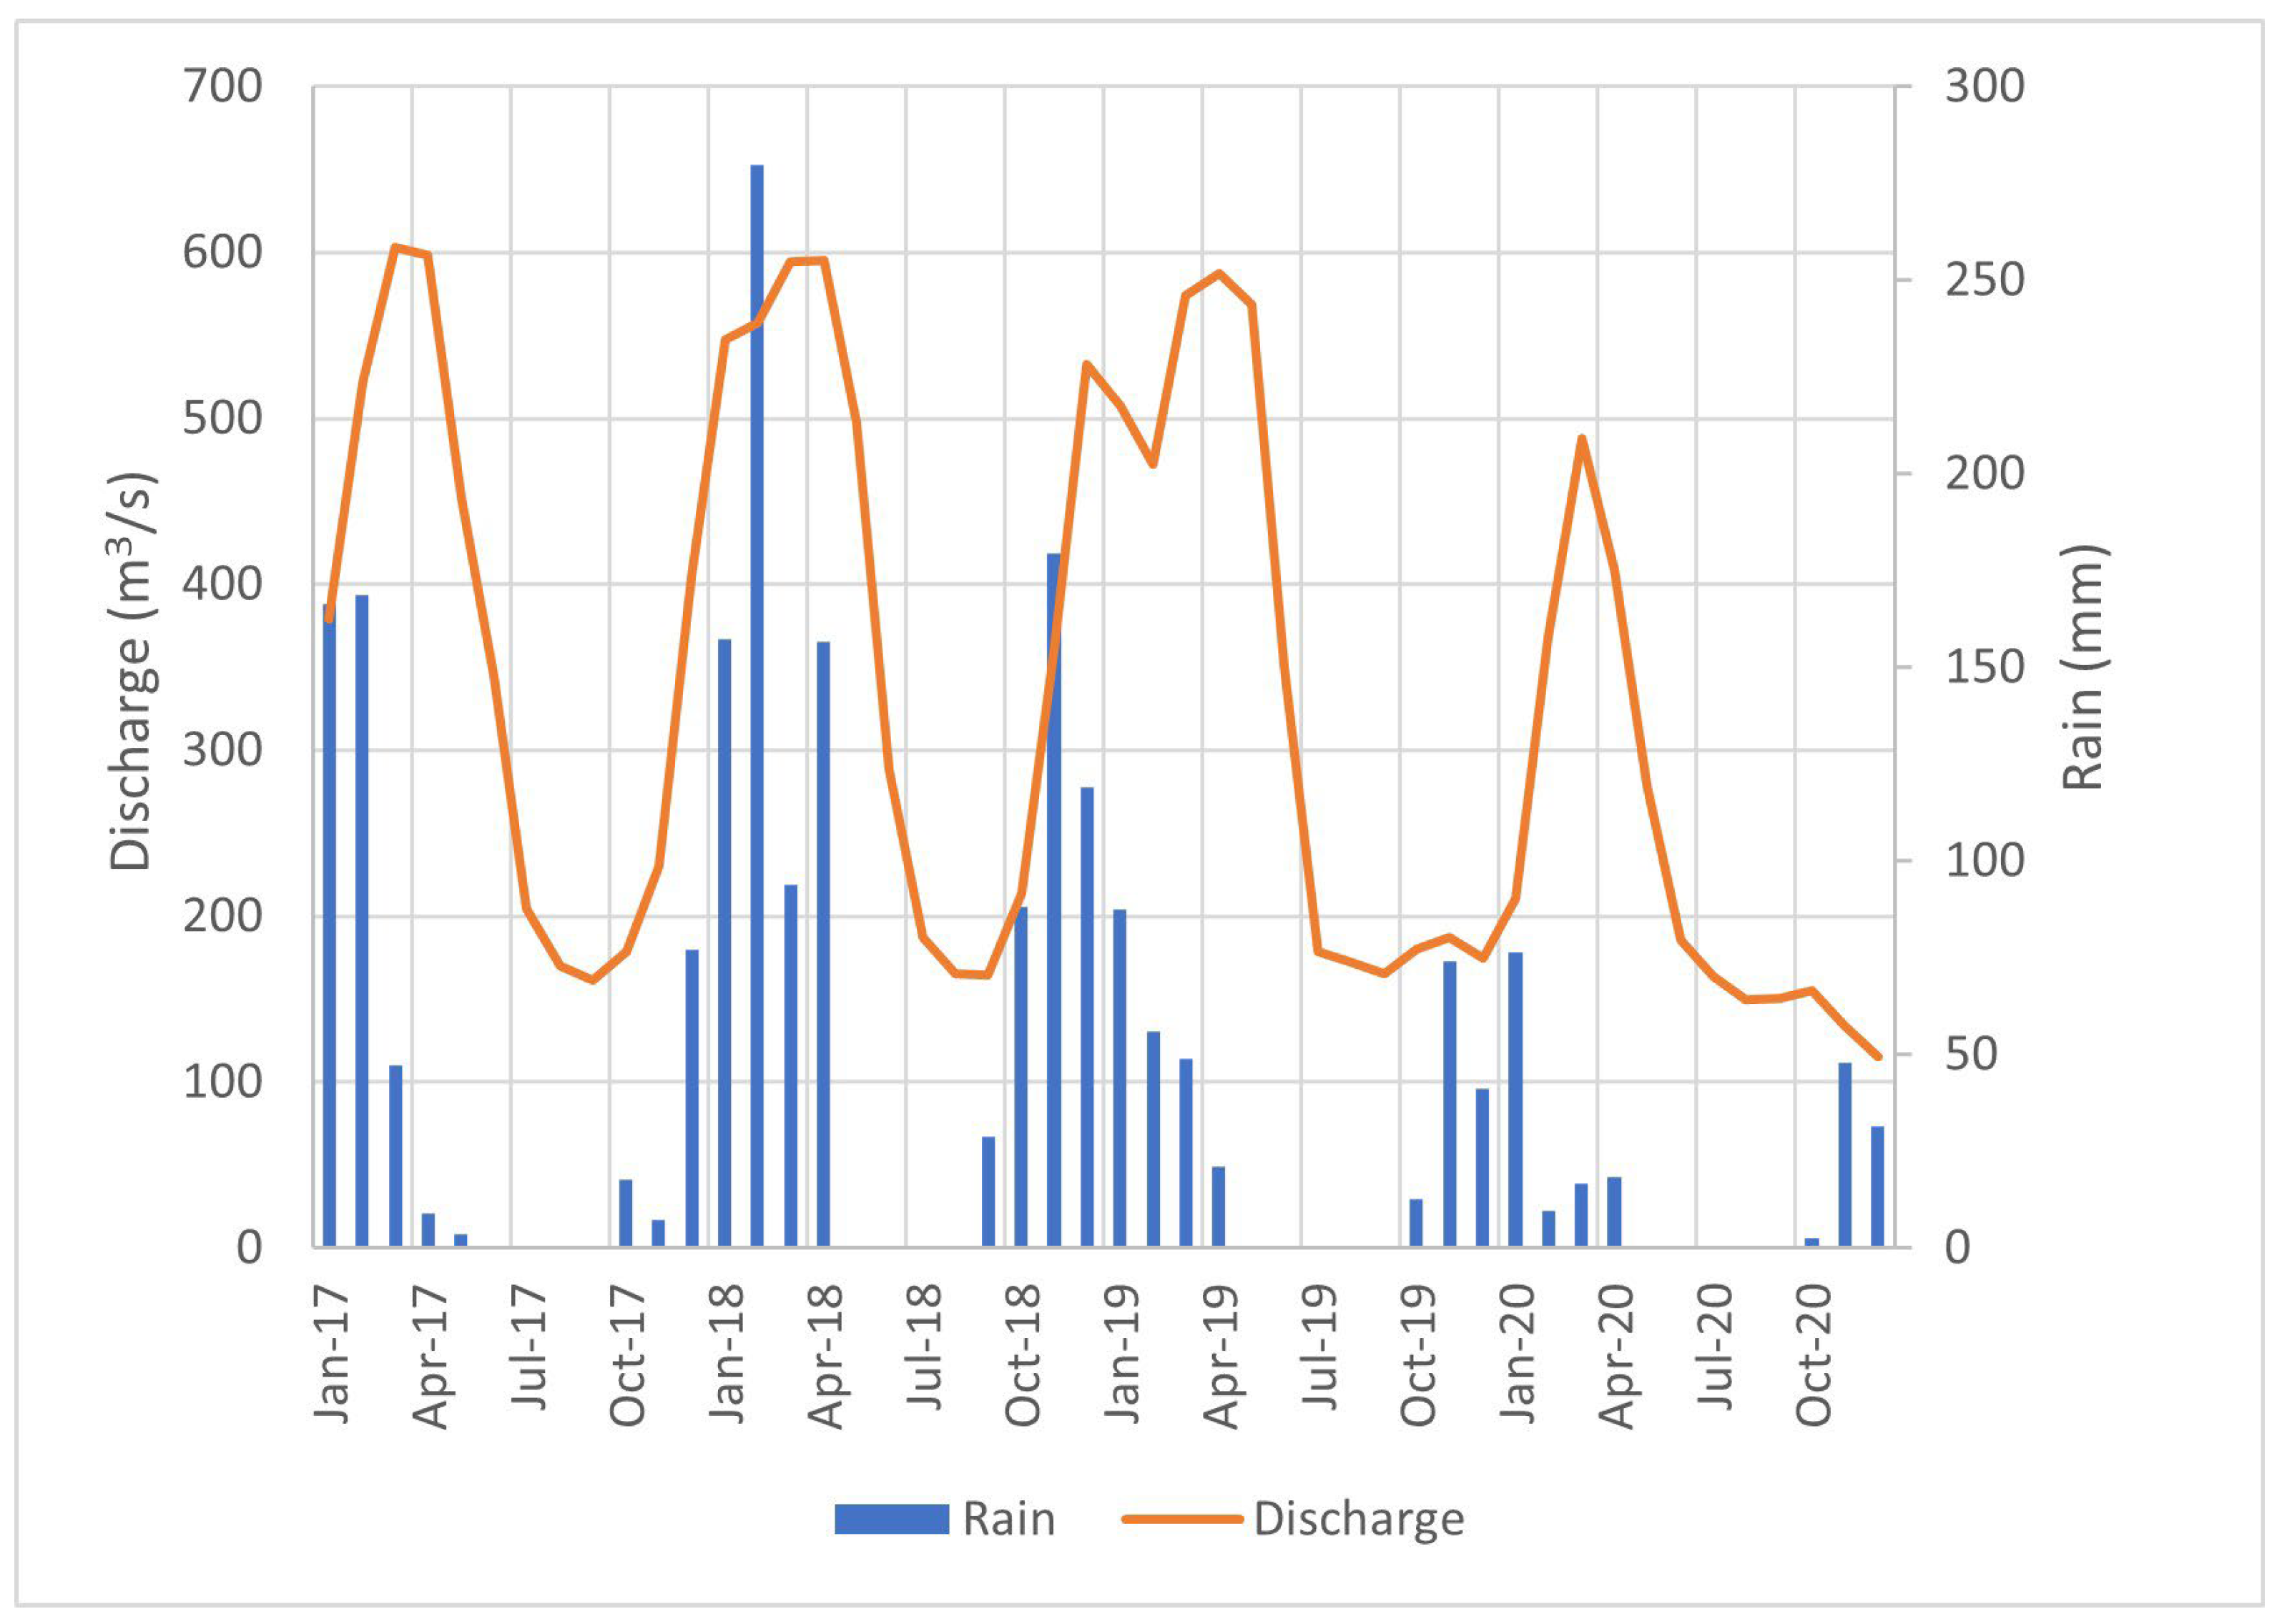
Hydroclimatic data from the Porto Cercado fluviometric station located upstream of the SESC Pantanal Ramsar Site on the Cuiabá River were analyzed to characterize river discharge and precipitation patterns between 2017 and 2020 (Figure 2). The highest average monthly discharge during the study period was recorded in March 2017, reaching 603 m3/s. In subsequent years, peak discharges occurred in April, with similar magnitudes: 595 m3/s in 2018 and 588 m3/s in 2019. A marked reduction in river discharge was observed in 2020, with the annual maximum reaching only 488 m3/s. The lowest discharge of the entire period was recorded in September 2020, at 150 m3/s, indicating severe low-flow conditions [51,52].
Figure 2.
Monthly average flow for the Cuiabá River and monthly rainfall during the period from 2017 to 2022. Data obtained from the river gauge stations at Porto Cercado on the Cuiabá River (river gauge station code: 66340000).
Precipitation data show that the highest monthly rainfall occurred in February 2018 (280 mm). As expected for the regional climate, maximum rainfall typically occurred between November and February. However, the 2019–2020 wet season exhibited anomalously low precipitation (peak of 230 mm), deviating from historical norms and contributing to the reduced flood magnitudes observed in that year. It is important to note that monthly rainfall data for August 2017 were not available in the ANA dataset, representing a minor data gap in the time series.
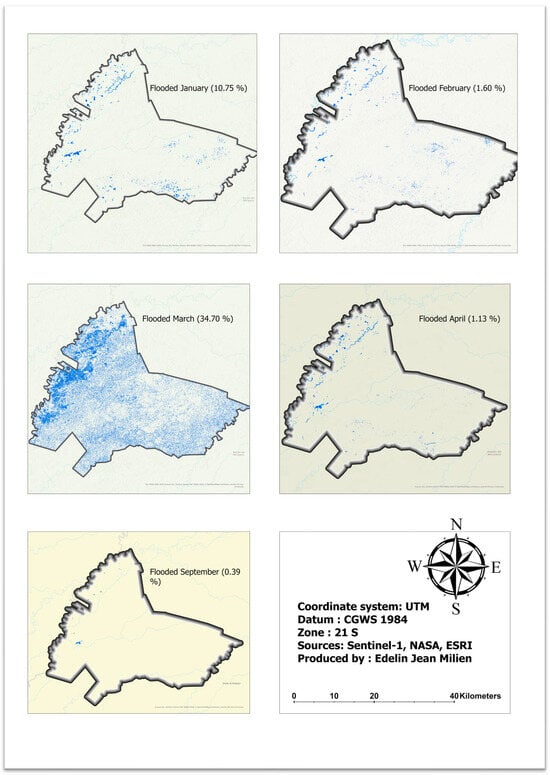
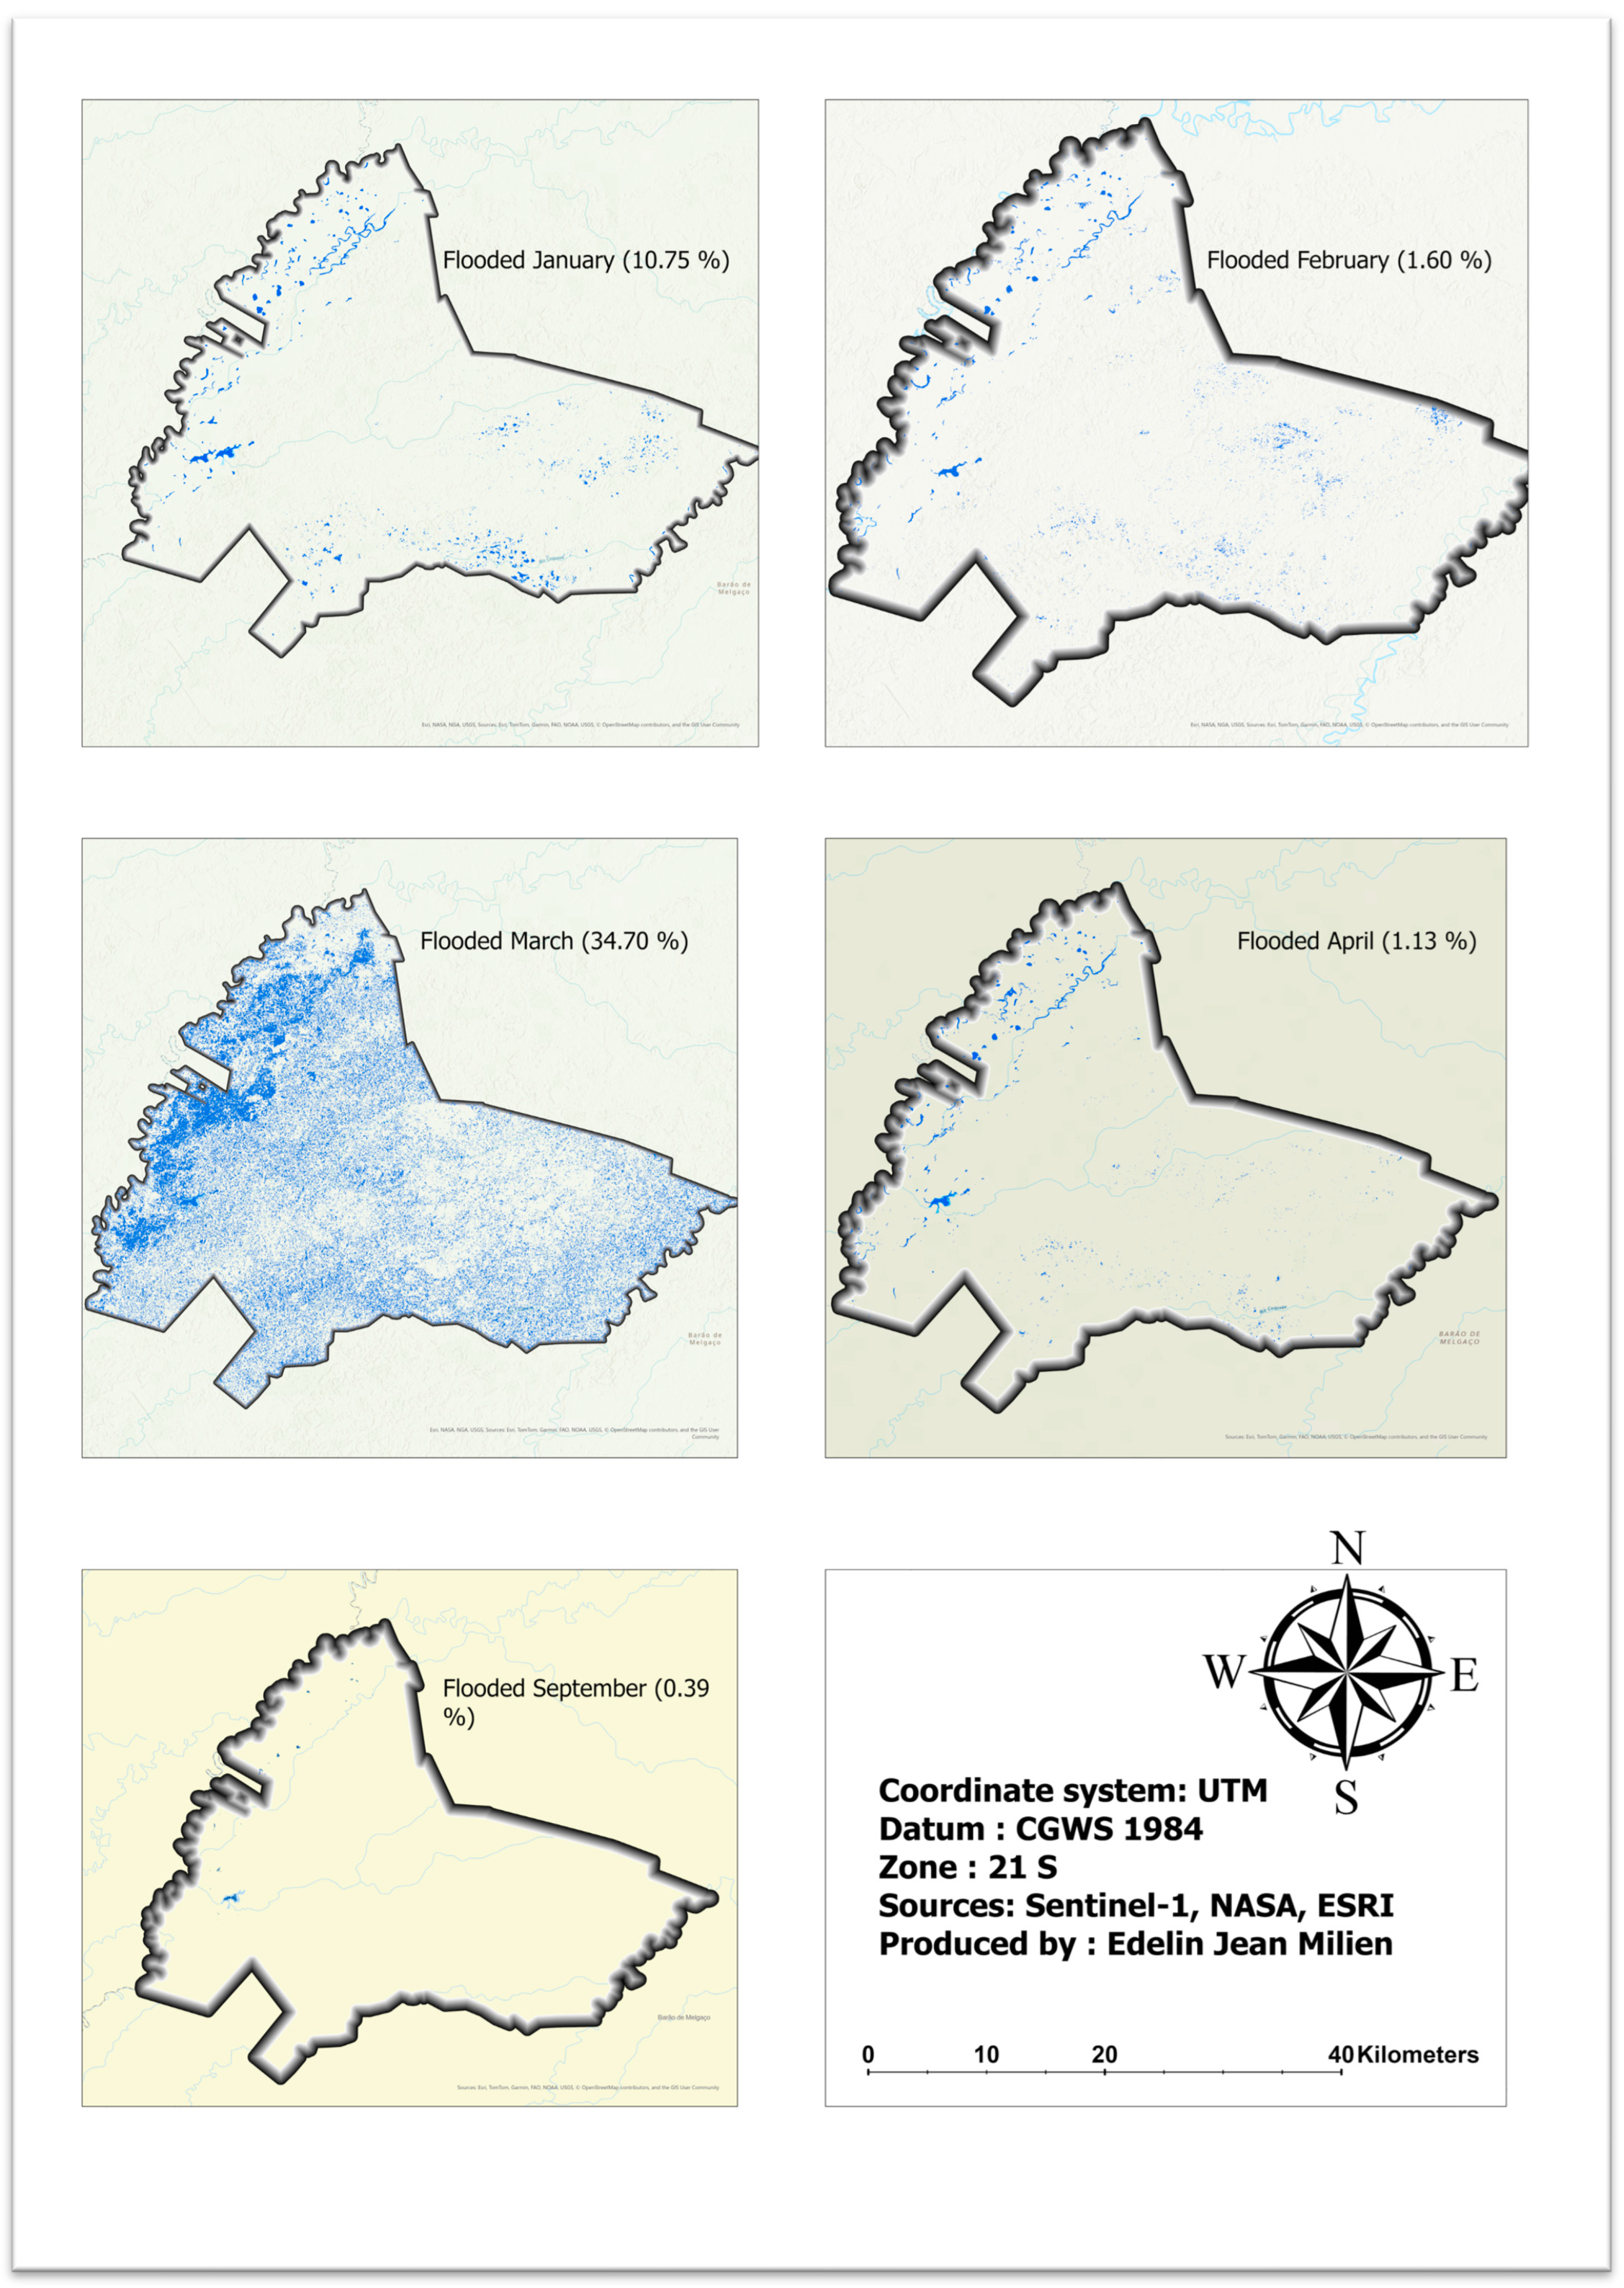
Figure 3 illustrates the flooded areas during the months of January to April 2017. The dark blue regions represent permanent water bodies: areas where water is present in all observations, including the main tributaries of the Cuiabá River that flow. It can be observed that the degree of flooding at the Ramsar SESC Pantanal site varies between flood months: In March, coinciding with the peak flow, practically the entire reserve is flooded. In January, the flooded area is smaller than in March but larger than in February and April, suggesting that accumulated rainfall in the area is a significant factor in flooding. However, despite the flows in February and April being important (522 and 598 m3/s, respectively), the flooded area is much smaller than in March or January, which suggests that other factors may intervene in the flooding process.
Figure 3.
Flood maps in the study area. The maps from January to April 2017 illustrate the variation in flooded areas during the flooded months. In September, at the end of the dry season, only the permanent water bodies are highlighted. Open water areas are highlighted.
3.2. Temporal Variation in Flooded Areas Estimated Using the Binarization Linear Method (2017–2020)
Table 1 presents the variation in flooded areas over different periods using a linear binarization method. The results show significant temporal fluctuations in flood extent, reflecting hydrological variability within the study area. The most extensive flooding occurred in March 2017, when open water bodies covered 37,509.8 hectares, accounting for 34.7% of the study area. This suggests a major hydrological event, likely driven by increased precipitation, seasonal river discharge, or other hydrometeorological factors. Similarly, January 2017 recorded a substantial flooded area of 11,619.6 ha (10.75%), indicating another period of elevated water levels.
Table 1.
Temporal variation in flooded areas estimated using the binarization linear method (2017–2020).
In contrast, the lowest recorded extent was in September 2020, with only 73.5 ha of open water detected. This minimal flooding could be attributed to seasonal dry periods, reduced precipitation and lower river discharge. Other periods with relatively low flooding include September 2017 (426.4 ha, 0.39%), January 2020 (1037.0 ha, 0.96%), and March 2020 (809.3 ha, 0.75%), indicating similar low-water conditions.
A pronounced fluctuation is evident between different years and seasons. For instance, while March 2017 exhibited extreme flooding, March 2020 displayed a significantly lower extent (809.3 ha, 0.75%), indicating interannual differences in hydrological drivers. The April 2017 (1218.1 ha, 1.13%) and February 2017 (1731.4 ha, 1.60%) values suggest that flooding was minimal in those months compared to January and March of the same year. Additionally, September consistently recorded lower flood extents across years (2017 and 2020), implying a recurrent seasonal pattern of reduced water levels.
3.3. Random Forest Classification
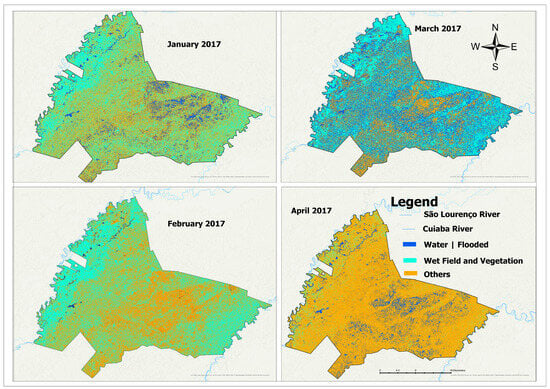
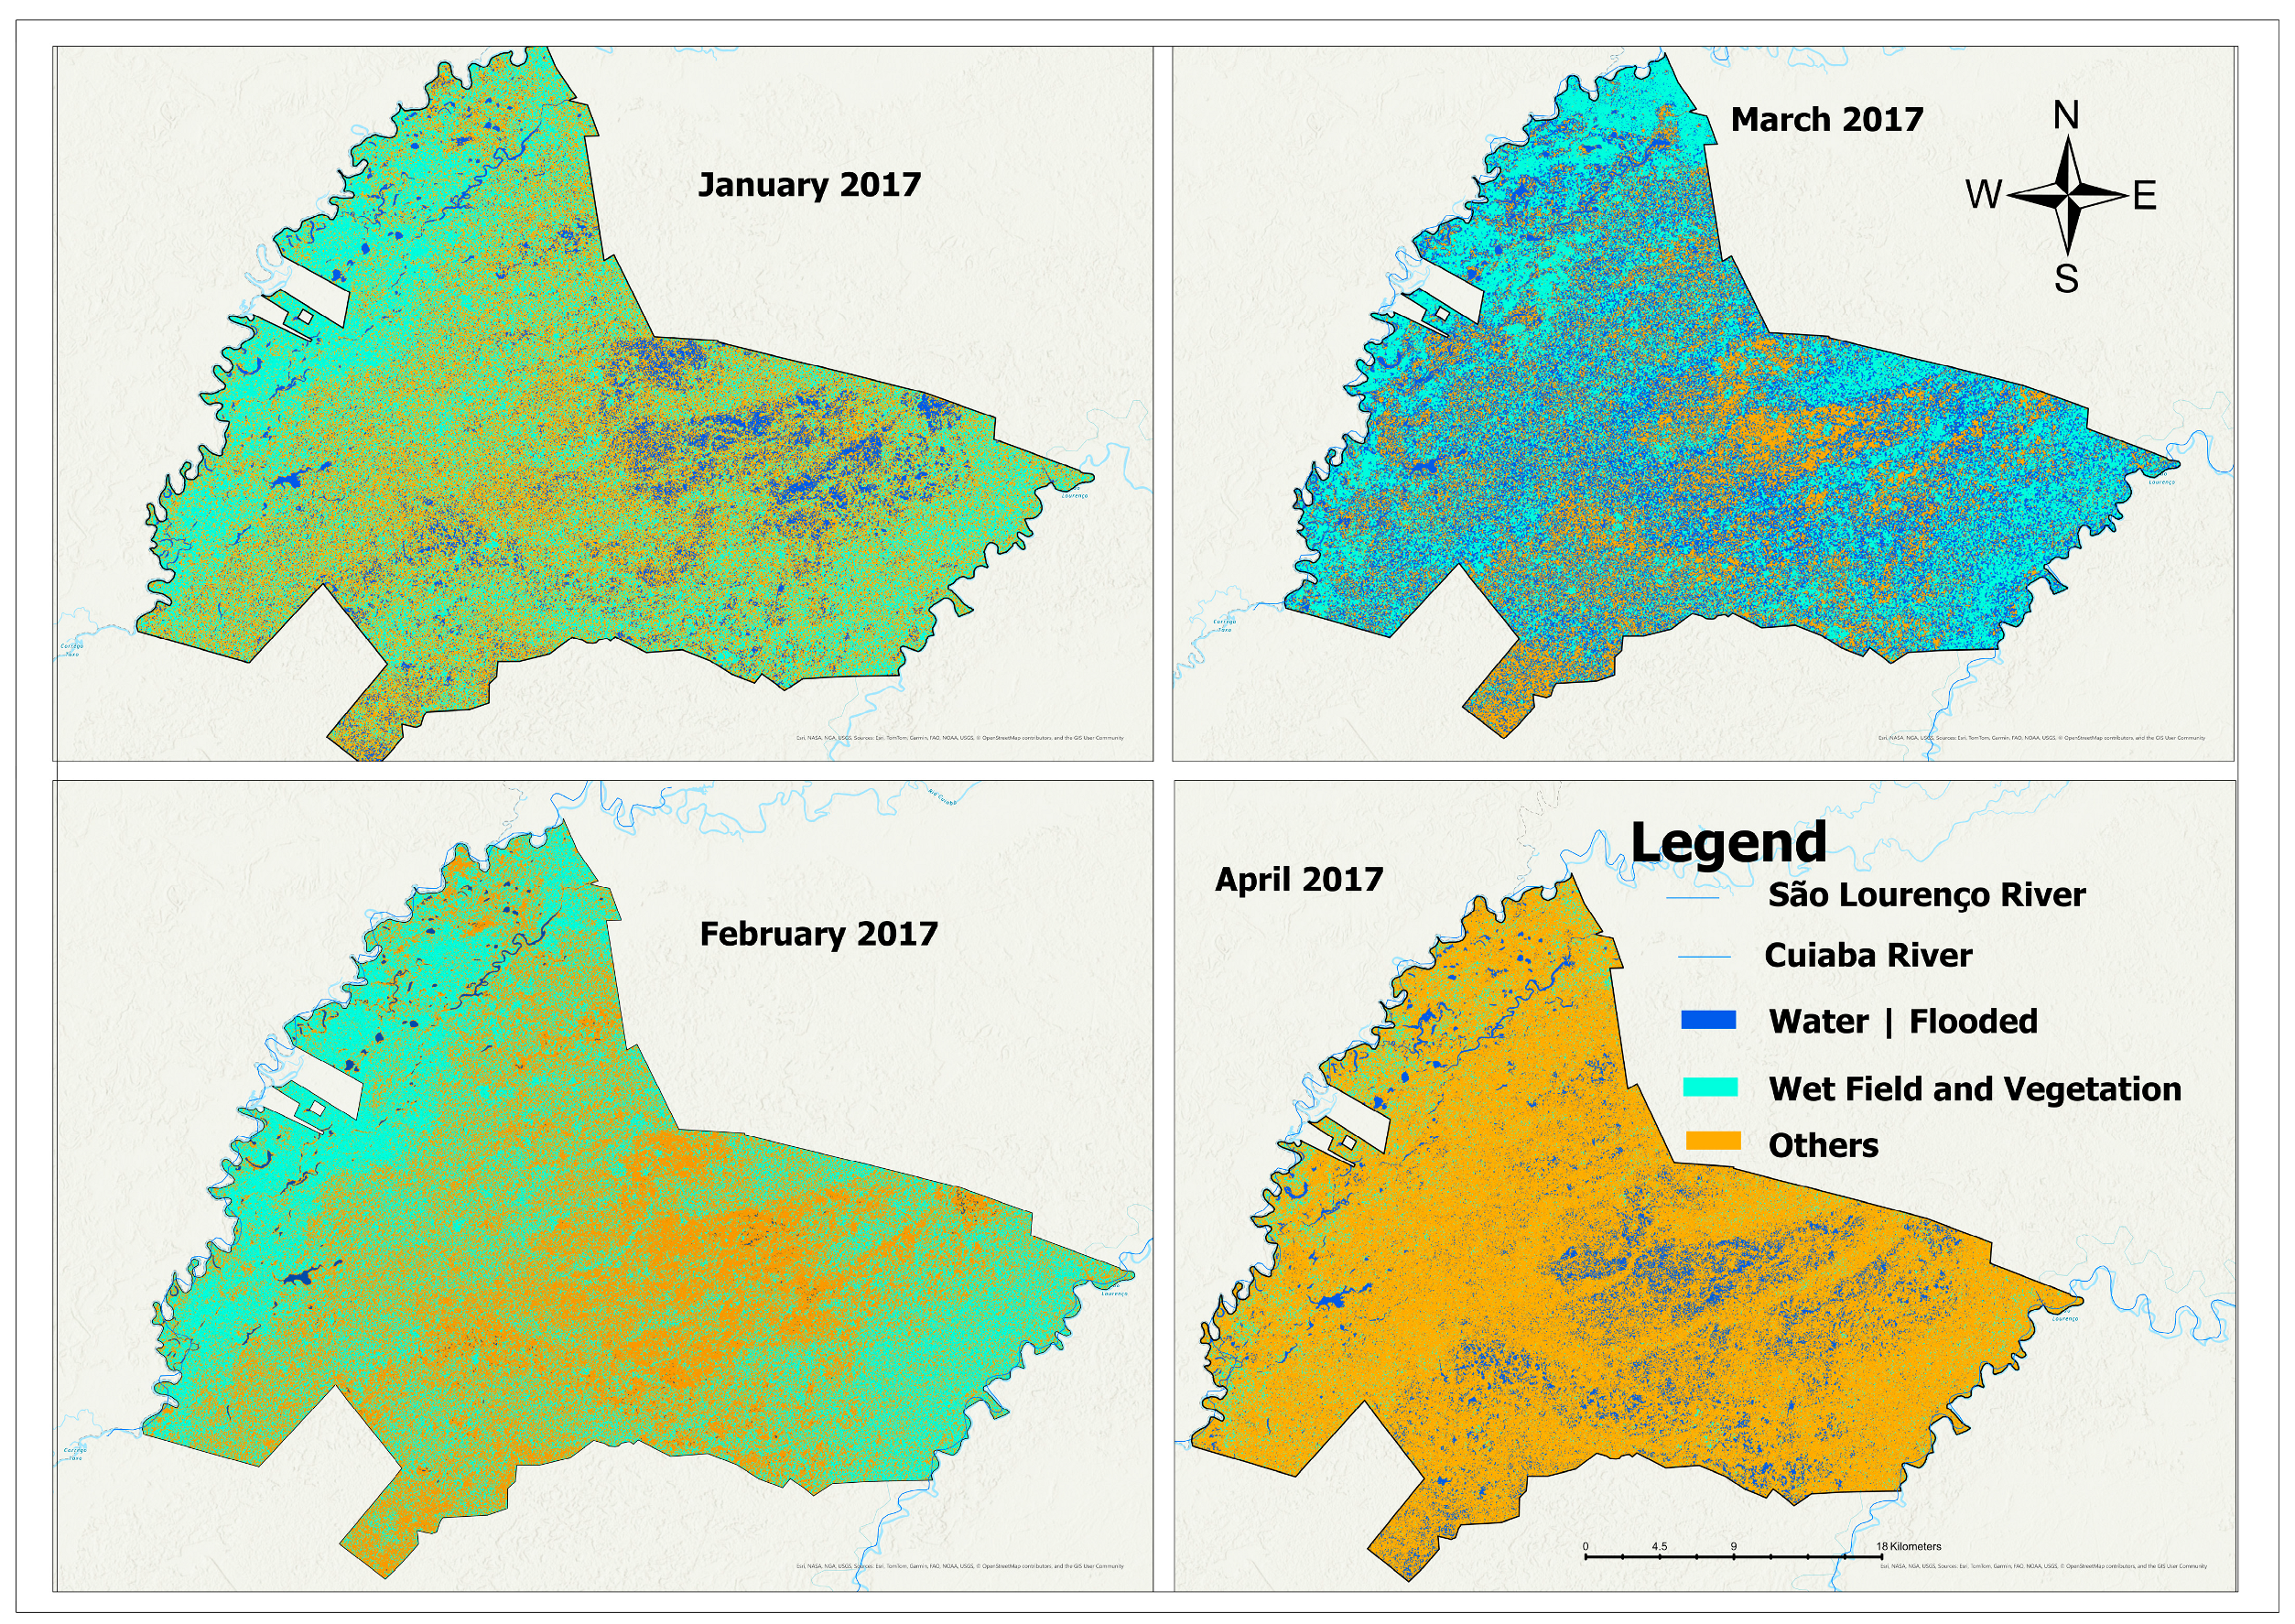
The Random Forest classification maps (Figure 4) illustrate the spatial distribution of flooded areas, open land, and other land cover types from January to April 2017. The classification results distinguish three major land cover categories, which include both seasonally and permanently flooded areas, Open Land|Vegetation, which consists of wetlands, and sparsely vegetated areas. The map shows a clear seasonal variation in flooding, with January and March exhibiting moderate flood extents, while April records the highest inundation area. In contrast, February presents the lowest flood extent, despite moderate river discharge, suggesting that local rainfall, soil saturation, and floodplain retention capacity play a key role in controlling seasonal flooding dynamics.
Figure 4.
Random Forest supervised classification for January, February, March and April 2017. The image was generated in the UTM coordinate system, SIRGAS 2000 Datum zone 21S.
The quantitative assessment of flooded areas derived from the Random Forest classification further supports the observed seasonal patterns (Table 2). In January 2017, approximately 11,619.69 hectares (10.75%) of the study area were flooded. However, the flood extent significantly decreased in February to only 831.13 hectares (0.77%), making it the month with the lowest recorded flood extent. A substantial increase was observed in March, when 37,509.80 hectares (34.70%) were flooded, indicating the transition toward peak inundation. Table 3 shows that the Random Forest classification achieved a high overall level of agreement, indicating that the model was generally effective in separating the main land-cover and flood-related classes.
Table 2.
Quantitative assessment of flooded areas derived from the Random Forest classification further supports the observed seasonal patterns.
Table 3.
Class-wise cross-validation accuracy metrics derived from the uploaded Random Forest output.
Finally, April recorded the highest flood extent, with 86,433.10 hectares (79.96%) of the area underwater, representing the most extensive flood event of the study period. The results suggest that while river discharge contributes to flooding, other hydrological factors, such as accumulated precipitation and floodplain retention, play a crucial role in determining the extent of water coverage in different months.
The peak flood in April ensures high hydrological connectivity, allowing for nutrient transport and sediment deposition, which are critical for maintaining floodplain productivity. Despite moderate river discharge in February (522 m3/s) and April (598 m3/s), February exhibited the lowest flood extent, emphasizing that flood patterns are not solely dictated by river discharge.
We performed a Kruskal–Wallis test to determine whether there are significant differences in the area variable across the three land cover classes: “Water|Flood”, “Open_Land|Vegetation”, and “Others”. The test statistic obtained was χ2 = 0.34615 with two degrees of freedom. This chi-squared value represents the degree to which the ranks of the different groups deviate from what would be expected under the null hypothesis, which assumes no differences between groups.
The p-value associated with this test was 0.8411. A p-value represents the probability of obtaining test statistics as extreme as the one observed, assuming that the null hypothesis is true. Since this p-value is much larger than the common significance threshold of 0.05, it indicates that there is no strong evidence to suggest significant differences in the distribution of area values across the three land classes.
4. Discussion
The application of Sentinel-1 aimed to overcome limitations found with the use of other remote sensing products. However, we assert that Sentinel-1 may serve as a tool for flood monitoring in wetlands, specifically because several challenges have been reported regarding cloud cover and the complex spectral conditions of lake water when only optical data are used [15]. Diverse studies using MODIS (Moderate Resolution Imaging Spectroradiometer) data [53,54] reported limitations due to low spatial resolution, while comprehensive information was obtained based on high temporal resolution [55,56].
By contrast, the following advantages of Sentinel-1, used in this study, can be clearly highlighted: (i) the high spatial resolution of Sentinel-1 data (10 m) allows for a detailed spatial analysis of water surface patterns and related flooded areas, (ii) the temporal resolution of the Sentinel-1 time series allows for monthly assessments of flooded areas, and (iii) the water extent obtained by Sentinel-1 provides continuous information from an active sensor, available even during cloudy periods [57].
The accuracy assessment further supports the reliability of the Sentinel-1 classification for flood mapping in the study area. The overall accuracy obtained indicates that the Random Forest model was effective in distinguishing the main mapped classes, despite the inherent complexity of floodplain environments.
Thus, these advantages of Sentinel-1 highlight that the two parts of the reserve (Paleo-area and recent area) [27] are flooded at different times. This flooding phenomenon can be caused by both local rains and water from the São Lourenço and Cuiabá rivers, which enter through underground channels, surface channels, and artificial channels [58].
It is important to note that there are variations in the flood phases in the different sub-regions of the study area, as well as the possibility of multi-year variations in more intense floods or droughts. The drought and fire events in the Pantanal in 2020 received wide coverage in national and international media. The periodic repetition of drought and fire periods in the Pantanal is predicted by mathematical models [59,60].
These analyses suggest that the pattern of intense droughts is moving towards a new climatic scenario in the Pantanal, which is in line with the projections of mathematical models [61,62]. This shift has ecological implications, including the loss of ecological connectivity, interruption of life cycles for aquatic fauna, and reduced regeneration of hydrophilic vegetation. Sentinel-1, as a continuous monitoring tool, enables the detection of such hydrological anomalies and long-term climate-driven changes.
Hence, our findings have direct implications for the adaptive management of the Ramsar Pantanal site. The flood information derived from Sentinel-1 can support the development of early warning systems, especially for drought-prone areas, and inform management plans for conservation units such as Private Natural Heritage Reserves (RPPNs) and Legal Reserves.
Moreover, flood extent data are useful for identifying and monitoring critical aquatic habitats. In the context of the Ramsar Convention, this evidence contributes to ecological character descriptions, indicators for monitoring wetland health, and land use zoning strategies. These applications align with public policies for wetland sustainability and ecosystem-based management.
To complement the flood frequency maps of the Pantanal from the data sources presented by MapBiomas 2020 collections, Sentinel-1 data can provide additional spatial information. This allows differentiation of details related to natural structures of flooded areas, such as potential habitats for aquatic birds located in lakes and dynamically changing small areas [63], as well as structures of flooded areas created by humans, such as narrow channels, to maintain water in the landscape as an adaptation strategy to climate change.
In comparison with the MapBiomas 2020 time series dataset, although it has a much lower temporal resolution, the flood frequency derived with Sentinel-1 shows very good agreement in the flooding pattern [56]. However, as can be seen in the differences in Figure 2, the ANA’s monthly data may reveal flooding that cannot be detected by Sentinel-1 during very dynamic flood periods due to higher temporal resolution. Combining the advantages of both data sources for flood mapping is a future task that could result in even better monitoring results.
Future research should explore coupling SAR-derived flood data with hydrological, topographic, and climate models to enhance predictions of flood scenarios under changing environmental conditions. The use of multivariate machine learning algorithms is also encouraged to increase the classification accuracy of seasonally flooded wetlands and improve the detection of ephemeral flood patterns.
The maps demonstrate that the Sentinel-1 backscattering in VV polarization was approximately 13 dB (decibels) higher in the flooded area than in the open water. Therefore, this polarization is useful for distinguishing between open water, flooded areas, and dry areas [64]. The lower backscattering in VV for open water, at least 10 dB lower than all classes of flooded vegetation, makes it the preferred image for mapping open water. The C-band in VH polarization is not useful for distinguishing open water from flooded pasture and submerged vegetation [65].
Therefore, the C-band in VV and VH is useful for separating flooded areas with different types of vegetation. However, VH polarization is more effective than VV in discriminating between vegetation and flooded pasture because the difference between vegetation and flooded pasture is greater in VH (at least 10 dB) than in VV (~5 dB). Additionally, both VV and VH polarizations can be beneficial for differentiating submerged vegetation from dense and sparse vegetation (VH submerged = 10 dB and VV submerged-emergent = 10 dB) [66].
The use of SAR data is a promising approach to answer questions and investigate the hydrological dynamics of flooded environments. The use of the Sentinel-1 SAR image series is a valuable option for flood mapping in areas with large water flow, such as the Pantanal. However, it is important to be aware of the challenges associated with this type of analysis. Speckle noise is a common problem in SAR images, resulting in spots and scatterings that make flood detection difficult, especially in areas with narrow channels in floodplains. Another limitation is that Sentinel-1 backscatter alone is less suitable for detailed identification of plant types or vegetation communities.
However, the applicability of this approach to other hydrological environments is promising, especially for large floodplain wetlands, seasonally inundated lowlands, and cloud-prone tropical and subtropical systems where optical remote sensing is frequently constrained during peak flood periods. However, its transferability should be evaluated carefully because SAR responses may vary according to hydroperiod, vegetation structure, water depth, sediment load, surface roughness, topography, and hydrological connectivity. Therefore, the extension of this method to other wetland systems requires local calibration, adjustment of classification parameters, and validation using field observations and hydrological data to ensure reliable flood detection under different environmental conditions.
Despite such limitations, the integration of SAR (e.g., Sentinel-1) with optical sensors (e.g., Sentinel-2, PlanetScope) and land use/land cover products (e.g., MapBiomas) can provide a more complete picture of hydrological dynamics. These multi-source approaches allow for distinguishing between natural flooding patterns and anthropogenic interventions, improving ecosystem assessments.
5. Conclusions
The Sentinel-1 classification achieved an overall accuracy of 97.70% and revealed seasonal variation in flood extent within the study area, with flooded areas ranging from 831.13 ha (0.77%) in February to 86,433.10 ha (79.96%) in April. These results demonstrate the strong potential of Sentinel-1 SAR data for capturing the spatial and temporal dynamics of flooding in the northern Pantanal at relatively fine spatial resolution.
Compared with previous approaches linked with large spatial resolution products, such as MODIS, Sentinel-1 provides important advantages for wetland flood monitoring and mapping, particularly due to its 10 m spatial resolution, regular temporal resolution, and ability to acquire data independently of cloud cover. This made it possible to monitor flood expansion and contraction during different hydrological phases and to identify distinct inundation patterns influenced by both local rainfall and river discharge. The results, therefore, provide a clearer understanding of seasonal hydrological behavior in the Ramsar SESC Pantanal site.
The spatial detail derived from Sentinel-1 also allowed the identification of important landscape features associated with flooding, including both natural floodplain structures and anthropogenic channels that influence water distribution. In addition, the comparison with other data sources, such as MapBiomas, showed a generally consistent flooding pattern, reinforcing the value of combining multiple datasets for wetland monitoring and interpretation.
Overall, this study confirms that Sentinel-1 SAR imagery is a reliable and valuable tool for distinguishing open water, flooded areas, and dry surfaces in a complex tropical wetland environment. Beyond its contribution to the understanding of flood dynamics in the Pantanal, the approach provides a useful basis for strengthening hydrological monitoring, supporting adaptive wetland management, and improving decision-making in Ramsar sites and other biodiversity conservation areas. Its application may also be extended to other large floodplain wetlands, especially in regions where persistent cloud cover limits the effectiveness of optical remote sensing.
Author Contributions
Conceptualization, E.J.M. and C.N.d.C.; methodology, E.J.M. and C.N.d.C.; software, E.J.M.; validation, C.N.d.C., P.G. and E.J.M.; formal analysis, E.J.M.; investigation, E.J.M.; data curation, E.J.M.; writing—original draft preparation, E.J.M.; writing—review and editing, E.J.M., C.N.d.C. and P.G.; visualization, C.N.d.C. and P.G.; supervision, C.N.d.C.; project administration, E.J.M.; funding acquisition, E.J.M. All authors have read and agreed to the published version of the manuscript.
Funding
This research was funded by the Coordenação de Aperfeiçoamento de Pessoal de Nível Superior “Capes” through a partnership with GCUB-OAS-PAEC for researcher mobility in ecology and biodiversity conservation at the Federal University of Mato-Grosso, grant number [8887.495657/2020-00].
Data Availability Statement
The original contributions presented in this study are included in this article. Further inquiries can be directed to the corresponding author.
Acknowledgments
This work was conducted during my doctor of philosophy (Ph.D.) degree study in Ecology and Biodiversity Conservation at the Federal University of Mato-Grosso—UFMT. Funding was provided by the Coordenação de Aperfeiçoamento de Pessoal de Nível Superior “Capes”, through a partnership between GCUB-OAS-PAEC, for researcher mobility. The authors want to thank INAU—CPP (Instituto Nacional de Ciência e Tecnologia em Áreas Úmidas) for their assistance and material support.
Conflicts of Interest
The authors declare that they have no known competing financial interests or personal relationships that could have appeared to influence the work reported in this paper.
References
- Junk, W.J.; Bayley, P.B.; Sparks, R.E. The Flood Pulse Concept in River-Floodplain Systems. Can. J. Fish. Aquat. Sci. 1989, 106, 110–127. [Google Scholar]
- Mitsch, W.J.; Bernal, B.; Hernandez, M.E. Ecosystem Services of Wetlands. Int. J. Biodivers. Sci. Ecosyst. Serv. Manag. 2015, 11, 1006250. [Google Scholar] [CrossRef] [Scilit]
- Richardson, C.J. Ecological Functions and Human Values in Wetlands: A Framework for Assessing Forestry Impacts. Wetlands 1994, 14, 1–9. [Google Scholar] [CrossRef] [Scilit]
- de Groot, D.; Brander, L.; Max Finlayson, C. Wetland Ecosystem Services. In The Wetland Book: I: Structure and Function, Management, and Methods; Springer: Dordrecht, The Netherlands, 2018; pp. 323–333. [Google Scholar] [CrossRef] [Scilit]
- Finlayson, C.M.; Rebecca D’Cruz, N.D. Millennium Ecosystem Assessment, 2005. Ecosystems and Human Well-Being: Wetlands and Water Synthesis; World Resources Institute: Washington, DC, USA, 2005; ISBN 1-56973-597-2. [Google Scholar]
- Rodriguez, I.D.V. The Ramsar Convention and Waterbirds in the Neotropics. Ornitol. Neotrop. 2004, 15, 445–454. [Google Scholar]
- Costanza, R.; de Groot, R.; Sutton, P.; van der Ploeg, S.; Anderson, S.J.; Kubiszewski, I.; Farber, S.; Turner, R.K. Changes in the Global Value of Ecosystem Services. Glob. Environ. Change 2014, 26, 152–158. [Google Scholar] [CrossRef] [Scilit]
- Tockner, K.; Stanford, J.A. Riverine Flood Plains: Present State and Future Trends. Environ. Conserv. 2002, 29, 308–330. [Google Scholar] [CrossRef] [Scilit]
- Hale, B.W.; Adams, M.S. Ecosystem Management and the Conservation of River–Floodplain Systems. Landsc. Urban Plan. 2007, 80, 23–33. [Google Scholar] [CrossRef] [Scilit]
- Ozesmi, S.L.; Bauer, M.E. Satellite Remote Sensing of Wetlands. Wetl. Ecol. Manag. 2002, 10, 381–402. [Google Scholar] [CrossRef] [Scilit]
- Tiner, R.W.; Lang, M.W.; Klemas, V.V. (Eds.) Remote Sensing of Wetlands; CRC Press Taylor & Francis Group: Boca Raton, FL, USA, 1982; Volume 1, ISBN 9781482237382. [Google Scholar]
- Feyisa, G.L.; Meilby, H.; Fensholt, R.; Proud, S.R. Automated Water Extraction Index: A New Technique for Surface Water Mapping Using Landsat Imagery. Remote Sens. Environ. 2014, 140, 23–35. [Google Scholar] [CrossRef] [Scilit]
- Evans, T.L.; Costa, M.; Tomas, W.M.; Camilo, A.R. Large-Scale Habitat Mapping of the Brazilian Pantanal Wetland: A Synthetic Aperture Radar Approach. Remote Sens. Environ. 2014, 155, 89–108. [Google Scholar] [CrossRef] [Scilit]
- Guo, M.; Li, J.; Sheng, C.; Xu, J.; Wu, L. A Review of Wetland Remote Sensing. Sensors 2017, 17, 777. [Google Scholar] [CrossRef] [Scilit]
- Milien, E.J.; Nunes, G.M.; Pierre, G.; Hamilton, S.K.; Da Cunha, C.N. Hydrological Dynamics of the Pantanal, a Large Tropical Floodplain in Brazil, Revealed by Analysis of Sentinel-2 Satellite Imagery. Water 2023, 15, 2180. [Google Scholar] [CrossRef] [Scilit]
- Dettmering, D.; Schwatke, C.; Boergens, E.; Seitz, F. Potential of ENVISAT Radar Altimetry for Water Level Monitoring in the Pantanal Wetland. Remote Sens. 2016, 8, 596. [Google Scholar] [CrossRef] [Scilit]
- Mahdavi, S.; Salehi, B.; Granger, J.; Amani, M.; Brisco, B.; Huang, W. Remote Sensing for Wetland Classification: A Comprehensive Review. GISci. Remote Sens. 2018, 55, 623–658. [Google Scholar] [CrossRef] [Scilit]
- Joshi, N.; Baumann, M.; Ehammer, A.; Fensholt, R.; Grogan, K.; Hostert, P.; Jepsen, M.; Kuemmerle, T.; Meyfroidt, P.; Mitchard, E.; et al. A Review of the Application of Optical and Radar Remote Sensing Data Fusion to Land Use Mapping and Monitoring. Remote Sens. 2016, 8, 70. [Google Scholar] [CrossRef] [Scilit]
- Shen, X.; Wang, D.; Mao, K.; Anagnostou, E.; Hong, Y. Inundation Extent Mapping by Synthetic Aperture Radar: A Review. Remote Sens. 2019, 11, 879. [Google Scholar] [CrossRef] [Scilit]
- Amitrano, D.; Di Martino, G.; Di Simone, A.; Imperatore, P. Flood Detection with SAR: A Review of Techniques and Datasets. Remote Sens. 2024, 16, 656. [Google Scholar] [CrossRef] [Scilit]
- Zhang, M.; Lin, H. Wetland Classification Using Parcel-Level Ensemble Algorithm Based on Gaofen-6 Multispectral Imagery and Sentinel-1 Dataset. J. Hydrol. 2022, 606, 127462. [Google Scholar] [CrossRef] [Scilit]
- Carreño Conde, F.; De Mata Muñoz, M. Flood Monitoring Based on the Study of Sentinel-1 SAR Images: The Ebro River Case Study. Water 2019, 11, 2454. [Google Scholar] [CrossRef] [Scilit]
- Rana, V.K.; Suryanarayana, T.M. Evaluation of SAR Speckle Filter Technique for Inundation Mapping. Remote Sens. Appl. Soc. Environ. 2019, 16, 100271. [Google Scholar] [CrossRef] [Scilit]
- Lang, F.; Zhu, Y.; Zhao, J.; Hu, X.; Shi, H.; Zheng, N.; Zha, J. Flood Mapping of Synthetic Aperture Radar (SAR) Imagery Based on Semi-Automatic Thresholding and Change Detection. Remote Sens. 2024, 16, 2763. [Google Scholar] [CrossRef] [Scilit]
- Dasgupta, A.; Grimaldi, S.; Ramsankaran, R.; Pauwels, V.R.N.; Walker, J.P.; Chini, M.; Hostache, R.; Matgen, P. Flood Mapping Using Synthetic Aperture Radar Sensors From Local to Global Scales. Glob. Flood Hazard Appl. Model. Mapp. Forecast. 2018, 55–77. [Google Scholar] [CrossRef] [Scilit]
- Girard, P.; Fantin-Cruz, I.; de Oliveira, S.M.L.; Hamilton, S.K. Small-Scale Spatial Variation of Inundation Dynamics in a Floodplain of the Pantanal (Brazil). Hydrobiologia 2010, 638, 223–233. [Google Scholar] [CrossRef] [Scilit]
- Pupim, F.D.N. Geomorfologia e Paleo-Hidrologia dos Megaleques dos Rios Cuiabá e São Lourenço, Quaternário da Bacia do Pantanal; Universidade Estadual Paulista: Rio Claro, Brazil, 2014. [Google Scholar]
- da Cunha, C.N.; Junk, W.J.; Fiuza, A.G.; Bononi, J.; de Arruda, E.C. Sítio Ransar|Sesc Pantanal; Cuiabá, Brazil, 2019; Available online: https://lac.wetlands.org/wp-content/uploads/sites/2/2020/01/20191023_Sitio-Ramsar_Sesc-Pantanal.pdf (accessed on 23 October 2023).
- Da Silva, C.J.; Girard, P. New Challenges in the Management of the Brazilian Pantanal and Catchment Area. Wetl. Ecol. Manag. 2005, 12, 553–561. [Google Scholar] [CrossRef] [Scilit]
- Chen, X.; Chen, L.; Stone, M.C.; Acharya, K. Assessing Connectivity between the River Channel and Floodplains during High Flows Using Hydrodynamic Modeling and Particle Tracking Analysis. J. Hydrol. 2020, 583, 124609. [Google Scholar] [CrossRef] [Scilit]
- Corradini, F.A.; Assine, M.L. Compartimentação Geomorfológica e Processos Deposicionais No Megaleque Fluvial Do Rio São Lourenço, Pantanal Mato-Grossense. Rev. Bras. Geocienc. 2012, 42, 20–33. [Google Scholar] [CrossRef] [Scilit]
- Zanaga, D.; Van De Kerchove, R.; De Keersmaecker, W.; Souverijns, N.; Brockmann, C.; Quast, R.; Wevers, J.; Grosu, A.; Paccini, A.; Vergnaud, S.; et al. ESA WorldCover 10 m 2020 V100. Meteosat Second. Gener. Evapotranspiration 2021, 1–27. [Google Scholar] [CrossRef]
- Lee, J. Refined Filtering of Image Noise Using Local Statistics. Comput. Graph. Image Process. 1981, 15, 380–389. [Google Scholar] [CrossRef] [Scilit]
- Geudtner, D.; Torres, R.; Snoeij, P.; Davidson, M.; Rommen, B. Sentinel-1 System Capabilities and Applications. Int. Geosci. Remote Sens. Symp. 2014, 1457–1460. [Google Scholar] [CrossRef] [Scilit]
- Dhanabalan, S.P.; Rahaman, S.A.; Jegankumar, R. Flood Monitoring Using Sentinel-1 Sar Data: A Case Study Based on an Event of 2018 and 2019 Southern Part of Kerala. Int. Arch. Photogramm. Remote Sens. Spat. Inf. Sci.—ISPRS Arch. 2021, 44, 37–41. [Google Scholar] [CrossRef] [Scilit]
- Brisco, B. Remote Sensing of Wetlands: Applications and Advances; CRC Press: Boca Raton, FL, USA, 2015. [Google Scholar]
- Mullissa, A.; Vollrath, A.; Odongo-Braun, C.; Slagter, B.; Balling, J.; Gou, Y.; Gorelick, N.; Reiche, J. Sentinel-1 Sar Backscatter Analysis Ready Data Preparation in Google Earth Engine. Remote Sens. 2021, 13, 1954. [Google Scholar] [CrossRef] [Scilit]
- Slagter, B.; Tsendbazar, N.E.; Vollrath, A.; Reiche, J. Mapping Wetland Characteristics Using Temporally Dense Sentinel-1 and Sentinel-2 Data: A Case Study in the St. Lucia Wetlands, South Africa. Int. J. Appl. Earth Obs. Geoinf. 2020, 86, 102009. [Google Scholar] [CrossRef] [Scilit]
- Meyer, F. CHAPTER 2—Spaceborne Synthetic Aperture Radar–Principles, Data Access, and Basic Processing Techniques. In SAR Handbook; NASA: Washington, DC, USA, 2019. [Google Scholar] [CrossRef]
- Veloso, A.; Mermoz, S.; Bouvet, A.; Le Toan, T.; Planells, M.; Dejoux, J.F.; Ceschia, E. Understanding the Temporal Behavior of Crops Using Sentinel-1 and Sentinel-2-like Data for Agricultural Applications. Remote Sens. Environ. 2017, 199, 415–426. [Google Scholar] [CrossRef] [Scilit]
- Twele, A.; Cao, W.; Plank, S.; Martinis, S. Sentinel-1-Based Flood Mapping: A Fully Automated Processing Chain. Int. J. Remote Sens. 2016, 37, 2990–3004. [Google Scholar] [CrossRef] [Scilit]
- Lopes, A.; Nezry, E.; Touzi, R.; Laur, H. Maximum a Posteriori Speckle Filtering and First Order Texture Models in SAR Images. Dig.—Int. Geosci. Remote Sens. Symp. 1990, 3, 2409–2412. [Google Scholar] [CrossRef] [Scilit]
- Lee, J. Sen Polarimetric SAR Speckle Filtering and Its Implication for Classification. IEEE Trans. Geosci. Remote Sens. 1999, 37, 2363–2373. [Google Scholar] [CrossRef] [Scilit]
- Lee, J.S.; Wen, J.H.; Ainsworth, T.L.; Chen, K.S.; Chen, A.J. Improved Sigma Filter for Speckle Filtering of SAR Imagery. IEEE Trans. Geosci. Remote Sens. 2009, 47, 202–213. [Google Scholar] [CrossRef] [Scilit]
- Small, D. Flattening Gamma: Radiometric Terrain Correction for SAR Imagery. IEEE Trans. Geosci. Remote Sens. 2011, 49, 3081–3093. [Google Scholar] [CrossRef] [Scilit]
- Flores-Anderson, A.I.; Parache, H.B.; Martin-Arias, V.; Jiménez, S.A.; Herndon, K.; Mehlich, S.; Meyer, F.J.; Agarwal, S.; Ilyushchenko, S.; Agarwal, M.; et al. Evaluating SAR Radiometric Terrain Correction Products: Analysis-Ready Data for Users. Remote Sens. 2023, 15, 5110. [Google Scholar] [CrossRef] [Scilit]
- Evans, T.L.; Costa, M.; Telmer, K.; Silva, T.S.F. Using ALOS/PALSAR and RADARSAT-2 to Map Land Cover and Seasonal Inundation in the Brazilian Pantanal. IEEE J. Sel. Top. Appl. Earth Obs. Remote Sens. 2010, 3, 560–575. [Google Scholar] [CrossRef] [Scilit]
- Chini, M.; Hostache, R.; Giustarini, L.; Matgen, P. A Hierarchical Split-Based Approach for Parametric Thresholding of SAR Images: Flood Inundation as a Test Case. IEEE Trans. Geosci. Remote Sens. 2017, 55, 6975–6988. [Google Scholar] [CrossRef] [Scilit]
- Otsu, N. A Threshold Selection Method from Gray-Level Histograms. IEEE Trans. Syst. Man Cybern. 1996, 9, 62–66. [Google Scholar] [CrossRef] [Scilit]
- Kumar, A.K.; Kumar, A.K.; Guo, S. Two Viewpoints Based Real-Time Recognition for Hand Gestures. IET Image Process. 2020, 14, 4606–4613. [Google Scholar] [CrossRef] [Scilit]
- Thielen, D.; Schuchmann, K.L.; Ramoni-Perazzi, P.; Marquez, M.; Rojas, W.; Quintero, J.I.; Marques, M.I. Quo Vadis Pantanal? Expected Precipitation Extremes and Drought Dynamics from Changing Sea Surface Temperature. PLoS ONE 2020, 15, e0227437. [Google Scholar] [CrossRef] [Scilit]
- Girard, P. Hydrology of Surface and Groundwaters in the Pantanal Floodplains. In The Pantanal: Ecology, Biodiversity and Sustainable Management of a Large Neotropical Seasonal Wetland; Pensoft Publishers: Sofia, Bulgaria, 2011; pp. 103–126. ISBN 978-954-642-493-8. [Google Scholar]
- Padovani, C.R. Dinâmica Espaço-Temporal Das Inundações Do Pantanal. Esc. Super. Agric. Luiz Queiroz Cent. Energ. Nucl. Na Agric. 2010, 174. [Google Scholar] [CrossRef] [Scilit]
- da Paz, A.R.; Collischonn, W.; Tucci, C.E.M.; Padovani, C.R. Large-Scale Modelling of Channel Flow and Floodplain Inundation Dynamics and Its Application to the Pantanal (Brazil). Hydrol. Process. 2011, 25, 1498–1516. [Google Scholar] [CrossRef] [Scilit]
- Márcia, E.; De Moraes, L.; Clemente, C.; Barbosa, F.; Melack, J.M.; De Freitas, R.M.; Titonelli, F.; Shimabukuro, Y.; de Observação, C. Comparing MODIS and ETM + image data for inland water studies: Spatial resolution constraints Comparação de Imagens MODIS e ETM Para Estudo de Águas Interiores: Imposições Da Resolução Espacial Instituto Nacional de Pesquisas Espaciais University of Cal. Terra 2006, 109–118. [Google Scholar]
- Dao, P.D.; Mong, N.T.; Chan, H.P. Landsat-MODIS Image Fusion and Object-Based Image Analysis for Observing Flood Inundation in a Heterogeneous Vegetated Scene. GISci. Remote Sens. 2019, 56, 1148–1169. [Google Scholar] [CrossRef] [Scilit]
- Huth, J.; Gessner, U.; Klein, I.; Yesou, H.; Lai, X.; Oppelt, N.; Kuenzer, C. Analyzing Water Dynamics Based on Sentinel-1 Time Series-a Study for Dongting Lakewetlands in China. Remote Sens. 2020, 12, 1761. [Google Scholar] [CrossRef] [Scilit]
- Nunes da Cunha, C.; Piedade, M.T.F.; Junk, W.J. Classificação e Delineamento Das Áreas Úmidas Brasileiras e de Seus Macrohabitats; EdUFMT: Cuiabá, Brazil, 2015; Volume 1, ISBN 9788578110796. [Google Scholar]
- Marengo, J.A.; Alves, L.M.; Torres, R.R. Regional Climate Change Scenarios in the Brazilian Pantanal Watershed. Clim. Res. 2016, 68, 201–213. [Google Scholar] [CrossRef] [Scilit]
- Marengo, J.A.; Cunha, A.P.; Cuartas, L.A.; Deusdará Leal, K.R.; Broedel, E.; Seluchi, M.E.; Michelin, C.M.; De Praga Baião, C.F.; Chuchón Ângulo, E.; Almeida, E.K.; et al. Extreme Drought in the Brazilian Pantanal in 2019–2020: Characterization, Causes, and Impacts. Front. Water 2021, 3, 639204. [Google Scholar] [CrossRef] [Scilit]
- Leal Filho, W.; Azeiteiro, U.M.; Salvia, A.L.; Fritzen, B.; Libonati, R. Fire in Paradise: Why the Pantanal Is Burning. Environ. Sci. Policy 2021, 123, 31–34. [Google Scholar] [CrossRef] [Scilit]
- de Magalhães Neto, N.; Evangelista, H. Human Activity Behind the Unprecedented 2020 Wildfire in Brazilian Wetlands (Pantanal). Front. Environ. Sci. 2022, 10, 888578. [Google Scholar] [CrossRef] [Scilit]
- Catia Núnes da Cunha, W.J.J. Year-To-Year Changes in Water Level Drive the Invasion of Vochysia Divergens-103. Appl. Veg. Sci. 2004, 7, 103–110. [Google Scholar]
- Huang, M.; Jin, S. Backscatter Characteristics Analysis for Flood Mapping Using Multi-Temporal Sentinel-1 Images. Remote Sens. 2022, 14, 3838. [Google Scholar] [CrossRef] [Scilit]
- de Almeida Furtado, L.F.; Silva, T.S.F.; Novo, E.M.L.d.M. Dual-Season and Full-Polarimetric C Band SAR Assessment for Vegetation Mapping in the Amazon Várzea Wetlands. Remote Sens. Environ. 2016, 174, 212–222. [Google Scholar] [CrossRef] [Scilit]
- Tuan, V.A.; Quang, N.H.; Hang, L.T.T. Optimizing Flood Mapping Using Multi-Synthetic Aperture Radar Images for Regions of the Lower Mekong Basin in Vietnam. Eur. J. Remote Sens. 2021, 54, 13–28. [Google Scholar] [CrossRef] [Scilit]

Disclaimer/Publisher’s Note: The statements, opinions and data contained in all publications are solely those of the individual author(s) and contributor(s) and not of MDPI and/or the editor(s). MDPI and/or the editor(s) disclaim responsibility for any injury to people or property resulting from any ideas, methods, instructions or products referred to in the content. |
© 2026 by the authors. Licensee MDPI, Basel, Switzerland. This article is an open access article distributed under the terms and conditions of the Creative Commons Attribution (CC BY) license.