


Abstract
Urban flood resilience is an important indicator for measuring a city’s capacity to respond to and recover from flood disasters. However, existing assessments often lack a long-term hydrological baseline. This study establishes the historical water system of Yuan Dadu (1267–1368 CE) as a control scenario to benchmark the flood resilience of modern Beijing. By integrating a historical geographic reconstruction with a hydrological–hydrodynamic simulation and the fuzzy analytic hierarchy process (FAHP), the research quantifies structural differences in resilience profiles between the nature-adapted historical system and the modern engineering-dominated system. The results indicate that Yuan Dadu’s urban flood resilience index (UFRI) is 3.44 and modern Beijing’s is 3.28. Despite modern Beijing’s significant advantage in drainage facility density (0.61 km/km2) and emergency management, the system exhibits a functional substitution failure, where gray infrastructure has failed to fully compensate for a 26% reduction in the unit area storage capacity (from 6.4 to 4.7 × 10⁴ m3/km2) and a 48.4% decline in the water system structural complexity. The findings indicate that, in rapidly urbanized cities on alluvial plains with high impervious coverage, expanding drainage networks alone may be insufficient to offset losses in a natural hydraulic buffering capacity. Accordingly, planning strategies are proposed that integrate distributed micro-storage and restore topological connectivity to recreate system-level hydraulic buffering functions.
1. Introduction
Under the dual pressures of global climate change and rapid urbanization, urban flooding has evolved from an occasional hazard into a systemic risk threatening sustainable development. According to the United Nations Office for Disaster Risk Reduction (UNDRR), direct global economic losses from urban flooding exceeded $500 billion between 2000 and 2020 [1]. In China, the frequency of extreme precipitation has tested traditional flood control systems [2]. Despite the continuous expansion of gray infrastructure (drainage pipes and pumping stations), many megacities continue to suffer from severe urban flooding. This suggests that the engineering-based approach may have hit a resilience ceiling.
The concept of urban flood resilience originated from the field of ecology and has evolved over several decades into a relatively comprehensive theoretical framework [3]. Holling [4] first introduced the concept of ecological resilience, emphasizing a system’s ability to absorb disturbances while maintaining its functions. Walker et al. [5] defined resilience as the capacity of a system to maintain its fundamental functions and structures after experiencing disturbances. In the field of urban flooding, Liao [6] proposed the resilience concept of “living with floods,” emphasizing cities’ ability to adapt and learn. Bruneau et al. [7] developed the “4R” resilience assessment framework—robustness, redundancy, resourcefulness, and rapidity—based on critical infrastructure, emphasizing resistance capacity and rapid recovery. In recent years, social–ecological system resilience has become a research hotspot. Folke [8] emphasized the coupling relationship between social and ecological systems and proposed the adaptive cycle theory. Building on this, Kotzee and Reyers [9] constructed a “social–ecological–engineering” triple resilience framework, emphasizing system integrity and dynamic adaptability. Cutter et al. [10] proposed the DROP model, incorporating institutional, social, economic, and infrastructural dimensions into a comprehensive community disaster resilience assessment framework. Nature-based solutions (NbS) have provided new approaches for enhancing urban flood resilience. Cohen-Shacham et al. [11] systematically elaborated the theoretical foundation and practical applications of NbS. In China, sponge city construction has become an important practice of NbS. Chan et al. [12] investigated the mechanisms by which sponge city construction enhances urban resilience. Li et al. [13] evaluated 30 sponge city pilot projects and found that green infrastructure can significantly enhance urban flood regulation capacity.
China has historically placed great emphasis on urban flood prevention, forming a unique systematic ideology [14]. From site selection in the pre-Qin period to urban flood control systems in the Sui and Tang dynasties and urban hydraulic engineering in the Song and Yuan dynasties, rich experience has been accumulated. The urban planning philosophy in the “Rites of Zhou: Records of Examination of Craftsmen” (Zhou Li Kao Gong Ji) and the layout principle of “ancestral temple on the left, altar of land and grain on the right, court in front, market behind” reflect ancient people’s profound understanding of the relationship between cities and nature [15]. Yuan Dadu (1267–1368 CE), as an exemplar of ancient Chinese capital planning, achieved a high level of water system planning. The hydraulic engineering presided over by Guo Shoujing introduced water from the Baifu Spring into the city, constructing a complete urban water network [16]. Since Yuan Dadu and modern Beijing share the exact same geographical location and topography, this historical water system serves as a hydrological baseline, reflecting the region’s inherent flood resilience.
However, existing research on urban flood resilience assessment shares a common structural limitation: they evaluate current system states without reference to a pre-urbanization hydrological baseline. While scholars have reconstructed the water system pattern of Yuan Dadu [17] and analyzed its transformation [18,19], these studies largely remain at the level of qualitative description or engineering technical analysis, stopping short of a quantitative resilience measurement. As a result, it is difficult to isolate the specific contribution of water system degradation from the broader effects of urbanization, such as surface hardening. Without such a baseline, current assessments can describe the symptoms of resilience deficits but cannot diagnose their structural causes.
This study addresses this gap by establishing the historical water system of Yuan Dadu (1267–1368 CE) as a reference condition, against which the flood resilience of modern Beijing is systematically evaluated. By integrating a historical geographic reconstruction, hydrological–hydrodynamic simulation, and the fuzzy analytic hierarchy process (FAHP), this study constructs a cross-temporal urban flood resilience index (UFRI) and quantifies the resilience deficit attributable to water system degradation, providing a diagnostic basis for targeted compensatory planning strategies.
2. Materials and Methods
2.1. Study Area
Beijing, as a megacity with over 800 years of capital history, exhibits a particularly representative evolution of its flood control and drainage system. From Jin Zhongdu to Yuan Dadu, and then to Ming-Qing Beijing, successive rulers placed great emphasis on urban water system construction. The Jishuitan Lake excavated during the Jin Zhongdu period, the Tonghui River system built during the Yuan Dadu period, and the Yuhe water system of the Ming-Qing period all represent outstanding examples of ancient urban hydraulic engineering. Among these, Yuan Dadu (1267–1368 CE) stands as an exemplar of ancient Chinese capital water system planning. Its planning and construction fully considered the flood control and drainage requirements, establishing a complete water network with the Jinshui River and the Tonghui River as the backbone, supplemented by the city moat and Yu River. Through the rational utilization of natural terrain and the establishment of storage lakes, an efficient flood control and drainage system was formed. The relevant historical documents, such as the “Yuan Shi: River and Canal Records”, provide detailed records of water system planning, engineering construction, and management systems. Archeological discoveries and historical maps provide reliable evidence for studying the Yuan Dadu water system. These rich historical materials provide a solid foundation for conducting comparative studies between the ancient and modern periods.
To ensure scientific validity and comparability in the ancient–modern comparison, the delineation of the study area follows the principle of “spatial scope consistency.” We first defined the core study area of modern Beijing, covering the main portions of six central districts: Dongcheng, Xicheng, Chaoyang, Haidian, Fengtai, and Shijingshan. This area not only represents the political, economic, and cultural core of modern Beijing but also completely encompasses the historical site of Yuan Dadu and its main water system influence zone. Through precise calculation using the geographic information system (GIS) software ArcGIS 10.8, the total area of this study region was determined to be 1366 km2. Subsequently, we applied this identical geographic spatial extent as the study area for the Yuan Dadu period, covering the Yuan Dadu city site (bounded by Jiande Gate in the north, Lizheng Gate in the south, Guangxi Gate in the east, and Suqing Gate in the west) and its surrounding core water system influence zone, including upstream water diversion channels (such as the Baifu–Wengshan River) and downstream drainage corridors (such as the Tonghui River). By comparing two urban forms that have undergone approximately 700 years of transformation within the same spatial extent, we can objectively eliminate the influence of geographic location differences and focus on the fundamental impacts of the urbanization processes, the water system planning, and the underlying surface evolution on flood characteristics.
2.2. Urban Flood Resilience Assessment Framework
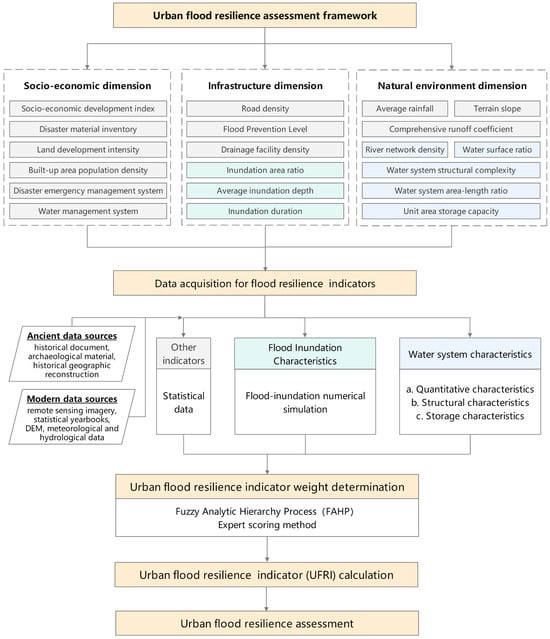
Constructing an urban flood resilience assessment framework that is applicable to an ancient–modern comparison is one of the primary objectives of this study, requiring a special consideration of historical data availability and a cross-temporal indicator of comparability. Based on the urban system resilience theory, the study constructs an assessment system from three dimensions: socio-economic, infrastructure, and natural environment (Figure 1). This reflects the organizational capacity, engineering capacity, and natural regulation capacity of cities in responding to flood disasters.
Figure 1.
The urban flood resilience assessment framework.
The indicator selection follows the principles of systematicity and representativeness proposed by Rözer et al. [20], while incorporating comparability and operability principles based on the characteristics of historical research. The principle of systematicity requires that the indicator system comprehensively captures the multi-dimensional characteristics of urban flood resilience. The comparability principle emphasizes that selected indicators must have substantial meaning in both ancient and modern periods with obtainable corresponding data. The representativeness principle ensures that each indicator can accurately reflect the core characteristics of its dimension. The operability principle requires that the indicator data can be obtained through historical documents, archeological materials, or modern monitoring methods.
The socio-economic dimension indicators were designed with reference to Cutter et al.’s [10] institutional resilience theory and Li et al.’s [13] management capacity assessment methods, including six indicators: the socio-economic development index (SEDI), the disaster material inventory (DMI), the land development intensity, the built-up area population density, the disaster emergency management system (DEMS), and the water management system (WMS). These indicators reflect the economic strength, management level, and social organizational capacity of cities, representing the “soft power” embodiment of urban resilience. The inclusion of land development intensity and population density as negative indicators is informed by Mustafa et al. [21], who demonstrate that urbanization exacerbates flood vulnerability.
The infrastructure dimension of the assessment framework is informed by the multidisciplinary assessment methods and engineering resilience framework proposed by Moghadas et al. [22] and includes indicators such as road density, flood prevention level (FPL), drainage facility density, and inundation characteristics. The first three reflect the engineering capacity of urban flood control and drainage, while the latter three serve as negative indicators, directly representing urban vulnerability under extreme rainfall conditions.
The natural environment dimension of the indicator system is informed by the NbS theory [11] and by the established sponge city assessment frameworks. It includes eight indicators: average rainfall, terrain slope, comprehensive runoff coefficient, river network density, water surface ratio, water system structural complexity, water system area–length ratio, and unit area storage capacity. These indicators comprehensively reflect the natural attributes and regulation capacity of urban water systems. Water system structural complexity is calculated using Equation (1), based on Horton’s law of stream numbers [23] and Rodriguez-Iturbe and Rinaldo’s [24] fractal river network theory, quantifying the hierarchical characteristics of water systems. It should be noted that this metric captures the degree of hierarchical organization but does not distinguish between the networks with identical total lengths and stream orders but different spatial configurations (e.g., dendritic vs. parallel). SC is therefore used as a simplified index, complemented by other indicators for comprehensive characterization.
where represents water system structural complexity; is the number of stream orders; is the total length of all channels (km); and is the length of the main channel (km).
2.3. Data Sources and Calculation Methods
Data acquisition for the Yuan Dadu period represents the main challenge of this study. We employed a multi-source data fusion approach, obtaining the required data through historical document analysis, archeological material compilation, historical geographic reconstruction, and analogical reasoning. The core documentary sources include official histories (Yuan Shi and Yuan Dian Zhang), local gazetteers (Xi Jin Zhi and Ri Xia Jiu Wen Kao), and specialized hydraulic records (Yuan Shi: Records of Rivers and Canals; Tonghui River Chronicles). Archeological evidence includes Yuan Dadu excavation reports, hydraulic site surveys, and physical remains such as city wall foundations and drainage culverts. Each indicator value is traceable to one or more of these sources; full source–indicator linkages and derivation rationale are provided in the Supplementary Materials (Section S9). The data reliability was enhanced through the cross-validation of independent documentaries and archeological sources. The estimated parameters are treated as uncertain inputs in the sensitivity analysis. The spatial data were reconstructed using GIS and used as inputs for flood inundation simulation.
The data for modern Beijing were obtained from remote sensing imagery, statistical yearbooks, 30 m resolution DEM, meteorological and hydrological monitoring data, and relevant planning documents from 2020 to 2023. The land use and water surface ratio data were obtained through remote sensing image interpretation. The socio-economic indicators were extracted from statistical yearbooks. The terrain slope was calculated using DEM data. Additionally, the flood inundation characteristics under extreme rainstorm conditions were assessed using the “Beijing Urban Waterlogging Risk Map (2022 Edition)”. The specific calculation methods for key indicators are provided in the Supplementary Materials.
A resolution disparity exists between the historical reconstruction data and the modern monitoring data. To address the potential uncertainty in the historical parameter estimation, a Monte Carlo simulation method was employed.
2.4. Flood Inundation Numerical Simulation
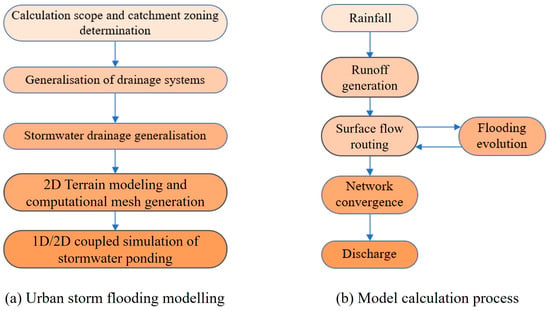
To quantitatively assess the flood inundation characteristics in both periods, different data acquisition methods were employed. For modern Beijing, authoritative data from the “Beijing Urban Waterlogging Risk Map” published by the Beijing Municipal Water Authority were directly adopted. For the Yuan Dadu period, a hydrological–hydrodynamic coupled model was employed for the flood inundation numerical simulation (Figure 2a). The model includes rainfall-runoff, one-dimensional river hydrodynamics, and two-dimensional surface flow modules, enabling a relatively accurate simulation of urban flood generation, convergence, and inundation processes (Figure 2b).
Figure 2.
The hydrological–hydrodynamic coupled model schematic.
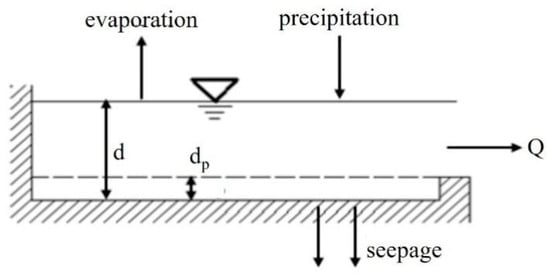
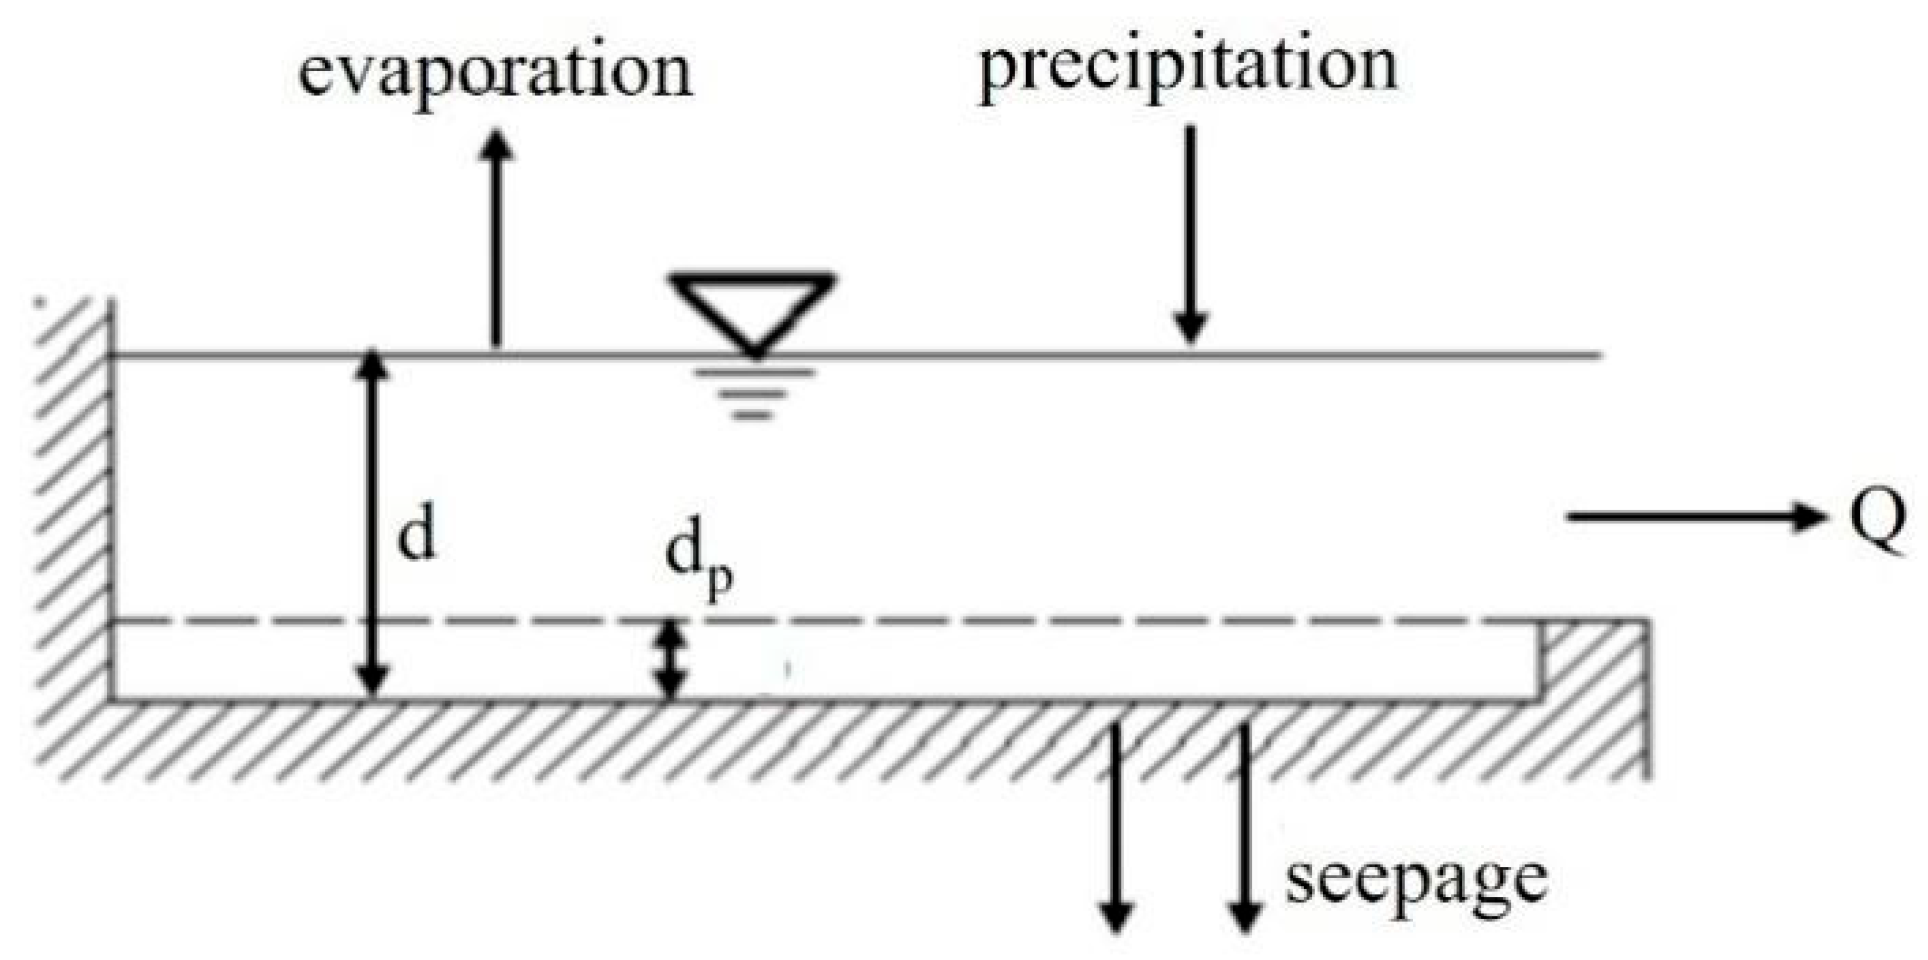
Urban surfaces are classified as either permeable or impermeable. For impermeable surfaces, the runoff coefficient method is used in the model to characterize runoff. For permeable surfaces such as green areas, apart from evapotranspiration, the primary initial loss comes from soil infiltration, for which the Horton infiltration model is used to calculate runoff generation. The non-linear reservoir model (Figure 3) is used for surface routing, and the kinematic wave equations are used to calculate overland flow by simultaneously solving the continuity Equation (2) and the Manning Formula (3).
where is the surface stagnant water volume (m3); is the water depth (m); is the rainfall duration (h); is the surface area (m2); denotes the net rainfall intensity (mm/h); is the outflow rate (m3/s); is the diffusion width of the basin (m); stands for the surface Manning’s coefficient; is the maximum depth of the depression storage (m); and is the average slope of the basin.
Figure 3.
The schematic of a non-linear reservoir model.
The one-dimensional river hydrodynamic module employs the complete Saint-Venant equations to describe the water flow in channels and pipes. For open channel flow in rivers, a one-dimensional unsteady open channel flow model is used. For pressurized flow that may occur in pipes, a pressurized flow model is employed. Through numerical solutions by the dynamic wave method, complex flow regimes such as backwater, reverse flow, and pressurized flow can be accurately simulated.
The two-dimensional surface flow module employs the two-dimensional shallow water equations (Equations (4)–(6)) to simulate urban surface flood propagation processes:
where is the water depth (m); and are the velocity components in the and directions, respectively (m/s); is gravitational acceleration (m/s2); and and are the bottom-slope source term components in the and directions, respectively.
As no observed inundation data exist for the Yuan Dadu period, direct quantitative validation is not possible; the model credibility is established through parameter physical plausibility (Supplementary Materials, Tables S12–S14) and spatial plausibility verification against the terrain-driven accumulation patterns that are documented in Section 3.2.
2.5. Comprehensive Assessment Method
This study employs FAHP to determine indicator weights, which can effectively handle the fuzziness and uncertainty in the evaluation process [25,26]. We invited 15 experts to participate in the indicator importance evaluation, with expert composition including 5 from hydraulic engineering, 4 from urban planning, 3 from historical geography, and 3 from environmental science, ensuring the comprehensiveness and professionalism of the evaluation.
- (1)
- Weight calculation
First, a hierarchical structure model was established, with urban flood resilience as the target layer, the three dimensions (socio-economic, infrastructure, and natural environment) as the criterion layer, and 20 specific indicators as the indicator layer. Then, the judgment matrices were constructed using Saaty’s 1–9 scale method [27], with experts comparing the relative importance of each pair of elements. The judgment matrix takes the form:
where represents the importance of the element relative to the element .
The weight calculation employs the geometric mean method. First, calculate the geometric mean of each row’s elements in the judgment matrix, then perform normalization to obtain the weight vector. The specific calculation formula is:
where is the weight of the indicator ; is the number of indicators; and is the element in the judgment matrix.
To ensure the consistency of the judgments, consistency testing is required. The maximum eigenvalue , consistency index (CI), and consistency ratio (CR) of the judgment matrix are calculated. When CR < 0.1, the matrix can be considered to have satisfactory consistency and passes the consistency test.
where is the random consistency index, which depends on the matrix order .
- (2)
- UFRI Calculation
The weight determination results are as follows: socio-economic dimension (0.227), infrastructure dimension (0.311), and natural environment dimension (0.462). The natural environment dimension receives the highest weight, reflecting the expert consensus that, for urban flood resilience specifically, the natural regulation capacity of water systems (infiltration, storage, and conveyance) represents the most fundamental determinant of flood outcomes. This weighting is consistent with the NbS and sponge city concepts and is supported by the FAHP consistency ratios (all CR < 0.1). Within each dimension, indicator weights reflect their relative importance to flood resilience.
After obtaining indicator values from historical materials or monitoring data, a standardization process is applied to map them onto a 1–5 scoring scale. The negative indicators employ reverse scoring. The specific scoring standards are detailed in the Supplementary Materials. The scoring process employed interval-based assignment rather than linear interpolation to maintain methodological consistency and to reduce subjective judgment in the historical data interpretation.
The UFRI is defined and calculated using the following formula:
where represents the weight of the indicator in dimension ; represents the score of the indicator in dimension ; and is the number of indicators in the dimension .
- (3)
- Sensitivity analysis
To identify key factors influencing urban flood resilience, sensitivity analysis was conducted by perturbing the main indicators by ±20% and observing the resulting change in UFRI. The sensitivity coefficient is calculated as:
where is the sensitivity coefficient of the indicator ; is the change in UFRI; is the change in the indicator ; is the baseline UFRI value; and is the baseline value of the indicator .
3. Results and Discussion
3.1. Water System Characteristics
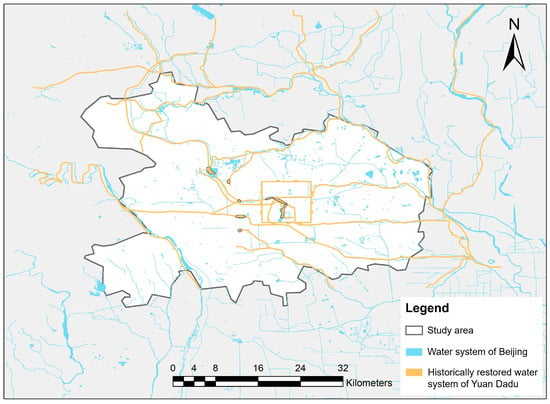
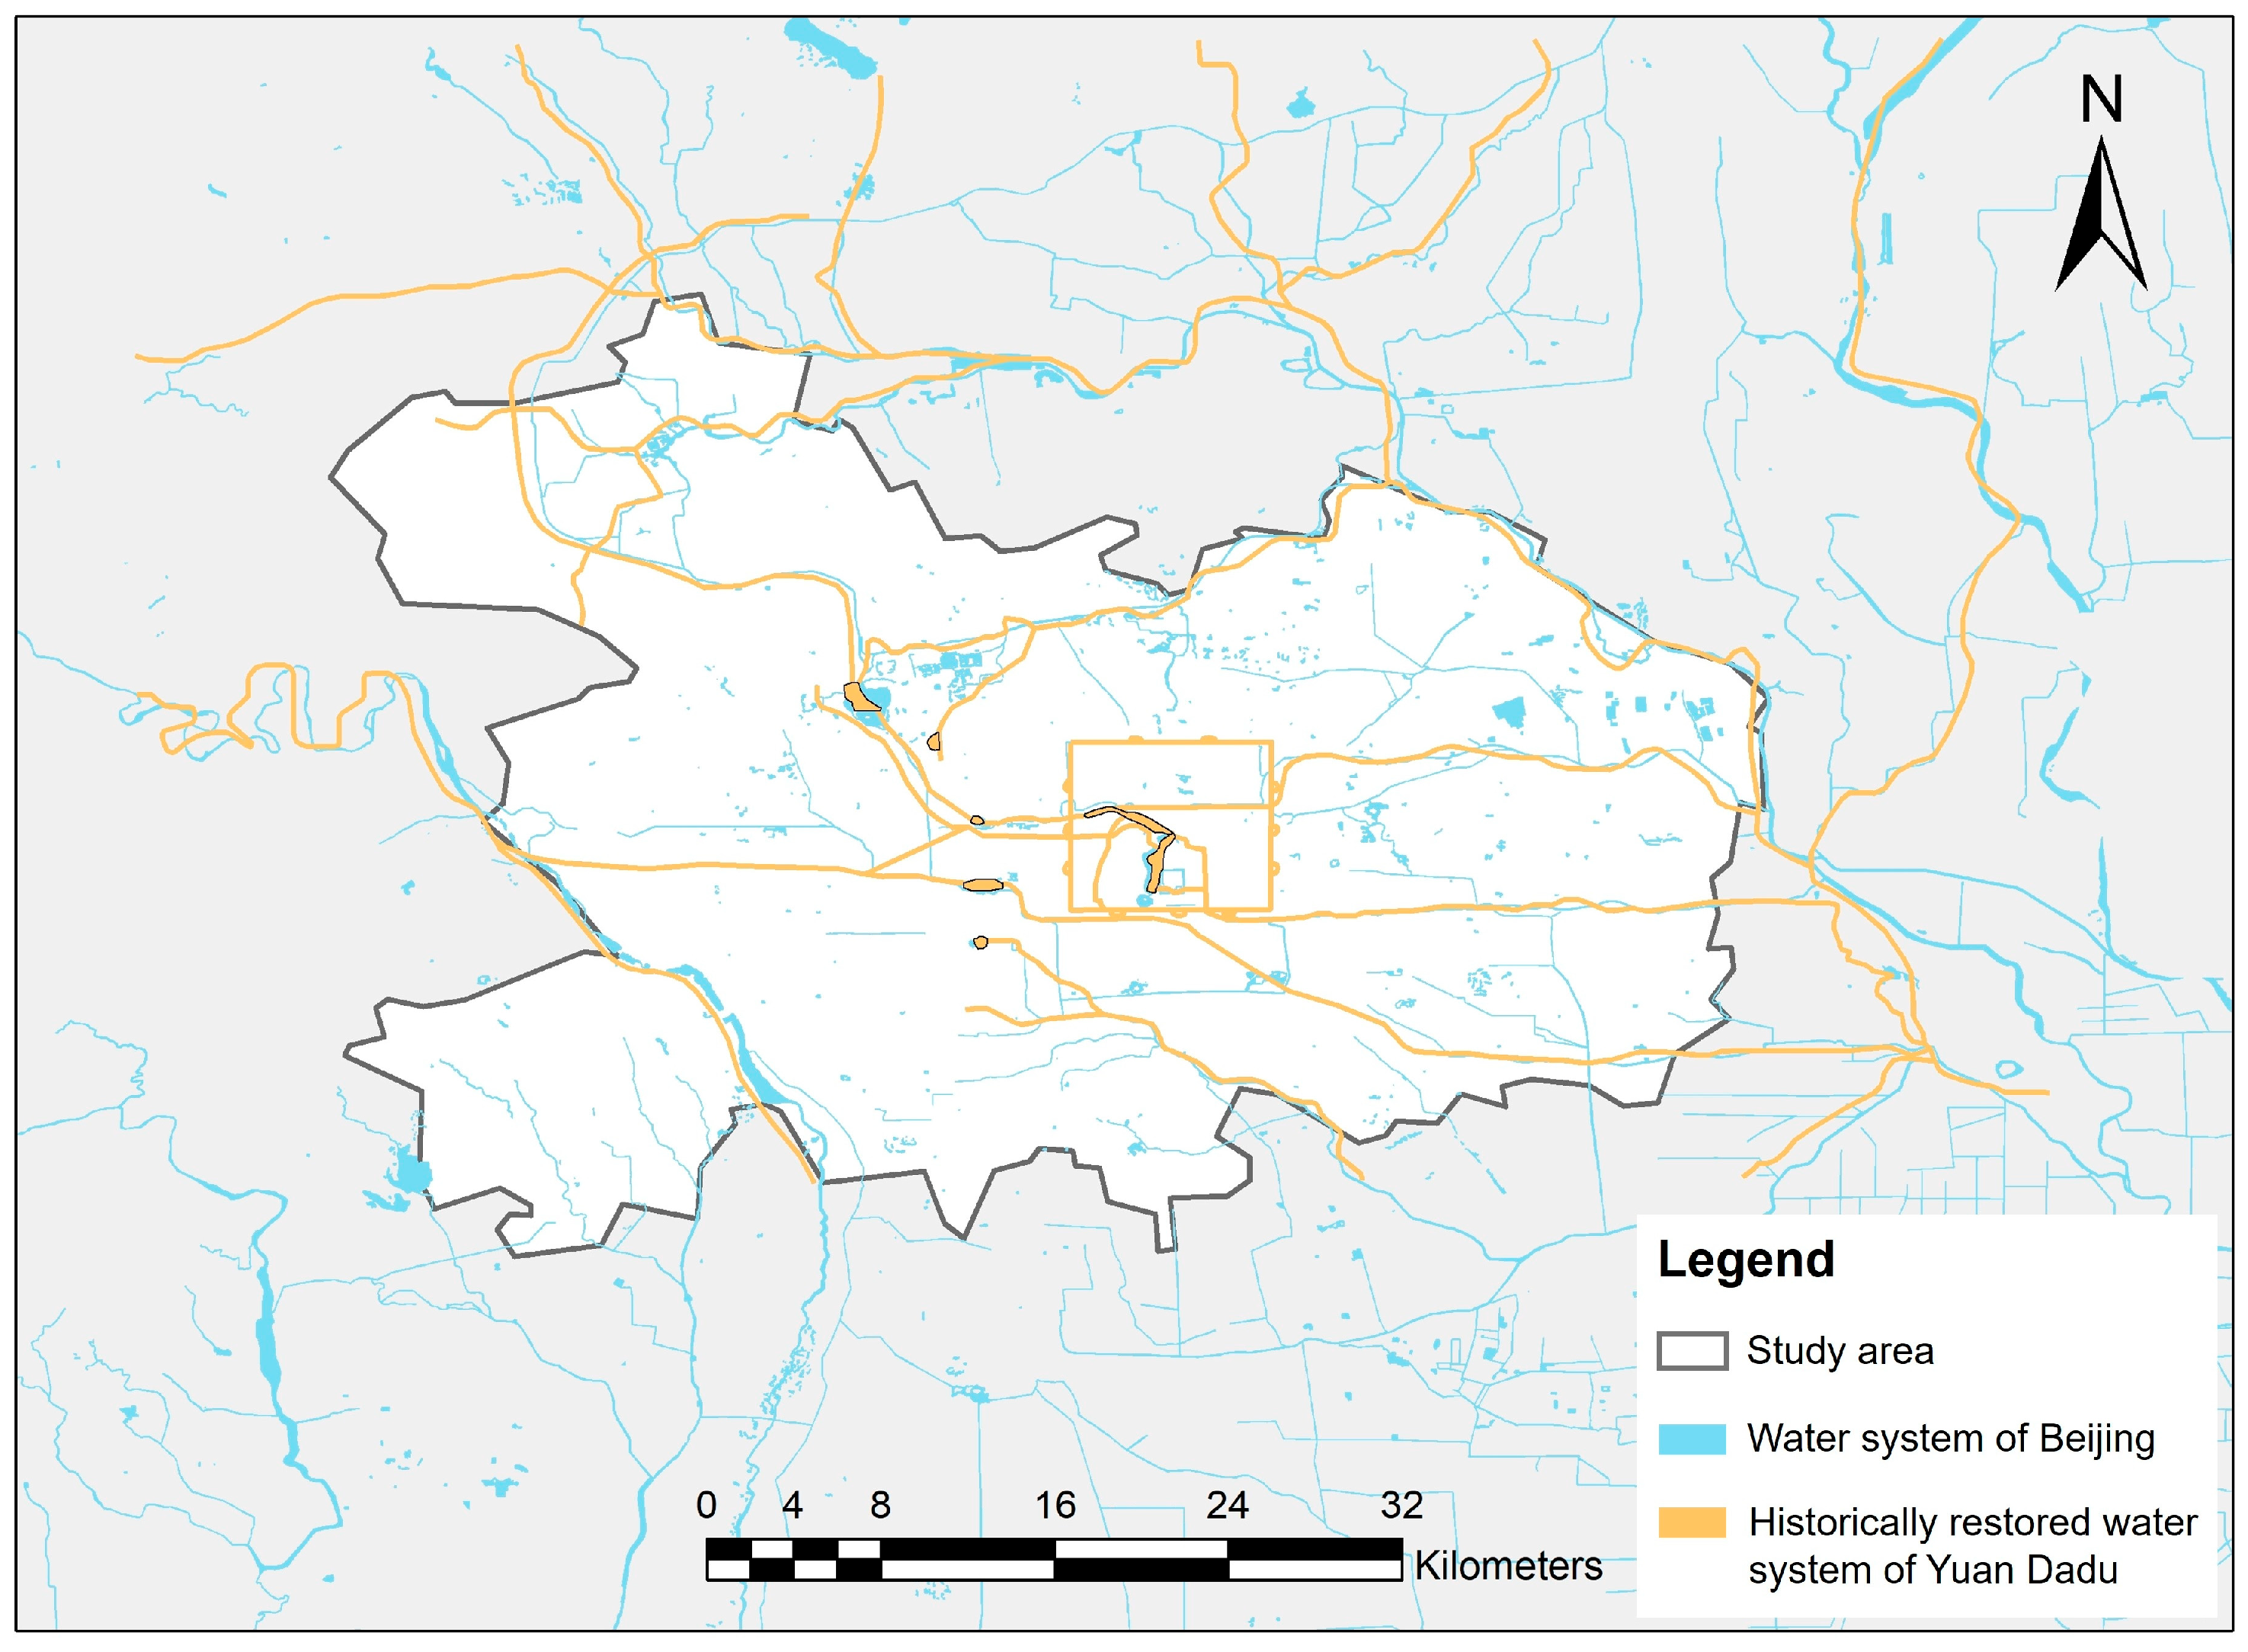
Figure 4 shows the water system spatial distribution in Yuan Dadu and modern Beijing. The assessment results of the water system quantitative characteristics reveal significant differences in the water system spatial patterns between Yuan Dadu and modern Beijing (Table 1). According to estimates, the total river channel length during the Yuan Dadu period was approximately ~728 km, primarily composed of the Yongding River (125 km), the Tonghui River (82 km), the Jinshui River (20 km), and the city moat (29 km), forming a water network that is dominated by natural rivers that are supplemented by artificial channels. Notably, this data employs Horton’s law-based river network estimation method. Beyond the 358 km backbone network recorded in the historical documents, it includes an estimated ~370 km of low-order tributary networks. This estimation method has been validated in Rodriguez-Iturbe and Rinaldo’s [24] fractal river network research, which demonstrated that natural river networks exhibit a high self-similarity with bifurcation ratios typically ranging from three to five.
Figure 4.
The water system spatial distribution in Yuan Dadu and modern Beijing.
Table 1.
The comparison of water system pattern characteristic indicators.
Modern Beijing has a total river channel length of 675 km. While the total length is comparable to the Yuan period, the hydraulic function has fundamentally shifted. The statistics from the Beijing Municipal Water Authority indicate that approximately 60% of modern channels have undergone channelization, replacing natural rivers with concrete-lined conduits. Yuan Dadu’s river network density reached 0.53 km/km2, while modern Beijing’s is 0.49 km/km2. Although the surface difference appears small, considering that modern channels are predominantly hardened drainage conduits, their ecological functions and storage capacity have significantly deteriorated. This finding aligns with Chin’s [28] research conclusions on ecological function degradation caused by urban channel channelization.
A critical divergence is observed in the water surface metrics. The water system area during the Yuan Dadu period reached 28 km2 (water surface ratio 2.0%), whereas modern Beijing’s water system area is 23.2 km2 (1.7%). This reduction is manifested in both quantity and spatial connectivity. Yuan Dadu’s water bodies were dominated by large, contiguous lakes such as the Jishuitan Lake (1.0 km2) and the Wengshanpo Lake (1.6 km2), forming a connected storage network with a unit area storage capacity of 6.4 × 10⁴ m3/km2. In contrast, modern Beijing’s water bodies are fragmented, primarily consisting of small park lakes. Consequently, the unit area storage capacity has declined to 4.7 × 10⁴ m3/km2, a decrease of 26.0% relative to the historical baseline. These figures represent Yuan Dadu’s design capacity at the time of construction and do not distinguish between the passive storage of natural lakes and the operationally constrained storage of modern engineered facilities. This fragmentation disrupts hydraulic connectivity and reduces the system’s capacity to buffer flood peaks.
The structural analysis further quantifies the degradation of the water system’s topology (Table 1). The water system structural complexity during the Yuan Dadu period was 43.6, reflecting a robust hierarchical structure. This high complexity indicates a stable “source–main–tributary” organization, which effectively enhances the system resilience according to Strahler’s river classification theory. Modern Beijing’s structural complexity has declined to 22.5. Despite the construction of extensive engineering facilities, the degradation of the natural river network topology has weakened the system’s inherent hydraulic buffering capacity. The simplification of the network structure increases the reliance on artificial facilities such as pipe networks. Once these facilities overload, the lack of natural water system redundancy exposes the city to higher flood risks.
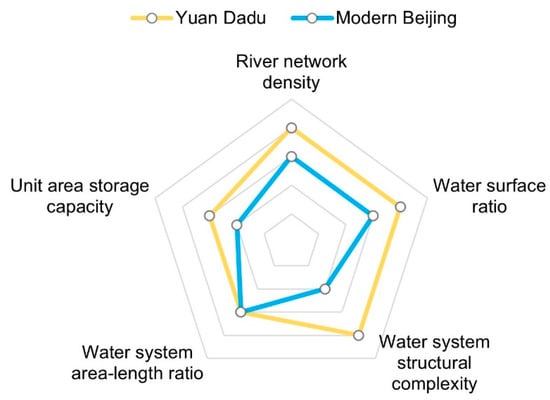
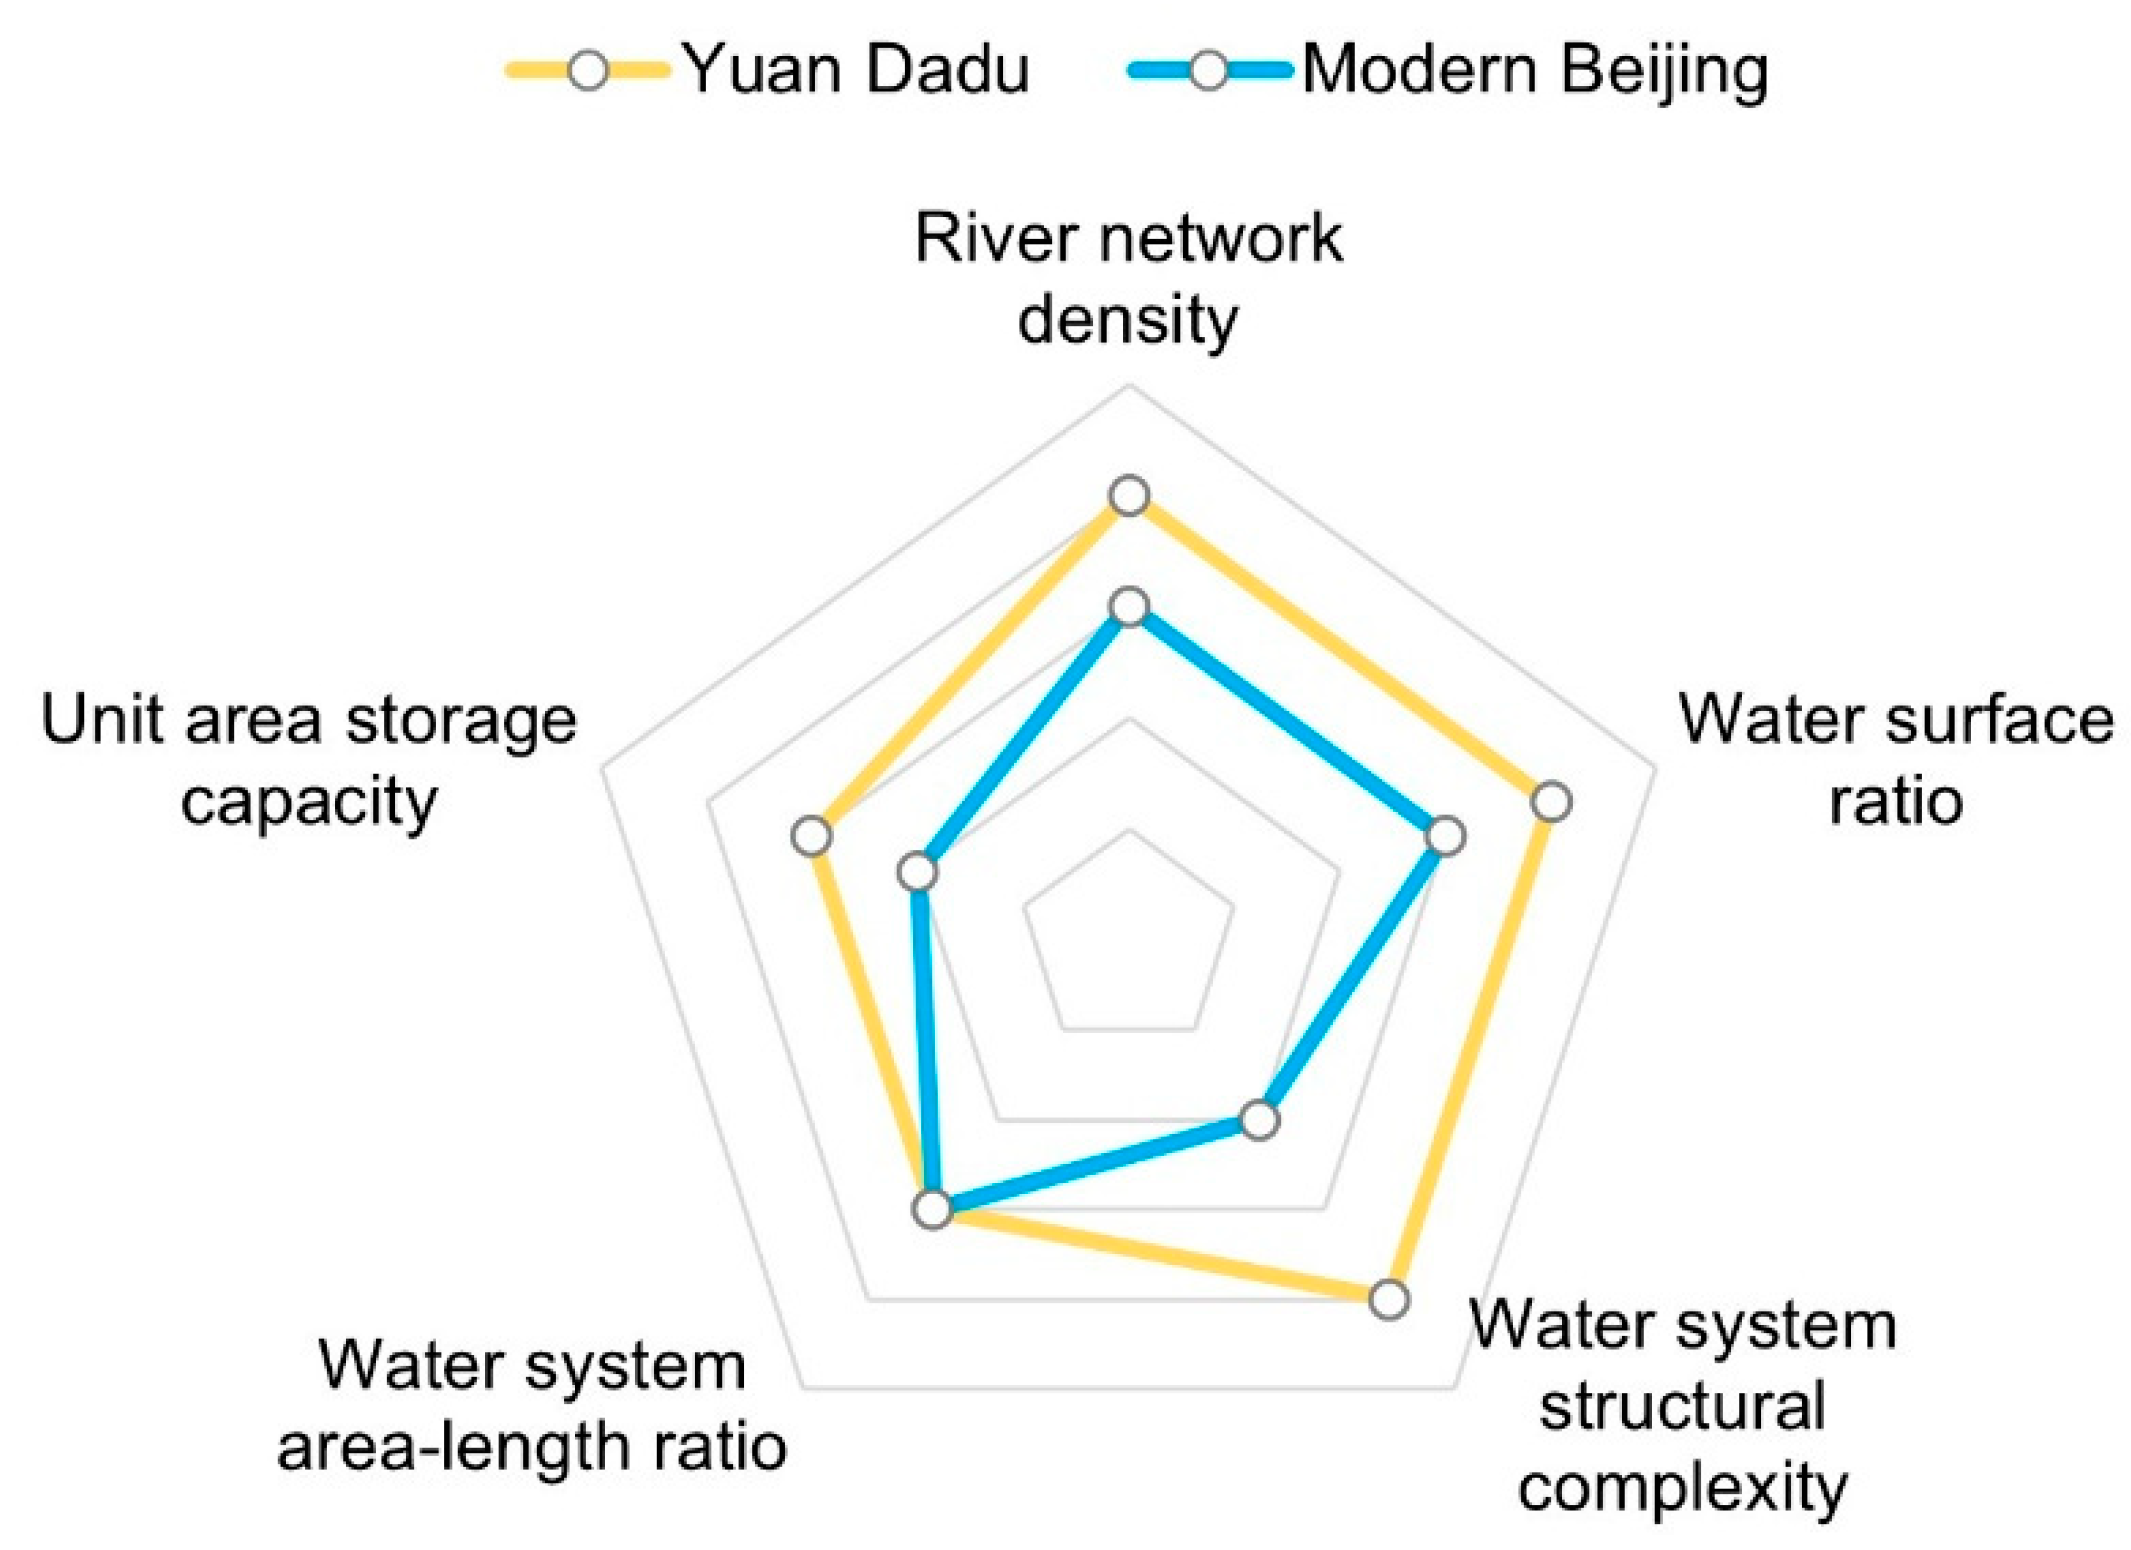
Figure 5 shows the radar chart of the water system pattern characteristic indicators after scoring. The area difference between the two radar charts intuitively reflects the impact of water system pattern evolution on urban flood resilience. Yuan Dadu’s radar chart presents a relatively balanced outward-expanding form, indicating that its water system maintained a good coordination across indicators, forming a resilience system that is dominated by natural storage. Modern Beijing’s radar chart shows obvious inward contraction and imbalance, especially the “depression” in storage capacity-related indicators, revealing systematic defects of over-reliance on engineering measures while neglecting natural water system functions.
Figure 5.
The radar chart of the water system characteristic indicators.
3.2. Flood Inundation Characteristics
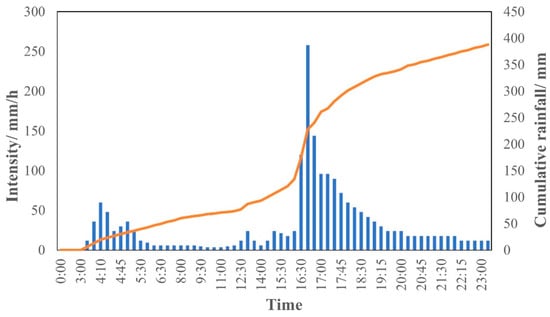
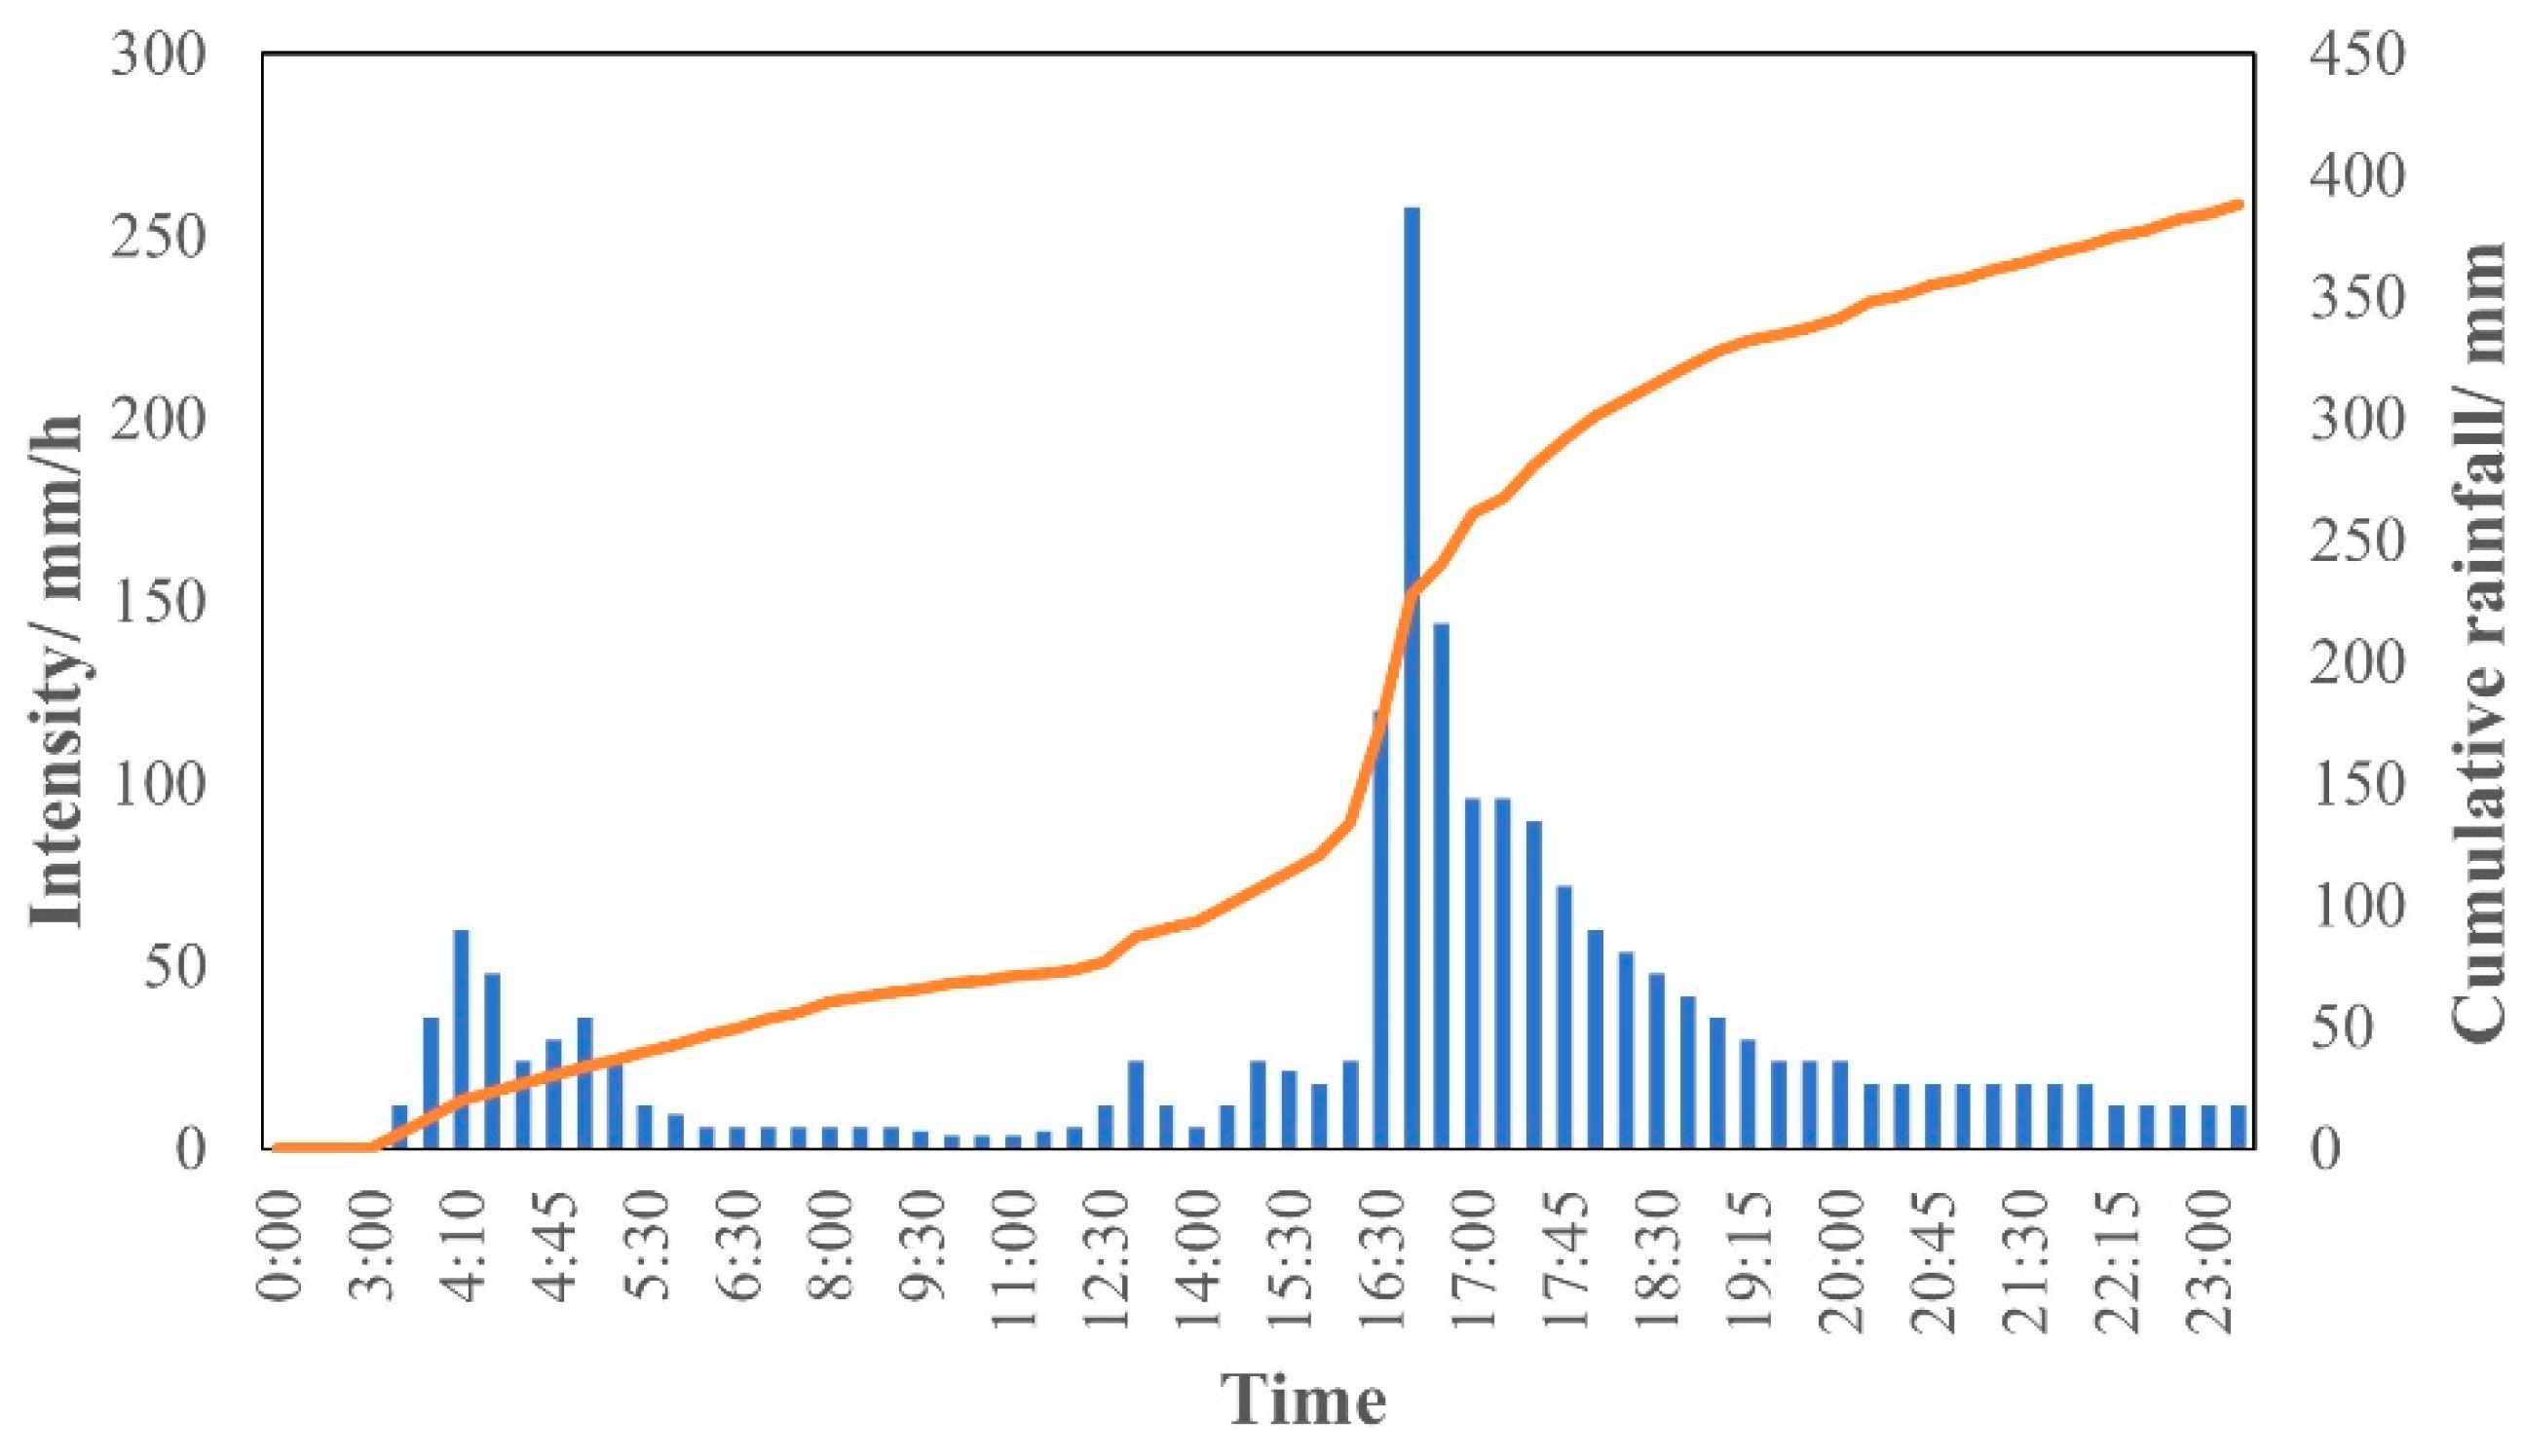
By comparing data from the “Beijing Urban Waterlogging Risk Map” with the simulation results from the Yuan Dadu scenario, we analyzed differences in flood inundation characteristics between the two periods. To ensure scientific comparability, the Yuan Dadu flood inundation simulation employed a rainfall scenario consistent with the “Beijing Urban Waterlogging Risk Map” (approximately equivalent to a 20–30 year return period rainstorm). The Waterlogging Risk Map was produced using a hydrological–hydrodynamic framework that is conceptually consistent with the model employed here. The specific design storm hyetograph was constructed based on rainfall pattern data, with proportional scaling according to the annual rainfall ratio between Yuan Dadu and modern Beijing (approximately 750 mm/year vs. 560 mm/year; SI Table S8). The resulting 24 h cumulative rainfall after scaling was 400 mm (Figure 6). It should be noted that the drainage capacity in each scenario reflects its period-specific infrastructure: the open-channel gravity systems for Yuan Dadu versus the modern pressurized pipe-and-pump network for Beijing. This structural difference is itself part of what the study aims to characterize.
Figure 6.
The design 24 h cumulative rainfall for the Yuan Dadu scenario.
The comparison of total inundation indicators reveals structural differences in how the two systems respond to equivalent rainfall inputs (Table 2). In modern Beijing, the waterlogging risk zone covers 97.9 km2 (7.2% of the study area), with an average inundation depth of 0.33 m. The simulation results for the Yuan Dadu baseline show a maximum inundation area of 121.9 km2, but with a significantly lower average inundation depth of 0.24 m, 27.3% lower than modern Beijing. This disparity reflects a structural difference in the drainage paradigms: modern Beijing’s reliance on rapid centralized drainage results in localized deep ponding when pipe capacity is exceeded, whereas the Yuan Dadu system facilitated a dispersed retention across the natural depressions, resulting in larger areas of shallow overland flow. The hydraulic implications of these contrasting patterns are further assessed within the UFRI framework alongside infrastructure and socio-economic dimensions (Section 3.3).
Table 2.
The comparison of total inundation indicators under the typical rainfall scenarios.
The inundation duration for modern Beijing was estimated using the storage–discharge balance method. Based on waterlogging data, the peak waterlogging volume was estimated at approximately 3.3 × 10⁷ m3. When considering drainage measures such as pipe networks and pumping stations, the comprehensive drainage rate was approximately 1.2 × 10⁷ m3/h. The drainage process exhibits non-linear characteristics—rapid in the initial stage and progressively slower as hydraulic gradients diminish—consistent with the dynamic influence of multiple factors, including upstream inflow, downstream blockage, and local topographic constraints [2]. Applying the storage–discharge balance approach to these parameters yields an estimated time from peak waterlogging to basic recession (water depth < 15 cm) of approximately 4–5 h; incorporating the upstream confluence time, the central estimate of total inundation duration is 6.0 h. Given the simplified nature of this approach relative to the full hydrodynamic simulation employed for Yuan Dadu, we treat this estimate as carrying inherent uncertainty. A sensitivity range of 5.5–6.5 h was examined, and the comparative conclusion reported below was found to be insensitive to values within this range. Yuan Dadu’s inundation duration, assessed through model evaluation, was approximately 4.5 h, 25% shorter than modern Beijing’s central estimate, and lying outside the 5.5–6.5 h sensitivity range. This difference primarily stems from the rapid evacuation capacity of Yuan Dadu’s high-density river network system and the storage buffering effect of lakes.
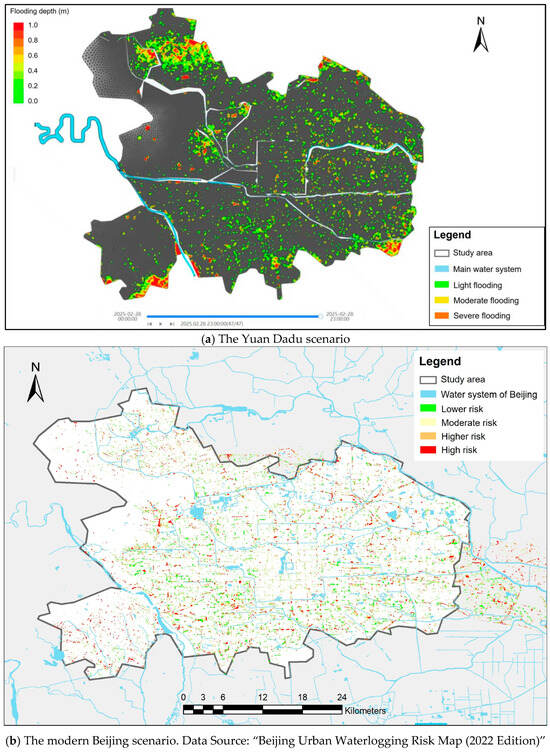
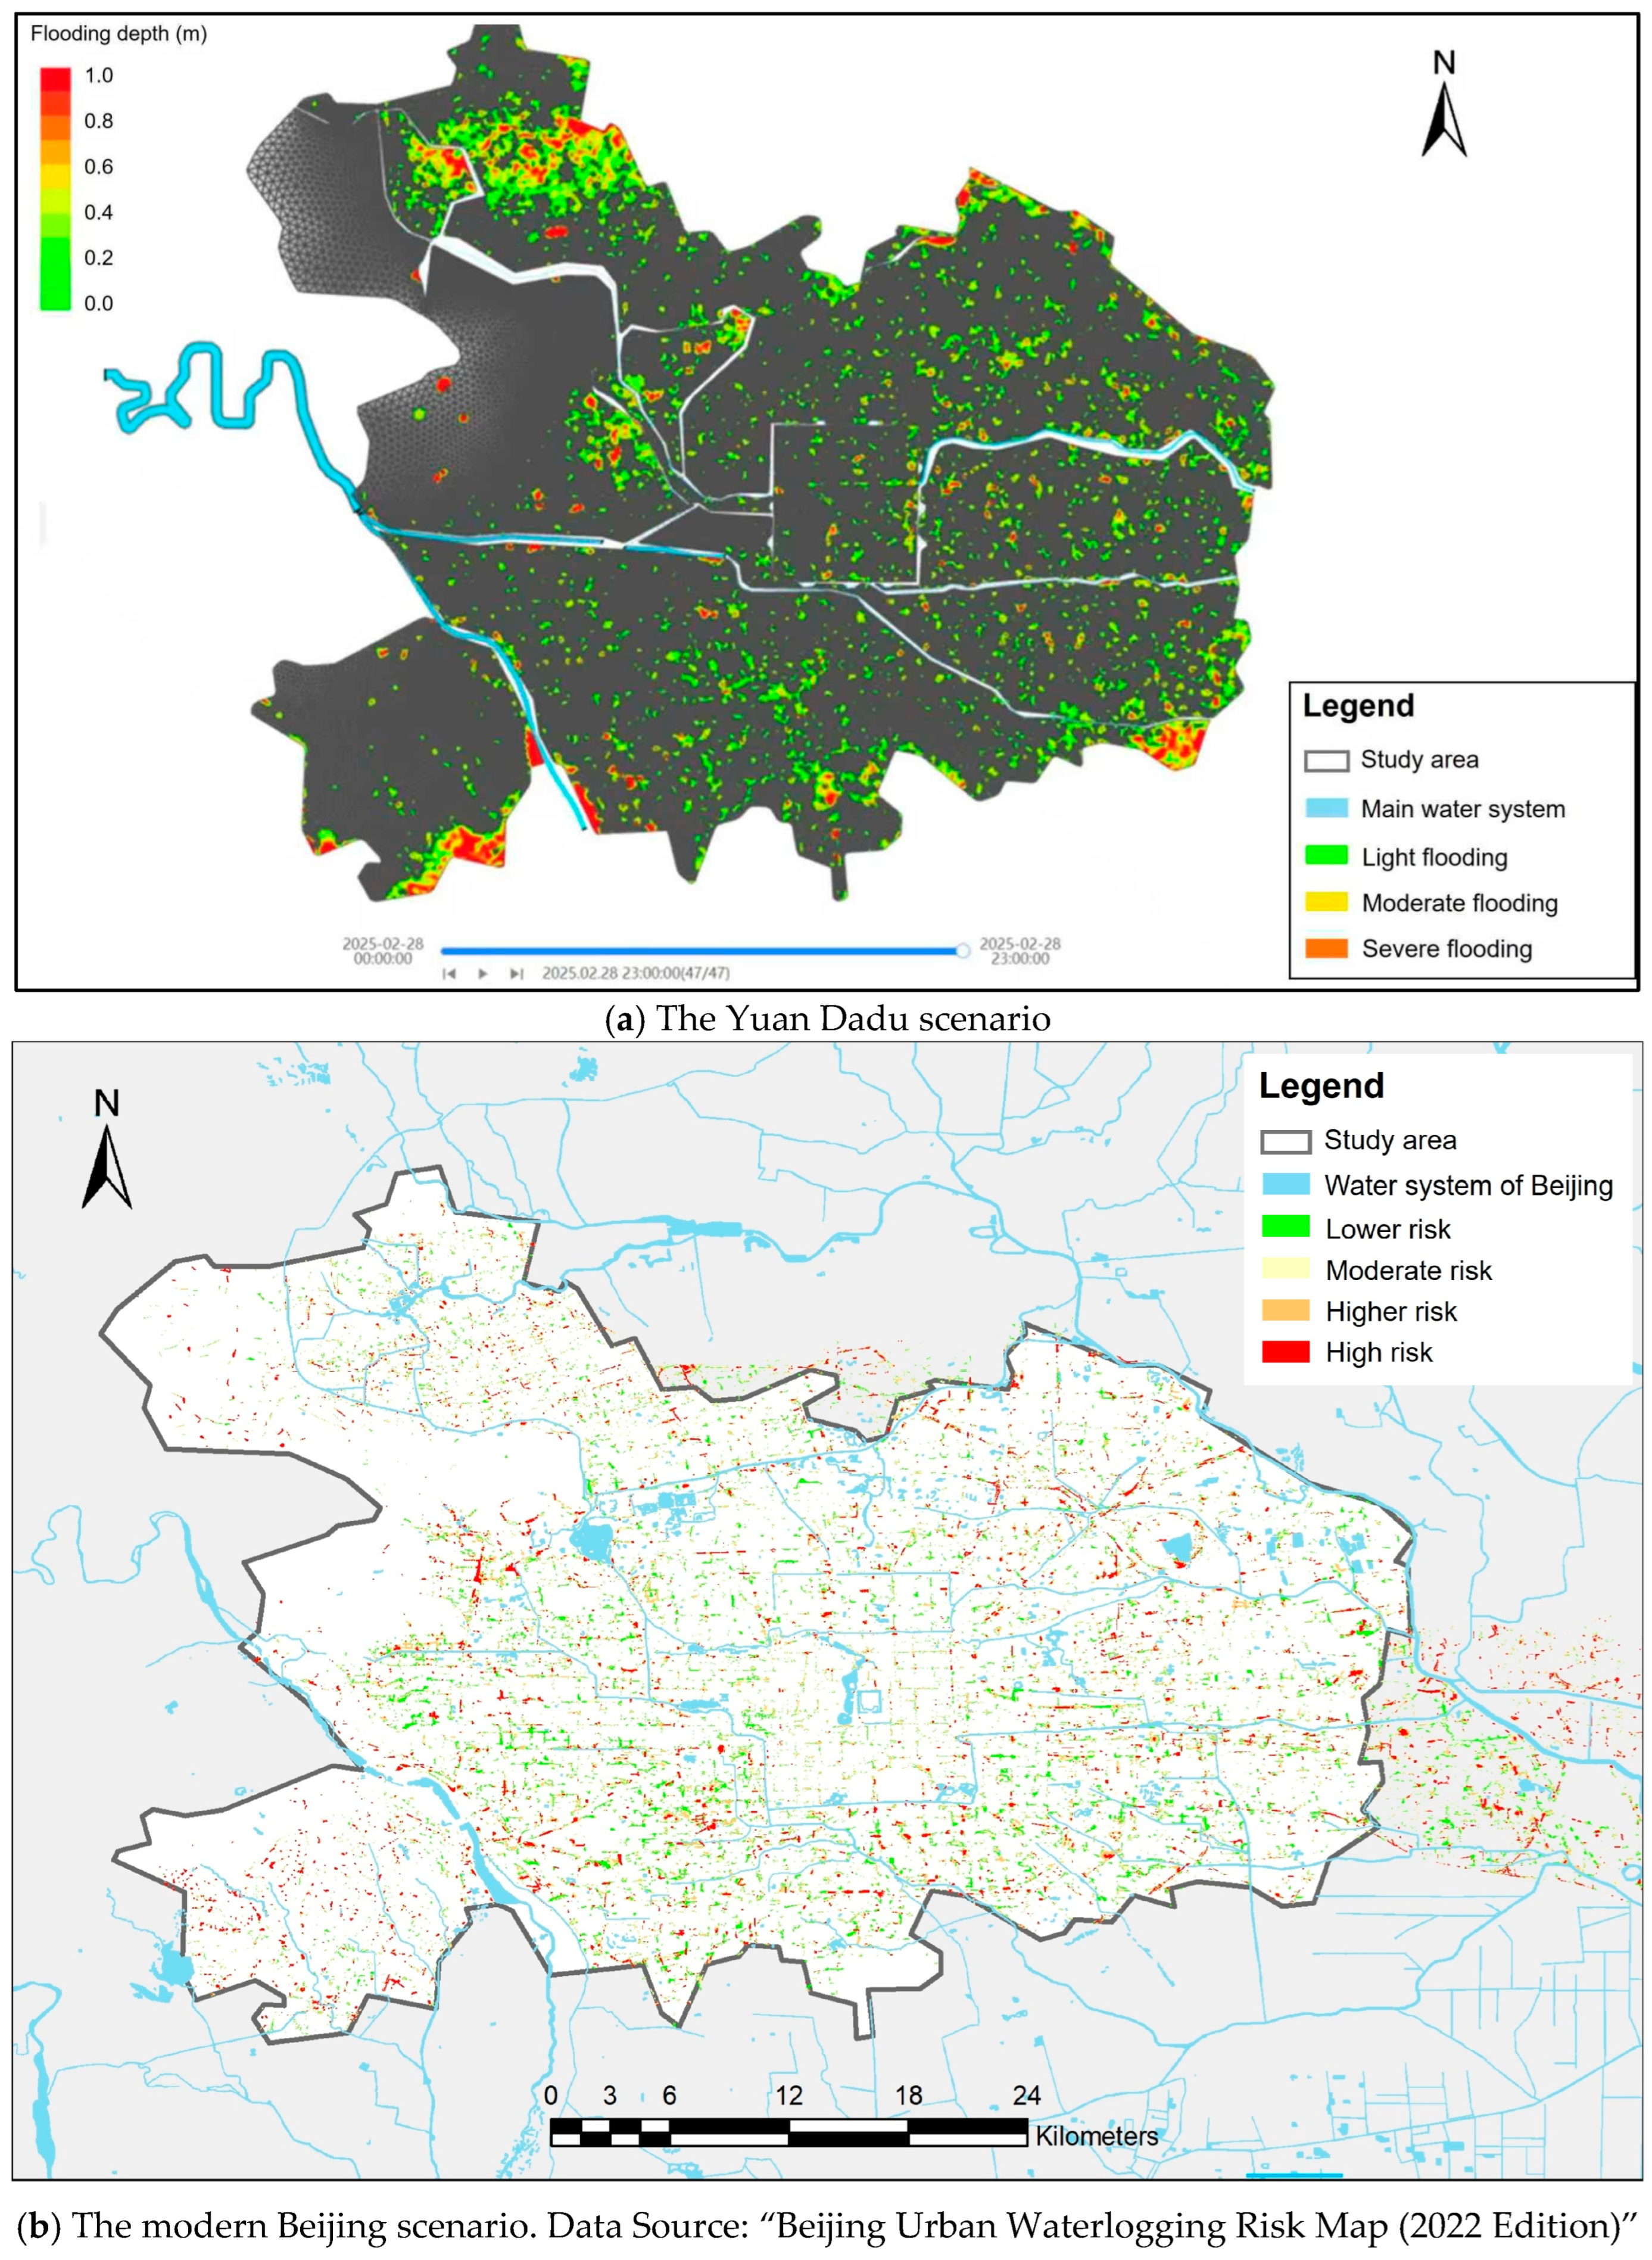
From the spatial distribution of inundated areas, both periods show both similarities and obvious differences (Figure 7). The similarities lie in the fact that low-lying areas such as Southern Fengtai and Eastern Chaoyang are high-incidence waterlogging areas in both periods, reflecting the decisive role of topographic factors. The overall terrain pattern of Beijing, high in the northwest and low in the southeast, determines that these areas are naturally prone to waterlogging. Yuan Dadu’s inundated areas were mainly concentrated around Nanyuan Feifang Lake and the Yongding River old course, which historically served as natural flood detention areas. In contrast, modern Beijing has numerous new waterlogging points, particularly in rapid urbanization areas. These new waterlogging points are mostly located at underground space entrances, underpasses, and old residential areas, reflecting the destruction of natural drainage patterns by urban construction. Research indicates that building density and spatial layout have significant impacts on urban flood characteristics; dense building layouts lead to runoff concentration, forming new ponding points [21].
Figure 7.
The flood inundation comparison between Yuan Dadu and modern Beijing.
The spatial analysis reveals differences in inundation patch characteristics. Modern Beijing’s inundated areas exhibit a highly fragmented patch distribution, with an average patch area of only 0.18 km2, distributed mainly along roads and at the ends of drainage pipe networks, showing a typical “point–linear” aggregation pattern. This distribution pattern is closely related to the topological structure of the pipe network drainage system; when pipe network capacity is insufficient, water accumulates along pipe flow paths and concentrates at terminal nodes and low points. In contrast, Yuan Dadu’s inundation distribution exhibits “areal” characteristics, with an average patch area of 1.2 km2, mainly distributed in natural depressions and around rivers and lakes. According to archeological excavations and “History of the Yuan Dynasty” records, Yuan Dadu’s channels primarily followed the natural terrain excavation, with embankments mostly constructed of rammed earth, with stone reinforcements at key nodes (such as around sluice gates and bridges). Based on a comprehensive assessment of cross-sectional dimensions and materials, the flood prevention standard of Yuan Dadu’s backbone channels roughly equated to a modern 10-year return period. This means that theoretically, when encountering super-standard rainstorms, the Yuan-period channels would inevitably overflow, causing waterlogging in low-lying areas along the banks. The flood impact of such inundation depends on the spatial distribution of the population and assets, which is assessed through the socio-economic dimension of the UFRI (Section 3.3) rather than the inundation extent alone.
The changes in the comprehensive runoff coefficient further explain the differences in the inundation characteristics. Yuan Dadu’s comprehensive runoff coefficient was 0.15, reflecting the large amount of permeable underlying surface at the time, including ~35% green space and ~49% farmland. These permeable surfaces could effectively infiltrate rainwater, reducing surface runoff. Modern Beijing’s comprehensive runoff coefficient reaches 0.65, with impermeable surface area exceeding 70%, converting most rainwater into surface runoff, greatly increasing the burden on the drainage system. The underlying surface characteristics not only affect the total runoff but also significantly influence the runoff process. Yuan Dadu’s large permeable surfaces and water system network extended the confluence time and reduced the flood peak flow, which aligns with the “infiltration, detention, and storage” concepts in the sponge city construction [13].
3.3. Flood Resilience Assessment Results
Based on the Fuzzy AHP weights and the standardized indicator values, the UFRI was calculated to diagnose the resilience profiles of the two systems (Table 3). The UFRI for Yuan Dadu is 3.44, and it is 3.28 for modern Beijing. A Monte Carlo simulation (1000 iterations, ±30% parameter variation) yields 95% confidence intervals of [3.12, 3.68] for Yuan Dadu and [2.85, 3.12] for modern Beijing. These intervals are adjacent but non-overlapping, indicating a directionally consistent but modest composite difference. The primary analytical contribution lies at the dimension level (Table 3), where the contrasts are large, weight-independent, and robust across all tested uncertainty scenarios.
Table 3.
The urban flood resilience assessment results.
- (1)
- Socio-economic Dimension
Modern Beijing scores 4.6 in the socio-economic dimension, significantly outperforming the Yuan Dadu baseline (3.8). This reflects the strength of modern emergency management, which is characterized by a three-tier response mechanism and real-time monitoring systems [10]. In contrast, although Yuan Dadu established a management system centered on the Metropolitan Water Conservancy Bureau (Du Shui Jian), it primarily relied on experiential management and manual dispatch, with limited response speed and precision.
- (2)
- Infrastructure Dimension
The assessment reveals a critical infrastructure paradox: modern Beijing scores significantly higher in infrastructure (3.9) compared to Yuan Dadu (2.6) due to a drainage pipe density of 0.61 km/km2 (6.8 times the historical baseline). However, this engineering advantage does not translate into superior inundation control. The modern drainage system design follows the “rapid discharge” principle, with pipe network design standards of 3–5 year return periods. While the high-density pipe networks expedite runoff conveyance, they lack the volume to buffer peak flows [29]. The assessment confirms that engineering measures face diminishing marginal returns; once the drainage threshold is exceeded, the system lacks the “passive redundancy” provided by the historical river network, leading to an immediate overload. The studies show that when cities over-rely on engineering facilities while neglecting natural regulation capacity, systems fall into a vicious cycle of “construction–overload–reconstruction” with continuously diminishing marginal returns [30].
- (3)
- Natural Environment Dimension
The resilience deficit is primarily driven by the natural environment dimension, where Yuan Dadu (3.9) outperforms modern Beijing (2.2) by 1.7 points. This gap stems from three structural shifts: First, the runoff control mechanism has shifted from “source reduction” to “end-of-pipe treatment.” The increase in the comprehensive runoff coefficient from 0.15 to 0.65 implies that the modern drainage system faces a hydraulic load that is 4.3 times higher than the baseline scenario.
Second is the difference in the topological resilience of water system networks. Yuan Dadu’s water system structural complexity was 43.6, maintaining a complete 5-order branching river network, with orders 1–3 accounting for 50.8% of the total length. This highly branched network structure has two key advantages: first, it provides multiple redundant pathways, allowing floodwater to evacuate through alternative routes when one channel section becomes blocked; second, low-order tributaries near the runoff source areas enable distributed in situ storage [31].
Third, the spatiotemporal configuration of the storage has degraded. Yuan Dadu’s unit area storage capacity reached 6.4 × 10⁴ m3/km2, with storage facilities exhibiting multi-scale distribution. This configuration allows different rainfall intensities to find corresponding scale–storage spaces. Modern Beijing’s storage capacity declined to 4.7 × 10⁴ m3/km2, with the storage facilities mainly consisting of large reservoirs and a few rainwater detention basins, severely lacking medium and small-scale storage.
- (4)
- Sensitivity Analysis
The sensitivity analysis further reveals the key factors affecting resilience. The perturbation testing of the main indicators by ±20% found that the unit area storage capacity has the highest sensitivity coefficient (0.053), followed by the water surface ratio (0.041) and the water system structural complexity (0.035). This means that changes in storage capacity have the greatest impact on the overall resilience. The scenario simulations show that if modern Beijing restores the storage capacity from 4.7 × 10⁴ m3/km2 to 6.0 × 10⁴ m3/km2, UFRI could increase by 0.16 points, surpassing Yuan Dadu’s level. In contrast, the road density and drainage facility density have sensitivity coefficients below 0.02, indicating that marginal returns from continued engineering investment are already very low.
3.4. Historical Insights and Modern Implications
The assessment reveals that the resilience of Yuan Dadu stemmed from a nature-adapted system logic. The lower UFRI of modern Beijing (3.28 vs. 3.44) highlights the opportunity cost of neglecting natural hydraulic functions. This section outlines strategies to bridge this gap through functional compensation rather than mere historical restoration.
- (1)
- Nature-adapted system coupling mechanism
The core of Yuan Dadu’s water system planning lies in constructing an efficient natural–artificial coupled system. Utilizing the 15 m natural elevation drop from the Baifu Spring to the Wengshanpo Lake enabled a gravity flow, with a precise regulation through 24 sluice gates—diverting water into the city for navigation and irrigation during high-water periods and opening gates for flood discharge during flood periods, transforming flood management from “human–water conflict” to “human–water cooperation” [17]. The resilience advantage of this coupling mechanism lies in self-adaptability: when one sluice gate fails, others can compensate by adjusting their opening degrees; when one channel section silts up, floodwater can bypass through the tributary networks.
- (2)
- Spatial substitution effect of storage function
Unlike the high-standard engineering facilities that rapidly discharge water, Yuan Dadu extended the flood retention time by increasing the storage space and reducing and delaying the flood peaks. The simulations show that the Wengshanpo Lake’s 240 × 104 m3 storage capacity could reduce downstream flood peaks by 30% and delay peak arrival by 1.5 h. Modern planning must reintroduce “spatial buffers” into the urban fabric—not necessarily by widening rivers, but by integrating multifunctional storage spaces (e.g., sunken plazas and park lakes) to compensate for the deficit in the surface ratio and storage capacity.
- (3)
- Addressing topological vulnerability
The degradation of the water system’s structural complexity (from 43.6 to 22.5) has created a topological vulnerability. The historical baseline featured a highly branched network (Orders 1–3 comprising 50.8% in length), providing redundancy and routing flexibility. The modern simplified tree-like structure lacks this redundancy; a failure at a single node causes systemic disruption. Restoring resilience requires shifting from linear drainage channels to a reticulated network. Reconnecting dead-end water bodies and utilizing green corridors as temporary floodways can artificially recreate the network redundancy of the Yuan period.
- (4)
- Strategic framework for resilience enhancement
Based on the above analysis, modern urban flood resilience enhancement should follow a “restoration–optimization–integration” strategy framework. First, restoring the natural storage functions through distributed micro-storage facilities can offset the loss of large natural lakes. The sensitivity analysis indicates that the storage capacity has the greatest impact on the UFRI. Second, optimizing underlying surface permeability through low-impact development (LID) measures such as permeable pavements, sunken green spaces, and rain gardens. Third, constructing “blue–green–grey” integrated systems. The specific approaches include: restoring some hardened channels to natural channels, increasing detention capacity, constructing ecological purification ponds at pipe network terminals, and integrating with sponge city construction to build comprehensive “infiltration, detention, storage, purification, utilization, and drainage” management systems [32].
3.5. Limitations
Several limitations should be acknowledged. The historical hydrodynamic model for Yuan Dadu cannot be calibrated or validated against any observed data—an inherent constraint of all historical hydrological reconstruction. Monte Carlo simulations and multi-source parameter cross-validation provide partial uncertainty bounds, but model structural uncertainty remains unquantifiable. This is compounded by an asymmetry in data confidence: modern Beijing indicators derive from measured datasets, whereas Yuan Dadu parameters are reconstructed from historical documents and archeological evidence. The reported UFRI values should therefore be interpreted as characterizing the direction and approximate magnitude of structural change rather than precise benchmarks; dimension-level contrasts are considerably more robust to this constraint than the composite score.
Reconstruction of low-order tributary networks via Horton’s law assumes statistical self-similarity that may not hold for Yuan Dadu’s partially engineered canal system. The FAHP weighting scheme, while expert-informed (n = 15, all CR < 0.1), remains subject to judgment. The UFRI further provides a static snapshot under a single design storm, leaving recovery trajectories and adaptive capacity under sequential extremes as important directions for future work. Finally, the quantitative findings are specific to Beijing’s hydro-geomorphological context; the diagnostic framework is broadly transferable, but site-specific conclusions should be applied to other cities with caution.
4. Conclusions
This study constructed a quantitative assessment framework to benchmark the flood resilience of modern Beijing against its historical hydrological baseline, Yuan Dadu (1267–1368 CE). By controlling for geographical and meteorological variables, the framework identifies what natural hydraulic functions have been lost through urbanization, isolating the structural consequences of water system transformation from other confounding factors.
The assessment results indicate structurally different resilience profiles across dimensions, with 95% confidence intervals that are adjacent but non-overlapping and a composite ordering that is sensitive to weighting assumptions. While modern Beijing possesses a significant advantage in infrastructure density and emergency management, this adaptive capacity has not translated into superior resilience. The study reveals a functional substitution failure: the expansion of gray infrastructure (pipe density 0.61 km/km2) has failed to fully compensate for the loss of natural hydraulic functions. Specifically, the increase in the comprehensive runoff coefficient from 0.15 to 0.65, coupled with a 26% reduction in unit area storage capacity and a 48.4% decline in structural complexity, has compromised the system’s ability to buffer extreme rainfall.
These findings carry implications for the urban flood management in Beijing’s hydro-geomorphological context. The planning strategies should address not only drainage capacity but also restore the topological connectivity of the water network, recovering distributed storage functions, and embedding micro-storage within the high-density urban fabric to recreate hydraulic buffering at the system level. The specific quantitative findings of this study are particular to Beijing; the analytical framework—using a pre-urbanization hydrological baseline to identify the natural hydraulic functions lost through urbanization—may be applicable to other cities where comparable historical water system records exist.
The limitations remain regarding the precision of the historical data reconstruction. Future research could further refine these datasets through archeological evidence and explore the resilience evolution of different adaptation pathways under diverse climate change scenarios.
Supplementary Materials
The supporting information can be downloaded at https://www.mdpi.com/article/10.3390/w18060735/s1.
Author Contributions
Conceptualization, J.L. and Z.H.; methodology, Z.H.; software, Z.H.; validation, Z.H.; formal analysis, Z.H.; investigation, Z.H.; data curation, Z.H.; writing—original draft preparation, Z.H.; writing—review and editing, Z.H.; visualization, Z.H.; supervision, J.L. All authors have read and agreed to the published version of the manuscript.
Funding
This research received no external funding.
Data Availability Statement
The original contributions presented in this study are included in the article/Supplementary Material. Further inquiries can be directed to the corresponding author.
Acknowledgments
During the preparation of this manuscript, the authors used Google Gemini 3 for the purposes of language polishing. The authors have reviewed and edited the output and take full responsibility for the content of this publication.
Conflicts of Interest
The authors declare no conflicts of interest.
References
- UNDRR. Global Assessment Report on Disaster Risk Reduction 2022; United Nations Office for Disaster Risk Reduction: Geneva, Switzerland, 2022. [Google Scholar]
- Tang, Z.; Wang, P.; Li, Y.; Sheng, Y.; Wang, B.; Popovych, N.; Hu, T. Contributions of Climate Change and Urbanization to Urban Flood Hazard Changes in China’s 293 Major Cities since 1980. J. Environ. Manag. 2024, 353, 120113. [Google Scholar] [CrossRef] [Scilit] [PubMed]
- Meerow, S.; Newell, J.P.; Stults, M. Defining Urban Resilience: A Review. Landsc. Urban Plan. 2016, 147, 38–49. [Google Scholar] [CrossRef] [Scilit]
- Holling, C.S. Resilience and Stability of Ecological Systems. Annu. Rev. Ecol. Syst. 1973, 4, 1–23. [Google Scholar] [CrossRef] [Scilit]
- Walker, B.; Holling, C.S.; Carpenter, S.R.; Kinzig, A. Resilience, Adaptability and Transformability in Social-Ecological Systems. Ecol. Soc. 2004, 9, 5. [Google Scholar] [CrossRef] [Scilit]
- Liao, K.H. A Theory on Urban Resilience to Floods—A Basis for Alternative Planning Practices. Ecol. Soc. 2012, 17, 48. [Google Scholar] [CrossRef] [Scilit]
- Bruneau, M.; Chang, S.E.; Eguchi, R.T.; Lee, G.C.; O’Rourke, T.D.; Reinhorn, A.M.; Shinozuka, M.; Tierney, K.; Wallace, W.A.; Von Winterfeldt, D. A Framework to Quantitatively Assess and Enhance the Seismic Resilience of Communities. Earthq. Spectra 2003, 19, 733–752. [Google Scholar] [CrossRef] [Scilit]
- Folke, C. Resilience: The Emergence of a Perspective for Social-Ecological Systems Analyses. Glob. Environ. Chang. 2006, 16, 253–267. [Google Scholar] [CrossRef] [Scilit]
- Kotzee, I.; Reyers, B. Piloting a Social-Ecological Index for Measuring Flood Resilience: A Composite Index Approach. Ecol. Indic. 2016, 60, 45–53. [Google Scholar] [CrossRef] [Scilit]
- Cutter, S.L.; Barnes, L.; Berry, M.; Burton, C.; Evans, E.; Tate, E.; Webb, J. A Place-Based Model for Understanding Community Resilience to Natural Disasters. Glob. Environ. Chang. 2008, 18, 598–606. [Google Scholar] [CrossRef] [Scilit]
- Cohen-Shacham, E.; Walters, G.; Janzen, C.; Maginnis, S. Nature-Based Solutions to Address Global Societal Challenges; IUCN: Gland, Switzerland, 2016. [Google Scholar]
- Chan, F.K.S.; Griffiths, J.A.; Higgitt, D.; Xu, S.; Zhu, F.; Tang, Y.-T.; Xu, Y.; Thorne, C.R. “Sponge City” in China—A Breakthrough of Planning and Flood Risk Management in the Urban Context. Land Use Policy 2018, 76, 772–778. [Google Scholar] [CrossRef] [Scilit]
- Li, H.; Ding, L.; Ren, M.; Li, C.; Wang, H. Sponge City Construction in China: A Survey of the Challenges and Opportunities. Water 2017, 9, 594. [Google Scholar] [CrossRef] [Scilit]
- Mao, Z.; Tan, X. History of Ancient Chinese Flood Control Engineering Technology; Shanxi Education Press: Taiyuan, China, 2017. [Google Scholar]
- He, Y.J. History of Ancient Chinese Urban Planning; China Architecture & Building Press: Beijing, China, 1996. [Google Scholar]
- Hou, R.Z. Life Imprint of Beijing City; SDX Joint Publishing Company: Beijing, China, 2009. [Google Scholar]
- Xu, B. Review on the Researches of Planning and Recovery of Capital Dadu of the Yuan Dynasty. The Palace Museum. 2020. Available online: https://www.dpm.org.cn/Uploads/File/2020/11/12/u5fad16548fcc6.pdf (accessed on 17 March 2026).
- Hui, Z.; Wang, J. Research on the Experience and Wisdom of Water System Planning in Yuan Dadu. Urban. Archit. 2021, 18, 17–19. [Google Scholar] [CrossRef]
- Yang, R. Research on the Relationship Between Water System Construction and Gardens in Yuan Dadu. Master’s Thesis, Xi’an University of Architecture and Technology, Xi’an, China, 2020. [Google Scholar]
- Rözer, V.; Mehryar, S.; Surminski, S. From Managing Risk to Increasing Resilience: A Review on the Development of Urban Flood Resilience, Its Assessment and the Implications for Decision Making. Environ. Res. Lett. 2022, 17, 123006. [Google Scholar] [CrossRef] [Scilit]
- Mustafa, A.; Bruwier, M.; Archambeau, P.; Erpicum, S.; Pirotton, M.; Dewals, B.; Teller, J. Effects of Spatial Planning on Future Flood Risks in Urban Environments. J. Environ. Manag. 2018, 225, 193–204. [Google Scholar] [CrossRef] [Scilit] [PubMed]
- Moghadas, M.; Asadzadeh, A.; Vafeidis, A.; Fekete, A.; Kötter, T. A Multi-Criteria Approach for Assessing Urban Flood Resilience in Tehran, Iran. Int. J. Disaster Risk Reduct. 2019, 35, 101069. [Google Scholar] [CrossRef] [Scilit]
- Horton, R.E. Erosional Development of Streams and Their Drainage Basins: Hydrophysical Approach to Quantitative Morphology. Geol. Soc. Am. Bull. 1945, 56, 275–370. [Google Scholar] [CrossRef] [Scilit]
- Rodriguez-Iturbe, I.; Rinaldo, A. Fractal River Basins: Chance and Self-Organization; Cambridge University Press: Cambridge, UK, 2001. [Google Scholar]
- Alharairi, M.; Amin, S.H.; Zolfaghari, S.; Fang, L. Fuzzy Analytic Hierarchy Process: A Comprehensive Literature Review. Int. J. Anal. Hierarchy Process 2025, 17, 1–27. [Google Scholar] [CrossRef] [Scilit]
- Otay, İ.; Çevik Onar, S.; Öztayşi, B.; Kahraman, C. A Novel Interval Valued Circular Intuitionistic Fuzzy AHP Methodology: Application in Digital Transformation Project Selection. Inf. Sci. 2023, 647, 119407. [Google Scholar] [CrossRef] [Scilit]
- Ekmekcioğlu, Ö.; Koc, K.; Özger, M. District Based Flood Risk Assessment in Istanbul Using Fuzzy Analytical Hierarchy Process. Stoch. Environ. Res. Risk Assess. 2021, 35, 617–637. [Google Scholar] [CrossRef] [Scilit]
- Chin, A. Urban Transformation of River Landscapes in a Global Context. Geomorphology 2006, 79, 460–487. [Google Scholar] [CrossRef] [Scilit]
- Zhou, Q.; Mikkelsen, P.S.; Halsnæs, K.; Arnbjerg-Nielsen, K. Framework for Economic Pluvial Flood Risk Assessment Considering Climate Change Effects and Adaptation Benefits. J. Hydrol. 2012, 414–415, 539–549. [Google Scholar] [CrossRef] [Scilit]
- Mugume, S.N.; Gomez, D.E.; Fu, G.; Farmani, R.; Butler, D. A Global Analysis Approach for Investigating Structural Resilience in Urban Drainage Systems. Water Res. 2015, 81, 15–26. [Google Scholar] [CrossRef] [Scilit] [PubMed]
- Yu, Z.; Wang, Q.; Xu, Y.; Lu, M.; Lin, Z.; Gao, B. Dynamic Impacts of Changes in River Structure and Connectivity on Water Quality under Urbanization in the Yangtze River Delta Plain. Ecol. Indic. 2022, 135, 108582. [Google Scholar] [CrossRef] [Scilit]
- Jiang, Y.; Zevenbergen, C.; Ma, Y. Urban Pluvial Flooding and Stormwater Management: A Contemporary Review of China’s Challenges and “Sponge Cities” Strategy. Environ. Sci. Policy 2018, 80, 132–143. [Google Scholar] [CrossRef] [Scilit]

Disclaimer/Publisher’s Note: The statements, opinions and data contained in all publications are solely those of the individual author(s) and contributor(s) and not of MDPI and/or the editor(s). MDPI and/or the editor(s) disclaim responsibility for any injury to people or property resulting from any ideas, methods, instructions or products referred to in the content. |
© 2026 by the authors. Licensee MDPI, Basel, Switzerland. This article is an open access article distributed under the terms and conditions of the Creative Commons Attribution (CC BY) license.