Article

Evaluation of Long-Term Increased Groundwater Abstraction Impact on Watershed Hydrology in Han River Basin, South Korea


1
Department of Civil, Environmental and Plant Engineering, Graduate School, Konkuk University, 1 Hwayang Dong, Gwangjin-Gu, Seoul 05029, Republic of Korea
2
Hydro Science and Engineering Research, Korea Institute of Civil Engineering and Building Technology, Daehwa-Dong 283, Goyang-Daero, Ilsanseo-Gu, Goyang-Si 10223, Republic of Korea
3
Asia Infrastructure Research Center, Konkuk University, 1 Hwayang Dong, Gwangjin-Gu, Seoul 05029, Republic of Korea
4
Division of Civil and Environmental Engineering, College of Engineering, Konkuk University, 1 Hwayang Dong, Gwangjin-Gu, Seoul 05029, Republic of Korea
*
Author to whom correspondence should be addressed.
Water 2026, 18(5), 607; https://doi.org/10.3390/w18050607
Submission received: 2 February 2026 / Revised: 24 February 2026 / Accepted: 2 March 2026 / Published: 3 March 2026
(This article belongs to the Section Hydrology)

Abstract

Distinguishing the hydrological impacts of anthropogenic groundwater withdrawal from natural climate variability is a critical yet complex challenge in sustainable water resource management. This study quantitatively evaluated the watershed-scale hydrological response to the increased groundwater abstraction in the Han River basin (35,770 km2) of South Korea using the Soil and Water Assessment Tool (SWAT). Groundwater use datasets for the 1970s and 2010s were constructed using groundwater statistical yearbooks. By applying the groundwater use datasets under 2010s weather conditions, we effectively isolated the specific effects of human usage. The results indicated that a rise in the annual groundwater abstraction from 9.6 to 22.3 million m3 reduced the average streamflow by 6.59%. The baseflow and groundwater recharge were identified as the most sensitive components, decreasing by 20.7% and 20.8%, respectively. Notably, intensive summer withdrawal (53% of the annual total) depleted aquifer storage, directly exacerbating streamflow reductions during the autumn and winter seasons. A flow duration analysis further confirmed that the duration of the dry season—defined by the flow exceeded for 275 days (Q275)—extended by 13 days, as the exceedance duration for the specific flow duration shifted from Q275 to Q263. These findings highlighted that excessive groundwater withdrawal compromises seasonal hydrological stability, necessitating integrated management strategies to secure the streamflow during critical dry periods.

1. Introduction

Sustainable water resource management relies on the fundamental understanding that surface water and groundwater are not isolated components but constitute a single, interconnected resource [1,2]. These systems maintain a hydrological balance through continuous exchange processes; surface water recharges aquifers via infiltration, while groundwater discharges to streams, sustaining the baseflow especially during dry periods [3,4]. Groundwater storage also contributes to hydrological buffering by moderating rapid rises in stream levels during intense rainfall events, thereby supporting watershed-scale hydrological resilience [5].
Despite this connectivity, groundwater use has increased steadily worldwide as an essential resource for the municipal, industrial, and agricultural sectors. However, when the groundwater abstraction persistently exceeds the natural recharge, it can lower groundwater levels, reduce the groundwater discharge to the stream, and degrade the natural flow regimes [6,7,8,9]. In severe cases, intensified pumping may reverse the hydraulic gradients and shift the stream–aquifer exchanges toward losing conditions, increasing the risk of streamflow depletion and ecological stress [10,11]. Long-term overexploitation can further reduce the buffering capacity and weaken the riverine resilience, with additional societal impacts in urban areas (e.g., land subsidence or sinkholes) [12,13,14].
In South Korea, rapid urbanization, agricultural intensification, and expanding water demand have been accompanied by a pronounced increase in groundwater reliance, particularly during droughts or localized shortages [15]. Although groundwater provides critical supply security, the hydrological consequences of sustained increases in groundwater abstraction remain a pressing concern, as they may amplify the low-flow vulnerability and dry season water stress in regulated and densely populated basins [16] such as the Han River system. Importantly, these impacts are often difficult to isolate from climate variability and infrastructure operations, which can mask the underlying signal of the groundwater abstraction change.
Recently, the extensive impact of groundwater abstraction on regional hydrological processes has been actively investigated globally. For example, studies published between 2022 and 2025 have quantified the severe aquifer depletion and groundwater storage loss driven by intensive agricultural irrigation [17,18,19] and rapid urban development [20]. Furthermore, recent studies highlight how continuous overextraction disrupts surface water-groundwater interactions, altering the hydrological cycles even in the inland basin [21]. However, while these studies successfully evaluate the overall long-term volumetric loss of groundwater availability and river infiltration, most have focused on annual depletion rates or spatial storage changes. There remains a critical research gap regarding the quantitative evaluation of the seasonal lag effect at the watershed scale—specifically, the mechanism where intensive groundwater withdrawal during the wet summer season fails to sustain the baseflow discharge, subsequently exacerbating the stream desiccation during the winter dry season.
To effectively manage these risks, it is essential to quantitatively evaluate how increased groundwater abstraction affects the watershed hydrology. In this context, physically based watershed models offer a powerful solution. The Soil and Water Assessment Tool (SWAT), a semi-distributed, process-based model, is particularly suitable because it represents the watershed heterogeneity via subbasins/HRUs (Hydrological Response Units) and can incorporate consumptive water use modules to account for anthropogenic withdrawals at appropriate spatial scales [15,22,23,24,25]. This capability offers a robust approach for evaluating groundwater abstraction impacts under controlled meteorological conditions.
The main objectives of this study are (1) to quantitatively evaluate the impacts of increased groundwater abstraction on watershed-scale hydrological components in the Han River basin (35,770 km2) using SWAT, and (2) to discuss these findings within the context of Integrated Water Resources Management (IWRM) to suggest practical strategies for mitigating the seasonal streamflow depletion. To achieve this, SWAT, which allows the groundwater abstraction to be represented at the standard watershed level, was applied using groundwater use datasets from the 1970s (1976–1985) and the 2010s (2006–2015). The model was then used to evaluate the impacts of increased groundwater abstraction under controlled meteorological conditions. Ultimately, by providing a robust scientific basis for the seasonal lag effect, these findings are intended to serve as a practical decision-support tool for regional water authorities (e.g., the Ministry of Climate, Energy and Environment (MCEE), and K-water) and local policymakers. The results specifically offer quantitative targets for establishing groundwater withdrawal limits and designing localized water-retention infrastructures to ensure long-term hydrological sustainability.

2. Materials and Methods

2.1. Study Area

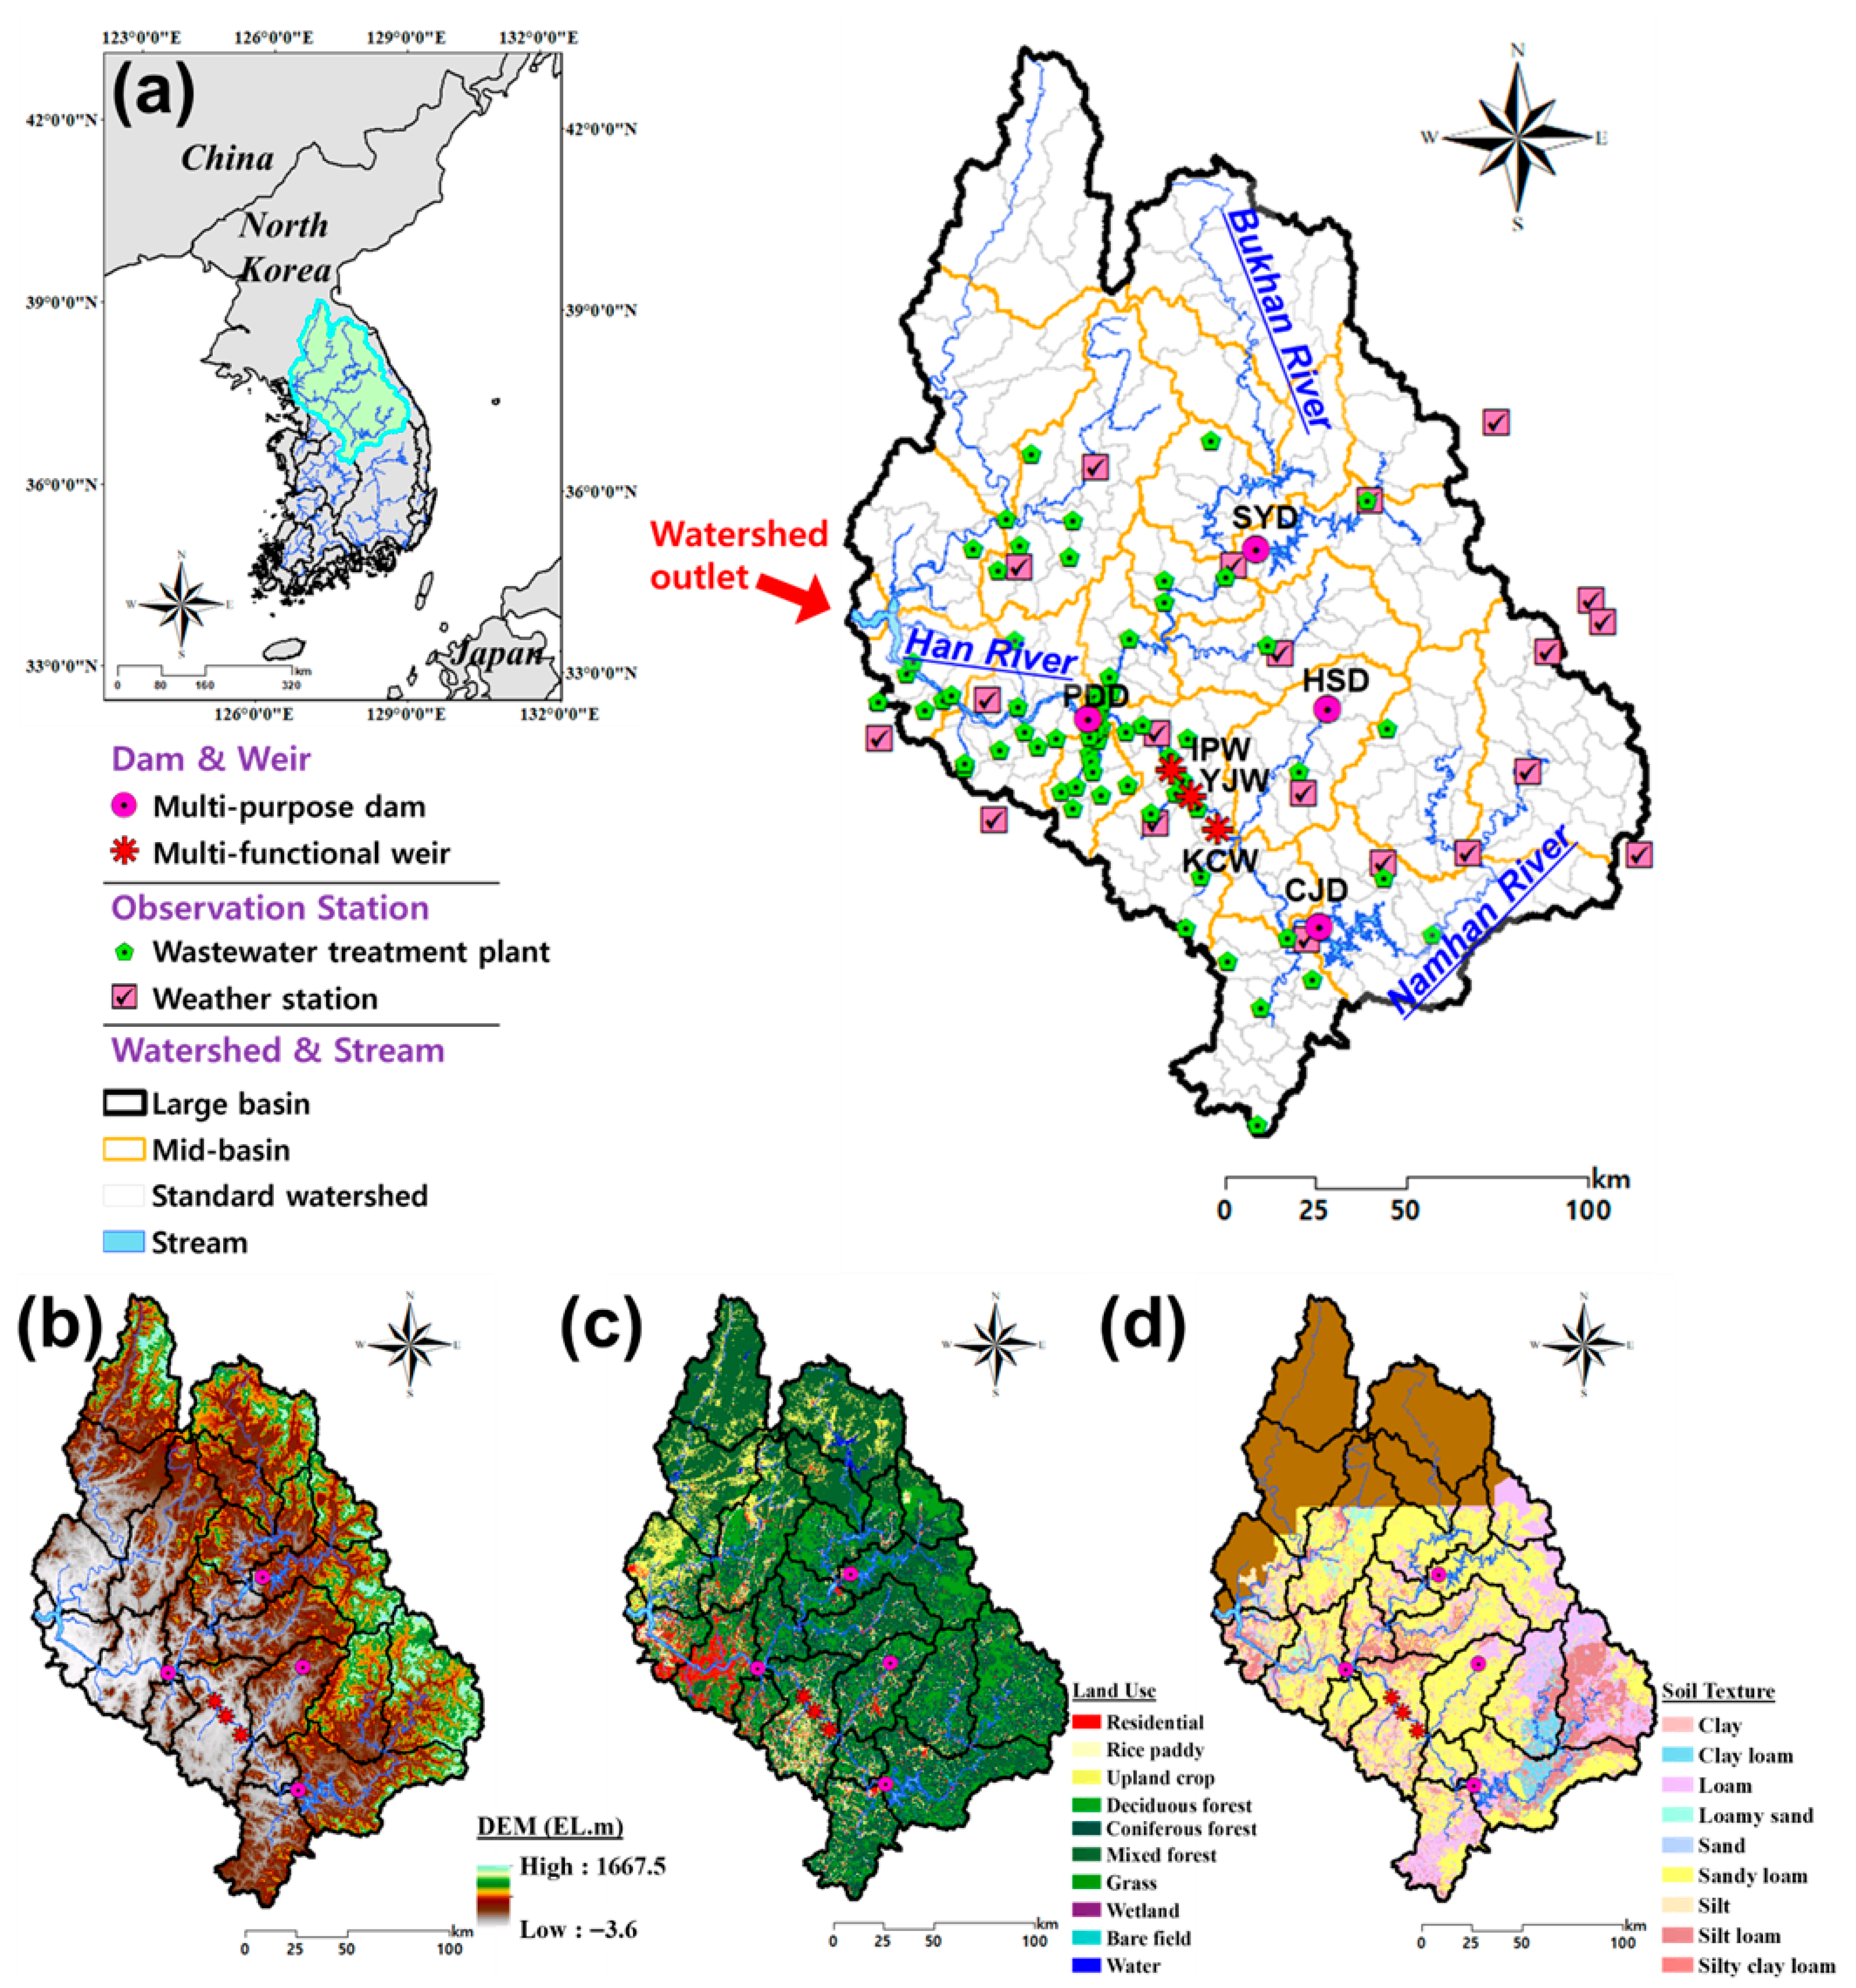
The study area is the Han River basin (35,770 km2) which is one of the five major river basins in South Korea. The basin contains four multi-purpose dams (Soyang; SYD, Hoengseong; HSD, Chungju; CJD, and Paldang; PDD) and three multi-functional weirs (Kangcheon; KCW, Yeoju; YJW, and Ipo; IPW) which collectively regulate streamflow within the watershed. The Han River basin has experienced steadily increasing groundwater abstraction due to the presence of large metropolitan areas, including Seoul, and extensive agricultural districts throughout Gyeonggi Province. In the 2010s, the average annual groundwater abstraction reached 22.3 mm, accounting for approximately 1.68% of the average annual precipitation (1326.6 mm) within the basin. According to the Groundwater Statistical Yearbook by [26], the total regional groundwater use in 2023 was 3117.1 million m3, of which Seoul and Gyeonggi Province accounted for 470.6 million m3, representing approximately 15.1% of the national total. Hydrologically, the Han River basin is hierarchically classified into large basin, mid-basins (e.g., North Han River and South Han River), and smaller standard watersheds. In this study, the standard watersheds were utilized as the foundational subbasin units for the SWAT setup, while the mid-basins are illuminated to denote major tributary systems.
Figure 1a presents the geographical location of the Han River basin and the spatial datasets used for SWAT setup, including the Digital Elevation Map (DEM) (Figure 1b), land use (Figure 1c), and soil textures (Figure 1d). A 30 m spatial resolution DEM was obtained from the National Geographic Information Institute of Korea (NGII) [27]. The 1:25,000-scale land use and soil maps were provided by MCEE [28] and the Rural Development Administration (RDA) [29], respectively. Additionally, the digital stream network dataset, which was used to accurately define the river reaches and routing pathways within the basin, was obtained from the Water Resources Management Information System (WAMIS). The forest and agricultural areas of the Han River basin occupied 74.4% and 13.1% of the watershed area and the dominant soil types were sandy loam (52.3%) and loam (23.6%), respectively.

2.2. SWAT Description

SWAT is a physically based, semi-distributed, continuous watershed model developed by the United States Department of Agriculture—Agricultural Research Service (USDA-ARS). The model and its documentation are freely available for download from the SWAT homepage (https://swat.tamu.edu/, accessed on 15 February 2026) [30,31]; SWAT simulates hydrologic processes by comprehensively integrating meteorological conditions, land use characteristics, topography, and soil properties. While the model is capable of representing various watershed processes, this study focuses exclusively on the water cycle, simulating components from rainfall to streamflow and groundwater recharge. One of SWAT’s key advantages is its use of HRUs–spatial units that share homogeneous land use, soil type, and slope. For each HRU, SWAT applies a water balance equation, using precipitation as an input, to simulate total runoff, evapotranspiration, canopy interception, infiltration, surface runoff, lateral flow, and base flow [30,31].
Daily surface runoff in SWAT is calculated using the Soil Conservation Service Curve Number (SCS-CN) method, while lateral flow is estimated through the Kinematic Storage Model, which divides the soil profile into ten or fewer layers (up to four layers were configured in this study) and applies a linear reservoir routing technique. Potential evapotranspiration is computed using the Penman–Monteith method. The water balance equation used in SWAT is as follows:
S W t = S W 0 + i = 1 t ( R d a y Q s u r f W s e e p E a Q g w )
where S W t represents the soil water content at the time (mm H2O), S W 0 is the initial soil water content on the day (mm H2O), R d a y is the daily precipitation (mm H2O), Q s u r f denotes the daily surface runoff (mm H2O), W s e e p indicates the daily percolation to the vadose zone (mm H2O), E a signifies the daily evapotranspiration (mm H2O), and Q g w describes the daily groundwater return flow (mm H2O).
While Equation (1) represents the water balance within the soil profile, the artificial groundwater abstraction is simulated by directly removing water from the shallow aquifer using the WUS (consumptive water use) module, which is detailed in Section 2.3.
SWAT also can simulate the daily operations of reservoir located within a watershed, and the basic equation for reservoir operation is expressed as follows:
V = V s t o r e d + V f l o w i n V f l o w o u t + V p c p V e v a p V s e e p
where V represents the reservoir storage volume at the end of the day (m3 H2O), V s t o r e d is the initial storage volume (m3 H2O), V f l o w i n is the daily inflow to the reservoir (m3 H2O), V f l o w o u t is the daily outflow from the reservoir (m3 H2O), V p c p indicates the daily precipitation falling directly onto the reservoir surface (m3 H2O), V e v a p is the daily evaporation loss from the reservoir (m3 H2O), and V s e e p is the seepage loss from the reservoir (m3 H2O).

2.3. Consumptive Water Use

In this study, WUS module in SWAT was utilized to apply for groundwater use data at each standard watershed. WUS module acts as a management tool designed to remove water from the watershed system. Instead of simulating water transfers outside the watershed, this study assumes the extract groundwater is primarily consumed locally for purposes such as agricultural irrigation, as well as municipal and industrial water supply within the respective standard watersheds. Water removed through this module is treated as a permanent loss from the watershed and is not returned to the hydrologic system.
While the WUS module can withdraw water from various sources within a subbasin, this study specifically configured the module to extract water directly from the shallow aquifer. This direct removal physically reduces the shallow aquifer storage, which consequently decreases the groundwater discharge (baseflow) contributing to the main channel. The WUS module is implemented monthly, allowing users to specify the average daily withdrawal rate (104 m3/day) for each month of the year [15,25,32].

2.4. Groundwater Use Data

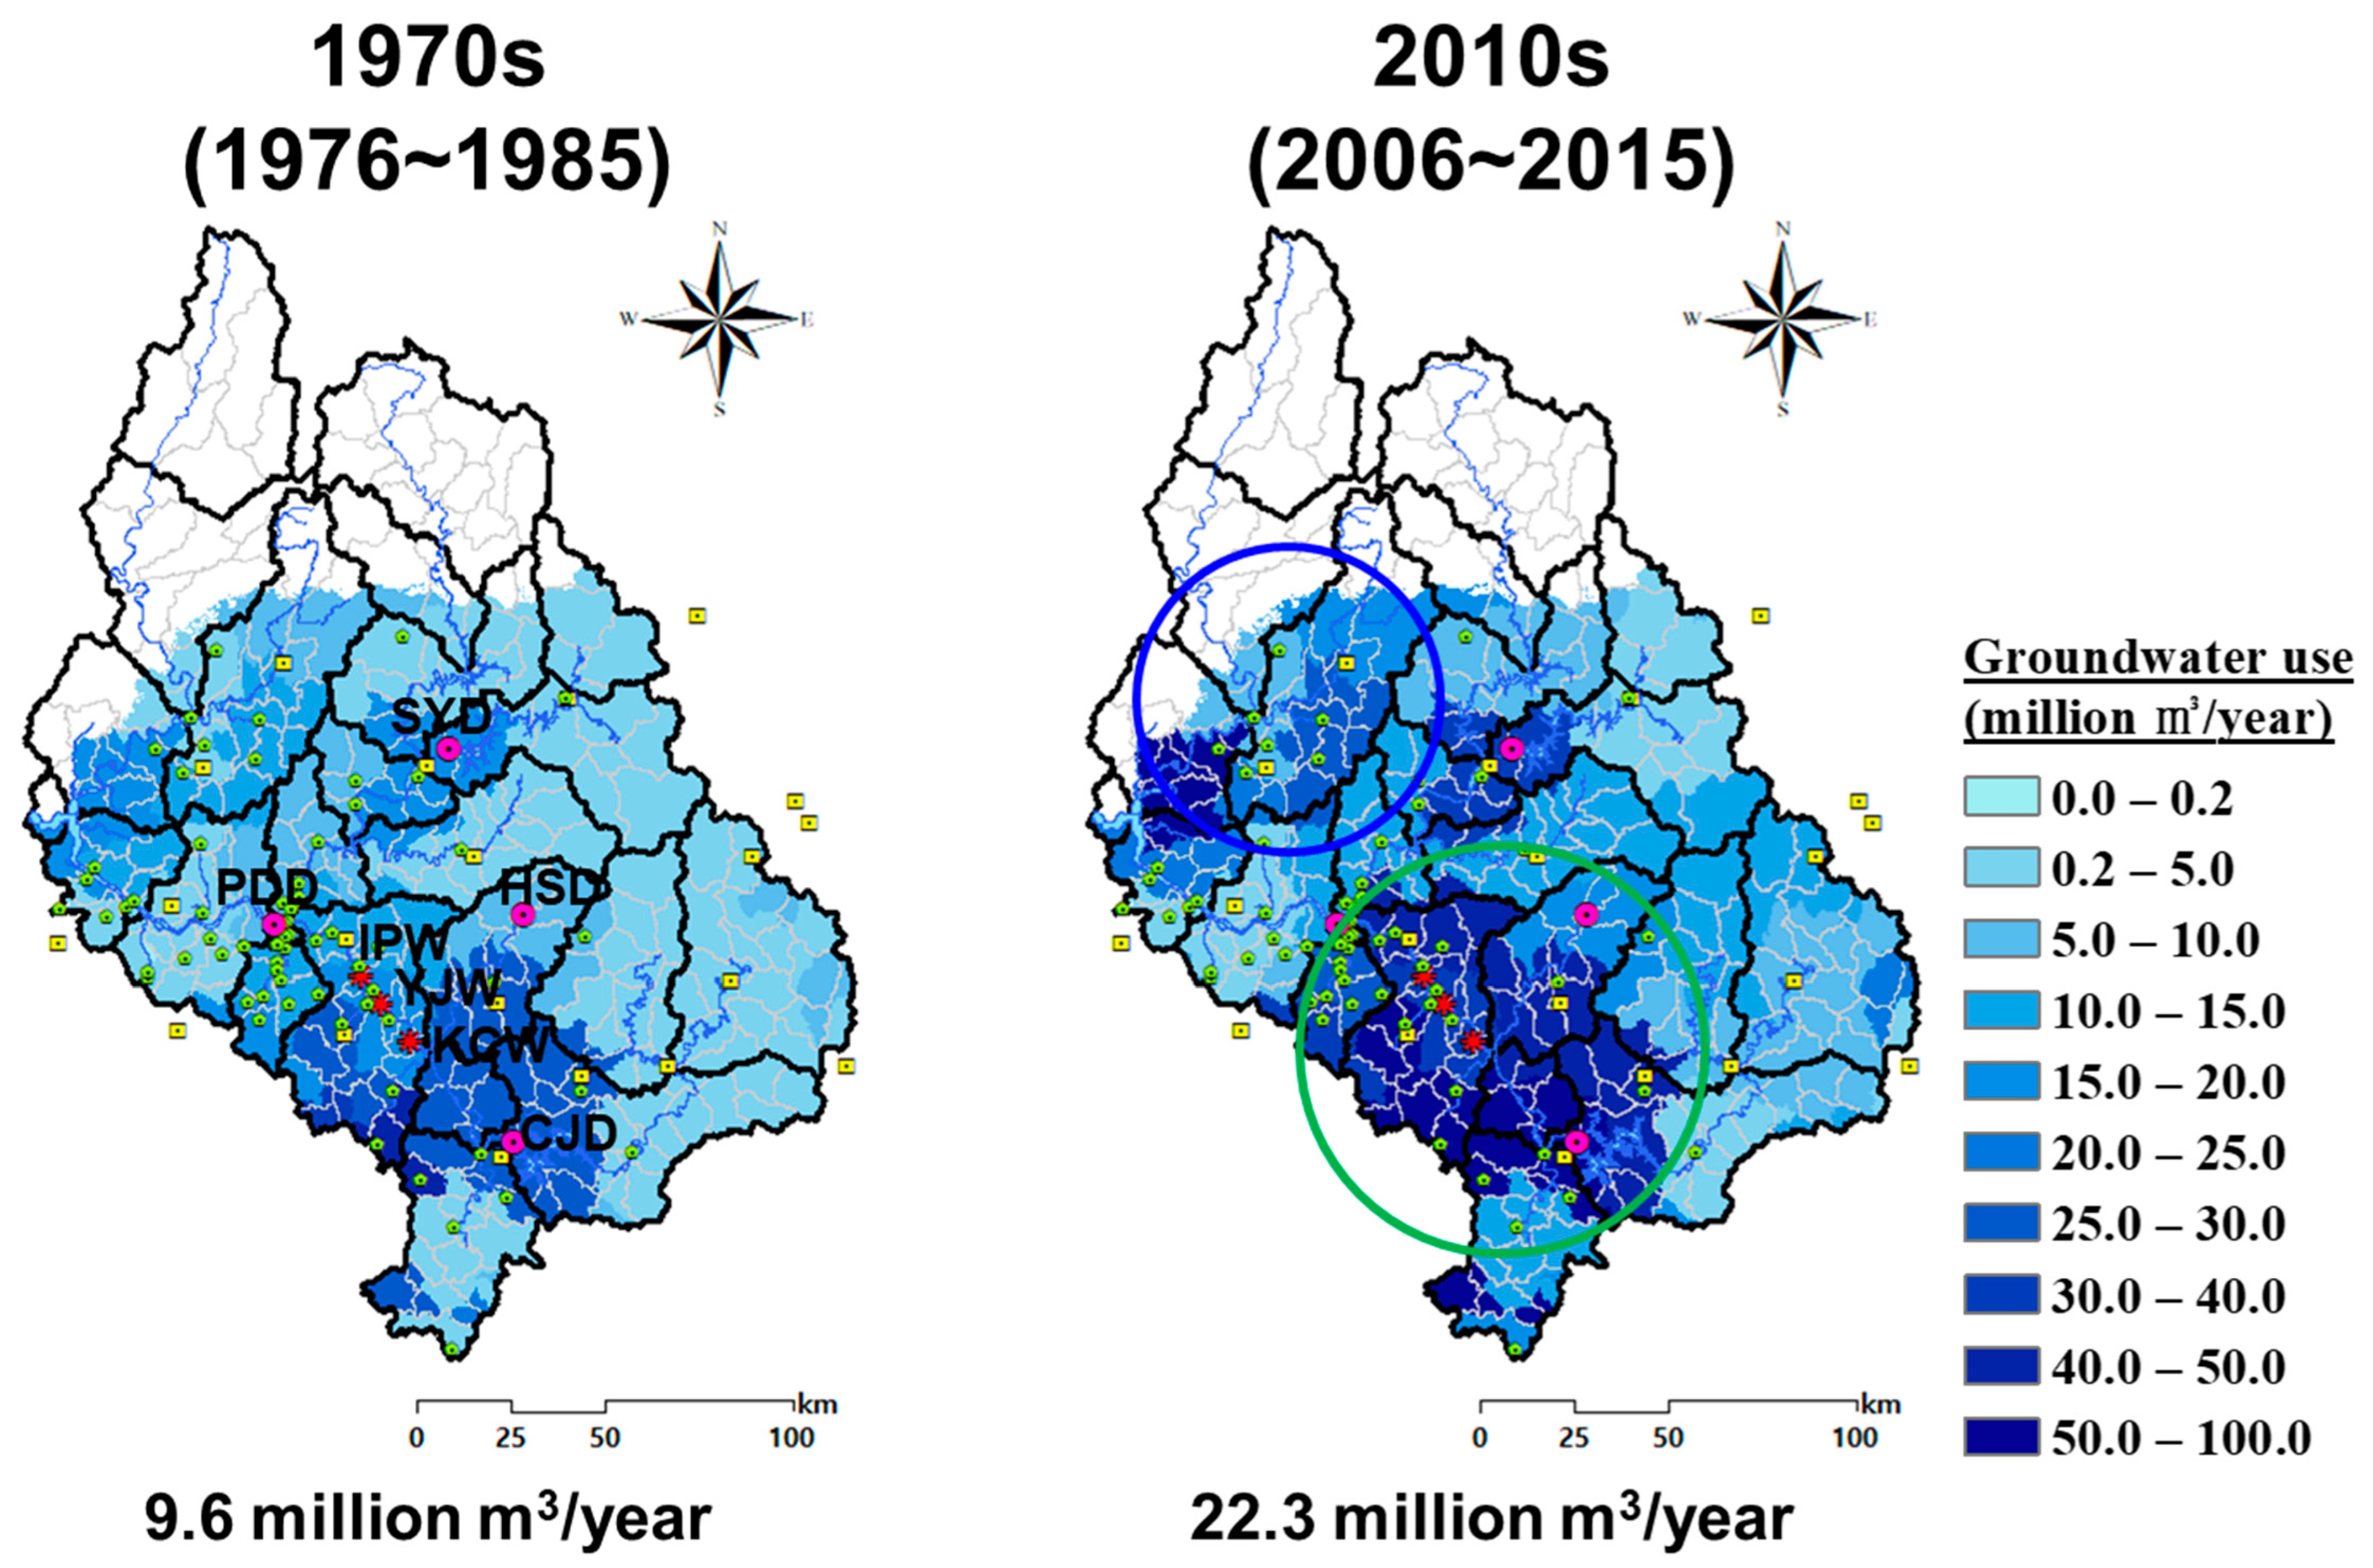
To construct the groundwater use dataset, the Groundwater Statistical Yearbooks and additional groundwater use records were collected from the National Groundwater Information Center [33]. Using these datasets, groundwater use information was compiled for 1970s and 2010s. Because groundwater use data in South Korea are reported by administrative district (city–county–district) and by usage category, they were first aggregated to represent the total groundwater withdrawal. Although the original data include specific usages such as irrigation, municipal, and industrial supplies, the total abstraction volume was applied to the SWAT WUS module without further subdivision. This approach was chosen because the primary focus of this study is to evaluate the integrated physical impact of total human-induced withdrawal on the basin’s hydrological buffering capacity. The aggregated values were then converted into area groundwater use and spatially allocated to each standard watershed, excluding border regions adjacent to North Korea, using the Data Join tool in ArcGIS (version 10.3, ESRI, Redlands, CA, USA) [12,15]. Figure 2 presents the resulting spatial distribution changes in groundwater use data for the 1970s and 2010s within the Han River basin.
Based on the constructed dataset, the average groundwater abstraction in the 1970s was 9.6 million m3/year, whereas the 2010s showed an average of 22.3 million m3/year, indicating an increase of approximately 12.7 million m3/year. To provide context within the basin’s water budget, this 2010s average annual abstraction represents a relatively small fraction (approximately 1.68%) of the region’s average annual precipitation. The spatial analysis revealed that groundwater abstraction increased more substantially along the downstream regions of CJD with extensive agricultural land compared with more urbanized areas (Figure 1c and Figure 2, where the blue and green circles highlight the Hantan and Seom River basins, respectively).
Table 1 summarizes the monthly groundwater abstraction for each period. The results showed that groundwater abstraction in the Han River basin during the 1970s and 2010s was highly concentrated in the summer season (June–August), accounting for 50.3% and 52.8% of the respective annual amounts. This indicates that groundwater abstraction is more intensive during the flood season compared with spring (March–May), autumn (September–November), and winter (December–February). Groundwater abstraction increased substantially across all months for the two periods, with the most pronounced increases occurring during the summer flood season (June–August).

2.5. Methodology

To construct the SWAT model for the Han River basin, GIS-based spatial dataset including DEM, land use (referring to the 2010 national mid-classification land cover map provided by the MCEE), and soil maps were used along with daily meteorological data from 1976 to 2019. The meteorological variables included daily precipitation (mm), maximum and minimum temperature (°C), wind speed (m/s), relative humidity (%), and solar radiation (MJ/m2). These daily meteorological datasets were directly obtained from the Automated Synoptic Observing System (ASOS) operated by the Korea Meteorological Administration (KMA). Specifically, data from 20 weather stations located within and adjacent to the Han River basin were collected to drive the model. Within the SWAT framework, these meteorological data were spatially distributed by assigning the records from the weather station nearest to the centroid of each respective subbasin.
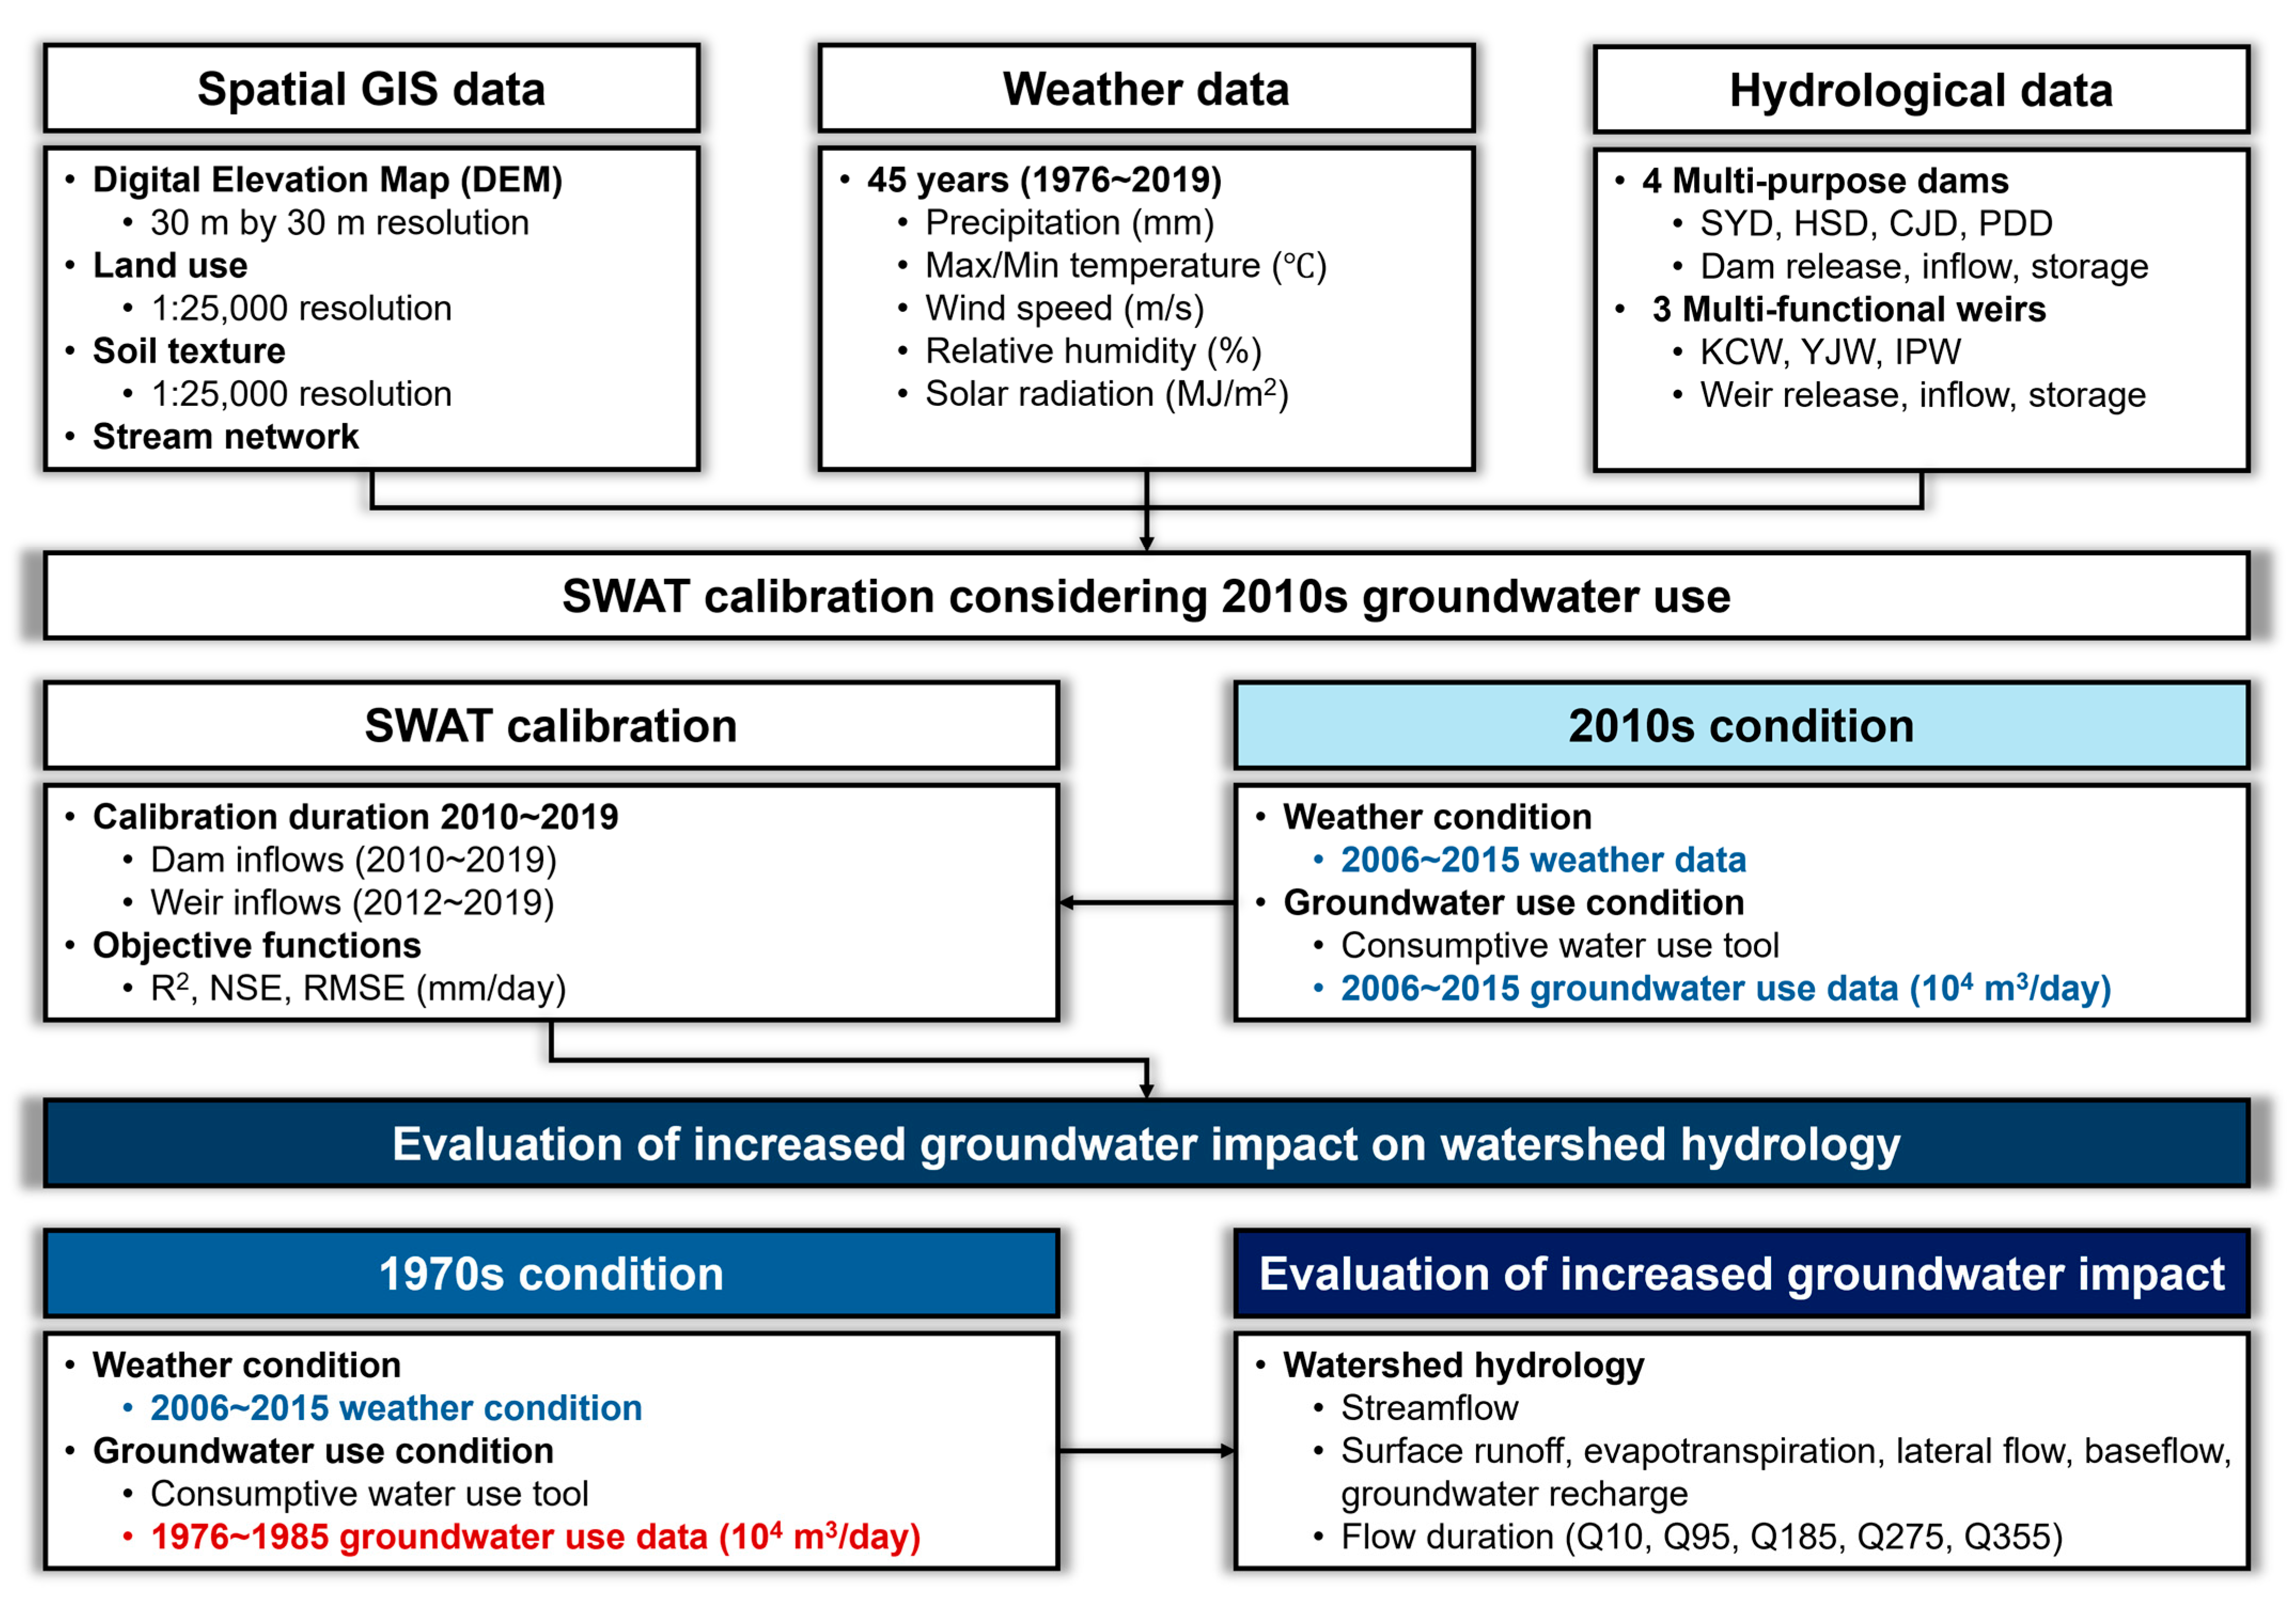
The specifications of the dams (SYD, HSD, CJD, and PDD) and weirs (KCW, YJW, and IPW), as well as daily inflow, release, and storage data for the same period, were collected to ensure reliable SWAT simulations. Subsequently, the 2010s groundwater use data was applied to each standard watershed using the WUS module, and then SWAT was calibrated for the 4 dams and 3 weirs under 2010s weather conditions. Specifically, the model calibration was conducted through a manual calibration approach. Sensitive parameters were iteratively adjusted within their physically meaningful ranges to optimize the match between the simulated and observed daily records at the multi-site locations.
To quantitatively evaluate the performance of the SWAT model calibration, three widely used statistical metrics were employed: the coefficient of determination (R2), Nash–Sutcliffe Efficiency (NSE), and root-mean-squared error (RMSE). Following the general performance rating guidelines for hydrological models established by [34], the simulation results were categorized into qualitative criteria such as ‘Very Good’, ‘Good’, and ‘Satisfactory’ based on the calculated R2 and NSE values. These predefined criteria provide a standardized basis for objectively assessing the reliability of the simulated streamflow against the observed data.
After calibration, the 1970s groundwater use was applied under the same 2010s weather and land use conditions. This study adopted a controlled scenario analysis approach to explicitly quantify the hydrological changes driven solely by the increase in groundwater abstraction. If the actual land use map and weather conditions of the 1970s were applied, the resulting change in streamflow would reflect the combined confounding effects of urbanization (e.g., changes in impervious cover), climate variability, and groundwater withdrawal, making it difficult to isolate the specific impact of the latter. Although the Han River basin has undergone significant land use transitions since the 1980s, such as the expansion of urban impervious areas and shifts in agricultural patterns, both land use and weather conditions were fixed to the 2010s in this study. This enabled a direct evaluation of the hydrological impacts of increased groundwater abstraction while controlling for environmental variability (Figure 3). Specifically, this evaluation was conducted by quantifying the relative changes in simulated hydrological components, particularly total runoff and baseflow, between the 1970s and 2010s scenarios. Furthermore, a flow duration curve analysis was employed to assess the shifts in low-flow regimes and extended dry periods.

3. Results

3.1. SWAT Calibration

SWAT was calibrated under 2010s weather conditions while applying the groundwater use dataset corresponding to the 2010s. The calibration period for multi-purpose dams was set to 2010–2019, whereas the calibration period for multi-functional weirs was set to 2012–2019 to reflect their actual operational timelines. The calibration was performed using the observed dam and weir inflow data for each structure. Table 2 summarizes the SWAT parameters, definitions, default values, and adjusted values assigned to each dam and weir. In this study, eight parameters were selected for calibration: the SCS curve number (CN2), Manning’s “n” value for the main channel (CH_N(2)), soil evaporation compensation coefficient (ESCO), available water capacity (SOL_AWC), saturated hydraulic conductivity (SOL_K), groundwater delay time (GW_DELAY), threshold water level for base flow (GWQMN), and base flow recession constant (ALPHA_BF). Reservoir parameters (RES_ESA, RES_EVOL, RES_PSA, RES_PVOL, and RES_VOL) were also adjusted to reflect the specific characteristics of each multi-purpose dam and multi-functional weir.
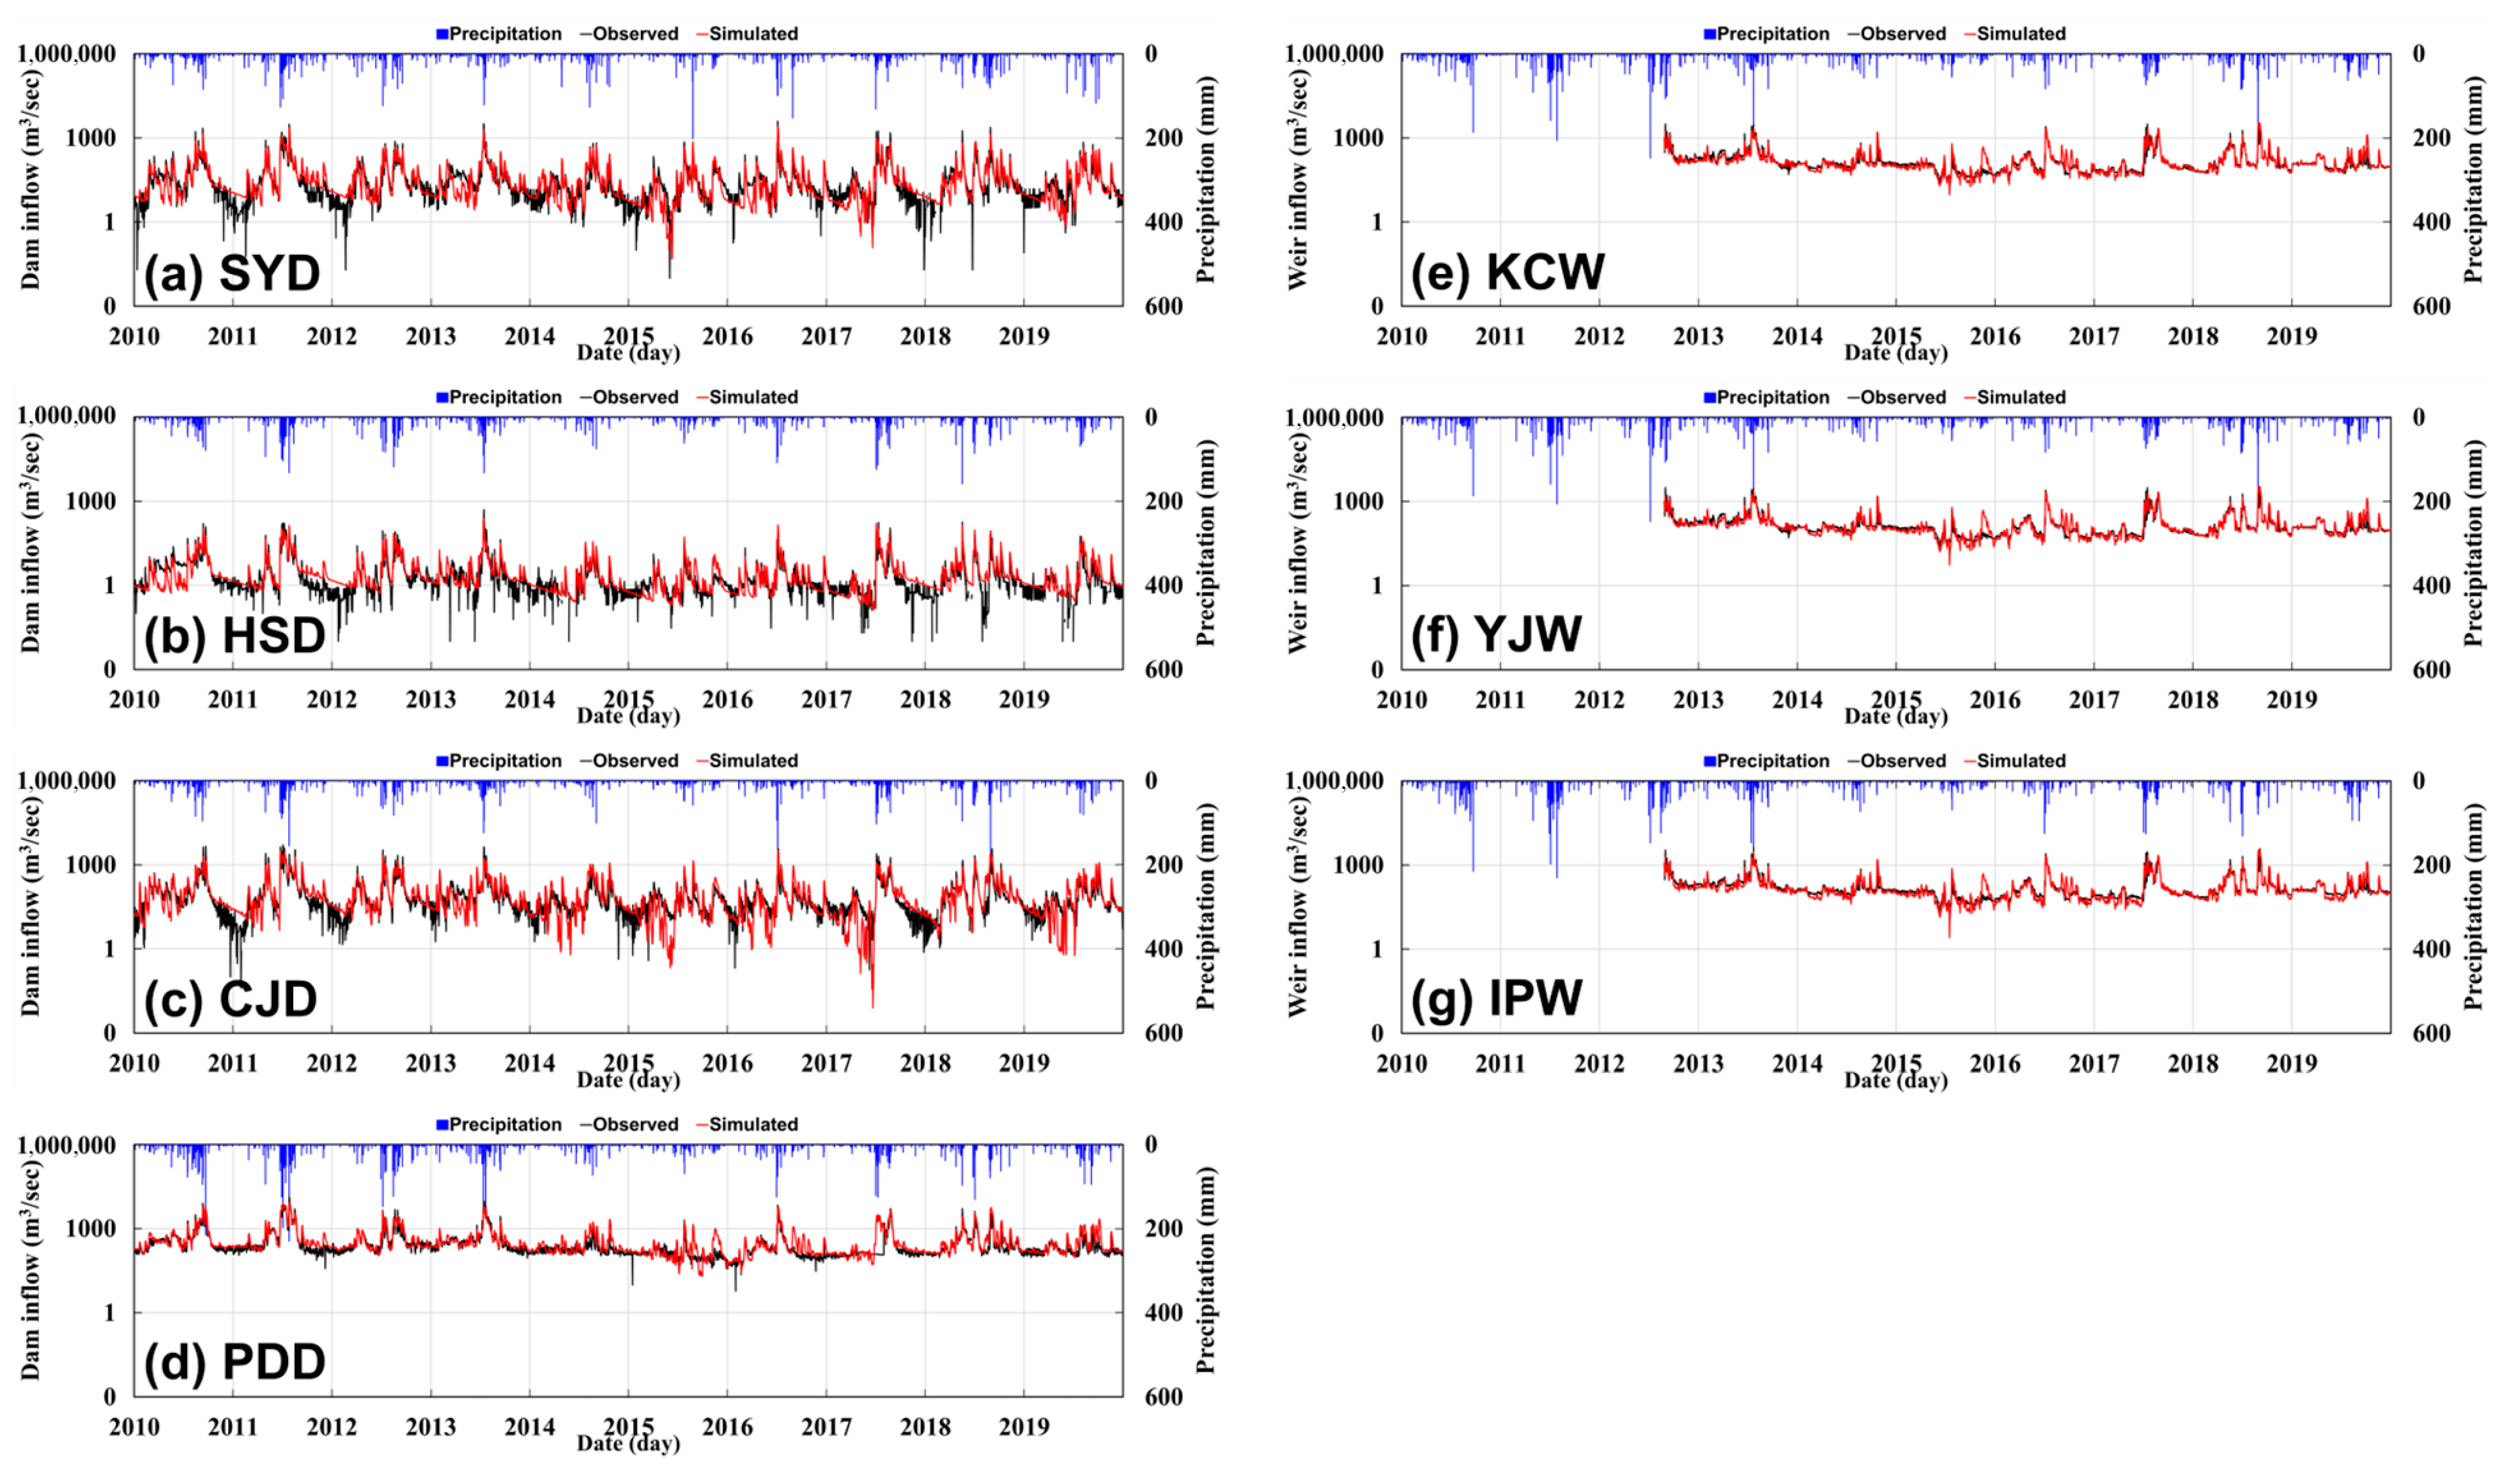
Figure 4a presents the calibrated time series inflow for SYD, Figure 4b for HSD, Figure 4c for CJD, and Figure 4d for PDD during 2010–2019. Similarly, Figure 4e shows the calibrated inflow time series for KCW, Figure 4f for YJW, and Figure 4g for IPW. As observed in these figures, the three multi-functional weirs exhibit highly synchronized temporal variations in streamflow. This similarity is primarily because these weirs are located sequentially along the same main stem of the South Han River, thus sharing identical regional weather conditions as boundary inputs. Furthermore, their inflow patterns are heavily dominated by the regulated, controlled releases from the upstream multi-purpose dams, particularly the HSD and CJD. Table 3 summarizes the average R2 (coefficient of determination), NSE (Nash–Sutcliffe Efficiency), and RMSE (root-mean-squared error) values for all calibration points. For the four multi-purpose dams, the statistical results indicate that the average R2 values were 0.72, 0.75, 0.75, and 0.74, while the average NSE values were 0.70, 0.69, 0.71, and 0.66, respectively. The average RMSE values were 2.97 mm/day, 3.02 mm/day, 2.18 mm/day, and 1.56 mm/day. For the three multi-functional weirs, the average R2 for KCW, YJW, and IPW were 0.87, 0.85, and 0.86, respectively, while the average NSE were 0.76, 0.75, and 0.79. The average RMSE values were 1.77 mmm/day, 1.06 mm/day, and 1.02 mm/day. Overall, the model performance for both structures falls within the ‘Very Good’ to ‘Satisfactory’ range [34,35].

3.2. Increased Groundwater Abstraction Impact on Streamflow

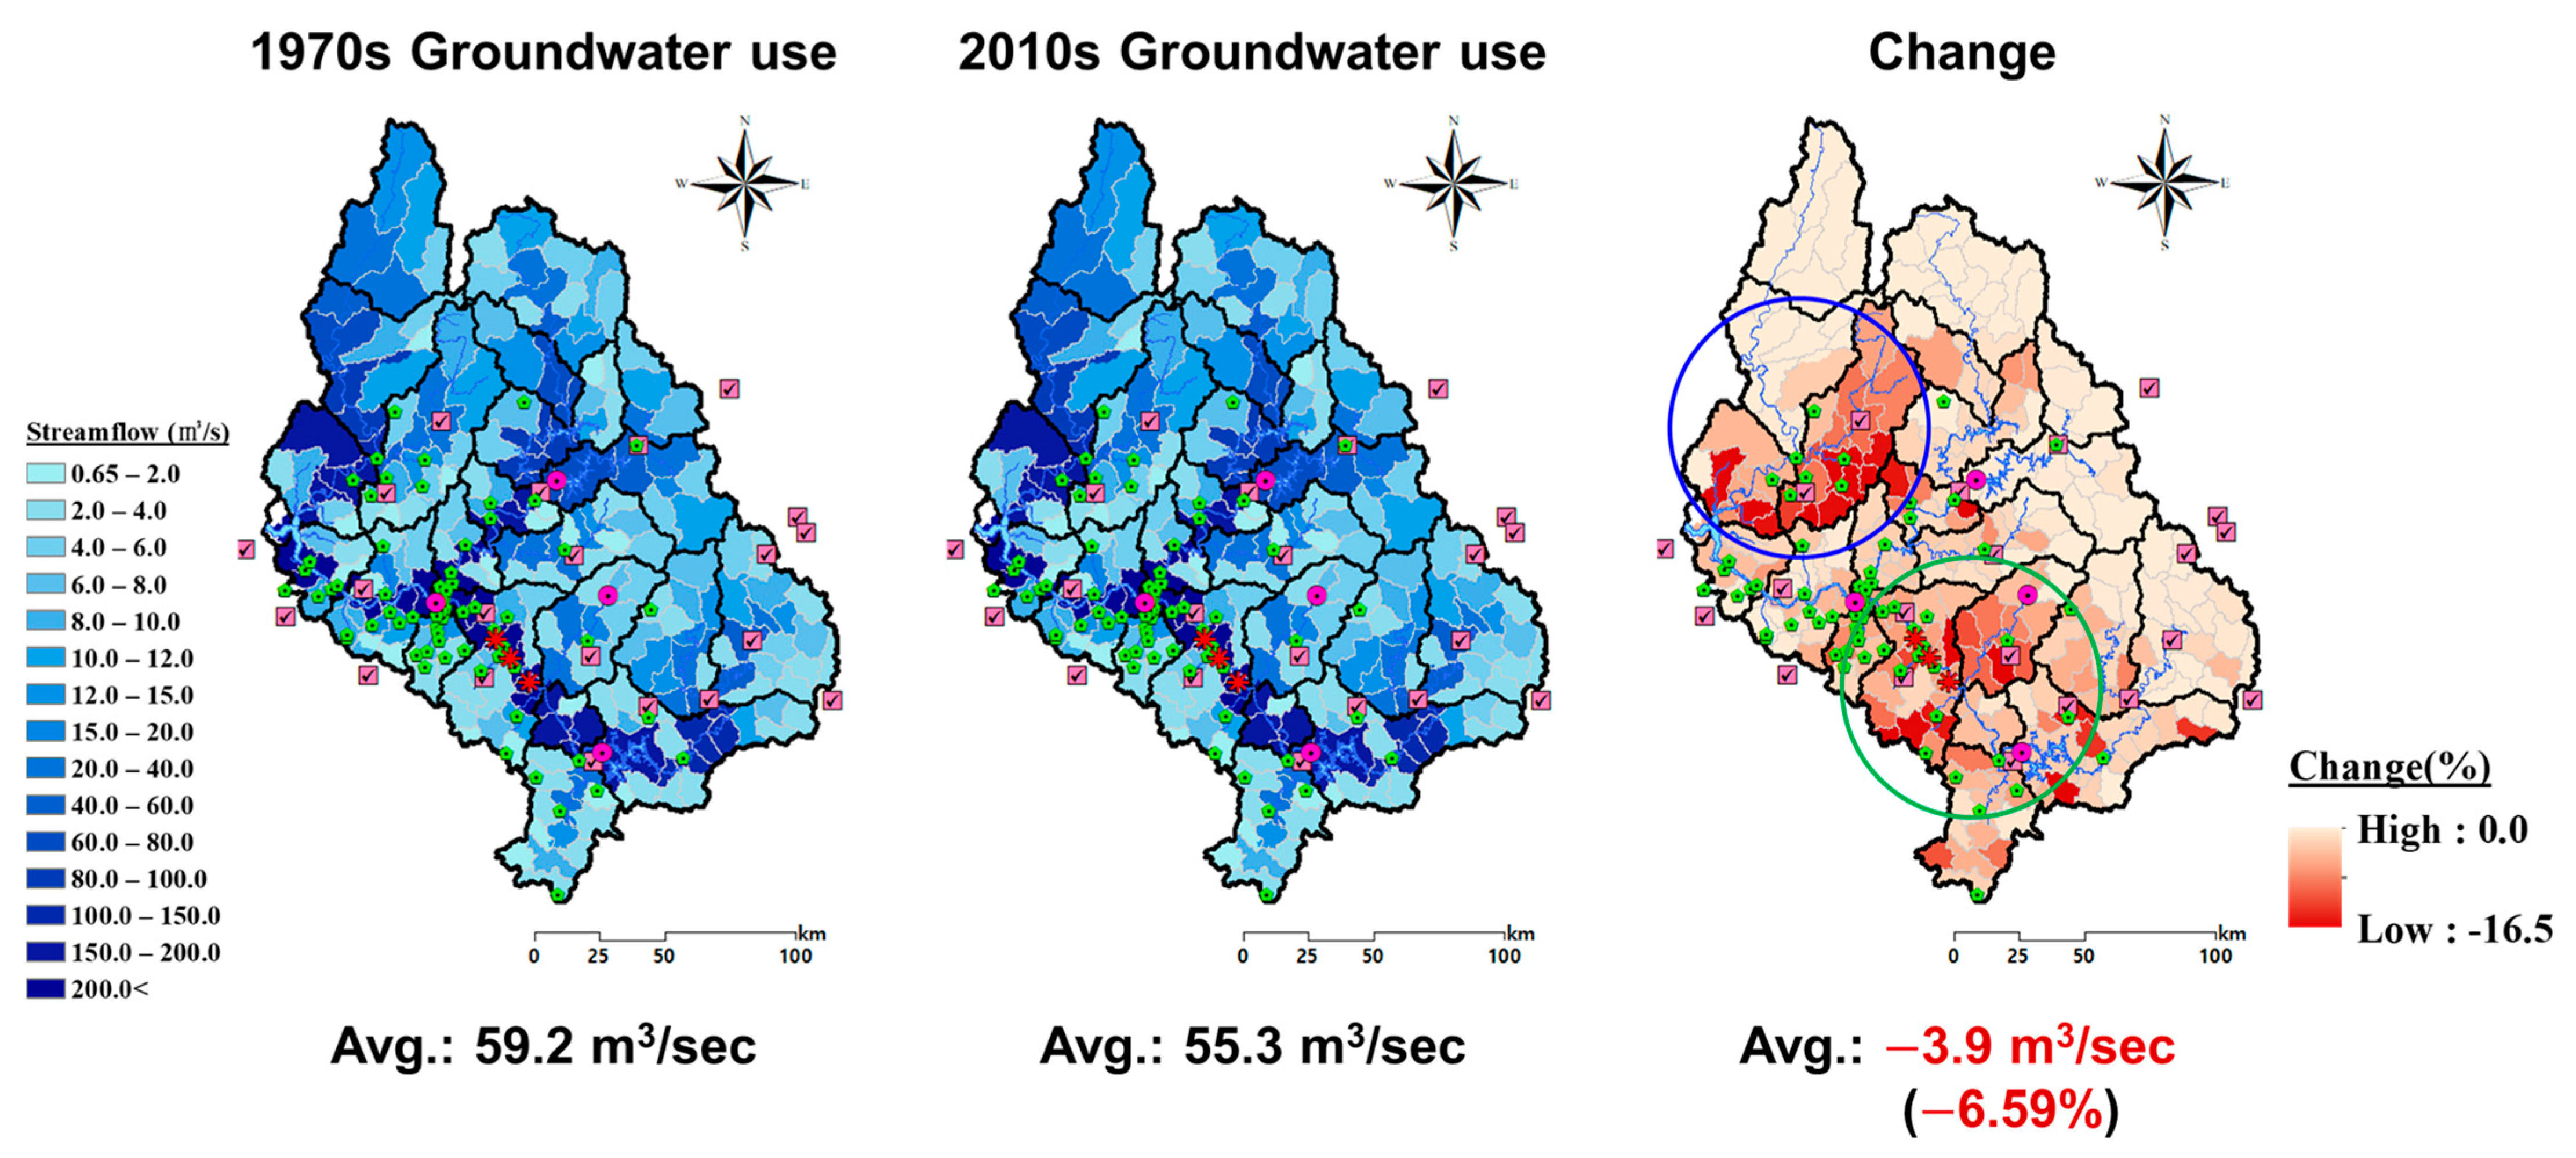
Using the calibrated SWAT, the 1970s groundwater use dataset was applied to the same standard watersheds under 2010s weather conditions to quantify the hydrological changes (Figure 5). The simulation results indicated that the average streamflow of the Han River basin was 59.2 m3/s under the 1970s groundwater abstraction condition. When the 2010s groundwater use dataset was applied, the average streamflow decreased to 55.3 m3/s, representing a reduction of 3.9 m3/s (−6.59%). The analysis showed a maximum average annual decrease in streamflow of up to 16.5% among the standard watersheds over the entire simulation period. As expected, the reduction magnitude during a specific single month (e.g., during the extreme dry season) could be significantly larger than this long-term average.
Spatially, the reduction in streamflow was unevenly distributed across the watershed. The decline was particularly pronounced in the Hantan River (Figure 5, blue circle) and the Seom River (Figure 5, green circle). Specifically, the average streamflow in the Hantan River decreased by 6.1%, while both the downstream area of HSD and the Seom River experienced a decrease of 4.2%. According to the land use analysis (Figure 1c), these regions are characterized by relatively high proportions of urbanized and agricultural areas, which account for 23.3%, 32.3%, and 14.0% of their respective watershed areas.

3.3. Increased Groundwater Abstraction Impact on Watershed Hydrology

The impact of increased groundwater abstraction (i.e., 22.3 mm/year, which accounts for approximately 1.68% of the annual precipitation as detailed in Section 2.1) on hydrological components is summarized in Table 4. The simulation results showed that the total runoff (TR) decreased from 740.0 mm to 720.4 mm, representing a 2.7% reduction (−19.6 mm). The baseflow (BF) declined from 89.5 mm to 71.0 mm, corresponding to a 20.7% decrease (−18.5 mm), while the groundwater recharge (GWR) decreased from 114.8 mm to 90.9 mm, a reduction of 20.8% (−23.9 mm). Other components such as evapotranspiration (ET), surface runoff (SR), and lateral flow (LF) showed negligible changes. Notably, the average annual groundwater abstraction of 22.3 mm directly resulted in an 18.5 mm reduction in BF, indicating that approximately 83% of the abstracted volume was reflected in the decrease in BF. While the percentage reduction in TR (2.7%) might appear relatively small, the substantial decreases in BF (20.7%) and GWR (20.8%) clearly indicate that the hydrological impact of groundwater abstraction is highly significant and concentrated on subsurface components. These >20% reductions far exceed typical model uncertainty margins, providing a robust signal of aquifer depletion.
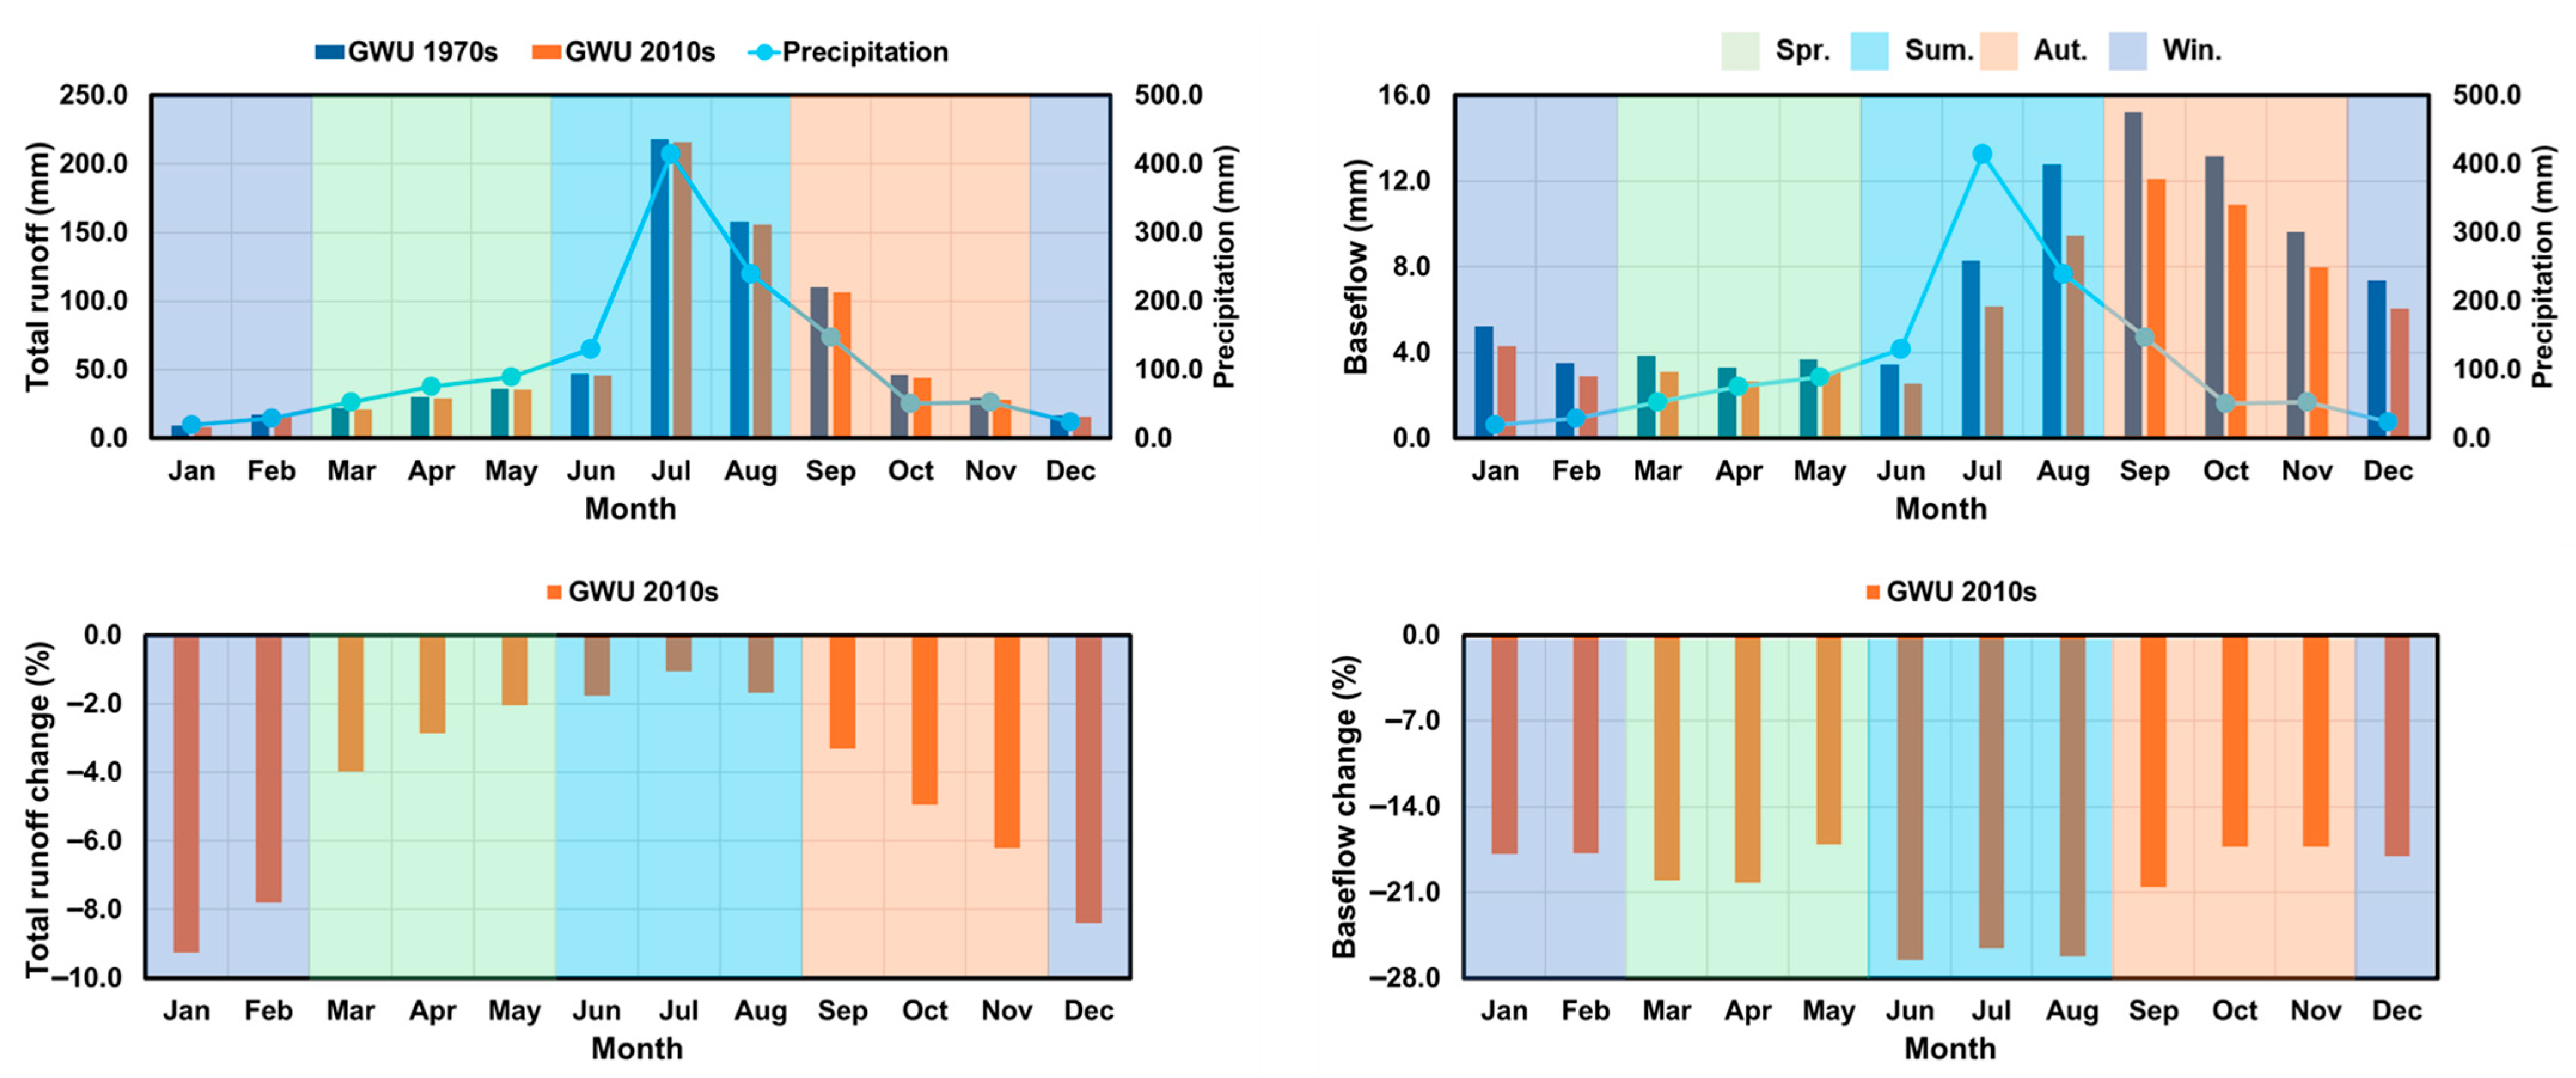
Figure 6 and Table 5 present the monthly and seasonal changes in TR and BF. The seasonal analysis revealed distinct temporal variations in the reduction in TR. Instead of a uniform decrease throughout the year, the main changes demonstrate that the most pronounced proportional reductions in TR occurred during the autumn and winter seasons. Specifically, the decrease in TR was numerically largest in autumn but proportionally the highest in winter. Conversely, the spring and summer seasons exhibited relatively minor percentage decreases in TR, despite the high abstraction volumes during the summer. Regarding the seasonal changes in BF, the results showed consistent and substantial decreases across all seasons. Unlike TR, BF experienced severe reductions year-round, with the highest percentage reduction occurring during the summer season, coinciding with the peak groundwater abstraction period.

3.4. Flow Duration Analysis

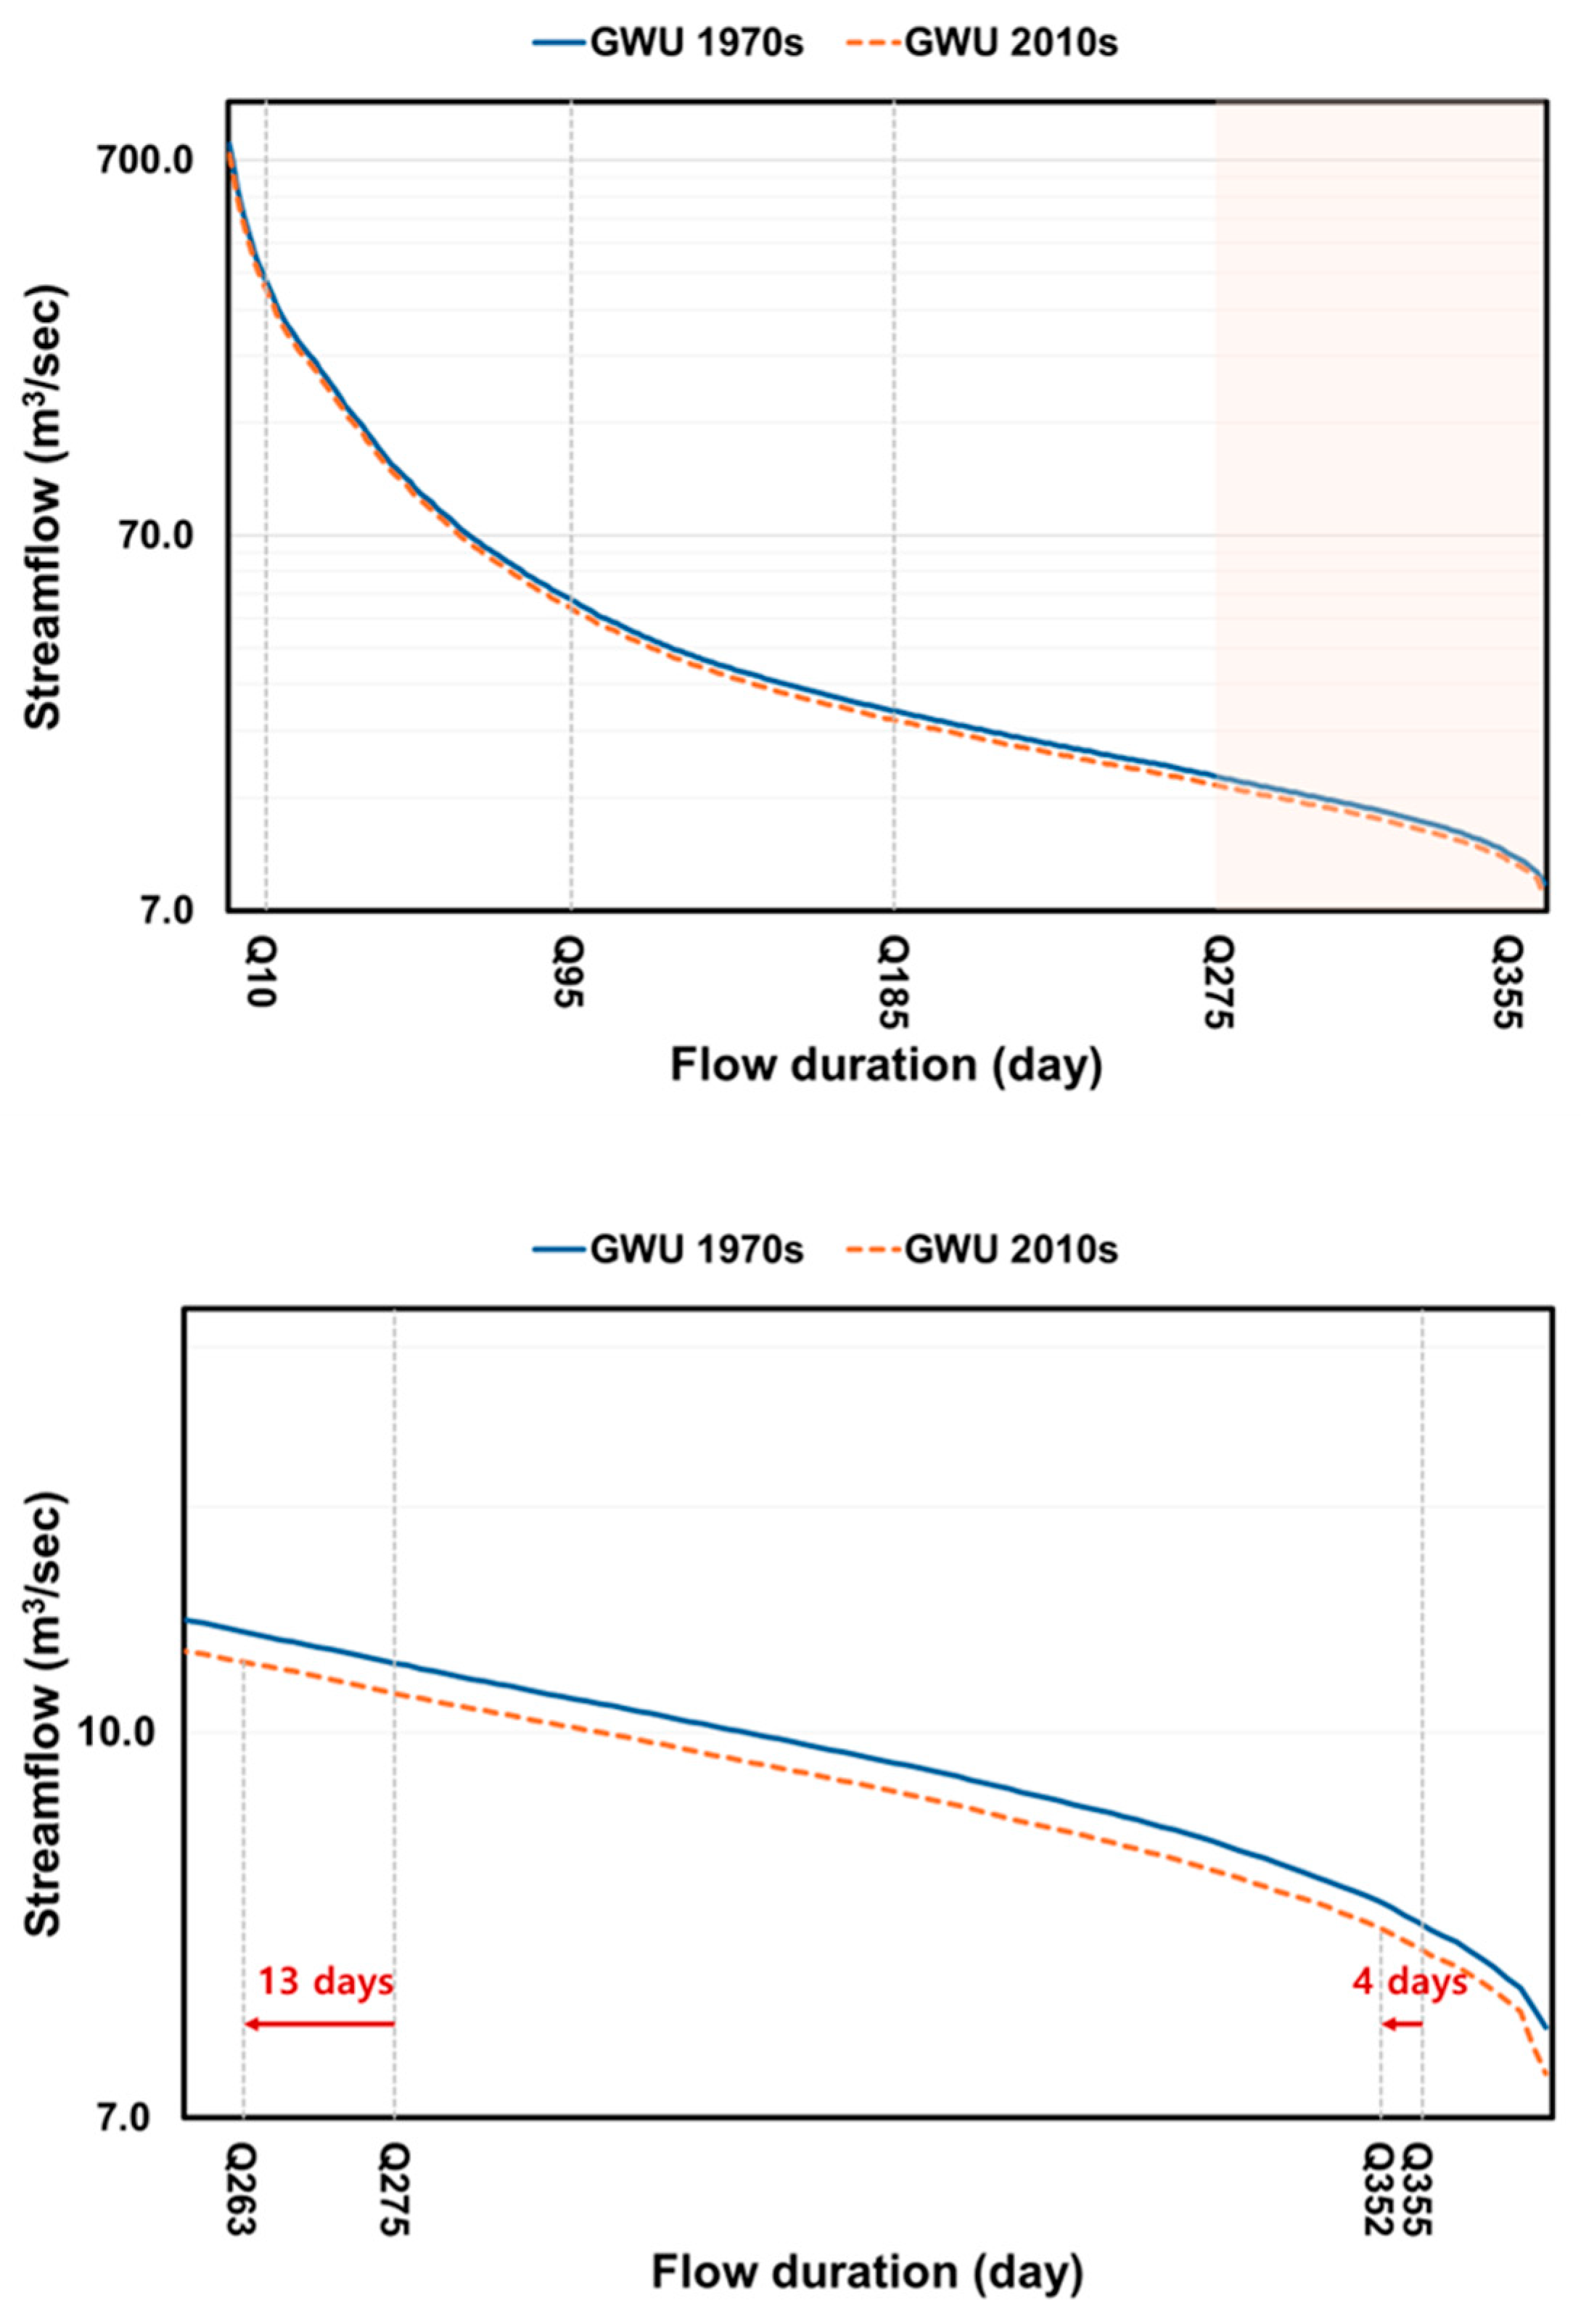
The flow duration analysis results for the 1970s and 2010s groundwater abstraction conditions are presented in Figure 7 and Table 6. The flow duration curves indicated that the streamflow across all flow regimes decreased under the 2010s groundwater abstraction condition compared to the 1970s. As detailed in Table 6, the main changes reveal a consistent downward shift across the entire flow duration curve. Rather than listing the specific numerical reductions for each flow regime, the primary trend demonstrates that, while the absolute volumetric reductions were naturally larger during high flows (Q10), the persistent relative decreases across moist (Q95), mid-range (Q185), dry (Q275), and low-flow (Q355) conditions indicate a comprehensive depletion of the streamflow. The exact numerical values for each flow regime are summarized in Table 6. Crucially, this overall downward shift in the flow duration curve resulted in a severe reduction in the duration for maintaining specific streamflow levels. Specifically, the exceedance duration for the specific flow volume representing the 1970s Q275 was reduced by 13 days in the 2010s, with its flow duration effectively shifting from Q275 to Q263.

4. Discussion

4.1. Mechanisms of Hydrological Response

Among all hydrological components, BF and GWR were found to be the most sensitive to increased groundwater abstraction (Table 4) [36]. The reduction in BF contributed directly to the decrease in TR. This response is governed by the water balance mechanism where increased abstraction artificially removes water from the aquifer, lowering the water table and subsequently reducing the groundwater discharge to the stream.
A critical finding of this study is the identification of a seasonal lag effect. While groundwater abstraction in the 2010s increased by approximately 2.4 times in summer compared to the 1970s (accounting for 53% of the annual total), the reduction in TR was more pronounced in autumn and winter (4.2% and 8.4%) than in summer (1.3%) (Table 1, Figure 6, and Table 5). This indicates that intensive summer withdrawal depletes aquifer storage, which fails to recover sufficiently to sustain the baseflow during the subsequent dry seasons (autumn and winter) [37]. This depletion of the hydrological buffering capacity exacerbates the streamflow reduction during low-flow periods, heightening the vulnerability to the drought conditions [38]. The severity of the baseflow reduction and the identified seasonal dynamics in the Han River basin are consistent with the trends observed in other regions facing intensive groundwater stress. For instance, studies in the High Plains Aquifer (USA) and various Mediterranean basins have similarly documented that persistent over-abstraction leads to significant baseflow depletion (ranging from 20% to 30%), often causing perennial streams to shift toward intermittent flow regimes [39,40]. While those studies primarily highlight the annual volumetric loss, our findings uniquely underscore that, even in monsoon-dominated regions with high summer precipitation, the seasonal lag effect can trigger critical water shortages during the dry season, suggesting that the Han River’s hydrological resilience is becoming increasingly fragile compared to international benchmarks.

4.2. Socio-Hydrological Implications for Water Management

The spatial analysis revealed that streamflow reductions were significant in the Hantan and Seom River basins, which are characterized by a high proportion of agricultural and urbanized areas (Figure 1c and Figure 5). This suggests that the combined pressure of municipal and agricultural groundwater withdrawal is a primary driver of local streamflow depletion. The flow duration analysis confirmed that the risk of stream drying—quantified by the reduction in flow duration from Q275 to Q263 for the same flow magnitude—effectively extended the dry season by 13 days (Figure 7 and Table 6). This extension implies a serious threat to water security and aquatic ecosystems [41,42]. Therefore, these findings should be effectively integrated into IWRM strategies. Decision-making bodies, such as the MCEE and local governments, should consider the baseflow deficit caused by groundwater pumping when establishing dam operation rules or permitting new groundwater wells. Active management strategies, such as artificial recharge or wastewater reuse, are essential for compensating for the identified baseflow loss [43].

4.3. Limitations and Future Research

While this study provides valuable insights into the mechanism of groundwater abstraction impacts, both model-specific and methodological limitations should be acknowledged. Regarding the hydrological modeling, while the overall calibration was satisfactory, some discrepancies were observed during specific periods (Figure 4 and Table 3). For instance, the model did not adequately reproduce the spring inflow patterns from 2013 to 2015, which can be attributed to the severe multi-year droughts. Furthermore, the simulation tended to overestimate the dam inflows during the winter season of specific years (e.g., 2011, 2012, and 2015). This winter overestimation is a recognized limitation of the SWAT, primarily due to the inherent uncertainties in fully capturing complex winter hydrological dynamics, such as snow accumulation, snowmelt timing, and soil freezing/thawing processes during dry periods [44]. Beyond these simulation uncertainties, several methodological limitations specific to the groundwater assessment must be addressed.
First, the WUS module in SWAT treats groundwater withdrawal as a permanent loss from the watershed [15,25,32]. In reality, a portion of the abstracted water returns to the hydrological system. For instance, the irrigation water in rice paddies partly infiltrates to recharge the groundwater (return flow), and municipal water is discharged back to the river via wastewater treatment plants after use [45]. Furthermore, because the abstracted groundwater was simulated as a direct consumptive loss from the aquifer using the WUS module, the re-application of this water for agricultural irrigation was not explicitly routed to the land surface. Consequently, potential secondary alterations in other hydrological components, such as increased ET, SR, or PE, were not fully captured in the current model setup [45,46]. Since our model did not account for these return flows and surface re-applications, the simulated streamflow reduction of 6.59% likely represents a conservative estimate (an overestimation of the reduction) compared to actual conditions. To quantitatively approximate a portion of this overestimation, we can consider the constant discharge from wastewater treatment plants. Assuming the total increase in abstraction is roughly 0.4 m3/s, with approximately 47% allocated for general water supply (as the remaining 53% is primarily concentrated in the summer for irrigation), the uniform return flow from wastewater treatment plants would be approximately 0.19 m3/s. if this return flow is explicitly accounted for 4.3% (and similarly to 4.7% for Q185). Furthermore, while agricultural return flows typically occur during the wet summer season and their estimation is more complex, they would undoubtedly provide additional buffering against streamflow depletion during those months Therefore, while the absolute magnitude of streamflow reduction might be buffered by these return flows, the identified seasonal lag effect—where intensive summer withdrawal leads to winter BF depletion—remains a scientifically valid and critical mechanism describing the watershed’s vulnerability.
However, agricultural return flows typically occur during the wet summer season, and wastewater treatment plant discharges are generally constant throughout the year. Therefore, while the absolute magnitude of the streamflow reduction might be buffered by these return flows, the identified seasonal lag effect—where intensive summer withdrawal leads to winter baseflow depletion—remains a scientifically valid and critical mechanism describing the watershed’s vulnerability.
Second, regarding the data currency, this study utilized the 2010s dataset as a baseline to isolate the physical mechanisms of the lag effect. Since the groundwater use trends in the Han River basin have continued to rise or maintain high levels since 2015, the 2010s scenario effectively serves as a representative baseline for modern hydrological stress. While the 2010s scenario uses data up to 2015, national statistics show that the groundwater abstraction in the Han River basin has continued to rise or maintain its peak levels through 2024. Thus, the 2010s period serves as a statistically robust baseline, ensuring the study remains relevant to the current 2026 context rather than being purely retrospective.
Third, it should be acknowledged that the historical groundwater use data from the 1970s, derived from statistical yearbooks, contains inherent uncertainties regarding spatial distribution and volume accuracy compared to modern digital metering [47]. However, the focus of this study is on the relative hydrological change driven by the marked increase in groundwater withdrawal over decades. Since the long-term trend of increasing groundwater abstraction is distinct and evident (an approximately 12.7 mm/year increase), the identified mechanism of the seasonal lag effect remains a robust finding despite the potential noise in the historical dataset (Figure 2). Notably, as discussed in Section 2.1, while the total annual abstraction represents a relatively small fraction (1.68%) of the average annual precipitation, its disproportionate impact on subsurface components (a 20.7% reduction in baseflow) underscores the extreme sensitivity of the basin’s hydrological buffering capacity to human-induced withdrawals (Figure 6, Table 4 and Table 5).
Finally, while this study employed a physically based model, future research could benefit from integrating Machine Learning (ML) and geostatistical interpolation (e.g., Kriging) to improve the spatial resolution of the groundwater data. Recent studies [48,49] have demonstrated that combining physical modeling with ML-based drought inference can significantly enhance predictive accuracy and management efficiency. Furthermore, as a valuable follow-up study, future research should incorporate the synergistic impacts of climate change and socio-economic shifts. Anticipated changes in precipitation patterns and rising temperatures, coupled with the expected population growth and the subsequent increase in water demand, are likely to further exacerbate groundwater depletion and seasonal baseflow instability [50,51,52]. Investigating these multi-faceted stressors will be critical for developing adaptive and resilient water management strategies to ensure long-term sustainability.

5. Conclusions

This study quantitatively isolated the hydrological impacts of increased groundwater abstraction using a successfully calibrated SWAT model, which demonstrated satisfactory to very good performance for simulating the watershed’s complex hydrology. Compared to the 1970s baseline, the 2010s scenario resulted in reductions in total runoff that varied seasonally between 1.3% (summer) and 8.4% (winter). Furthermore, the impact on subsurface components was even more severe, causing an overall 20.7% (18.5 mm) reduction in annual baseflow (with seasonal decreases ranging from 18.0% to 26.1%) and a 20.8% (23.9 mm) decrease in groundwater recharge. Crucially, we confirmed a seasonal lag effect—intensive summer withdrawals deplete the watershed’s buffering capacity, failing to sustain the autumn and winter streamflow. Consequently, the dry season desiccation period (Q275) was extended by 13 days.
Importantly, these findings from the 2010s remain highly valid and relevant for the current 2020–2026 period, as national statistics indicate that the groundwater reliance in the Han River basin has continued to persist or intensify [26]. To ensure long-term sustainability under the growing uncertainties of Climate Change, water management policies must incorporate specific, quantitative targets. We urgently recommend implementing decentralized water retention infrastructures—such as subsurface dams, sand dams, and Managed Aquifer Recharge (MAR)—to strictly compensate for the 18.5 mm basin-wide baseflow deficit. Integrating these explicit targets into the IWRM framework will provide regional water authorities (e.g., the MCEE) and local stakeholders with the practical tools needed to enhance the watershed’s resilience against future water stress.

Author Contributions

Conceptualization, Y.K. and W.K.; methodology, Y.L. and W.K.; validation, S.W. and Y.L.; resources, S.K.; data curation, Y.K.; writing—original draft preparation, Y.K.; writing—review and editing, Y.K. and W.K.; visualization, Y.L. and S.W.; supervision, S.K.; project administration, S.K.; funding acquisition, S.K. and Y.L. All authors have read and agreed to the published version of the manuscript.

Funding

This work was supported by Korea Environment Industry & Technology Institute (KEITI) through Aquatic Ecosystem Conservation Research Program, funded by the Korea Ministry of Climate, Energy and Environment (MCEE) (RS-2025-02304832). This work was supported by the Korea Environment Industry & Technology Institute (KEITI) through the Water Management Program for Drought Project, funded by the Korea Ministry of Climate, Energy, and Environment (MCEE) (2022003610002). This paper was written as part of Konkuk University’s research support program for its faculty on sabbatical leave in 2023.

Data Availability Statement

The data used and analyzed during this study are available from the corresponding author upon reasonable request due to the large size and complexity of the datasets.

Conflicts of Interest

The authors declare no conflicts of interest.

References

  1. Winter, J.G.; Duthie, H.C. Effects of urbanization on water quality, periphyton and invertebrate communities in Southern Ontario stream. Can. Water Resour. J. 1998, 23, 245–257. [Google Scholar] [CrossRef]
  2. Geris, J.; Comte, J.C.; Franchi, F.; Petros, A.K.; Tirivarombo, S.; Selepeng, A.T.; Villholth, K.G. Surface water-groundwater interactions and local and use control water quality impacts of extreme rainfall and flooding in a vulnerable semi-arid region of Sub-Saharan Africa. J. Hydrol. 2022, 609, 127834. [Google Scholar] [CrossRef]
  3. Sophocleous, M. Interactions between groundwater and surface water: The state of the science. Hydrogeol. J. 2022, 10, 52–67. [Google Scholar] [CrossRef]
  4. Swain, S.; Taloor, A.K.; Dhal, L.; Sahoo, S.; Al-Ansari, N. Impact of climate change on groundwater hydrology: A comprehensive review and current status of the Indian hydrogeology. Appl. Water Sci. 2022, 12, 120. [Google Scholar] [CrossRef]
  5. Siebert, S.; Burke, J.; Faures, J.M.; Frenken, K.; Hoogeveen, J.; Döll, P.; Portmann, F.T. Groundwater use for irrigation—A global inventory. Hydrol. Earth Syst. Sci. 2010, 14, 1863–1880. [Google Scholar] [CrossRef]
  6. Kirk, S.; Herbert, A.W. Assessing the impact of groundwater abstractions on river flows. Geol. Soc. Lond. Spec. Publ. 2002, 193, 211–233. [Google Scholar] [CrossRef]
  7. Gleeson, T.; VanderSteen, J.; Sophocleous, M.A.; Taniguchi, M.; Alley, W.M.; Allen, D.M.; Zhou, Y. Groundwater sustainability strategies. Nat. Geosci. 2010, 3, 378–379. [Google Scholar] [CrossRef]
  8. Park, G.M.; Lee, H.J.; Koo, M.H.; Kim, Y.C. Strategies for an effective artificial recharge in alluvial stream-aquifer systems undergoing heavy seasonal pumping. J. Geol. Soc. Korea 2016, 52, 211–219. [Google Scholar] [CrossRef]
  9. Wendt, D.E.; Van Loon, A.F.; Bloomfield, J.P.; Hannah, D.M. Asymmetric impact of groundwater use on groundwater droughts. Hydrol. Earth Syst. Sci. 2020, 24, 4853–4868. [Google Scholar] [CrossRef]
  10. Wada, Y.; Van Beek, L.P.H.; Van Kempen, C.M.; Reckman, J.W.T.M.; Vasak, S.; Bierkens, M.F.P. Global depletion of groundwater resources. Geophys. Res. Lett. 2010, 37, L20402. [Google Scholar] [CrossRef]
  11. de Graaf, I.E.M.; Gleeson, T.; Van Beek, L.P.H.; Sutanudjaj, E.H.; Bierkens, M.F.P. Environmental flow limits to global groundwater pumping. Nature 2019, 574, 90–94. [Google Scholar] [CrossRef]
  12. Yoo, J.H.; Kim, K.H.; Park, Y.G.; Lee, G.H.; Kim, S.J.; Jung, C.G. A study on the use of GIS-based time series spatial data for streamflow depletion assessment. J. Korean Assoc. Geogr. Inf. Stud. 2018, 21, 50–63. [Google Scholar] [CrossRef]
  13. Liu, Q.; Gui, D.; Zhang, L.; Niu, J.; Dai, H.; Wei, G.; Hu, B.X. Simulation of regional groundwater levels in arid regions using interpretable machine learning models. Sci. Total Environ. 2022, 831, 154902. [Google Scholar] [CrossRef]
  14. Lee, S.Y.; Baek, W.J.; Kim, J.Y.; Jeong, C.S.; Kang, J.M. Groundwater flow analysis during excavation for underground tunnel construction. J. Korean GEO-Environ. Soc. 2024, 25, 19–24. [Google Scholar] [CrossRef]
  15. Kim, W.J.; Kim, S.J.; Kim, J.U.; Lee, J.W.; Woo, S.Y.; Kim, S.H. Assessment of long-term groundwater use increase and forest growth impact on watershed hydrology. Water Resour. Manag. 2022, 36, 5801–5821. [Google Scholar] [CrossRef]
  16. Kim, G.; Lee, J.B.; Agoussou, A.; Yang, J.S. Proposal for the groundwater based countermeasures to secure water resources considering regional characteristics of water resources vulnerable areas. J. Korea Water Resour. Assoc. 2022, 55, 191–203. [Google Scholar] [CrossRef]
  17. Prayag, A.G.; Zhou, Y.; Srinivasan, V.; Stigter, T.; Verzijl, A. Assessing the impact of groundwater abstractions on aquifer depletion in the Cauvery Delta, India. Agric. Water Manag. 2023, 279, 108191. [Google Scholar] [CrossRef]
  18. Fantaye, S.M.; Wolde, B.B.; Haile, A.T.; Taye, M.T. Estimation of shallow groundwater abstraction for irrigation and its impact on groundwater availability in the Lake Tana sub-basin, Ethiopia. J. Hydrol. Reg. Stud. 2023, 46, 101365. [Google Scholar] [CrossRef]
  19. Abbas, S.A.; Bailey, R.T.; White, J.T.; Arnold, J.G.; White, M.J. Estimation of groundwater storage loss using surface-subsurface hydrologic modeling in an irrigated agricultural region. Sci. Rep. 2025, 15, 8350. [Google Scholar] [CrossRef]
  20. Lu, C.; Richards, L.A.; Wilson, G.J.L.; Krause, S.; Lapworth, D.J.; Gooddy, D.C.; Chakravorty, B.; Palya, D.A.; Niasar, V.J. Quantifying the impacts of groundwater abstraction on Ganges river water infiltration into shallow aquifers under the rapidly developing city of Patna, India. J. Hydrol. Reg. Stud. 2022, 42, 101133. [Google Scholar] [CrossRef]
  21. Yan, H.; Xie, Z.; Jia, B.; Li, R.; Wang, L.; Tian, Y.; You, Y. Impact of groundwater overextraction and agricultural irrigation on hydrological processes in an inland arid basin. J. Hydrol. 2025, 653, 132770. [Google Scholar] [CrossRef]
  22. Cheema, M.J.M.; Immerzeel, W.W.; Bastiaanssen, W.G.M. Spatial quantification of groundwater abstraction in the irrigated Indus basin. Groundwater 2013, 52, 25–36. [Google Scholar] [CrossRef] [PubMed]
  23. Zhang, X.; Ren, L.; Kong, X. Estimating spatiotemporal variability and sustainability of shallow groundwater in a well-irrigated plain of the Haihe River basin using SWAT model. J. Hydrol. 2016, 541, 1221–1240. [Google Scholar] [CrossRef]
  24. Shafeeque, M.S.M.; Cheema, M.J.M.; Sarwar, A.S.A.; Hussain, M.W. Quantification of groundwater abstraction using SWAT model in Hakra branch canal system of Pakistan. Pak. J. Agric. Sci. 2016, 53, 249–255. [Google Scholar] [CrossRef]
  25. Lee, J.W.; Jung, C.G.; Kim, S.H.; Kim, S.J. Assessment of climate change impact on future groundwater-level behavior using SWAT groundwater-consumption function in Geum River basin of South Korea. Water 2019, 11, 949. [Google Scholar] [CrossRef]
  26. K-Water. Groundwater Statistical Yearbook; K-Water: Daejeon, Republic of Korea, 2024. [Google Scholar]
  27. National Geographic Institute (NGII). Digital Elevation Model (DEM). Available online: https://www.ngii.go.kr (accessed on 20 February 2026).
  28. Ministry of Climate, Energy and Environment (MCEE). Land Use Map. Available online: https://aid.mcee.go.kr (accessed on 20 February 2026).
  29. Rural Development Administration (RDA). Korean Soil Map. Available online: https://soil.rda.go.kr (accessed on 20 February 2026).
  30. Arnold, J.G.; Williams, J.R.; Srinivasan, R.; King, K.W. Swat Manual; USDA, Agricultural Research Service and Blackland Research Center: Temple, TX, USA, 1996. [Google Scholar]
  31. Neitsch, S.L.; Arnold, J.G.; Kiniry, J.R.; Williams, J.R. Soil and Water Assessment Tool: The Theoretical Documentation; U.S. Agricultural Research Service: Temple, TX, USA, 2001; pp. 340–367. [Google Scholar]
  32. Arnold, J.G.; Kiniry, J.R.; Srinivasan, R.; Williams, J.R.; Haney, E.B.; Neitsch, S.L. Swat 2012 Input/Output Documentation; Texas Water Resources Institute: College Station, TX, USA, 2013. [Google Scholar]
  33. National Groundwater Information Center (GIMS). Groundwater Statistical Yearbooks, Ministry of Climate, Energy and Environment, Sejong, Republic of Korea. Available online: https://www.gims.go.kr (accessed on 20 February 2026).
  34. Moriasi, D.H.; Wilson, B.N.; Douglas-Mankin, K.R.; Arnold, J.G.; Gowda, P.H. Hydrologic and water quality models: Use, calibration, and validation. Trans. ASABE 2012, 55, 1241–1247. [Google Scholar] [CrossRef]
  35. Mkhwanazi, M.; Chavez, J.R.; Rambikur, E.H. Comparison of large aperture scintillometer and satellite based energy balance models in sensible heat flux and crop evapotranspiration determine. Int. J. Remote Sens. Appl. 2012, 2, 24–30. [Google Scholar]
  36. Sun, S.; Tang, Q.; Konar, M.; Huang, Z.; Gleeson, T.; Ma, T.; Fang, C.; Cai, X. Domestic groundwater depletion supports China’s full supply chains. Water Resour. Res. 2022, 58, e2021WR030695. [Google Scholar] [CrossRef]
  37. Hellwig, J.; Stahl, K. An assessment of trends and potential future changes in groundwater-baseflow drought based on catchment response times. Hydrol. Earth Syst. Sci. 2018, 22, 6209–6224. [Google Scholar] [CrossRef]
  38. Cruz, M.G.; Hernandez, E.A.; Uddameri, V. Vulnerability assessment of agricultural production systems to drought stresses using robustness measures. Sci. Rep. 2021, 11, 21648. [Google Scholar] [CrossRef]
  39. Steward, D.R.; Allen, A.J. Peak groundwater depletion in the High Plains Aquifer, projections from 1930 to 2110. Agric. Water Manag. 2016, 170, 36–48. [Google Scholar] [CrossRef]
  40. Nie, W.; Zaitchick, B.F.; Rodell, M.; Kumar, S.V.; Anderson, M.C.A.; Hain, C. Groundwater withdrawals under drought: Reconciling GRACE and Land Surface Models in the United States High Plains Aquifer. Water Resour. Res. 2018, 54, 5282–5299. [Google Scholar] [CrossRef]
  41. Rolls, R.J.; Bond, N.R. Environmental and ecological effects of flow alteration in surface water ecosystems. In Water for the Environment: From Policy and Science to Implementation and Management; Academic Press: Cambridge, MA, USA, 2017; pp. 65–82. [Google Scholar] [CrossRef]
  42. Van Gerven, L.P.A.; Kuiper, J.J.; Janse, J.H.; Janssen, A.B.G.; Jeuken, M.; Mooij, W.M.; de Klein, J.J.M. How regime shifts in connected aquatic ecosystems are affected by the typical downstream increase of water flow. Ecosystems 2017, 20, 733–744. [Google Scholar] [CrossRef]
  43. Kim, Y.W.; Kim, W.J.; Woo, S.Y.; Lee, Y.G.; Kim, S.J. A study on investigation of stream drying phenomena in tributaries of the Han River basin and estimation of ecological flow. J. Korea Water Resour. Assoc. 2024, 57, 519–532. [Google Scholar] [CrossRef]
  44. Ahl, R.S.; Woods, S.W.; Zuuring, H.R. Hydrologic calibration and validation of SWAT in a snow-dominated Rocky Mountain Watershed, Montana, U.S.A. J. Am. Water Resour. Assoc. 2008, 44, 1411–1430. [Google Scholar] [CrossRef]
  45. Lee, J.W.; Jung, C.G.; Kim, D.Y.; Maeng, S.J.; Jeong, H.S.; Jo, Y.S.; Kim, S.J. A study on estimating the quick return flow from irrigation canal of agricultural water using watershed model. J. Korea Water Resour. Assoc. 2022, 55, 321–331. [Google Scholar] [CrossRef]
  46. Han, J.H.; Lee, S.R.; Kim, J.G. Quantifying stream return flow of agricultural water using SWAT-MODFLOW-PADDY model in Korean Paddy Fields. Agronomy 2024, 14, 2440. [Google Scholar] [CrossRef]
  47. Rowe, W.D. Understanding uncertainty. Risk Anal. 1994, 14, 743–750. [Google Scholar] [CrossRef]
  48. Schiavo, M.; Pedretti, D. Genetic and iterative metaheuristics—Informed algorithms for precision shallow groundwater modeling and drought inference. J. Geophys. Res. Mach. Learn. Comput. 2025, 2, e2025JH000854. [Google Scholar] [CrossRef]
  49. Zowam, F.J.; Milewski, A.M. Groundwater level prediction using machine learning and geostatistical interpolation models. Water 2024, 16, 2771. [Google Scholar] [CrossRef]
  50. Toure, A.; Diekkrüger, B.; Mariko, A.; Cissé, A.S. Assessment of groundwater resources in the context of climate change and population growth: Case of the Klela Basin in Southern Mali. Climate 2017, 5, 45. [Google Scholar] [CrossRef]
  51. Secci, D.; Tanda, M.G.; D’Oria, M.; Todaro, V. Artificial intelligence models to evaluate the impact of climate change on groundwater resources. J. Hydrol. 2023, 627, 130359. [Google Scholar] [CrossRef]
  52. Lu, X.; Wang, Z.; Zhao, M.; Peng, S.; Geng, S.; Ghorbani, H. Data-driven insights into climate change effects on groundwater levels using machine learning. Water Resour. Manag. 2025, 39, 3521–3536. [Google Scholar] [CrossRef]
Figure 1. (a) Location of the Han River basin with hydraulic structures and weather stations, (b) DEM, (c) land use, and (d) soil texture maps. The sharp linear boundary observed in the northern part of the basin (e.g., in (d)) indicates the limit of available spatial soil data due to the geopolitical border (Demilitarized Zone) with North Korea.
Water 18 00607 g001
Figure 2. Spatial distribution changes in groundwater use between 1970s and 2010s within the Han River basin. The blue and green circles indicate the Hantan and Seom River basin, respectively, highlighting the hotspots with the most substantial increases in groundwater abstraction.
Water 18 00607 g002
Figure 3. Overall study procedure of this study. The blue text represents the fixed baseline conditions (2010s), while the red text highlights the substituted historical conditions (1970s) to isolate the impact of groundwater abstraction.
Water 18 00607 g003
Figure 4. Calibrated time series inflow for multi-purpose dams and multi-functional weirs from 2010 to 2019. (Note: The y-axis representing the inflow is presented on a logarithmic scale.)
Water 18 00607 g004
Figure 5. The average streamflow changes due to increased groundwater abstraction. The value at the bottom (-6.59%) indicates the basin-wide spatial average reduction across all subbasins.
Water 18 00607 g005
Figure 6. The monthly changes in TR and BF.
Water 18 00607 g006
Figure 7. The flow duration curves of 1970s and 2010s groundwater abstraction conditions.
Water 18 00607 g007
Table 1. Summary of monthly groundwater abstraction for 1970s and 2010s.
PeriodMonth
Jan.Feb.Mar.Apr.MayJun.Jul.Aug.Sep.Oct.Nov.Dec.
1970s
groundwater
abstraction
(106 ton)
0.270.270.270.300.290.840.940.950.450.270.270.27
2010s
groundwater
abstraction
(106 ton)
0.570.570.570.630.621.942.202.211.010.570.570.57
Table 2. Summary of SWAT parameters and adjusted value for calibration.
ParameterDefinitionRangeInitial *
(Default)
Adjusted Value
SYDHSDCJDPDDKCWYJWIPW
CN2SCS curve number for moisture condition35 to 98Given by
HRUs **
−5−10−5−5−5--
CH_N (2)Manning’s “n” value for main channel−1 to 0.30.0140.080.080.060.060.060.060.08
ESCOSoil evaporation compensation coefficient0 to 10.950.900.900.600.600.650.650.65
SOL_AWCAvailable water capacity of the soil layer
(mmH2O/mm soil)
0 to 1Given by
HRUs
* 1.10* 1.05* 0.95-* 1.10* 1.05-
SOL_KSaturated hydraulic conductivity (mm/hr)0 to 2000Given by
HRUs
* 1.10* 1.10* 0.95--* 1.05-
GW_DELAYDelay time for aquifer recharge (days)0 to 50031100120807010080120
GWQMNThreshold water level in shallow aquifer for base flow (mm)0 to 50001000500500500500500500500
ALPHA_BFBase flow recession constant0 to 10.0480.300.300.700.700.800.750.75
RES_ESAReservoir surface area when the reservoir is filled to emergency spillway (ha)--700058097002000350350350
RES_EVOLVolume of water needed to fill the reservoir to the emergency spillway (104 m3)--290,00010,690275,00034,4001870213024,300
RES_PSAReservoir surface area when the reservoir is filled to the principal spillway (ha)--6180500877517003003003000
RES_PVOLVolume of water needed to fill the reservoir to the principal spillway (104 m3)--250,3807890225,15219,40087011301430
RES_VOLInitial reservoir volume
(104 m3)
--154,8607601,074,10068308807900960
* Initial (Default) values represent the uncalibrated parameters automatically assigned by the SWAT prior to the calibration process. ** Given by HRUs, this indicates that the initial values are spatially distributed and vary for each HRU based on its specific land use, soil, and slope characteristics. The adjusted values for these parameters (e.g., marked with * or -) represent relative or additive modifications applied to the baseline HRU-specific values.
Table 3. The summary of statistical calibration results of SWAT.
PointCalibration
Component
Objective Function
R2CriteriaNSECriteriaRMSE (mm/Day)
SYDDam inflow0.72Satisfactory0.70Satisfactory2.97
HSDDam inflow0.75Good0.69Satisfactory3.02
CJDDam inflow0.75Good0.71Good2.18
PDDDam inflow0.74Satisfactory0.66Satisfactory1.56
KCWWeir inflow0.87Very Good0.76Good1.77
YJWWeir inflow0.85Good0.75Good1.06
IPWWeir inflow0.86Very Good0.79Good1.02
Table 4. Summary of hydrological component changes driven by increased groundwater abstraction.
Groundwater AbstractionHydrological Component
TRETSRLFBFPEGWR
1970s
groundwater
abstraction
(mm)
740.0487.1166.7458.189.5116.7114.8
2010s
groundwater
abstraction
(mm)
720.4487.1166.7458.171.0116.790.9
Change
(mm)
−19.60.00.00.0−18.50.0−23.9
Change
(%)
−2.60.00.00.0−20.70.0−20.8
Table 5. The summary of seasonal changes in TR and BF.
SeasonPrecipitation
(mm)
TR_1970s
(mm)
TR_2010s
(mm)
Change
(%)
BF_1970s
(mm)
BF_2010s
(mm)
Change
(%)
Spring
(Mar.~May)
217.888.485.92.810.98.819.3
Summer
(Jun.~Aug.)
783.9422.8417.11.324.518.126.1
Autumn
(Sep.~Nov.)
251.9185.7177.94.238.030.918.7
Winter
(Dec.~Feb.)
73.143.139.58.416.113.218.0
Total1326.6740.0720.42.689.571.020.7
Table 6. The results of flow duration analysis.
Flow Duration1970s
Groundwater
Abstraction
(m3/s)
2010s
Groundwater
Abstraction
(m3/s)
Change
(m3/s)
Change
(%)
Q10
(High flows)
351.52333.5118.015.40
Q95
(Moist conditions)
47.4644.972.495.53
Q185
(Mid-range flows)
23.7922.521.275.63
Q275
(Dry conditions)
15.8715.020.745.61
Q355
(Low flows)
9.959.510.444.60
Note: Q x indicates the streamflow magnitude is exceeded for x days per year.
Disclaimer/Publisher’s Note: The statements, opinions and data contained in all publications are solely those of the individual author(s) and contributor(s) and not of MDPI and/or the editor(s). MDPI and/or the editor(s) disclaim responsibility for any injury to people or property resulting from any ideas, methods, instructions or products referred to in the content.