


Abstract
Understanding the effects of mixing-driven precipitation on solute transport behavior is critical for reactive transport predictions, yet its complexity, arising from the interplay of flow dynamics, solute transport, and geochemical reactions, remains a significant challenge. In particular, mineral precipitation modifies the hydraulic properties of porous media. The impact of this process on the solute transport behavior remains largely unexplored and is crucial for accurate reactive transport predictions. This study presents a controlled laboratory investigation of mixing-driven calcite precipitation (MDP) in an intermediate-scale Hele-Shaw cell, simulating a coarse-sand porous medium. The experiment allowed for direct visualization of the spatiotemporal evolution of precipitation while continuously monitoring hydraulic properties. Self-organized heterogeneities in the precipitate structure were observed, with calcite layers forming symmetric patterns aligned with the main flow, contrasting with the asymmetry predicted by a semi-analytical model under idealized conditions. Tracer tests conducted before and after precipitation demonstrated significant impacts on solute transport, including the emergence of strong anomalous transport features, such as earlier solute arrival, a distinct double peak, and pronounced tailing. These findings highlight the critical role of precipitation-induced heterogeneities in shaping transport behavior, emphasizing the need to integrate these dynamics into reactive transport models for improved predictive accuracy.
1. Introduction
Understanding the consequences of mixing waters with different chemical signatures is of critical importance for studies assessing the health of groundwater systems, e.g., [1,2,3,4] and engineering efforts aiming to design effective subsurface pollution control strategies, e.g., [5,6,7]. However, quantifying the extent of mixing in real-world hydrogeological systems is often difficult because of the generally unknown complexity of the medium heterogeneities (which translates into high uncertainty in the prediction of flow velocities) [8,9,10,11] and the impossibility of visually assessing the transport of solutes through the porous medium. Depending on the species in solution and the chemical composition of the host porous medium, the mixing of waters with different signatures can lead to the occurrence of reactions that influence the microscopic structure of the solid material and of the pore network [12,13,14]. Eventually, this interaction creates a feedback loop where changes in the porous medium (including changes in grain size and pore/pore-throat size distributions) now influence the groundwater flow, the extent of mixing (incomplete mixing) [15,16], and the rate of chemical reactions [13,17]. One reactive process commonly discussed in the subsurface literature is the precipitation/dissolution of carbonates (i.e., calcite). Various studies have discussed potential applications of this chemical process in the context of groundwater remediation, e.g., [18,19,20,21,22,23], Geological Carbon Sequestration (GCS), e.g., [7,24,25,26], Enhanced Oil Recovery (EOR), e.g., [27,28,29,30], Managed Aquifer Recharge (MAR), e.g., [6,18,31,32] and Coastal Aquifers Management (CAM), e.g., [5,33]. Of particular interest is the occurrence of mineral precipitation. This process has been explored in applications of pollutant remediation, with engineered mineral precipitation aiming to trap harmful chemical species (e.g., heavy metals) in order to limit their uncontrolled movement, reducing the risk of polluting freshwater sources while also facilitating their removal [18,31,34,35]. Similarly, in carbon sequestration, precipitation is employed to purposefully decrease the effective permeability of some regions in the porous medium to meet the specific objectives of a given application [7,24,25]. This context serves to underline the importance of understanding the mechanisms that control the occurrence of mineral precipitation in groundwater systems as a necessary step to improve the effectiveness of subsurface engineering applications based on this process. Along this line, the Mixing-Driven Precipitation (MDP) of carbonated minerals, and the interactions that the fresh precipitate may experience with the porous medium and groundwater flow are of special interest [36,37,38,39,40]. In this case, as the reaction progresses towards precipitation, the mixture simultaneously flows through the medium, meaning that supersaturation—and thus the tendency for precipitation—increases downstream from the initial mixing zone [11,13,14,41]. Depending on the local flow conditions, the roughness of the grain surface, and the structure of the pore network, the mineral may nucleate and attach to the solid matrix through heterogeneous deposition, gradually transforming the substrate chemistry from the original sand grains to newly formed precipitates [36,37,38]. In this context, a significant knowledge gap exists regarding how mineral precipitation evolves spatially and temporally under different mixing conditions, as well as the characteristic patterns and heterogeneities emerging from the process. These aspects are crucial for understanding how precipitation impacts the effective solute transport properties of the system, particularly the quantitative metrics used to describe the transport of dissolved species (e.g., breakthrough curves). However, these effects remain largely unknown, and their detailed characterization is of relevance, for example, to assist the adequate interpretation of laboratory and field-scale tracer test experiments [42], and to evaluate the conceptual formulation of numerical models aiming to describe the transport of solutes under MDP conditions [43]. As a contribution, this article builds upon the results of a novel laboratory-scale experiment in which MDP is purposefully induced to evaluate the spatiotemporal evolution of calcite precipitation. Beyond real-time visualization, the essential new contribution is the quantitative evaluation of how transient mineral precipitation alters the integral solute transport behavior of the porous medium, as quantified through breakthrough curves (BTCs). The experimental setup allows monitoring and visualizing in real-time the spatiotemporal evolution of the precipitation process, and to quantify the influence that the fresh precipitate exerts on the porous media system by means of breakthrough curves (BTCs) measured at the system outlet. In particular, this study focuses on the precipitation of calcite () as a test mineral, occurring in a synthetic two-dimensional homogeneous aquifer emulating a coarse sand granular system. The reactants mix due to transverse dispersion in a horizontal flow-through system with advection-dominated transport conditions. Although similar experiments exist in the literature [36,37,38,40], the influence that transient mineral precipitation exerts on the hydraulic and solute transport properties of porous media remains largely unexplored. Previous experimental conditions reported in the literature have generally led to the precipitation of thin calcite layers [36,37,38], mainly due to the use of fine-grained porous media and experimental setups that promote diffusion-dominated transport (low Péclet numbers). In contrast, the present study focuses on advection-dominated transport conditions, where variations in grain size and flow configuration shift the balance between advection and reaction, leading to distinct precipitation patterns and heterogeneous structures, and allowing the assessment of the macroscopic consequences of transient precipitation on solute transport behavior. Similarly, studies analyzing breakthrough curves aiming to evaluate changes in the porous medium due to the precipitated mineral are limited, and in this work we emphasize this quantitative metric because of its high relevance for both field and experimental applications. In this sense, this work aims (i) to demonstrate that the evolution of the precipitation plume can be largely influenced by self-organized pore-scale heterogeneities driven by precipitation during the mixing process, challenging the predictions and assumptions of simplified semi-analytical reactive transport models, and (ii) to evaluate, by means of tracer test experiments, the influence that fresh mineral precipitates produce on solute transport behavior through a porous medium. Specifically, the main novelty of this work is the quantitative comparison of BTCs before and after MDP, demonstrating a clear shift from Fickian to non-Fickian anomalous transport, evidenced by earlier solute arrival, a distinct double peak, and pronounced tailing resulting from precipitation-induced heterogeneities.
The structure of this article is as follows. Section 2 describes the experimental setup used for the Mixing-Driven Precipitation (MDP) and tracer test experiment, detailing the image processing technique employed to visualize the spatiotemporal evolution of calcite precipitation, along with the semi-analytical formulation used for the comparative analysis. Section 3 presents the main findings, including an explanation of the self-organized heterogeneous porous medium formed after MDP and an examination of the anomalous transport behavior observed in the breakthrough curve (BTC) measured after the precipitation of calcite. Finally, the article concludes with a summary of key insights from the study, emphasizing the significance of MDP and its impact on solute transport for subsurface engineering applications.
2. Materials and Methods
2.1. Experimental Setup
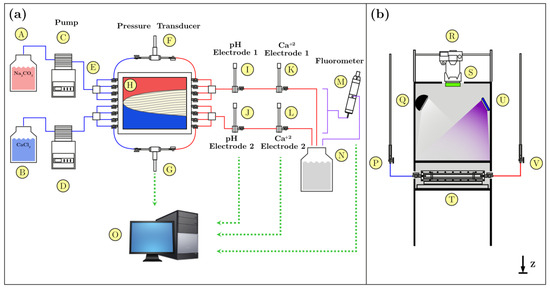
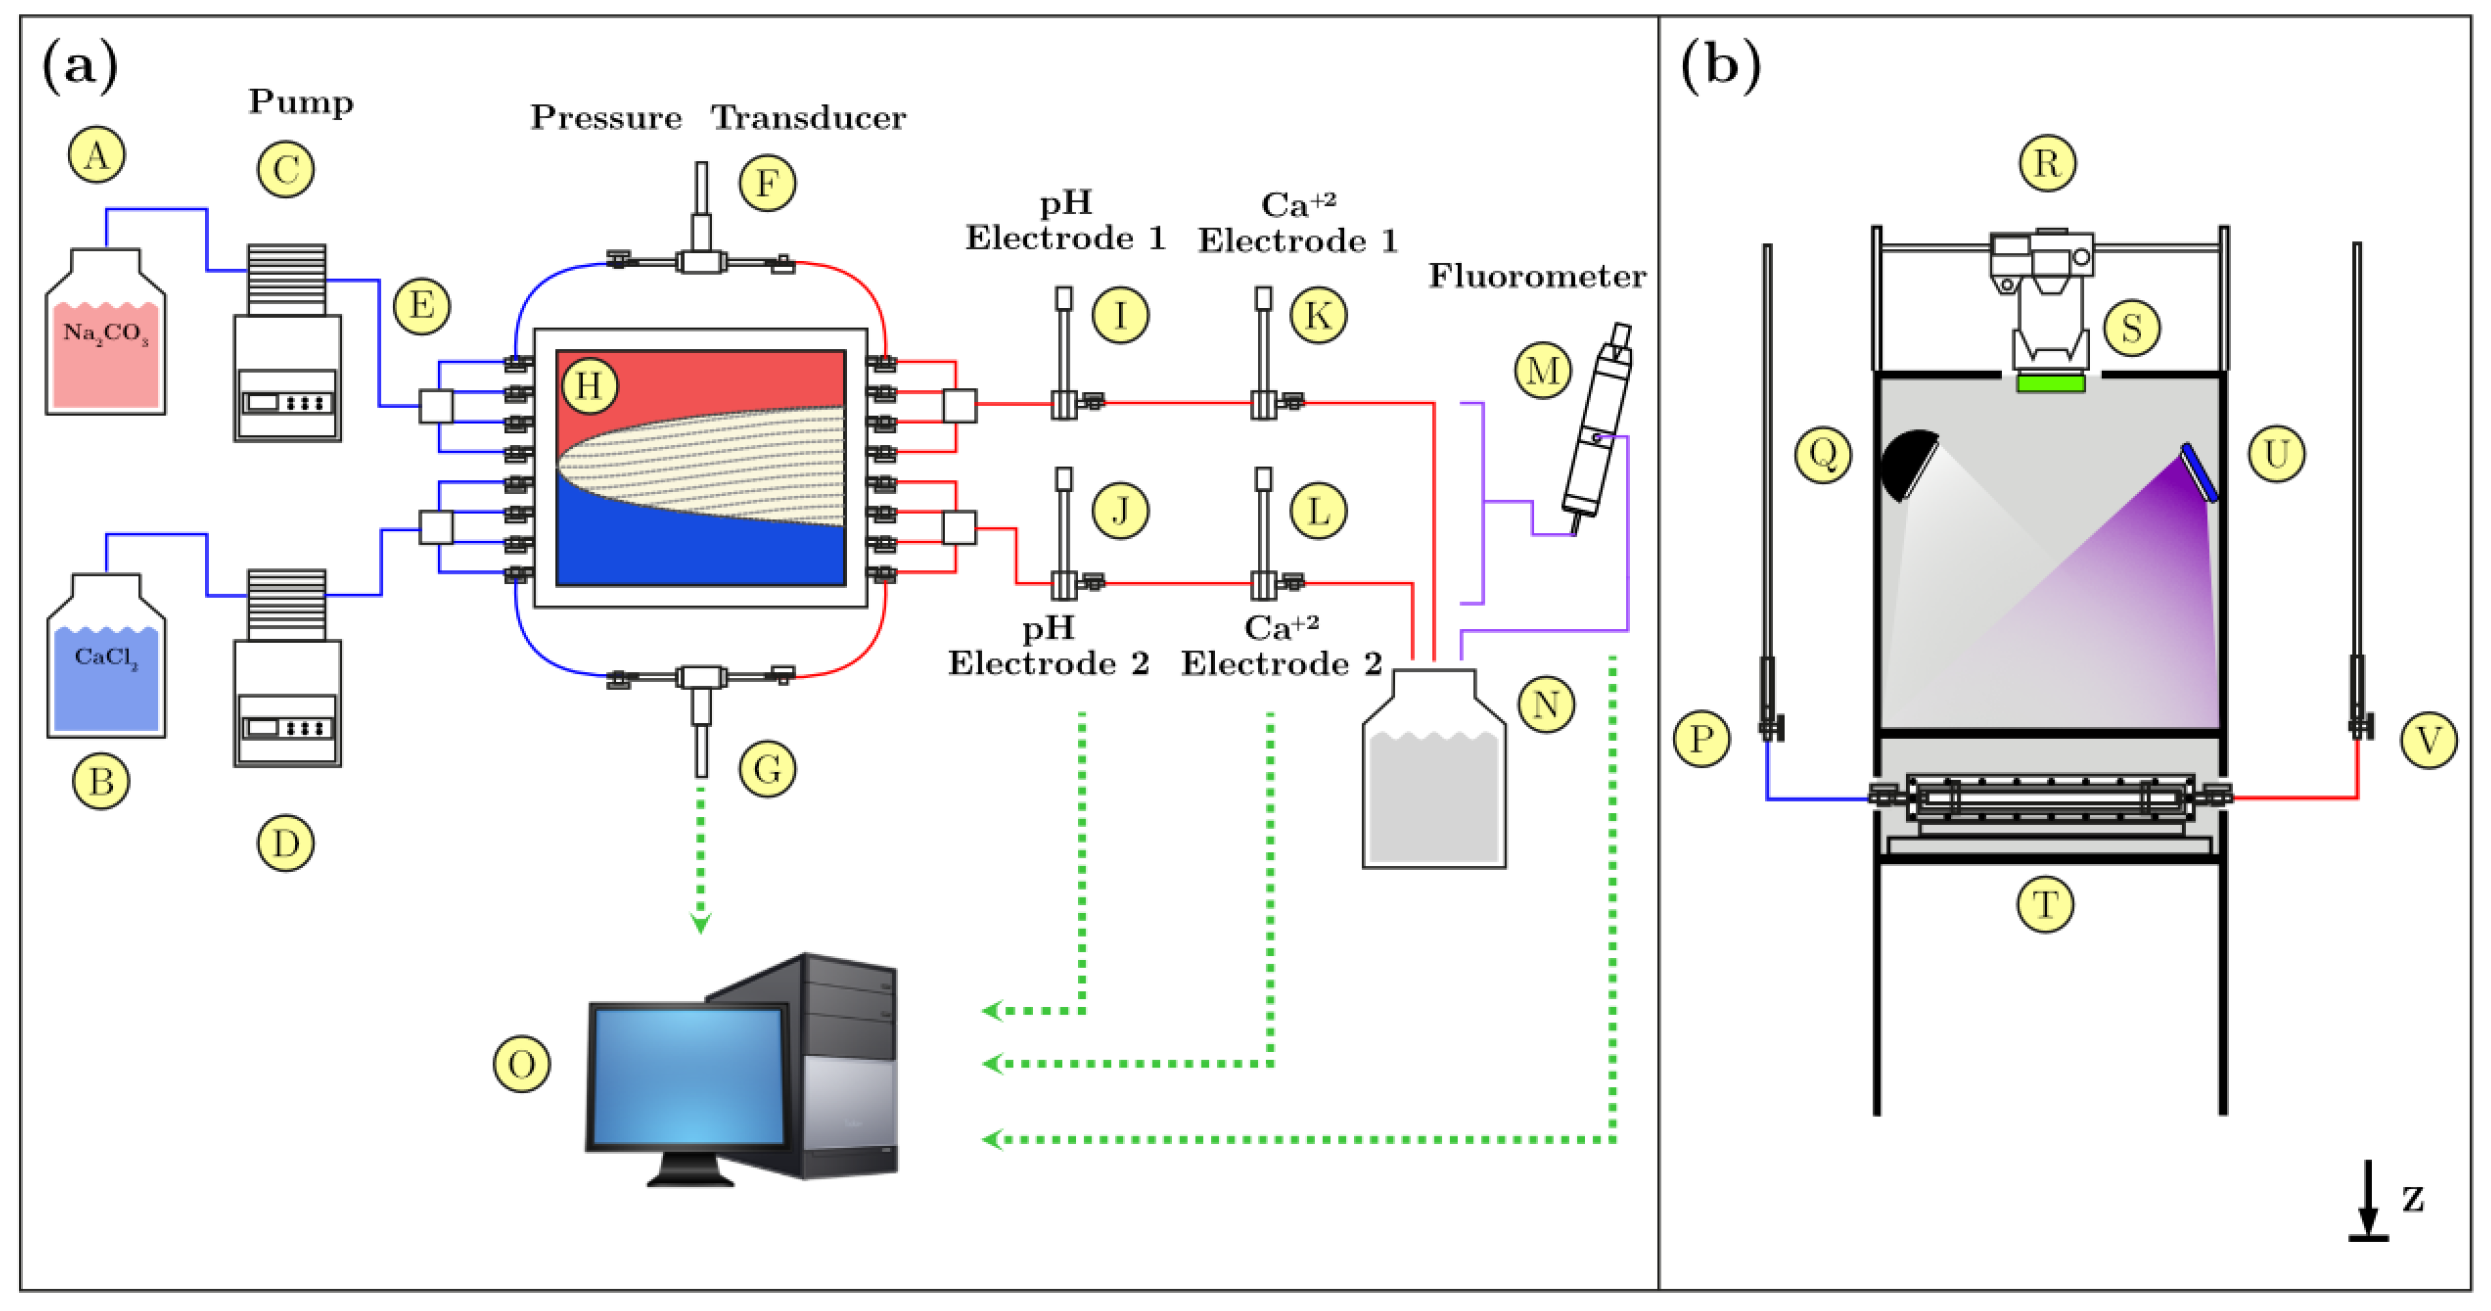
Experiments involving calcite precipitation and conservative tracer tests were conducted in a horizontal quasi two-dimensional tank fabricated with plexiglass, with inner dimensions of in length (L), in width (W), and in height (H) (Figure 1a). The tank was wet-packed with spherical glass beads (d = 2 mm of diameter) and initially filled with deionized water (Milli-Q, Millipore, Barcelona, Spain). The tank featured eight inlet and outlet ports, evenly spaced 2 cm apart, aiming to provide uniform flow conditions. In the inlet, four ports were connected to a 4-channel flow cell and a mini-pulse peristaltic pump (Gilson Minipulse 3 Peristaltic Pump, Gilson Inc., Middleton, WI, USA). The other four inlet ports were connected to a separate 4-channel flow cell and pump of the same characteristics. The outlet ports of the tank were bifurcated and organized into two separate major outlets, each grouped by a 4-channel cell, followed by a pH/temperature electrode (pH/ATC Electrode BNC 8-PIN, Hanna Instruments, Woonsocket, RI, USA) and a Calcium Ion Selective Electrode (Thermo Fisher Scientific, Waltham, MA, USA) connected in series after the cell. Fluorescein tracer tests were performed in order to characterize the conservative transport properties of the system. Concentrations were measured with an Albillia FL24 fluorometer (Albillia Sàrl, Neuchâtel, Switzerland) that linked both outlet flow cells into a single outflow connection (purple line in Figure 1a), providing an integral breakthrough curve for the system. During the calcite precipitation experiment, potential changes in the hydraulic conductivity of the aquifer were monitored by means of two sets of Keller Series PD 23 pressure transducers (Keller AG, Winterthur, Switzerland) installed at the inlet and outlet of the tank, which were also complemented with piezometers for comparison. The evolution of the freshly precipitated calcite was monitored via image analysis. The experimental setup was placed inside a darkroom, aiming to prevent external light interference (Figure 1b), equipped with two distinct light sources for visualization. For the experiment of calcite precipitation, a 1550 Lm, 20 W Downlight LED was positioned above the tank, and reflected light intensity was used to monitor the evolution of the precipitate. For the fluorescein tracer tests, violet UV light combined with a green MidOpt BP525-67 filter (MidOpt Inc., Palatine, IL, USA) was employed. Images were taken with a Nikon D7100 camera (Nikon Corporation, Tokyo, Japan), paired with a Tamron SP AF17-50mm F/2.8 XR Di II LD Aspherical (IF) Model A16 lens (Tamron Co., Ltd., Saitama, Japan). Throughout the experiment, continuous monitoring was conducted for the pressure transducers, calcium probe, and fluorometer measured every 1 s, pH every 5 s, photographs were taken every 30 s, and piezometers every 10 min. The real view of the experimental setup in the laboratory is shown in Supplementary Material (Figure S1).
Figure 1.
Top and side views of the experimental setup. Inlet flow lines: blue; outlet flow lines: red; fluorometer flow lines: violet; computer connection: green. Panel (a): top view of the experimental setup where (A) and (B) are the containers with the inflow solutions, (C) and (D) peristaltic pumps. (E) 4-channel cells, (F) and (G) pressure transducers, (H) horizontal two-dimensional tank, (I) and (J) pH electrodes, (K) and (L) calcium electrodes, (M) fluorometer, (N) container for collecting outflow solutions, (O) data logging computer. Panel (b): side view of the experimental setup where (P) left piezometer, (Q) UV light, (R) Nikon D7100 camera, (S) green MidOpt BP525-67 filter, (T) horizontal two-dimensional tank, (U) LED light, (V) right piezometer.
2.2. Initial and Boundary Conditions
Precipitation and tracer test experiments were conducted under advection-dominated transport conditions, supported by a grain Péclet number of , with v the flow velocity ( m/s) calculated from the total inflow rate (), the cross-sectional area (), and the initial porosity (experimentally determined value), d is the diameter of the glass beads in the experiment (), and D the molecular diffusion coefficient of water () [44]. The initial hydraulic conductivity () of the system was estimated to be , obtained from applying Darcy’s law with the hydraulic parameters shown in Table S1 in Supplementary Material. The initial porosity was determined by converting the weight of the glass beads used to fill the tank into an equivalent volume, based on the average density of glass (, Labbox Labware, S.L., Barcelona, Spain). In terms of the flow boundary conditions, a prescribed flow boundary was established at the system entry with a constant inflow rate Q, and for the system outlet, a constant head boundary condition was imposed (0.9 m above the tank elevation), which was defined by trial and error in the laboratory, aiming to create a moderate hydraulic gradient with respect to the piezometric head provided by the prescribed inflow boundary.
2.3. Mixing-Driven Precipitation (MDP) and Tracer Test Experiments
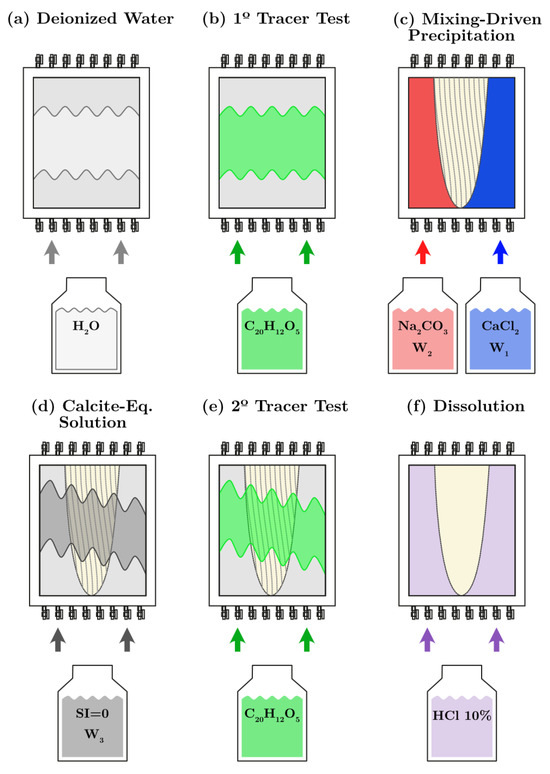
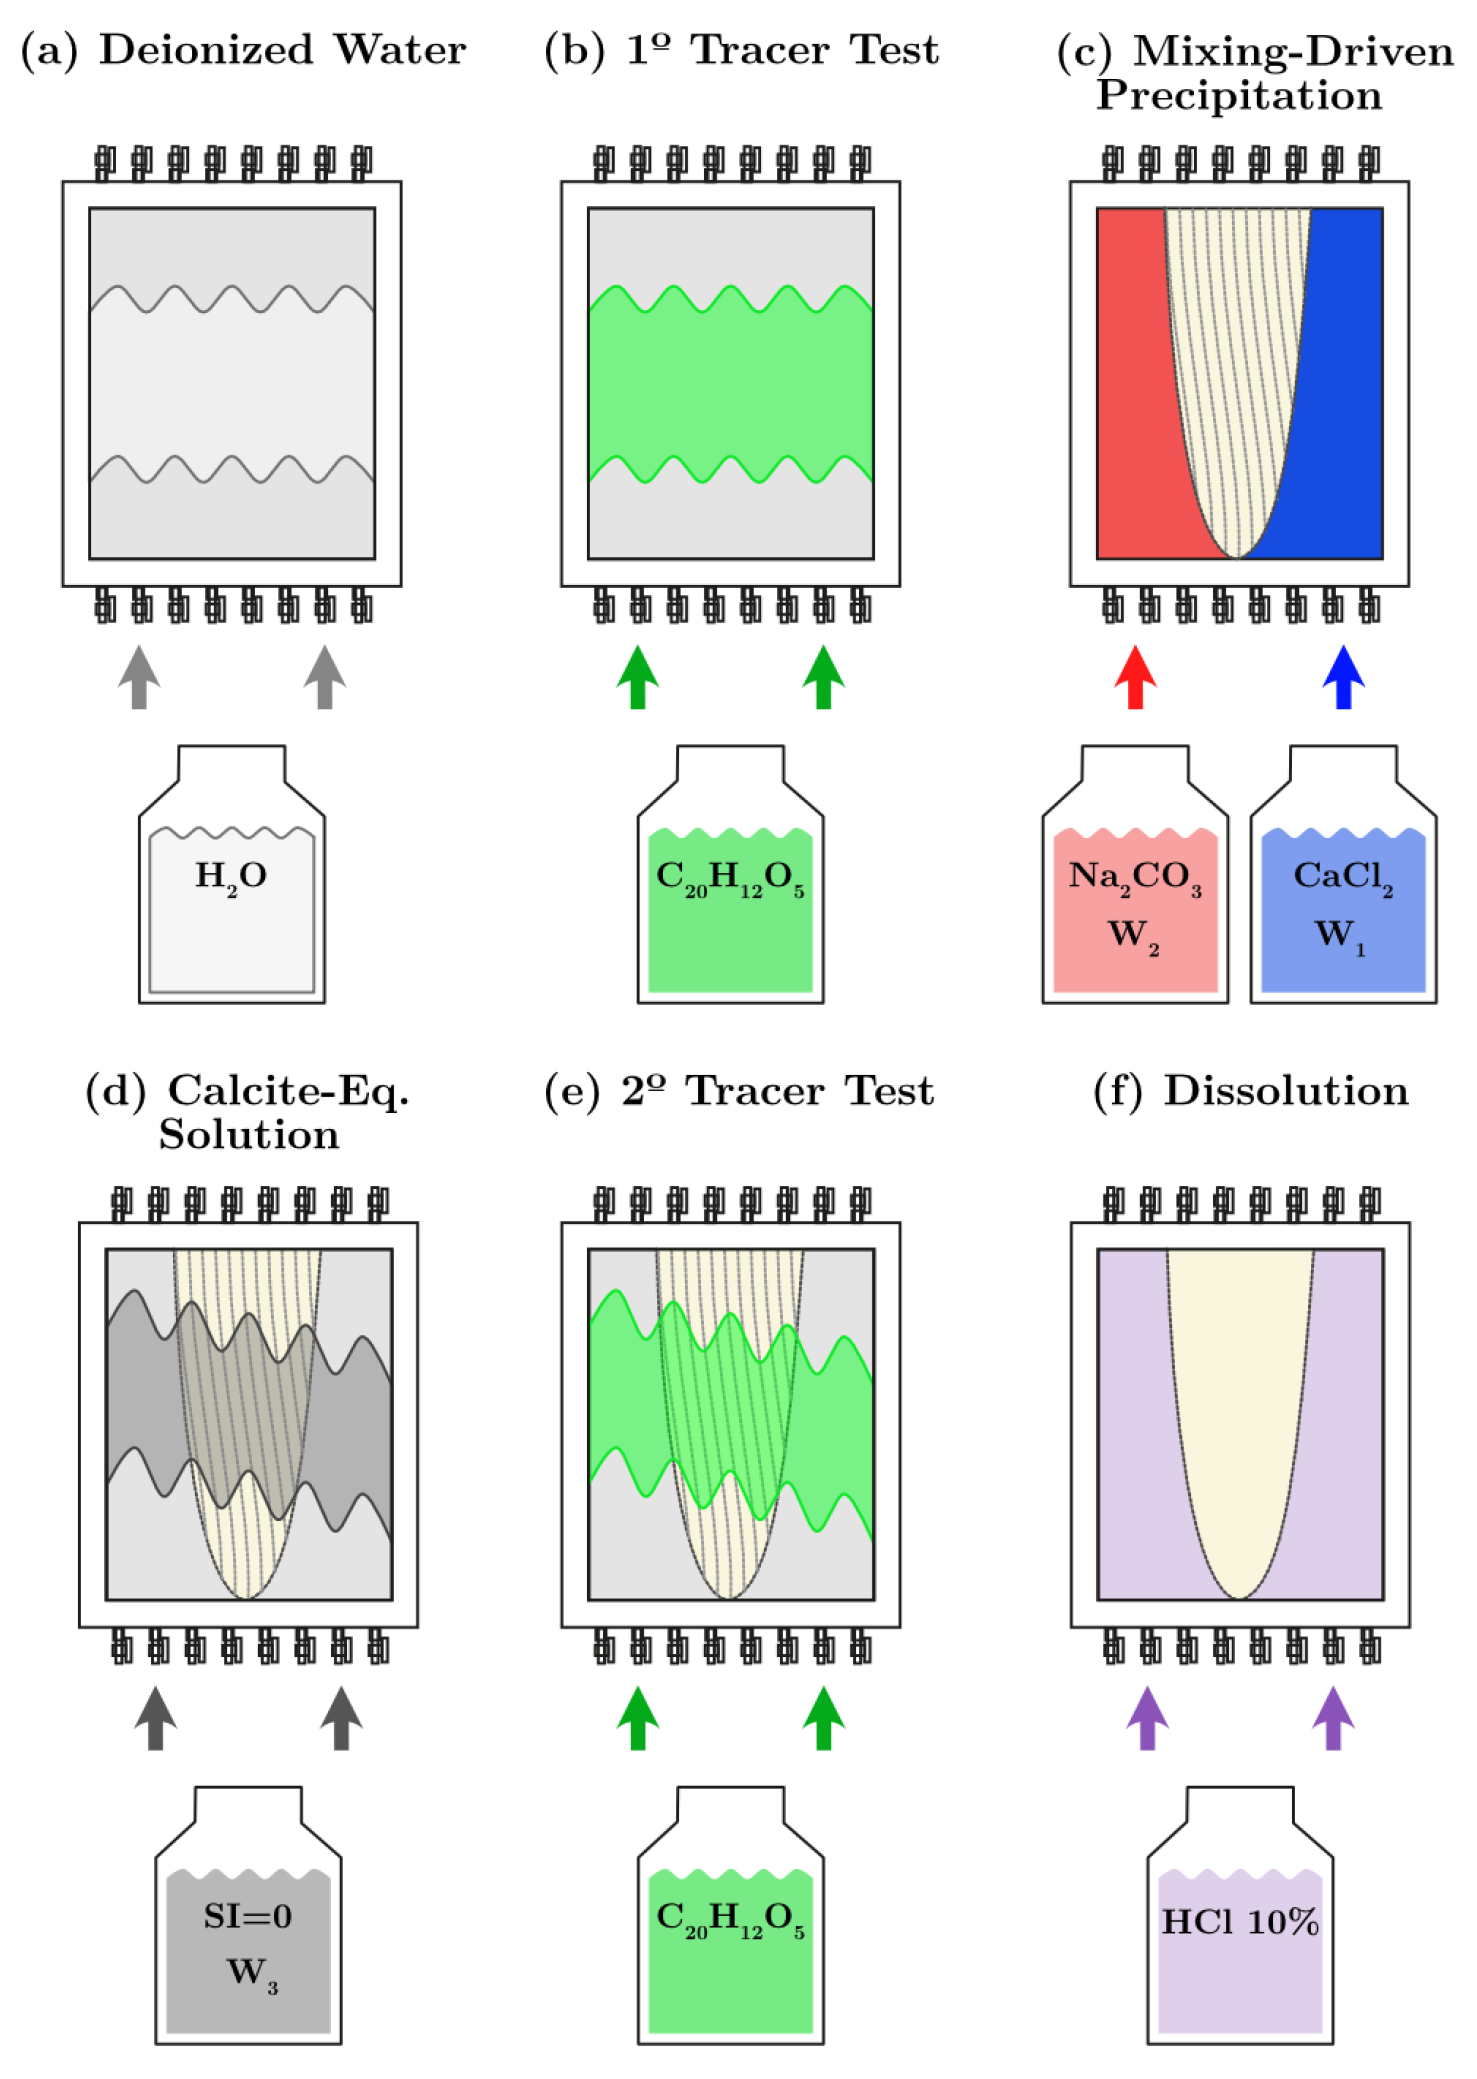
The whole experimental activity lasted 630 min and was divided into 6 stages (Figure 2, Table S2 in Supplementary Material): (a) injection of deionized water, (b) initial conservative tracer test T1, (c) MDP (injection of inflow solutions and in Table 1), (d) injection of a calcite-equilibrated solution ( in Table 1), (e) second conservative tracer test T2, and f) calcite dissolution (injection of HCl 10%). During the first 20 min, deionized water was injected into the tank to achieve steady-state flow conditions (Figure 2a). This stage was followed by the first tracer test T1, whose purpose was to obtain the initial transport conditions of the system through the breakthrough curve (BTC). During this test, a solution containing fluorescein (with concentration = 3 mg/L) was injected over a 10-min period (Figure 2b), followed by a 1 h and 30-min purge with distilled water. Subsequently, we conducted the MDP experiment for 120 min (Figure 2c), during which synthetic solutions of CaCl2 () and Na2CO3 () (Table 1) were simultaneously injected into the tank, in parallel. The concentrations were chosen taking into account characteristic values reported in previous studies [36,37]. Following this stage, a solution equilibrated with respect to calcite () was introduced over a 60-min period in order to reach geochemical equilibrium in the system (Figure 2d). The experiment continued with the second tracer test, T2, whose objective was to capture differences in the BTC consequence of the freshly formed calcite after the MDP stage. It was carried out using water in equilibrium with calcite () instead of deionized water to avoid further precipitation (Figure 2e). To conclude the experimental activities, a 10% HCl solution was introduced for a 210-min period in order to dissolve the layer of calcite (Figure 2f), which allowed to obtain an estimation of the total amount of precipitation.
Figure 2.
Detailed procedure conducted throughout the experiment. For practical reasons, the tank is displayed vertically in this figure, where the right part corresponds to the bottom and the left part to the top. The patterns used inside represent the flow, and the colors assigned to each container are only used to represent the solutions in this figure and do not necessarily correspond to their actual color in reality: (a) injection of deionized water, (b) first tracer test T1, (c) Mixing-Driven Precipitation (MDP) experiment, (d) injection of calcite-equilibrated solution , (e) second tracer test T2, (f) dissolution of the layer of calcite using a 10% HCl solution.
Table 1.
Chemical properties of the solutions employed in the experiment.
2.4. Image Processing for Visualizing the Spatiotemporal Evolution of Calcite
The camera recorded 24-bit RGB color images during the MDP experiment, focusing on visualizing the spatiotemporal evolution of CaCO3 precipitation over time. Camera settings were manually adjusted and kept constant throughout the entire experiment. A relative aperture of f/2.8, a shutter speed of 1/30 s, and an ISO setting of 200 were used. The images were processed using the OpenCV library in Python (version 3.13.0) [46,47] following the method proposed by Schuszter et al. [48] to visualize precipitation patterns of calcite [48,49,50]. Images were processed following five steps: (a) converting images from raw format (NEF) to 16-bit images (TIFF); (b) cropping the images to focus on the precipitation zone, which resulted in a region of interest (ROI) with a resolution of 3975 × 3000 pixels, each pixel with an area of mm2, corresponding to a square pixel of approximately mm in size; (c) transforming red, green, and blue pixel intensity (, , into grayscale as
which results in a single-band representation of the image with ; (d) normalization of the grayscale pixel intensity to analyze images in the range [0, 1] as
where is the grayscale light intensity distribution of a reference image representing a blank state obtained from the steady-state flow conditions prior to the MDP experiment, and , correspond, respectively, to the maximum and minimum grayscale intensities considering all images captured during the MDP such that their difference gives the maximum range of intensity variability; (e) and finally map the images in terms of the logarithm of the normalized intensity for visualization and to qualitatively assess the amount of precipitation. It should be noted that provides a qualitative representation of relative changes in deposition. The dynamic range corresponds to the normalized optical contrast between the blank and the most intense image, as no direct calibration with calcite concentration was performed.
2.5. Semi-Analytical Model for Calcite Precipitation in Idealized Conditions
For the purposes of comparison with the MDP experiment, we developed a semi-analytical solution for the spatiotemporal distribution of calcite precipitation in a homogeneous, well-mixed, equilibrium system. The solution is based on the mixing-ratio approach discussed in De Simoni et al. [51], which determines the rate of reaction for calcite precipitation assuming idealized transport conditions, that is, instantaneous complete mixing, local equilibrium, and uniform velocity field with a negligible influence of changes in the transport properties due to the chemical process of precipitation. In this context, it has been shown that the rate of calcite precipitation can be calculated as
where is the mixing ratio between the two end-members (solutions and ) and is the concentration of the ion. The mixing ratio ranges between 0 and 1, and accounts for the relative contribution of one end member to the total mixture, in this case, associated with the presence of the CaCl2 solution (). To exemplify, if at a given location, the concentration of the mixture at that location (without reactions) consists of 30% of the solution (CaCl2) and 70% solution (Na2CO3). Expression (3) illustrates that the rate of reaction is composed of a chemical speciation coefficient () and the scalar dissipation rate (). De Simoni et al. [51] showed that the mixing ratio () satisfies the conservative advection-dispersion equation
where are the longitudinal and transverse dispersion coefficients, respectively. A transient analytical solution to Equation (4), emulating idealized conditions in our experiment, was presented in the work of Wexler [52], which is also provided in Supplementary Materials (refer to Text S1, Figure S2 and Table S3). From this solution, we determined the reaction rate r by substituting into Equation (3), where is estimated, neglecting the longitudinal gradient of the mixing ratio . This assumption is quantitatively justified because each reactant solution enters through half of the tank, creating transverse concentration gradients that are significantly larger than longitudinal ones. Under our advection-dominated conditions (Pe = 523), longitudinal advection and transverse dispersion dominate the reaction zone, making longitudinal dispersive gradients orders of magnitude smaller than transverse mixing gradients. Moreover, mixing-driven precipitation in the longitudinal direction is effectively inhibited by the equilibrated solution that was injected previously. The chemical speciation term was obtained from a set of mixing simulations generated with the geochemical speciation code PHREEQC [45,53,54], spanning the range , aiming to simulate the different mixing conditions of the two end-members and (refer to Figure S3 in Supplementary Materials). From these simulations, a curve was constructed, which was later used to numerically evaluate the second derivatives for a given value of (Figure S4). As a result of mixing, PHREEQC predicted the occurrence of calcite precipitation. Some combinations of these simulations were validated experimentally to corroborate the numerical estimation of the amount of precipitated mineral (Figure S3b). With this information, it was then possible to build the spatiotemporal distribution of the precipitated mass of calcite predicted by the semi-analytical model, which was accumulated in time for each cell to properly depict the evolution of the mineral distribution.
3. Results and Discussion
3.1. Spatiotemporal Evolution of Calcite Precipitation
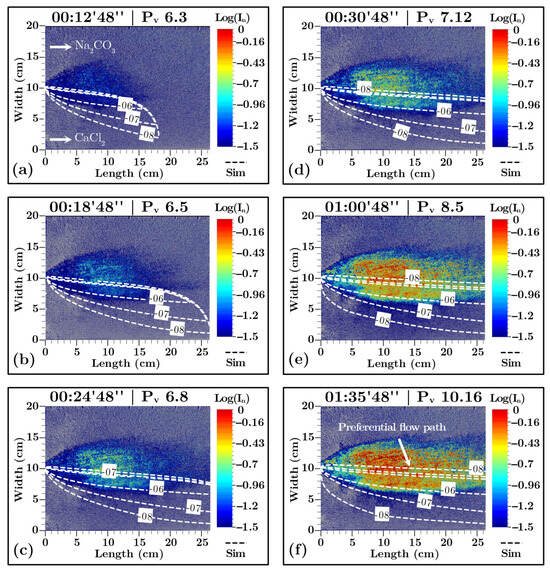
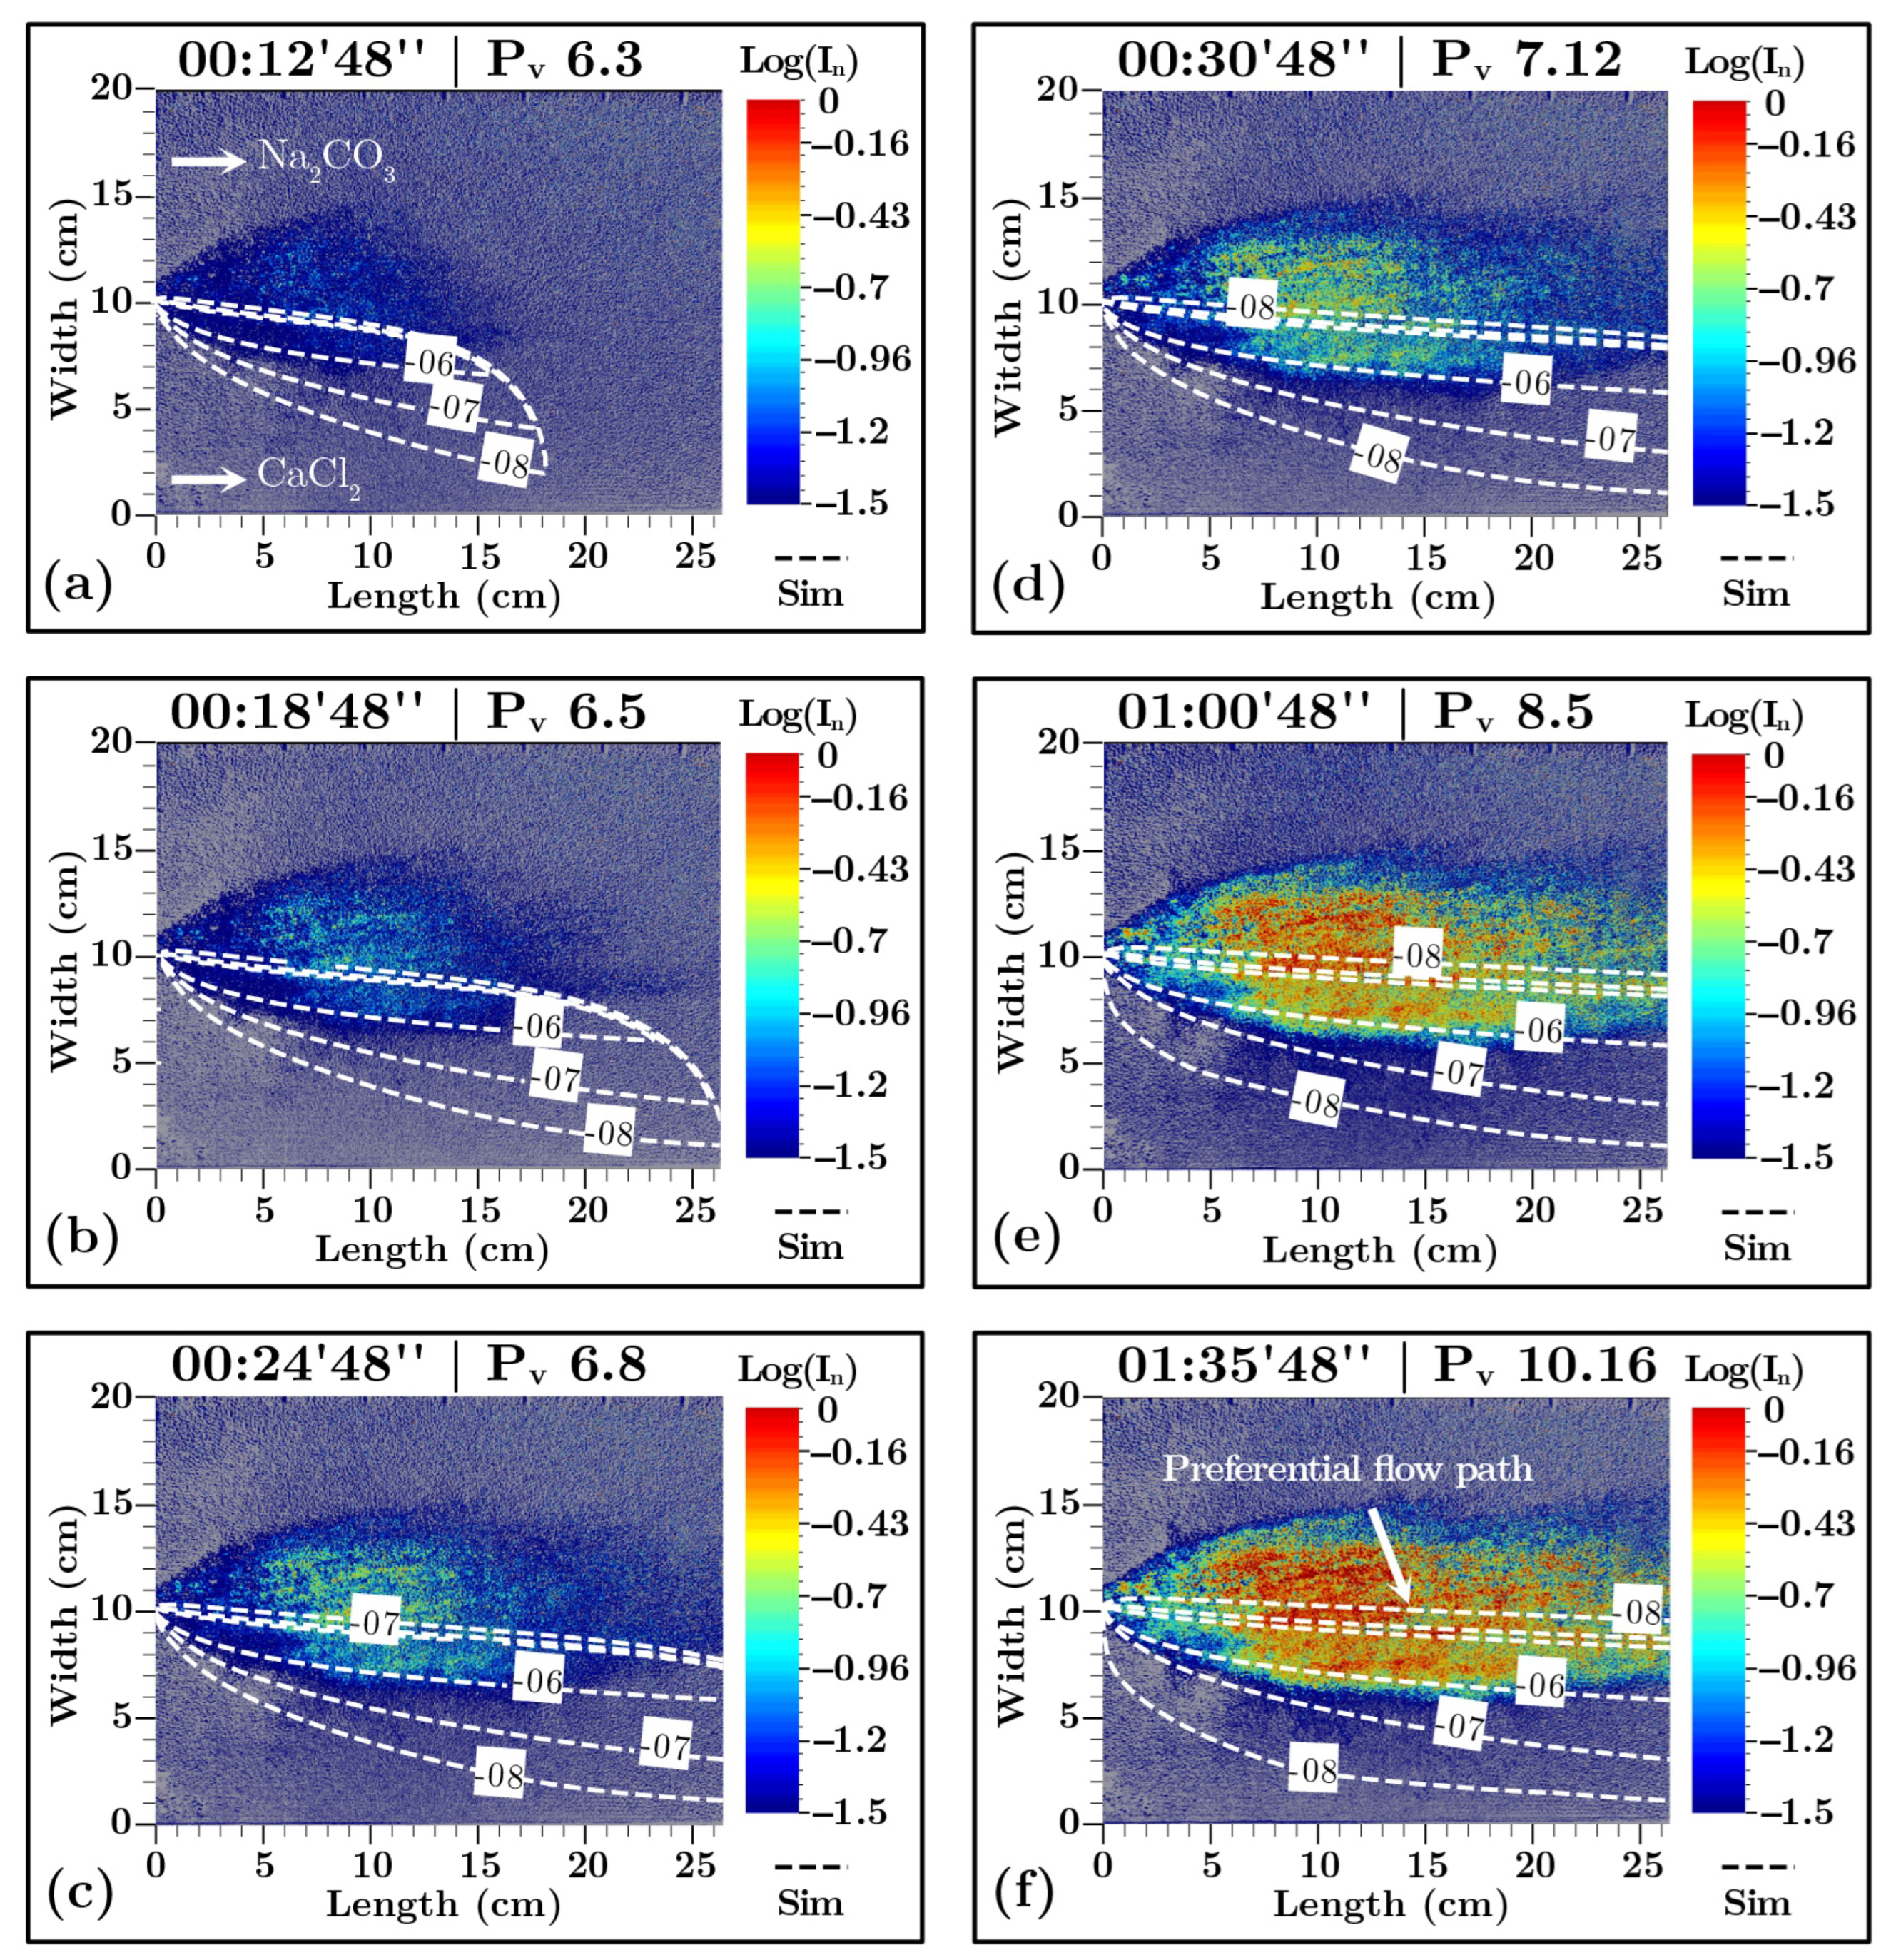
We begin analyzing the experimental results by discussing the evolution of calcite precipitation through a series of 6 images illustrating different instants of the MDP experiment, shown in Figure 3. In Figure 3a it can be seen that calcite initially precipitates in a seemingly homogeneous symmetric manner (), extending across the entire precipitation front. In Figure 3b, small in-situ precipitation nuclei emerge at the center of the layer (). These nuclei cluster and gradually expand with time, as shown in Figure 3c, forming aggregates of larger size, a dynamic that has been reported in previous studies [55,56,57]. As time progresses (Figure 3d,e), advection promotes the formation of elongated precipitation patterns, apparently following the main direction of the flow (). The formation of this kind of structure has also been reported in previous studies discussing the precipitation of carbonates [58,59] and biofilm growth [57]. A more detailed view of these patterns can be seen in Figure S5. Although the linear precipitation structures observed in Figure S5 are slightly inclined relative to the horizontal flow direction, they generally follow the main orientation of the flow field. This minor deviation is attributed to small-scale variations in local flow velocity and pore connectivity within the homogeneous packing, rather than to heterogeneity in grain size or boundary effects. Similar angular patterns were observed in repeated experiments, suggesting that such orientations arise from local flow instabilities that promote preferential pathways and subsequent asymmetric precipitation fronts. For the last part of the experiment, it is observed that in between the zones of maximum calcite precipitation (), internal elongated structures of moderate cumulative precipitation emerge (). This effect suggests the formation of preferential channels where the flow and transport will concentrate. Thus, an important highlight of our experiment is that the precipitation of calcite driven by transverse mixing transformed an initially homogeneous porous medium into a self-organized heterogeneous porous medium (after MDP). This transformation is characterized by a symmetric precipitation zone of calcite following a bell-shaped form, located at the middle of the tank, marked by the presence of elongated carbonate structures and preferential flow channels aligned with the main flow direction. These results illustrate that the growth of the calcite precipitate is heterogeneous, a characteristic primarily influenced by three major factors: (a) the natural presence of initial pore-scale heterogeneities inducing preferential flow channels, as evidenced by slight irregularities in the tracer front and minor variations in flow velocity observed during the pre-MDP tracer test (), which suggest small differences in pore connectivity within the otherwise homogeneous packing, (b) the influence that these early precipitation structures exert on the flow and subsequent development of the precipitation reaction, which impacts the degree of mixing of the reactants, and (c) some influence of the method for the injection of the input solutions (slightly non-uniform), which can create slight irregularities in the advancement of the precipitation front, for example, as seen in Figures S6 and S7. We consider that these pore-scale differences have the potential to create macroscopic differences in the distribution of the mineral for different realizations of the experiment. Figures S6 and S7 illustrate the progression of two tracer tests (T1 and T2) conducted within the experimental tank before and after the Mixing-Driven Precipitation experiment (MDP). Figure S6 contains a sequence of images representing the initial stages of the tracer test, covering the first three time steps (4.45, 8.45, and 12.45 min), while Figure S7 includes images depicting the final stages, corresponding to the last three time steps (16.45, 20.45, and 24.45 min). Before MDP, the tracer test (T1) exhibits a slightly irregular flow pattern, likely due to minor variations in the flow rate at the inlet ports and small heterogeneities that developed within the tank during the packing process. In contrast, after MDP, the tracer test (T2) reveals the formation of strong preferential flow channels influenced by self-organized pore-scale heterogeneities resulting from precipitation during the mixing process.
Figure 3.
Evolution of calcite precipitation during the MDP experiment (colormap), and comparison with the semi-analytical model (dashed lines). The image sequence time is expressed in pore volumes, , where t is the time elapsed from the start of the first tracer test experiment , and V is the volume of the tank. Notice that the MDP experiment started at (Table S2). Images are presented in and the isolines of cumulative mass obtained from the semi-analytical model in log grams. The injected solutions (Na2CO3 and CaCl2) used in the MDP experiment are indicated by white arrows in panel (a). From panel (a,b), the comparison between the experiment and the model results is shown for the initial stages; from (c–e), the images show the period when the precipitate has already advanced into the tank; and panel (f) shows the system after it has reached a pseudo-steady-state condition.
3.2. Comparison with Semi-Analytical Model
The evolution of the calcite precipitation front observed in the MDP experiment was contrasted with the semi-analytical model developed for ideal mixing conditions, assuming instantaneous and complete mixing within each representative volume, local chemical equilibrium, and no impact of mineral precipitation on the flow and transport properties of the porous medium. The analytical solution is shown in Figure 3 with dashed lines. From Figure 3a–c the simulated calcite precipitation develops entirely within the side of the tank where the solution of CaCl2 is injected. This condition persists until Figure 3d, where the plume opens only in a slight manner towards the upper side of the tank (the side injecting Na2CO3), ultimately predicting an asymmetric precipitation region mainly oriented towards the side of the CaCl2 solution (Figure 3f). As discussed previously, the experimental snapshot shown in Figure 3a depicts a precipitation region predominantly concentrated at the center of the tank, which is then further expanded towards the side where the Na2CO3 solution is injected (refer to Figure S8 in Supplementary Materials). This result suggests that the precipitation of calcite is influencing the hydraulic properties of the porous medium, thereby affecting groundwater flow, transport, and ultimately mixing. This was also illustrated in the works of Redden et al. [60] and Zhang et al. [37], who demonstrated that thin layers of calcite precipitation can significantly limit the interaction of water parcels, impeding mixing and altering the local flow conditions. This influence on the porous medium is not taken into account by the semi-analytical model. In general, one could also consider that the hydraulic changes induced by the precipitation of calcite could even modify the local properties of dispersion (i.e., dispersivities) in a manner that for now remains undetermined [40]. In contrast, the semi-analytical model assumes that dispersion properties remain constant in magnitude, and uniform throughout the domain, when in fact they might very well depend on the total amount of precipitation. This may be a reason explaining why conventional dispersion theories, which assume locally well-mixed conditions [9,13,16,61,62], generally fail to accurately predict mixing and the outcome of related chemical reactions.
3.3. Temporal Evolution of Calcite Precipitation Rate and Incomplete Mixing
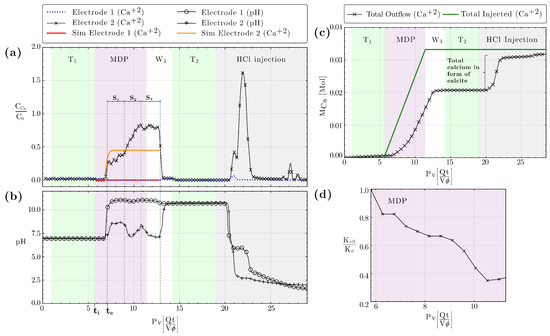
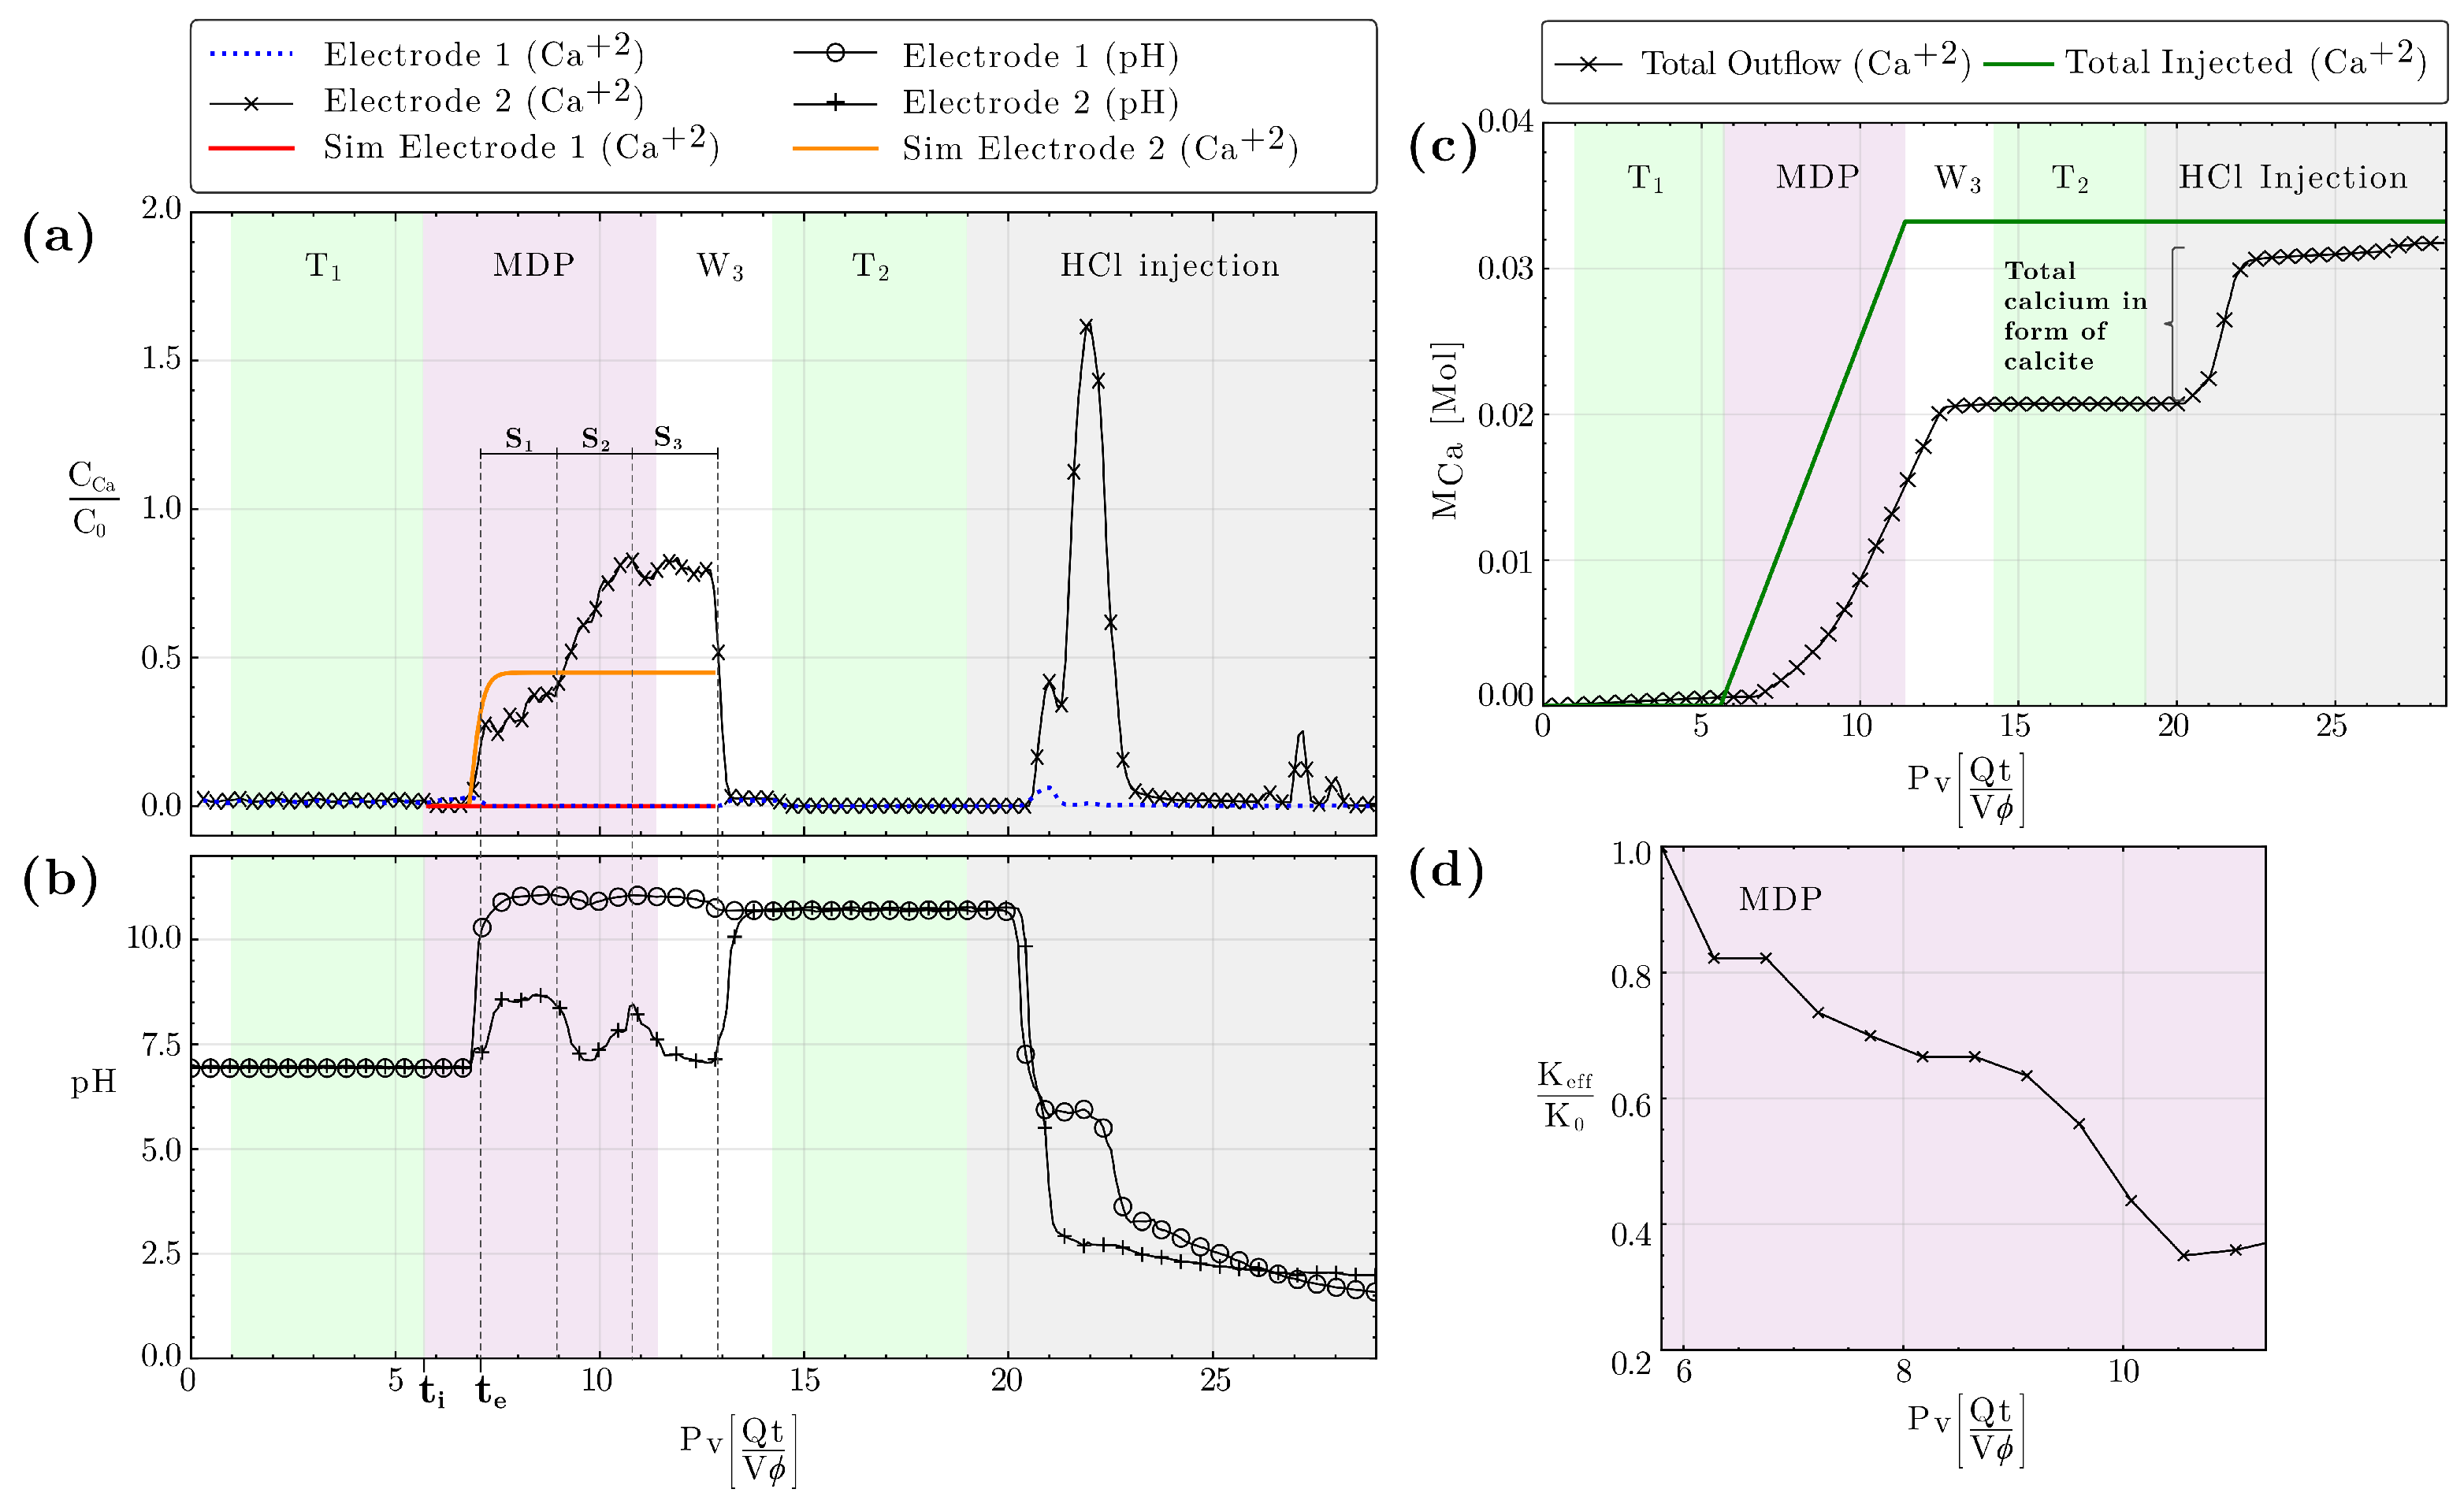
Figure 4a presents the breakthrough curves (BTCs) of calcium measured at the system outlet during the experiment, alongside the analogous results generated by the semi-analytical model. The behavior of the BTC of electrode 2 (on the CaCl2- side) can be analyzed considering 3 stages: (a) S1, characterized by a rapid linear ascent illustrating the arrival of the calcium plume followed by a markedly moderate slope, (b) S2, characterized by a sudden increase in the slope of the calcium concentration curve, and finally (c) S3, where the slope stabilizes and becomes nearly horizontal. The initial behavior of the BTC during the S1 stage allows us to conclude that the highest rate of calcite precipitation occurred within a short period of time at the beginning of the MDP phase. This is evidenced by the smaller slope of the BTC of calcium during this phase, which clearly increased during the S2 stage. Furthermore, the visual inspection of Figure 3a–d also supports this idea, suggesting that the system is highly sensitive to small perturbations in the initial conditions. During S2, the precipitation rate decreased with respect to S1 illustrating a transition towards a more stable condition. Finally, in S3, where the tank was being flushed with the solution equilibrated with calcite (), the rate slope of the BTC remained stable, supporting the idea that no further precipitation occurred during this phase. The semi-analytical model reveals a markedly distinct behavior. The calculated values for the concentration measured by electrode 2 (Figure 4a) rise quickly at the beginning of S1, reaching higher values than those observed during the experimental stage S1. The calcium output values then stabilize, achieving an earlier stable condition that is consistently maintained until S3. This discrepancy is mainly attributed to the assumptions made by the semi-analytical model, which tends to overestimate the total amount of precipitated calcium by assuming complete mixing and equilibrium reaction, differing from the more realistic conditions achieved in the experiment. These differences are further influenced by the changes in local porosity and the development of zones with varying hydraulic conductivities (preferential flow channels).
Figure 4.
Quantitative experimental results. The different experimental stages are presented in zones: the first and second tracer tests are represented as T1 and T2, the Mixing-Driven Precipitation as MDP, and the calcite dissolution as HCl injection. The green color indicates the tracer tests, purple represents the mixing experiment, white corresponds to the injection of the equilibrium solution, and gray indicates the stage of dissolution of the layer by HCl. (a) Breakthrough curve of calcium concentration in normalized form (C0 = 0.05 mol/kgw of in Table 1). Solid-lines represent the results of the semi-analytical model, and time is expressed in pore volume Pv. S1, S2, and S3 represent different identified breakthrough stages: S1 (between Pv = 7 and Pv = 9), S2 (between Pv = 9 and Pv = 11), and S3 (from Pv = 11 onward). (b) pH measurements at both outlet ports: the line with circles corresponds to Electrode 1, and line with plus-symbols represents Electrode 2. (c) Mass balance of total calcium mass, where represents the accumulated mass at a given instant, expressed in moles. Solid-line is obtained from the injected solution and injection flow-rate, and line with crosses is calculated from the outflow breakthrough curves. (d) Effective hydraulic conductivity relative to the initial value K0 obtained before MDP.
Incomplete mixing is also evident from the analysis of the BTCs for pH obtained during the MDP experiment (Figure 4b). Before MDP, both outlet pH BTCs exhibited values of pH ≈ 7 characteristic of the inflow of deionized water (standard values). As MDP progresses, electrode 1 experiences an increase in pH to approximately 11, characteristic of the solution of Na2CO3 (), indicating that this solution is exiting from that side of the tank throughout the MDP phase. In contrast, electrode 2 exhibits fluctuations in pH values characterized by two peaks: the first during stage S1 and the second at the end of S2. The minimum pH values observed approach 7, similar to the experimentally measured value for CaCl2 (), which was 6.8. The maximum values of both peaks are around 8.5. These variations indicate that the peaks are the result of incomplete mixing between and , suggesting the influence of local changes in the flow direction due to the precipitation of calcite.
3.4. Porosity and Permeability Reduction
The variation in porosity within the tank, resulting from calcite precipitation during the MDP experiment, was determined through a mass balance of calcium (Figure 4c). This calculation used the data from the calcium breakthrough curve (Figure 4a) considering the values obtained after the HCl injection phase. The total mass of precipitated calcite was calculated from the difference between the total outgoing calcium mass measured with the electrodes and the total injected calcium mass, resulting in a value of 0.011 mol (approximately 1.1 g), equivalent to a volume of 0.405 . This precipitation led to only a slight reduction in the total tank bulk porosity, from 0.34 to 0.339, quantitatively confirming the limited impact of precipitation on the overall porosity. Although the overall change is small, results show that an uneven spatial redistribution of this reduced volume can still induce significant local variations in permeability. This mismatch can be conceptually explained through short pore-scale percolation theory, where the precipitation strategically constricts or blocks critical pore throats, causing a disproportionate 65% reduction in permeability despite a bulk porosity loss of less than 0.1% of the total tank volume. This behavior is consistent with established permeability–porosity relationships, where permeability is primarily controlled by pore-throat connectivity rather than bulk pore volume, such that small reductions in porosity caused by pore-throat clogging can produce non-linear and disproportionate decreases in permeability. The variation of the effective hydraulic conductivity during the MDP experiment is shown in Figure 4d. It exhibits a tendency to decrease over time, experiencing a significant variation around Pv = 9. Before MDP, the initial hydraulic conductivity was 145.4 m/d, decreasing to 51.78 m/d due to the precipitation of calcite.
3.5. Impact of MDP on Solute Transport
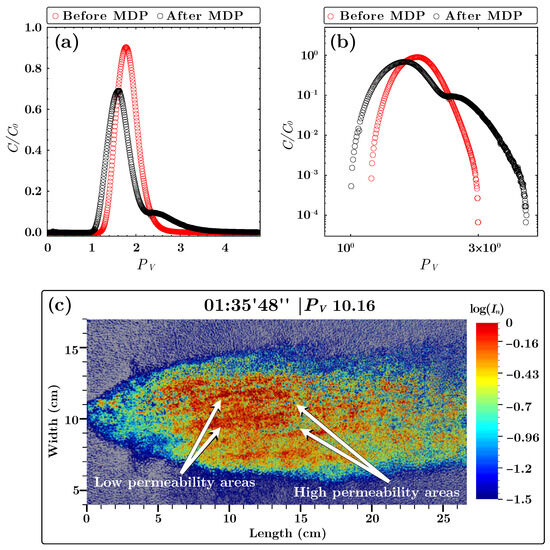
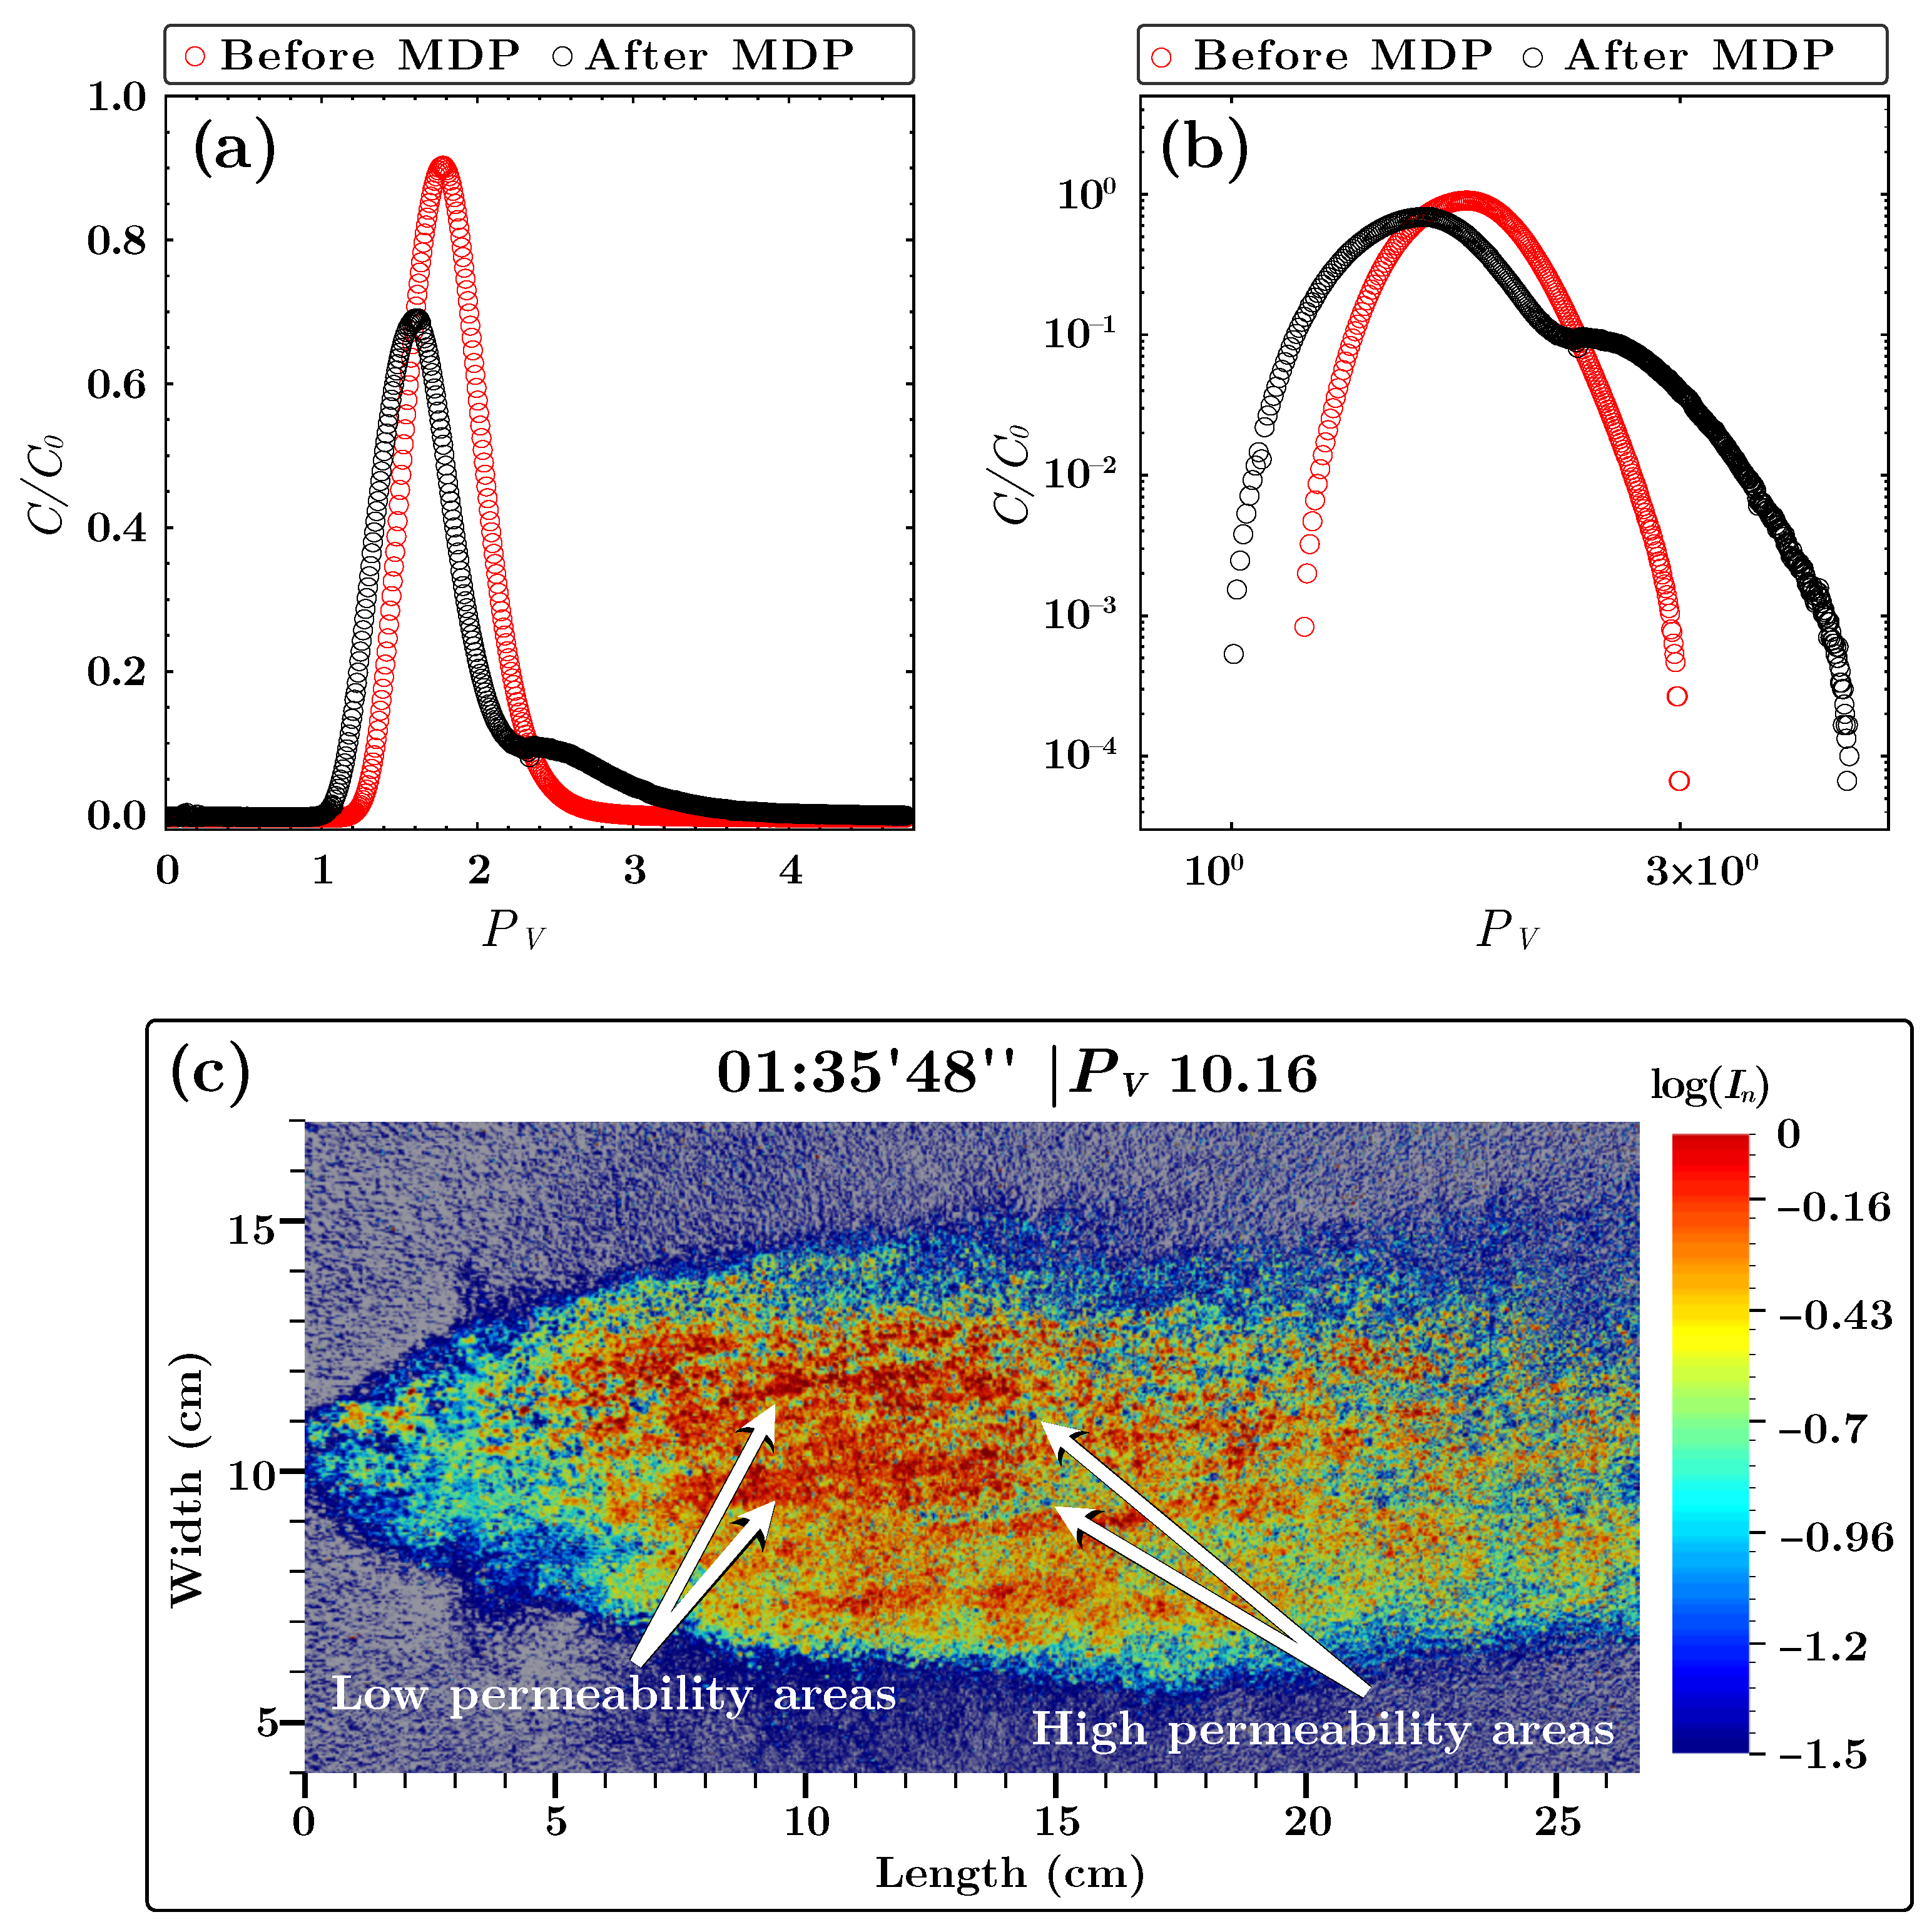
The effect of MDP on solute transport was analyzed through the fluorescein tracer tests obtained before and after the MDP experiment (Figure 5a,b). The first tracer test (before MDP in Figure 5a,b), displays a classical symmetric Gaussian-like distribution, indicative of Fickian behavior, which is the expected outcome for a homogeneous porous media. The BTC after the MDP experiment reveals an earlier arrival of the tracer concentration and a double peak. The first peak concentration is considerably lower than the one obtained in the homogeneous medium, and a weaker second peak that ends in a long tail. Figure 5b highlights these differences by means of a double log scale, especially for the arrival and trailing phases of the BTC, indicating that, as a consequence of the precipitation of calcite, there is a transition from Fickian to non-Fickian or anomalous transport behavior. This can be explained by the development of zones with varying hydraulic conductivities induced by the growth of the calcite mineral, as depicted in Figure 5c. These zones are characterized by areas of low permeability, represented by elongated carbonate structures, and areas of high permeability, which serve as preferential flow channels. The earlier arrival of the tracer after the MDP phase results from the acceleration of flow within preferential channels, where the local velocity increases as the effective flow area decreases, together with flow through unaltered (non-precipitated) regions. The reduction in concentrations in the first arrival, the presence of a second peak, and the extended tailing of the BTC are due to the accumulation of the tracer in areas where calcite precipitated (elongated carbonate structures), which act as zones of low permeability with reduced velocities, which in general have the potential to store the solute for longer periods of time. The solute that during early stages diffused into the low permeability zones slowly diffuses back into the main flow channel at late times. This release mechanism causes the concentration to decline slowly, explaining the long tail in the breakthrough curve. These results suggest that the breakthrough curve obtained after the MDP phase reflects a self-organized heterogeneous porous medium (development of heterogeneity that arises from internal feedbacks between flow, solute transport, and calcite precipitation, rather than from externally imposed parameter variations) characterized by highly anisotropic, spatially correlated variations in local hydraulic conductivity, oriented along the mean flow velocity, which leads to a more heterogeneous water velocity field. The latter may be characterized by a higher dispersion coefficient, giving a higher precipitation rate as illustrated by Equation (3). However, this would still result in the BTCs of Fickian behavior. That is, a model, that increases the dispersion coefficient according to precipitated calcite will not reproduce the two peaks of the observed BTC. More promising are dual-domain or Multi Rate Mass Transfer (MRMT) models, which can mechanistically explain the non-Fickian behavior. By partitioning the system into mobile and immobile zones, MRMT can capture the mass transfer limitations induced by the precipitation structures. For instance, Wang et al. [63] has successfully applied MRMT to biofilm growth in porous media and its effect on transport properties.
Figure 5.
(a) Breakthrough curves obtained before and after MDP experiment. Concentration values are normalized in terms of , and time is expressed in pore volume . The red and black curve represents solute transport before (T1) and after (T2) Mixing-Driven Precipitation (MDP) experiment. (b) Experimental breakthrough curves expressed on a logarithmic scale. (c) Map of calcite precipitation expressed semi-quantitatively in showing elongated carbonate structures patterns and preferential flow paths.
4. Conclusions
Mineral precipitation driven by mixing modifies the properties of porous media, influencing flow and transport processes. Understanding how precipitation structures form and impact solute behavior is crucial for environmental and groundwater engineering applications, such as pollutant remediation and carbon sequestration. In this regard, breakthrough curves (BTCs) are essential tools for analyzing changes in transport behavior. Optimal conditions for promoting precipitation structures have been historically studied in carbonate systems. However, the mechanisms underlying the spatiotemporal evolution of carbonate structure patterns and their influence on solute transport remain largely unknown. In this context, we presented a precipitation experiment conducted in a two-dimensional, intermediate-scale synthetic aquifer designed to resemble a coarse sand aquifer system. In this study, we investigated the Mixing-Driven Precipitation (MDP) of calcite and evaluated its impact on solute transport through breakthrough curves. Finally, we conclude that:
- After conducting the MDP experiment, a self-organized heterogeneous precipitation pattern emerges, characterized by elongated carbonate structures that create markedly preferential flow paths aligned with the main flow direction. The precipitation front formed a symmetrical bell-shaped curve located at the middle of the tank, a pattern distinctly different from the asymmetrical shape predicted by a homogeneous well-mixed equilibrium model with constant transport and hydraulic properties. Initial homogeneity assumed by many theoretical models overly simplifies reality and thus affects the predicted distribution of precipitation, as demonstrated by the comparison of experimental results with the semi-analytical model.
- The highest rate of calcite precipitation occurred within a short period of time at the beginning of the MDP experiment, suggesting that the system is highly sensitive to initial perturbations. Fluctuations in the measured outlet pH values suggest changes in the local flow direction associated with the precipitation of calcite. Interestingly, a significant effect on permeability and transport was achieved with a relatively small amount of precipitated calcite (less than 0.1% of the total tank volume).
- MDP shifted the solute transport behavior of the system from a classical Fickian homogeneous to a non-Fickian anomalous pattern. This was evidenced by a conservative breakthrough curve with a double peak and pronounced tailing, indicative of channeling and back diffusion processes from low-permeability zones.
Our results underscore the importance of understanding the mechanisms behind the formation of local pore-scale heterogeneities due to precipitation, as well as the resulting macroscopic precipitation structure, in order to accurately analyze the behavior of coarse granular aquifers following mineral precipitation processes. This finding highlights the need for models that capture the spatial heterogeneity of precipitation for an accurate interpretation of tracer tests. Future research aimed at improving the understanding of breakthrough curves must focus on accurately characterizing the heterogeneous nature of mineral precipitation patterns.
Supplementary Materials
The following supporting information can be downloaded at: https://www.mdpi.com/article/10.3390/w18050606/s1, Figure S1: View of the Experimental Setup in the Laboratory, Figure S2: Model Representation, Figure S3: PHREEQC Calculations, Figure S4: Calcium Second Derivative, Figure S5: Linear Calcite Precipitation Patterns, Figure S6: Tracer Test Evolution: Initial Stages, Figure S7: Tracer Test Evolution: Final Stages, Figure S8: Evolution of the Precipitation Front; Table S1: Initial Experimental Conditions, Table S2: Time Span Covered for Each Stage of the Experiment, Table S3: Parameters Used in the Semi-Analytical Model; Text S1: Mixing Ratio with Wexler’s Analytical Solution, Text S2: Image Processing for Visualizing Tracer Test Evolution, Text S3: Image Processing for Visualizing Calcite Precipitation Front Evolution. References [44,52,53,64,65] are cited in Supplementary Materials.
Author Contributions
G.G.-S.: conceptualization, formal analysis, investigation, methodology, software, validation, visualization, and writing—original draft preparation; R.P.-I.: conceptualization, formal analysis, methodology, software, supervision, visualization, and writing—review & editing; M.W.S.: conceptualization, formal analysis, methodology, software, and writing—review & editing; D.R.-N.: conceptualization, investigation, methodology, and visualization; M.T.: conceptualization, methodology, and writing—review & editing; D.F.-G.: conceptualization, formal analysis, methodology, resources, supervision, and writing—review & editing. All authors have read and agreed to the published version of the manuscript.
Funding
This research was funded by the Ministry of Economic Affairs and Digital Transformation of the Government of Spain (GRADIENT, PID2021-127911OB-I00), the State Agency for Research (AGAUR-SGR-609) of the Generalitat de Catalunya, and the International Doctoral Scholarship Program of Chile, managed by ANID (National Research and Development Agency).
Data Availability Statement
The original contributions presented in this study are included in the article. Further inquiries can be directed to the corresponding author.
Acknowledgments
The authors thank Maria Llinàs Griful of the Universitat Politècnica de Catalunya for her invaluable support during the laboratory work.
Conflicts of Interest
The authors declare no conflicts of interest.
References
- Rodríguez-Escales, P.; Fernàndez-Garcia, D.; Drechsel, J.; Folch, A.; Sanchez-Vila, X. Improving degradation of emerging organic compounds by applying chaotic advection in m anaged a quifer r echarge in randomly heterogeneous porous media. Water Resour. Res. 2017, 53, 4376–4392. [Google Scholar] [CrossRef] [Scilit]
- Wang, Y.; Fernàndez-Garcia, D.; Sole-Mari, G.; Rodríguez-Escales, P. Enhanced NAPL removal and mixing with engineered injection and extraction. Water Resour. Res. 2022, 58, e2021WR031114. [Google Scholar] [CrossRef] [Scilit]
- Bertran, O.; Fernàndez-Garcia, D.; Sole-Mari, G.; Rodríguez-Escales, P. Enhancing Mixing During Groundwater Remediation via Engineered Injection-Extraction: The Issue of Connectivity. Water Resour. Res. 2023, 59, e2023WR034934. [Google Scholar] [CrossRef] [Scilit]
- Yuan, L.; Wang, K.; Zhao, Q.; Yang, L.; Wang, G.; Jiang, M.; Li, L. An overview of in situ remediation for groundwater co-contaminated with heavy metals and petroleum hydrocarbons. J. Environ. Manag. 2024, 349, 119342. [Google Scholar] [CrossRef] [Scilit]
- Sanford, W.E.; Konikow, L.F. Porosity development in coastal carbonate aquifers. Geology 1989, 17, 249–252. [Google Scholar] [CrossRef] [Scilit]
- Yabusaki, S.; Cantrell, K.; Sass, B.; Steefel, C. Multicomponent reactive transport in an in situ zero-valent iron cell. Environ. Sci. Technol. 2001, 35, 1493–1503. [Google Scholar] [CrossRef] [Scilit] [PubMed]
- Johnson, J.W.; Nitao, J.J.; Knauss, K.G. Reactive transport modelling of CO2 storage in saline aquifers to elucidate fundamental processes, trapping mechanisms and sequestration partitioning. Geol. Soc. Lond. Spec. Publ. 2004, 233, 107–128. [Google Scholar] [CrossRef] [Scilit]
- Werth, C.J.; Cirpka, O.A.; Grathwohl, P. Enhanced mixing and reaction through flow focusing in heterogeneous porous media. Water Resour. Res. 2006, 42, W12414. [Google Scholar] [CrossRef] [Scilit]
- Dentz, M.; Le Borgne, T.; Englert, A.; Bijeljic, B. Mixing, spreading and reaction in heterogeneous media: A brief review. J. Contam. Hydrol. 2011, 120, 1–17. [Google Scholar] [CrossRef] [Scilit]
- de Dreuzy, J.R.; Carrera, J.; Dentz, M.; Le Borgne, T. Time evolution of mixing in heterogeneous porous media. Water Resour. Res. 2012, 48, W06511. [Google Scholar] [CrossRef] [Scilit]
- Dentz, M.; Hidalgo, J.J.; Lester, D. Mixing in porous media: Concepts and approaches across scales. Transp. Porous Media 2023, 146, 5–53. [Google Scholar] [CrossRef] [Scilit]
- Anna, P.d.; Jimenez-Martinez, J.; Tabuteau, H.; Turuban, R.; Le Borgne, T.; Derrien, M.; Méheust, Y. Mixing and reaction kinetics in porous media: An experimental pore scale quantification. Environ. Sci. Technol. 2014, 48, 508–516. [Google Scholar] [CrossRef] [Scilit]
- Valocchi, A.J.; Bolster, D.; Werth, C.J. Mixing-limited reactions in porous media. Transp. Porous Media 2019, 130, 157–182. [Google Scholar] [CrossRef] [Scilit]
- Rolle, M.; Le Borgne, T. Mixing and reactive fronts in the subsurface. Rev. Mineral. Geochem. 2019, 85, 111–142. [Google Scholar] [CrossRef] [Scilit]
- Tartakovsky, A.M.; Tartakovsky, G.D.; Scheibe, T.D. Effects of incomplete mixing on multicomponent reactive transport. Adv. Water Resour. 2009, 32, 1674–1679. [Google Scholar] [CrossRef] [Scilit]
- Wright, E.E.; Richter, D.H.; Bolster, D. Effects of incomplete mixing on reactive transport in flows through heterogeneous porous media. Phys. Rev. Fluids 2017, 2, 114501. [Google Scholar] [CrossRef] [Scilit]
- Battiato, I.; Tartakovsky, D.M.; Tartakovsky, A.M.; Scheibe, T. On breakdown of macroscopic models of mixing-controlled heterogeneous reactions in porous media. Adv. Water Resour. 2009, 32, 1664–1673. [Google Scholar] [CrossRef] [Scilit]
- Lee, M.; Paik, I.S.; Kim, I.; Kang, H.; Lee, S. Remediation of heavy metal contaminated groundwater originated from abandoned mine using lime and calcium carbonate. J. Hazard. Mater. 2007, 144, 208–214. [Google Scholar] [CrossRef] [Scilit] [PubMed]
- Laumann, S.; Micić, V.; Lowry, G.V.; Hofmann, T. Carbonate minerals in porous media decrease mobility of polyacrylic acid modified zero-valent iron nanoparticles used for groundwater remediation. Environ. Pollut. 2013, 179, 53–60. [Google Scholar] [CrossRef] [Scilit]
- Wang, Y.; Pleasant, S.; Jain, P.; Powell, J.; Townsend, T. Calcium carbonate-based permeable reactive barriers for iron and manganese groundwater remediation at landfills. Waste Manag. 2016, 53, 128–135. [Google Scholar] [CrossRef] [Scilit] [PubMed]
- Mohapatra, A.K.; Sujathan, S.; Ekamparam, A.S.; Singh, A. The role of manganese carbonate precipitation in controlling fluoride and uranium mobilization in groundwater. ACS Earth Space Chem. 2021, 5, 2700–2714. [Google Scholar] [CrossRef] [Scilit]
- González-Subiabre, G.; Bertran, O.; Fernàndez-Garcia, D. Impact of sharp soil interfaces on solute transport: Insights from a reactive tracer test in a 2D intermediate-scale experiment. Water 2025, 17, 2382. [Google Scholar] [CrossRef] [Scilit]
- González-Subiabre, G.; Reales-Núñez, D.; Pérez-Illanes, R.; Fernàndez-Garcia, D. Linking Self-Organized Heterogeneities to Solute Transport in Mixing-Induced Precipitated Porous Media. Water 2026, 18, 502. [Google Scholar] [CrossRef] [Scilit]
- Rosenbauer, R.J.; Koksalan, T.; Palandri, J.L. Experimental investigation of CO2–brine–rock interactions at elevated temperature and pressure: Implications for CO2 sequestration in deep-saline aquifers. Fuel Process. Technol. 2005, 86, 1581–1597. [Google Scholar] [CrossRef] [Scilit]
- Kharaka, Y.K.; Thordsen, J.J.; Hovorka, S.D.; Nance, H.S.; Cole, D.R.; Phelps, T.J.; Knauss, K.G. Potential environmental issues of CO2 storage in deep saline aquifers: Geochemical results from the Frio-I Brine Pilot test, Texas, USA. Appl. Geochem. 2009, 24, 1106–1112. [Google Scholar] [CrossRef] [Scilit]
- Altman, S.J.; Aminzadeh, B.; Balhoff, M.T.; Bennett, P.C.; Bryant, S.L.; Cardenas, M.B.; Chaudhary, K.; Cygan, R.T.; Deng, W.; Dewers, T.; et al. Chemical and hydrodynamic mechanisms for long-term geological carbon storage. J. Phys. Chem. C 2014, 118, 15103–15113. [Google Scholar] [CrossRef] [Scilit]
- Keith, D.C.; Harrison, W.J.; Wendlandt, R.F.; Daniels, E.J. Mineralogical responses of siliciclastic carbonate-cemented reservoirs to steamflood enhanced oil recovery. Appl. Geochem. 1998, 13, 491–507. [Google Scholar] [CrossRef] [Scilit]
- Cuthbert, M.O.; McMillan, L.A.; Handley-Sidhu, S.; Riley, M.S.; Tobler, D.J.; Phoenix, V.R. A field and modeling study of fractured rock permeability reduction using microbially induced calcite precipitation. Environ. Sci. Technol. 2013, 47, 13637–13643. [Google Scholar] [CrossRef] [Scilit] [PubMed]
- Wu, J.; Wang, X.B.; Wang, H.F.; Zeng, R.J. Microbially induced calcium carbonate precipitation driven by ureolysis to enhance oil recovery. RSC Adv. 2017, 7, 37382–37391. [Google Scholar] [CrossRef] [Scilit]
- Alarifi, S.A.; Mustafa, A.; Omarov, K.; Baig, A.R.; Tariq, Z.; Mahmoud, M. A review of enzyme-induced calcium carbonate precipitation applicability in the oil and gas industry. Front. Bioeng. Biotechnol. 2022, 10, 900881. [Google Scholar] [CrossRef] [Scilit] [PubMed]
- Mitchell, A.C.; Ferris, F.G. The coprecipitation of Sr into calcite precipitates induced by bacterial ureolysis in artificial groundwater: Temperature and kinetic dependence. Geochim. Cosmochim. Acta 2005, 69, 4199–4210. [Google Scholar] [CrossRef] [Scilit]
- Singh, R.; Yoon, H.; Sanford, R.A.; Katz, L.; Fouke, B.W.; Werth, C.J. Metabolism-induced CaCO3 biomineralization during reactive transport in a micromodel: Implications for porosity alteration. Environ. Sci. Technol. 2015, 49, 12094–12104. [Google Scholar] [CrossRef] [Scilit] [PubMed]
- Singurindy, O.; Berkowitz, B.; Lowell, R.P. Carbonate dissolution and precipitation in coastal environments: Laboratory analysis and theoretical consideration. Water Resour. Res. 2004, 40, W04401. [Google Scholar] [CrossRef] [Scilit]
- Fujita, Y.; Taylor, J.L.; Gresham, T.L.; Delwiche, M.E.; Colwell, F.S.; McLing, T.L.; Petzke, L.M.; Smith, R.W. Stimulation of microbial urea hydrolysis in groundwater to enhance calcite precipitation. Environ. Sci. Technol. 2008, 42, 3025–3032. [Google Scholar] [CrossRef] [Scilit] [PubMed]
- Lauchnor, E.G.; Schultz, L.N.; Bugni, S.; Mitchell, A.C.; Cunningham, A.B.; Gerlach, R. Bacterially induced calcium carbonate precipitation and strontium coprecipitation in a porous media flow system. Environ. Sci. Technol. 2013, 47, 1557–1564. [Google Scholar] [CrossRef] [Scilit]
- Tartakovsky, A.M.; Redden, G.; Lichtner, P.C.; Scheibe, T.D.; Meakin, P. Mixing-induced precipitation: Experimental study and multiscale numerical analysis. Water Resour. Res. 2008, 44. [Google Scholar] [CrossRef] [Scilit]
- Zhang, C.; Dehoff, K.; Hess, N.; Oostrom, M.; Wietsma, T.W.; Valocchi, A.J.; Fouke, B.W.; Werth, C.J. Pore-scale study of transverse mixing induced CaCO3 precipitation and permeability reduction in a model subsurface sedimentary system. Environ. Sci. Technol. 2010, 44, 7833–7838. [Google Scholar] [CrossRef] [Scilit]
- Katz, G.E.; Berkowitz, B.; Guadagnini, A.; Saaltink, M.W. Experimental and modeling investigation of multicomponent reactive transport in porous media. J. Contam. Hydrol. 2011, 120, 27–44. [Google Scholar] [CrossRef] [Scilit]
- Yoon, H.; Valocchi, A.J.; Werth, C.J.; Dewers, T. Pore-scale simulation of mixing-induced calcium carbonate precipitation and dissolution in a microfluidic pore network. Water Resour. Res. 2012, 48. [Google Scholar] [CrossRef] [Scilit]
- Bray, J.M.; Lauchnor, E.G.; Redden, G.D.; Gerlach, R.; Fujita, Y.; Codd, S.L.; Seymour, J.D. Impact of mineral precipitation on flow and mixing in porous media determined by microcomputed tomography and MRI. Environ. Sci. Technol. 2017, 51, 1562–1569. [Google Scholar] [CrossRef] [Scilit]
- Rolle, M.; Eberhardt, C.; Chiogna, G.; Cirpka, O.A.; Grathwohl, P. Enhancement of dilution and transverse reactive mixing in porous media: Experiments and model-based interpretation. J. Contam. Hydrol. 2009, 110, 130–142. [Google Scholar] [CrossRef] [Scilit]
- Li, X.; Yang, X. Effects of physicochemical properties and structural heterogeneity on mineral precipitation and dissolution in saturated porous media. Appl. Geochem. 2022, 146, 105474. [Google Scholar] [CrossRef] [Scilit]
- Cil, M.B.; Xie, M.; Packman, A.I.; Buscarnera, G. Solute mixing regulates heterogeneity of mineral precipitation in porous media. Geophys. Res. Lett. 2017, 44, 6658–6666. [Google Scholar] [CrossRef] [Scilit]
- Perkins, T.K.; Johnston, O. A review of diffusion and dispersion in porous media. Soc. Pet. Eng. J. 1963, 3, 70–84. [Google Scholar] [CrossRef] [Scilit]
- Parkhurst, D.L.; Appelo, C. User’s Guide to PHREEQC (Version 2): A Computer Program for Speciation, Batch-Reaction, One-Dimensional Transport, and Inverse Geochemical Calculations; Technical Report; US Geological Survey: Reston, VA, USA, 1999. [Google Scholar]
- Bradski, G.; Kaehler, A. Learning OpenCV: Computer Vision with the OpenCV Library; O’Reilly Media, Inc.: Sebastopol, CA, USA, 2008. [Google Scholar]
- Howse, J. OpenCV Computer Vision with Python; Packt Publishing: Birmingham, UK, 2013; Volume 27. [Google Scholar]
- Schuszter, G.; Brau, F.; De Wit, A. Calcium carbonate mineralization in a confined geometry. Environ. Sci. Technol. Lett. 2016, 3, 156–159. [Google Scholar] [CrossRef] [Scilit]
- Schuszter, G.; De Wit, A. Comparison of flow-controlled calcium and barium carbonate precipitation patterns. J. Chem. Phys. 2016, 145, 224201. [Google Scholar] [CrossRef] [Scilit] [PubMed]
- Schuszter, G.; Brau, F.; De Wit, A. Flow-driven control of calcium carbonate precipitation patterns in a confined geometry. Phys. Chem. Chem. Phys. 2016, 18, 25592–25600. [Google Scholar] [CrossRef] [Scilit]
- De Simoni, M.; Sanchez-Vila, X.; Carrera, J.; Saaltink, M. A mixing ratios-based formulation for multicomponent reactive transport. Water Resour. Res. 2007, 43. [Google Scholar] [CrossRef] [Scilit]
- Wexler, E.J. Analytical Solutions for One-, Two-, and Three-Dimensional Solute Transport in Ground-Water Systems with Uniform Flow; US Government Printing Office: Washington, DC, USA, 1992. [Google Scholar]
- Parkhurst, D.L. User’s Guide to PHREEQC: A Computer Program for Speciation, Reaction-Path, Advective-Transport, and Inverse Geochemical Calculations; Number 95-4227; US Department of the Interior, US Geological Survey: Reston, VA, USA, 1995. [Google Scholar]
- Parkhurst, D.L.; Appelo, C. Description of Input and Examples for PHREEQC Version 3—A Computer Program for Speciation, Batch-Reaction, One-Dimensional Transport, and Inverse Geochemical Calculations; U.S. Geological Survey: Reston, VA, USA, 2013; 497p. [Google Scholar]
- Noiriel, C.; Steefel, C.I.; Yang, L.; Bernard, D. Effects of pore-scale precipitation on permeability and flow. Adv. Water Resour. 2016, 95, 125–137. [Google Scholar] [CrossRef] [Scilit]
- Leroy, P.; Li, S.; Jougnot, D.; Revil, A.; Wu, Y. Modelling the evolution of complex conductivity during calcite precipitation on glass beads. Geophys. J. Int. 2017, 209, 123–140. [Google Scholar] [CrossRef] [Scilit]
- Nambi, I.M.; Werth, C.J.; Sanford, R.A.; Valocchi, A.J. Pore-scale analysis of anaerobic halorespiring bacterial growth along the transverse mixing zone of an etched silicon pore network. Environ. Sci. Technol. 2003, 37, 5617–5624. [Google Scholar] [CrossRef] [Scilit] [PubMed]
- Green, D.C.; Shida, Y.; Honma, N.; Holden, M.A.; Kim, Y.Y.; Kulak, A.N.; Ogasawara, W.; Meldrum, F.C. Skin-Deep Surface Patterning of Calcite. Chem. Mater. 2019, 31, 8725–8733. [Google Scholar] [CrossRef] [Scilit]
- Izumoto, S.; Huisman, J.A.; Zimmermann, E.; Heyman, J.; Gomez, F.; Tabuteau, H.; Laniel, R.; Vereecken, H.; Méheust, Y.; Le Borgne, T. Pore-scale mechanisms for spectral induced polarization of calcite precipitation inferred from geo-electrical millifluidics. Environ. Sci. Technol. 2022, 56, 4998–5008. [Google Scholar] [CrossRef] [Scilit]
- Redden, G.; Fujita, Y.; Delwiche, M.; White, T.; Roney, T.; Versteeg, R.; Fox, D.; Palmer, C. Mixing solutions, precipitation and changing permeability in porous media. Geochim. Cosmochim. Acta Suppl. 2005, 69, A180. [Google Scholar]
- Gramling, C.M.; Harvey, C.F.; Meigs, L.C. Reactive transport in porous media: A comparison of model prediction with laboratory visualization. Environ. Sci. Technol. 2002, 36, 2508–2514. [Google Scholar] [CrossRef] [Scilit]
- Borgne, T.L.; Ginn, T.R.; Dentz, M. Impact of fluid deformation on mixing-induced chemical reactions in heterogeneous flows. Geophys. Res. Lett. 2014, 41, 7898–7906. [Google Scholar] [CrossRef] [Scilit]
- Wang, J.; Carrera, J.; Saaltink, M.W.; Petchamé-Guerrero, J.; Herrera, G.S.; Valhondo, C. Biofilm growth in porous media well approximated by fractal multirate mass transfer with advective-diffusive solute exchange. Water Resour. Res. 2024, 60, e2023WR036872. [Google Scholar] [CrossRef] [Scilit]
- Mordvintsev, A.; Abid, K. OpenCV-Python Tutorials Documentation. Technical Report 2014. Available online: https://depcent.nitc.ac.in/electrical/ipg-new/python/opencv-python-tutroals.pdf (accessed on 26 January 2026).
- Trabucchi, M.; Garcia, D.F.; Carrera, J. Visualizing and evaluating wormholes formation dynamics under flow competition in an intermediate-scale dissolution experiment. Sci. Total Environ. 2023, 867, 160977. [Google Scholar] [CrossRef] [Scilit] [PubMed]

Disclaimer/Publisher’s Note: The statements, opinions and data contained in all publications are solely those of the individual author(s) and contributor(s) and not of MDPI and/or the editor(s). MDPI and/or the editor(s) disclaim responsibility for any injury to people or property resulting from any ideas, methods, instructions or products referred to in the content. |
© 2026 by the authors. Licensee MDPI, Basel, Switzerland. This article is an open access article distributed under the terms and conditions of the Creative Commons Attribution (CC BY) license.