


Abstract
Combined sewer overflow (CSO) pollution has consequently become a critical challenge, yet its formation depends on tightly coupled dry- and wet-weather processes. This study aims to integrate high-resolution field monitoring with statistical analysis to characterize the full “accumulation–transport–discharge” cycle of CSO pollution in a representative combined sewer catchment located in the Yangtze River basin, China. A dynamic analytical framework was established, combining multiple pollution media and linking dry-weather accumulation with rainfall-driven transport, enabling quantitative source apportionment of pollutant contributions. Results indicated that during dry periods, domestic sewage exhibited strong enrichment, with concentrations of total inorganic nitrogen (TIN), chemical oxygen demand (COD), and total phosphorus (TP) being 2.1-, 2.3-, and 1.9-fold higher, respectively, than the Chinese secondary discharge standards (GB 18918-2002). Surface sediment showed pronounced spatial heterogeneity, with greater loads in residential than transportation areas and substantial fine-particle accumulation on roofs (particle size < 150 μm, accounting for 73% by mass). Sewer sediments, dominated by coarse inorganic particles (over 77% by mass), represented the main pollutant reservoir. Rainfall produced distinct hydrodynamic and water quality responses. Light rain following long antecedent dry periods generated a high-concentration but low-load regime with a strong first flush, whereas moderate rain yielded lower concentrations but higher loads. Overflow occurred when rainfall exceeded ~14 mm, with pollutant peaks lagging rainfall by 20–45 min in the studied area. TIN and TP peaked sharply at rainfall event onset, and first-flush intensities followed TIN > TP > COD > suspended solids (SS). Source apportionment identified sewer sediments as the dominant CSO source, followed by surface runoff and domestic sewage. These findings clarify the mechanisms linking dry-weather accumulation to wet-weather transport and support targeted CSO pollution control and urban water quality management.
1. Introduction
Combined sewer overflow (CSO) pollution has emerged as a critical challenge for urban water management worldwide [1]. During rainfall events, exceeding the conveyance capacity of sewer networks or treatment capacity of wastewater treatment plants, excess untreated mixed sewage is discharged directly into receiving waters via overflow structures. Such discharges typically contain high concentrations of organic matter, nutrients, and suspended solids, which constitute the dominant fraction of CSO pollution loads and drive the primary water quality impacts. In addition, CSO discharges may transport trace pollutants associated with particulate matter [2], reflecting the coupled behavior of pollutants during overflow events.
CSO discharges trigger a wide range of environmental risks. They accelerate eutrophication and the formation of black-odor water bodies [3], disrupt the structures and function of aquatic ecosystems [4], increase the transmission risk of pathogenic microorganisms, and pose long-term threats to human health due to chronic exposure to toxic substances [5]. Frequent CSO events also impose considerable operational and maintenance burdens on urban drainage infrastructure [6,7]. In China, where wastewater collection and treatment capacities are increasing and point source pollution is largely controlled [8], CSO has become a major contributor to urban non-point source pollution. Therefore, systematic CSO control is essential for safeguarding water quality, ecosystem integrity, public health, and sustainable urban development [9,10].
Although rainfall precipitation is widely recognized as a key driver of runoff wash-off and CSO generation [11], CSO pollution is not a simple consequence of individual rainfall events. Rather, it results from a complex sequence of interconnected processes, including dry-weather pollutant accumulation, rainfall-induced transport, in-sewer transport, and eventual overflow discharge. Existing research mainly concentrated on pollutant transport and discharge mechanisms during rainfall, focusing on rainfall–runoff responses, sewer sediment mobilization driven by rapidly increasing flow, and pollutant release through CSO structures, with comparatively limited attention to pollutant accumulation during antecedent dry period (ADP) and its influence on subsequent CSO pollution dynamics. This knowledge gap limits accurate load prediction and weakens the scientific basis for targeted control strategies.
Surface sediments derive from atmospheric deposition, vehicular abrasion particles, and biogenic debris [12], and their accumulation is influenced by ADP, street sweeping frequency, and wind disturbances [13]. A conceptual model describing street particle production, transport, and delivery has been developed [14], but field-based verification at the event scale remains limited. Sewer sediments, primarily from domestic wastewater and redeposited surface runoff [15], with additional contributions from sewer biofilms [16], form a persistent in-sewer pollutant reservoir. Pollutant stocks accumulate continuously during dry periods, and their magnitude governs the potential for CSO pollution release [17]. Nevertheless, interactions among multiple pollutant source reservoirs and their chain-response behaviors during rainfall events remain poorly understood, hindering mechanism-based source apportionment and control.
Moreover, pollutant release characteristics vary significantly across land-use types and surface categories. Organic pollutants and nutrients are generally higher in commercial areas than in residential zones [18], while transportation streets are typically dominated by suspended solids and heavy metals [19]. In contrast, rooftop runoff generally exhibits relatively low pollution levels [20]. Pronounced first-flush effects are widely reported in surface runoff [21,22,23]. Rainfall depth, intensity, and duration strongly influence overflow pollutant loads [24,25]. However, most studies focus on these output-side drivers, while the internal coupling mechanisms linking pollutant accumulation and transport remains inadequately understood.
Overall, domestic sewage, surface runoff, and sewer sediments constitute the primary pollutant sources in CSO systems [26]. Domestic sewage contributes substantially to background loads in the absence of rainfall dilution [27]. Sewer sediments can account for up to 60–70% of total pollutant loads [28]. A comprehensive understanding of the composition and contribution mechanisms of these sources is essential for effective CSO management. Such understanding underpins the transition from traditional static assessments toward integrated strategies encompassing source reduction, in-system process control, and end-of-pipe regulation.
To address these gaps, this study aims to investigate how CSO pollution responds to and how its sources can be apportioned under the combined influence of dry-weather pollutant accumulation and rainfall characteristics. A typical combined sewer catchment in the central urban area of a Chinese city was selected, and an integrated sampling and analytical framework was developed to capture the full sequence of pollutant accumulation, transport, and discharge processes. For the first time, this study systematically couples dry- and wet-weather processes, overcoming the limitations of traditional single-process approaches. From both temporal and spatial perspectives, this study systematically elucidates the accumulation patterns of domestic sewage, surface sediments, and sewer sediments, and quantitatively evaluates their respective contributions to CSO pollution. The results advance mechanistic understanding beyond traditional static evaluation, providing both theoretical insights and practical guidance for precision control and optimized management of CSO in urban drainage systems.
2. Materials and Methods
2.1. Study Area and Sampling Design
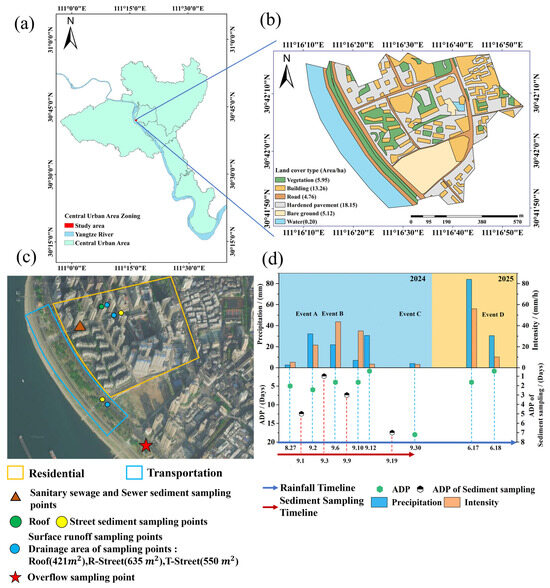
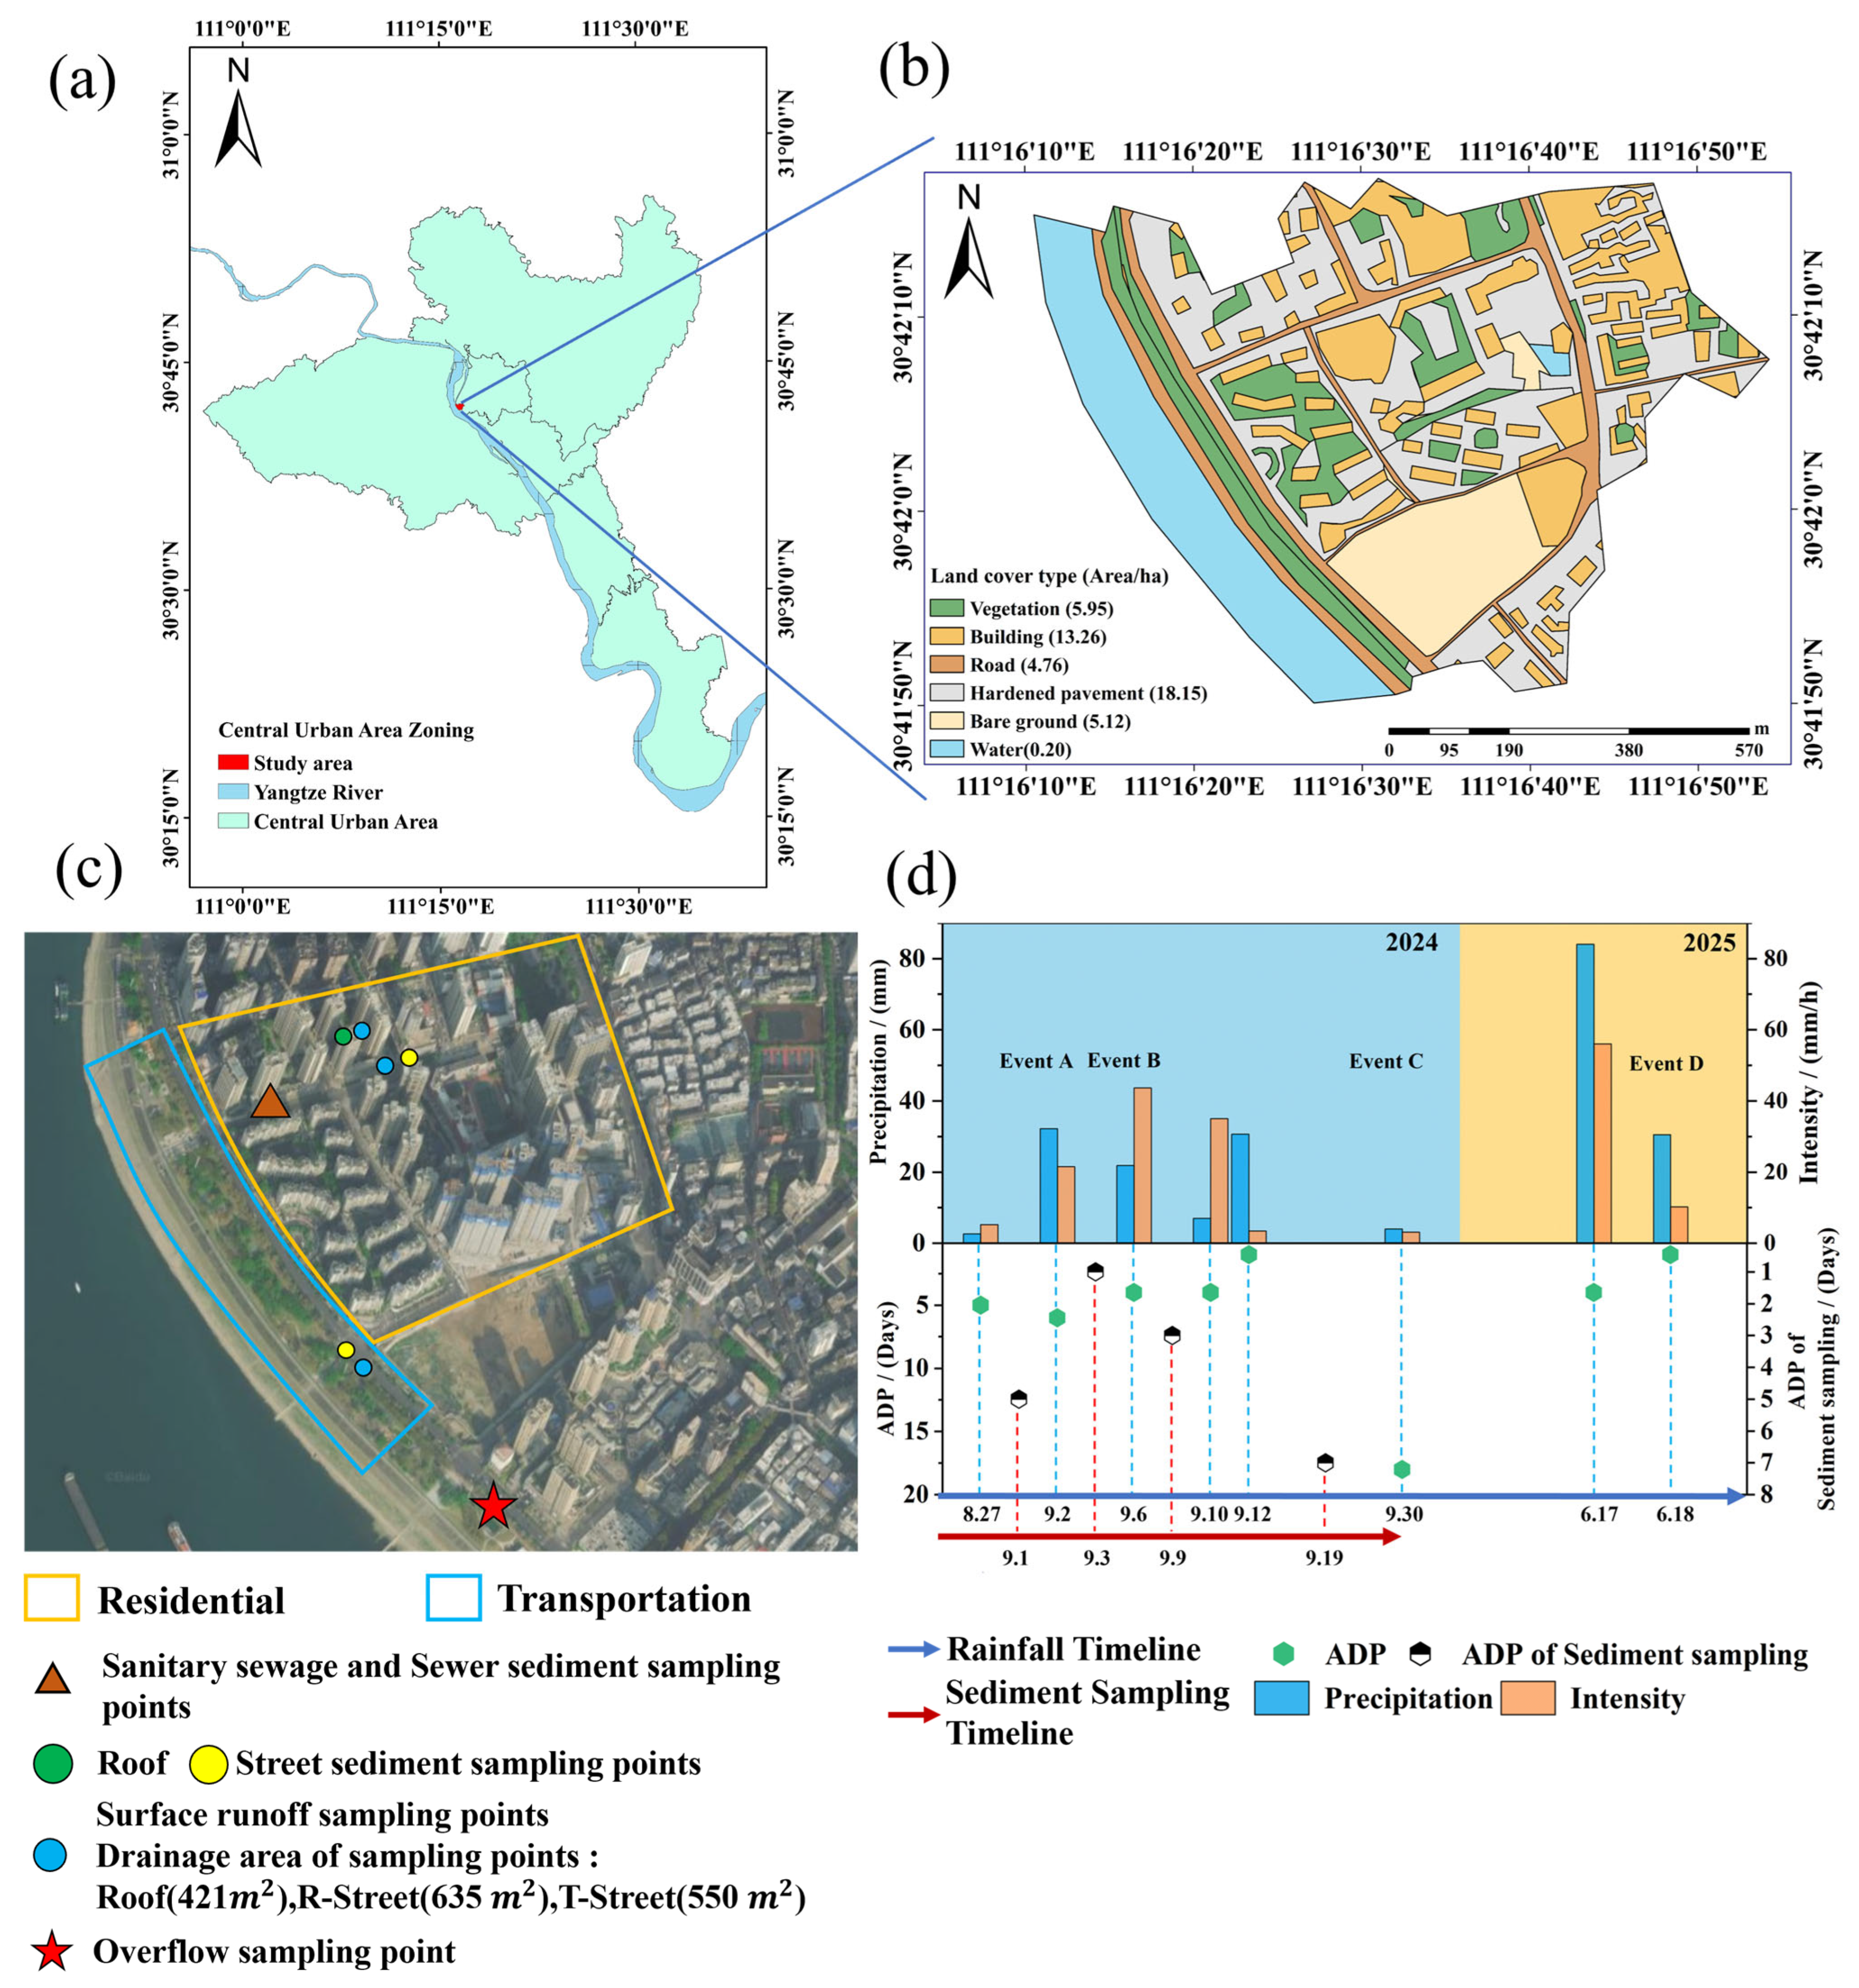
The study area (Figure 1a) is located in the transitional zone between the hilly and plain regions of the middle–upper Yangtze River basin, characterized by a north to south sloping terrain. The landscape is dominated by hills and low mountains, with an average elevation of around 100 m. The region has a subtropical monsoon humid climate, where 60–70% of the annual precipitation occurs between April and September. The long-term mean annual precipitation is 1157.5 mm, with interannual variability ranging from 733.3 mm to 1866.6 mm. Light rainfall accounts for approximately 75% of rainy days, while heavy rainfall occurs only 1–7 days per year. The detailed rainfall information is provided in Supplementary Materials (Figure S1).
Figure 1.
Research area overview: (a) distribution map of urban centers in the study area; (b) land cover distribution map of the study area; (c) distribution map of sampling points; (d) precipitation characteristics, where ADP represents antecedent dry period.
The selected study area is a typical combined sewer system (CSS) catchment located in the urban core. The catchment is subdivided into 14 tertiary drainage sub-catchments, with impervious surfaces accounting for more than 70% of the area. One representative sub-catchment was selected for detailed investigation (Figure 1b). This sub-catchment covers an area of 48.43 ha, of which approximately 77% consists of paved surfaces, and exhibits land-use proportions comparable to those of the entire catchment. The total length of the drainage network is 8.70 km, with combined sewer pipes comprising 64.8% of the system. An interception wall is installed upstream of the overflow weir to facilitate the interception of initial stormwater under normal rainfall conditions. The high degree of imperviousness and rapid runoff response result in steep hydrograph peaks during heavy rainfall events. In addition, combined sewer overflow from the study area is discharged directly into the Yangtze River, making this catchment particularly suitable for investigating CSO hydrodynamics and the associated pollutant transport processes.
The area features two dominant urban land-use types: residential (R) and transportation (T). Sampling sites were installed in both zones (Figure 1c) to investigate pollutant accumulation on roofs and streets during ADP and their transport during rainfall events. Previous studies have shown that approximately 80% of total surface sediment accumulation occurs within the first seven dry days [29,30]. Thus, dry periods of 1–7 days were selected for sediment sampling. Overflow water samples were collected at the overflow weir (111.282° E, 30.695° N), while domestic sewage and sewer sediment samples were obtained from a branch sewer conduit (111.278° E, 30.699° N).
2.2. Multi-Source Pollutant Monitoring and Sampling
Comprehensive sampling campaigns were conducted in September 2024 and June 2025 to monitor pollutants, including dry-weather domestic sewage, surface sediments, sewer sediments, as well as surface runoff and CSO wastewater during rainfall events. Detailed sampling methods and quantities are summarized in Table 1. To capture the rapid temporal dynamics of pollutant transport, rainfall–runoff and overflow samples were collected following a “dense-first, sparse-later” strategy, which is widely applied to resolve first-flush characteristics and early-stage concentration peaks [31]. Immediately after collection, all samples were stored at 4 °C and transported to the laboratory within 24 h for further analysis.
Table 1.
Pollution sources, sampling methods, and sample numbers during dry and rainfall periods.
Flow rates of domestic sewage, mixed storm–sewage flow, and overflow discharge were continuously recorded at one-minute intervals under both dry- and wet-weather conditions using THWater Doppler ultrasonic flowmeters (TWQ) (Beijing Qinghuan Smart Water Technology Co., Ltd., Beijing, China). Flow measurements were conducted based on the velocity–area method, with flow velocity measured using the Doppler ultrasonic principle and liquid level monitored by pressure sensors or ultrasonic techniques, enabling full-range level detection. The system is capable of providing accurate liquid level measurements even under overload conditions. Collected parameters included instantaneous liquid level, flow velocity, and flow rate. These high-resolution hydrodynamic data ensured accurate quantification of pollutant loads and enabled detailed interpretation of accumulation–transport–discharge processes across different flow regimes.
2.3. Representative Rainfall Events Selection
Four representative rainfall events were monitored between September 2024 and June 2025. Rainfall classification followed meteorological standards established by the Standardization Administration of China (GB/T 28592-2012) [32], with detailed classifications provided in the Supplementary Materials (Table S1). In 2024, a total of 70 rainfall events occurred in the study area, of which light, moderate, and heavy rain events accounted for 54%, 19%, and 27%, respectively. The selected events span heavy (Event A: 32.2 mm; Event D: 30.5 mm), moderate (Event B: 21.8 mm), and light rainfall (Event C: 4.0 mm) conditions, thereby capturing a wide range of hydrological and CSO responses scenarios (Figure 1d). The selected event durations ranged from 0.5 to 3 h, with rainfall intensities of 3.08–43.60 mm/h and ADPs of 1–18 days, representing different pollutant build-up conditions. The detailed characteristics of the rainfall events are summarized in Supplementary Materials (Table S2). Rainfall was recorded at one-minute intervals using a THWater tipping-bucket rain gauge (Beijing Qinghuan Smart Water Technology Co., Ltd., Beijing, China) (111.29° E, 30.70° N; resolution 0.2 mm/min), providing high-resolution meteorological inputs for subsequent CSO hydrodynamic and pollutant process analyses. This ensures comprehensive coverage of pollutant accumulation–transport responses and supports robust interpretation of intra-event variability in CSO processes.
2.4. Physicochemical Parameters Analysis
Water samples were analyzed for COD, SS, TP and TIN following national standard methods [33]. Specifically, COD was determined using the rapid dichromate (potassium dichromate) method, SS by the gravimetric method, and TP by the molybdenum–antimony anti-spectrophotometric method. TIN was calculated as the sum of three inorganic nitrogen species, including ammonium nitrogen (NH4+–N) determined by the Nessler’s reagent spectrophotometric method, nitrite nitrogen (NO2−–N) determined by the N-(1-naphthyl)-ethylenediamine spectrophotometric method, and nitrate nitrogen (NO3−–N) determined by the thymol method. Surface sediment samples were air-dried and sieved sequentially through 10-mesh, 50-mesh (300 μm), 100-mesh (150 μm), and 150-mesh (100 μm) screens to obtain grain-size fractions. For each fraction, 1 g of sediment was mixed with ultrapure water at a mass ratio of 1:250, shaken for 3 h, and ultrasonically extracted for 2 h (180 W) to obtain dissolved pollutants, which were analyzed for TIN, COD, SS, and TP concentrations. For sewer sediments, additional physicochemical parameters were measurements including water content (θ), total solids (TS), and volatile solids (VS), which were used to characterize pollutant storage properties.
2.5. Statistical Analysis
To characterize average pollutant discharge during rainfall events, the event mean concentration (EMC) was calculated following Equation (1) [34]:
where EMC is the event mean concentration (mg/L); is the total pollutant load during the event (mg); is the total runoff volume (L); and are instantaneous concentration (mg/L) and flow rate (L/h) at time t (h); and are the concentration and flow rate of the -th collected sample.
2.5.1. First-Flush Analysis
The cumulative load-cumulative runoff relationship was used to construct the M(V) curve, in which the initial slope indicates the strength of the first flush [35]. The first-flush factor MFF30 was applied to quantify the initial flush intensity (Equation (2)) [36]:
where is the pollutant load fraction discharged within the first 30% of runoff volume. Classification criteria are MFF30 ≥ 1.67 for a strong first flush, 1 < MFF30 < 1.67 for a moderate first flush, and MFF30 ≤ 1 indicating no initial flush.
To further describe pollutant release during mid-term flushing behavior, the intermediate flush rate (IF) was calculated following Equation (3) [37]:
where is the flush rate between runoff percentage m% and n%; , are the cumulative pollutant load fractions at those runoff thresholds.
2.5.2. Source Apportionment
A mass-balance model integrating surface runoff, domestic sewage, and sewer sediment contributions was used to quantify pollutant source composition during overflow events (Equation (4)) [38]:
where is the pollutant load in overflow discharge (kg); is the domestic sewage load (kg); is the surface runoff load (kg); is the sewer sediments load (kg).
Pollutant load is estimated through the following steps: integrating flow and concentration data within a single land cover type unit (Equation (5)), extrapolating to the study area based on area proportion (Equation (6)), and summing the pollutant loads across all land cover types (Equation (7)). The calculation formula is as follows:
where is the pollution load generated by a unit area of the i-th underlying surface during a single rainfall event (kg); is the surface runoff flow rate of the i-th underlying surface at time step t (m3/s); is the corresponding pollutant concentration (mg/L); is the time step (min).
where is the total pollution load contributed by the i-th underlying surface within the study area (kg); is the total area of the i-th underlying surface within the study area (m2); is the area of the corresponding unit underlying the surface (m2).
where is the total surface runoff pollution load in the study area (kg).
The pollutant load of dry-weather domestic sewage was calculated based on the monitored sewage flow rate and the average pollutant concentrations measured at the overflow chamber under dry-weather conditions (Equation (8)):
where is the average dry-weather domestic sewage flow rate at the overflow chamber (L/s); is the average concentration of each pollutant (mg/L); and is the duration of the rainfall event (s).
The pollution load associated with sewer sediments () cannot be directly calculated. Therefore, it was indirectly estimated using the relationship among the total overflow pollution load, the dry-weather domestic sewage load, and the rainfall–runoff pollution load, as expressed in Equation (4).
3. Results and Discussion
3.1. Accumulation of Surface Sediment
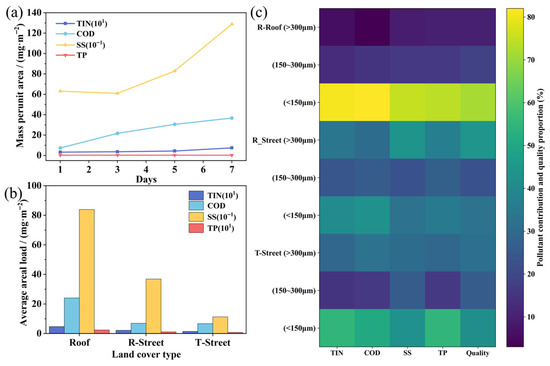
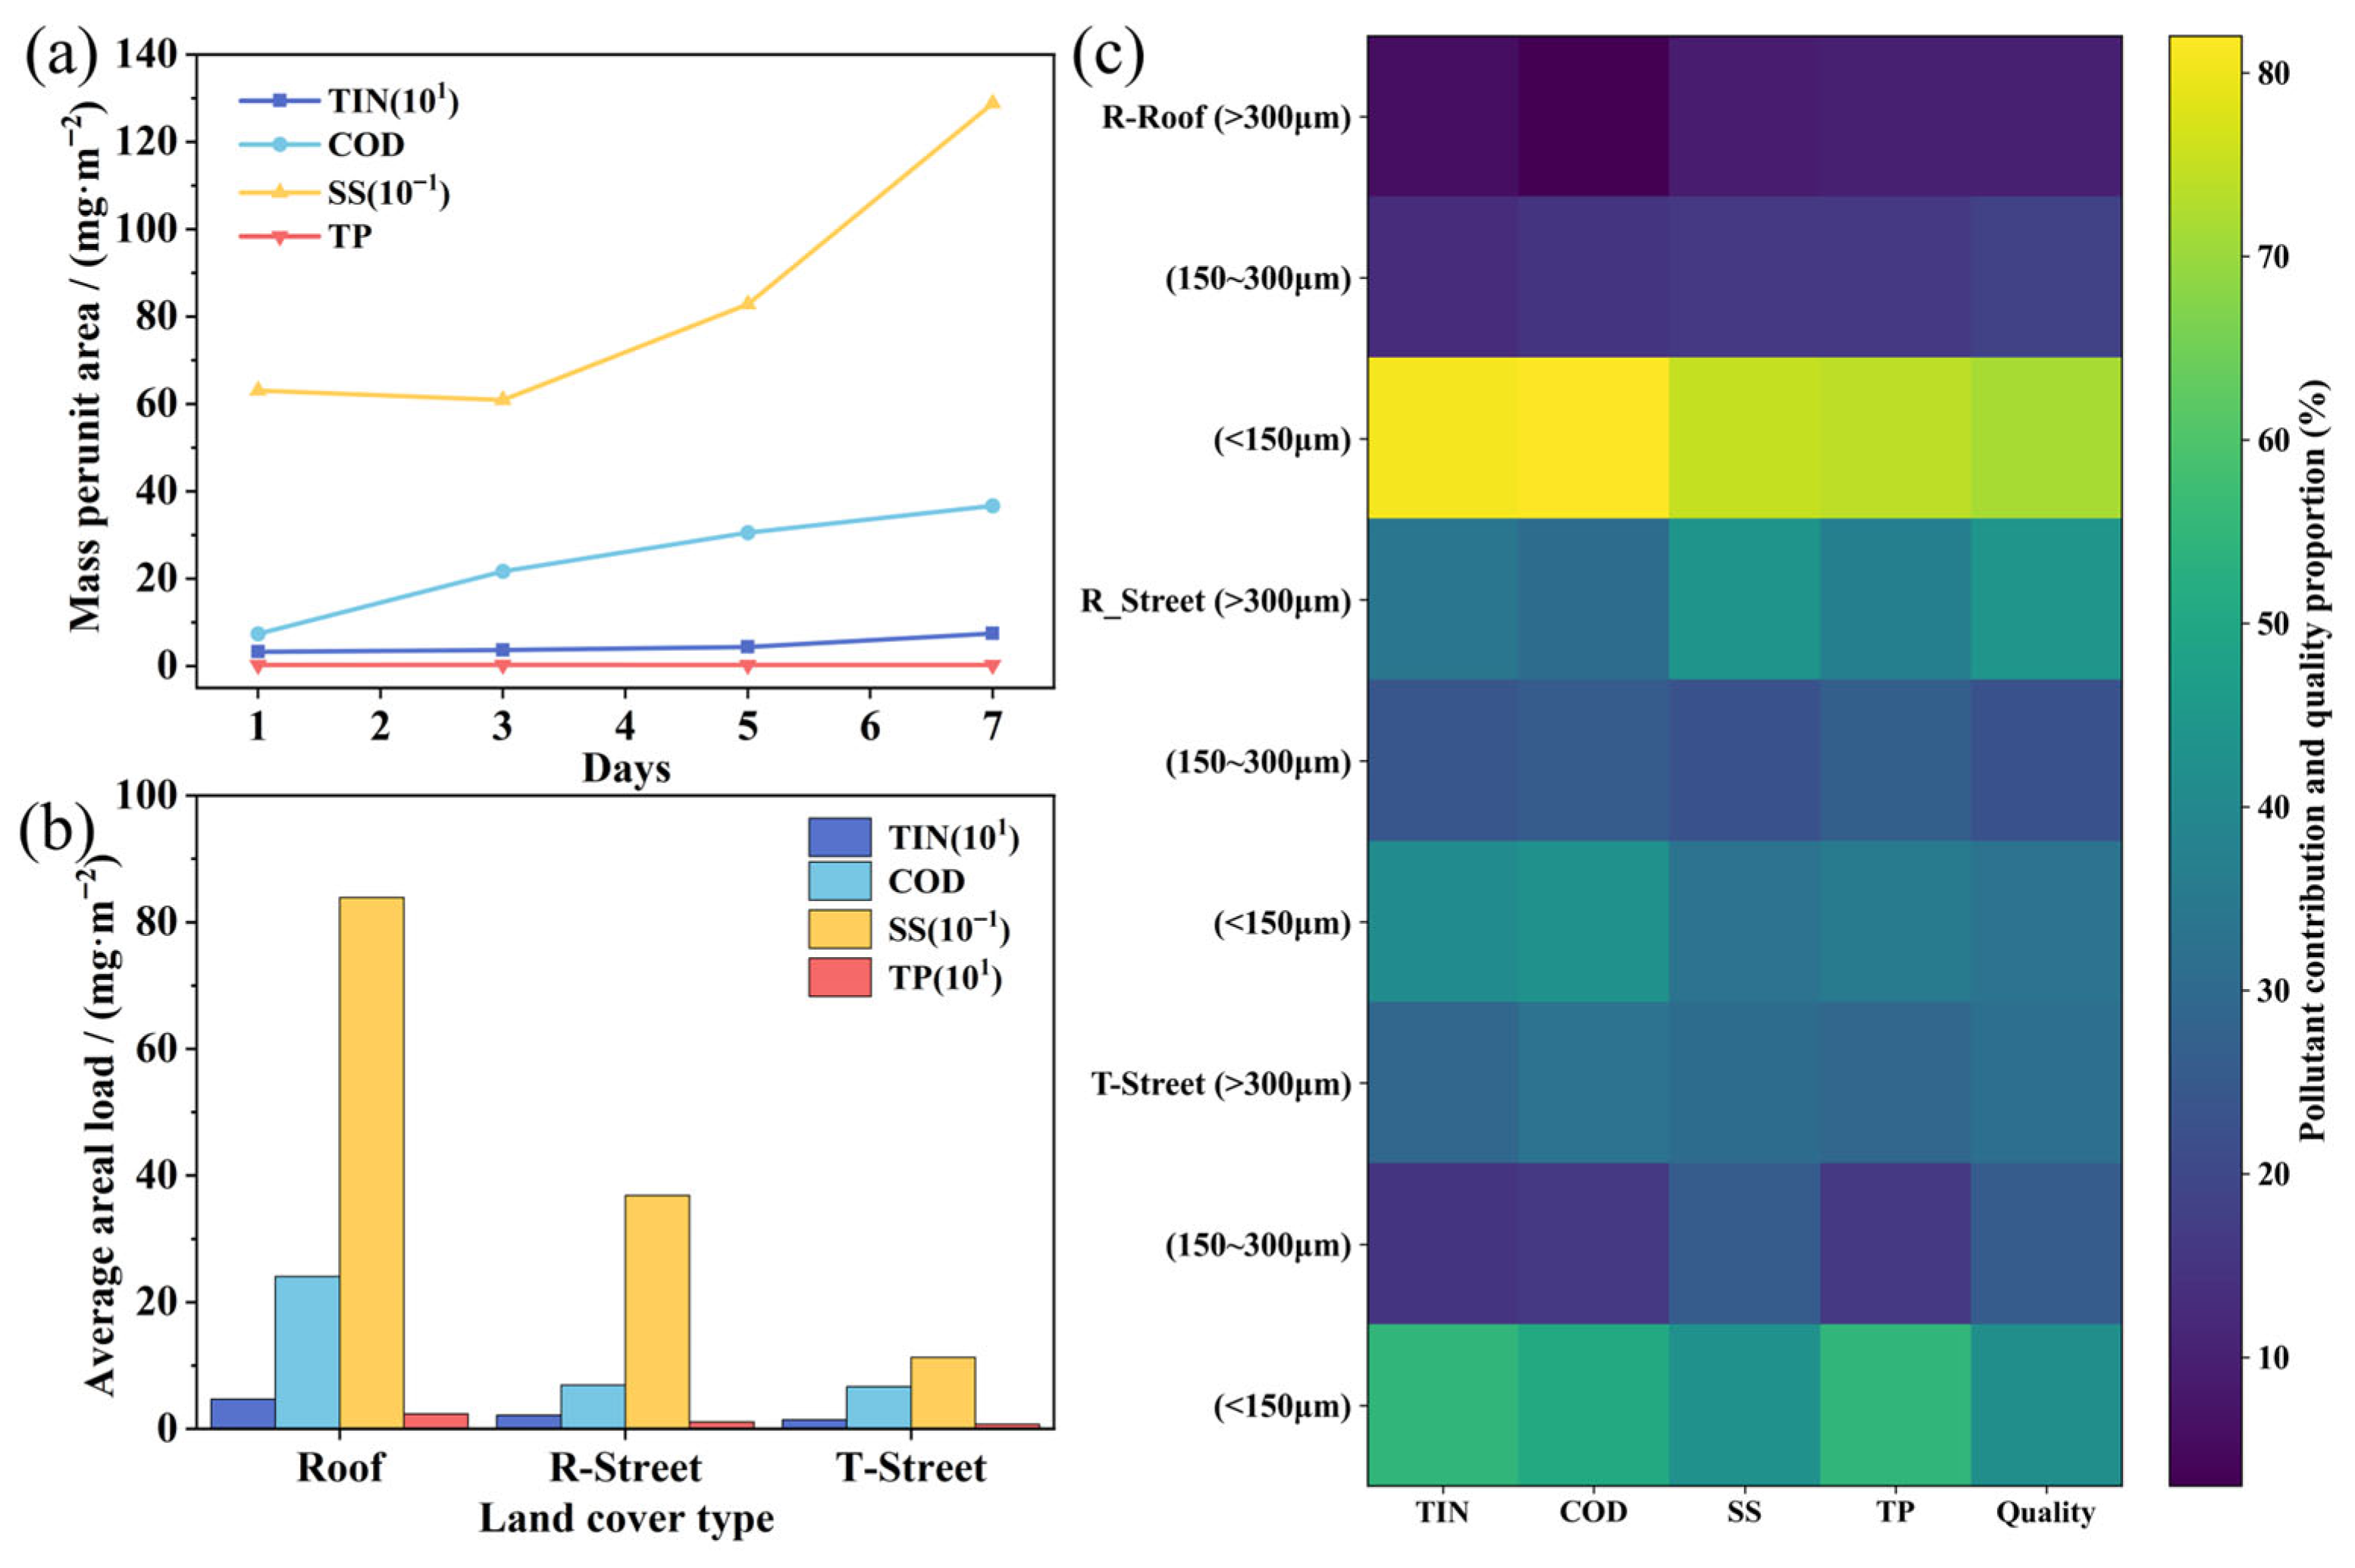
Urban surface sediments function as major carriers of CSO pollutants, and their build-up directly influences the magnitude of first-flush wash-off and the associated discharge risks [39]. Rooftop sediments in residential areas illustrate these dynamics (Figure 2a). Across dry periods of 1–7 days, pollutant loads exhibited clear accumulation patterns: while TP remained relatively stable, TIN, COD, and SS increased markedly with prolonged dry days. For example, COD loads increased from 7.36 mg/m2 after 1 dry day to 21.66, 30.51, and 36.67 mg/m2 after 3, 5, and 7 dry days, respectively, reflecting continuous inputs from atmospheric deposition and gravitational settling during dry periods.
Figure 2.
Characteristics of surface sediments during drought periods. (a) Accumulated pollutant load per unit area over 1–7 days in rooftop sediments. (b) Average accumulated pollutant load per unit area over 1–7 days in surface sediments. (c) Mass fraction of sediment particle size and contribution to carried pollutant load.
Marked differences in sediment loads were observed across surface types. Street sediments exhibited considerably lower TIN, COD, SS, and TP loads of 0.11–0.38, 2.50–9.03, 57.23–513.53, and 0.06–0.39 mg/m2, respectively, whereas rooftop sediments exhibited substantially higher ranges of 0.32–0.74, 7.36–36.67, 608.69–1288.00, and 0.22–0.25 mg/m2. The detailed data are provided in Supplementary Materials (Table S3). This pronounced “rooftop dust > street dust” gradient (Figure 2b) is mainly attributed to the low-disturbance conditions on rooftops, which facilitate long-term particle accumulation. In contrast, vehicular movement and routine street sweeping reduce sediment retention on road surfaces. Functionally, residential areas consistently exhibited higher sediment loads than transportation zones, implying less favorable dispersion and deposition environments within densely populated neighborhoods.
Particle size distribution further governed sediment mobility and pollutant-carrying capacity [14]. Sieving results showed that rooftop sediments were dominated by fine particles (<100 μm), accounting for 46.5% of total mass; combined fine and medium-fine fractions (100–150 μm) contributed 71.7% (Figure 2c), consistent with observations by Miguntanna et al. [40]. In transportation areas, coarse (>300 μm) and fine (<100 μm) fractions were similarly abundant (31.7% and 30.6%), whereas residential street dust was characterized by medium-coarse and coarse particles (150–300 μm), which together contributed more than 65%. These differences reflect distinct disturbance conditions, with vehicular activity redistributing coarse particles on roads and residential areas accumulating mid-sized particles due to lower turbulence and weaker surface cleaning.
The linkage between particle size and pollutant contribution was further visualized using a heatmap (Figure 2c). For rooftop sediments, particles smaller than 150 μm accounted for over 73% of all pollutant loads and peaked at 82.2%, underscoring the central role of fine particles as pollutant carriers due to their high specific surface area and abundant reactive sites [41]. Conversely, in transportation areas, fine particles contributed much less to SS, and in residential street dust, pollutant loads were concentrated in medium and coarse fractions. These patterns emphasize that surface function and disturbance intensity jointly shape the pollutant-bearing characteristics of urban sediments.
3.2. Rainfall–Runoff and Pollutant Response Characteristics
Surface runoff is the primary vector transporting urban surface sediments [42] and directly trigger CSO pollutant release. Its water quality dynamics reflect both sediment wash-off responses and the integrated influence of rainfall characteristics and underlying surface conditions [43]. In this study, three natural rainfall events (B, C, and D) were examined to characterize runoff pollution behaviors in residential and transportation zones and on different surface types (rooftop, street); Rainfall Event A was excluded because surface runoff samples could not be collected due to a temporary adjustment in field personnel scheduling.
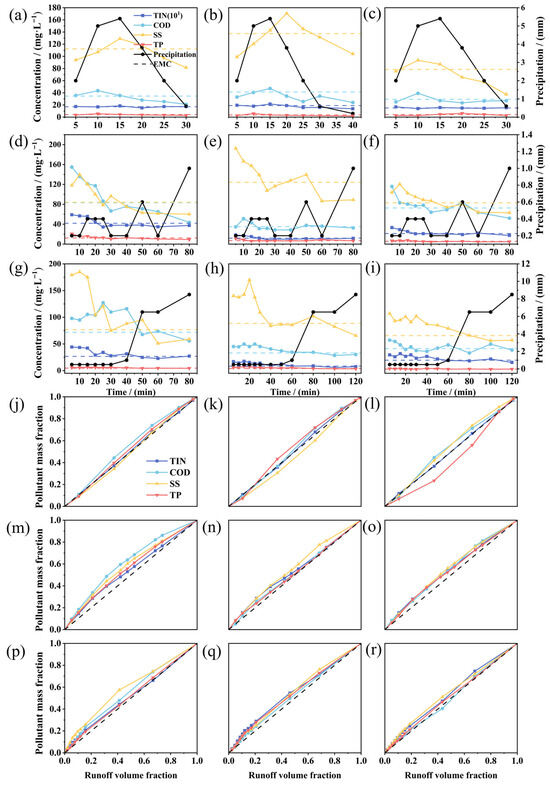
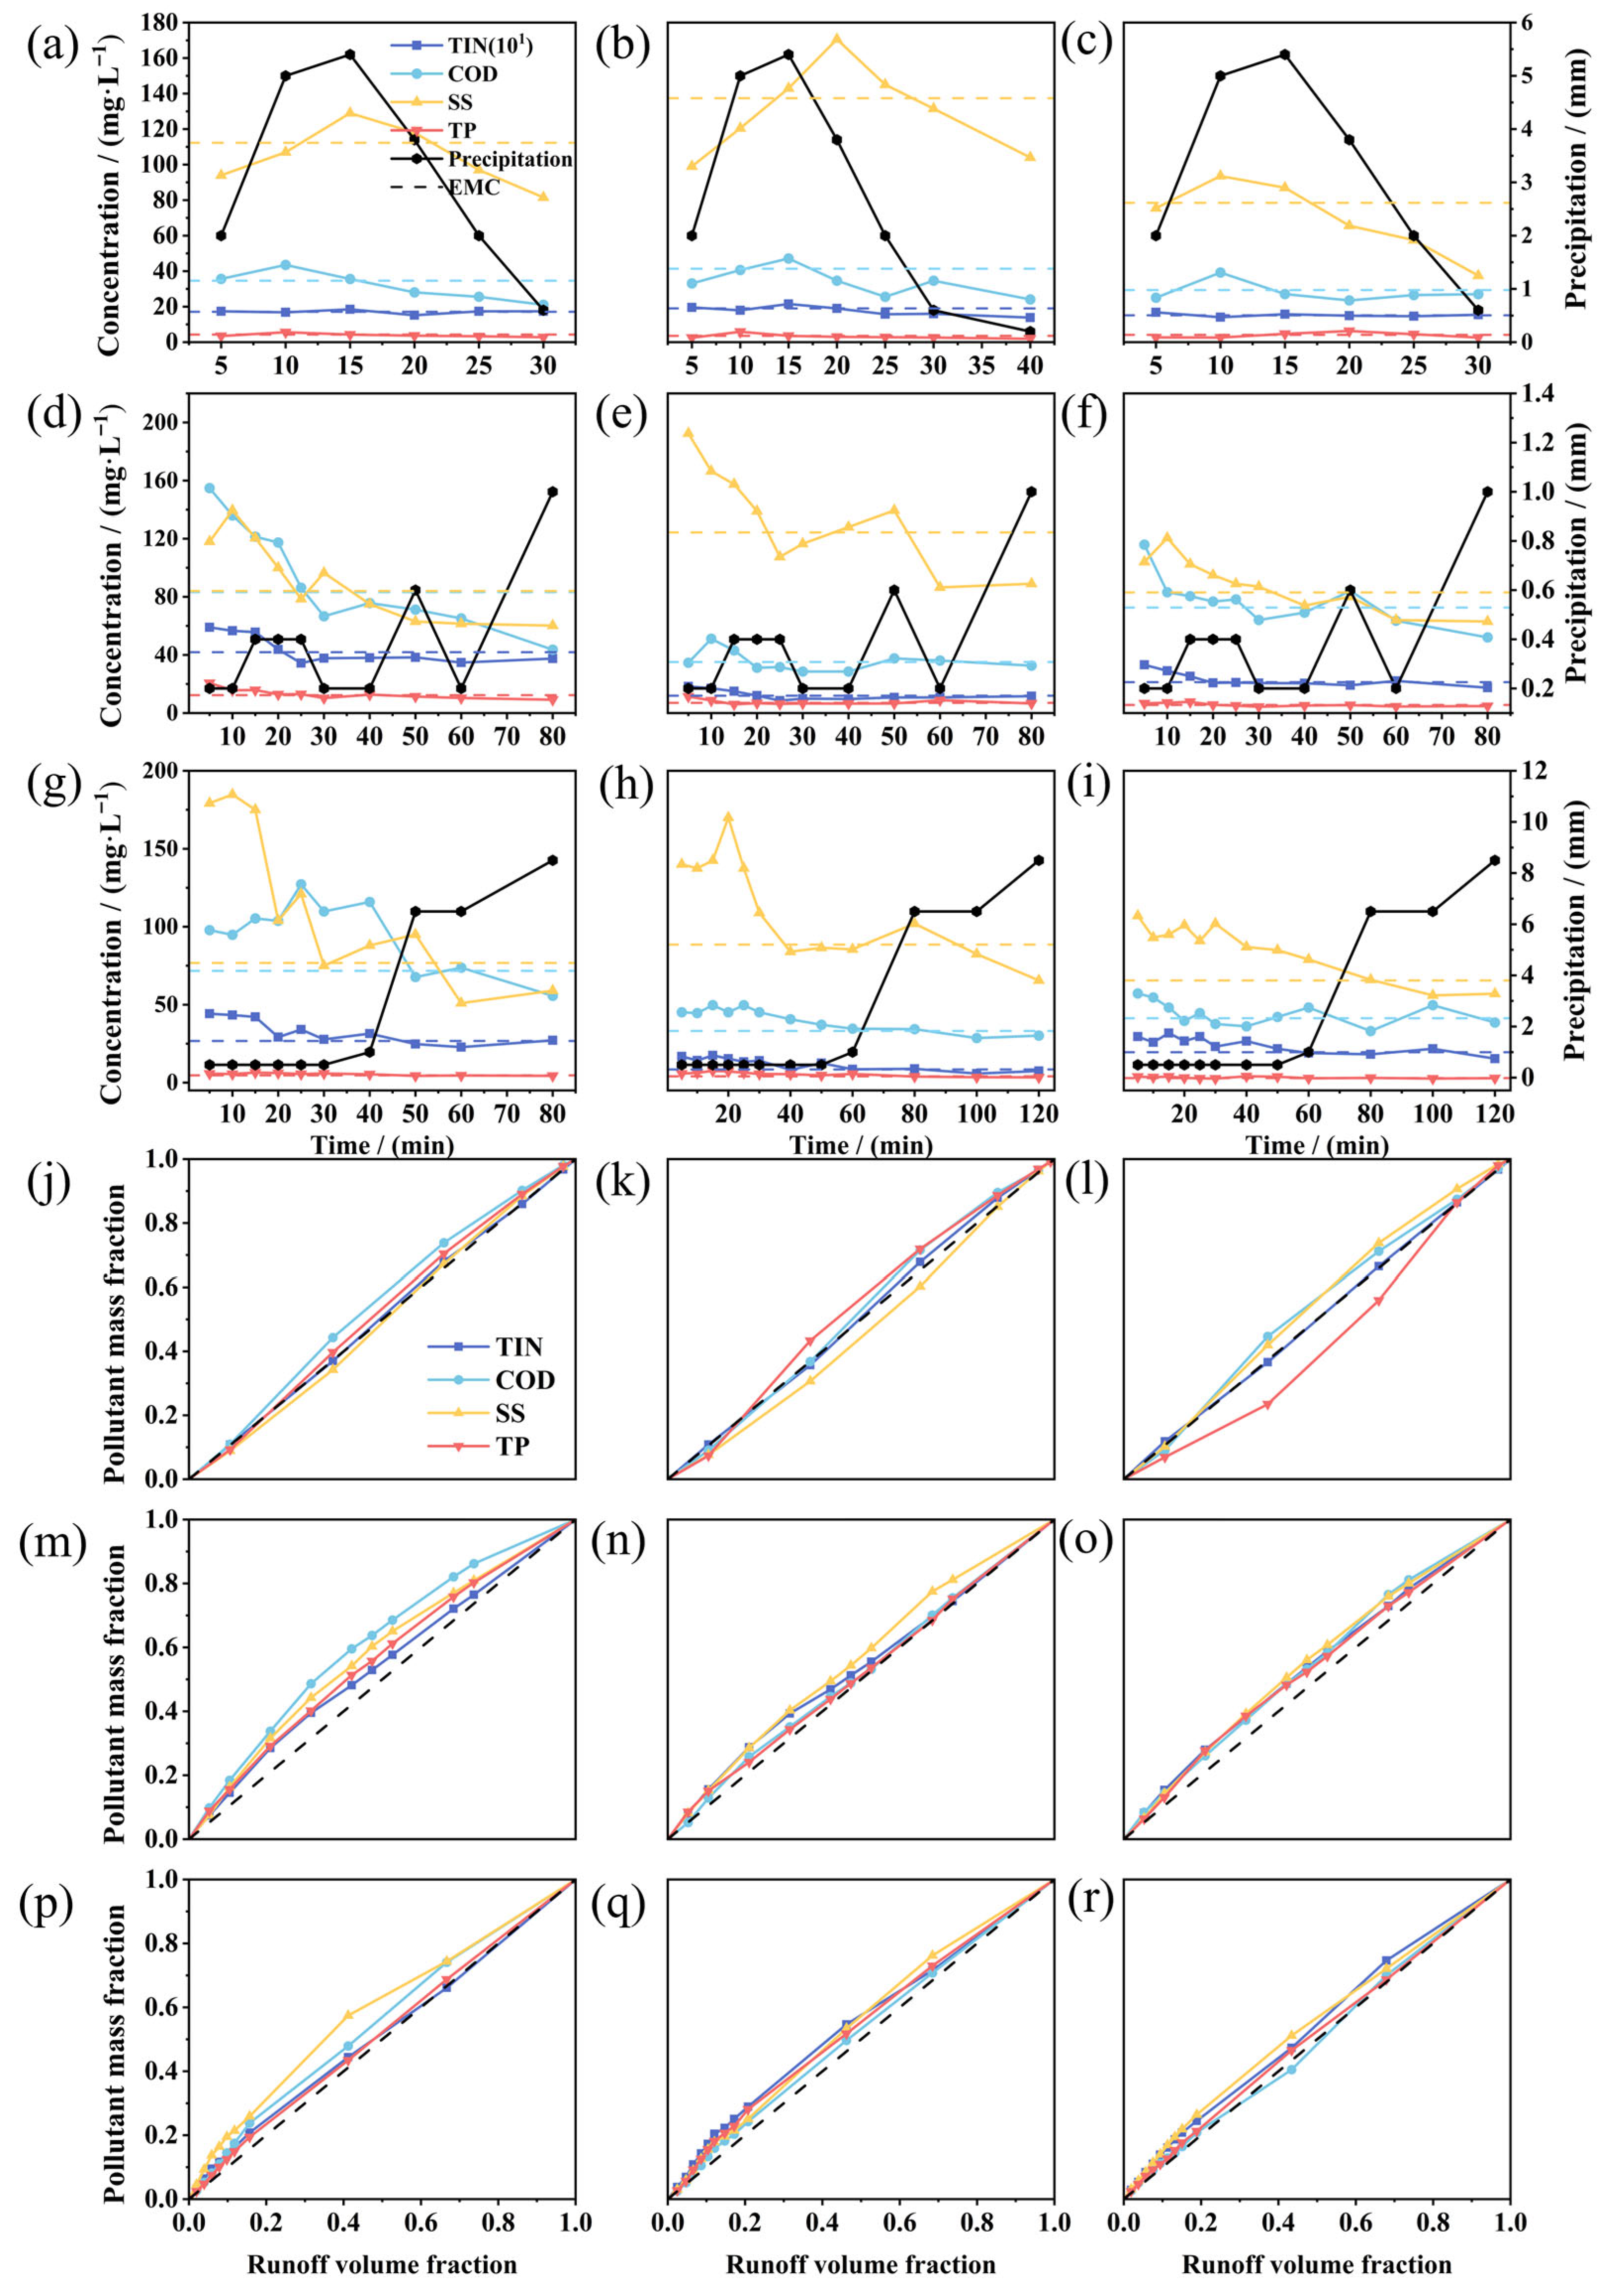
For Event B (moderate rainfall, duration 0.5 h, ADP 4 days), pollutant concentrations across all surfaces peaked within 20 min of rainfall onset, aligning with the peak rainfall intensity and subsequently declining due to dilution (Figure 3a–c). Pollution was most severe on the transportation street (Figure 3b), where EMC values for all pollutants exceeded 1.2 times the Class IV surface-water standard (GB 3838-2002) [44]. SS reached an EMC of 137.40 mg/L (peak 170.50 mg/L), 4.5 times the secondary effluent standard (GB 18918-2002) [45]. Residential area rooftop runoff exhibited milder pollution (Figure 3c), with SS decreasing from 93.60 mg/L to 37.50 mg/L as rainfall progressed.
Figure 3.
Time-varying pollutant concentrations and M(V) curves during rainfall events. Each row corresponds from left to right to residential street, transportation street, and residential rooftops: (a–c) for Rainfall Event B, (j–l) for the corresponding M(V) curve; (d–f) correspond to Rainfall Event C, (m–o) represent the corresponding M(V) curves; (g–i) correspond to Event D, (p–r) represent the corresponding M(V) curves. In panels (a–i), the colored dashed lines indicate the EMC of different pollutants. In the M(V) curves of panels (j–r), the black dashed lines serve as auxiliary reference lines to aid visualization of the curve trends and do not correspond to actual measured data.
Event C (light but long-duration rainfall; ADP 14 days), displayed pronounced first-flush characteristics (Figure 3d–f). Concentration peaks occurred within 10 min after rainfall onset, well before the rainfall intensity peak, signaling rapid wash-off of accumulated pollutants. Residential street runoff exhibited the highest pollution, with TIN, COD, and TP concentrations of 3.44–5.90 mg/L, 43.64–154.80 mg/L, and 0.92–2.07 mg/L. Their EMCs (4.19, 83.16, and 1.23 mg/L) were 2.8, 2.8, and 4.1 times the Class IV standard (GB 3838-2002) [44].
Event D (heavy rainfall, ADP 1 day) also showed early concentration peaks within 20 min (Figure 3g–i), followed by sharp declines driven by intense dilution. On the residential street, TIN and SS fluctuated between 2.28–4.42 mg/L and 51.00–184.50 mg/L. Despite the short ADP, EMC exceeded Class IV standard (GB 3838-2002) [44], likely due to re-deposition from preceding rainfall events and insufficient early-event dilution.
The M(V) curves for Event B (Figure 3j–l) were flat, indicating the absence of a strong first-flush effect due to limited antecedent accumulation and sustained dilution. The steep initial slopes of M(V) curves for Event C residential street (>45°, Figure 3m) highlight substantial sediment accumulation during the prolonged dry period and limited early-event dilution. This trend was also reflected in the between-event comparison, where the COD EMC of the residential street was 2.4 times that of Event B. The transportation street (except COD) and residential rooftops also displayed marked first-flush behavior (Figure 3n,o). For Event D (Figure 3p–r), a clear SS first-flush occurred on the residential street, whereas rooftops did not show a strong surge.
Overall, the average EMC values for runoff pollution across all three events exceeded the Class IV standard (GB 3838-2002) [44] but remained lower than values reported in many Chinese cities [46,47,48]. The detailed EMC data are provided in the Supplementary Materials (Table S4). Pollution dynamics were shaped by the interplay antecedent dry duration, rainfall characteristics, and functional zone attributes. Event B exhibited the lowest concentrations due to limited antecedent accumulation and strong dilution; Event C showed the highest due to long dry periods build-up and weak early-event dilution; Event D, despite a short dry period, still showed elevated pollution attributable to residual pollutant re-deposition and inadequate early dilution. First-flush effects followed C > D > B, patterns observed by Yan et al. [49]. Spatially, pollution severity ranked residential street > transportation street > residential rooftop. Higher TIN and COD levels in the residential street suggest stronger domestic-source contributions, whereas transportation streets were dominated by SS, underscoring the roles of vehicular wear particles and street dust [50]. Despite high dry-period accumulation on rooftops, runoff pollution remained modest due to low wash-off efficiency and strong dilution [51].
3.3. Flushing Characteristics of Sewer Sediment
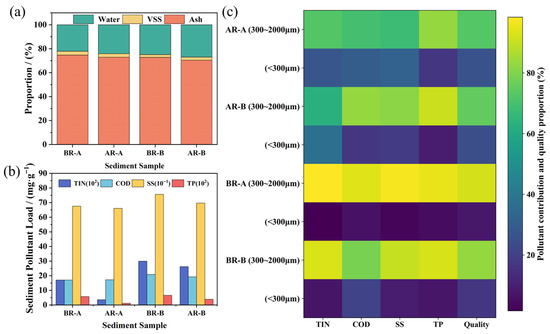
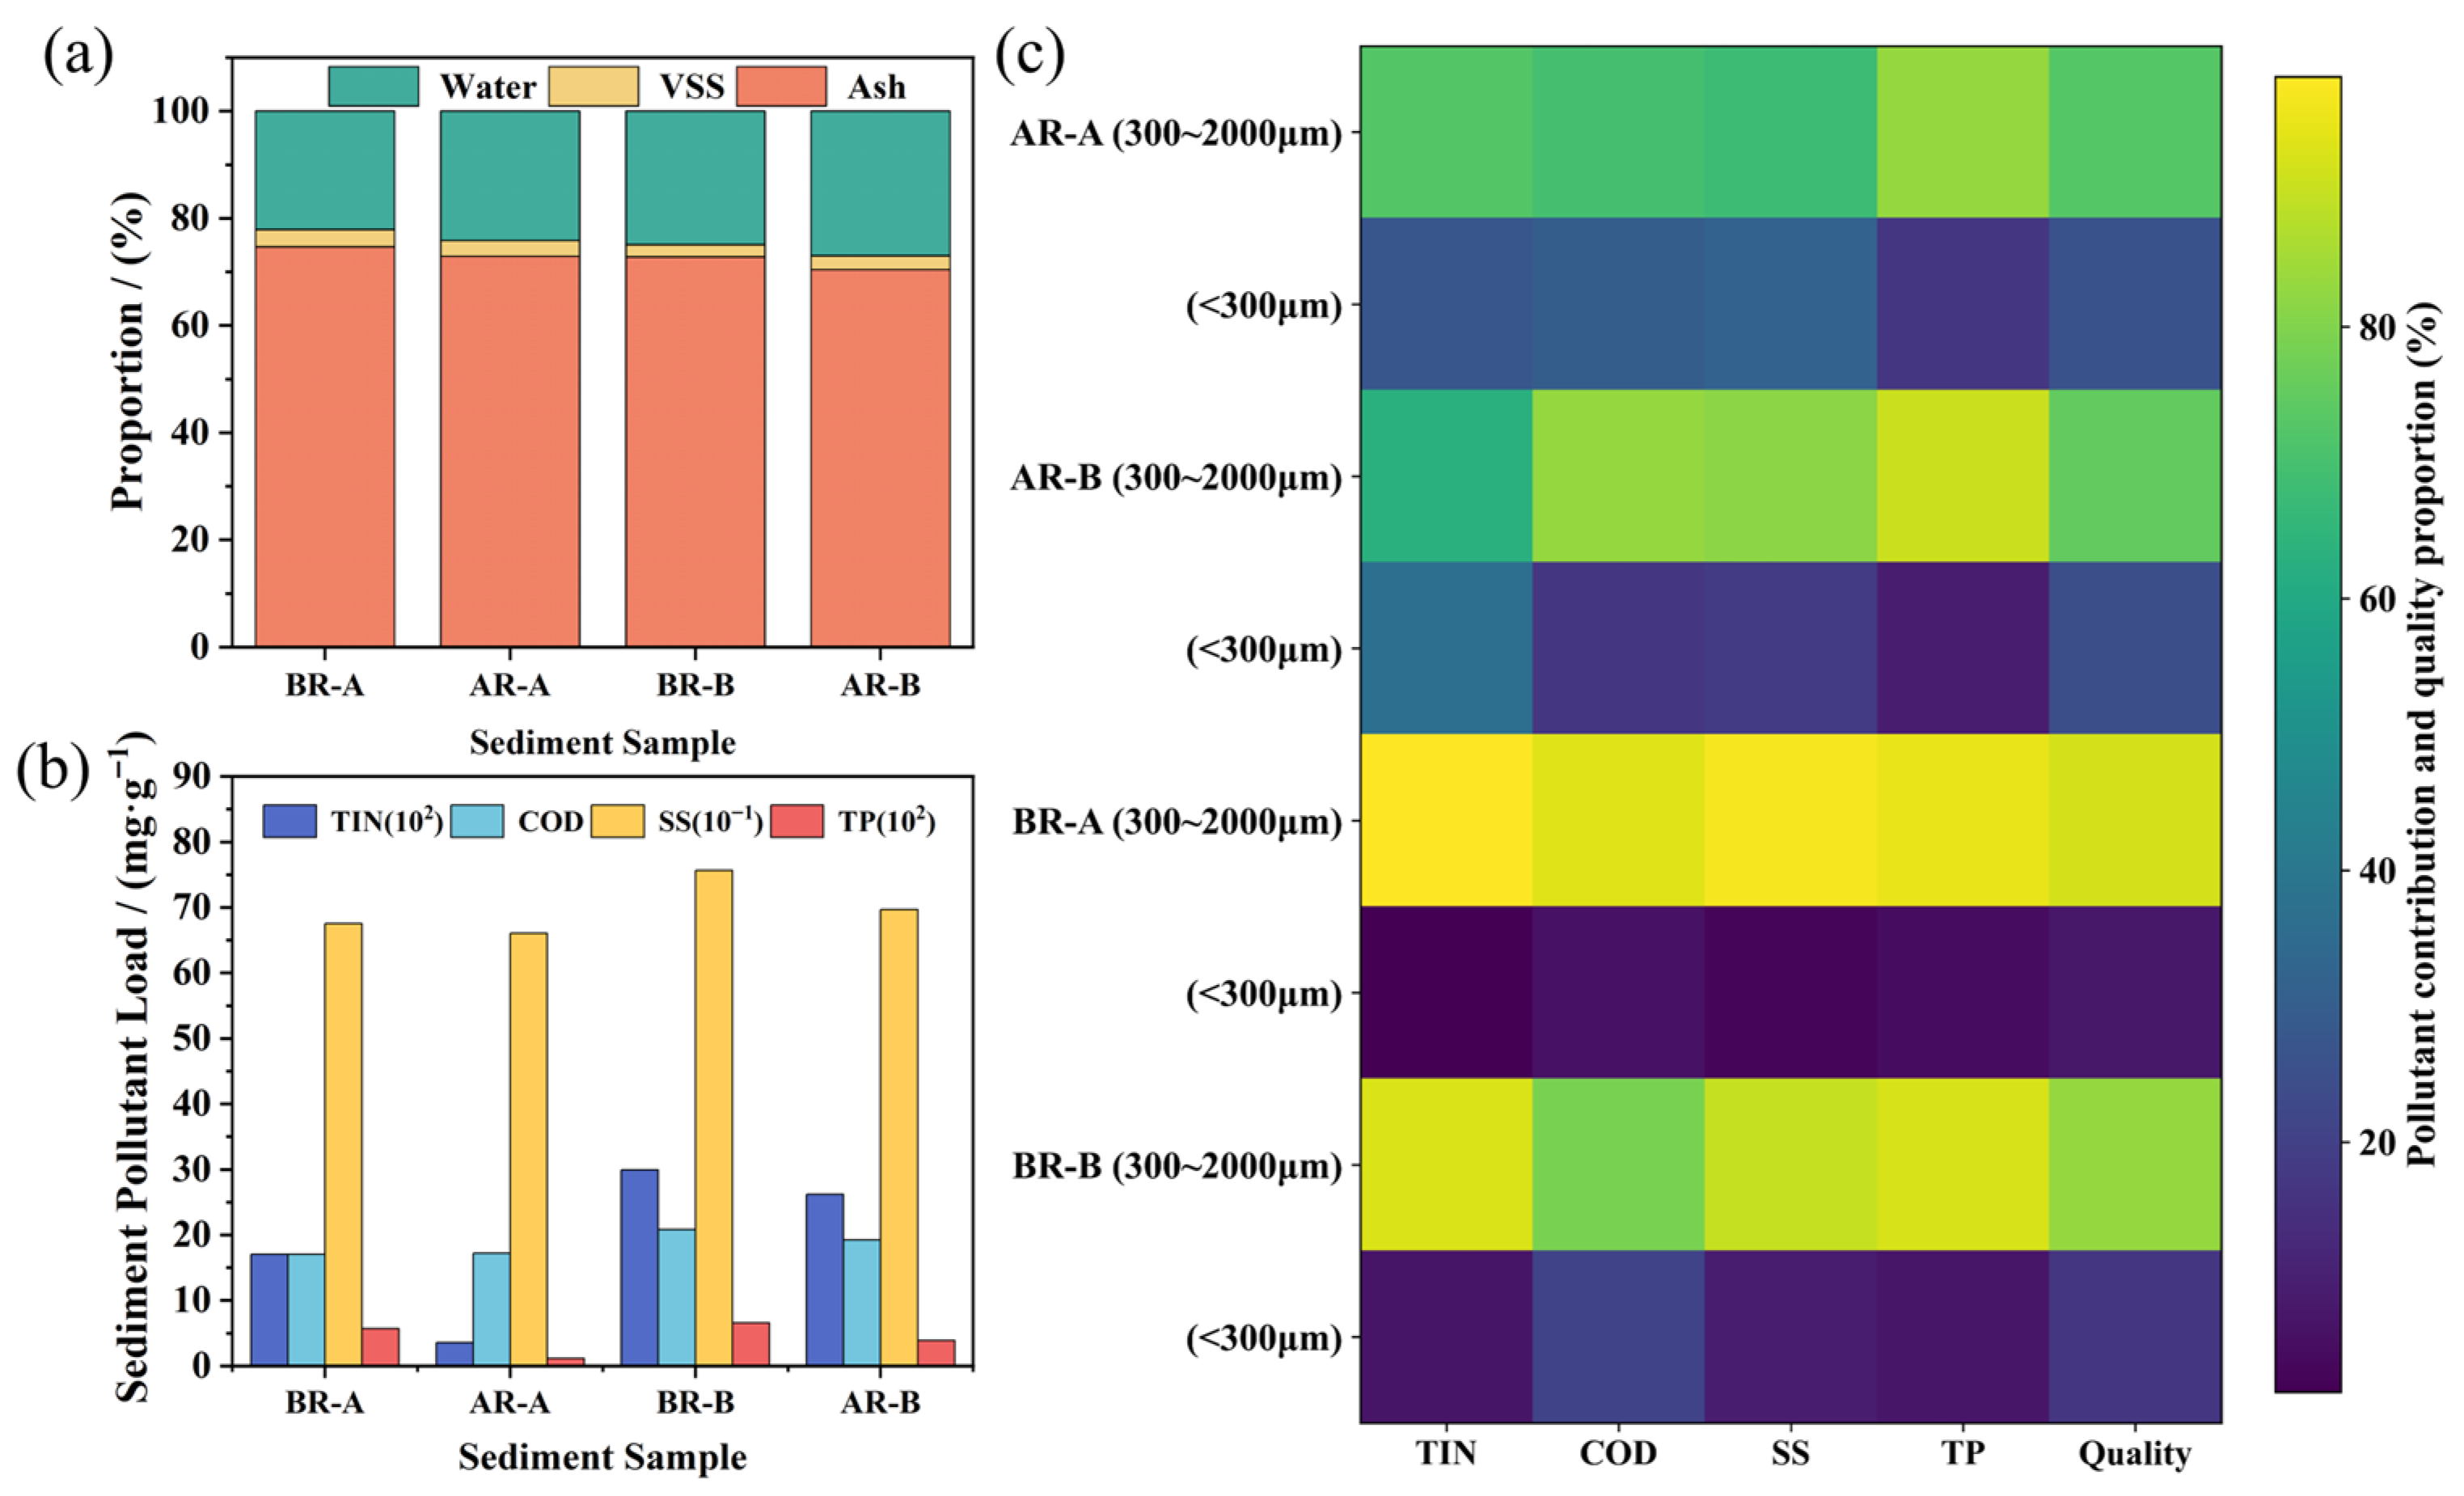
Combined sewer sediments represent a key latent pollution reservoir within CSO systems, and their resuspension during rainfall events can substantially enhance pollutant export to receiving waters. A comprehensive characterization of sewer sediments was conducted (Figure 4), elucidating their physical attributes, pollutant load distribution, and rainfall-induced disturbance mechanisms.
Figure 4.
Characteristics of sewer sediment: (a) sediment composition; (b) concentrations of various pollutants; (c) mass fraction distribution by particle size and pollutant load contribution.
The compositional properties of the sediments are shown in Figure 4a. Ash and vs. accounted for 70.41–74.70% and 2.28–3.20%, respectively, indicating that inorganic particles (sand- and gravel-sized fractions) dominate the solid phase, whereas organic components are mainly retained in the moisture phase. Sediment moisture content ranged from 22.10% to 26.99%, consistent with Yu et al. [24]. Rainfall primarily altered the water content: following hydraulic scouring, soaking, or resuspension, moisture increased by approximately 2%, whereas vs. content remained nearly unchanged, suggesting that short-term rainfall events exert limited disturbance on the bulk volatile organic fraction.
Pollutant loads before and after rainfall are shown in Figure 4b and in the Supplementary Materials (Table S5). During dry periods, average TIN, COD, SS, and TP loads were 0.23, 18.92, 715.90, and 0.06 mg/g, respectively. Rainfall-driven runoff inflow and scouring removed surface-adsorbed contaminants, reducing these values to 0.15, 18.20, 678.68, and 0.02 mg/g. The disturbance effect was most pronounced under intense rainfall (Event A), where TIN and TP decreased from 0.17 and 0.06 mg/g to 0.04 and 0.01 mg/g. In contrast, reductions under moderate rainfall (Event B) were marginal, indicating a strong positive relationship between hydraulic shear intensity and pollutant detachment.
The heatmap in Figure 4c further highlights particle size distribution and pollutant contributions. Under both dry periods and post-rainfall static conditions, coarse particles (300–2000 μm) overwhelmingly dominate, accounting for 77.62–94.73% of the total mass. This reflects the strong settling stability of coarse fractions within sewer conduits. Intense rainfall increased the proportion of fine particles (<300 μm) from 7.89% to 17.27%, driven by the fragmentation of larger aggregates and detachment of fine materials from pipe walls. These patterns demonstrate that high-energy hydrodynamic conditions enhance the mobility and downstream transport potential of fine particle fractions. Coarse particles consistently served as the primary carriers of pollutant loads across all scenarios, confirming their role as the major long-term pollution source within sewer sediments, underscoring their importance in desilting and sewer maintenance strategies. Following rainfall, the contribution of fine particles increased. Under intense rainfall (Event A), fine particles contributed 36.85% of TIN, whereas moderate rainfall (Event B) increased the COD contribution to 20.88%. These findings corroborate that stronger hydrodynamic forces favor the transport of fine, pollutant-rich particles and explain the elevated fine-fraction contaminants frequently observed in CSO discharges.
3.4. Rainfall-Overflow Response Characteristics
CSO water quality is governed by the competing influences of pollutant wash-off and rainfall dilution. Stormwater inflow enhances in-sewer hydraulics energy, resuspending sediments and mobilizing surface-derived pollutants, while simultaneously diluting in-sewer concentrations through the intrusion of relatively clean rainfall. The dynamic balance between these processes determines both the magnitude and temporal evolution of overflow pollution.
3.4.1. Dynamics of Water Quality During Overflow Events
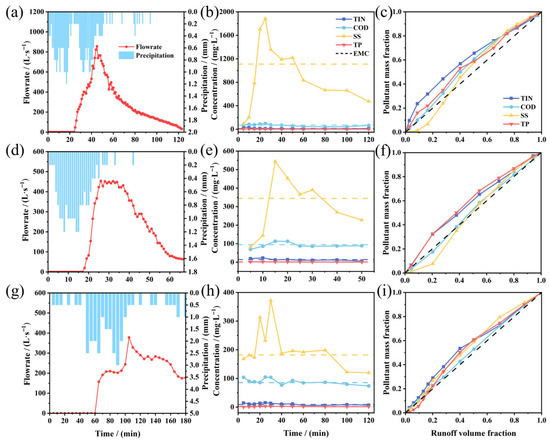
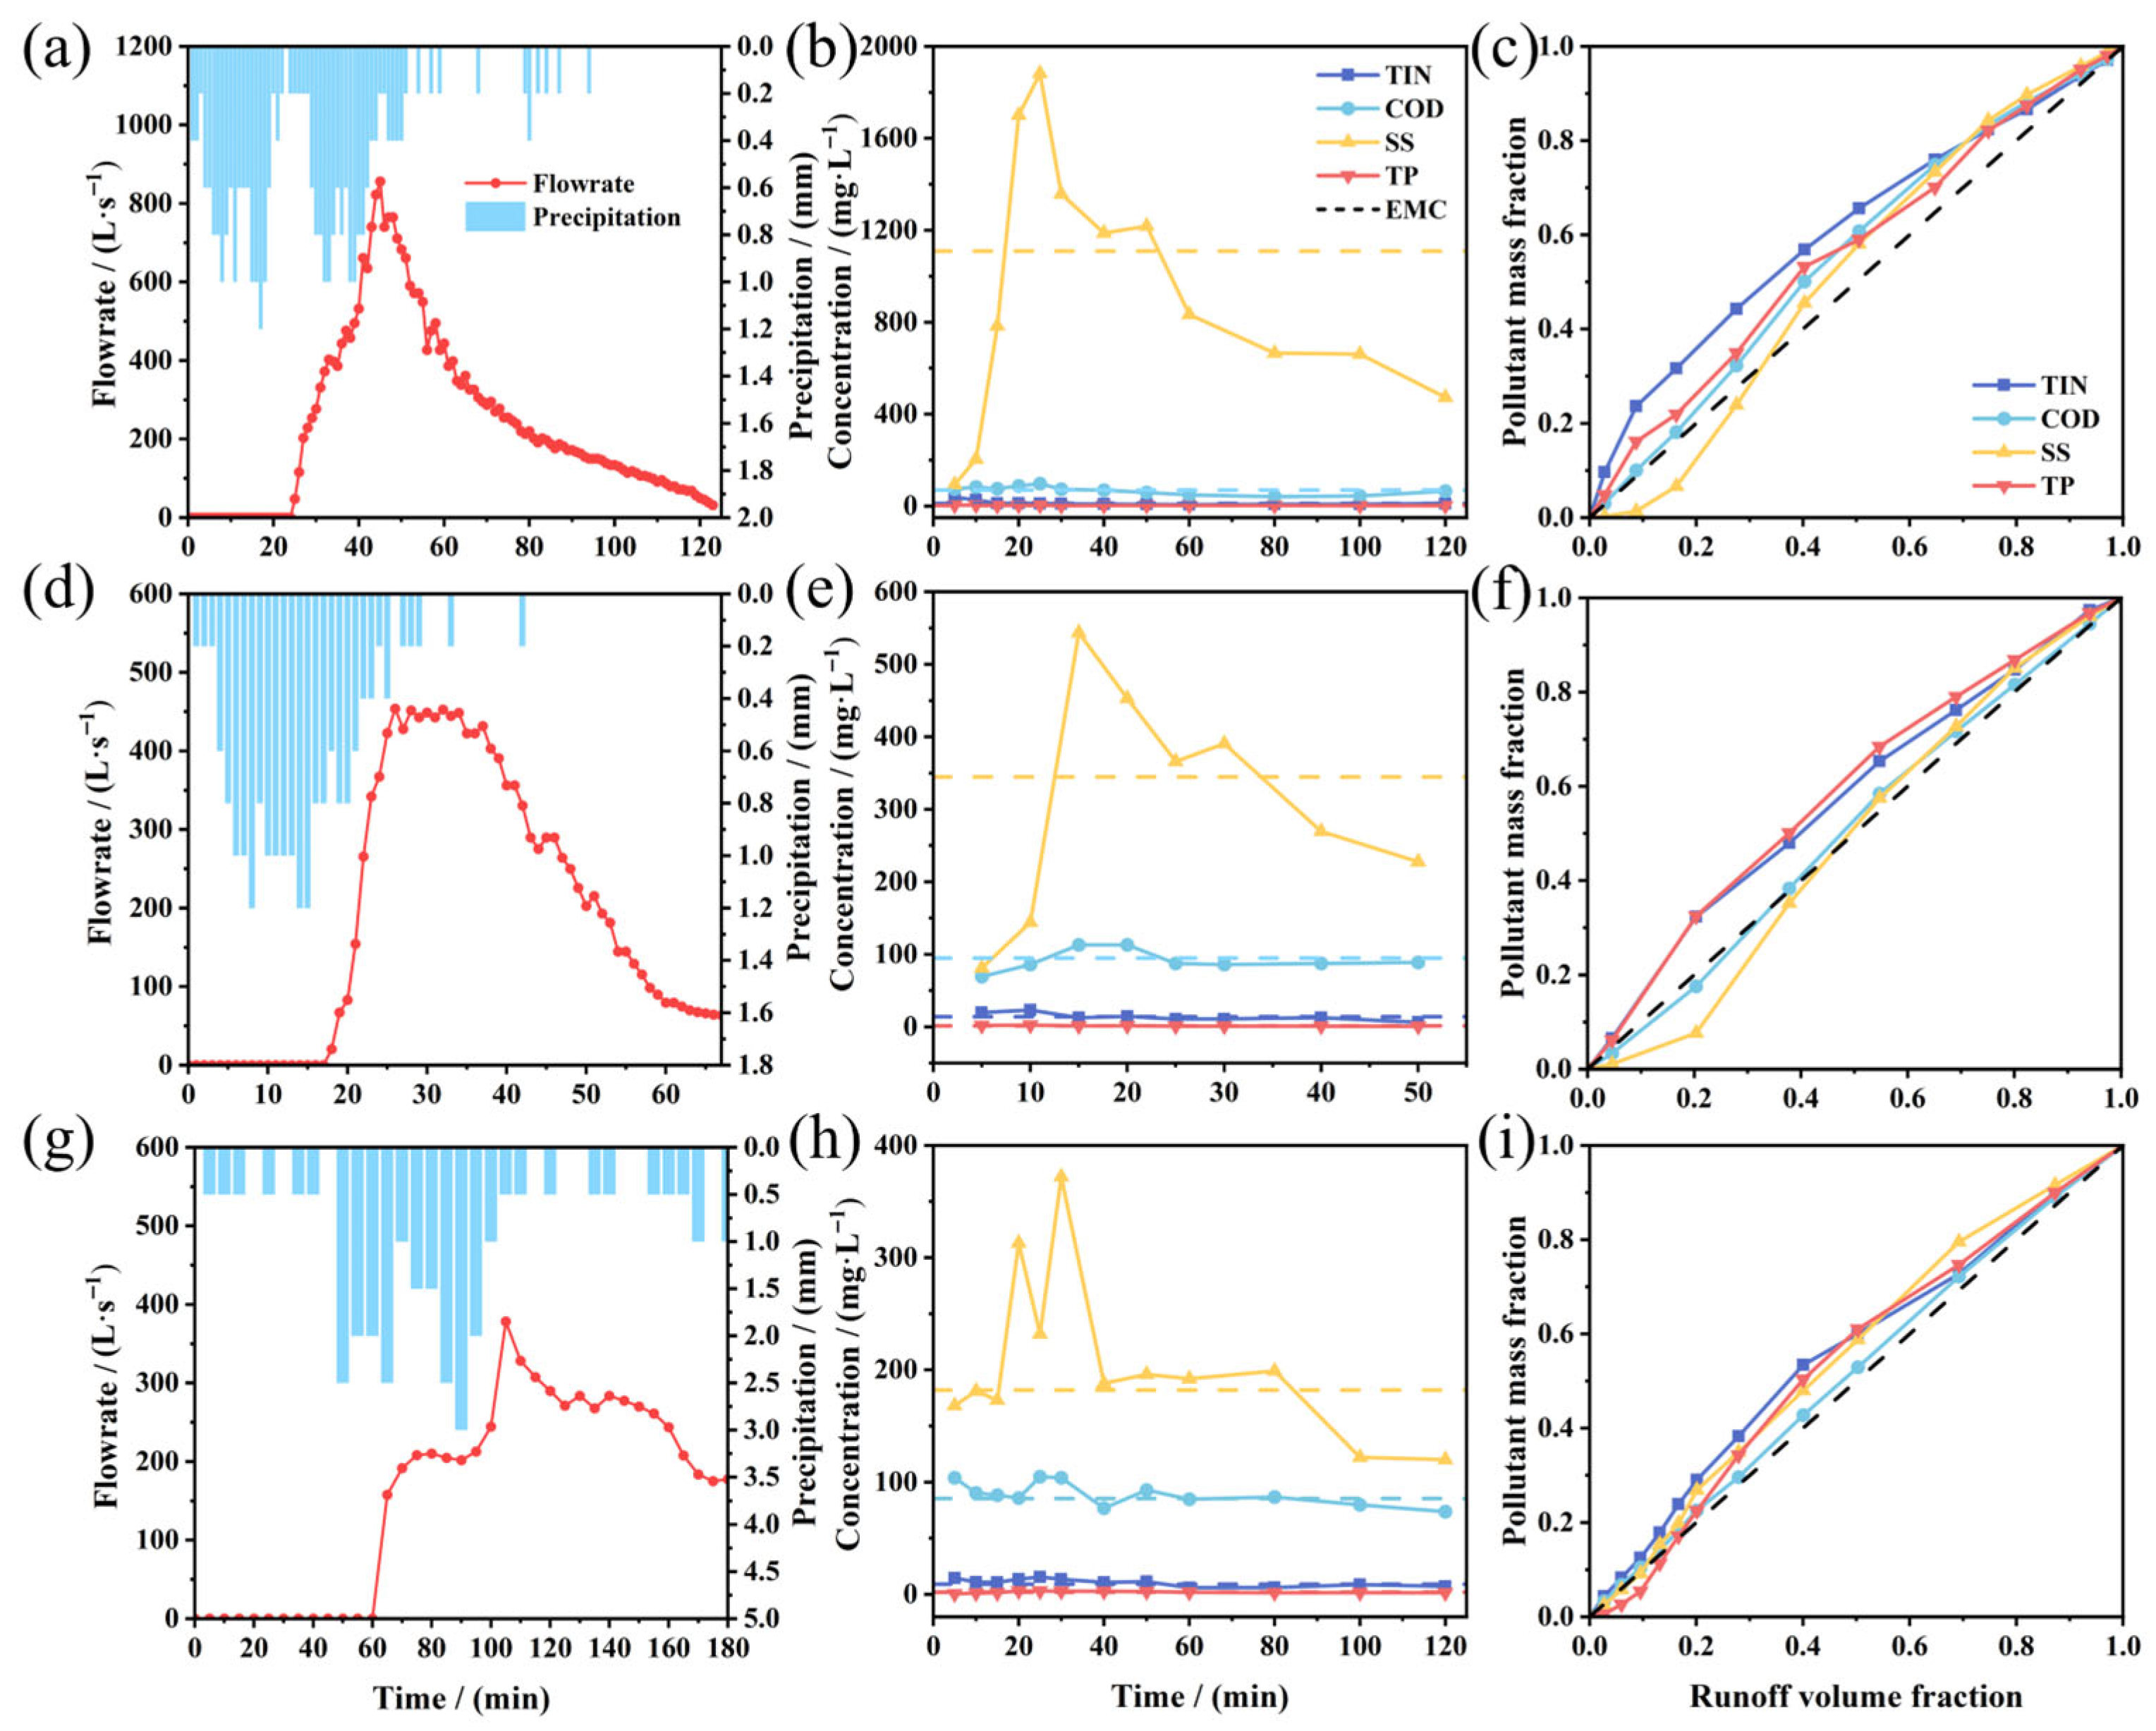
For Event A (Figure 5a,b), overflow water quality displayed a typical progression from wash-off dominance to dilution control. SS concentrations rose sharply with the hydrograph, reaching an instantaneous peak of 1882 mg/L at 25 min, reflecting the combined influence of initial surface runoff and subsequent intense hydraulic scouring that mobilized large quantities of sewer sediments. In contrast, TIN and TP peaked rapidly within the first 5–10 min (38.02 and 4.01 mg/L), followed by a steady decrease due to rainfall dilution. COD varied more gradually (40.63–97.40 mg/L), exhibiting a broadened peak attributable to the simultaneous effects of wash-off and dilution. Wash-off analysis (Figure 5c, Table 2) showed initial M(V) slopes > 45° MFF30 > 1 for TIN, COD, and TP, indicating moderate first-flush behavior. Although SS exhibited MFF30 < 1, its IF30–60 > 1 indicated a mid-flush effect. The initial flushing intensity followed TIN > TP > COD > SS, consistent with the more rapid transport of dissolved N and P relative to particulate solids.
Figure 5.
Overflow pollution characteristics: each row corresponds from left to right to rainfall and drainage hydrographs, pollutant dynamic concentrations, and M(V) curves. (a–c), (d–f), and (g–i) correspond to Events A, B, and D, respectively. In panels (b,e,h), the colored dashed lines indicate the EMC of different pollutants. In the M(V) curves of panels (c,f,i), the black dashed lines serve as auxiliary reference lines to aid visualization of the curve trends and do not correspond to actual measured data.
Table 2.
MFF30 and IF30–60 value for CSO events.
Event B (Figure 5d,e) showed a comparable sequence but with notably lower pollutant peaks due to antecedent scouring during Event A. Peak concentrations of SS, TIN, and TP (543, 23.01, and 2.24 mg/L) decreased by 71%, 40%, and 44%, respectively, indicating substantial depletion of readily mobilizable pollutants. Wash-off characteristics (Figure 5f, Table 2) revealed that TIN and TP maintained first-flush signatures (M(V) > 45° and MFF30 > 1), whereas COD and SS transitioned toward mid-flush behavior (IF30–60 > 1 but MFF30 < 1). The relative first-flush strength ranked TP > TIN > COD > SS.
Event D (Figure 5g,h) was influenced by low early rainfall intensity and the preceding 84 mm storm, which had already disturbed much of the sewer sediment stock. Consequently, pollutants peaks were the lowest among the three events (e.g., TIN:15.46 mg/L, SS: 372 mg/L). The concentration increased during the first 30 min but declined thereafter, reflecting a dilution-dominant regime. Together with Events B and D, these patterns highlight that the temporal dynamics of in-system pollutant storage exert a critical control on subsequent CSO pollution strength. Wash-off analysis (Figure 5i, Table 2) indicated that TIN retained a moderate first flush (M(V) > 45° and MFF30 > 1). COD showed no evidence of either first- or mid-flush characteristics. Although the initial slopes for SS and TP were <45°, both exhibited MFF30 > 1, indicating early mass-release behavior despite initially low concentration gradients. As seen in Figure 5h, cumulative loads of SS and TP increased sharply when cumulative overflow volume reached 20–30%, producing early-event load enrichment likely driven by enhanced flow-induced sediment transport. The flushing intensity ranked TIN > SS > TP > COD.
3.4.2. Pollution-Driven Mechanisms of Overflow Events
Although all three rainfall events triggered CSO once cumulative rainfall reached approximately 14–15 mm, their hydrodynamic and water quality responses differed markedly. The onset of overflow lagged behind rainfall by ~20 min, 18 min, and 1 h for Events A, B, and D, respectively, reflecting variations in initial system storage and conveyance capacity. Overflow durations were 2 h, 1 h, and 2 h, and total overflow volume followed the order A (1804.59 m3) > D (1750.40 m3) > B (768.35 m3). Correspondingly, peak flow rates were 0.85, 0.45, and 0.38 m3/s, each exhibiting a delayed response relative to peak rainfall intensity, indicating the hydraulic inertia characteristic of combined sewer systems.
In terms of pollution levels, CSO water quality during the three events remained lower than values reported for major domestic and international cities [25,52], yet substantially exceeded Class IV surface-water standards. The detailed CSO water quality data are provided in the Supplementary Materials (Table S6). TIN exceeded the standard by more than five-fold, COD by over 1.3-fold, while SS (above the Grade II discharge standard) and TP surpassed the standard by more than five-fold and 3.5-fold, respectively. These results identify TIN, SS, and TP as the primary pollutants of concern in the study area.
The mechanisms driving pollutant release were collectively governed by ADP and sediment accumulation, rainfall characteristics, and residual pollution storage. Pearson correlation analysis (Figure S2 in the Supplementary Materials) revealed that ADP and sediment accumulation were the dominant controls on SS, exhibiting an extremely strong positive correlation (r = 0.94). This is consistent with the event-specific exceedance ratios (Event A > Event B > Event D: 35.97 > 10.49 > 5.07), demonstrating intensified particulate transport under longer dry conditions. Rainfall depth exhibited a strong positive correlation with TP (r = 0.97), indicating enhanced wash-off of particulate phosphorus during larger rainfall events. Rainfall intensity was the primary determinant of TIN release (r = 0.995), reflecting a pronounced first-flush response whereby high-intensity rainfall rapidly mobilized nitrogenous pollutants. Event B, with the highest rainfall intensity, presented the greatest TIN EMC—1.5 times that of Event C, which had the lowest intensity—demonstrating that strong hydraulic scouring accelerates nitrogen detachment from surface and in-sewer sources. Despite Event D occurring only one day after a major rainfall event, TIN and TP concentrations remained elevated, suggesting that residual pollutants in sewer sediments and surface sediments can induce secondary pollution. This underscores the need for timely post-storm street sweeping and sewer desilting to mitigate carry-over contamination.
Overall, CSO pollution dynamics were shaped by the coupled influences of ADP, sediment accumulation, rainfall depth and intensity, and residual pollutant storage. ADP predominantly governed SS loads, rainfall depth enhanced phosphorus wash-off, rainfall intensity governed nitrogen first-flush efficiency, and secondary pollution effects further shaped pollutant levels. These insights offer scientific guidance for targeted CSO pollution control and event-based urban drainage management.
3.5. Source Apportionment of Overflow Pollutant Loads
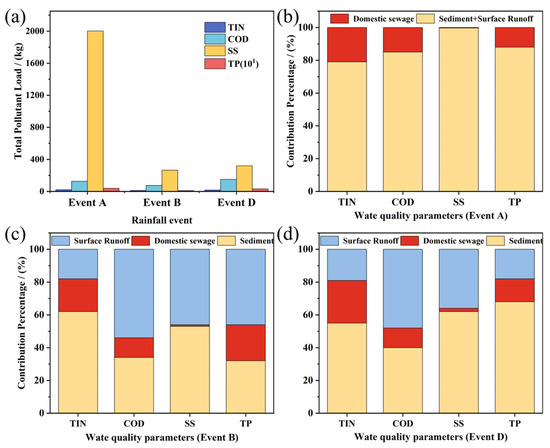
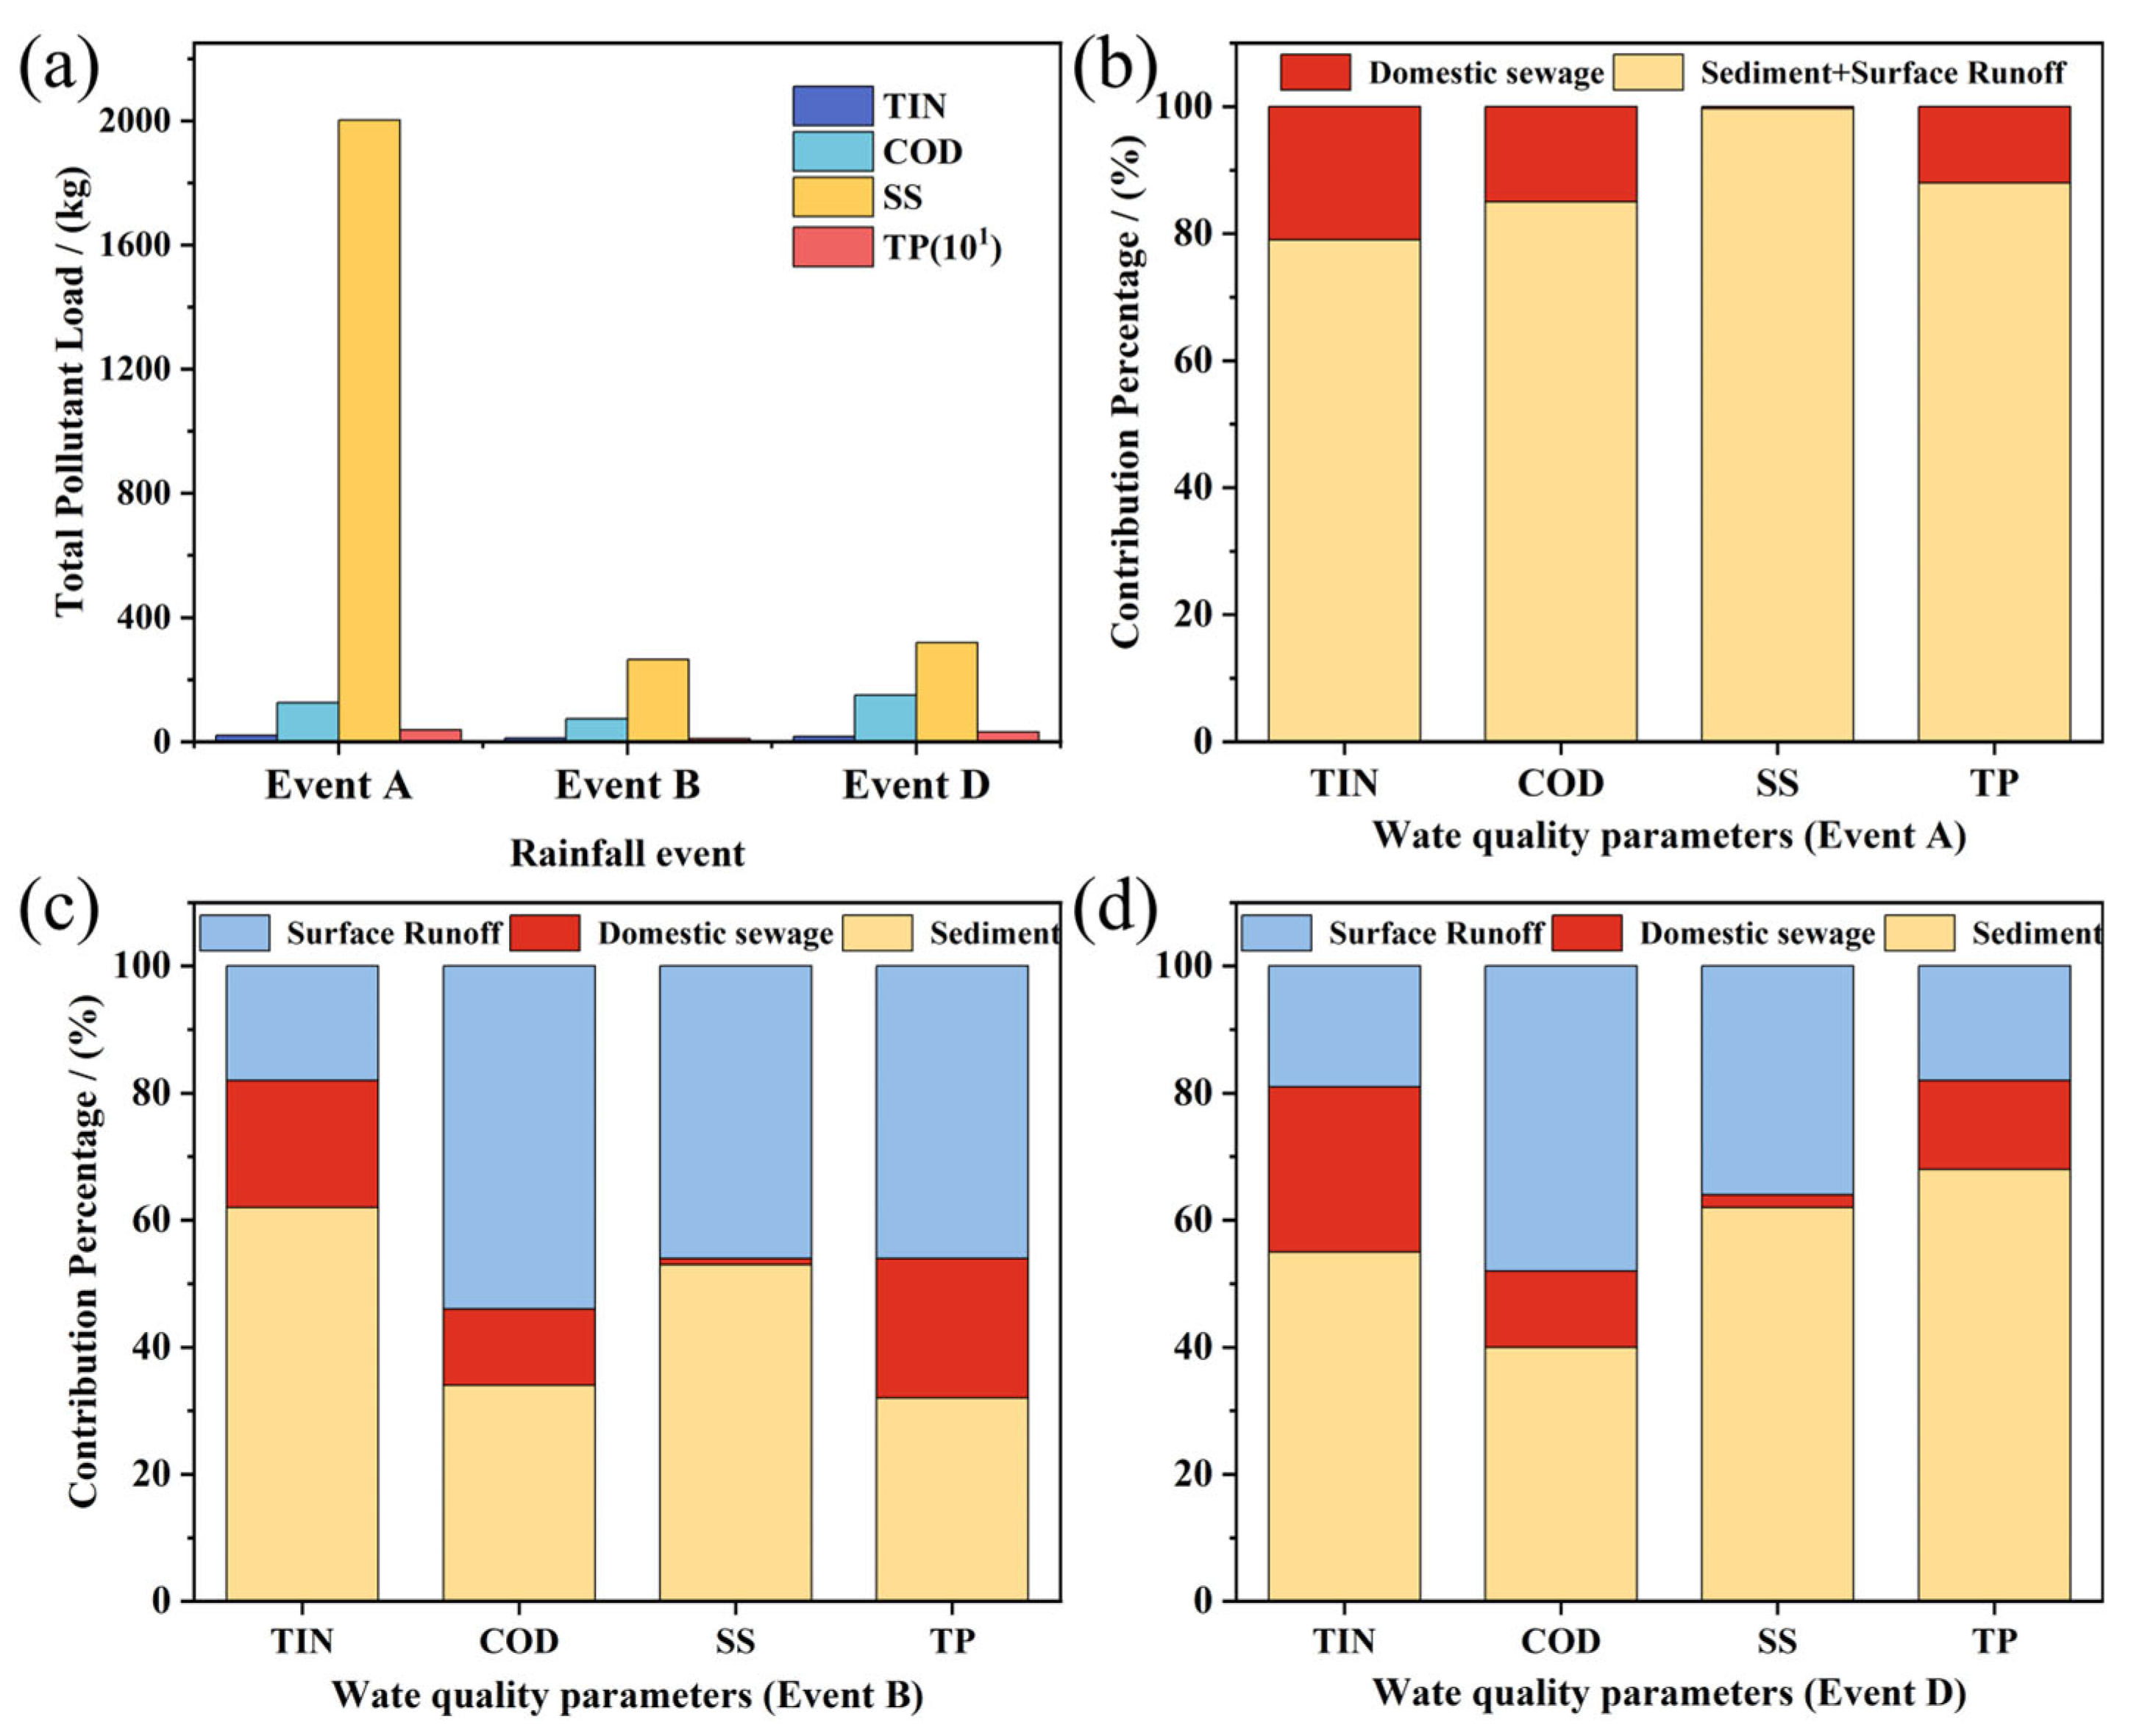
Rainfall characteristics directly shape CSO pollution loads through the sequential process of accumulation–transport–discharge. As shown in Figure 6a, Event A generated the largest pollutant loads due to its long ADP (ADP > 14 days without sewer-flushing rainfall), the greatest rainfall depth, and the highest overflow volume. Total pollutant loads followed the order Event A > Event D > Event B, confirming the fundamental mechanism that CSO loads arise from the combined effects of sediment accumulation, rainfall-driven wash-off, and overflow discharge.
Figure 6.
Overflow pollutant load and contribution: (a) pollutant load discharged during different rainfall events; (b–d) percentage contribution of pollution sources for Events A, B, and D, respectively.
Source apportionment results (Figure 6b–d) revealed pronounced differences among the three major pollution sources—surface runoff, domestic sewage, and sewer sediments—and demonstrated strong pollutant-specific dependencies. The detailed domestic sewage data are provided in the Supplementary Materials (Table S7) [53,54]. A comparison with previous studies worldwide is provided in the Supplementary Materials (Table S8) [25,26,28,38,55,56,57,58,59].
In this study, domestic sewage contributed relatively stable shares across pollutants, with the highest contribution to TIN (20–26%), followed by TP (12–22%), and limited contributions to SS (2%) and COD (12–15%). Overall, domestic sewage acted as a secondary pollution source with relatively low load contributions. Previous studies have also reported similar patterns: in Milwaukee [58], domestic sewage accounted for approximately 9% of total suspended solids (TSS), while in Shanghai, China [59], the average contribution of multiple pollutants from domestic sewage was 12.2%.
Surface runoff exhibited more variable effects across pollutant groups. It accounted for the highest proportion of COD (48–54%), moderate and stable contributions to TIN (18–19%), and a broader range for SS (36–46%) and TP (18–46%), reflecting the spatial heterogeneity of surface-deposition pathways. This variability reflects the pronounced spatial heterogeneity of surface pollutant deposition and wash-off pathways. In some urban catchments, surface runoff can dominate CSO pollution loads; for example, studies in Milwaukee [53] reported surface runoff contributions as high as 91% for TSS and 71% for TP, highlighting its critical role as a pollution source that requires focused management and control.
Sewer sediments consistently emerged as the dominant contributor among the three sources. Their contributions reached 53–62% for SS, 55–62% for TIN, 34–40% for COD, and 32–68% for TP. These results are consistent with findings from Nanning, China [25], where sewer sediments contributed more than 35% of the loads for all major pollutants. With increasing rainfall intensity, sewer flow velocity increases, enhancing sediment erosion and resuspension processes. These results reaffirm that sewer sediments act as a major pollution reservoir and a primary driver of CSO pollutant loads in the study area, emphasizing the urgent need for targeted management interventions.
3.6. Insights, Limitations, and Contributions
This study revealed the spatiotemporal evolution and dominant mechanisms governing pollutant dynamics during both dry and wet periods in the catchment, thereby clarifying the formation pathways and critical control points of CSO pollution. During dry periods, incomplete surface cleaning and prolonged absence of strong hydraulic flushing promote the persistent accumulation of pollutants on paved surfaces and within sewer sediments, forming a “stockpiling phase”. Once intense rainfall occurs, these accumulated sediments are rapidly mobilized by runoff scouring, producing pronounced first-flush overflow pollution peaks at overflow outlets.
Surface runoff pollution is jointly controlled by urban functional zoning, pollutant deposition pathways, and rainfall wash-off mechanisms. Because the dominant source contributions vary significantly across functional zones, spatially differentiated control strategies are required. During rainfall, pollutant transport exhibits strong event dependency: light rain should prioritize source reduction and initial-runoff interception (e.g., green roofs, permeable pavements, sunken green spaces and other sponge infrastructure). Moderate to heavy rain requires optimizing conveyance pathways and enhancing pre-event surface cleaning to limit peak loads and hydraulic stress. Post-storm sweeping and sewer desilting should also be implemented to prevent the re-accumulation of residual pollutants. Given the substantial contributions of sewer sediments in the study area, establishing regular desilting schedules and operational standards is crucial to reduce pollutant reservoirs and limit high-concentration pollution pulses.
From a broader perspective, China is transitioning from “engineering-led” CSO management toward “smart and resilient” systems. The source-apportionment insights generated in this study provide quantitative support for the operation and maintenance of drainage systems and can guide optimized deployment of sponge-city facilities. Looking forward, integrating smart drainage infrastructure, digital twin platforms, and machine learning approaches can enable dynamic prediction of CSO pollutant transport and facilitate adaptive operation of gates, pumps, and detention facilities. Coupling these with Life Cycle Assessment (LCA) methods enables the evaluation of energy use and carbon footprint across the CSO system’s “transport–reduction–discharge” life cycle, promoting environmentally and carbon-optimized drainage planning.
Despite the insights, the study has limitations. Monitoring constraints and a limited number of rainfall events prevented a range of rainfall intensities, durations, and ADP conditions from being captured. Future research should expand both the spatial and temporal coverage, integrating multi-source long-term monitoring with high-resolution hydrodynamic modeling across diverse scenarios. This would enhance the precision and generalizability of source-apportionment results and further elucidate the interactive mechanisms linking rainfall characteristics, surface features, and sewer hydraulics.
Overall, this study fills a critical knowledge gap in understanding combined sewer overflow (CSO) pollution by systematically integrating pollutant accumulation during dry weather with rainfall-driven transport processes. It establishes a coupled conceptual framework linking surface runoff, domestic sewage, and sewage sediments, overcoming the limitations of traditional single-process analyses and constructing a transferable methodological foundation. By identifying dominant pollutant carriers, conducting stratified analysis of source contributions, and pinpointing critical intervention points, this study provides data-driven guidance for precise CSO control and urban drainage management. The analytical framework and control strategies demonstrate cross-scale applicability: at the provincial level, localized adjustments enable direct application to regions with similar climatic and infrastructure conditions; at the national level, the study emphasizes the need for unified multi-medium investigation standards and pollution source allocation guidelines to achieve coordinated, adaptive combined sewer overflow management across regions.
4. Conclusions
This study established a dynamic analytical framework that systematically captures the complete “accumulation–transport–discharge” cycle of pollutants in combined sewer systems, integrating multiple pollution media into a unified spatiotemporal process. By linking pollutant build-up during dry periods with their transport and release during rainfall, the framework clarifies the intrinsic interactions and response mechanisms underlying CSO formation. Quantitative source contribution analysis further enabled a comprehensive understanding of pollutant origins and their dynamic evolution. The major findings are as follows:
- During dry periods, pronounced pollutant enrichment was observed across all media. Domestic sewage consistently exceeded national discharge standards, indicating continuous in-system loading. Surface sediments exhibited strong spatial heterogeneity and particle size dependence, with fine particles acting as key pollutant carriers. Sewer sediments, dominated by coarser material, constituted the largest pollutant reservoir prior to rainfall.
- Rainfall-driven transport was jointly controlled by the antecedent dry period, rainfall intensity, surface characteristics, and urban functional zoning. First-flush intensity followed the order TIN > TP > COD > SS, and particle-associated pollutants showed potential secondary resuspension during mid-to-late runoff stages.
- Source apportionment identified sewer sediments as the dominant contributors to CSO pollution (≈40–60%), followed by surface runoff (30–45%) and domestic sewage (10–20%), with distinct source preferences among individual pollutants.
Overall, this study advances a coupled source–sink understanding of CSO dynamics and provides a robust scientific basis for prioritizing pollution control measures, optimizing system operation, and supporting data-driven urban drainage management.
Supplementary Materials
The following supporting information can be downloaded at https://www.mdpi.com/article/10.3390/w18050573/s1, Figure S1: Annual precipitation in the study area from 2002 to 2021; Figure S2: Pearson correlation analysis, where ADP represents antecedent dry period, P represents precipitation, I represents rainfall intensity, and D represents rainfall duration; Table S1: Grade of precipitation based on Chinese national standard (GB/T 28592-2012); Table S2: Rainfall event summary table; Table S3: Corresponding cumulative days for each underlying surface pollutant-specific pollution load per unit area; Table S4: Average EMC values and exceedance multiples for rainfall over different land cover type; Table S5: Pollutant loads in different particle size fractions in sewer sediments before and after rainfall; Table S6: EMC values and exceedance multiples of CSO events; Table S7: Water quality indicators for domestic sewage during dry weather; Table S8: Sources apportionment of pollutant load in CSO.
Author Contributions
Conceptualization, X.L.; methodology, X.L., Z.Z. and Z.L.; software, X.L.; writing—original draft, X.L.; data curation, Z.Z., Z.C., H.Z. and X.S.; writing—review and editing, Z.Z., H.J. and Z.L.; investigation, H.J. and H.Z.; supervision, Z.L. and Z.Y. All authors have read and agreed to the published version of the manuscript.
Funding
This research was supported by the National Natural Science Foundation of China (grant number: 52070112).
Data Availability Statement
The original contributions presented in this study are included in the article/Supplementary Material. Further inquiries can be directed to the corresponding authors.
Conflicts of Interest
Author Zhiyu Yang was employed by the company CAUPD Beijing Planning & Design Consultants, Ltd. The remaining authors declare that the research was conducted in the absence of any commercial or financial relationships that could be construed as a potential conflict of interest.
References
- Petrie, B. A Review of Combined Sewer Overflows as a Source of Wastewater-Derived Emerging Contaminants in the Environment and Their Management. Environ. Sci. Pollut. Res. Int. 2021, 28, 32095–32110. [Google Scholar] [CrossRef] [Scilit]
- Sarti, C.; Cincinelli, A.; Bresciani, R.; Rizzo, A.; Chelazzi, D.; Masi, F. Microplastic Removal and Risk Assessment Framework in a Constructed Wetland for the Treatment of Combined Sewer Overflows. Sci. Total Environ. 2024, 952, 175864. [Google Scholar] [CrossRef] [Scilit]
- Botturi, A.; Ozbayram, E.G.; Tondera, K.; Gilbert, N.I.; Rouault, P.; Caradot, N.; Gutierrez, O.; Daneshgar, S.; Frison, N.; Akyol, Ç.; et al. Combined Sewer Overflows: A Critical Review on Best Practice and Innovative Solutions to Mitigate Impacts on Environment and Human Health. Crit. Rev. Environ. Sci. Technol. 2021, 51, 1585–1618. [Google Scholar] [CrossRef] [Scilit]
- Madoux-Humery, A.-S.; Dorner, S.; Sauvé, S.; Aboulfadl, K.; Galarneau, M.; Servais, P.; Prévost, M. The Effects of Combined Sewer Overflow Events on Riverine Sources of Drinking Water. Water Res. 2016, 92, 218–227. [Google Scholar] [CrossRef] [Scilit]
- Zan, R.; Blackburn, A.; Plaimart, J.; Acharya, K.; Walsh, C.; Stirling, R.; Kilsby, C.G.; Werner, D. Environmental DNA Clarifies Impacts of Combined Sewer Overflows on the Bacteriology of an Urban River and Resulting Risks to Public Health. Sci. Total Environ. 2023, 889, 164282. [Google Scholar] [CrossRef] [Scilit] [PubMed]
- United States Environmental Protection Agency. Clean Watersheds Needs Survey. Available online: https://www.epa.gov/cwns (accessed on 9 September 2025).
- Van Bijnen, M.; Korving, H.; Langeveld, J.; Clemens, F. Quantitative Impact Assessment of Sewer Condition on Health Risk. Water 2018, 10, 245. [Google Scholar] [CrossRef] [Scilit]
- Ministry of Housing and Urban-Rural Development of the People’s Republic of China. China Urban Construction Statistical Yearbook; Ministry of Housing and Urban-Rural Development of the People’s Republic of China: Beijing, China, 2021.
- Chan, F.K.S.; Griffiths, J.A.; Higgitt, D.; Xu, S.; Zhu, F.; Tang, Y.-T.; Xu, Y.; Thorne, C.R. “Sponge City” in China—A Breakthrough of Planning and Flood Risk Management in the Urban Context. Land Use Policy 2018, 76, 772–778. [Google Scholar] [CrossRef] [Scilit]
- Zhang, L.; Chen, S. Carbon Peaks of Water Systems in Chinese Cities under Varying Water Demand Dynamics and Energy Transition Pathways. J. Clean. Prod. 2022, 379, 134695. [Google Scholar] [CrossRef] [Scilit]
- Jean, M.-È.; Duchesne, S.; Pelletier, G.; Pleau, M. Selection of Rainfall Information as Input Data for the Design of Combined Sewer Overflow Solutions. J. Hydrol. 2018, 565, 559–569. [Google Scholar] [CrossRef] [Scilit]
- Haynes, H.M.; Taylor, K.G.; Rothwell, J.; Byrne, P. Characterisation of Road-Dust Sediment in Urban Systems: A Review of a Global Challenge. J. Soils Sediments 2020, 20, 4194–4217. [Google Scholar] [CrossRef] [Scilit]
- Gunawardena, J.; Egodawatta, P.; Ayoko, G.A.; Goonetilleke, A. Atmospheric Deposition as a Source of Heavy Metals in Urban Stormwater. Atmos. Environ. 2013, 68, 235–242. [Google Scholar] [CrossRef] [Scilit]
- Baensch-Baltruschat, B.; Kocher, B.; Stock, F.; Reifferscheid, G. Tyre and Road Wear Particles (TRWP)—A Review of Generation, Properties, Emissions, Human Health Risk, Ecotoxicity, and Fate in the Environment. Sci. Total Environ. 2020, 733, 137823. [Google Scholar] [CrossRef] [Scilit]
- Chow, M.F.; Yusop, Z.; Mohamed, M. Quality and First Flush Analysis of Stormwater Runoff from a Tropical Commercial Catchment. Water Sci. Technol. 2011, 63, 1211–1216. [Google Scholar] [CrossRef] [Scilit] [PubMed]
- Michelbach, S. Origin, Resuspension and Settling Characteristics of Solids Transported in Combined Sewage. Water Sci. Technol. 1995, 31, 69–76. [Google Scholar] [CrossRef] [Scilit]
- Yang, W.; Zhang, J.; Mei, S.; Krebs, P. Impact of Antecedent Dry-Weather Period and Rainfall Magnitude on the Performance of Low Impact Development Practices in Urban Flooding and Non-Point Pollution Mitigation. J. Clean. Prod. 2021, 320, 128946. [Google Scholar] [CrossRef] [Scilit]
- Chow, M.F.; Yusop, Z.; Shirazi, S.M. Storm Runoff Quality and Pollutant Loading from Commercial, Residential, and Industrial Catchments in the Tropic. Environ. Monit. Assess. 2013, 185, 8321–8331. [Google Scholar] [CrossRef] [Scilit]
- Talebzadeh, F.; Valeo, C.; Gupta, R. Cadmium Water Pollution Associated with Motor Vehicle Brake Parts. IOP Conf. Ser. Earth Environ. Sci. 2021, 691, 012001. [Google Scholar] [CrossRef] [Scilit]
- Egodawatta, P.; Miguntanna, N.S.; Goonetilleke, A. Impact of Roof Surface Runoff on Urban Water Quality. Water Sci. Technol. 2012, 66, 1527–1533. [Google Scholar] [CrossRef] [Scilit] [PubMed]
- Brzezińska, A.; Zawilski, M.; Sakson, G. Assessment of Pollutant Load Emission from Combined Sewer Overflows Based on the Online Monitoring. Environ. Monit. Assess. 2016, 188, 502. [Google Scholar] [CrossRef] [Scilit]
- Lai, Q.; Ma, J.; Du, W.; Luo, Y.; Ji, D.; He, F. Analysis of the Source Tracing and Pollution Characteristics of Rainfall Runoff in Adjacent New and Old Urban Areas. Water 2023, 15, 3018. [Google Scholar] [CrossRef] [Scilit]
- Zheng, C. Scouring Effect of Pavement Runoff in Initial Stage. IOP Conf. Ser. Earth Environ. Sci. 2019, 300, 032046. [Google Scholar] [CrossRef] [Scilit]
- Yu, D.; Dian, L.; Hai, Y.; Randall, M.T.; Liu, L.; Liu, J.; Zhang, J.; Zheng, X.; Wei, Y. Effect of Rainfall Characteristics on the Sewer Sediment, Hydrograph, and Pollutant Discharge of Combined Sewer Overflow. J. Environ. Manag. 2022, 303, 114268. [Google Scholar] [CrossRef] [Scilit]
- Li, Y.; Zhou, Y.; Wang, H.; Jiang, H.; Yue, Z.; Zheng, K.; Wu, B.; Banahene, P. Characterization and Sources Apportionment of Overflow Pollution in Urban Separate Stormwater Systems Inappropriately Connected with Sewage. J. Environ. Manag. 2022, 303, 114231. [Google Scholar] [CrossRef] [Scilit]
- Gasperi, J.; Gromaire, M.C.; Kafi, M.; Moilleron, R.; Chebbo, G. Contributions of Wastewater, Runoff and Sewer Deposit Erosion to Wet Weather Pollutant Loads in Combined Sewer Systems. Water Res. 2010, 44, 5875–5886. [Google Scholar] [CrossRef] [Scilit]
- Kafi-Benyahia, M.; Gromaire, M.G.; Chebbo, G. Spatial Variability of Characteristics and Origins of Urban Wet Weather Pollution in Combined Sewers. Water Sci. Technol. 2005, 52, 53–62. [Google Scholar] [CrossRef] [Scilit] [PubMed]
- Chen, Y.; Shi, X.; Jin, X.; Jin, P. Characteristics of Overflow Pollution from Combined Sewer Sediment: Formation, Contribution and Regulation. Chemosphere 2022, 298, 134254. [Google Scholar] [CrossRef] [Scilit] [PubMed]
- Egodawatta, P.; Thomas, E.; Goonetilleke, A. Understanding the Physical Processes of Pollutant Build-up and Wash-off on Roof Surfaces. Sci. Total Environ. 2009, 407, 1834–1841. [Google Scholar] [CrossRef] [Scilit] [PubMed]
- Egodawatta, P.; Goonetilleke, A. Characteristics of Pollutants Built-up on Residential Road Surfaces. In Proceedings of the Proceedings of the 7th International Conference on Hydroscience and Engineering: ICHE 2006; Drexel University: Philadelphia, PA, USA, 2006; pp. 1–10. [Google Scholar]
- Fai, C.M.; Yusop, Z. Determination of Stormwater First Flush Treatment Strategies at Tropical Urban Catchments. Desalin. Water Treat. 2017, 79, 196–203. [Google Scholar] [CrossRef] [Scilit]
- GB/T 28592-2012; Grade of Precipitation. Standardization Administration of China, China Standards Press: Beijing, China, 2012.
- National Environmental Protection Agency of China, Editorial Committee of Standard Methods for the Examination of Water and Wastewater. Standard Methods for Examination of Water and Wastewater; CEPB Chinese Environmental Science Press: Beijing, China, 2002; ISBN 978-7-80163-400-9.
- Lee, J.H.; Bang, K.W. Characterization of Urban Stormwater Runoff. Water Res. 2000, 34, 1773–1780. [Google Scholar] [CrossRef] [Scilit]
- Bertrand-Krajewski, J.-L.; Chebbo, G.; Saget, A. Distribution of Pollutant Mass vs Volume in Stormwater Discharges and the First Flush Phenomenon. Water Res. 1998, 32, 2341–2356. [Google Scholar] [CrossRef] [Scilit]
- Kim, L.-H.; Kayhanian, M.; Zoh, K.-D.; Stenstrom, M.K. Modeling of Highway Stormwater Runoff. Sci. Total Environ. 2005, 348, 1–18. [Google Scholar] [CrossRef] [Scilit] [PubMed]
- Li, S. Research on Pollution Characteristics and Control Technologies of Combined Sewer Overflow; Tsinghua University: Beijing, China, 2015. (In Chinese) [Google Scholar]
- Gromaire, M.C.; Garnaud, S.; Saad, M.; Chebbo, G. Contribution of Different Sources to the Pollution of Wet Weather Flows in Combined Sewers. Water Res. 2001, 35, 521–533. [Google Scholar] [CrossRef] [Scilit]
- Flanagan, K.; Blecken, G.-T.; Österlund, H.; Nordqvist, K.; Viklander, M. Contamination of Urban Stormwater Pond Sediments: A Study of 259 Legacy and Contemporary Organic Substances. Environ. Sci. Technol. 2021, 55, 3009–3020. [Google Scholar] [CrossRef] [Scilit] [PubMed]
- Miguntanna, N.S.; Egodawatta, P.; Goonetilleke, A. Pollutant Characteristics on Roof Surfaces for Evaluation as a Stormwater Harvesting Catchment. Desalin. Water Treat. 2010, 19, 205–211. [Google Scholar] [CrossRef] [Scilit]
- Wijesiri, B.; Egodawatta, P.; McGree, J.; Goonetilleke, A. Understanding the Uncertainty Associated with Particle-Bound Pollutant Build-up and Wash-off: A Critical Review. Water Res. 2016, 101, 582–596. [Google Scholar] [CrossRef] [Scilit] [PubMed]
- Müller, A.; Österlund, H.; Marsalek, J.; Viklander, M. The Pollution Conveyed by Urban Runoff: A Review of Sources. Sci. Total Environ. 2020, 709, 136125. [Google Scholar] [CrossRef] [Scilit]
- Charters, F.J.; Cochrane, T.A.; O’Sullivan, A.D. Particle Size Distribution Variance in Untreated Urban Runoff and Its Implication on Treatment Selection. Water Res. 2015, 85, 337–345. [Google Scholar] [CrossRef] [Scilit]
- GB 3838-2002; Environmental Quality Standards for Surface Water. Standardization Administration of China, China Standards Press: Beijing, China, 2002.
- GB 18918-2002; Discharge Standard of Pollutants for Municipal Wastewater Treatment Plant. Standardization Administration of China, China Standards Press: Beijing, China, 2002.
- Choe, J.S.; Bang, K.W.; Lee, J.H. Characterization of Surface Runoff in Urban Areas. Water Sci. Technol. 2002, 45, 249–254. [Google Scholar] [CrossRef] [Scilit]
- Lin, W. Study on Stormwater Runoff Pollution in Municipal Roads of Xiamen City. China Water Wastewater 2024, 40, 19–24. (In Chinese) [Google Scholar] [CrossRef]
- Xu, M.; Li, H.; Fu, D. Study on the Runoff Patterns of Pollutants in Highway Pavement Rainwater. J. Anhui Agri. 2012, 40, 4178–4179+4216. (In Chinese) [Google Scholar]
- Yan, S.; Xu, H.; Fang, Y.; Li, J.; Lv, M.; Li, G.; Huang, L.; Li, Y.; Song, G. The Characteristics and Traceability Analysis of the Overflow Pollution During the Flood Season in an Urban Area. Water 2024, 16, 3159. [Google Scholar] [CrossRef] [Scilit]
- Charters, F.J.; Cochrane, T.A.; O’Sullivan, A.D. Untreated Runoff Quality from Roof and Road Surfaces in a Low Intensity Rainfall Climate. Sci. Total Environ. 2016, 550, 265–272. [Google Scholar] [CrossRef] [Scilit] [PubMed]
- Silveira, A.; de Lima, J.L.M.P.; Abrantes, J.R.C.B.; Mujtaba, B. Washout of Fine Sand Particles from a Ceramic Tile Roof: Laboratory Experiments Under Simulated Rainfall. Water Air Soil Pollut. 2017, 228, 352. [Google Scholar] [CrossRef] [Scilit]
- Kim, G.; Yur, J.; Kim, J. Diffuse Pollution Loading from Urban Stormwater Runoff in Daejeon City, Korea. J. Environ. Manag. 2007, 85, 9–16. [Google Scholar] [CrossRef] [Scilit] [PubMed]
- Wu, J.-L.; Liu, Z.; Ma, Q.; Wan, Y.; Dang, Z.; Liu, Y.; Liu, Y. Combined Collection Systems of Sewage and Rainfall Runoff Seriously Affect the Spatial Distributions of Natural Estrogens and Their Conjugates in River Water: Insights from the Pearl River of China. Water Res. 2024, 256, 121588. [Google Scholar] [CrossRef] [Scilit]
- Hamburg, M. Statistical Analysis for Decision Making; Harcourt, Brace & World: New York, NY, USA, 1970; ISBN 0155837605, 9780155837607. [Google Scholar]
- Rossi, L.; Krejci, V.; Rauch, W.; Kreikenbaum, S.; Fankhauser, R.; Gujer, W. Stochastic Modeling of Total Suspended Solids (TSS) in Urban Areas during Rain Events. Water Res. 2005, 39, 4188–4196. [Google Scholar] [CrossRef] [Scilit]
- Li, H.; Xu, S.; Huang, Y.; Wei, P. Pollution loading of overflow in combined drainage channels during rainy season. Huanjing Kexue Xuebao 2013, 33, 2522–2530. (In Chinese) [Google Scholar]
- Zhao, L.; Yang, F.; Wang, J.; Xie, Z.; Zhu, Y. Characterization of storm-water pollutant sources in a combined sewer network. Huanjing Kexue Xuebao 2008, 28, 1561–1570. (In Chinese) [Google Scholar]
- Soonthornnonda, P.; Christensen, E.R.; Boudjou, U.; Singer, M.; Bate, T.; Magruder, C.; Waldmer, E. An Evaluation of Separating Combined Sewers and Its Effect on Water Quality in the Greater Milwaukee, Wisconsin Area. Proceed. Water Environ. Fed. 2007, 2007, 7080. Available online: https://www.accesswater.org/publications/proceedings/-293694/an-evaluation-of-separating-combined-sewers-and-its-effect-on-water-quality-in-the-greater-milwaukee--wisconsin-area?pdfdownload=true (accessed on 10 February 2026). [CrossRef] [Scilit]
- Dian, L.; Zheng, X.; Yu, D.; Wei, Y. Research progress on characteristics and control of combined sewer overflows pollution. Water Resour. Prot. 2019, 35, 76–83. (In Chinese) [Google Scholar] [CrossRef]

Disclaimer/Publisher’s Note: The statements, opinions and data contained in all publications are solely those of the individual author(s) and contributor(s) and not of MDPI and/or the editor(s). MDPI and/or the editor(s) disclaim responsibility for any injury to people or property resulting from any ideas, methods, instructions or products referred to in the content. |
© 2026 by the authors. Licensee MDPI, Basel, Switzerland. This article is an open access article distributed under the terms and conditions of the Creative Commons Attribution (CC BY) license.