


Abstract
Drought leads to declining water levels and reduced water volume in lakes, significantly altering their water quality. Current research has primarily examined water quality during drought episodes or compared conditions before and after such events. However, the variations in water quality indicators and their relationships with hydrological factors across different drought stages, particularly during development and recovery periods, remain poorly understood. To address this gap, we investigated the stage-specific impacts of hydrological drought on lake water quality. Hydrological drought events were identified and segmented into development and recovery stages using the Standardized Water Level Index. Eight water quality indicators, including total nitrogen (TN) and total phosphorus (TP), were analyzed together with hydrological variables using Grey Relational Analysis (GRA). Poyang Lake, the largest freshwater lake in China, served as the case study. The results revealed significant spatio-temporal heterogeneity in both drought characteristics and water quality responses. Development periods were generally longer than recovery periods. Dissolved oxygen (DO) was consistently lower during drought development, whereas TP increased during recovery. GRA indicated that the main drivers of TN and TP shifted across drought stages. During the development period, TN and TP were more closely coupled, and permanganate index and turbidity exerted strong influences. In contrast, during the recovery period, TN was primarily associated with conductivity, while TP became mainly dominated by turbidity. This paper not only supplements the theoretical understanding of the interaction between hydrological drought and water quality, but also provides scientific support for water quality early warning, and the water resource management of large freshwater lakes under drought scenarios.
1. Introduction
Climate change and intense human activities are accelerating the hydrological cycle, leading to increased frequency and intensity of extreme hydro-meteorological disasters, including global heatwaves, heavy rainfalls, floods and droughts. These phenomena pose serious threats to ecosystems and human socio-economic development [1,2]. Among these, drought is the most common hydro-meteorological disaster triggered by climatic anomalies. It inflicts severe economic losses on ecosystems and presents major challenges for disaster prevention and mitigation [3,4]. The impact of drought is particularly pronounced in lake ecosystems, which depend on stable water supplies. Lakes are not only vital sources of freshwater, but also core carriers that maintain regional biodiversity and provide essential ecological services, such as water supply, aquaculture, recreation, and climate regulation [5,6,7]. However, under the influence of persistent drought, approximately 50% of the world’s large lakes are drying up or shrinking, with unexpected water loss occurring even in humid regions. This suggests that the global trend of lake drought is more widespread and pervasive than previously recognized [8]. Therefore, a thorough understanding of lake drought and effective responses to it are of critical theoretical and practical importance for assessing water resource security, predicting ecological risks, and formulating adaptive management strategies [9,10].
During drought periods, the most direct responses of lakes are declines in water level, along with reductions in water volume and surface area [11]. Some studies have focused on how drought events alter the hydrological regimes of lakes [12,13,14,15,16]. For example, Ndehedehe et al. [17] applied independent component analysis and fourth-order cumulant statistics to analyze spatio-temporal drought variability and its relation to terrestrial water storage in the Lake Chad Basin. Guo et al. [18] quantified shifts in dry-season lake levels due to channel changes in a river–lake system using two Long Short-Term Memory-based water level prediction models. Alongside hydrological changes, researchers have increasingly recognized that pronounced hydrological changes during droughts can alter physical, chemical, and biological processes in lakes, thereby driving significant water quality transformations [19,20]. To assess these impacts, Kim et al. [21] developed a method for evaluating spatio-temporal droughts based on water quality risk, which they applied to the Nakdong River Basin in South Korea to investigate drought assessment and water quality vulnerability under severe drought conditions. In another study, Li et al. [22] used multiple statistical techniques, including cluster analysis, discriminant analysis, principal component analysis, and factor analysis, to assess spatial and temporal variations in water quality in Australia’s Lower Lakes during and after drought periods. More recently, Seo et al. [23] proposed an Environmental Drought Condition Index—water quality based on a bivariate copula joint probability model linking meteorological drought indices and river water quality—to define and study environmentally relevant drought from a water quality perspective.
These studies have demonstrated that declining water levels reduce lake volume and prolong hydraulic retention time, creating conditions that can intensify nutrient accumulation and stimulate algal bloom formation. Concurrently, elevated evaporation rates concentrate soluble salts and pollutants, further degrading water quality. The exposure of littoral sediments may also induce the release of endogenous pollutants previously stored in lake beds. Additionally, altered thermal stratification patterns and reduced dissolved oxygen concentrations can disrupt aquatic ecosystems, ultimately reshaping biological community structure [20,24,25,26,27]. However, these findings are largely derived from single-stage drought analyses or drought and non-drought comparisons, failing to capture the dynamic nature of drought as a multi-stage process (development vs. recovery) with potentially distinct hydrological drivers and water quality responses.
Current research extensively documents the profound impacts of drought on the hydrology and water quality in lakes. Drought is not a uniform event but a dynamic process encompassing distinct stages, such as development and recovery periods. The intensity and duration of drought vary considerably across these stages. Yet, how lake water quality and its driving factors change from drought development to recovery remains unclear. Most existing studies, however, focus on examining hydrological and/or water quality indicators in typical extreme drought events, or comparing water quality between drought and non-drought periods. For instance, Wu et al. [28] examined changes in the precipitation–streamflow relationship during hydrological drought development and recovery by introducing the effective streamflow–precipitation ratio, revealing substantial differences between the two stages. Overall, the characteristics of lake water quality evolution across different drought stages and their linkages to hydrological indicators remain largely unexplored. Moreover, there is a lack of systematic analysis regarding how different drought stages influence specific water quality parameters and their key controlling factors in lakes, particularly in humid-zone lakes with complex river–lake connectivity, such as Poyang Lake.
This study therefore aims to elucidate the differential responses of water quality indicators during the development and recovery stages of drought events in lakes. Poyang Lake, the largest freshwater lake in China, was taken as the study area. Characterized by dramatic seasonal water level fluctuations, frequent drought–flood alternations, and high hydraulic connectivity with the Yangtze River, Poyang Lake provides an ideal natural laboratory for studying drought-driven water quality dynamics. In recent decades, the lake has experienced increasingly severe and prolonged drought events, which have significantly altered its hydrological regime, nutrient cycling, and ecological structure, attracting widespread attention for regional water security and ecological protection [10,14]. Lake hydrological drought is quantified using the Standardized Water Level Index (SWI) [29,30,31]. Specifically, the study seeks to address the following research gaps that remain under-explored in the existing literature: (1) comparing water quality indicators between drought development and recovery periods, and (2) identifying the driving forces for water quality variations in each period. We test the hypothesis that water quality exhibits pronounced spatio-temporal heterogeneity in response to distinct drought stages, and the transition from drought development to recovery reshapes the primary driving factors influencing key water quality indicators such as TN and TP. The findings are expected to enhance the understanding of stage-specific lake water quality dynamics during drought and the underlying influencing mechanisms, while also providing refined scientific support for lake water resource management and ecological protection.
2. Methodology
2.1. Study Area and Data
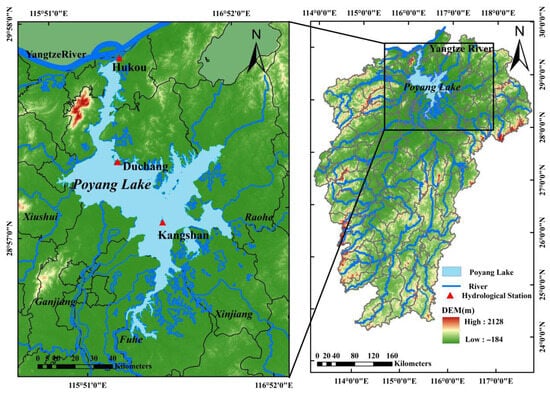
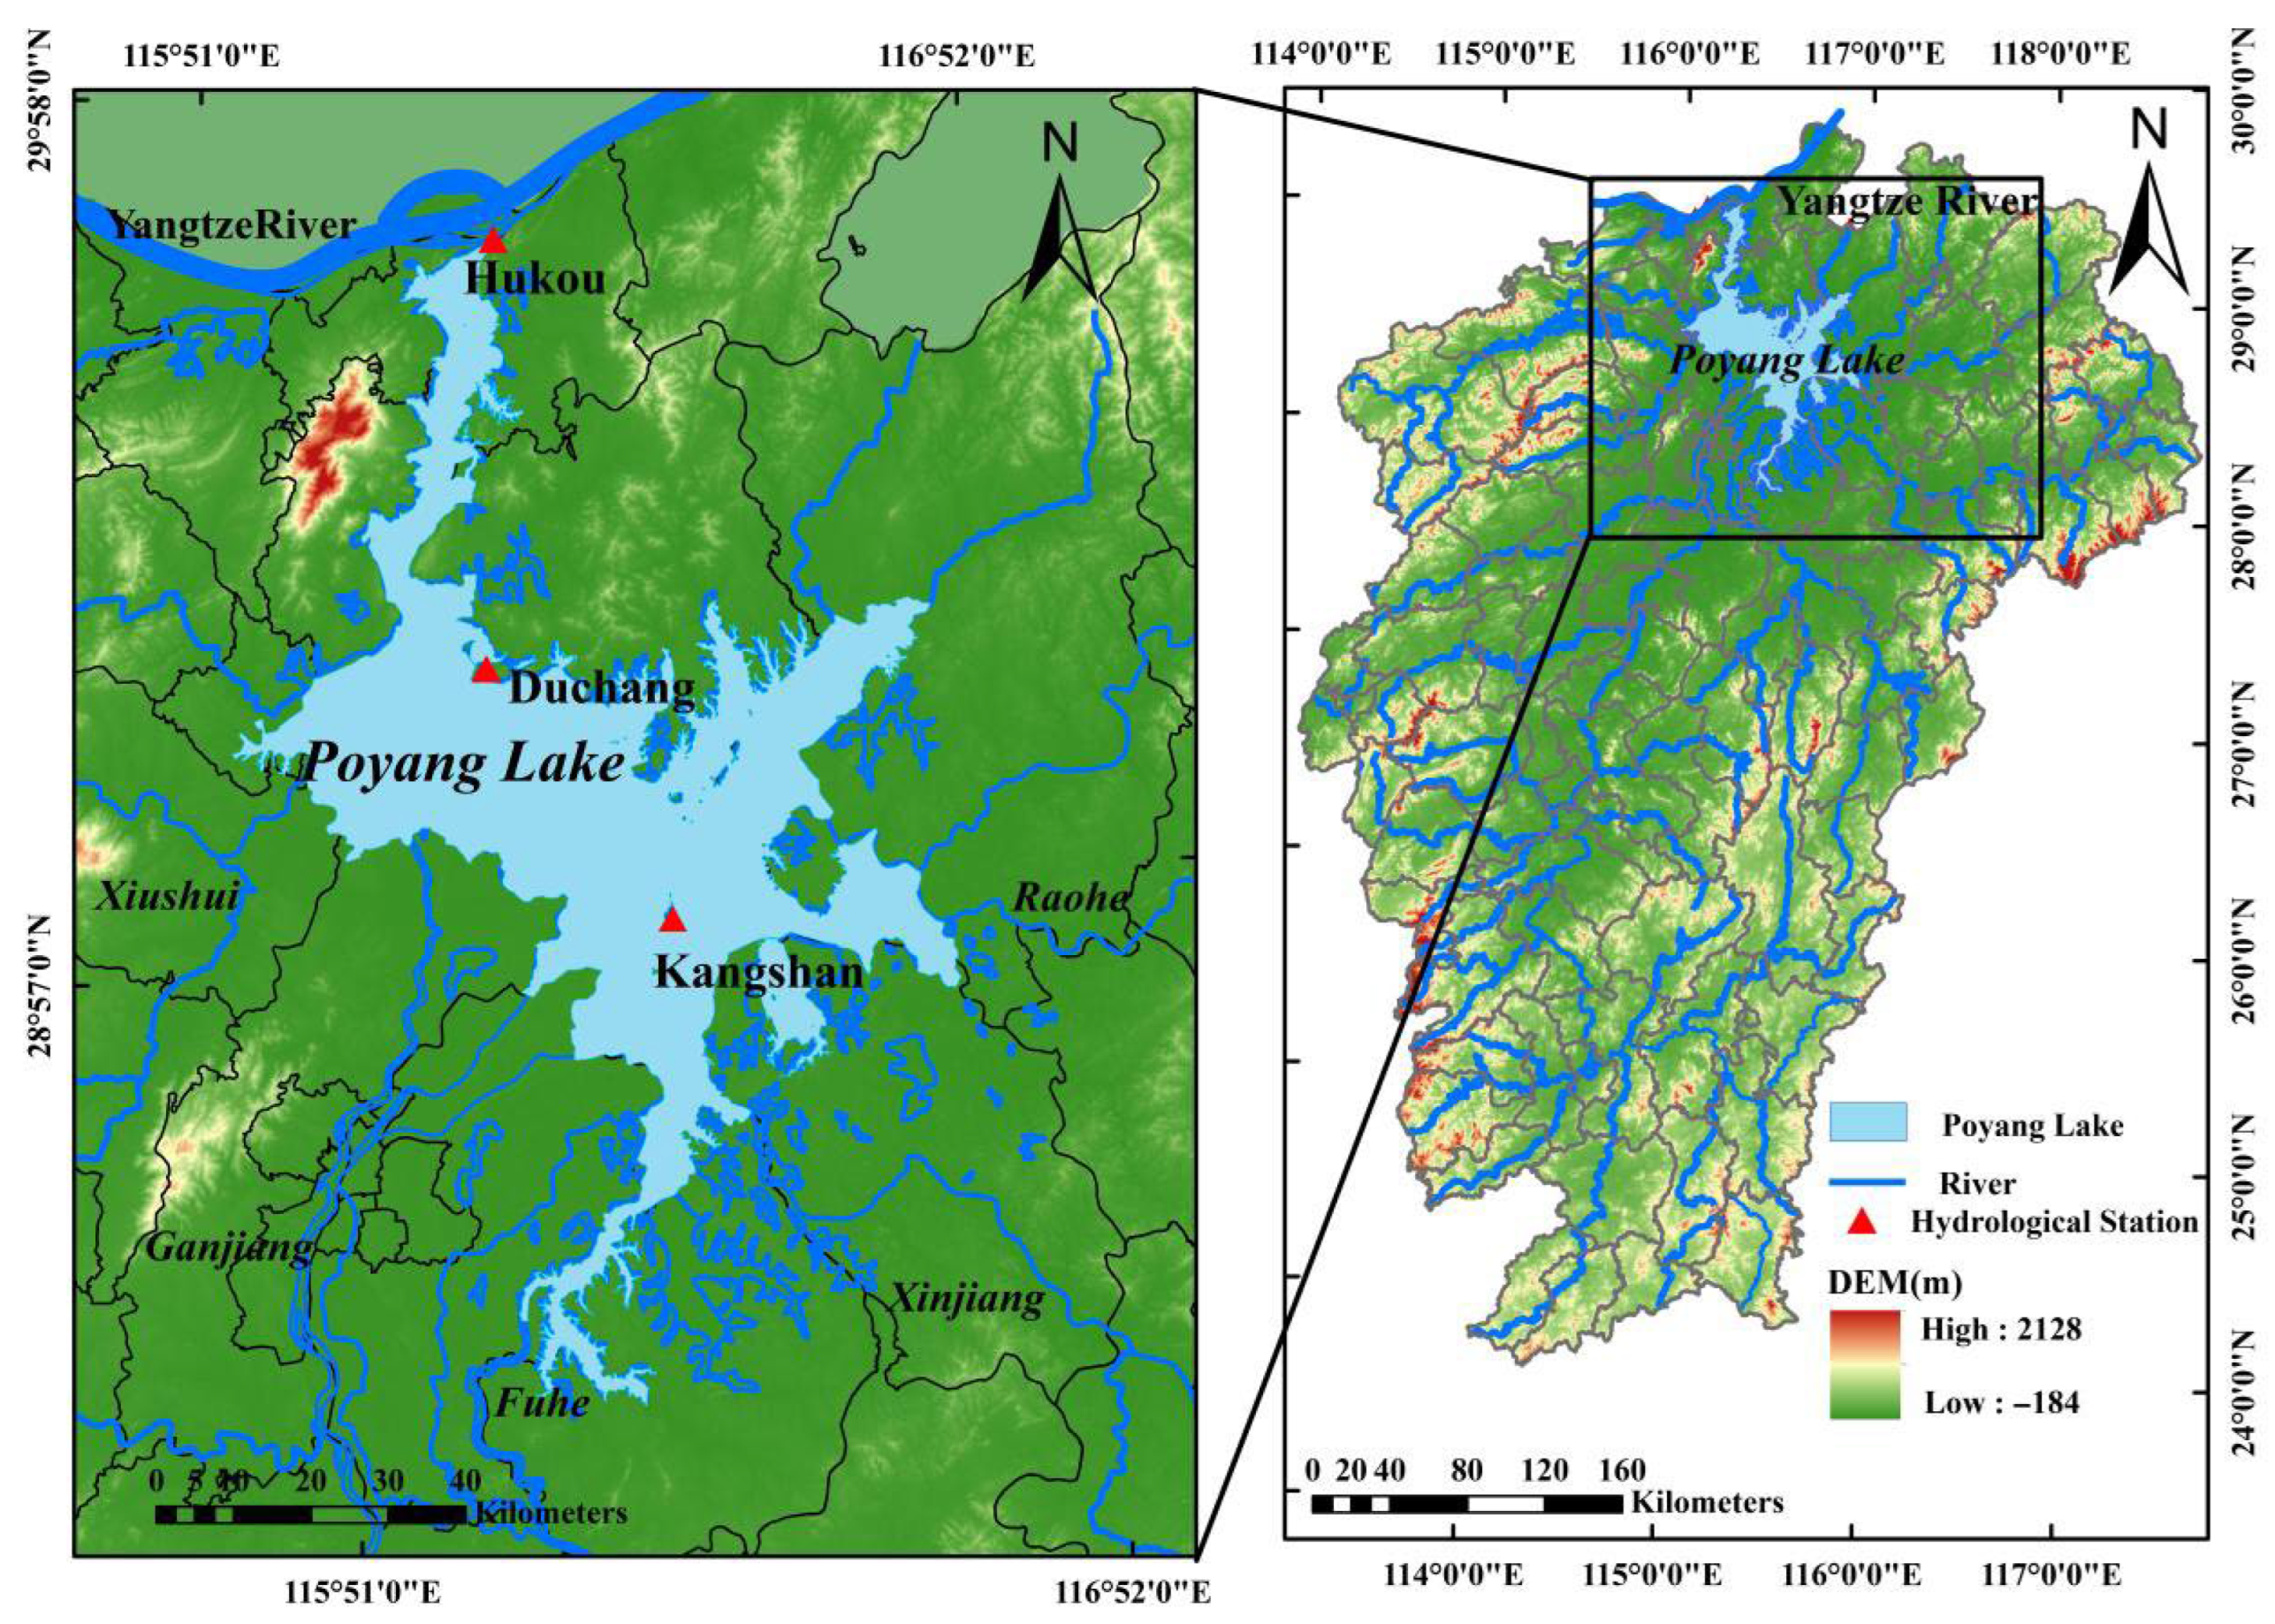
Poyang Lake (115°49′ E~116°46′ E, 28°11′ N~29°51′ N) is situated in the northern part of Jiangxi Province, on the south bank of the middle reaches of the Yangtze River (Figure 1). As the largest freshwater lake in China, it receives inflows from five major rivers, namely the Ganjiang, Fuhe, Xinjiang, Raohu and Xiushui, along with some smaller tributaries within its basin. The lake discharges into the Yangtze River through the Hukou. Characterized as a large, seasonal, open-water system, Poyang Lake drains an area of approximately 162,200 km2, accounting for about 9% of the total Yangtze River Basin. Poyang Lake has been intensively affected by anthropogenic activities in recent decades. Large-scale sand mining in the lake has changed sediment deposition, while the operation of upstream dams has altered the seasonal runoff and water level regimes. These human disturbances significantly affect lake hydrological processes and sediment dynamics.
Figure 1.
Location of the Poyang Lake.
Precipitation in the region is unevenly distributed throughout the year. The flood season contributes about 44% of the annual rainfall, while the dry season accounts for only 24% [32]. Influenced by the interaction of the Yangtze River and the five major tributaries, the hydrological regime of Poyang Lake has exhibited pronounced intra-annual variations. The storage capacity and surface area of the lake during the flood season are significantly larger than those during the drought period [33]. This dynamic gives rise to its distinctive seasonal pattern, often described as “a lake at high water and a river at low water.”
In this study, measured monthly water level data at Duchang and Kangshan Station from 2000 to 2022, and Hukou from 2000 to 2021, were used to identify hydrological drought events in Poyang Lake. The three stations were representative to reflect the condition of the lake [34,35]. Lake surface water temperature (LSWT) data from 2000 to 2022 and measured monthly water level data were provided by Jiangxi Hydrology Bureau. The monthly water quality data of Hukou, Duchang and Kangshan Stations from 2000 to 2022 (Table 1), including Dissolved Oxygen (DO), Total Nitrogen (TN), Conductivity, Dissolved Organic Carbon (DOC), pH, Permanganate Index, Total Phosphorus (TP), and Turbidity, were obtained from the national water quality automatic monitoring stations for surface water managed by the China Environmental Monitoring Centre (CNEMC; https://www.cnemc.cn/sssj/; accessed on 1 October 2025). These data are collected and transmitted in real time through professional automatic monitoring equipment, in strict compliance with the national surface water environmental monitoring standards and technical specifications. In this paper, we conducted data screening, processing and quantitative analysis based on these official standardized automatic monitoring datasets.
Table 1.
Descriptive statistics of water quality indicators.
For analytical consistency, the drought stage identification and water quality correlation analysis for Hukou Station were performed only using the overlapping period 2000–2021, and for Duchang and Kangshan Stations using the full-length time series 2000–2022.
2.2. The Evaluation of Drought
This study employed the Standardized Water Level Index (SWI), which is proposed by referring to the principle of Standardized Precipitation Index (SPI), to quantify hydrological drought in Poyang Lake. The SWI effectively captures the hydrological characteristics of river-connected lake systems and has been widely used in lake drought studies to accurately identify and characterize drought events [31,36]. It is constructed analogously to the SPI, but substitutes water level time series for precipitation data in its calculation process. The comprehensive descriptions of the SWI calculation processes can be found in He et al. [31].
Drought events can be captured by the run theory, which is proposed by Yevjevich [37] and is a widely applied approach for analyzing hydrological time series and extracting drought characteristics. Based on the SWI values, drought events are classified into five grades [28,31,38], as shown in Table 2. A drought event is defined when the SWI fell below −0.5, with lower values indicating greater drought intensity. This study focuses on droughts of slight grade and above (i.e., SWI < −0.5). To avoid premature judgement caused by transient water level recovery, a drought is recognized as terminated only when the SWI rises to and remains above −0.5 for at least 3 consecutive months. To eliminate false drought events induced by short-term hydrological fluctuations, such as temporary water level declines driven by seasonal water conservancy regulation or occasional meteorological anomalies, any SWI below −0.5 that lasts fewer than 2 consecutive months is classified as a transient disturbance rather than a formal drought event, and is excluded from subsequent drought statistics and stage division.
Table 2.
Classification of drought index [28,31,38].
2.3. The Characteristics of Drought Events and Their Development and Recovery Period
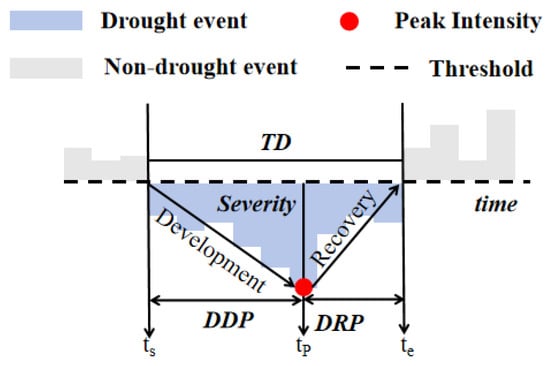
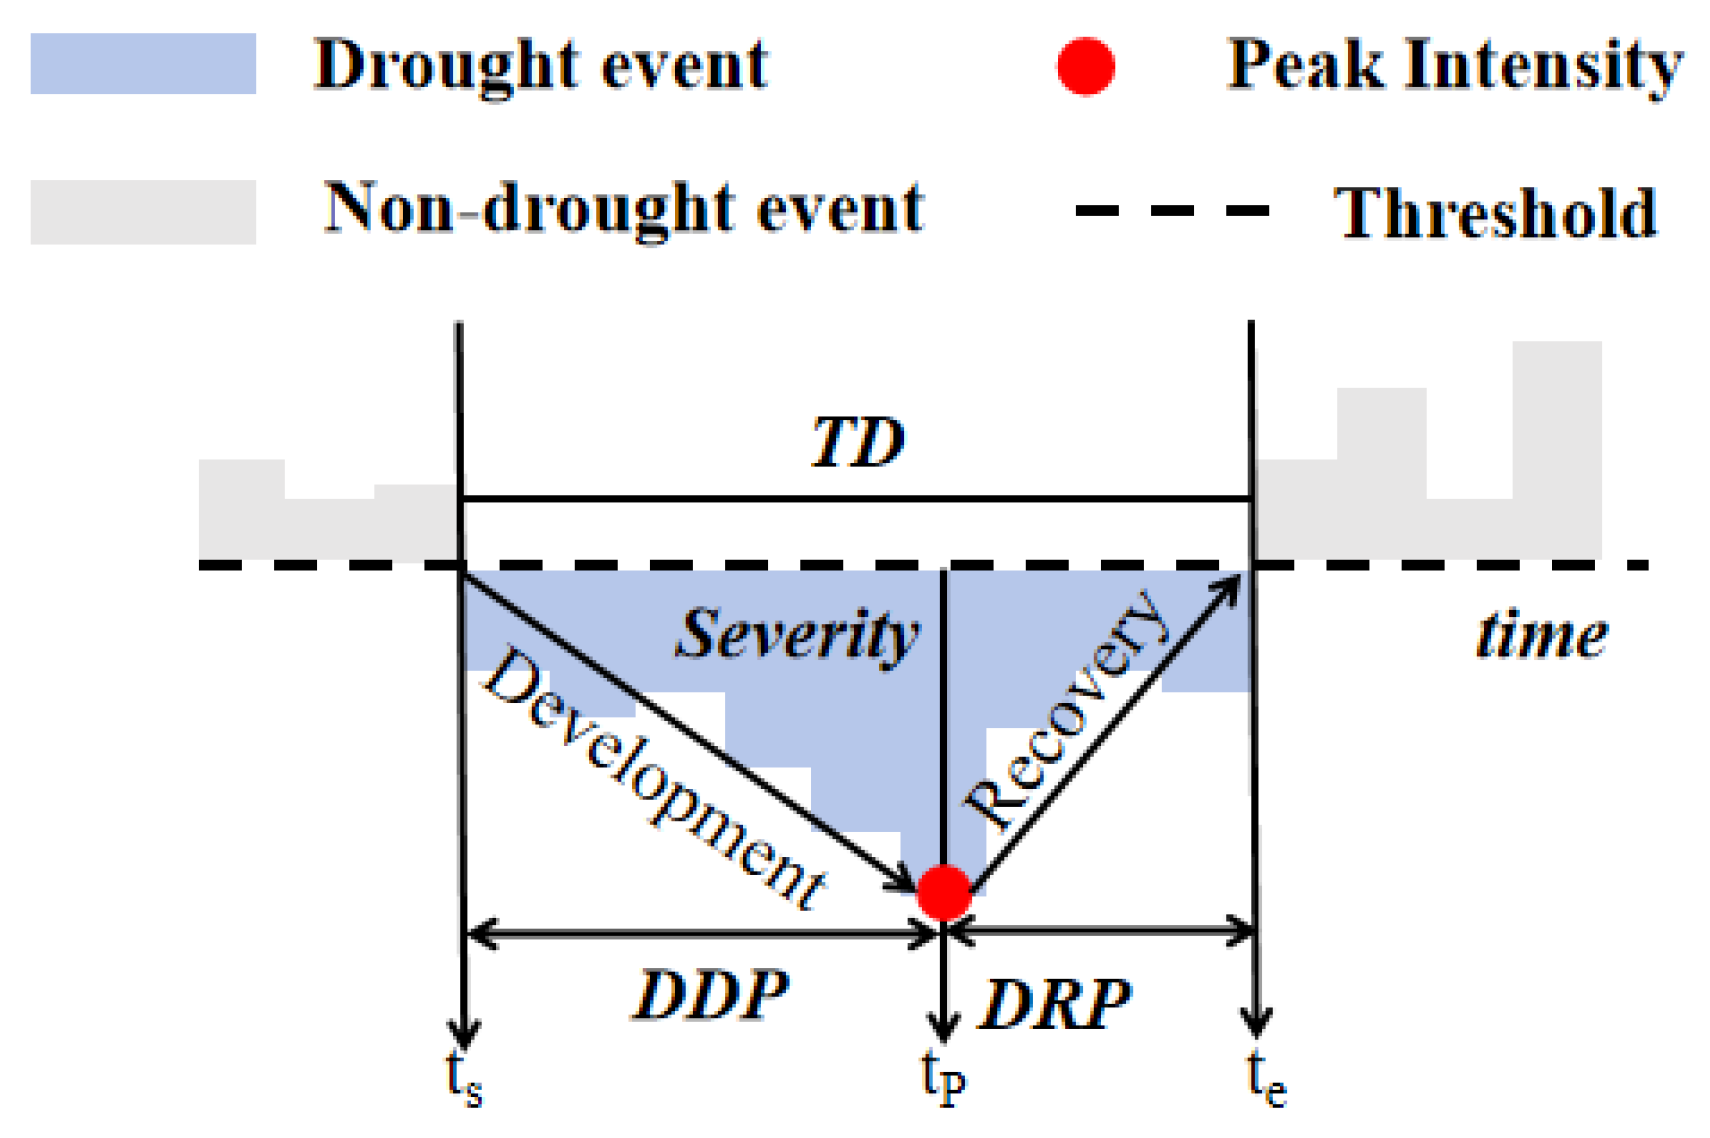
Drought events are characterized by multiple characteristics, including duration, peak intensity, frequency and severity [39]. An illustration of these characteristics along with the associated development and recovery periods is provided in Figure 2. Specifically, TD is defined as the length of time from the start (ts) to the end of a drought recovery (te) for a drought event. Peak intensity represents the maximum absolute value of the drought index during the event, and also marks the transition point between the development and recovery periods. Before drought peak intensity, the hydrological drought continuously intensifies with the decline of the lake water level (drought development stage). After peak intensity, the drought begins to alleviate with the gradual recovery of water level (drought recovery stage). This is consistent with the intrinsic evolution law of hydrological drought in lakes, and has been demonstrated as effective in relevant hydrological drought stage division studies, such as in Wu et al. [40]. Frequency refers to the average number of drought events occurring within a specified time interval. Severity is defined as the cumulative water deficit during a drought event [40,41].
Figure 2.
Schematic illustration of drought characteristics and their development and recovery period.
Following Parry et al. [42], each drought event is divided into a development period and a recovery period based on the timing of the peak intensity, such that the total duration satisfies TD = DDP + DRP. The DDP is the duration of development period, and is defined as the length of time from the start of drought (ts) to the end of drought development (tP). The DRP is the duration of the recovery period, and is defined as the length of time from the start of drought recovery (tP), which is also the end of drought development, as well the time point of peak intensity, to the end of a drought event (te).
2.4. Analysis of Driving Factors for Water Quality Indicators
Prior to examining the driving factors for water quality indicators, the Pearson correlation analysis is conducted to quantify linear relationships among hydrological and water quality variables (i.e., water level, LSWT, DO, TN, conductivity, DOC, pH, permanganate index, TP, and turbidity). Correlation coefficient values range from −1 to 1. Positive correlation coefficient values indicate direct relationships, and negative correlation coefficient values indicate inverse relationships between two variables.
Subsequently, the Grey Relational Analysis (GRA) method [43,44] is applied to assess the degree of association between TN or TP and other hydrological and water quality parameters. GRA has clear application boundaries in statistical inference. As a correlation-based method, it performs well in quantifying comprehensive correlation degrees and importance rankings among variables, especially in small-sample and uncertainty systems, which aligns with this study’s goal of identifying key driving factors. However, GRA only identifies statistical correlations between variables, rather than definitive causal relationships. It cannot decompose direct and indirect effects or verify causal pathways and directions—tasks that require dedicated models such as structural equation modelling. Since this study focuses on correlation intensity and factor importance rather than formal causal inference, GRA remains an appropriate and robust choice.
Before conducting GRA, dimensionless preprocessing was implemented to eliminate the impacts of inconsistent dimensions and numerical magnitudes among different indicators. GRA is a multi-factor statistical technique that utilizes grey relational sequence to evaluate the magnitude and order of correlation degrees among various variables. By ranking the relational degrees, key driving factors are identified, thereby clarifying the relative influence of different hydrological and water quality parameters on total nitrogen and total phosphorus.
where ζi(k) is the grey relational degree (GRD) at time k; x0(k) is the reference sequence; xi(k) is the i th comparison sequence; and θ is the associated parameter, used to reduce the influence of extreme values on the calculation. Its value ranges from 0 to 1, and it is usually set to 0.5 in practice. This value is the classical default and universally recommended parameter in the original grey system theory, and has been widely adopted as a standard setting [45]. Moreover, existing theoretical and empirical studies have confirmed that the value of θ only regulates the absolute value of relational grades, but does not change the relative ranking of different driving factors [46,47]. ri is the overall grey relational degrees between the comparison sequence and reference sequence across all time points. A higher ri indicates a stronger influence of the comparison variable on the reference variable.
3. Results
3.1. Analysis of Drought Characteristics of SWI
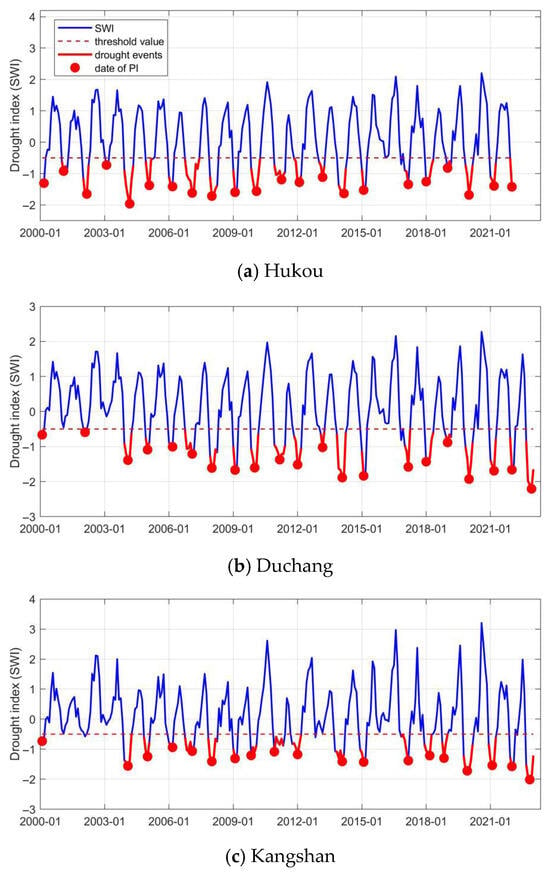
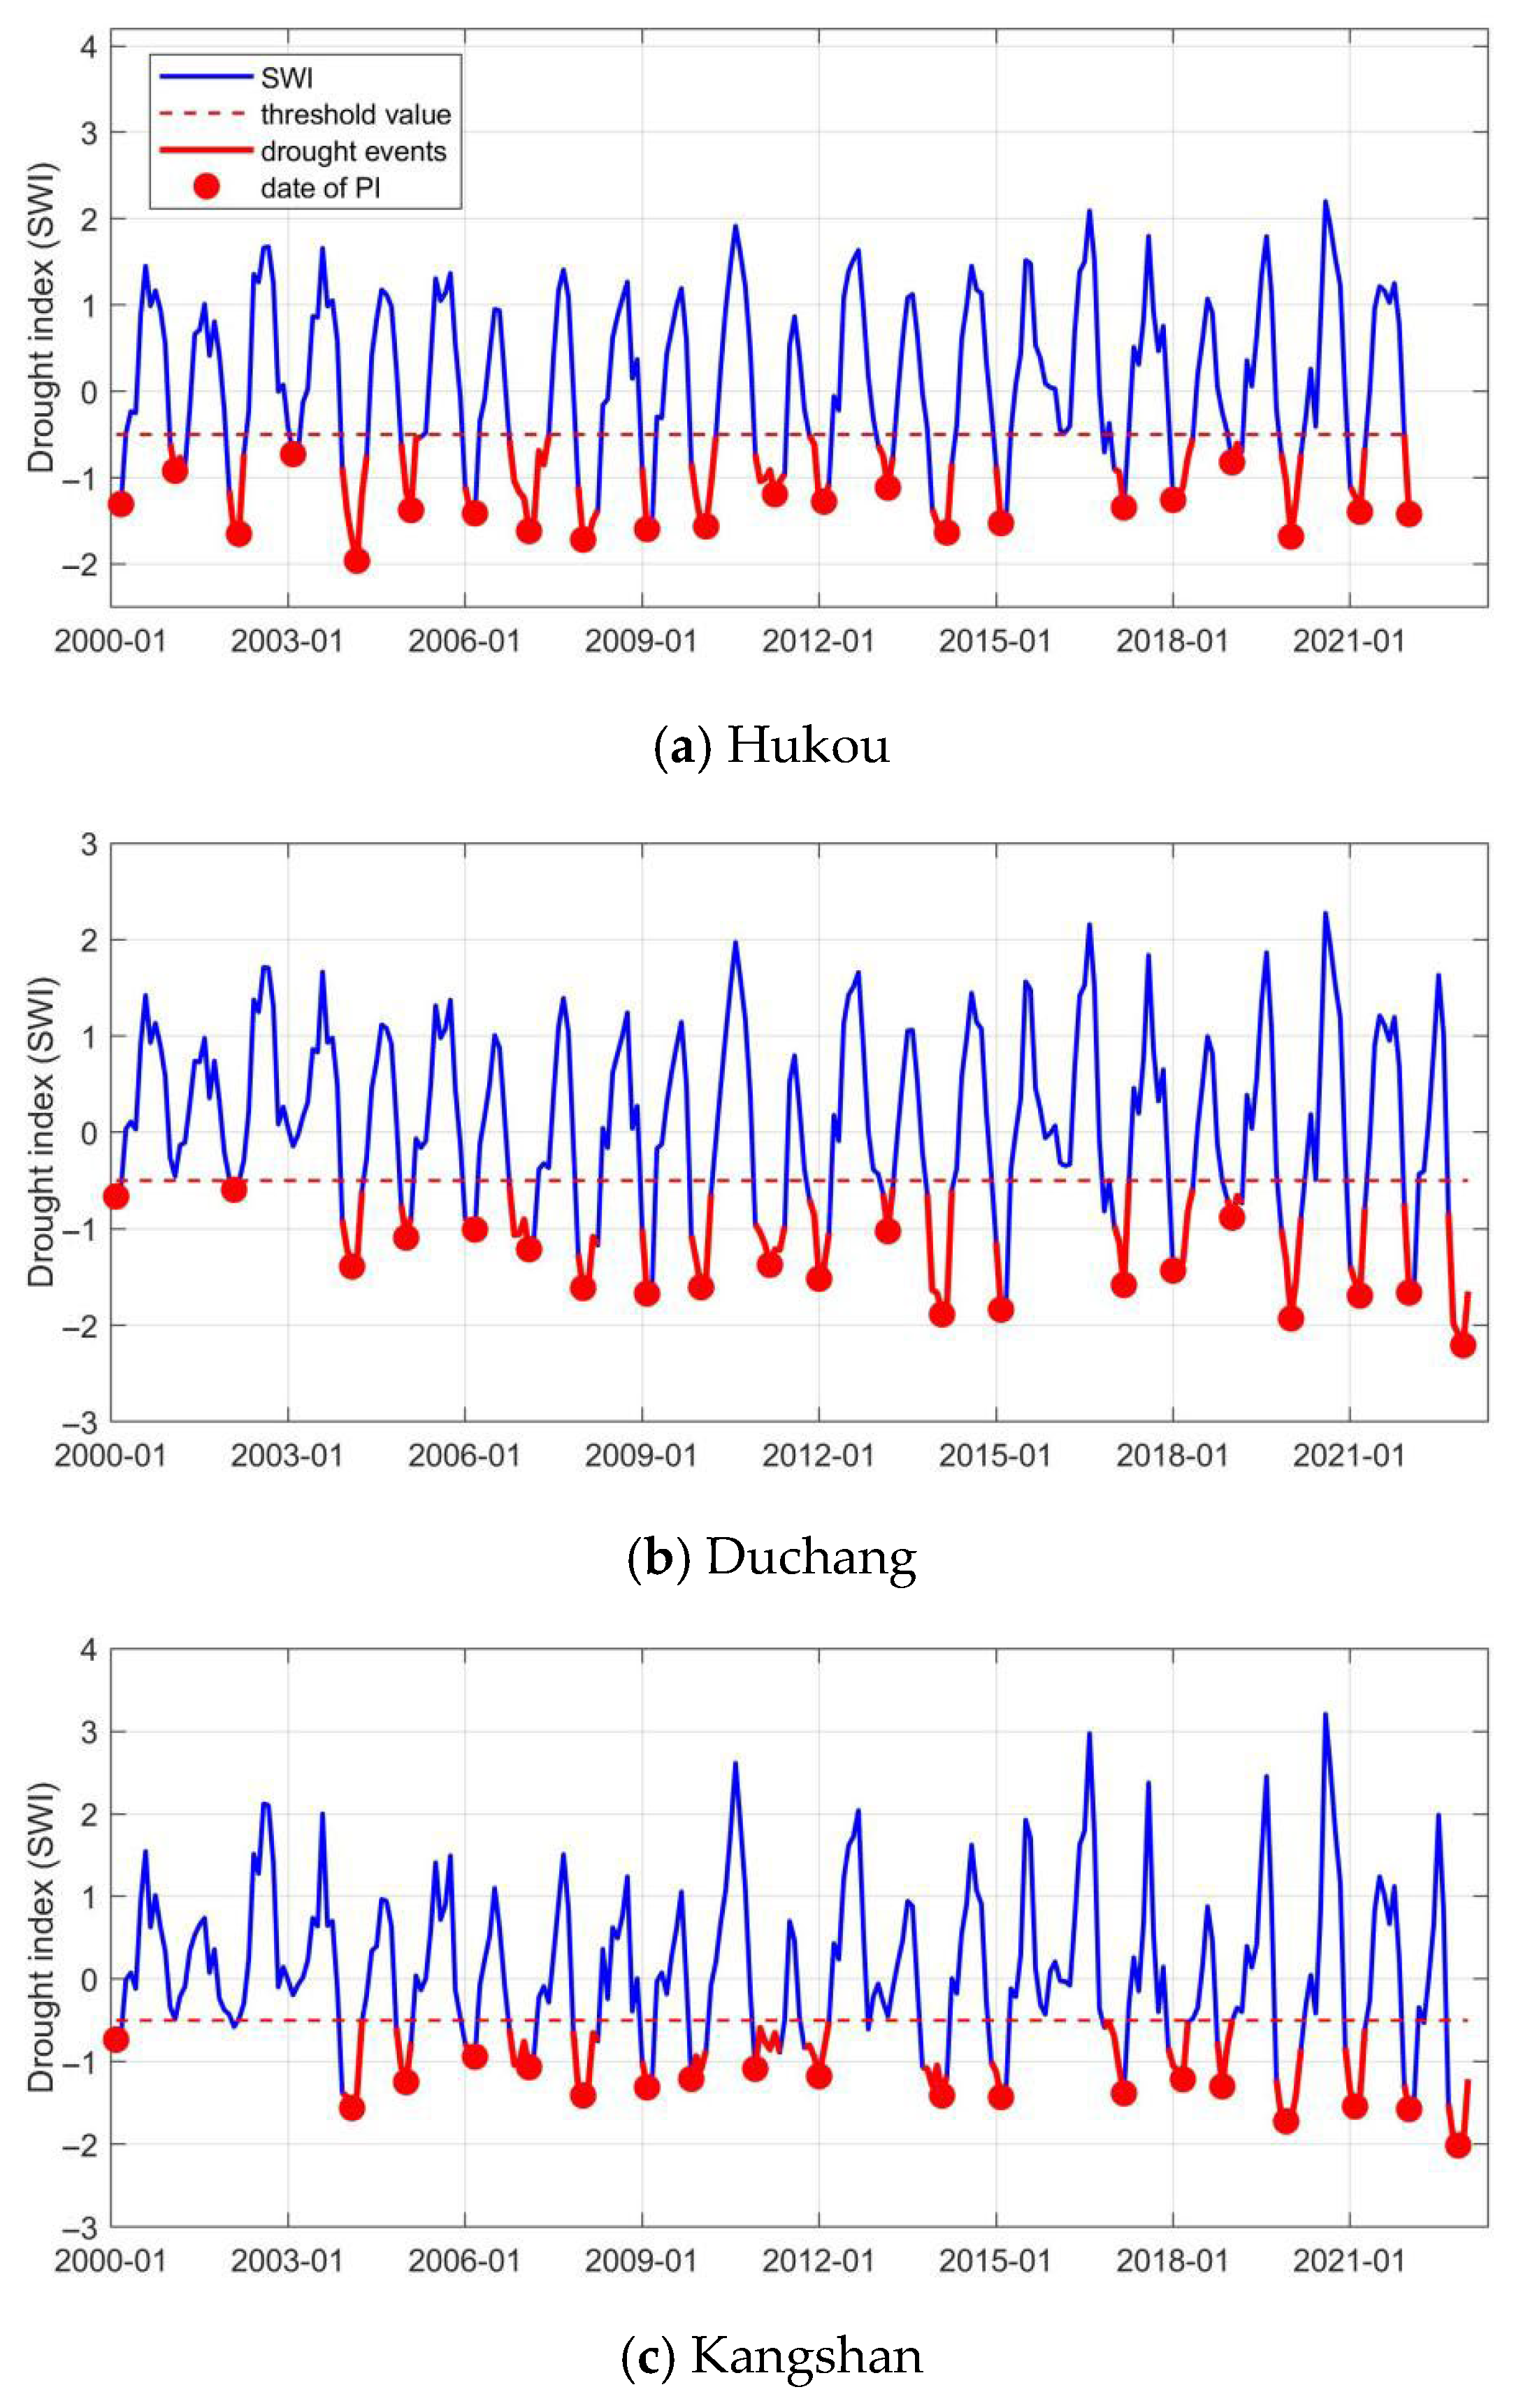
Hydrological drought events in Poyang Lake were identified using SWI by the run theory method (Figure 2). Subsequently, key drought characteristics, including duration, frequency, severity, peak intensity, DDP and DRP, were derived for the Hukou, Duchang and Kangshan stations, as summarized in Figure 3.
Figure 3.
Results for time series of SWI.
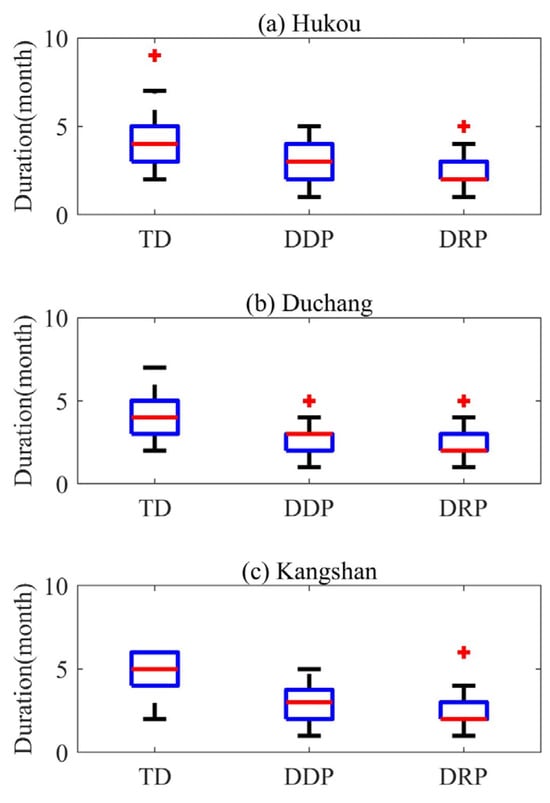
At Hukou Station, a total of twenty-two drought events were detected, corresponding to an average frequency of 1 event per year. The mean severity was 4.70, the average drought peak intensity reached 0.74, and the average duration was 4.32 months. In terms of different stages of drought events, the mean DDP lasted 2.82 months, while the mean DRP was 2.50 months. The most intense drought (drought peak intensity = 1.96) occurred in February 2004 and persisted for 6 months. The longest and most severe event (9.19) extended from September 2006 to May 2007, spanning for 9 months.
At Duchang Station, a total of twenty-one drought events were recorded, with an average frequency of 0.91 times/year. The mean severity, peak intensity, and duration were 4.89, 0.74, and 4.19 months, respectively. The average DDP and DRP were 2.62 months and 2.57 months. The most intense drought (drought peak intensity = 2.21) occurred in November 2022 and also exhibited the highest severity (8.76). This event lasted 5 months, from August to December 2022. The longest event extended from November 2010 to May 2011, lasting 7 months.
At Kangshan Station, a total of nineteen drought events were detected, with an average frequency of 0.83 times/year. The mean severity reached 4.98, the mean peak intensity was 0.75, and the mean duration was 4.63 months. The average DDP and DRP were 2.95 months and 2.68 months. The most intense drought (drought peak intensity = 2.01) occurred in October 2022 and recorded the highest severity (8.67). It persisted for 5 months, from August to December 2022. Six events tied for the longest duration (6 months each), occurring from September 2006 to February 2007, October 2007 to March 2008, November 2010 to April 2011, September 2011 to February 2012, September 2013 to February 2014, and September 2019 to February 2020.
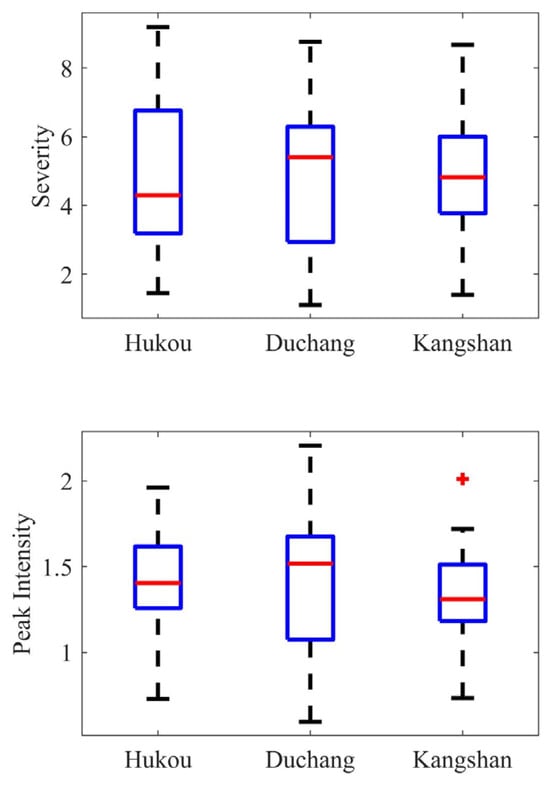
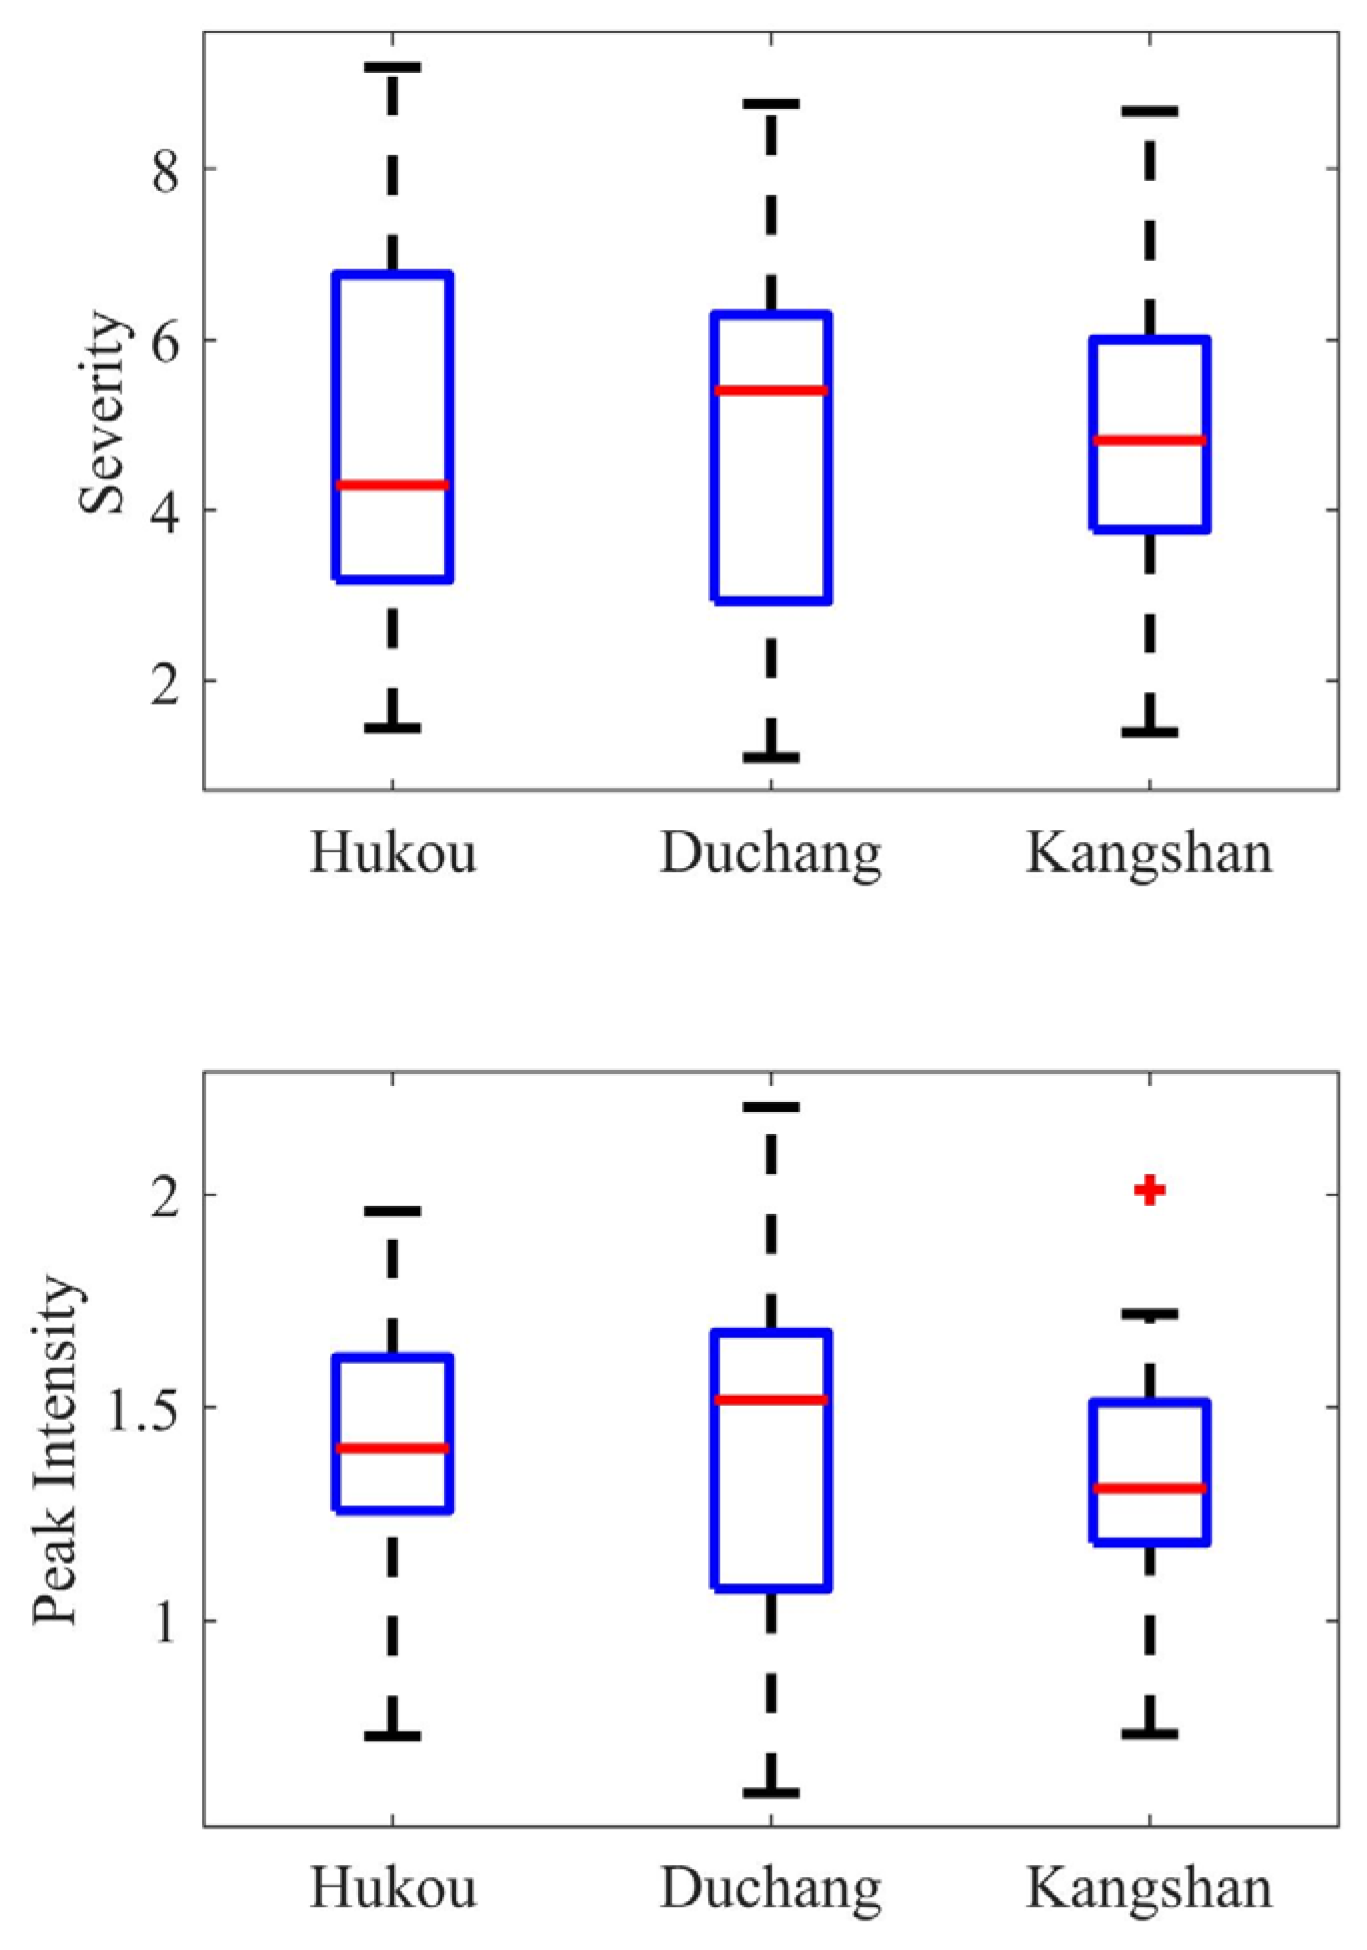
Figure 4 and Figure 5 present the results of the drought characteristics based on SWI. The three stations of Hukou, Duchang, and Kangshan in Poyang Lake frequently experience water deficits, with nearly one drought event occurring each year. The timing of the highest drought peak intensity differs among the stations, indicating that the peak intensity of droughts is not synchronized spatially. Notably, both Duchang and Kangshan stations recorded their most severe droughts with the highest peak intensity and severity in 2022, highlighting the pronounced impact on the southern part of Poyang Lake in that year. Regarding duration, Hukou Station experienced the longest event, lasting 9 months, while Kangshan Station had multiple events lasting for 6 months, reflecting relatively high frequencies. Although Kangshan Station recorded fewer drought events overall, it exhibited the highest mean severity (4.98), the longest mean duration (4.63 months), and the lengthiest mean development and recovery periods, suggesting more prolonged and intense drought process. These findings reveal significant spatio-temporal heterogeneity in drought characteristics across Poyang Lake.
Figure 4.
Drought characteristics of severity and peak intensity. The red line represents the median value. The bottom and the top of the boxes represent the 25th percentile and 75th percentile, respectively. Error bars below and above the boxes represent the 10th and 90th percentiles, respectively.
Figure 5.
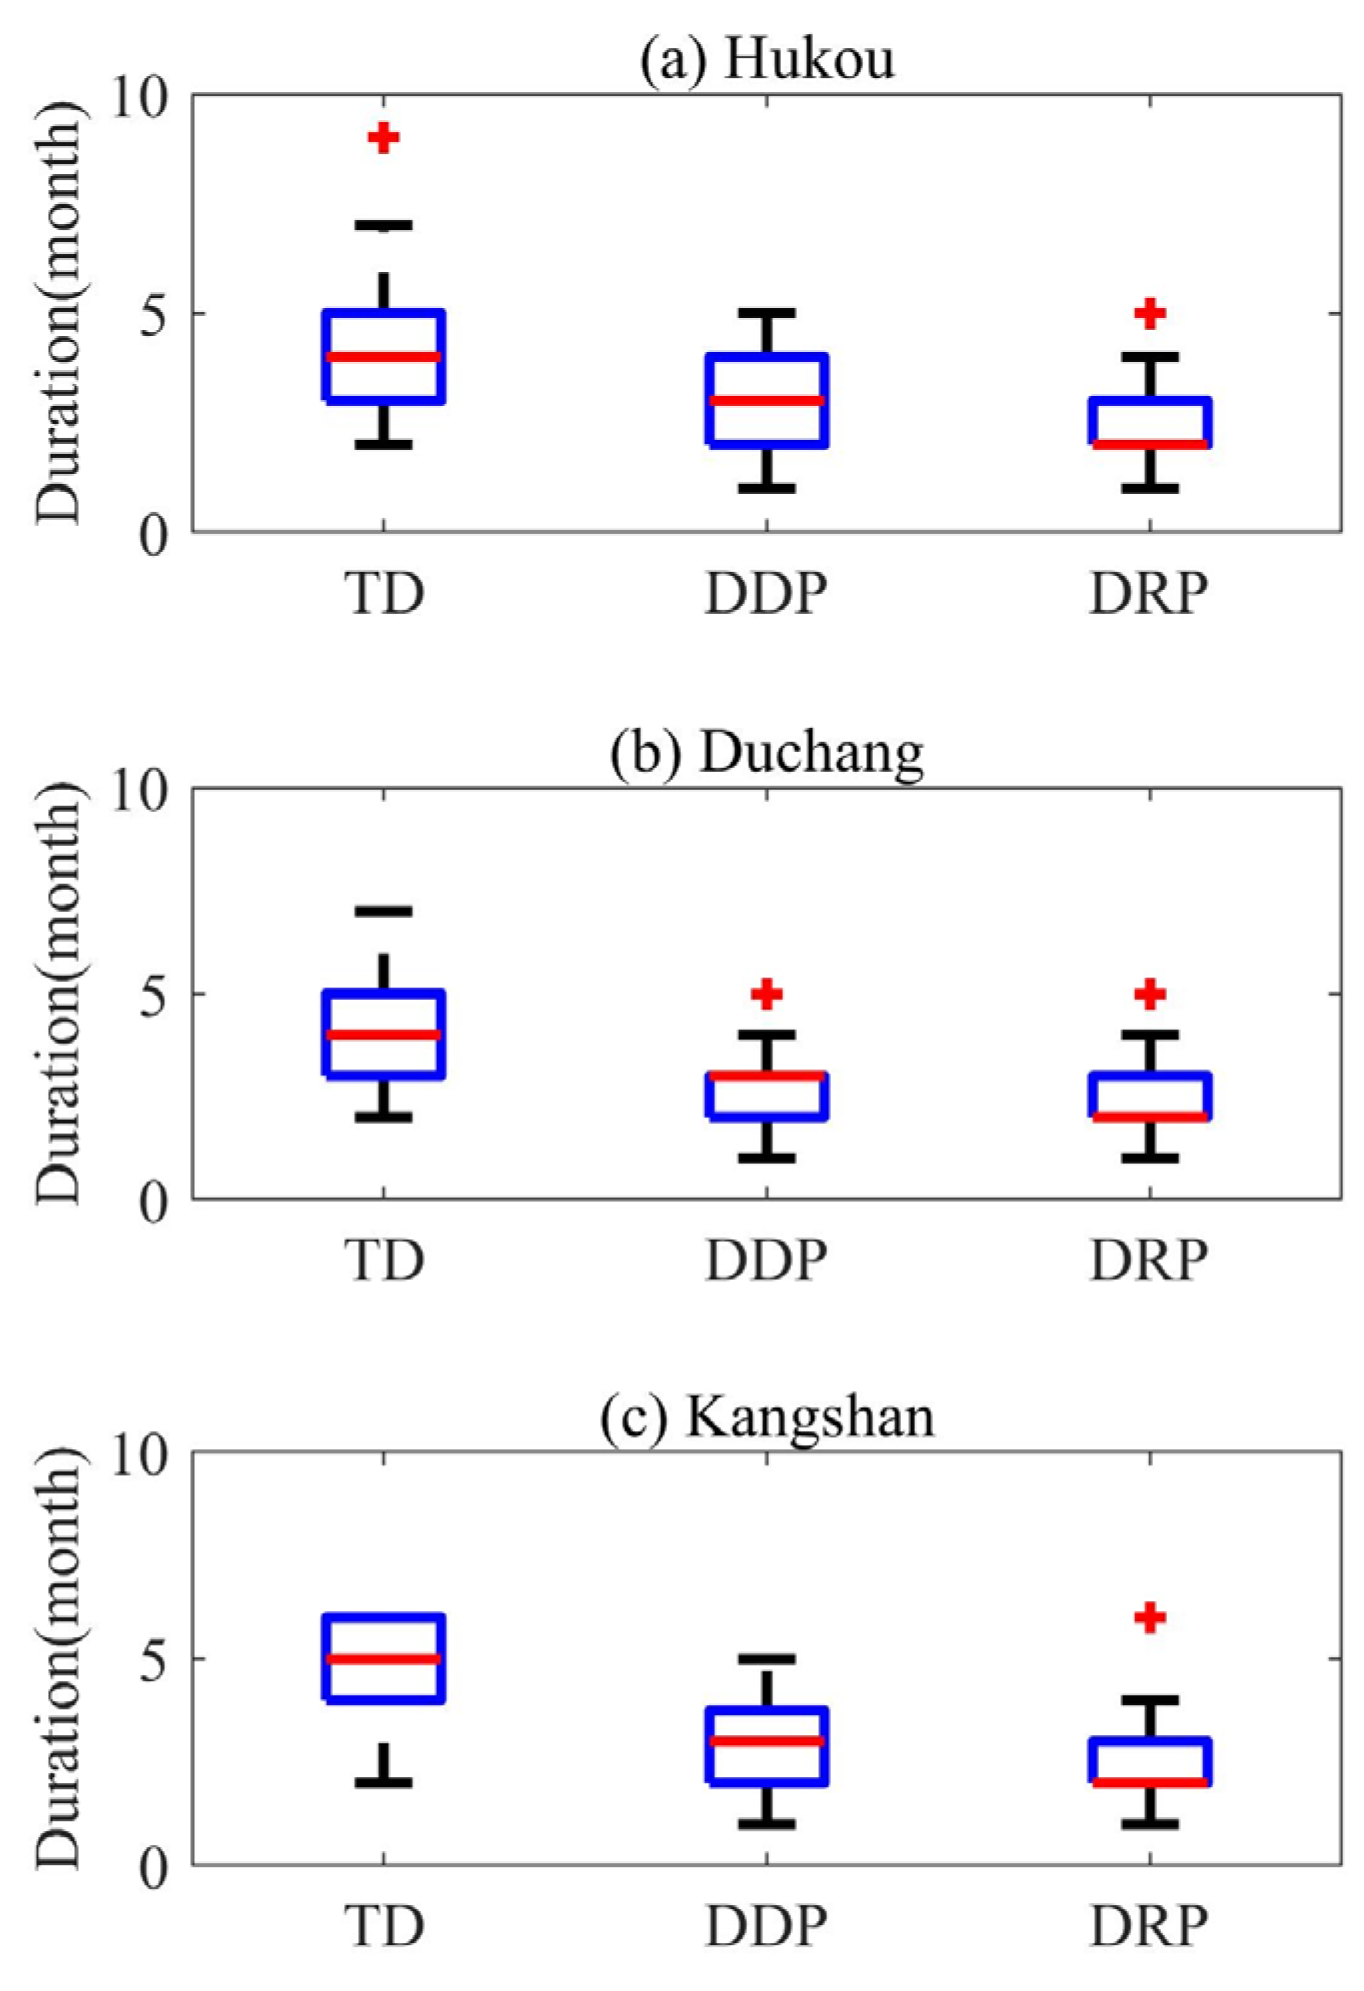
Drought characteristics of duration. The explanations for red lines, blue boxes and error bars refer to Figure 4.
Overall, development periods in Poyang Lake tend to be longer than recovery periods (Figure 5). This pattern aligns with findings from other regions, such as the Dongjiang River Basin in southern China and the Glan River Basin in southwestern Germany [40]. Consequently, it is essential to consider drought development and recovery stages separately in analysis and management.
3.2. Spatial and Temporal Variation Characteristics of Water Quality from 2000 to 2022
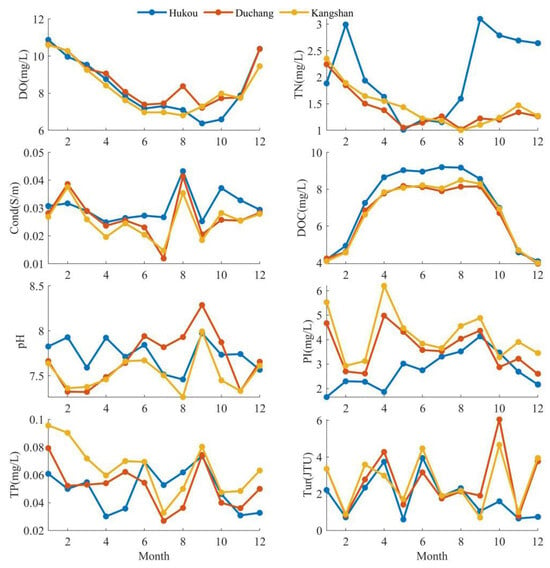
Figure 6 illustrates the monthly average variations in eight water quality indicators at the Hukou, Duchang, and Kangshan stations in Poyang Lake. Table 1 gives the mean values of water quality indicators at Hukou, Duchang and Kangshan Stations in Poyang Lake.
Figure 6.
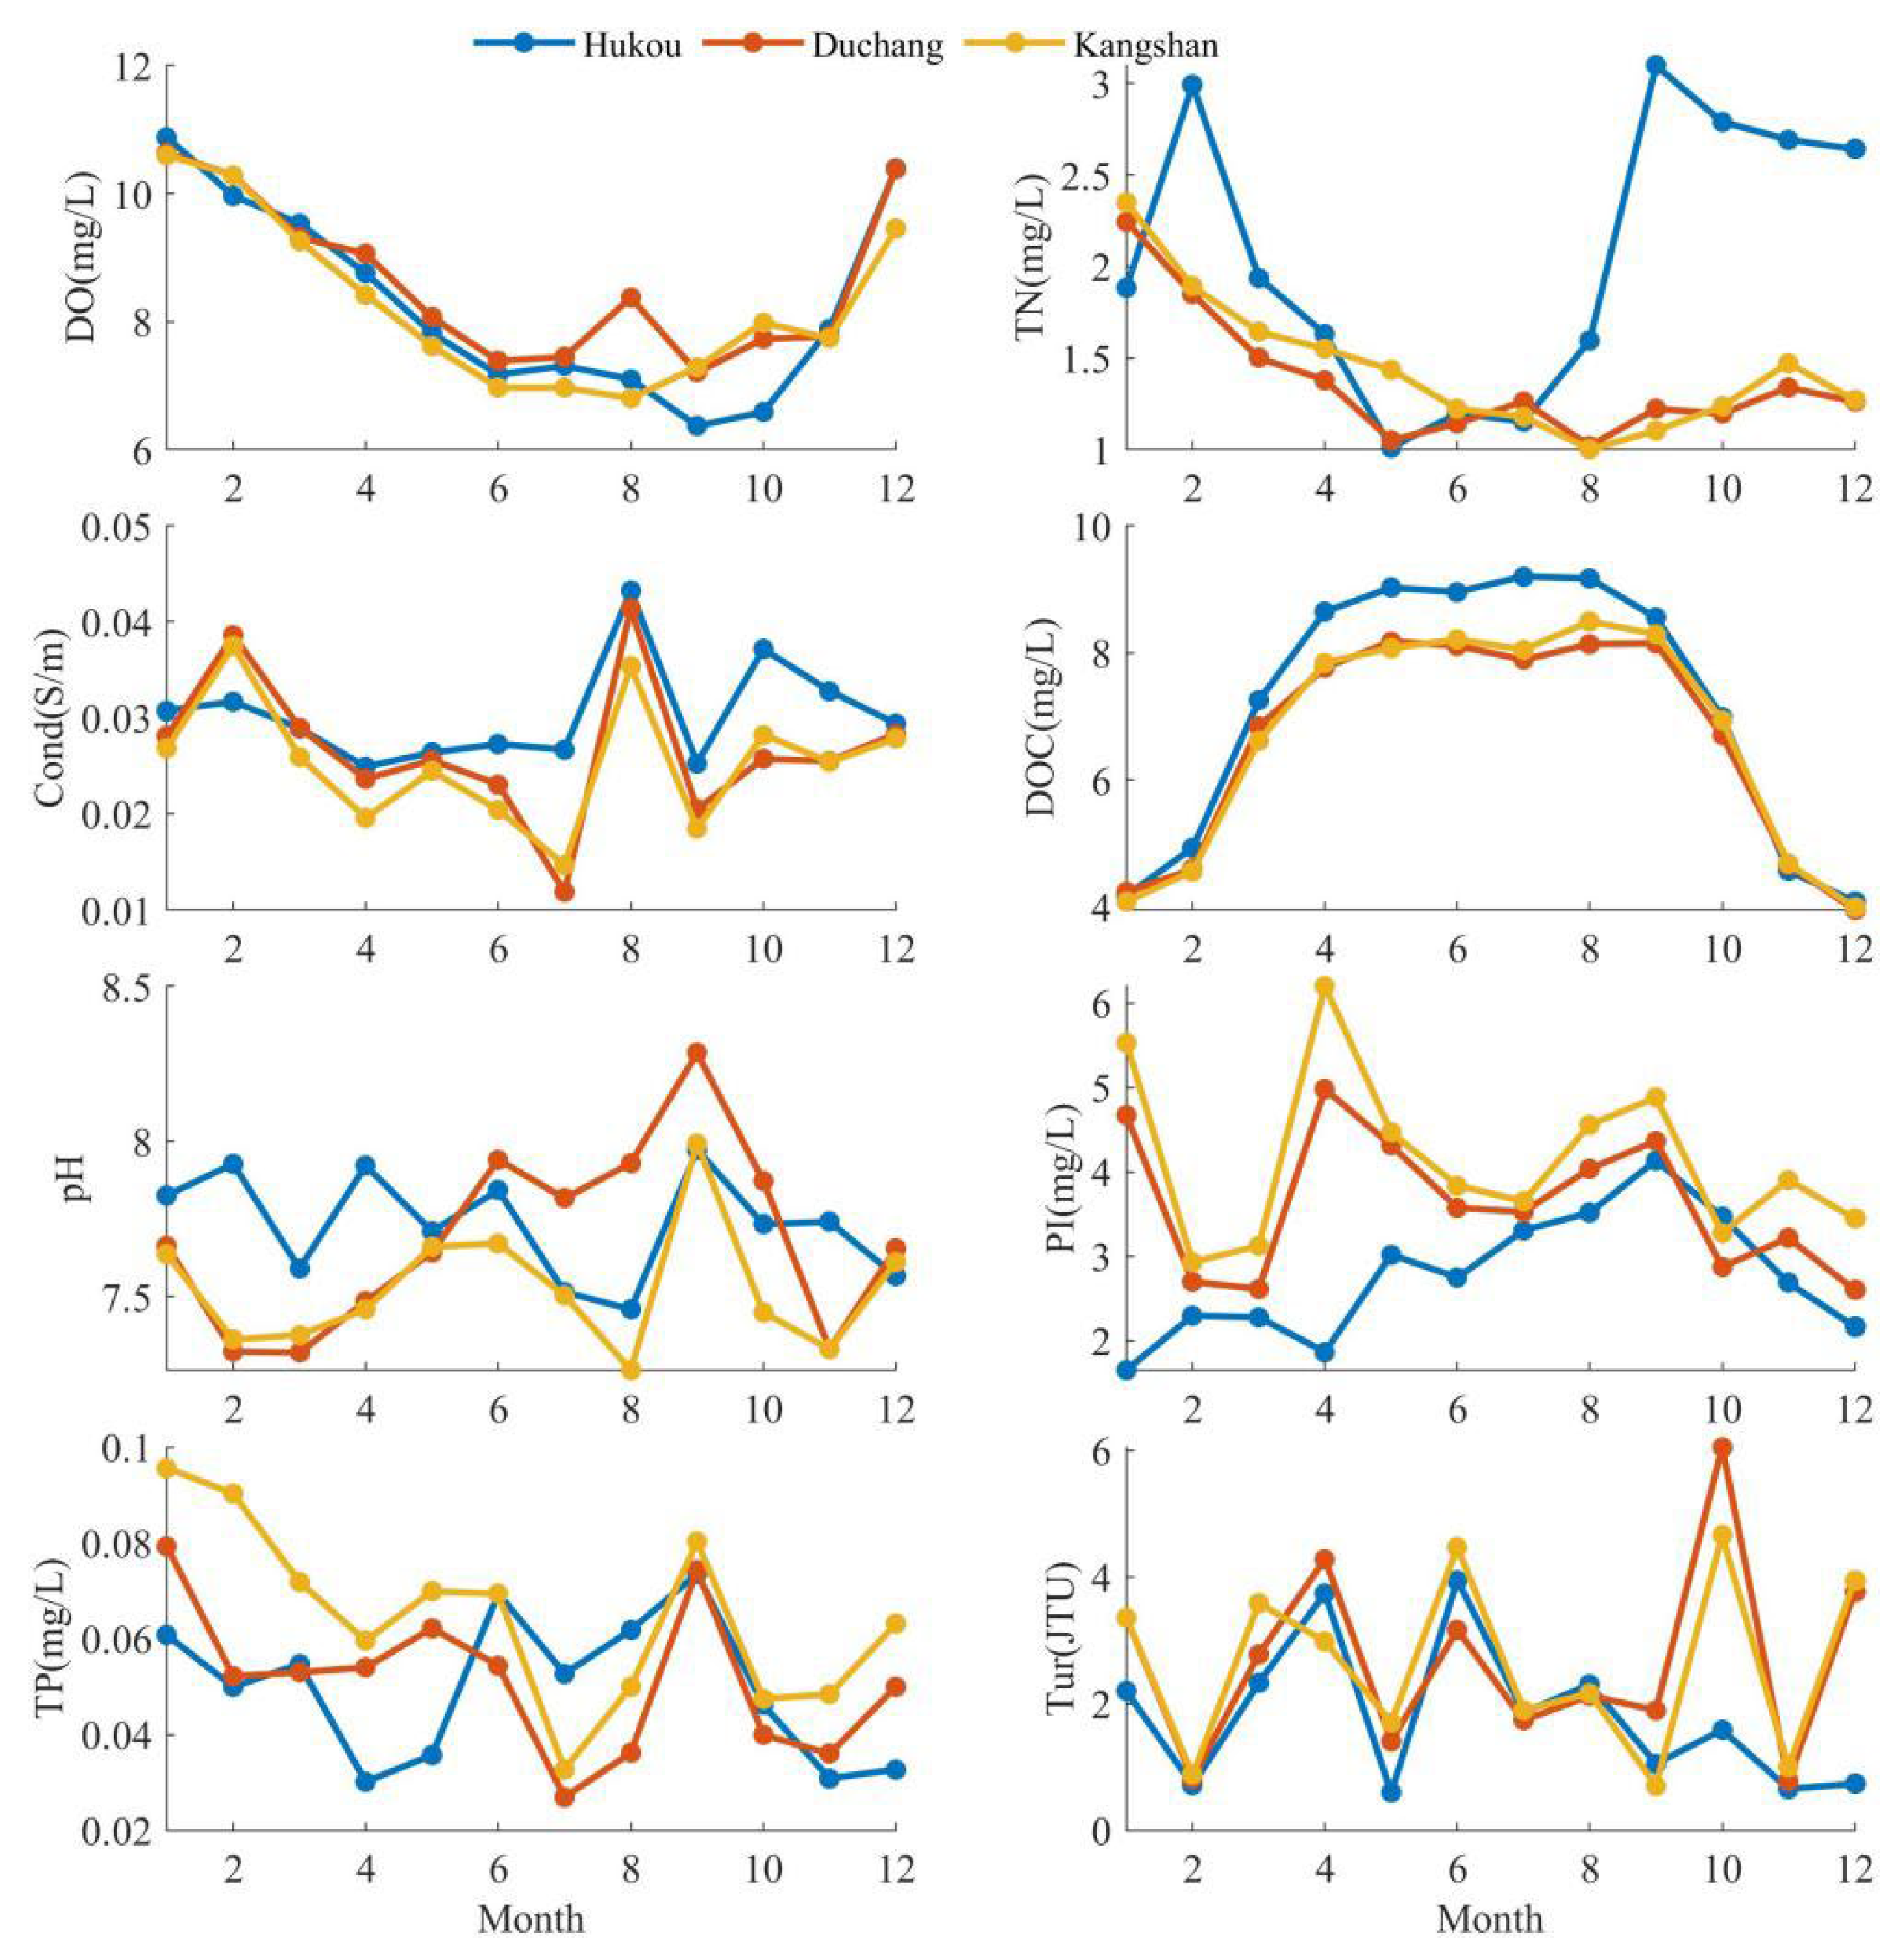
Variation trends in monthly average values of water quality indicators. Full names of abbreviations: DO—Dissolved Oxygen, TN—Total Nitrogen, Cond—Conductivity, DOC—Dissolved Organic Carbon, PI—Permanganate Index, TP—Total Phosphorus, and Tur—Turbidity.
DO exhibited a strong seasonal pattern across all stations, with significantly lower values during the wet season and higher values in the dry season. Concentrations peaked (>10 mg/L) between December and January, and dropped to their lowest levels (6.4–7.7 mg/L) from September to October. This result reflects the combined influence of temperature and biological respiration. During the warm wet season, elevated temperatures and intense biological activity increase oxygen consumption, whereas colder conditions in the dry (winter) season reduce metabolic demand.
DOC also displayed a strong seasonal pattern. Values at the three stations were significantly higher in the wet season, rising sharply from March and remaining high (>8 mg/L) from May to August. During the dry season, DOC declined to lower levels, reaching a minimum of 4 mg/L between October and December. This trend parallels seasonal runoff variation, as increasing rainfall from March. Hukou Station showed the highest and most prolonged peak in spring, suggesting it serves as the primary pathway for terrestrial organic carbon inputs into the lake.
TN at Duchang and Kangshan stations decreased gradually from January to December. In contrast, TN at Hukou Station fluctuated markedly, with lower values from April to August and higher concentrations in February and after September, indicating a possible concentrated nitrogen inputs during autumn.
TP showed a gradually decreasing trend throughout the year. Conductivity exhibited a bimodal pattern, with peaks in August and February. The summer peak likely reflects concentration by evaporation, while the smaller winter peak may be associated with higher salt concentrations under low water levels. pH remained weakly alkaline, with the highest value of 8.28 recorded at Duchang station in September. Permanganate index and turbidity varied considerably intra-annually with less distinct seasonal regularity, respectively, reaching maximum values in April and October.
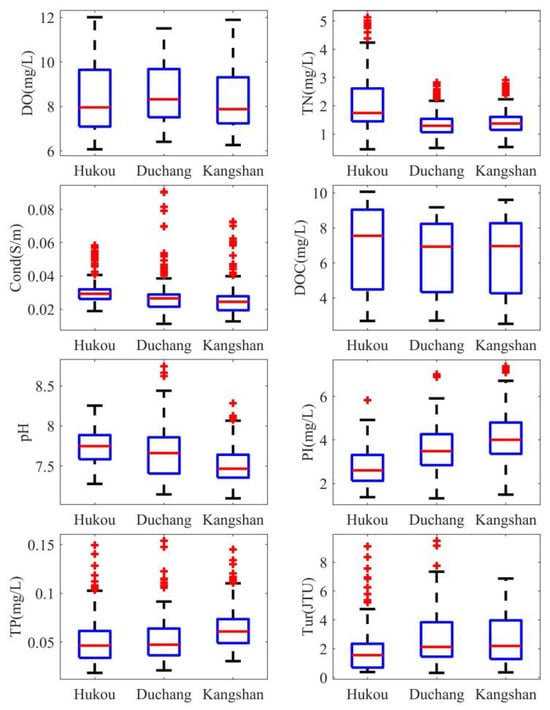
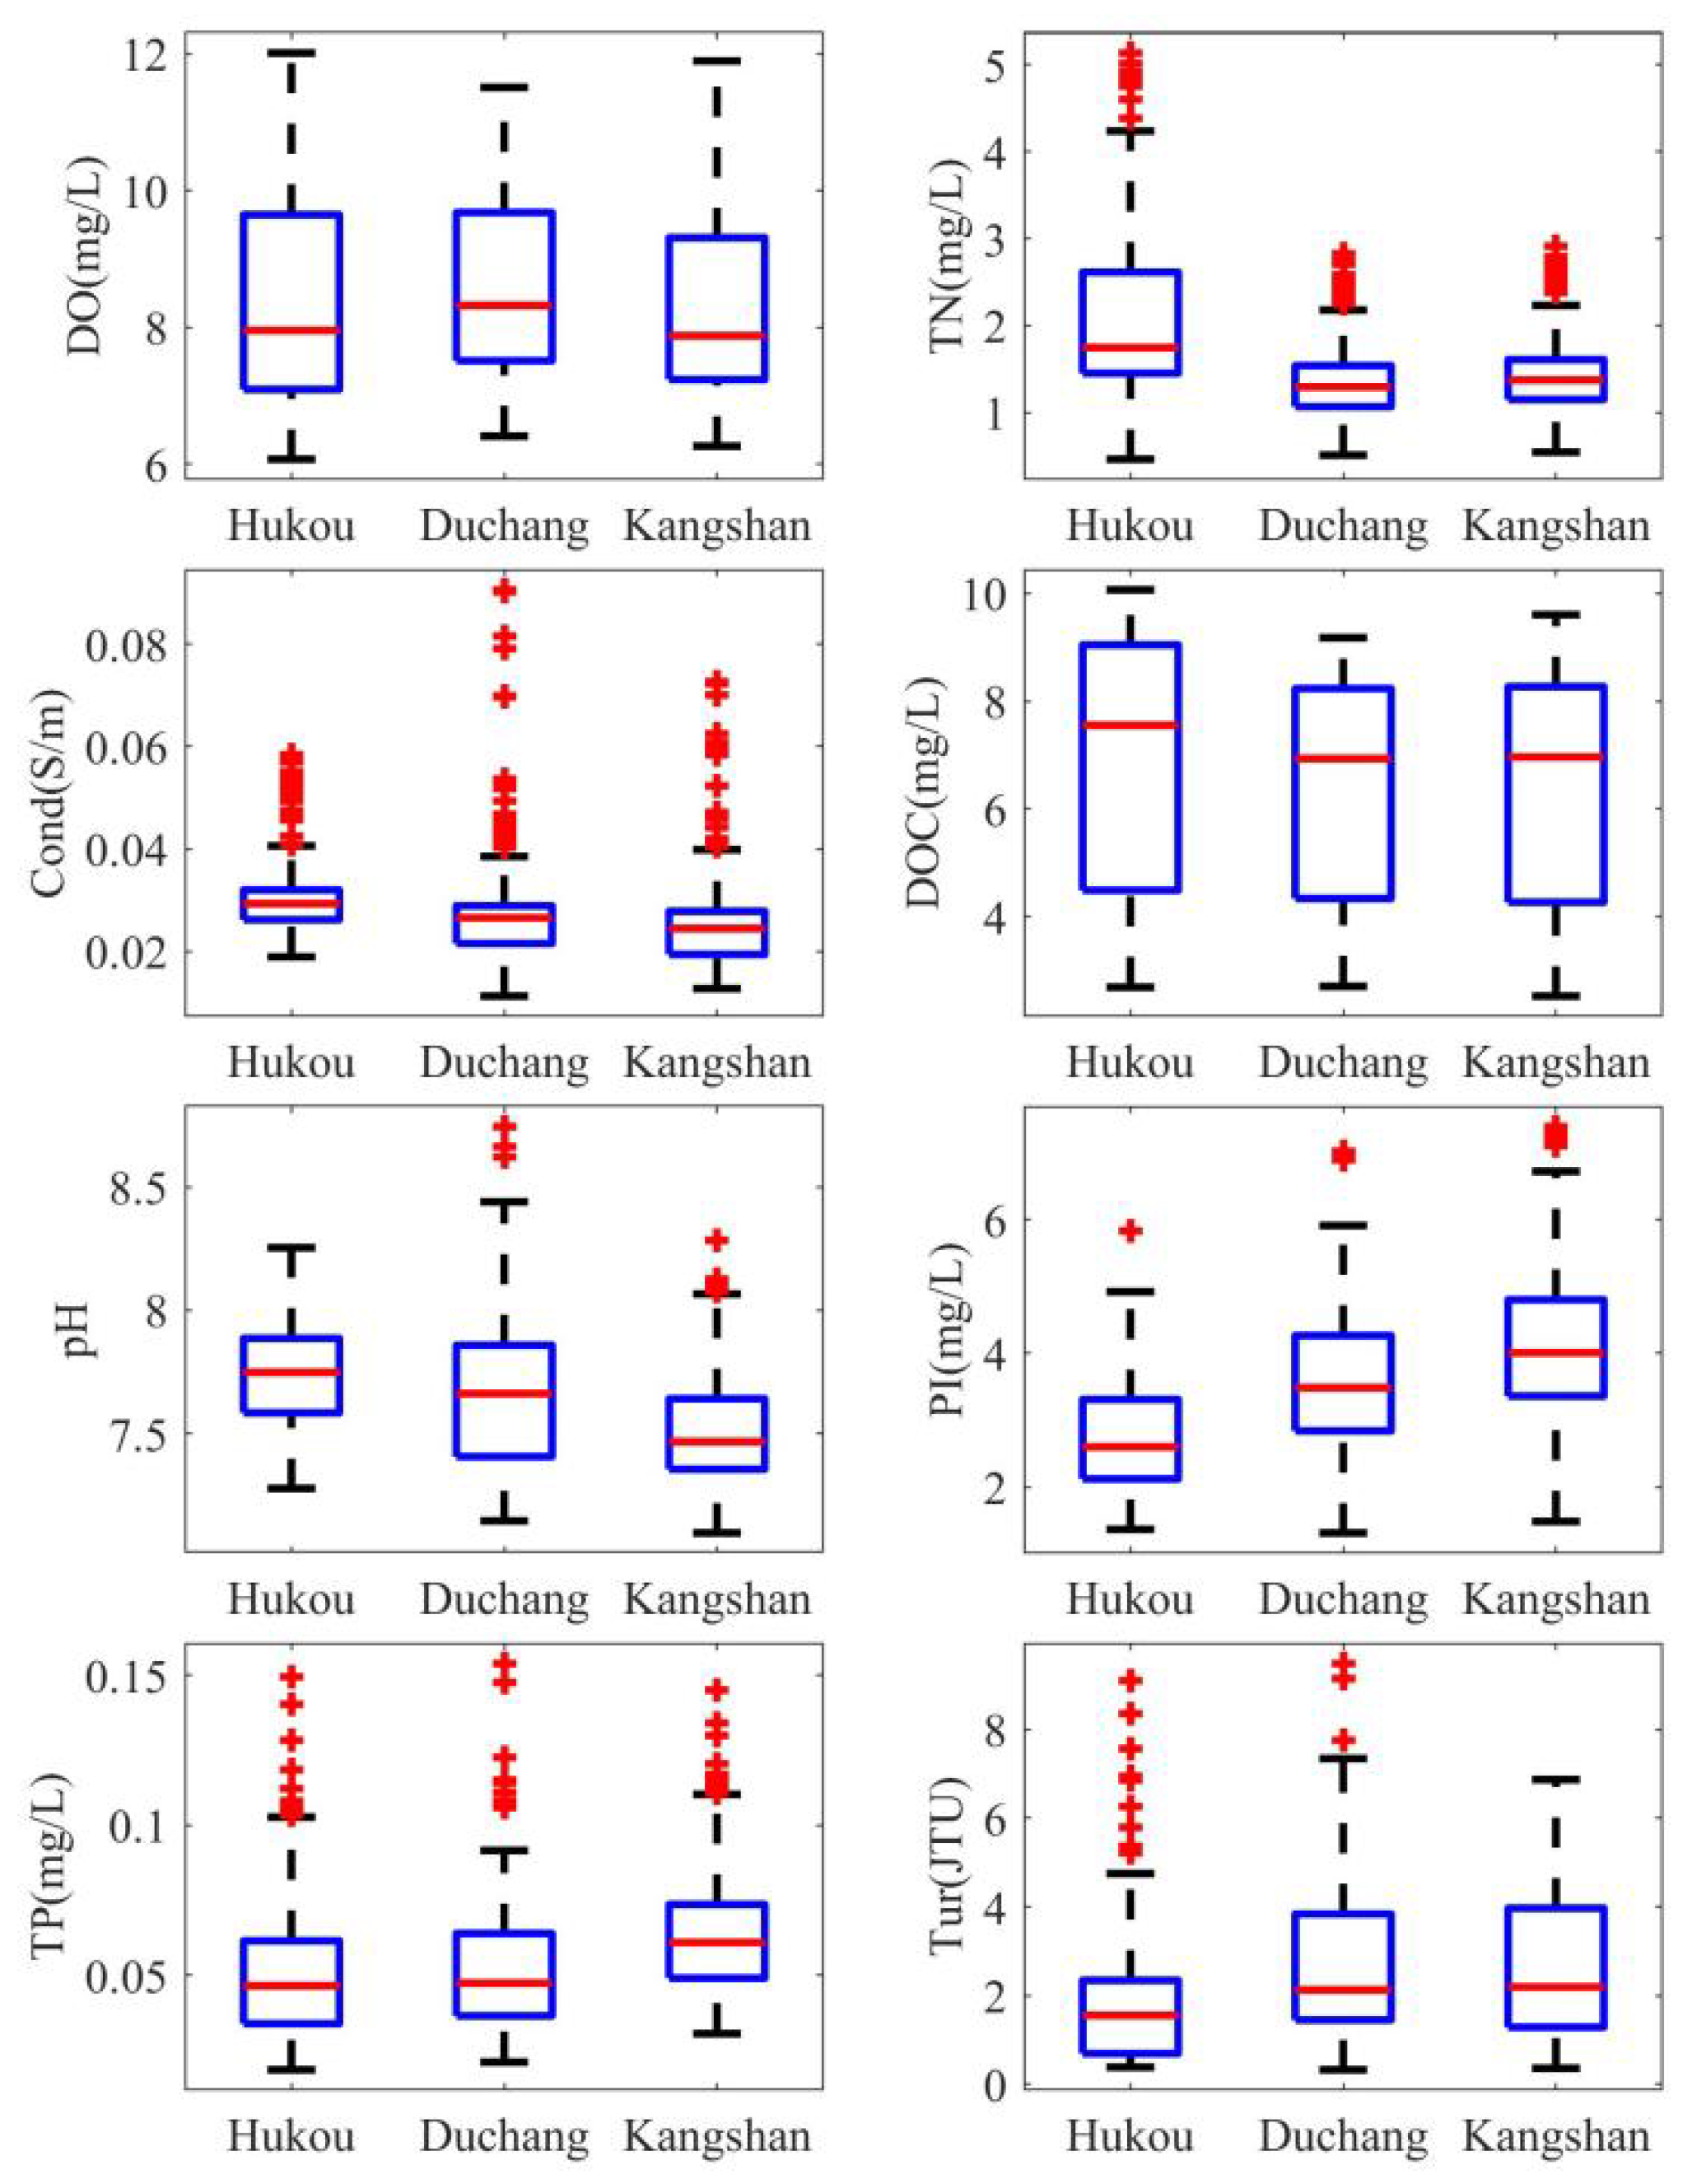
Figure 7 displayed boxplot results for eight water quality indicators at the Hukou, Duchang, and Kangshan stations in Poyang Lake. Spatial variations in key parameters were evident. Hukou Station exhibited relatively high pH and conductivity, but a low permanganate index. Conversely, Kangshan Station showed lower pH alongside elevated permanganate index and TP levels. TN concentrations were both higher and more broadly distributed at Hukou Station. The median values and distribution ranges of DO and DOC were highly consistent among all three stations. This uniformity suggested that these parameters were primarily regulated by regional common factors, such as temperature and background organic matter inputs, with minimal spatial differentiation. In contrast, permanganate index and turbidity exhibited a cumulative pattern from Hukou to Kangshan, characterized by increasing median values and widening distribution ranges. TP was marked by frequent extreme high values at all stations, emphasizing a strong influence from intermittent, intense inputs (e.g., runoff, pollutant discharges) and identifying it as a key variable pollution indicator. Notably, extreme turbidity values are concentrated at Hukou Station, likely linked to localized, episodic soil erosion events.
3.3. Comparison of Water Quality Indicators Between the Development and Recovery Period
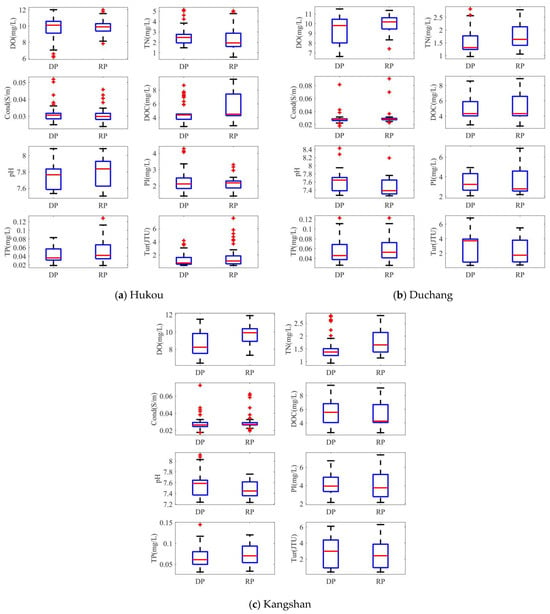
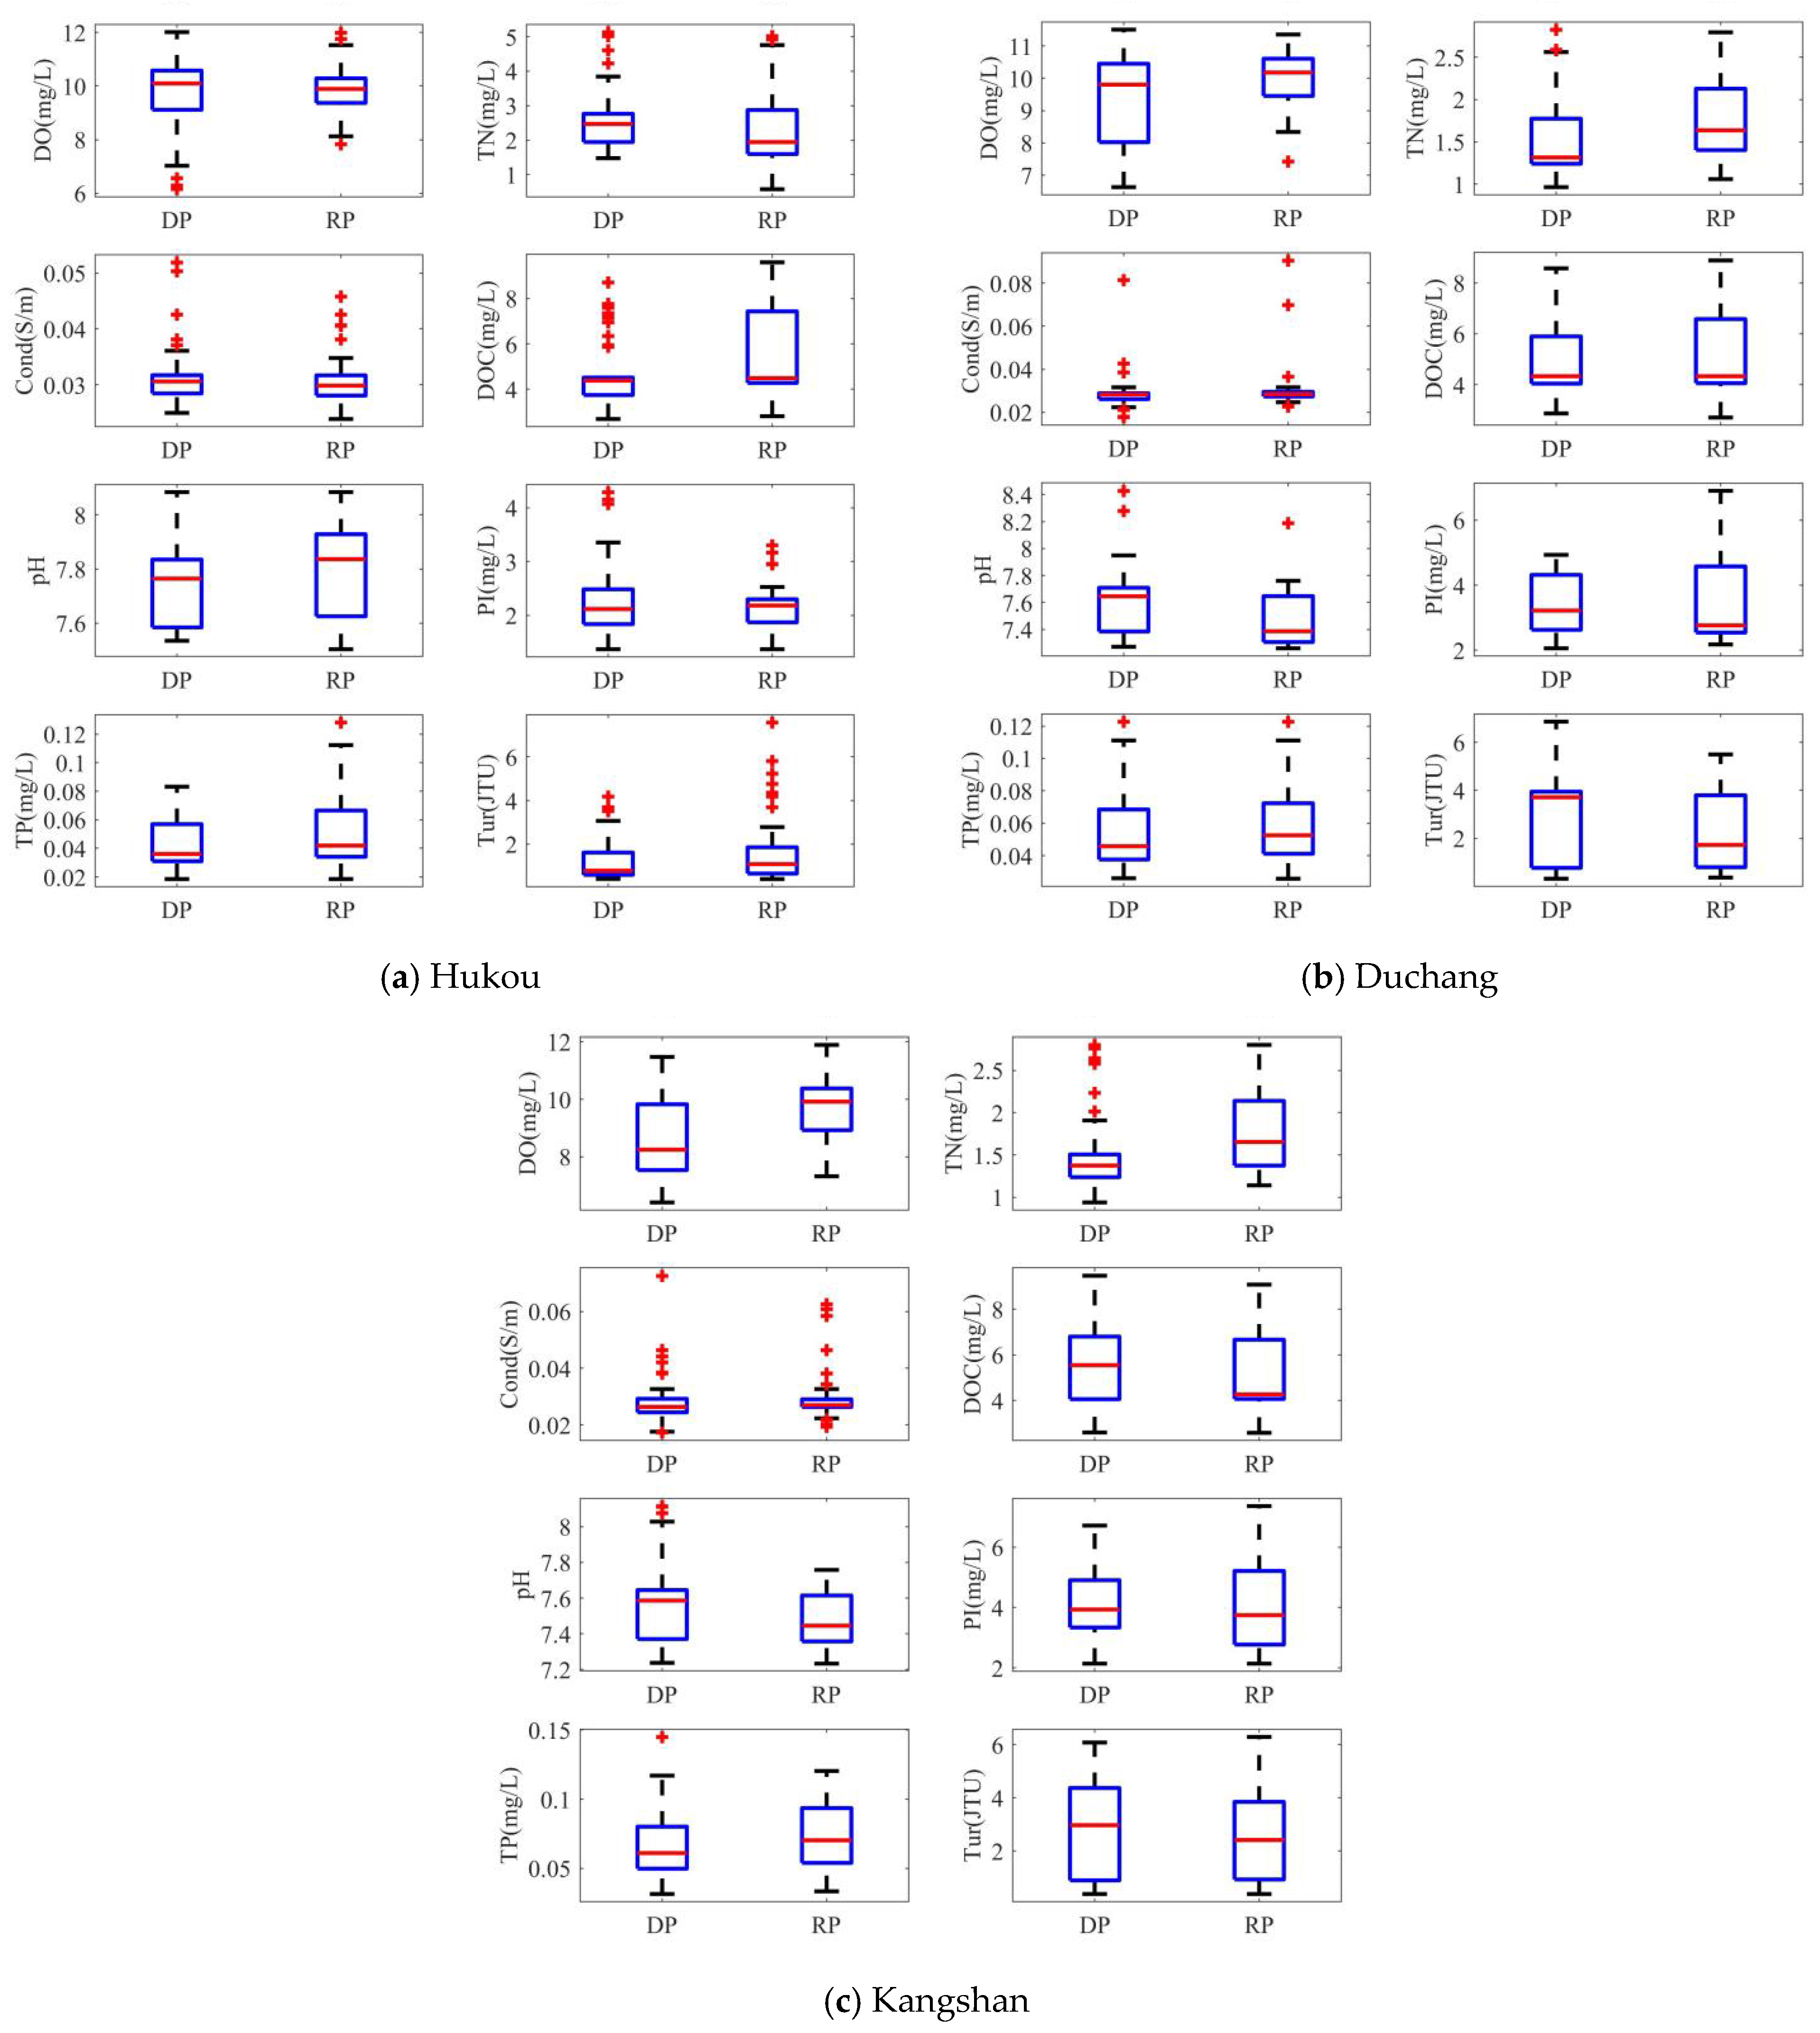
Figure 8 shows the monthly hydrological indicators (water level and LWST) and water quality indicators, including DO, TN, conductivity, DOC, pH, permanganate index, TP, and turbidity, during the development and recovery periods of drought events from 2000 to 2023 at the Houkou, Duchang, Kangshan stations in Poyang Lake. It is obvious that the DO values at all three stations were more concentrated during recovery periods, whereas TN values showed greater concentration during development periods, indicating that water quality variation was relatively limited in these respective stages. Across both periods, the distributions of permanganate index and turbidity were more concentrated at Hukou Station compared to Duchang and Kangshan.
Figure 8.
Boxplot for water quality indicators in the development and recovery periods. Full names of abbreviations: DP—drought development period and RP—drought recovery period. For other abbreviations in this figure, refer to Figure 6. The explanations for red lines, blue boxes and error bars refer to Figure 4.
DOC values at Hukou station were lower and less variable during development periods than recovery periods. This result can be attributed to significantly reduced runoff during drought development, which limited DOC primarily to endogenous release, resulting in lower and more uniform concentrations. In contrast, during recovery, the input of terrestrial organic carbon brought by runoff exhibited spatial and temporal heterogeneity, leading to higher DOC concentrations and a wider range of variability.
Further analysis of the mean values of various water quality indicators revealed that DO and TP values at all three stations were consistently lower during drought development than drought recovery. The lower DO levels during development periods likely resulted from the combined effect of warming and enhanced biological activity (reduced oxygen production coupled with increased consumption). The high TP during recovery periods was primarily associated with external runoff inputs and sediment resuspension. Moreover, the trends for most water quality indicators were highly consistent between the development and recovery periods at both Duchang and Kangshan stations.
Previous studies have demonstrated that drought events can reduce lake storage and concentrate pollutants, thereby deteriorating water quality [16], while intensive post-drought rainfall events usually trigger pronounced first-flush effects [24]. Consequently, water quality during hydrological recovery does not exhibit a simple linear reversal to pre-drought conditions, but shows distinctive dynamics and obvious hysteretic characteristics [48]. Although these general patterns have been widely recognized, the stage-specific evolution characteristics of water quality during drought development and recovery periods, and their quantitative linkages with hydrological indices, have not been systematically explored, especially for large river-connected floodplain lakes. In this study, differences in key water quality indicators were detected between the two drought stages, which further elucidates the non-linear and asynchronous responses of water quality to drought processes in Poyang Lake.
4. Discussion
4.1. The Correlation Analysis for Hydrological and Water Quality Indicators
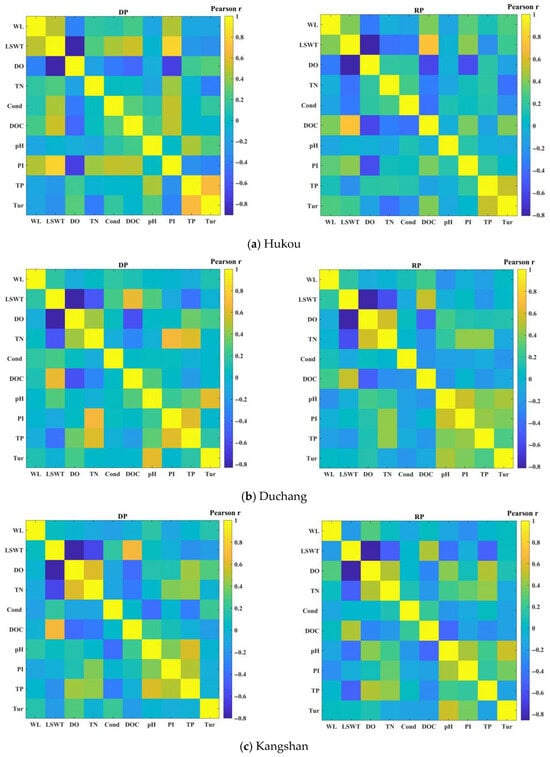
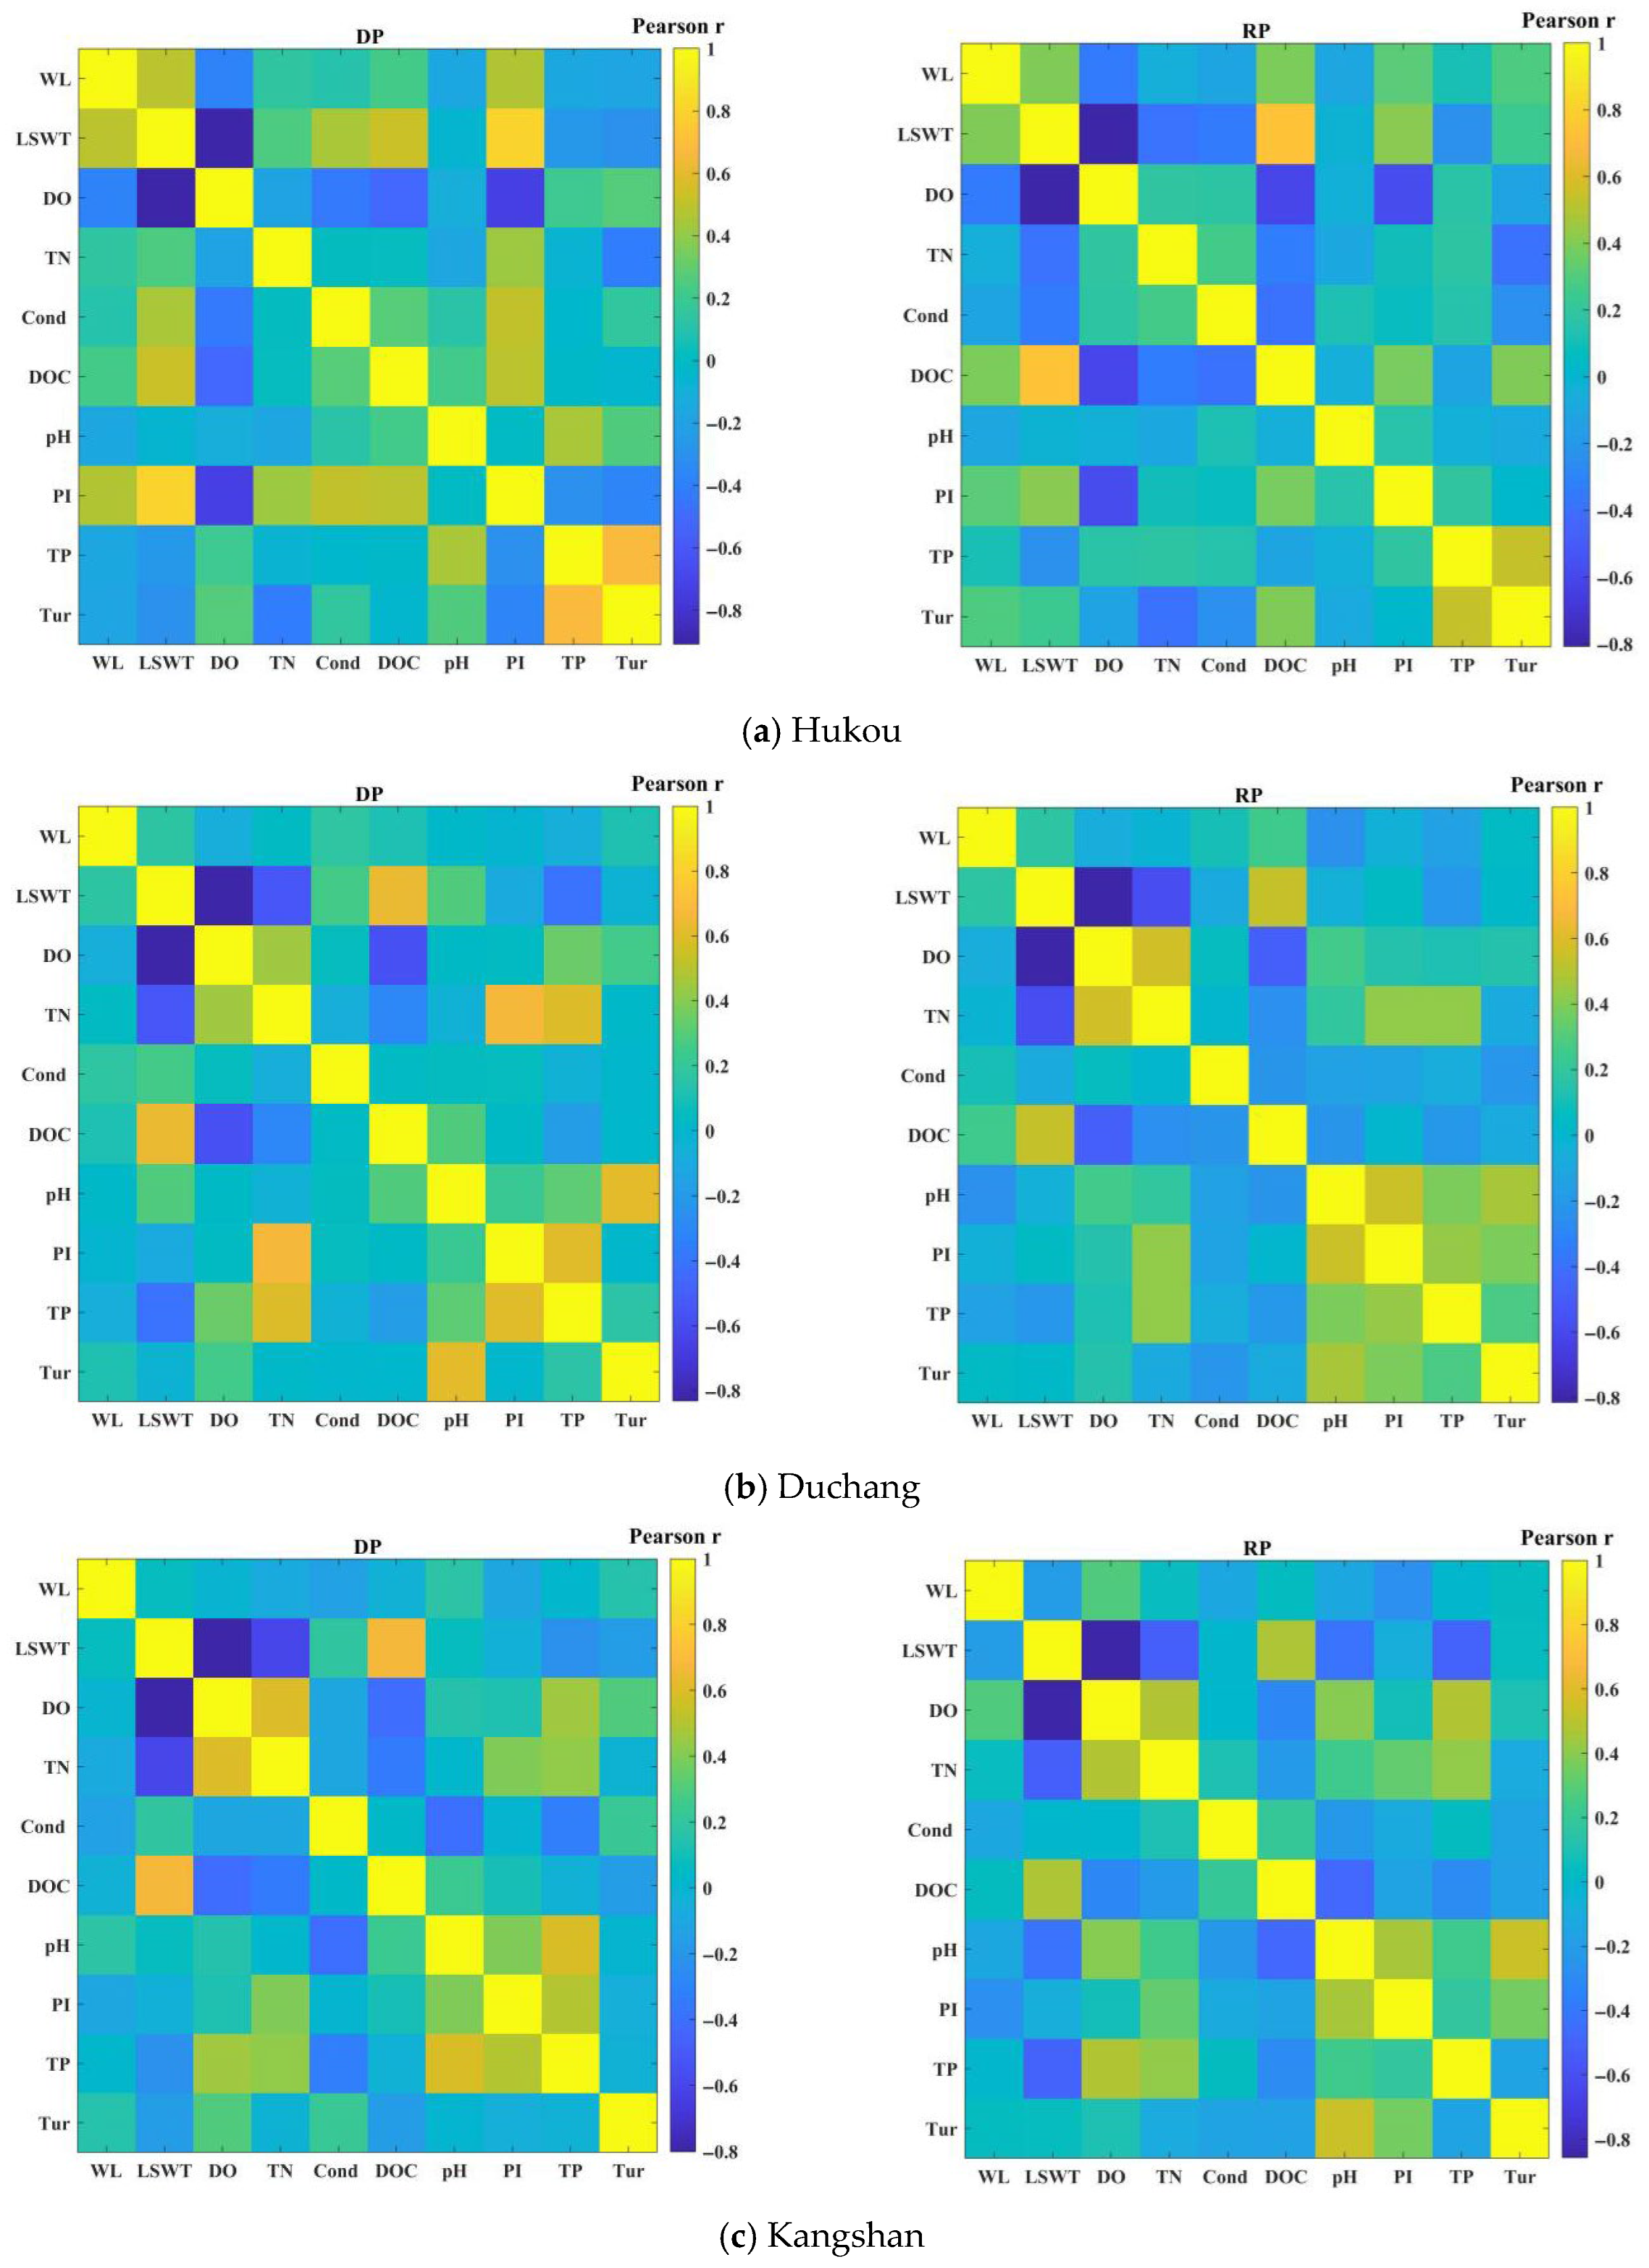
Figure 9 presents the correlations between water levels, LSWT, and various water quality indicators (DO, TN, conductivity, DOC, pH, permanganate index, TP, and turbidity) during drought development and recovery from 2000 to 2022 in Poyang Lake. A consistently strong negative correlation was observed between LSWT and DO across all three stations and both drought periods (R = −0.80 to −0.91, p < 0.01), indicating that rising water temperature significantly reduced dissolved oxygen content.
Figure 9.
Correlation between water level, LSWT and water quality indicators (for abbreviations in this figure, refer to Figure 8).
During the drought development periods, characterized by declining water levels, reduced water volume, and prolonged retention time, correlation patterns differed among stations. At Hukou station, permanganate index showed a significant positive correlation with LSWT (R = 0.81, p < 0.01) and with DO (R = 0.73, p < 0.01), while TP was positively correlated with turbidity (R = 0.67, p < 0.01). At Duchang and Kangshan stations, TN was significantly positively correlated with DO (R = 0.45 to 0.60, p < 0.01), and was also closely associated with permanganate index and TP. Conversely, TN was negatively correlated with LSWT (R = −0.51 to −0.60, p < 0.01), whereas DOC was positively correlated with LSWT (R = 0.63 to 0.67, p < 0.01). TP also showed a positive correlation with permanganate index (R = 0.51 to 0.60, p < 0.01). Additionally, at Duchang station, TN was strongly positively correlated with TP (R = 0.60, p < 0.01) during development periods, suggesting the driving effect of nitrogen on primary productivity. Turbidity was positively correlated with pH (R = 0.61, p < 0.01).
During the drought recovery periods, increased precipitation or inflow raised water levels and altered hydrodynamic conditions. Hukou Station, as the primary outlet connecting Poyang Lake to the Yangtze River, exhibited the strongest hydrological dynamics. It showed more significant correlations between water level and several water quality indicators. For example, the positive correlation between water level and DOC strengthened significantly from R = 0.23 to R = 0.39 during recovery period, indicating that rising water levels broadly influenced water quality. At Hukou station, DOC was positively correlated with LSWT (R = 0.74, p < 0.01), and negatively correlated with DO (R = −0.60, p < 0.01). Moreover, turbidity was significantly positively correlated with TP (R = 0.54~0.67, p < 0.01). This might be related to its geographical location. As the outlet of Poyang lake, Hukou station had more intense flow dynamics and sediment resuspension, resulting in more enhanced interaction between organic matter and particles.
When transitioning from drought development to drought recovery, several correlation shifts were observed. At Hukou station, the relationship between conductivity and LSWT changed from negative (R = −0.34, p < 0.01) to positive (R = −0.45, p < 0.01). At Duchang station, the positive correlation between TN and permanganate index decreased from 0.67 to 0.43, while the correlation between TN and DO increased from 0.45 to 0.57, and that between pH and permanganate index increased from 0.22 to 0.55. At Kangshan station, the negative correlation between TN and LSWT weakened from −0.60 to −0.52, and the positive correlation between pH and permanganate index increased from 0.39 to 0.46.
For TP, a key water quality indicator, its correlations with TN and permanganate index were generally evident during development periods, but weakened in the recovery period at Duchang and Kangshan stations. Conductivity generally showed weak correlations with other water quality indicators, suggesting that it is governed by independent controlling factors.
In summary, the impact of drought events on water quality in Poyang Lake exhibited distinct temporal and spatial heterogeneity. Nitrogen-driven biological processes appeared dominant during drought development, whereas physical disturbances linked to rising water levels prevailed in drought recovery. As a key hydrological node, the Hukou responded most sensitively to drought events. These findings provide a valuable reference for formulating differentiated strategies for different lake areas, as well as for lake management and ecological restoration during drought periods.
4.2. Driving Forces Analysis for Water Quality Indicators
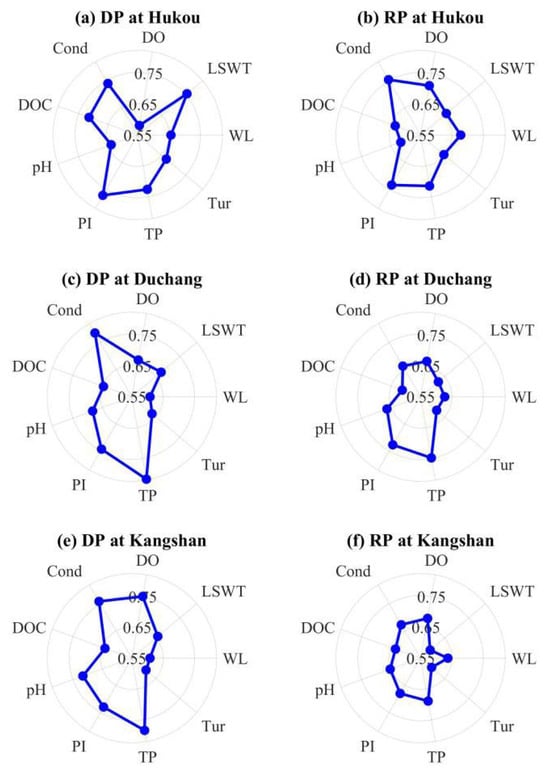
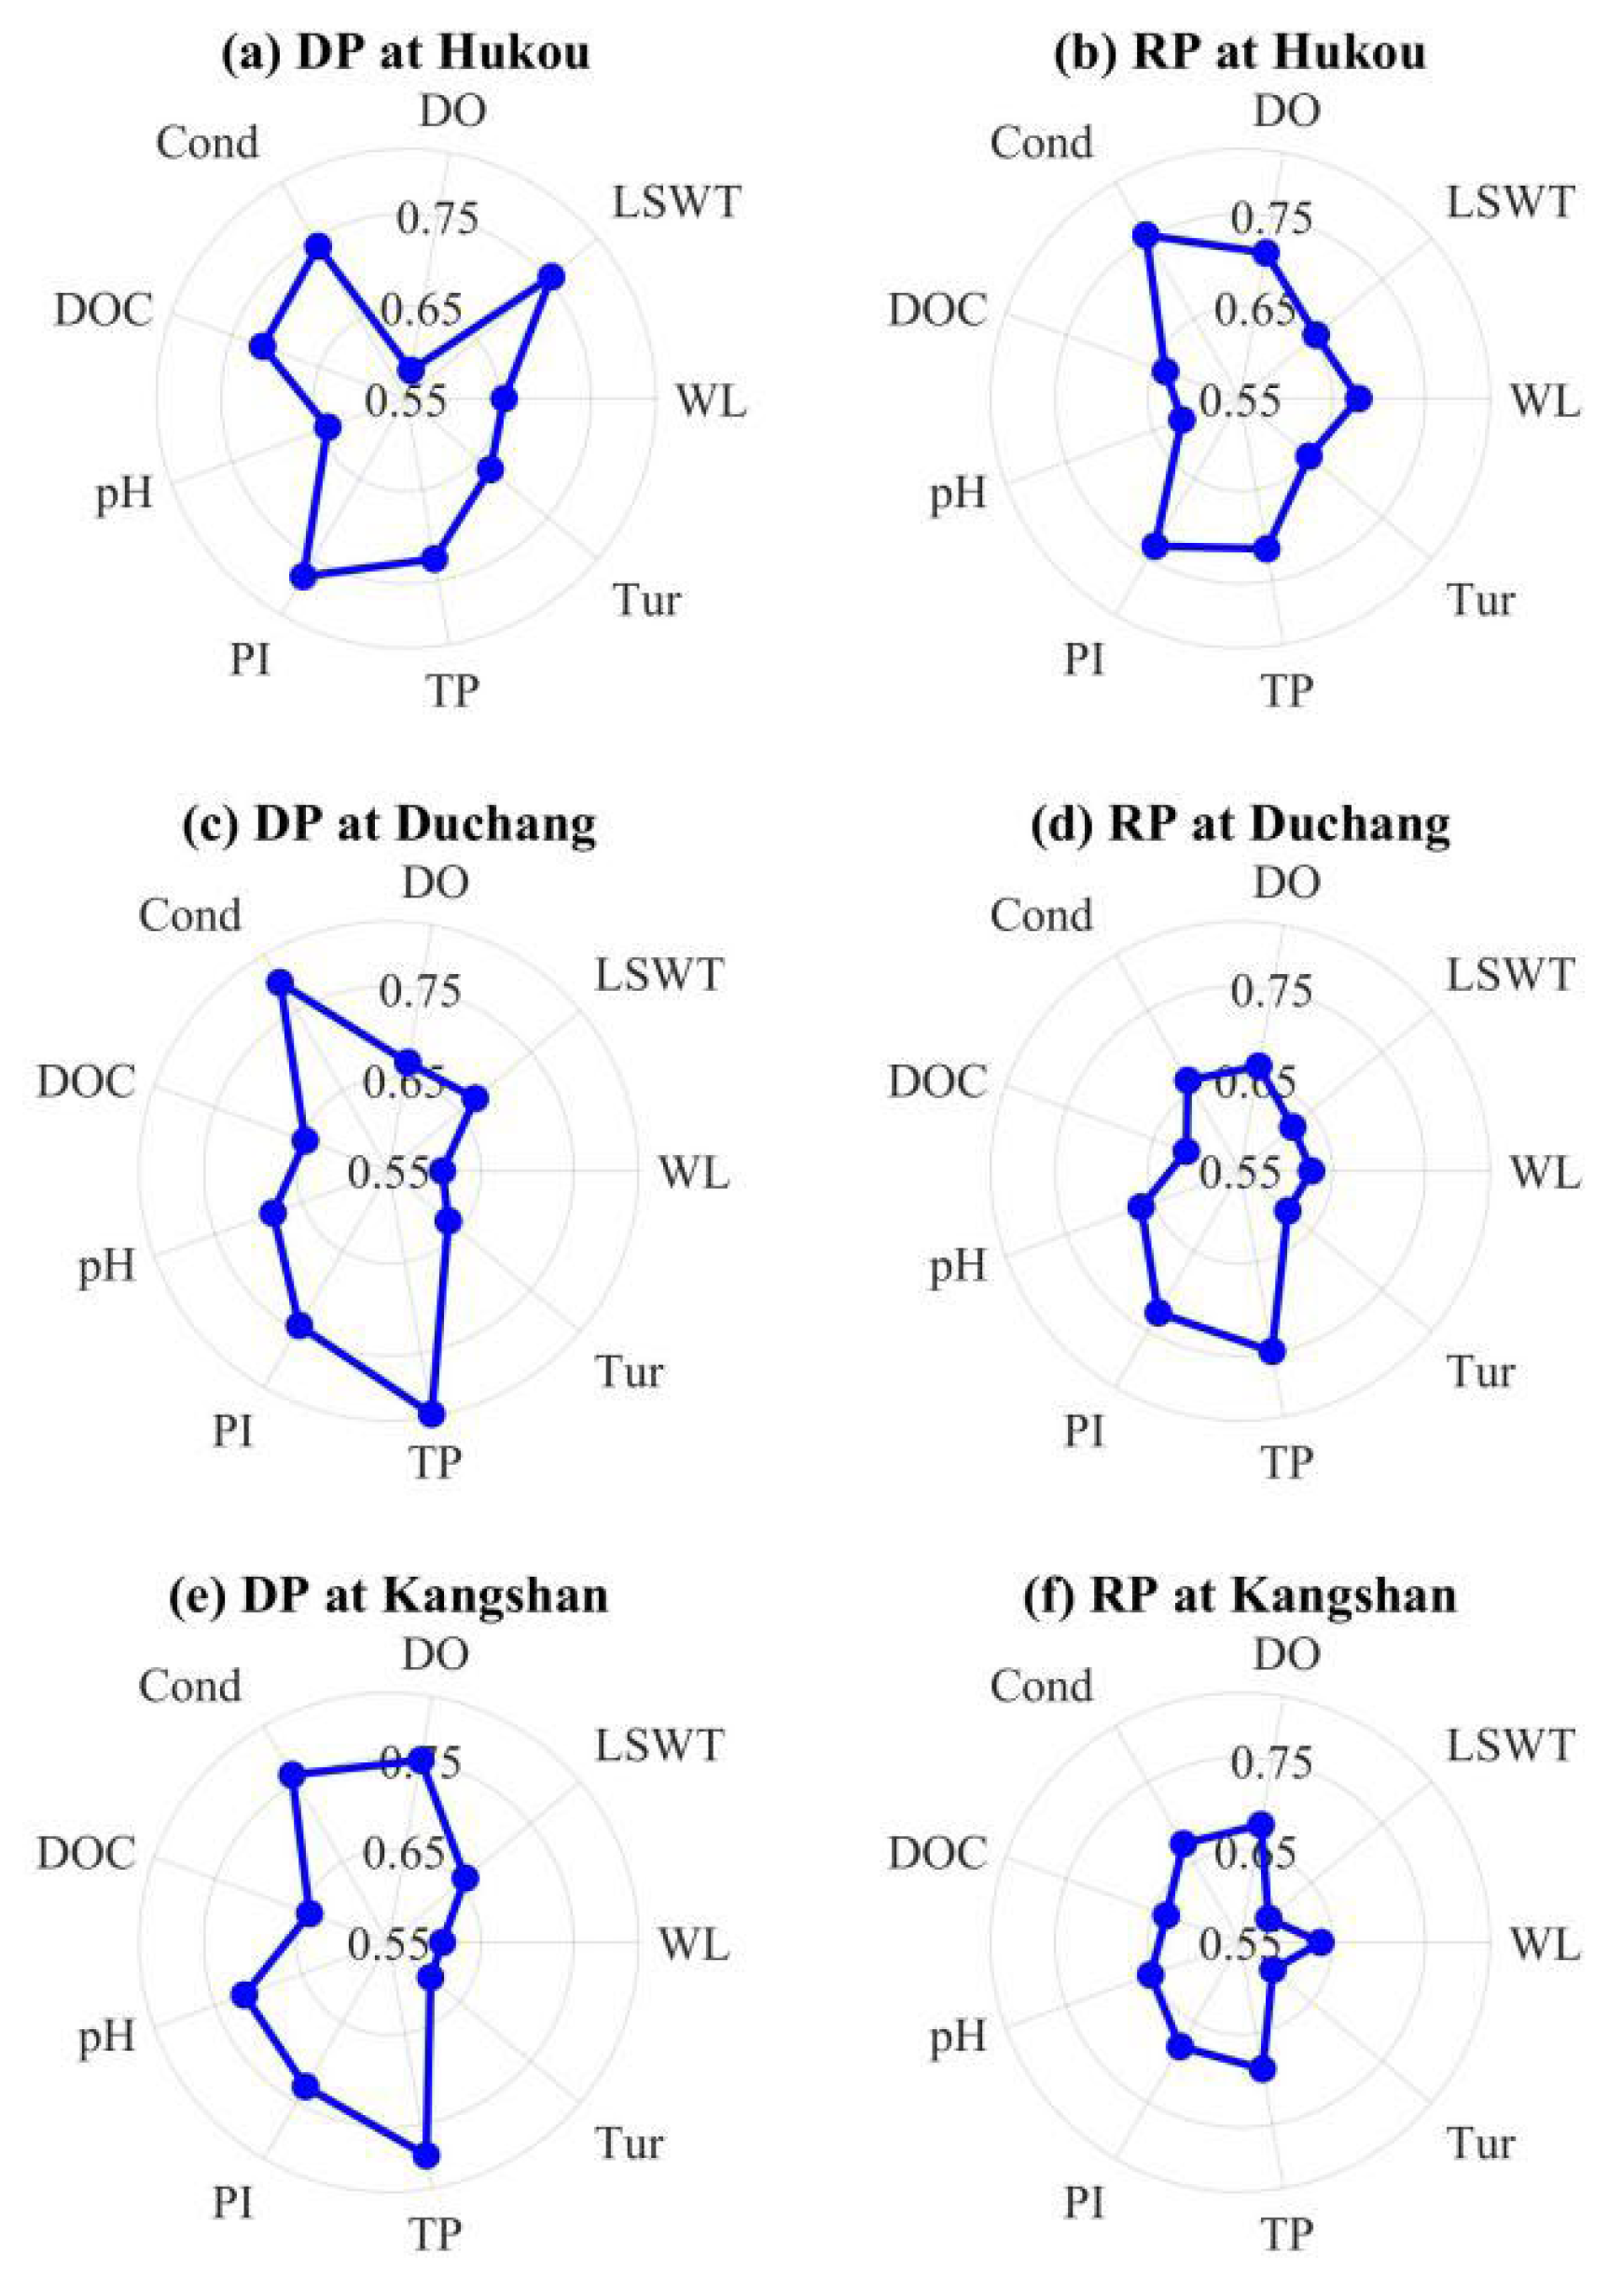
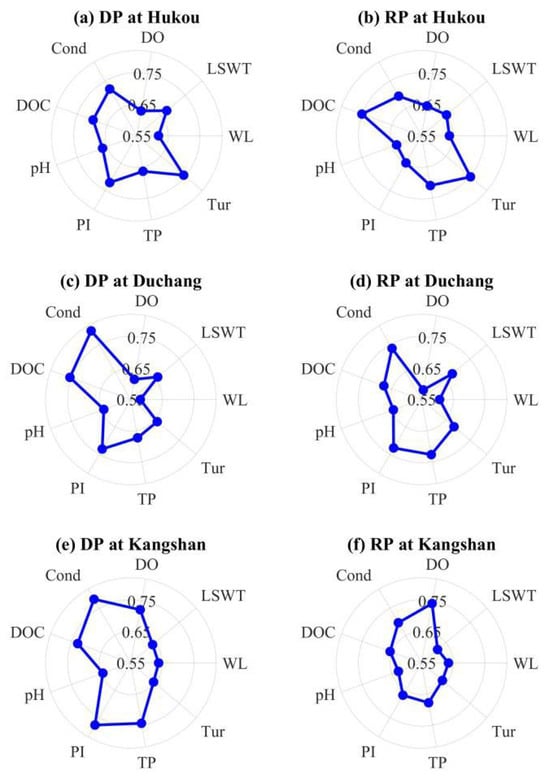
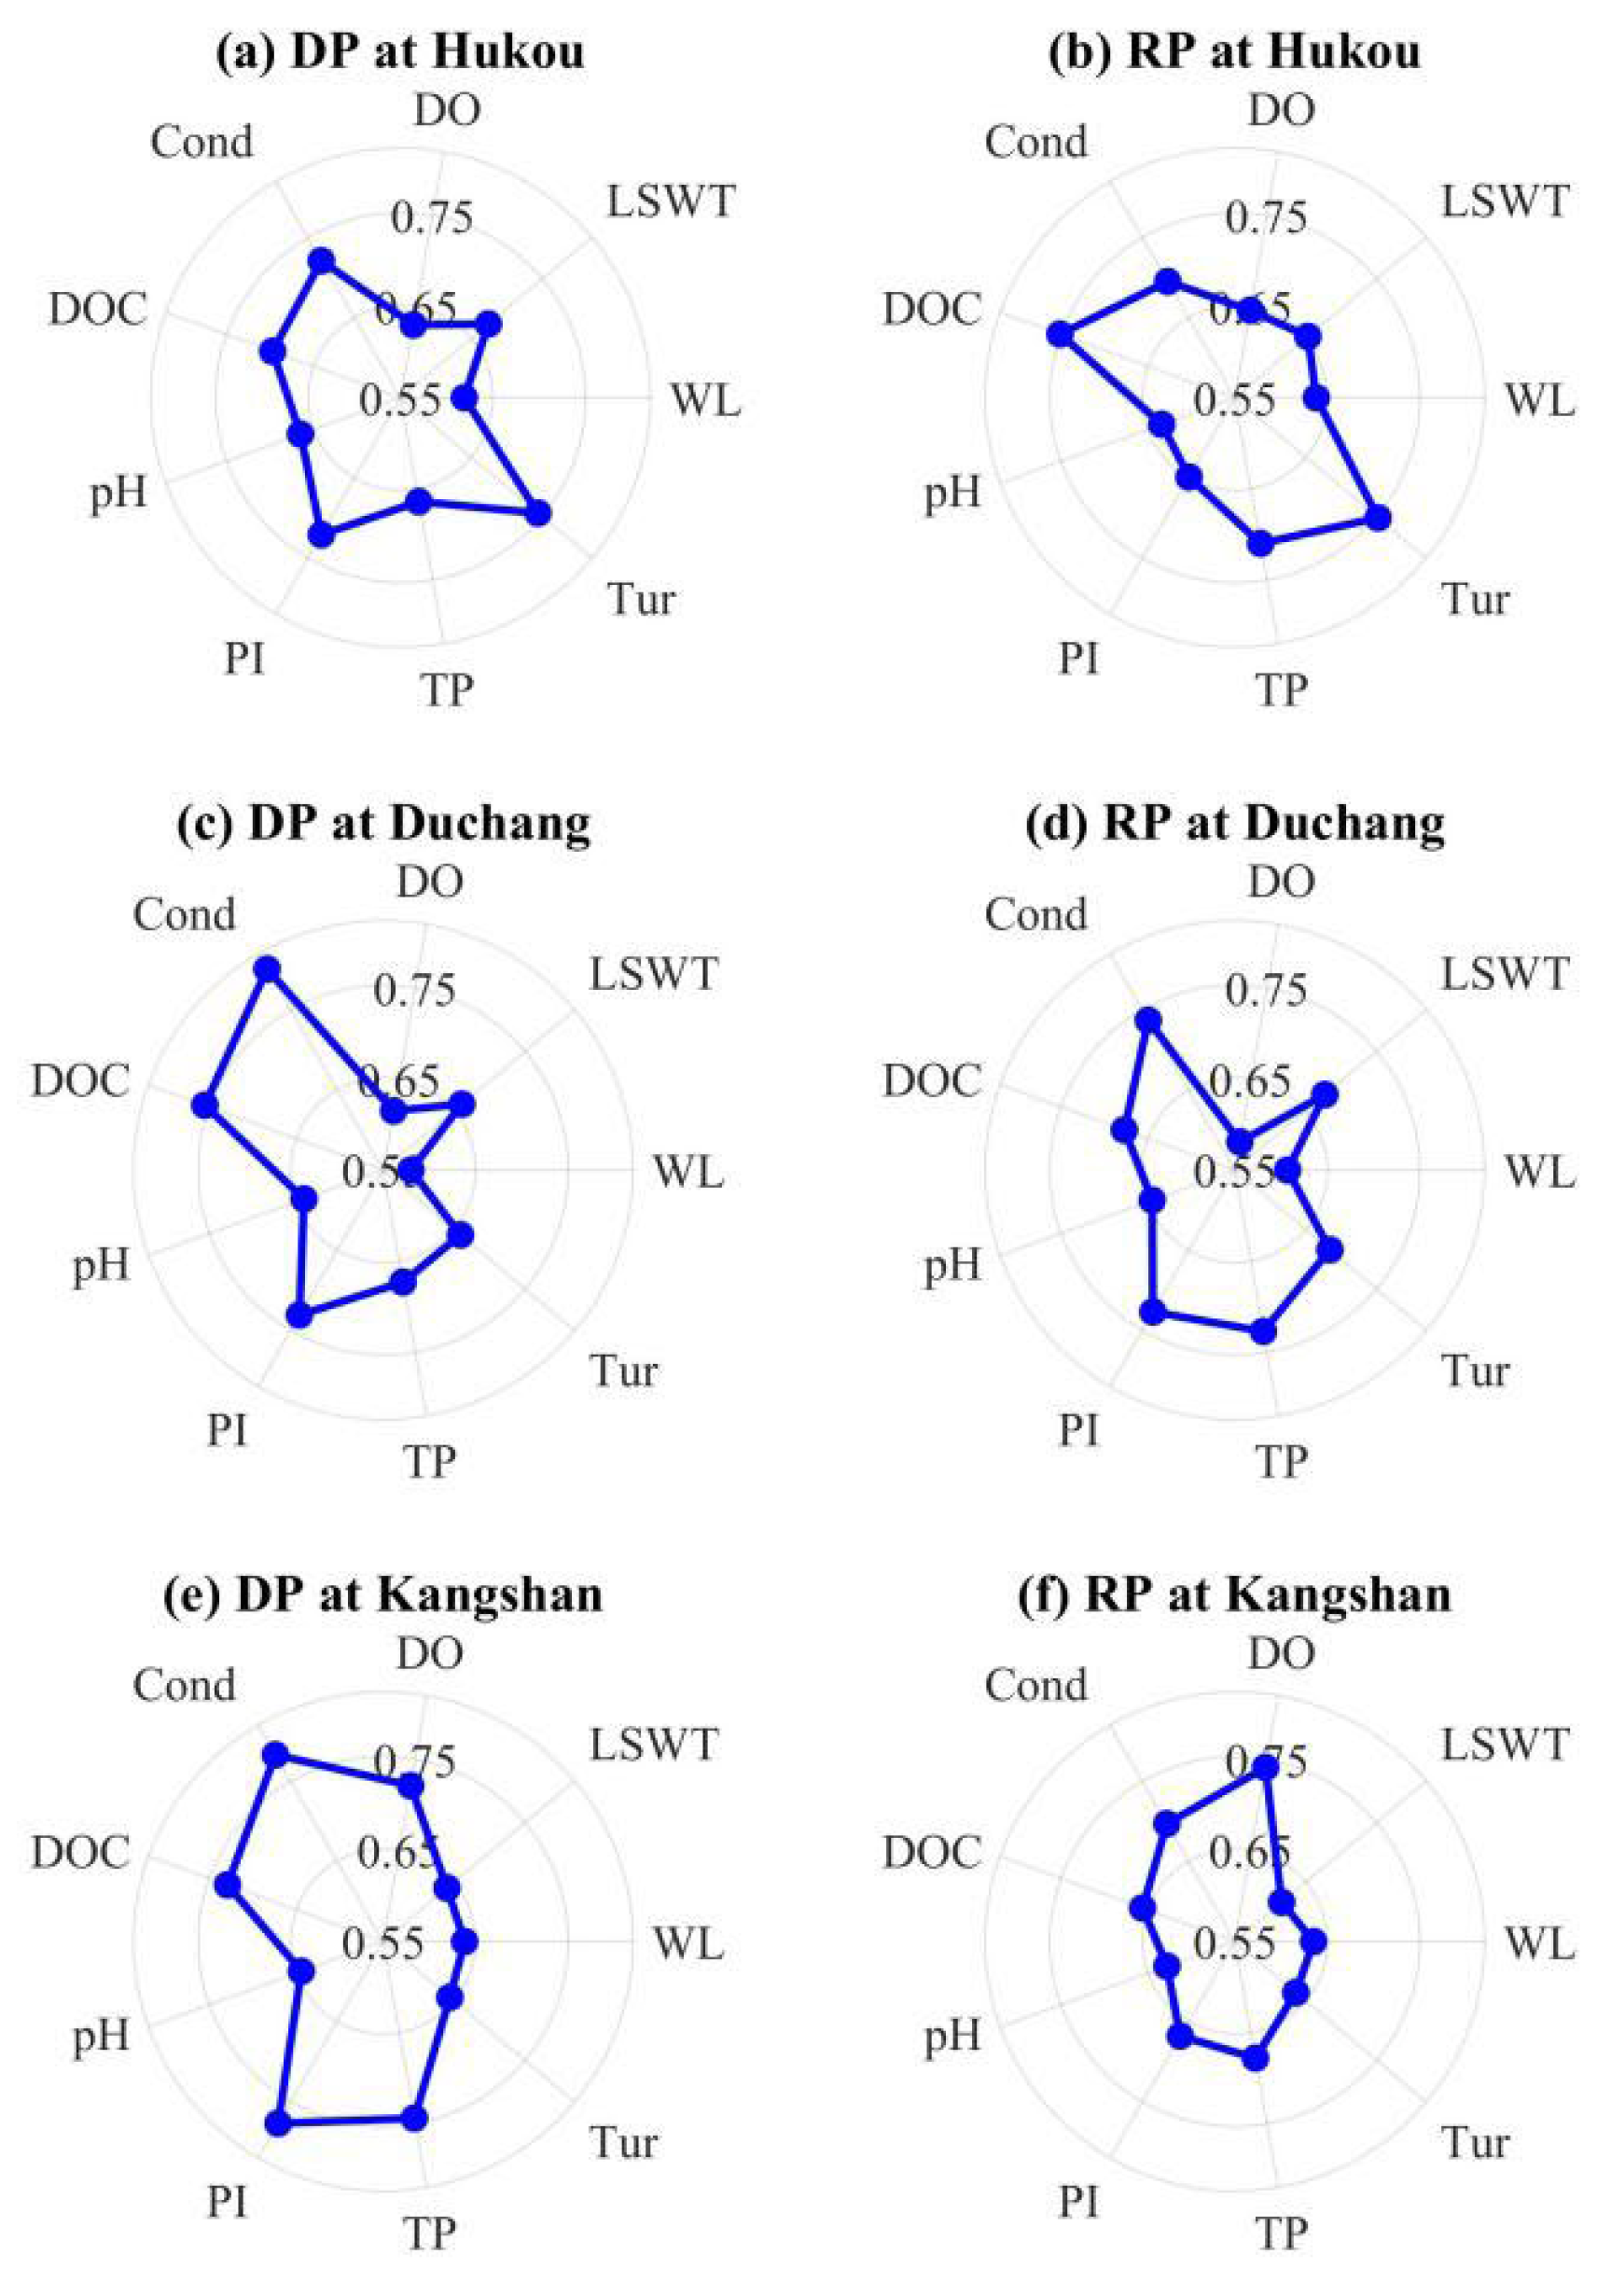
To further clarify the influence of hydrological and water quality indicators on TN and TP across drought stages, the GRA method was conducted to analyze their driving forces during development and recovery periods. The resulting effect degrees of water level, LSWT, DO, conductivity, DOC, pH, permanganate index, and turbidity on TN and TP at Hukou, Duchang and Kangshan stations in Poyang Lake are demonstrated in Figure 10 and Figure 11.
Figure 10.
Grey relational analysis between TN and other indicators (for abbreviations in this figure, refer to Figure 8).
Figure 11.
Grey relational analysis between TP and other indicators (for abbreviations in this figure, refer to Figure 8).
TN is a vital nutrient element for life, and a core limiting factor for plant growth and primary productivity. It can promote the growth of algae and aquatic plants [19,49,50]. During the development period, permanganate index was the primary factor influencing TN at Hukou station, with a GRD of 0.772 and ranking of 1. LSWT, with a ranking of 2, had a significant impact on TN, which reflects the promoting effect of temperature increase on the internal release of total nitrogen. At Duchang and Kangshan, TP was the strongest driver of TN (GRDs = 0.817 and 0.784, rank 1), indicating a strong co-variation between nitrogen and phosphorus loads during development periods. This phenomenon largely stems from coordinated release from sediments and evaporative concentration under shrinking water volume and prolonged retention time, which amplifies the co-variation in nutrient loads during drought development.
During recovery periods, as the hydrological conditions change, conductivity became the leading factor affecting TN at Hukou station (GRD = 0.754), implying that water-level rise and associated salinity changes played a key role in nitrogen cycling. This shift reflects the dominance of hydrological dilution, ionic flushing and regional water mixing as the lake refills, which modulates nitrogen transformation pathways. TP remained the most influential factor influencing TN at Duchang station (GRD = 0.748) and Kangshan station (GRD = 0.689), although the GRDs decreased compared to development periods. This suggests that the inherent nutrient coupling weakened but persisted, as water quality fails to recover synchronously with hydrological conditions, showing obvious ecological hysteresis.
TP is a key nutrient that directly shapes aquatic ecosystem structure and function [51]. During development periods, turbidity and TN were the core controlling factors. Turbidity was the primary driver of TP at Hukou station (GRD = 0.744, rank 1), which is closely associated with frequent sediment resuspension under low water conditions and wind–wave disturbance. Resuspended sediments release large amounts of particulate and dissolved phosphorus, directly elevating TP concentrations and water turbidity. Meanwhile, while TN exerted the strongest influence at Duchang (GRD = 0.801) and Kangshan (GRD = 0.783) stations, underscoring the close synergy of nitrogen and phosphorus nutrients during drought periods. At Kangshan station, pH also showed high relevance, with a GRD of 0.777 and ranking of 2. As pH variations mediate the phosphorus adsorption–desorption equilibrium at the sediment–water interface and affect microbial nutrient transformation.
During the recovery period, turbidity remained the dominant factor for TP at Hukou station, with a slightly increased GRD (0.752). TN retained the highest influence at Duchang station (GRD = 0.737), but it dropped to rank 2 at Kangshan station (GRD = 0.697), where DO became the primary factor (GRD = 0.741). The rise in DO importance reflects the recovery of aerobic microbial respiration, photosynthesis and organic matter decomposition, which gradually re-establishes redox conditions and reshapes phosphorus cycling. Concurrently, conductivity gained prominence at Hukou station (rising to rank 2), aligning with its increased role for TN and further highlighting the growing importance of salt environmental changes at this outlet station.
During development periods, the mutual correlation between TN and TP generally reached its peak at the Duchang and Kangshan stations, indicating intensified internal nutrient interactions under drought stress. Overall, the key hydrological and water quality drivers affecting TN and TP varied significantly in different drought stages and spatial locations, reflecting the complex response of Poyang Lake to drought stress and recovery. Drought events not only altered the strength of parameter correlations but also reshaped the ranking of dominant influencing factors.
4.3. Robustness Verification of Driving Factor Identification
To ensure the robustness of driving factor identification, Pearson correlation analysis and GRA were jointly applied and systematically cross-validated. Pearson correlation was used to reveal the direction and strength of linear relationships between variables, while GRA was adopted to quantify the comprehensive nonlinear correlation degree and importance ranking, which are complementary in characterizing complex hydrological and water quality systems.
Across all three stations and two drought stages, the dominant driving factors of TN and TP identified by the two methods were highly consistent. For TN, permanganate index, TP, LSWT and conductivity were consistently ranked as the most important variables in both Pearson correlation and GRA results. For TP, TN, pH, and turbidity exhibited strong correlations in Pearson analysis and high grey relational grades in GRA, supporting their role as core driving forces.
Minor inconsistencies were only observed among secondary environmental factors with weak linear correlation and low grey relational grade, such as DOC. These discrepancies are reasonable given the nonlinearity and random disturbance inherent in lake aquatic systems, and do not affect the identification of dominant mechanisms.
In this study, a conservative and rigorous joint judgement rule was applied to ensure conclusion robustness: only variables that showed meaningful linear correlation in Pearson analysis and simultaneously possessed high grey relational grade and top ranking in GRA were defined as robust dominant driving factors. Factors with inconsistent results between the two methods were treated as secondary or unstable indicators and not included in the core conclusions. This dual-method cross-validation effectively avoids one-sidedness and ensures the scientificity and reliability of the driving mechanism analysis.
5. Conclusions
This study aimed to investigate the variation in water quality during different stages of hydrological drought in Poyang Lake. Lake drought evolution, specifically the development and recovery phases, was identified using the SWI and run theory. The spatio-temporal variations in eight water quality indicators were then analyzed across these drought stages. Furthermore, the relationships between hydrological and water quality parameters and the driving forces behind TN and TP changes were examined using correlation and the GRA method. The key findings are as follows:
- (1)
- Hydrological drought events exhibited significant spatial and temporal variability across the lake. Droughts occurred frequently, with an average of nearly one event per year. The development period was generally longer than the recovery period.
- (2)
- Water quality indicators demonstrated distinct patterns between drought development and recovery. DO was consistently lower during the development period, while TP increased during the recovery period. At Hukou station, DOC concentrations were lower and less variable during development, likely due to limited endogenous release, but became higher and more heterogeneous during recovery, owing to external inputs.
- (3)
- Water quality variations showed temporal heterogeneity. During drought development, TN was primarily influenced by permanganate index, LSWT and TP. TP was most strongly associated with turbidity and TN. During drought recovery, the influence of conductivity on TN became prominent, and at Kangshan station, turbidity became a main dominant factor for TP. Overall, drought enhanced the coupling between TN and TP, and the transition between hydrological stages reshaped the primary influencing factors and their order of importance, reflecting the complex response mechanisms of the lake to drought stress and recovery.
- (4)
- The key factors influencing TN and TP in Poyang Lake displayed significant spatial heterogeneity. Hukou Station, the lake’s outlet to the Yangtze River, was most sensitive to hydrological changes. Conductivity emerged as a key factor influencing both TN and TP during drought recovery, highlighting the role of salinity dynamics. Duchang and Kangshan Stations in the southern part of the lake exhibited stronger internal nutrient coupling (TN and TP synergy) during drought development.
In summary, drought events in Poyang Lake not only altered the magnitude of hydrological and water quality parameters but also reshaped their interrelationships and dominant drivers across different temporal stages and spatial locations. These insights enhance the understanding of lake ecosystem responses to hydrological extremes and support adaptive management strategies in the face of increasing climate variability.
Author Contributions
Conceptualization, S.H.; methodology, S.H.; writing—original draft, S.H. and K.Z.; funding acquisition, S.H.; and supervision, J.X. All authors have read and agreed to the published version of the manuscript.
Funding
This research is financially supported by the National Natural Science Foundation of China (Grant No. 52309077), the National Key Research and Development Program of China (Grant No. 2023YFC3209003), the Key Laboratory Directed Commission Project of Hubei Province (Grant No. 2025CSA069), the Nature Science Foundation of Hubei Province (Grant No. 2022CFB573), and the Fundamental Research Funds for the Central Public Welfare Research Institutes (Grant No. CKSF2025730).
Data Availability Statement
Restrictions apply to the availability of these data. Data were obtained from the China Environmental Monitoring Centre and are available at https://www.cnemc.cn/sssj/ (accessed on 1 October 2025) with the permission of the China Environmental Monitoring Centre.
Conflicts of Interest
The authors declare no conflicts of interest.
References
- Bellprat, O.; Guemas, V.; Doblas-Reyes, F.; Donat, M.G. Towards Reliable Extreme Weather and Climate Event Attribution. Nat. Commun. 2019, 10, 1732. [Google Scholar] [CrossRef] [Scilit]
- Peng, J.; Dadson, S.; Hirpa, F.; Dyer, E.; Lees, T.; Miralles, D.G.; Vicente-Serrano, S.M.; Funk, C. A Pan-African High-Resolution Drought Index Dataset. Earth Syst. Sci. Data 2020, 12, 753–769. [Google Scholar] [CrossRef] [Scilit]
- Zhou, P.; Liu, Z.Y. Likelihood of Concurrent Climate Extremes and Variations over China. Environ. Res. Lett. 2018, 13, 094023. [Google Scholar] [CrossRef] [Scilit]
- Wu, X.Y.; Hao, Z.C.; Hao, F.H.; Singh, V.P.; Zhang, X. Dry-Hot Magnitude Index: A Joint Indicator for Compound Event Analysis. Environ. Res. Lett. 2019, 14, 064017. [Google Scholar] [CrossRef] [Scilit]
- Calzadilla, A.; Rehdanz, K.; Tol, R.S.J. The Economic Impact of More Sustainable Water Use in Agriculture: A Computable General Equilibrium Analysis. J. Hydrol. 2010, 384, 292–305. [Google Scholar] [CrossRef] [Scilit]
- Robinson, S.J.; Souter, N.J.; Bean, N.G.; Ross, J.V.; Thompson, R.M.; Bjornsson, K.T. Statistical Description of Wetland Hydrological Connectivity to the River Murray in South Australia Under Both Natural and Regulated Conditions. J. Hydrol. 2015, 531, 929–939. [Google Scholar] [CrossRef] [Scilit]
- He, S.; Xu, J.J.; Yi, Y.J.; Zhang, E.Z. Variations in Aquatic Vegetation Diversity Responses to Water Level Sequences During Drought in Lakes Under Uncertain Conditions. Water 2023, 15, 2395. [Google Scholar] [CrossRef] [Scilit]
- Sun, X.Y.; Armstrong, M.; Moradi, A.; Bhattacharya, R.; Antão-Geraldes, A.M.; Munthali, E.; Grossart, H.P.; Matsuzaki, S.S.; Kangur, K.; Dunalska, J.A.; et al. Impacts of Climate-Induced Drought on Lake and Reservoir Biodiversity and Ecosystem Services: A Review. Ambio 2025, 54, 488–504. [Google Scholar] [CrossRef] [Scilit]
- Ireland, A.W.; Booth, R.K.; Hotchkiss, S.C.; Schmitz, J.E. Drought as a Trigger for Rapid State Shifts in Kettle Ecosystems: Implications for Ecosystem Responses to Climate Change. Wetlands 2012, 32, 989–1000. [Google Scholar] [CrossRef] [Scilit]
- Guo, Y.; Lai, X.; Wu, X.; Chen, Y. Dry-Season Water Level Shift Induced by Channel Change of the River–Lake System in China’s Largest Freshwater Lake, Poyang Lake. Wetlands 2022, 42, 112. [Google Scholar] [CrossRef] [Scilit]
- Zhang, Q.; Werner, A.D. Hysteretic Relationships in Inundation Dynamics for a Large Lake–Floodplain System. J. Hydrol. 2015, 527, 160–171. [Google Scholar] [CrossRef] [Scilit]
- Huang, A.P.; Liu, X.B.; Peng, W.Q.; Dong, F.; Ma, B.; Li, J.J.; Wang, W.J. Spatiotemporal Characteristics, Influencing Factors and Evolution Laws of Water Exchange Capacity of Poyang Lake. J. Hydrol. 2022, 609, 127717. [Google Scholar] [CrossRef] [Scilit]
- Duan, Z.Z.; Wang, M.J.; Liu, Y.; Gao, W.; Chang, X.X. Predicting Hydrological Alterations to Quantitative and Localized Climate Change in Plateau Regions: A Case Study of the Lake Dianchi Basin, China. Stoch. Environ. Res. Risk Assess. 2022, 36, 969–983. [Google Scholar] [CrossRef] [Scilit]
- Tian, M.M.; Mao, J.Q.; Wang, K.; Xu, D.D. Spatio-Temporal Heterogeneity of Ecological Water Level in Poyang Lake, China. Ecol. Inform. 2024, 82, 102694. [Google Scholar] [CrossRef] [Scilit]
- Du, C.; Kong, X.Z.; Sun, D.P.; Xue, Y.F.; Zhang, C.; Xue, B. Stable Isotope Characteristics and Recharge Mechanisms of River, Lake and Groundwater by Precipitation in the Hulun Lake Basin. Hydrol. Process. 2025, 39, e70174. [Google Scholar] [CrossRef] [Scilit]
- Mahmood, M.R.; Abrahem, B.I.; Jumaah, H.J.; Alalwan, H.A.; Mohammed, M.M. Drought Monitoring of Large Lakes in Iraq Using Remote Sensing Images and Normalized Difference Water Index (NDWI). Results Eng. 2025, 25, 103854. [Google Scholar] [CrossRef] [Scilit]
- Ndehedehe, C.E.; Agutu, N.O.; Okwuashi, O.; Ferreira, V.G. Spatio-Temporal Variability of Droughts and Terrestrial Water Storage over Lake Chad Basin Using Independent Component Analysis. J. Hydrol. 2016, 540, 106–128. [Google Scholar] [CrossRef] [Scilit]
- Guo, Y.; Huang, S.Z.; Huang, Q.; Wang, H.; Fang, W.; Yang, Y.Y.; Wang, L. Assessing Socioeconomic Drought Based on an Improved Multivariate Standardized Reliability and Resilience Index. J. Hydrol. 2019, 568, 904–918. [Google Scholar] [CrossRef] [Scilit]
- Moss, B.; Jeppesen, E.; Søndergaard, M.; Lauridsen, T.L.; Liu, Z.W. Nitrogen, Macrophytes, Shallow Lakes and Nutrient Limitation: Resolution of a Current Controversy? Hydrobiologia 2013, 710, 3–21. [Google Scholar] [CrossRef] [Scilit]
- Wang, X.H.; Liu, Z.J.; Xu, Y.J.; Mao, B.Y.; Jia, S.Q. Extreme Drought Affects Lake Water Quality, Quantity, Morphometry: Evidence from China’s Largest Fresh Water Lake Under the 2022 Global Drought. Geosci. Front. 2025, 16, 102146. [Google Scholar] [CrossRef] [Scilit]
- Kim, J.S.; Jain, S.; Lee, J.H.; Chen, H.; Park, S.Y. Quantitative Vulnerability Assessment of Water Quality to Extreme Drought in a Changing Climate. Ecol. Indic. 2019, 103, 688–697. [Google Scholar] [CrossRef] [Scilit]
- Li, T.Y.; Li, S.Y.; Liang, C.; Bush, R.T.; Xiong, L.H.; Jiang, Y.J. A Comparative Assessment of Australia’s Lower Lakes Water Quality Under Extreme Drought and Post-Drought Conditions Using Multivariate Statistical Techniques. J. Clean. Prod. 2018, 190, 1–11. [Google Scholar] [CrossRef] [Scilit]
- Seo, J.Y.; Won, J.G.; Lee, H.S.; Kim, S.D. Probabilistic Monitoring of Meteorological Drought Impacts on Water Quality of Major Rivers in South Korea Using Copula Models. Water Res. 2024, 251, 121175. [Google Scholar] [CrossRef] [Scilit]
- Mosley, L.M. Drought Impacts on the Water Quality of Freshwater Systems; Review and Integration. Earth-Sci. Rev. 2015, 140, 203–214. [Google Scholar] [CrossRef] [Scilit]
- Ahmadi, B.; Ahmadalipour, A.; Moradkhani, H. Hydrological Drought Persistence and Recovery over the CONUS: A Multi-Stage Framework Considering Water Quantity and Quality. Water Res. 2019, 150, 97–110. [Google Scholar] [CrossRef] [Scilit]
- Saber, A.; James, D.E.; Hannoun, I.A. Effects of Lake Water Level Fluctuation due to Drought and Extreme Winter Precipitation on Mixing and Water Quality of an Alpine Lake, Case Study: Lake Arrowhead, California. Sci. Total Environ. 2020, 714, 136762. [Google Scholar] [CrossRef] [Scilit]
- Zhang, W.J.; Wu, J.F.; Yao, H.X.; Wang, J. Influence of Drought Identification Methods on Analyzing and Assessing Responses of Water Quality to Droughts. Ecol. Indic. 2025, 181, 114458. [Google Scholar] [CrossRef] [Scilit]
- Wu, J.; Chen, X.; Yuan, X.; Yao, H.X.; Zhao, Y.X.; Aghakouchak, A. The Interactions Between Hydrological Drought Evolution and Precipitation-Streamflow Relationship. J. Hydrol. 2021, 597, 126210. [Google Scholar] [CrossRef] [Scilit]
- Kubiak-Wójcicka, K.; Bąk, B. Monitoring of Meteorological and Hydrological Droughts in the Vistula Basin (Poland). Environ. Monit. Assess. 2018, 190, 691. [Google Scholar] [CrossRef] [Scilit]
- Gouahi, S.; Hssaisoune, M.; Ait Brahim, Y.; Kadi, M.A.E.; Nehmadou, M.; Bouchaou, L. Assessment of Groundwater Drought Risk in Arid Regions Using Standardized Indices and Reliability Analysis. Front. Water 2025, 7, 1628691. [Google Scholar] [CrossRef] [Scilit]
- He, S.; Zhang, E.Z.; Huo, J.J.; Yang, M.Z. Characteristics of Propagation of Meteorological to Hydrological Drought for Lake Baiyangdian in a Changing Environment. Atmosphere 2022, 13, 1531. [Google Scholar] [CrossRef] [Scilit]
- Huang, F.; Yan, B.; Zhang, X.; Zhao, D.Y.; Guo, L.D.; Wang, Y.K.; Xia, Z.Q. Water Regime Evolution of Large Seasonal Lakes: Indicators for Characterization and an Application in Poyang Lake, China. Int. J. Environ. Res. Public Health 2018, 15, 2598. [Google Scholar] [CrossRef] [Scilit]
- Gao, J.H.; Jia, J.J.; Kettner, A.J.; Xing, F.; Wang, Y.P.; Xu, X.N.; Yang, Y.; Zou, X.Q.; Gao, S.; Qi, S.; et al. Changes in Water and Sediment Exchange between the Changjiang River and Poyang Lake Under Natural and Anthropogenic Conditions, China. Sci. Total Environ. 2014, 481, 542–553. [Google Scholar] [CrossRef] [Scilit]
- Yao, J.; Zhang, Q.; Li, Y.L.; Li, M.F. Hydrological evidence and causes of seasonal low water levels in a large river-lake system: Poyang Lake, China. Hydrol. Res. 2016, 47, 24–39. [Google Scholar] [CrossRef] [Scilit]
- Zhang, D.; Chen, P.; Zhang, Q.; Li, X.H. Copula-based probability of concurrent hydrological drought in the Poyang lake-catchment-river system (China) from 1960 to 2013. J. Hydrol. 2017, 553, 773–784. [Google Scholar] [CrossRef] [Scilit]
- Xue, C.Y.; Zhang, Q.; Jia, Y.X.; Tang, H.W.; Zhang, H.M. Attribution of hydrological droughts in large river-connected lakes: Insights from an explainable machine learning model. Sci. Total Environ. 2024, 952, 175999. [Google Scholar] [CrossRef] [Scilit]
- Yevjevich, V. An Objective Approach to Definitions and Investigations of Continental Hydrologic Droughts. J. Hydrol. 1969, 7, 353. [Google Scholar] [CrossRef] [Scilit]
- Yang, F.; Duan, X.W.; Guo, Q.K.; Lu, S.J.; Hsu, K.L. The spatiotemporal variations and propagation of droughts in Plateau Mountains of China. Sci. Total Environ. 2022, 805, 150257. [Google Scholar] [CrossRef] [Scilit]
- Saghafian, S.D.; Mehdikhani, H. Drought Characteristics Using a New Copula-Based Trivariate Approach. Nat. Hazards 2014, 72, 1391–1407. [Google Scholar] [CrossRef] [Scilit]
- Wu, J.F.; Chen, X.H.; Yao, H.X.; Liu, Z.Y.; Zhang, D.J. Hydrological Drought Instantaneous Propagation Speed Based on the Variable Motion Relationship of Speed-Time Process. Water Resour. Res. 2018, 54, 9549–9565. [Google Scholar] [CrossRef] [Scilit]
- Wu, J.F.; Yao, H.X.; Chen, X.H.; Wang, G.X.; Bai, X.Y.; Zhang, D.J. A Framework for Assessing Compound Drought Events from a Drought Propagation Perspective. J. Hydrol. 2022, 604, 127228. [Google Scholar] [CrossRef] [Scilit]
- Parry, S.; Wilby, R.L.; Prudhomme, C.; Wood, P.J. A Systematic Assessment of Drought Termination in the United Kingdom. Hydrol. Earth Syst. Sci. 2016, 20, 4265–4281. [Google Scholar] [CrossRef] [Scilit]
- Zhang, D.; Luo, D. Evaluation of Regional Agricultural Drought Vulnerability Based on Unbiased Generalized Grey Relational Closeness Degree. Grey Syst. Theory Appl. 2022, 12, 839–856. [Google Scholar] [CrossRef] [Scilit]
- Zhang, Y.; Zhang, H.B.; Ye, Z.X.; Lyu, J.J.; Ma, H.; Zhang, X.D. Spatiotemporal Dynamics of Drought Propagation in the Loess Plateau: A Geomorphological Perspective. Water 2025, 17, 2447. [Google Scholar] [CrossRef] [Scilit]
- Javed, S.A.; Syed, A.M.; Javed, S. Perceived organizational performance and trust in project manager and top management in project-based organizations. Grey Syst. 2018, 8, 230–245. [Google Scholar] [CrossRef] [Scilit]
- Jiang, B.C.; Tasi, S.L.; Wang, C.C. Machine vision-based gray relational theory applied to IC marking inspection. IEEE Trans. Semicond. Manuf. 2002, 15, 531–539. [Google Scholar] [CrossRef] [Scilit]
- Song, Q.; Shepperd, M. Predicting software project effort: A grey relational analysis based method. Expert Syst. Appl. 2011, 38, 7302–7316. [Google Scholar] [CrossRef] [Scilit]
- Ahmadi, B.; Moradkhani, H. Revisiting hydrological drought propagation and recovery considering water quantity and quality. Hydrol. Process. 2019, 33, 1492–1505. [Google Scholar] [CrossRef] [Scilit]
- Guildford, S.J.; Hecky, R.E. Total Nitrogen, Total Phosphorus, and Nutrient Limitation in Lakes and Oceans: Is There a Common Relationship? Limnol. Oceanogr. 2000, 45, 1213–1223. [Google Scholar] [CrossRef] [Scilit]
- Rao, Q.Y.; Su, H.J.; Deng, X.W.; Xia, W.L.; Wang, L.T.; Cui, W.J.; Ruan, L.W.; Chen, J.; Xie, P. Carbon, Nitrogen, and Phosphorus Allocation Strategy among Organs in Submerged Macrophytes Is Altered by Eutrophication. Front. Plant Sci. 2020, 11, 524450. [Google Scholar] [CrossRef] [Scilit] [PubMed]
- Fasching, C.; Boodoo, K.S.; Yao, H.X.; Rusak, J.; Xenopoulos, M.A. Role of Lakes, Flood, and Low Flow Events in Modifying Catchment-Scale DOC: TN: TP Stoichiometry and Export. Water Resour. Res. 2024, 60, e2023WR034839. [Google Scholar] [CrossRef] [Scilit]

Disclaimer/Publisher’s Note: The statements, opinions and data contained in all publications are solely those of the individual author(s) and contributor(s) and not of MDPI and/or the editor(s). MDPI and/or the editor(s) disclaim responsibility for any injury to people or property resulting from any ideas, methods, instructions or products referred to in the content. |
© 2026 by the authors. Licensee MDPI, Basel, Switzerland. This article is an open access article distributed under the terms and conditions of the Creative Commons Attribution (CC BY) license.