


Abstract
Clarifying long-term runoff and sediment discharge (RSD) evolution and its driving mechanisms is critical for watershed soil and water conservation, and regional ecological sustainability. Existing research has emphasized meteorological, hydrological, and engineering factors, yet quantitative insights into fine-scale landscape-pattern modulation of RSD processes in Yellow River tributaries have remained limited. This study selected the Qingshui River (QSR) Basin and Kushui River (KSR) Basin and adopted 1990–2020 hydrological records and multiple landscape metrics to examine spatiotemporal RSD variations and quantify landscape controls on runoff generation and sediment yield. High RSD occurred in 1990–1999 with July and August concentration; a power function described local water and sediment relationships. The KSR Basin showed more intensive land-use change, and basins exhibited growing landscape fragmentation and diversity but declining patch connectivity. Landscape patterns exerted much stronger regulation on sediment yield than runoff generation: QSR runoff correlated with patch density (r = 0.31), and sediment yield with interspersion and juxtaposition index (r = −0.89), while KSR runoff was dominated by patch cohesion index (r = 0.43), and sediment yield by division index (r = −0.93). This work confirmed that landscape fragmentation and patch connectivity are core micro-scale drivers of water–sediment evolution, supporting landscape optimization for watershed management and water–sediment allocation.
1. Introduction
Under the coupled effects of climate change and intensive human activities, the water–sediment regime of global large rivers has undergone profound and differentiated variations in recent decades. Changes in watershed hydrological cycles and soil erosion processes can reshape the spatial and temporal patterns of runoff and sediment discharge (RSD) [1,2]. Climate change affects the fundamental conditions of watershed runoff generation and confluence primarily through long-term temporal fluctuations in temperature and precipitation. Numerous studies have confirmed that human activities serve as the dominant factor causing the widespread decline in water and sediment yields of major global rivers, exerting direct and decisive regulatory effects on water–sediment regime evolution [3,4]. Since the 20th century, rapid socioeconomic development and accelerated urbanization have intensified human interventions, including hydraulic engineering construction, water and sediment diversion in irrigation districts, ecological restoration, and land-use transition, which have thoroughly transformed the original natural hydrological environment of river basins [5]. Large-scale exploitation and utilization of watershed water resources substantially reduce river channel runoff, weaken fluvial sediment transport capacity, and trigger a series of ecological and hydrological problems such as unbalanced water and sediment resource allocation. As a typical sediment-laden river basin, the dynamic evolution of the water–sediment regime in Yellow River tributaries is critical to watershed soil and water conservation, water resource regulation, ecological restoration, and regional sustainable development. Clarifying the evolutionary laws and driving mechanisms of water–sediment regime in Yellow River tributaries provides significant theoretical and practical implications for refined governance, ecological protection, and high-quality development in the upper Yellow River Basin [6,7].
Scholars have conducted extensive systematic research on the attribution of watershed water–sediment evolution, preliminarily clarifying the driving mechanisms of climate variability and human activities on fluvial water–sediment processes. Existing studies have predominantly focused on the water–sediment regulatory effects of typical human activities, including reservoir and dam construction, and soil and water conservation projects [8,9,10,11]. Global-scale investigations have demonstrated that large-scale hydraulic projects significantly intercept sediment, sharply reduce riverine sediment discharge into the ocean, and dominate the runoff variations in more than half of global large rivers [12,13]. Targeted studies on the Yellow River Basin further verify that human activities are the primary driver of the remarkable reduction in RSD. Hydraulic regulation of mainstream reservoirs, soil and water conservation measures in the upper and middle reaches, irrigation water diversion, and grain-for-green ecological projects have substantially reshaped the spatiotemporal distribution patterns of the Yellow River’s water–sediment regime [14,15,16]. Beyond traditional engineering and ecological measures, land-use and landscape-pattern evolution represent core forms of underlying surface modification which directly alter surface roughness and soil infiltration properties, and reshape watershed runoff generation, confluence mechanisms, and hydrological cycles. Structural transitions of land-use types have been proven to be a critical inducement for abrupt changes in the watershed water–sediment regime over recent decades, with even higher contribution rates than some meteorological factors [17]. Accelerated urbanization and consequent transformations in land-use and landscape patterns have profoundly altered natural riverine environments [5]. As a core component of global environmental change, land-use transition modulates surface roughness, soil pore structure, and infiltration capacity, restructuring watershed hydrological processes and further affecting water and sediment resource allocation, eco-environmental quality, and socioeconomic sustainability [18]. Intensive ecological restoration and urbanization in the Yellow River Basin have driven drastic land-use restructuring, which is a major anthropogenic cause of the continuous decline in basin sediment yield [19]. Optimized land-use structures effectively improve soil infiltration performance, reduce hillslope erosion intensity, and enhance soil and water conservation capacity. In contrast, irrational land-use conversions, including disordered reclamation, vegetation degradation, and unregulated construction land expansion, destabilize underlying surface conditions and exacerbate watershed soil erosion and ecological degradation [20,21]. Therefore, exploring the response mechanisms of RSD to land-use changes is strategically vital for scientific water resource management and targeted soil and water conservation planning [22].
Despite abundant research on RSD evolution and its driving mechanisms in the Yellow River Basin, existing studies still have notable limitations. Most previous studies adopt qualitative or semi-quantitative methods to analyze traditional macroscopic driving factors, including climate variability, hydraulic engineering, and soil and water conservation measures, while neglecting fine-scale regulatory effects of microscopic underlying surface landscape structures [16,23]. Few studies have comprehensively quantified the coupled effects of multi-dimensional landscape metrics, such as landscape fragmentation, aggregation degree, patch connectivity, and spatial heterogeneity. Furthermore, long-term quantitative coupling analyses of water–sediment regime evolution, land-use dynamics, and landscape-pattern changes in typical Yellow River tributaries remain insufficient. The differential driving mechanisms of various landscape metrics on runoff generation and sediment yield have not been systematically clarified, thus restricting the accurate interpretation of microscopic landscape-induced water–sediment responses and hindering refined ecological governance in the upper Yellow River Basin.
Based on the above research gaps, this study selected two typical tributaries in the upper Yellow River Basin, the Qingshui River (QSR) Basin and Kushui River (KSR) Basin, as the study areas. Using long-term hydrological and land-use datasets from 1990 to 2020, this study systematically investigated the evolutionary characteristics and driving mechanisms of watershed water–sediment regime. The specific research objectives are as follows: (1) clarify the spatiotemporal evolution of the water–sediment regime in typical Yellow River tributaries over the past 30 years by analyzing the inter-annual variability, intra-annual distribution, and coupling relationships of RSD; (2) quantify the dynamic characteristics of long-term land-use change and landscape-pattern evolution to reveal the spatiotemporal variation in watersheds’ underlying surface conditions; and (3) quantitatively identify the differential driving effects of core landscape metrics (fragmentation, aggregation, patch density, and connectivity) on runoff generation and sediment yield, and determine the key microscopic landscape factors dominating water–sediment evolution. This study aims to provide a scientific reference and decision-making basis for landscape-pattern optimization, refined soil and water conservation, and sustainable ecological development in the upper Yellow River Basin.
2. Materials and Methods
2.1. Study Area
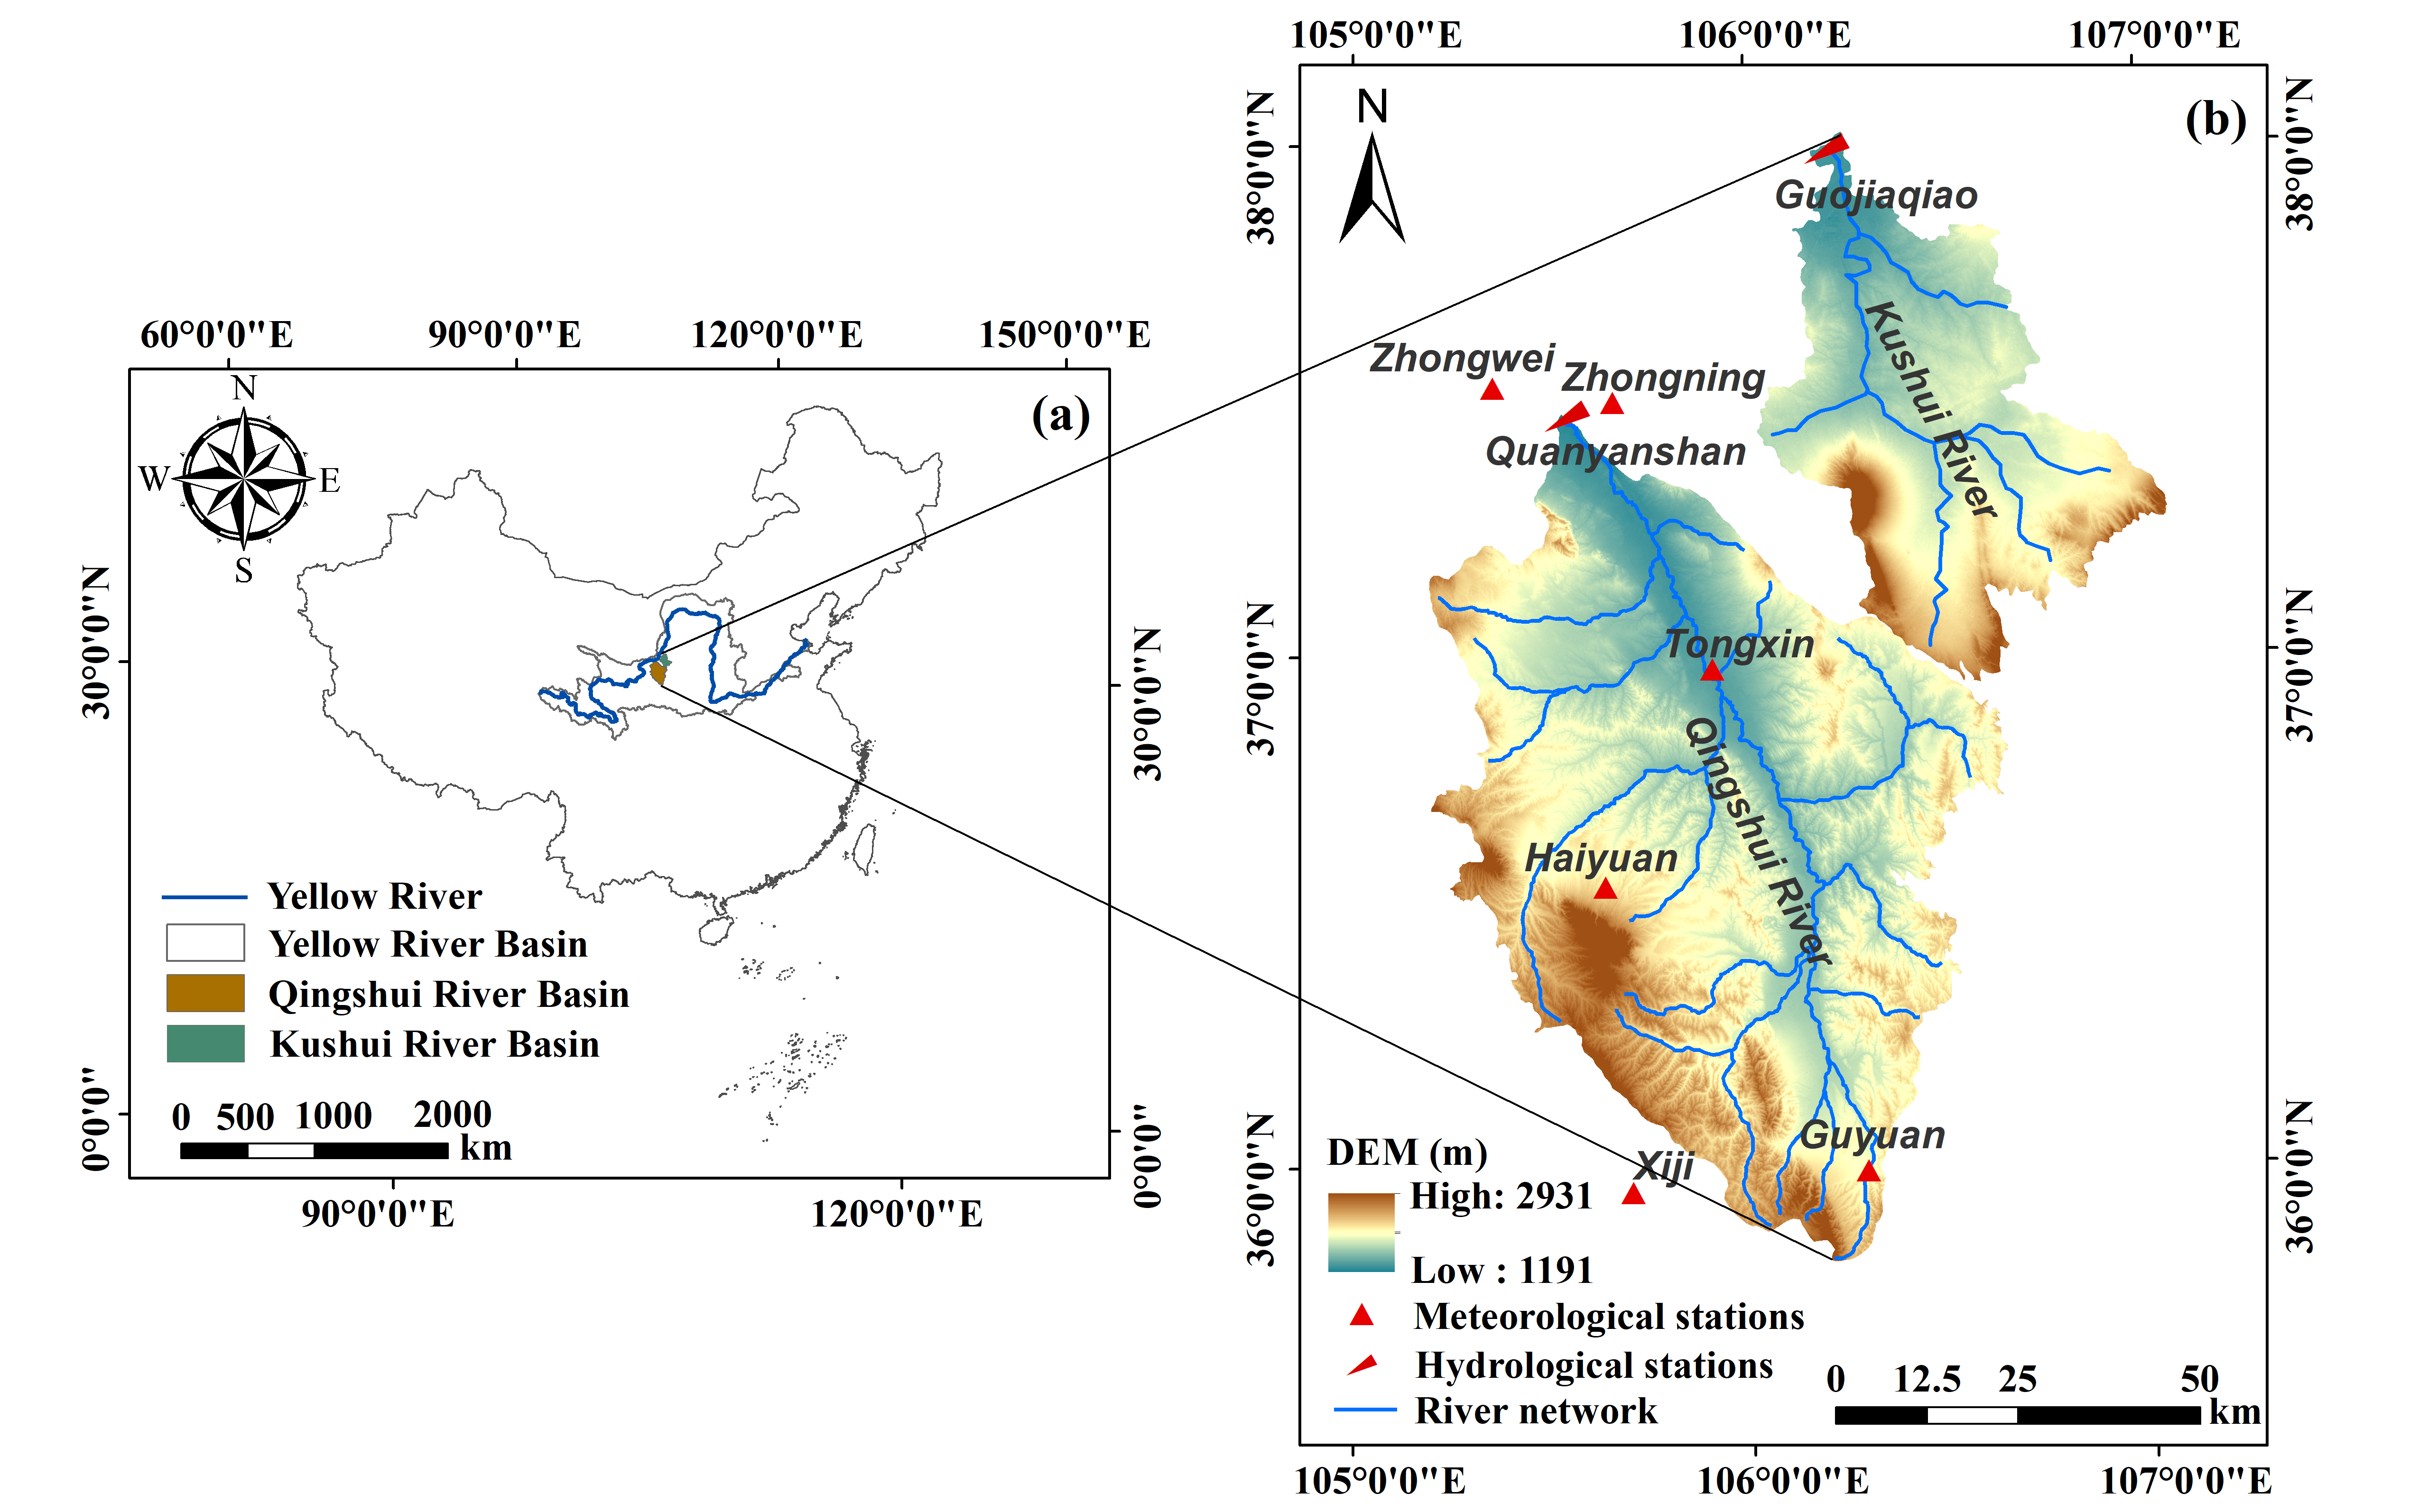
The Ningxia reach of the Yellow River lies in the lower section of the upper Yellow River. The QSR and KSR are the major tributaries discharging into the Yellow River along this reach (Figure 1). As the largest first-order tributary within the Ningxia reach of the Yellow River, the QSR is geographically located at 105°00′–107°07′ E and 35°36′–37°37′ N, with a drainage area of 14,481 km2. The QSR Basin had an annual average runoff of 129.3 million m3 and an annual average sediment discharge of 26.7 million t from 1990 to 2020. The QSR Basin features a temperate semi-arid climate, with an annual mean temperature of 6.2 °C for the period 1990–2020. The long-term annual average precipitation in the basin is approximately 335 mm, while potential evapotranspiration is substantially higher than precipitation, with a long-term annual mean potential evaporation ranging from 1000 to 1400 mm over the same period. The QSR Basin represents one of the most severe soil erosion areas in the upper Yellow River and is also a typical water-scarce basin in this region. Severe declines in groundwater levels coupled with increased water mineralization have posed substantial challenges to the basin’s ecological security [24]. The KSR is the second-largest tributary flowing into the Yellow River in the Ningxia reach. Its geographic coordinates are 106°02′–107°15′ E and 35°03′–38°05′ N; it has a total length of 224 km and an overall drainage area of 5447 km2. Situated at the junction of the Tengger Desert and the Mu Us Sandy Land, the KSR Basin is dominated by aeolian sand hills in terms of landforms. The KSR Basin had an annual average runoff of 141.0 million m3 and an annual average sediment discharge of 6.3 million t from 1990 to 2020. Characterized by a continental arid-semiarid climate, the basin has a long-term annual mean temperature of 7.3–9.8 °C and long-term annual average precipitation of 188.8–246.6 mm for the period 1990–2020. Natural hazards such as frost and hailstorms occur frequently across the basin [25]. Grassland and cropland constitute the dominant land-cover types in both basins.
Figure 1.
Overview map of the research area. (a) Location of the QSR and KSR Basins in the Yellow River Basin; and (b) the locations of the meteorological stations, hydrological stations, and river network in the QSR and KSR Basins.
2.2. Data Sources
The monthly scale-observed RSD data (1989–2019) from the hydrological stations at the outlets of major first-order tributaries (Quanyanshan and Guojiaqiao) along the Ningxia reach of the Yellow River were obtained from the Yellow River Conservancy Commission of the Ministry of Water Resources of China. In this study, RSD denotes stream flow volume and sediment transport mass. Runoff is summed from daily flow data (unit: m3), while sediment discharge is summed from daily sediment load, calculated as daily sediment concentration multiplied by daily flow (unit: t). The meteorological data for the corresponding period were sourced from the National Meteorological Science Data Center: http://data.cma.cn (accessed on 18 October 2024). The Digital Elevation Model (DEM) with a spatial resolution of 30 m was provided by the Institute of Geographic Sciences and Natural Resources Research, Chinese Academy of Sciences. Six land-use phase datasets spanning 1990–2020, with a spatial resolution of 30 m, were obtained from the Resource and Environment Science and Data Center, Chinese Academy of Sciences: http://www.resdc.cn (accessed on 23 October 2024). ArcGIS 10.2, R language, MATLAB 2020b, Origin 2026, and Fragstats 4.2 were adopted for data analysis and plotting in this section.
2.3. Pettitt Abrupt Change Test
The Pettitt (PT) abrupt change test, a nonparametric change-point detection method, was adopted to identify abrupt change points of RSD time series. It does not require normal distribution assumptions for hydrological data and can detect the most probable timing of a single significant shift in the series [26].
2.4. Land-Use Transition Matrix
In this study, the Markov transition matrix model was adopted to quantitatively characterize the conversions among different land-use types in the watershed. The mathematical formula of the land-use transition matrix is given below [27]:
where i and j represent land-use types of the watershed, and Aij denotes the transition probability from land-use type i to land-use type j. Aij must satisfy two conditions simultaneously: 0 ≤ Aij ≤ 1 and ∑jAij = 1.
2.5. Land-Use Dynamic Degree
Land-use dynamic degree can quantitatively characterize the numerical variation in a specific land-use type within a given region over a certain period, and effectively reveal the intensity of land-use type changes in the watershed. The single land-use dynamic degree measures the areal change intensity of a given land-use type at a specific spatiotemporal scale and accurately reflects its spatial evolution characteristics. By contrast, the comprehensive land-use dynamic degree systematically characterizes the overall regional land-use change rate by integrating and quantifying multi category land-use change information. The mathematical expression for the single land-use dynamic degree is presented below [28]:
where K is the value of land-use dynamic degree for a given period. A larger K indicates a greater change magnitude for this land type; T represents the time interval between the end and the start of the study period; Ut0 is the area of a certain land type at the beginning of the study period; and Ut denotes the area of the same land type at the end of the study period.
The mathematical expression for the comprehensive land-use dynamic degree is given below [28]:
where C is the comprehensive land-use dynamic degree for a given period, T denotes the time interval between the end and the start of the study period, LAi is the area of the i-th land-use type, and LAi−j represents the absolute value of area converted from the i-th land-use type to the j-th land-use type during the study period.
2.6. Quantification of Qualitative Indicators in the Ensemble Evaluation System
To achieve its scientific and quantitative description, landscape metrics were introduced as core parameters in this study. These metrics can effectively characterize the spatial configuration and compositional features of landscape patterns and be applied to assess the risk level of soil and water loss [29]. Using Fragstats 4.2 software, we calculated and analyzed key landscape metrics for the typical watershed from 1990 to 2020. The objective was to explore the response mechanism of RSD variations to land-use change in the typical watershed. Landscape-pattern metrics at the landscape level and class level were calculated using FRAGSTATS 4.2, with the queen’s 8-cell neighborhood rule adopted to identify contiguous patches. Several metrics that can effectively reflect watershed landscape-pattern characteristics were selected in this study, including Patch Density (PD), Aggregation Index (AI), Largest Patch Index (LPI), Shannon’s Diversity Index (SHDI), Interspersion and Juxtaposition Index (IJI), Landscape Shape Index (LSI), division index (DIVISION), patch cohesion index (COHESION), and contagion index (CONTAG). PD reflects landscape fragmentation; AI represents the aggregation of patches; LPI indicates the dominance of the largest patch; SHDI describes landscape diversity; IJI characterizes the interspersion degree of different patch types; LSI reflects the complexity of patch shape; DIVISION shows the degree of landscape segmentation; COHESION represents the connectivity of patches; CONTAG quantifies the aggregation degree of dominant patch types. Calculations and detailed interpretations of these landscape metrics followed the standard algorithms embedded in FRAGSTATS 4.2 and referred to relevant studies [30,31]. The derived metric values were further used to explore their quantitative associations with basin runoff and sediment discharge.
2.7. Partial Least Squares Regression Model
As a multivariate statistical technique, partial least squares regression (PLSR) integrates the technical strengths of principal component extraction, canonical correlation analysis, and multiple linear regression modeling. It can effectively cope with datasets characterized by limited sample sizes and high multicollinearity among variables. In the field of ecohydrological research, the PLSR model demonstrates capability to interpret the linkage mechanism between landscape patterns and water–sediment processes of watershed systems. By eliminating autocorrelation among variables, this method reduces data noise and maximizes the interpretation of variance characteristics for dependent variables [32]. In this study, runoff and sediment yield were adopted as dependent variable indicators, and landscape metrics representing spatial configuration of surface cover were selected as independent variables. The PLSR model was applied to calculate the variable importance in projection and quantify the influence weight of each explanatory factor on hydrological processes. The mathematical expression of this method is given below [33,34]:
where Q2cum stands for the predictive capability of the cumulative principal component model; Pi refers to the predicted value obtained by cross-validation when the i-th sample is excluded; qi is the observed runoff or sediment yield of sample i and pi denotes the fitted predicted value from the model established using all samples; k denotes the k-th latent variable of the PLSR model; m is the number of principal components in the PLSR model; and n represents the sample size.
3. Results
3.1. Variation Characteristics of RSD in Major Tributaries
Nearly 70-year time series of RSD at each hydrological station were divided into different periods by decade to obtain decadal variation characteristics of RSD for major tributaries in the Ningxia reach of the Yellow River (Table 1). The results showed that QSR exhibited a decreasing trend in RSD; KSR showed an increasing trend in runoff and a decreasing trend in sediment discharge. Overall, the RSD variations at the gauging stations of major Yellow River feeding tributaries shared similar temporal features. For the entire 1955–2019 period, the runoff of QSR ranged from 0.184 × 10⁸ m3 to 3.948 × 10⁸ m3, with a multi-decadal average of 1.174 × 10⁸ m3; its sediment discharge ranged from 0.00008 × 10⁸ t to 1.220 × 10⁸ t, with a multi-decadal average of 0.246 × 10⁸ t. For KSR, runoff varied between 0.103 × 10⁸ m3 and 2.131 × 10⁸ m3, with a multi-decadal average of 0.992 × 10⁸ m3; sediment discharge ranged from 0.0003 × 10⁸ t to 0.367 × 10⁸ t, with a multi-decadal average of 0.047 × 10⁸ t. Both runoff and sediment discharge of the two tributaries were relatively high during 1990–1999; in particular, sediment discharge in this decade was markedly higher than that in other periods. By contrast, the decadal mean sediment discharge of both tributaries during 2010–2019 was lower than their respective long-term averages.
Table 1.
Decadal variation characteristics of runoff and sediment discharge in QSR and KSR.
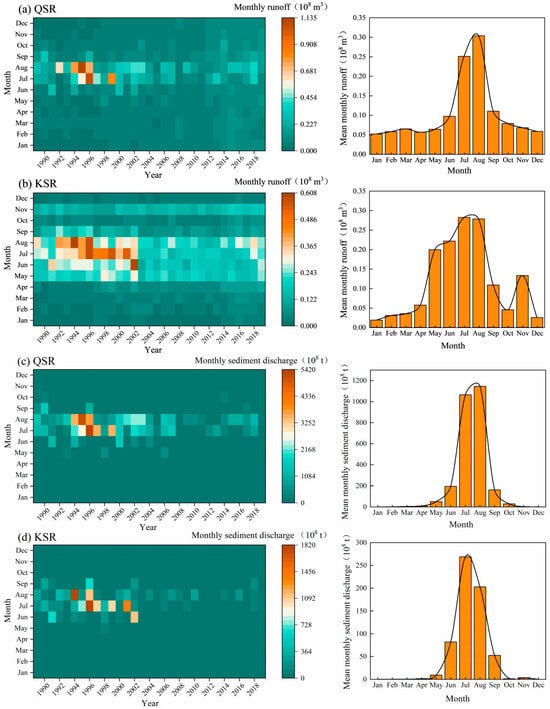
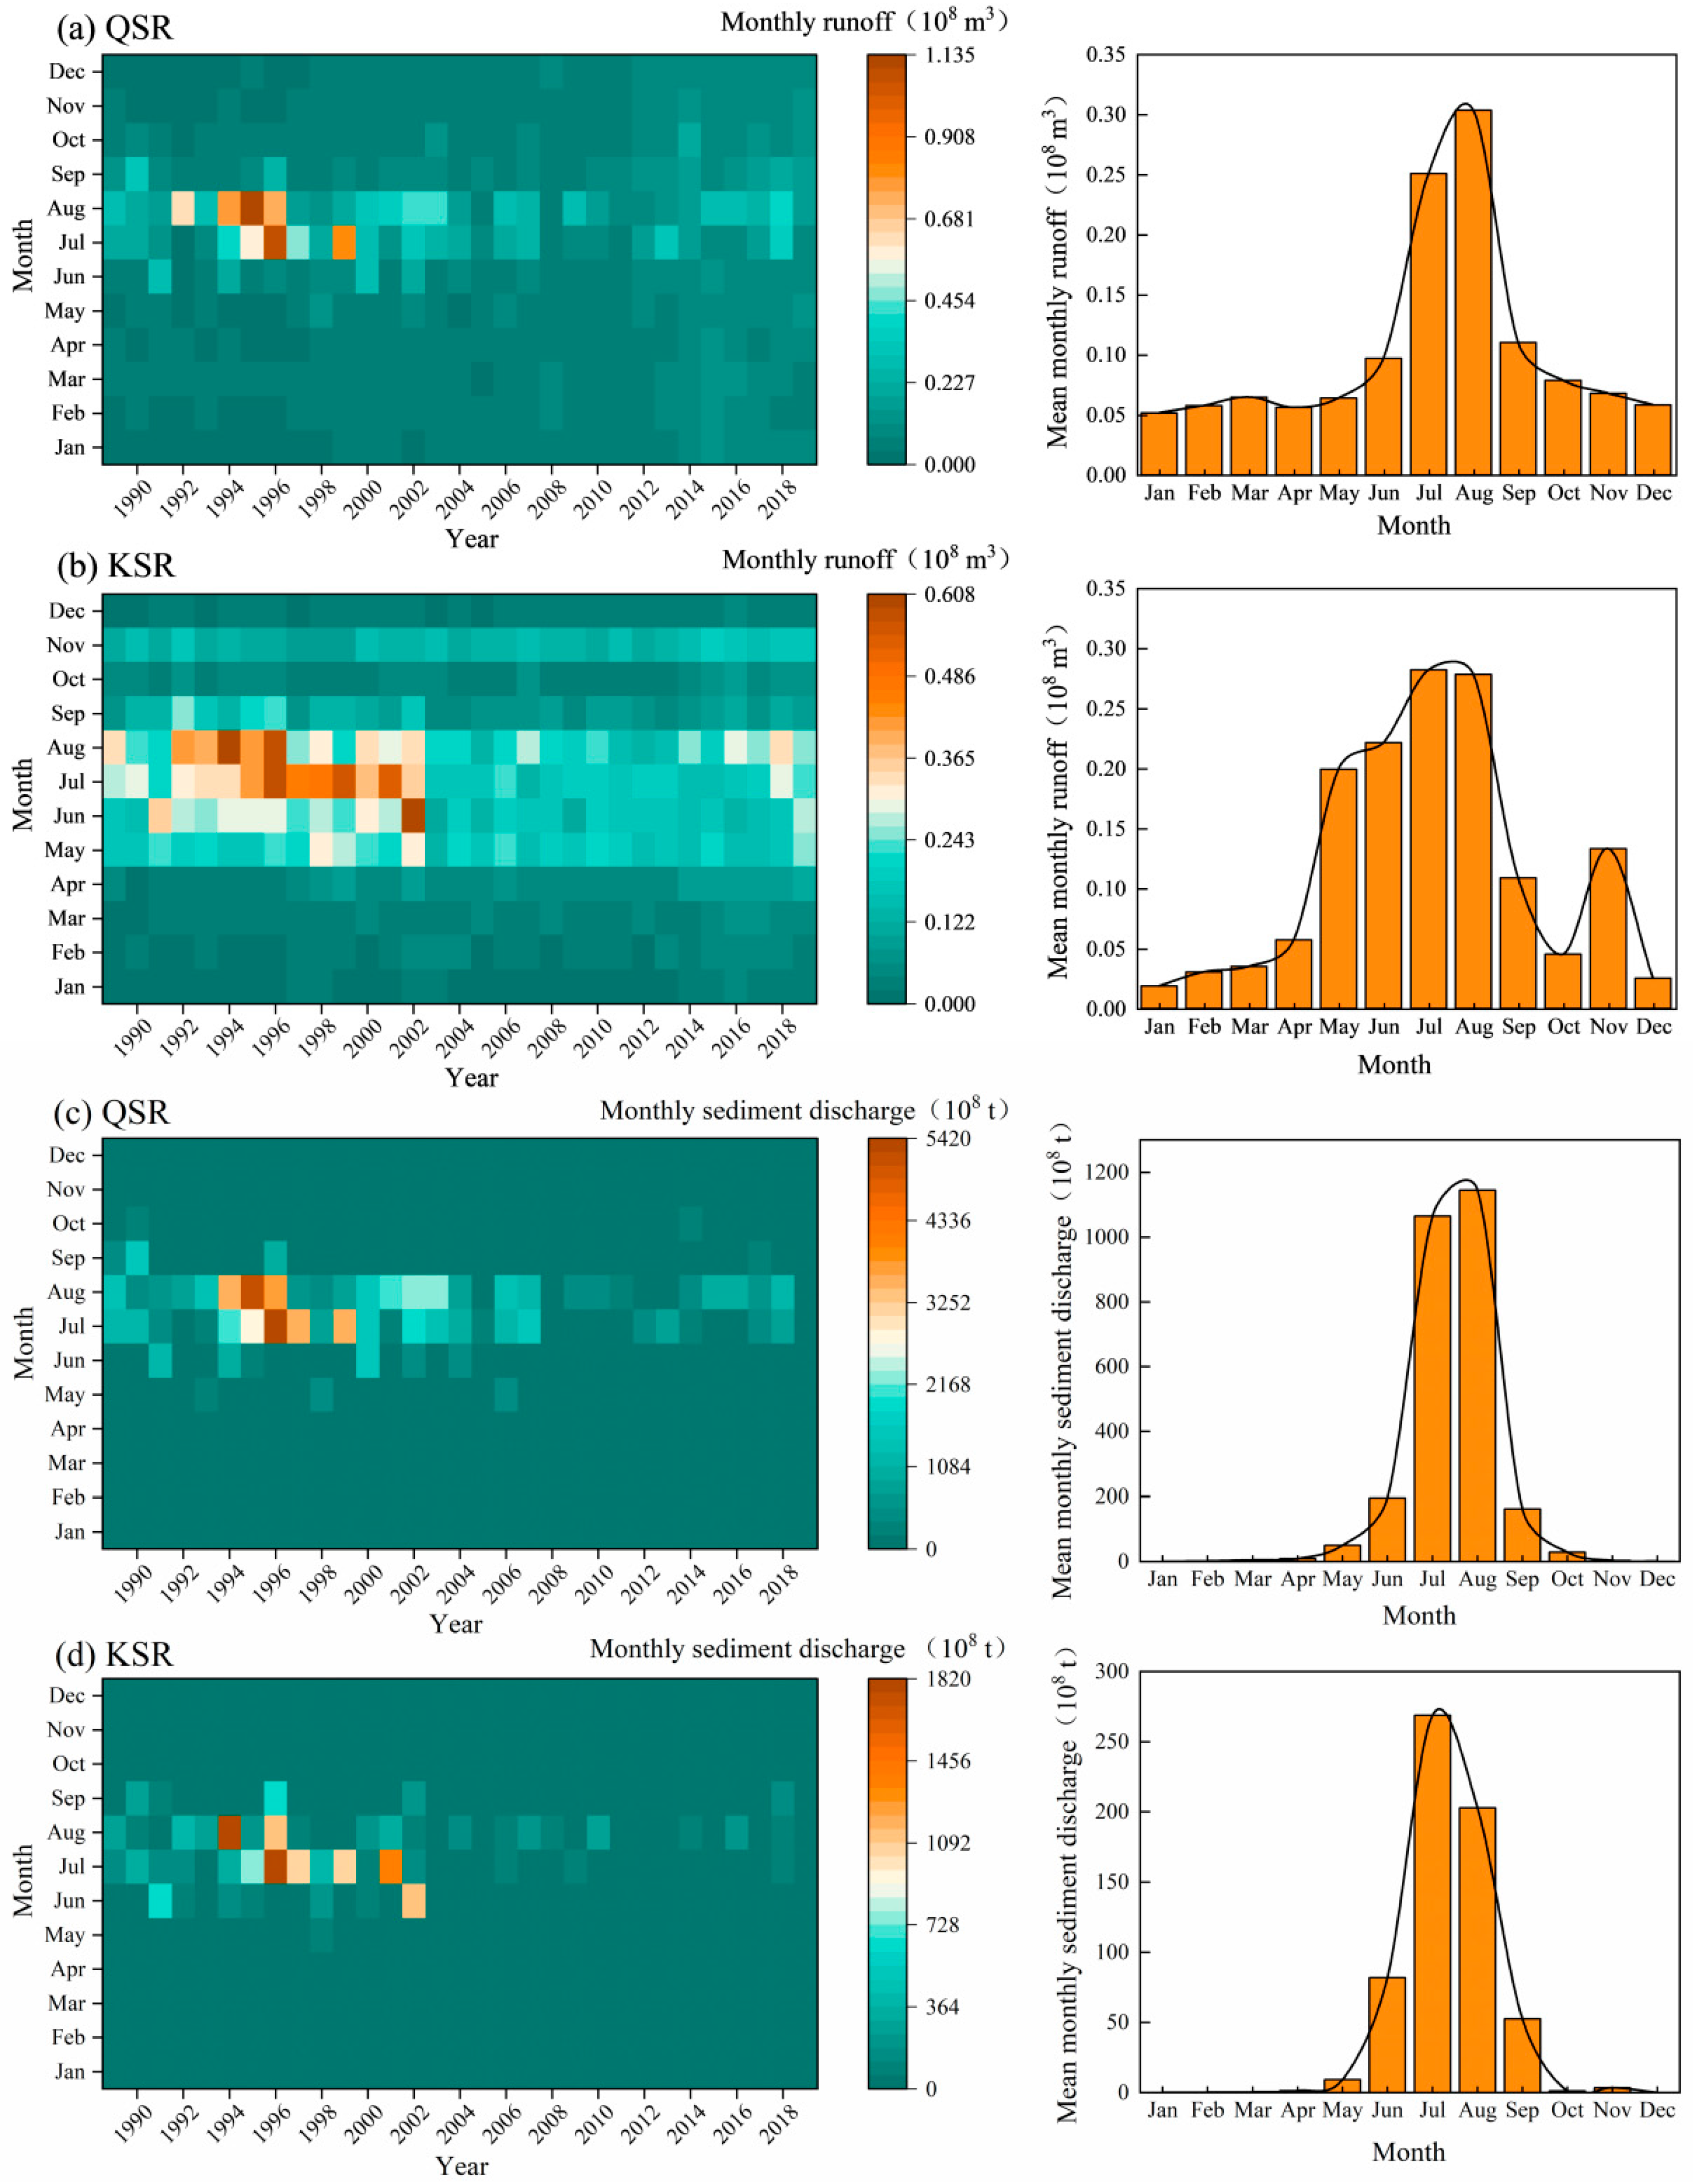
The variation coefficient, Cv, of QSR runoff and sediment time series decreased over time, indicating that inter-annual fluctuation intensity of its RSD gradually declined. For KSR, the inter-annual fluctuation intensity of runoff time series gradually decreased, while that of sediment discharge time series decreased first and then increased. Among them, QSR runoff time series had the most prominent fluctuation with a multi-year mean variation coefficient of 0.437, and the maximum Cv occurred in 1970–1979. By contrast, KSR sediment discharge time series showed the strongest fluctuation with a multi-year mean Cv of 1.070, and intense inter-annual sediment variation was observed during 1955–1969. Further analysis was performed on monthly distribution and intra-annual allocation characteristics for gauging stations of major Yellow River feeding tributaries over the past 30 years (Figure 2). The results revealed that RSD of major tributaries mainly concentrated in July and August, followed by June and September. This seasonal pattern is consistent with the monthly precipitation regime. Heavy rainfall events in both basins mostly occur in July and August. Precipitation is unevenly distributed, with summer rainfall (June–September) dominating the annual total. Accordingly, RSD of major tributaries was highly concentrated in the flood season, with its proportion in flood season substantially exceeding that in the non-flood season, and values remained obviously low in the remaining months. Furthermore, compared with the intra-annual distribution of runoff, the intra-annual allocation of sediment discharge for major tributaries was more concentrated within June to September, and sediment discharge was extremely low in other months. Although runoff reached its peak from July to August, it had obvious occurrences in all months.
Figure 2.
Monthly distribution and intra-annual allocation characteristics of runoff and sediment discharge for QSR and KSR.
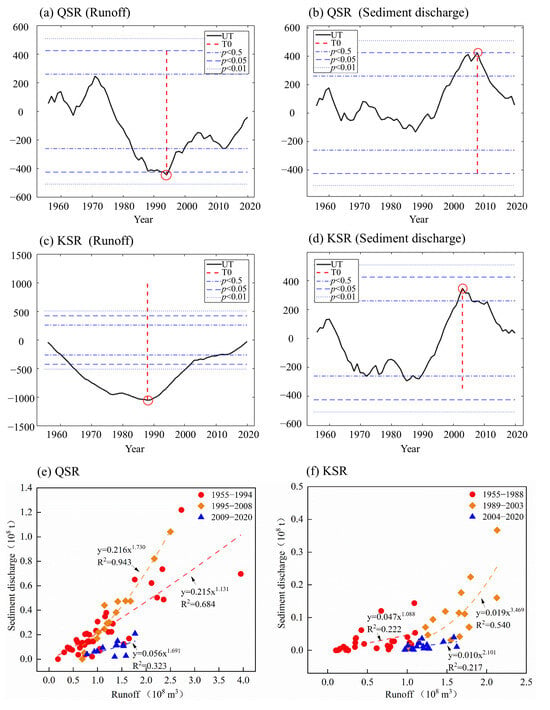
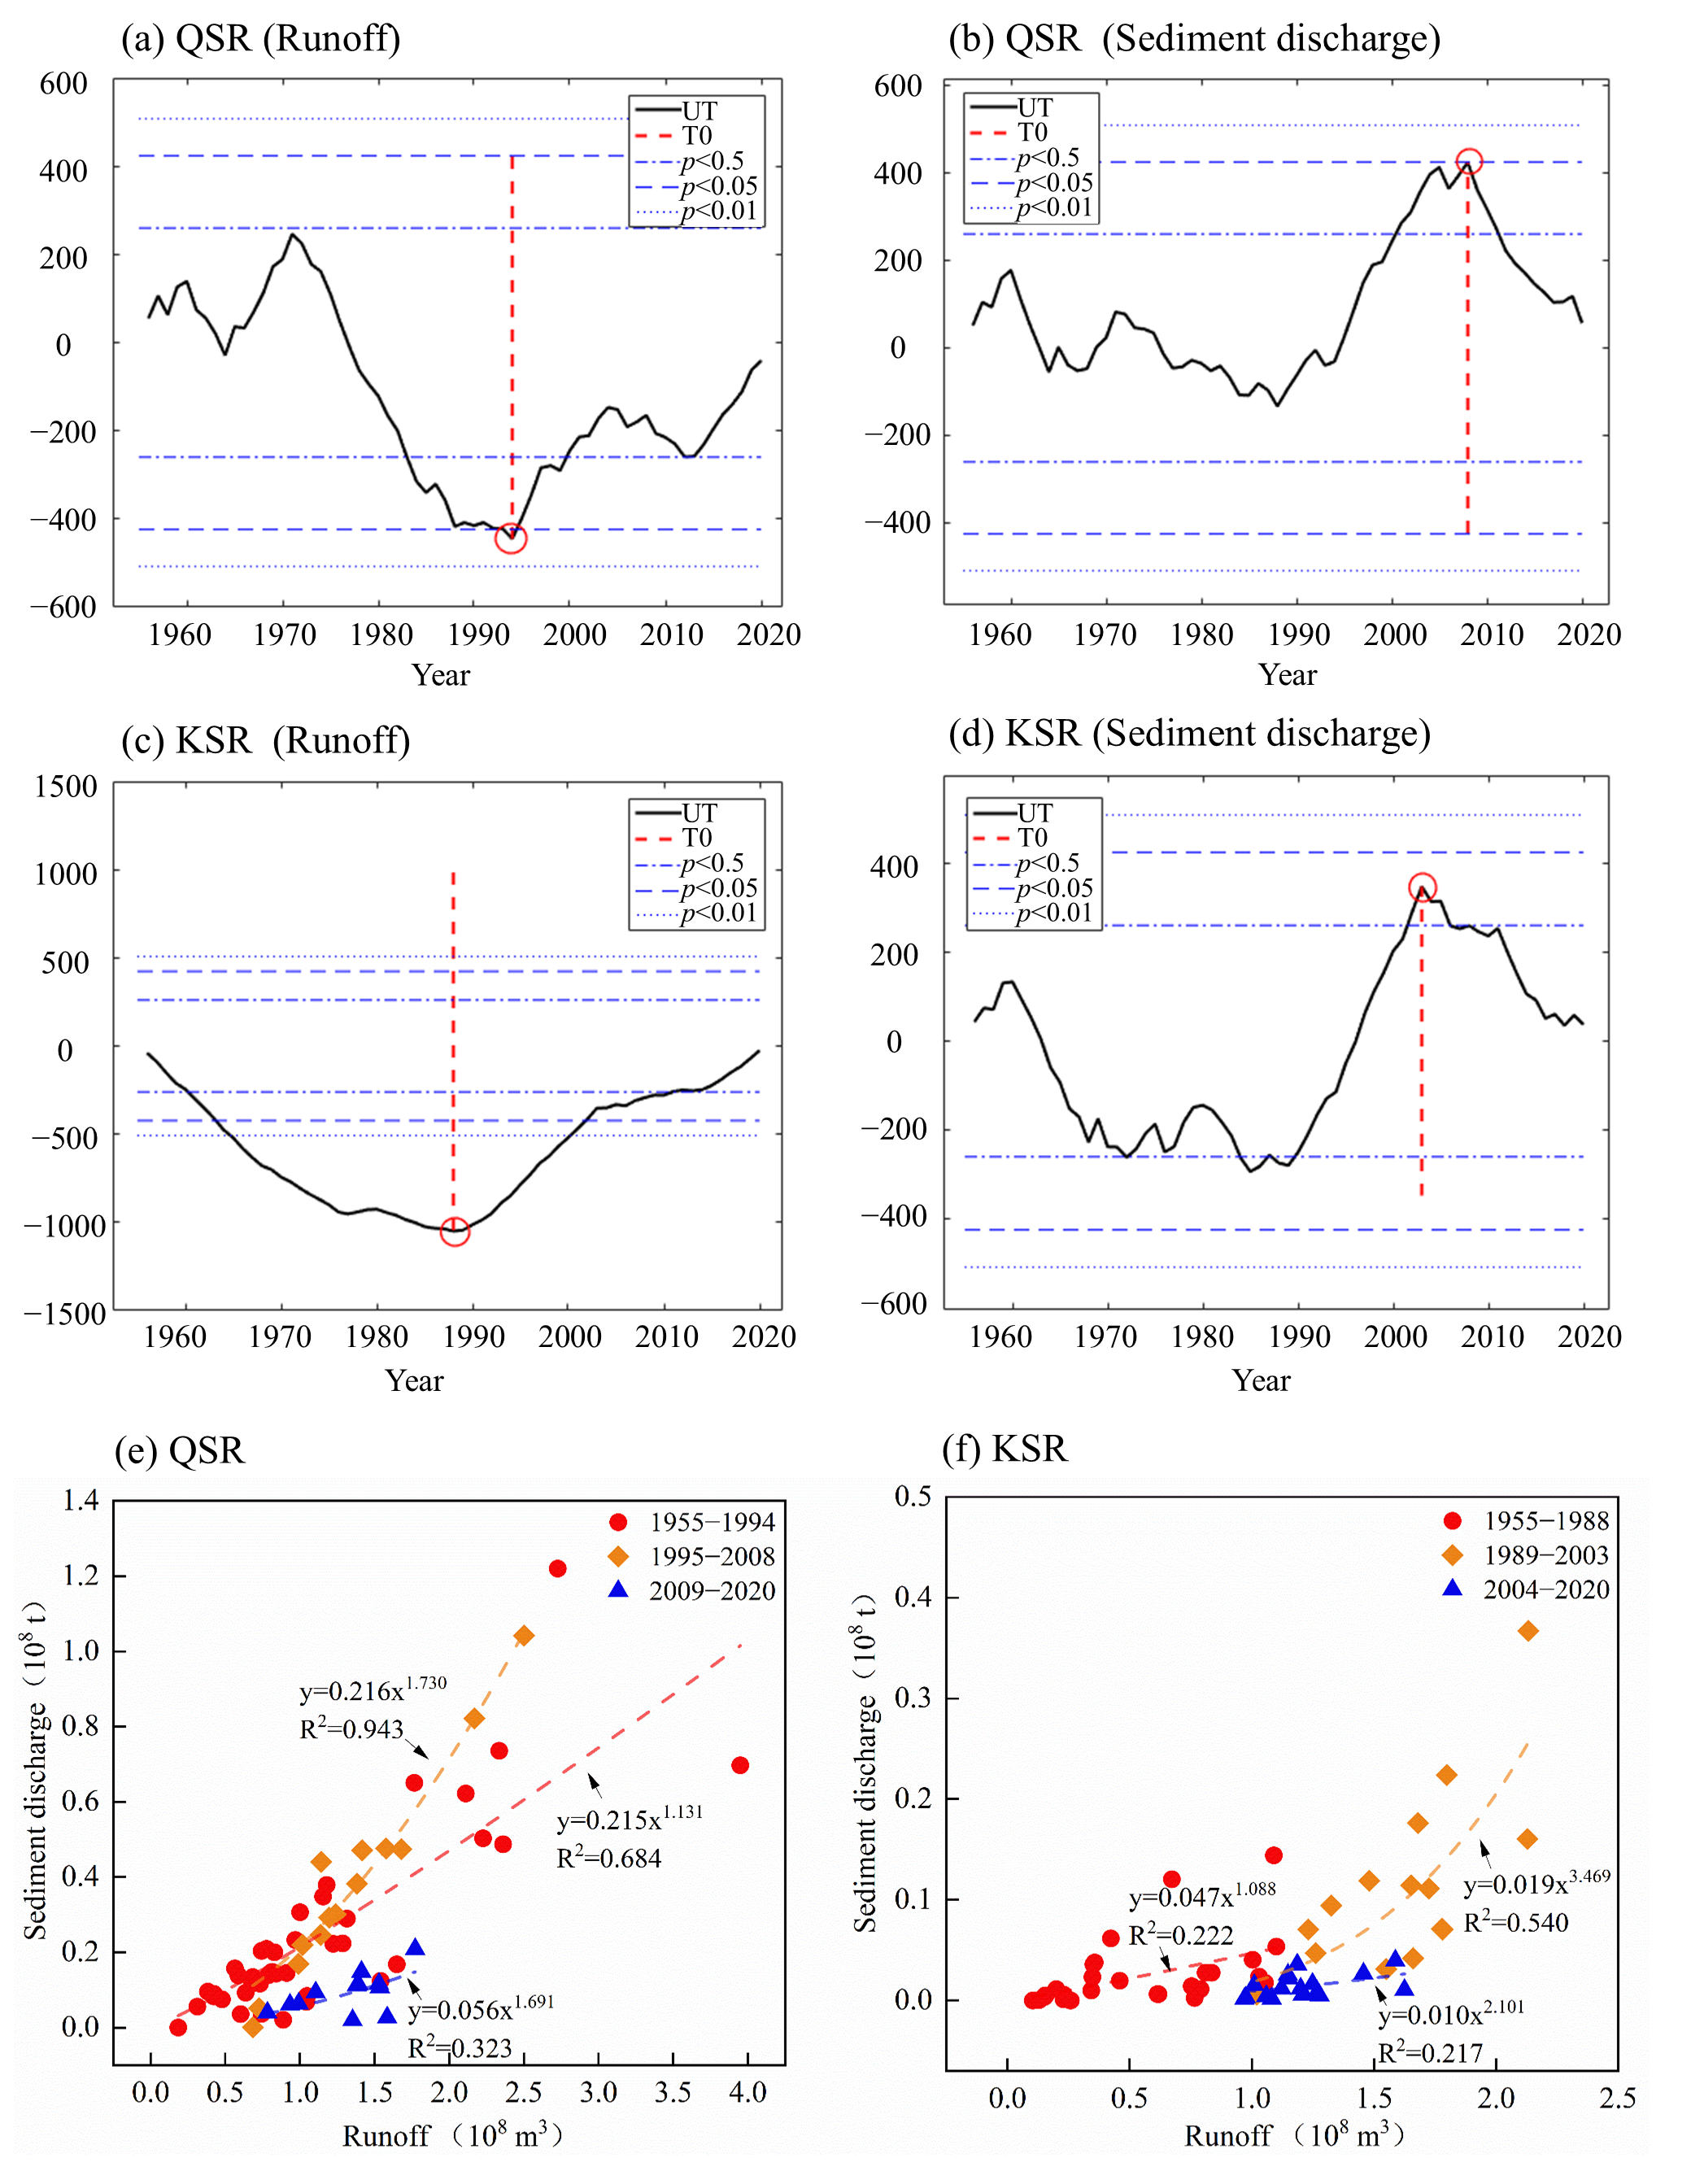
To determine specific analytical periods for the inter-annual RSD relationship, abrupt change analysis was conducted on RSD time series of the QSR and KSR (Figure 3a–d). The results indicated that the abrupt change years for RSD series of QSR were 1994 and 2008, respectively, whereas those for KSR were 1988 and 2003. Changes in RSD relationships of QSR and KSR across different periods are illustrated in Figure 3e,f. The power function was identified as the optimal functional form describing RSD relationships for the two tributaries, and RSD relation curves differed remarkably among periods. The power function for QSR achieved better fitting performance than that for KSR. The second stage (1995–2008) yielded the highest coefficient of determination (R2 = 0.943). In this stage, QSR runoff decreased first and then increased while channel sediment delivery declined; consequently, both coefficients of the power function rose in the second stage (1995–2008). During the third stage (2009–2020), sediment discharge reduction rate exceeded runoff reduction rate, and the two coefficients of fitted power function declined relative to the second stage. The power function curve gradually flattened, demonstrating that the expansion of soil and water conservation measures substantially reduced hillslope sediment yield and induced a downward trend in the incoming sediment coefficient (the ratio of sediment concentration to discharge, with a unit of kg·s·m−6, reflecting the water–sediment matching condition). For KSR, the highest coefficient of determination appeared in the second stage (1989–2003) (R2 = 0.540). In the third stage (2004–2020), two coefficients of fitted power function decreased compared with the second stage, the power function curve became flatter, and the incoming sediment coefficient presented a declining trend. In summary, since 2000, with remarkable expansion of coverage area for soil and water conservation measures, ecological benefits have become increasingly prominent. The ecological environment in the QSR and KSR Basins has been obviously improved, and hillslope sediment yield has been greatly reduced.
Figure 3.
(a,b) Pettitt abrupt change test for RSD series of the QSR, respectively; (c,d) Pettitt abrupt change test for RSD series of the KSR, respectively; and (e,f) variations in RSD relationships for the QSR and KSR in different periods, respectively.
3.2. Spatiotemporal Variation Characteristics of Land Use in Typical Watersheds
The annual statistical characteristics of land use in the QSR and KSR watersheds are presented in Table 2. Grassland dominated land-cover composition in both watersheds. In terms of area changes across land-use types, grassland experienced the largest magnitude of change, followed by forest. Built-up land exhibited an increasing trend across periods for both watersheds, with the fastest growth rate occurring during 2000–2010 (6.985 km2/a and 5.478 km2/a for QSR and KSR, respectively). The most rapid grassland decline was observed in 1990–2000 (−52.918 km2/a for QSR and −46.685 km2/a for KSR). Cropland expanded most rapidly from 1990 to 2000 at rates of 45.258 km2/a and 45.633 km2/a for QSR and KSR, respectively.
Table 2.
Annual statistical characteristics of land use in the QSR Basin and KSR Basin from 1990 to 2020.
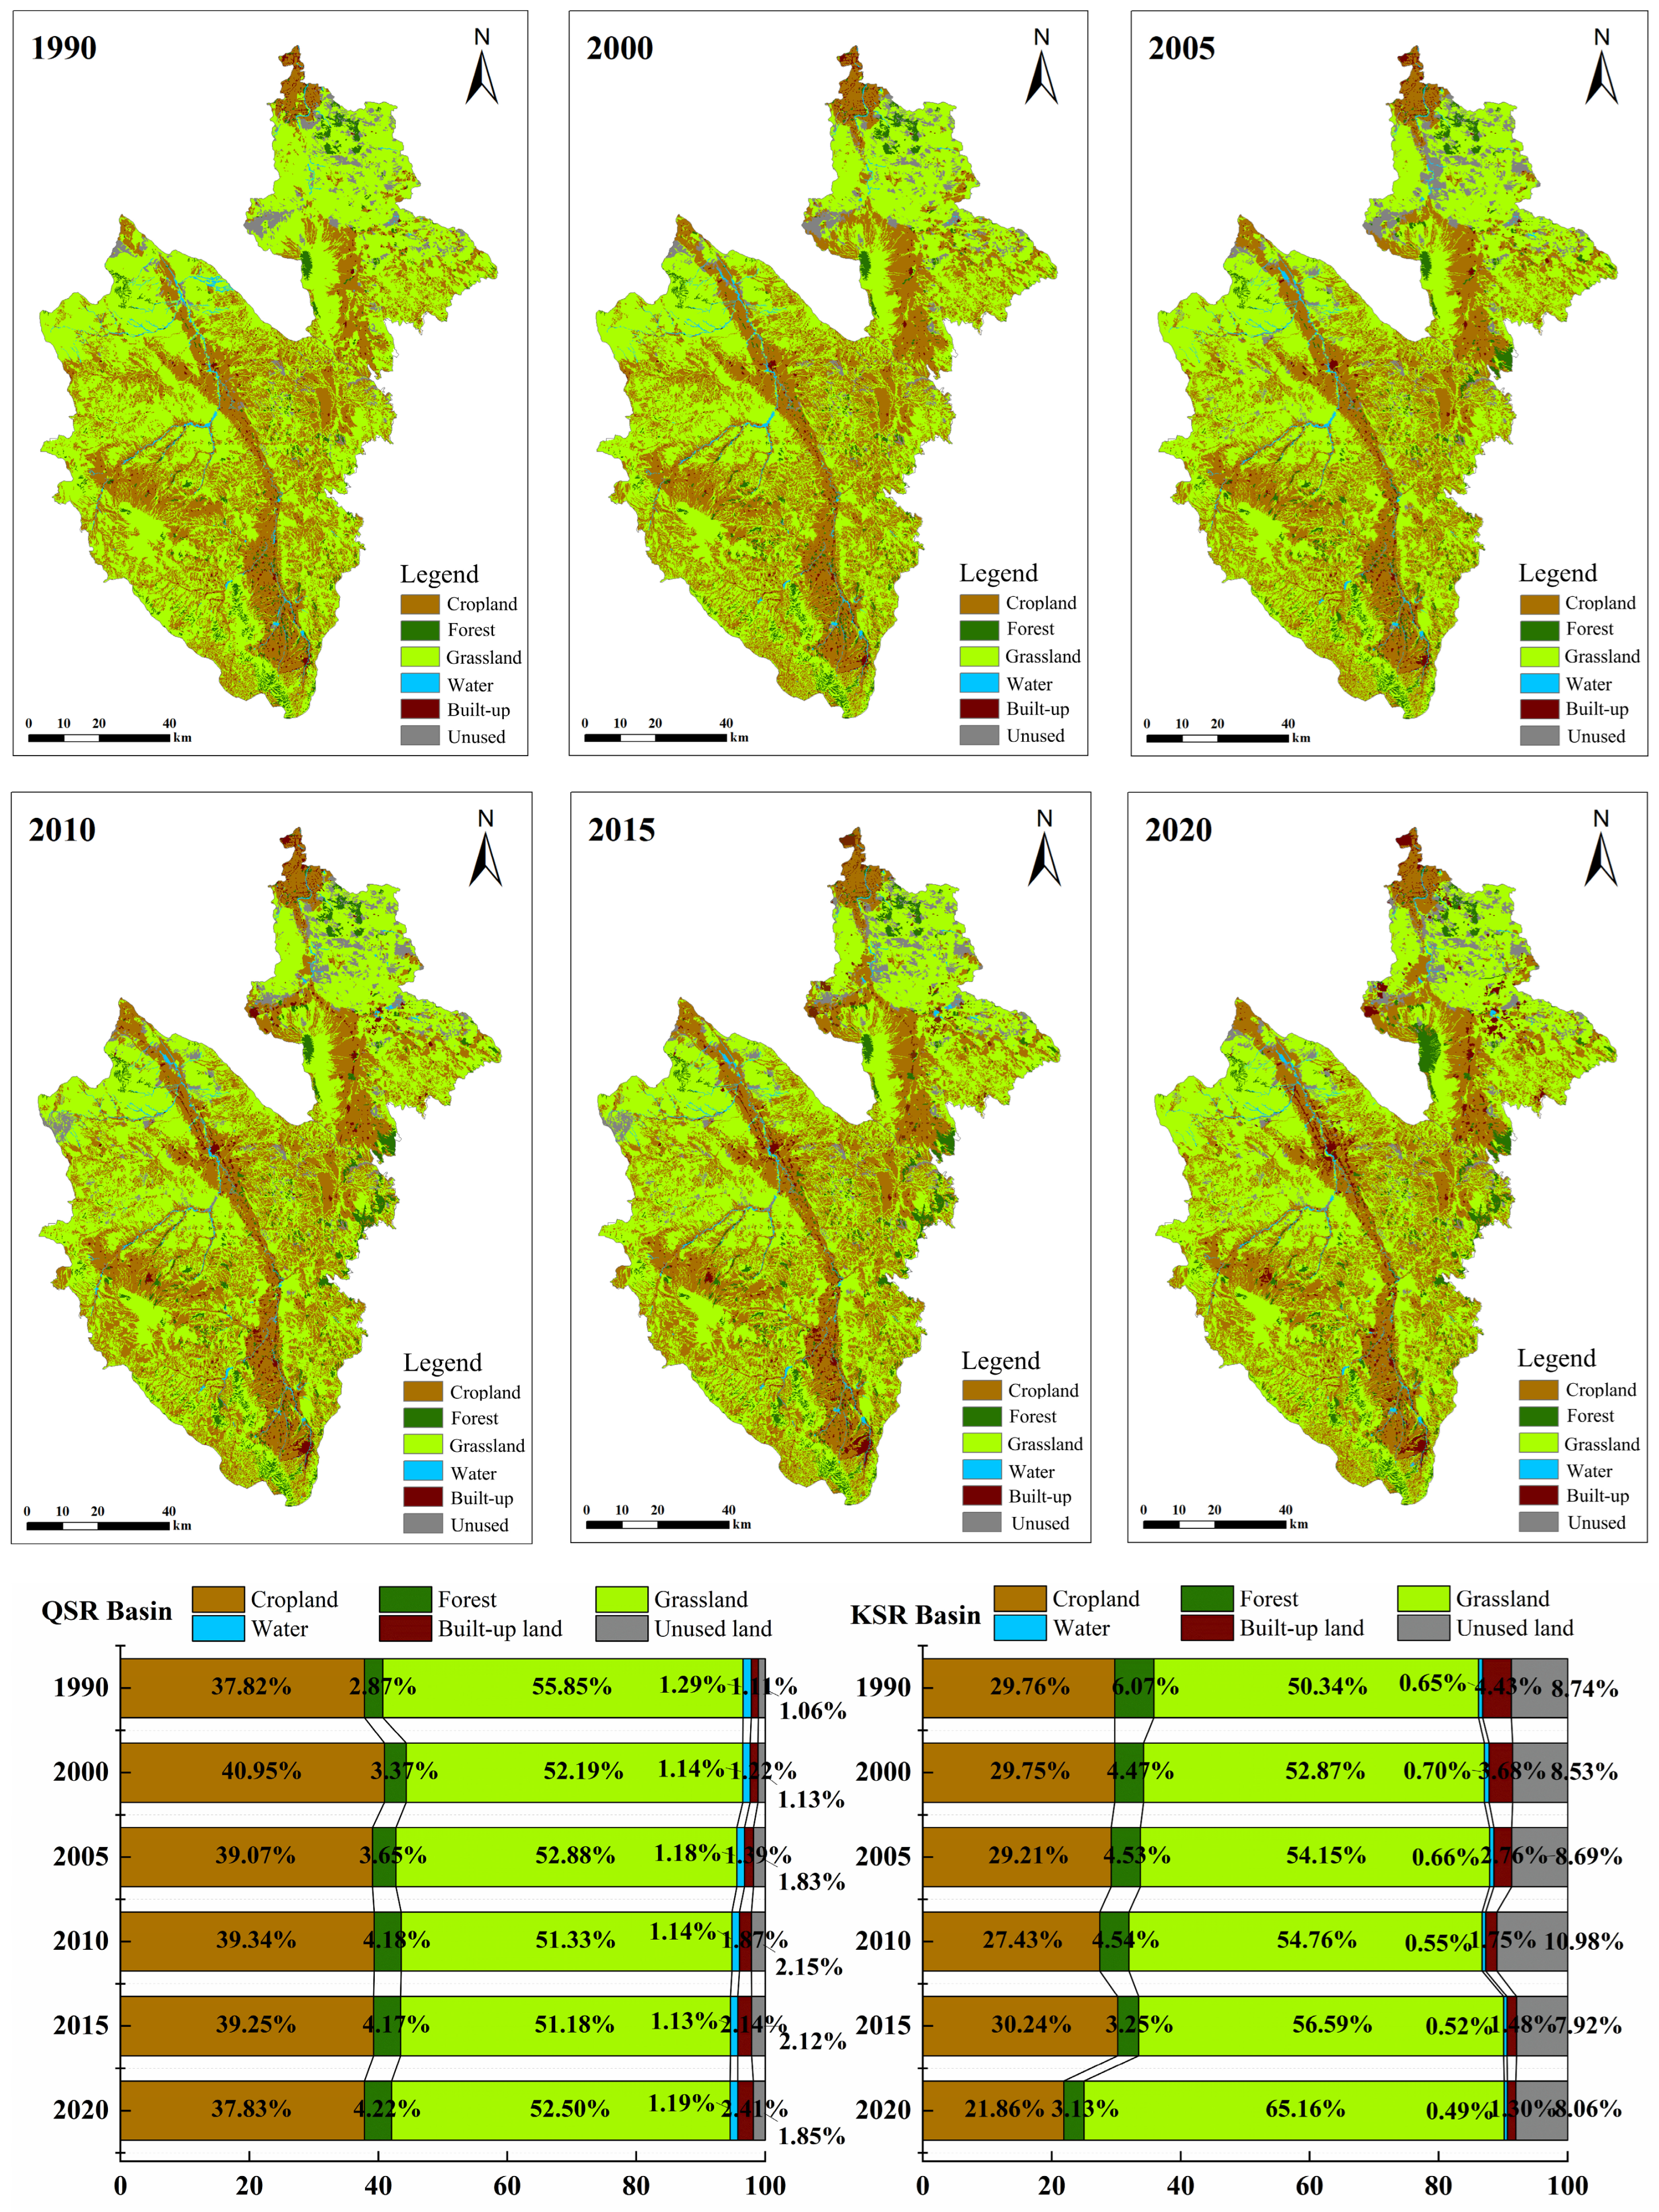
Spatial patterns and temporal proportional variations in land-use types from 1990 to 2020 for QSR and KSR watersheds are illustrated in Figure 4. Grassland and cropland were the predominant land-use types in both watersheds, among which grassland was overwhelmingly dominant and widely distributed over the entire watersheds. From 1990 to 2020, grassland proportion ranged from 51.18 to 55.85% in QSR and from 50.34 to 65.16% in KSR. Cropland was relatively concentrated and mainly distributed along main streams and tributaries within the two watersheds. Regarding temporal shifts in area proportion, QSR showed the largest variation in grassland share, with a net decrease of 3.35%, and the maximum reduction (−3.66%) took place in 1990–2000. By contrast, KSR yielded the most pronounced change for grassland with a net increase of 14.82%, and its largest increment (8.57%) occurred during 2015–2020.
The land-use changes in the two basins are mainly derived from transitions among different land-use types. To identify major transitions of land-use types over 1990–2020, a land-use transition matrix was constructed (Table 3). In the QSR watershed, land-use conversions mainly occurred among cropland, grassland, forest, and built-up land. The largest conversion was grassland to cropland (630.845 km2), while the reverse transition from cropland to grassland reached 379.459 km2. Overall, forest and built-up land expanded, whereas grassland shrank. Total converted area amounted to 1721.455 km2, accounting for 11.89% of the whole watershed. A land-use type is classified as a net inflow type if its total transferred-in area is greater than its total transferred-out area, and as a net outflow type if the total transferred-out area exceeds the transferred-in area. Forest, built-up land, and unused land were net inflow types, and grassland was the primary net outflow type with an outflow area of 882.629 km2. For KSR watershed, conversions primarily happened among cropland, grassland, forest, and unused land. Grassland-to-cropland conversion was the dominant transition (492.992 km2), and cropland-to-grassland conversion was 78.723 km2. Generally, cropland, forest, and built-up land increased, and grassland decreased. The total converted area was 1262.903 km2 (23.19% of total watershed area), where cropland, forest, and built-up land were net inflow categories, and grassland was net outflow.
Table 3.
Land-use transition matrix of the QSR Basin and KSR Basin from 1990 to 2020.
Figure 4.
Spatial and temporal proportional changes in land use in QSR and KSR watersheds from 1990 to 2020.
The single and comprehensive dynamic degrees of land use for successive periods in the QSR and KSR watersheds are shown in Table 4. Obvious inter-period disparities in land-use dynamics were detected between the two watersheds. KSR exhibited more intensive land-use changes: its 1990–2020 comprehensive dynamic degree was 0.494%, compared with 0.115% for QSR. For QSR, the minimum comprehensive dynamic degree (0.054%) occurred in 2010–2015 and the maximum value (0.380%) appeared in 1990–2000, while values fluctuated moderately in other periods. KSR had substantial period to period variation: the minimum comprehensive dynamic degree was 0.299% (2010–2015), and the peak reached 0.928% (2000–2005). In terms of single dynamic degree, cropland in KSR mostly presented positive values during each period, whereas QSR had alternating positive and negative values with nearly unchanged cropland area for the whole 1990–2020 span. Forest dynamic degrees were mostly positive in both watersheds; the 1990–2020 value of KSR (3.132%) was higher than QSR (1.563%), yet negative values were found for both watersheds in 2010–2015. Grassland dynamic degrees were consistently negative for KSR. For QSR, negative values prevailed except for 2000–2005 and 2015–2020, when positive values occurred. The magnitude of grassland dynamics was greater in KSR (−0.758%) than QSR (−0.200%) for 1990–2020. In summary, dominant land-use types driving land-use dynamics varied across periods. Over 1990–2020, single dynamic degrees of grassland and water were negative in QSR, while only grassland showed negative dynamic degree in KSR. Most positive single dynamic degree values in KSR were higher than those in QSR.
Table 4.
Single and comprehensive land-use dynamic degrees of the QSR Basin and KSR Basin in different periods.
3.3. Response of Basin Runoff and Sediment Discharge to Landscape-Pattern Metrics
To explore the responses of runoff and sediment yield to land-use change in typical watersheds, FRAGSTATS 4.2 was adopted to calculate landscape-level metrics (Table 5). The results indicate that PD generally presents an upward trend in the two typical watersheds. This means that landscape fragmentation within watersheds gradually intensifies, large patches tend to split apart, and landscape continuity decreases accordingly. AI shows a decreasing trend, which suggests increasing patch dispersion within watersheds. LPI has obvious fluctuation features with an overall declining trend. This changing trend reveals significant human activity influences on watershed landscape patterns, which are embodied in aggravated landscape fragmentation and improved landscape diversity. SHDI values are all greater than 0.82 and keep rising. It demonstrates that the spatial distribution of various landscape patch types in study areas tends toward balance and the richness of watershed landscape types increases. IJI shows an increasing trend, which means higher mixing level of different vegetation cover grades and rising landscape heterogeneity. LSI presents an upward trend, indicating that shapes of landscape patches in the two typical watersheds become more and more complex. The continuous rising trend of DIVISION demonstrates the enhancement of landscape heterogeneity in typical watersheds. COHESION and CONTAG decrease to different extents. It reflects that patches of the same land type gradually disperse and spatial connectivity among landscape patches weakens. In summary, continuous human activity disturbances over the past thirty years have produced significant influences on landscape patterns of both watersheds. Specific performances include aggravated landscape fragmentation, rising landscape diversity, increased landscape heterogeneity and reduced connectivity for patches of the same land type. Certain differences exist between the two watersheds in landscape patterns and ecological processes. The QSR watershed features high patch density with diversified patch shapes and distributions. The KSR watershed has relatively concentrated patch distribution and high landscape heterogeneity.
Table 5.
Variation characteristics of landscape-pattern metrics in the QSR Basin and KSR Basin across different years.
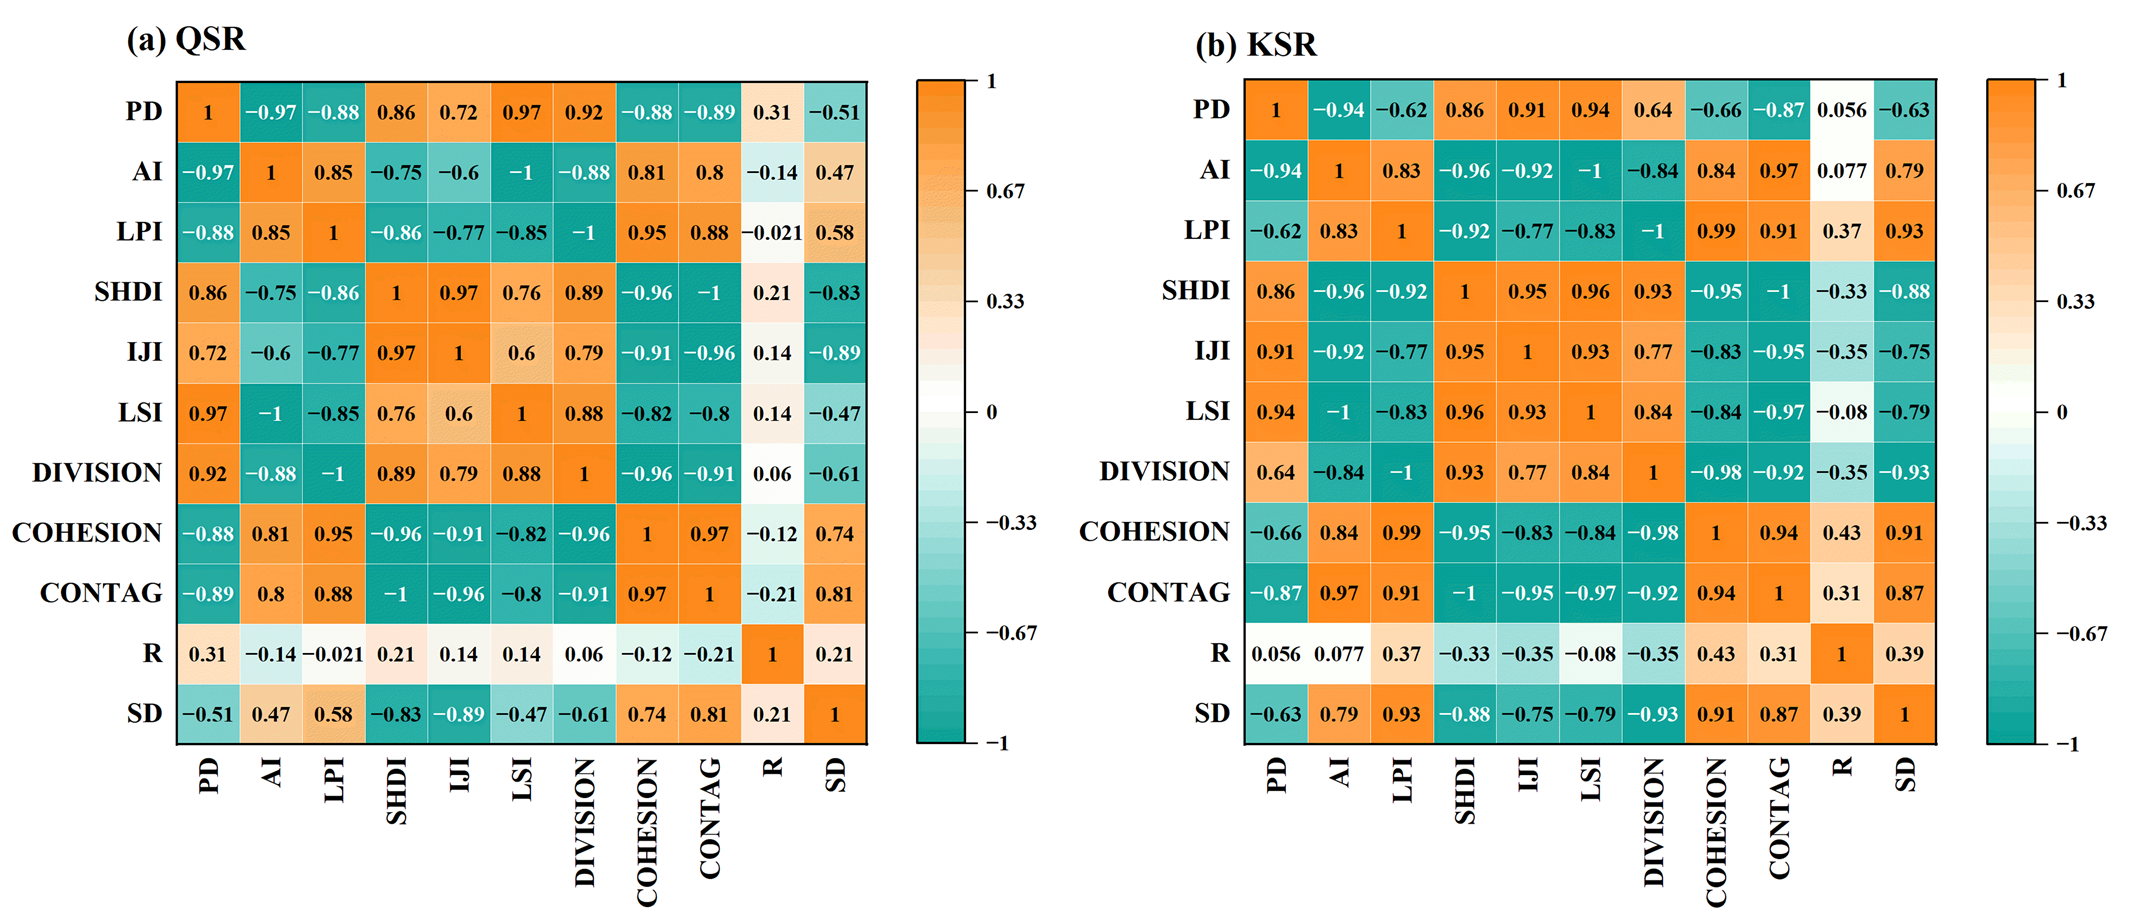
Pearson correlation analysis was further performed to examine relationships between landscape metrics and runoff and sediment yield (Figure 5). The results show that landscape-pattern metrics have substantially stronger correlation with sediment yield process than with runoff process. Specifically, landscape-pattern characteristics exert markedly greater influences on sediment transport process in the KSR watershed than in the QSR watershed. In both watersheds, AI, LPI, COHESION, and CONTAG show positive correlations with sediment yield. It indicates that the increase in landscape contagion and aggregation degree can bring obvious growth of erosion produced sediment yield. The reduction range of sediment yield is inversely proportional to patch connectivity. That is, higher patch connectivity corresponds to smaller reduction range of sediment yield. In addition, PD, SHDI, IJI, LSI, and DIVISION are negatively correlated with sediment yield. This implies that more patches and higher landscape fragmentation can generate more obvious sediment retention effects. For the QSR watershed, runoff has the strongest correlation with PD with a correlation coefficient of 0.31, and sediment yield has the strongest correlation with IJI with a correlation coefficient of −0.89. For the KSR watershed, runoff has the strongest correlation with COHESION, with a correlation coefficient of 0.43, and sediment yield has the strongest correlation with DIVISION, with a correlation coefficient of −0.93.
Figure 5.
Correlation between landscape-pattern metrics and runoff (R) and sediment discharge (SD) in the QSR Basin and KSR Basin.
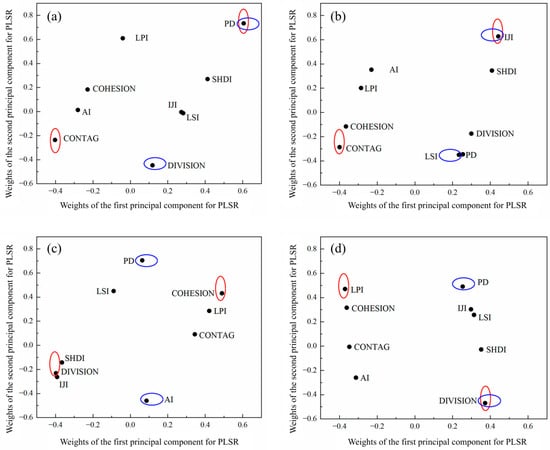
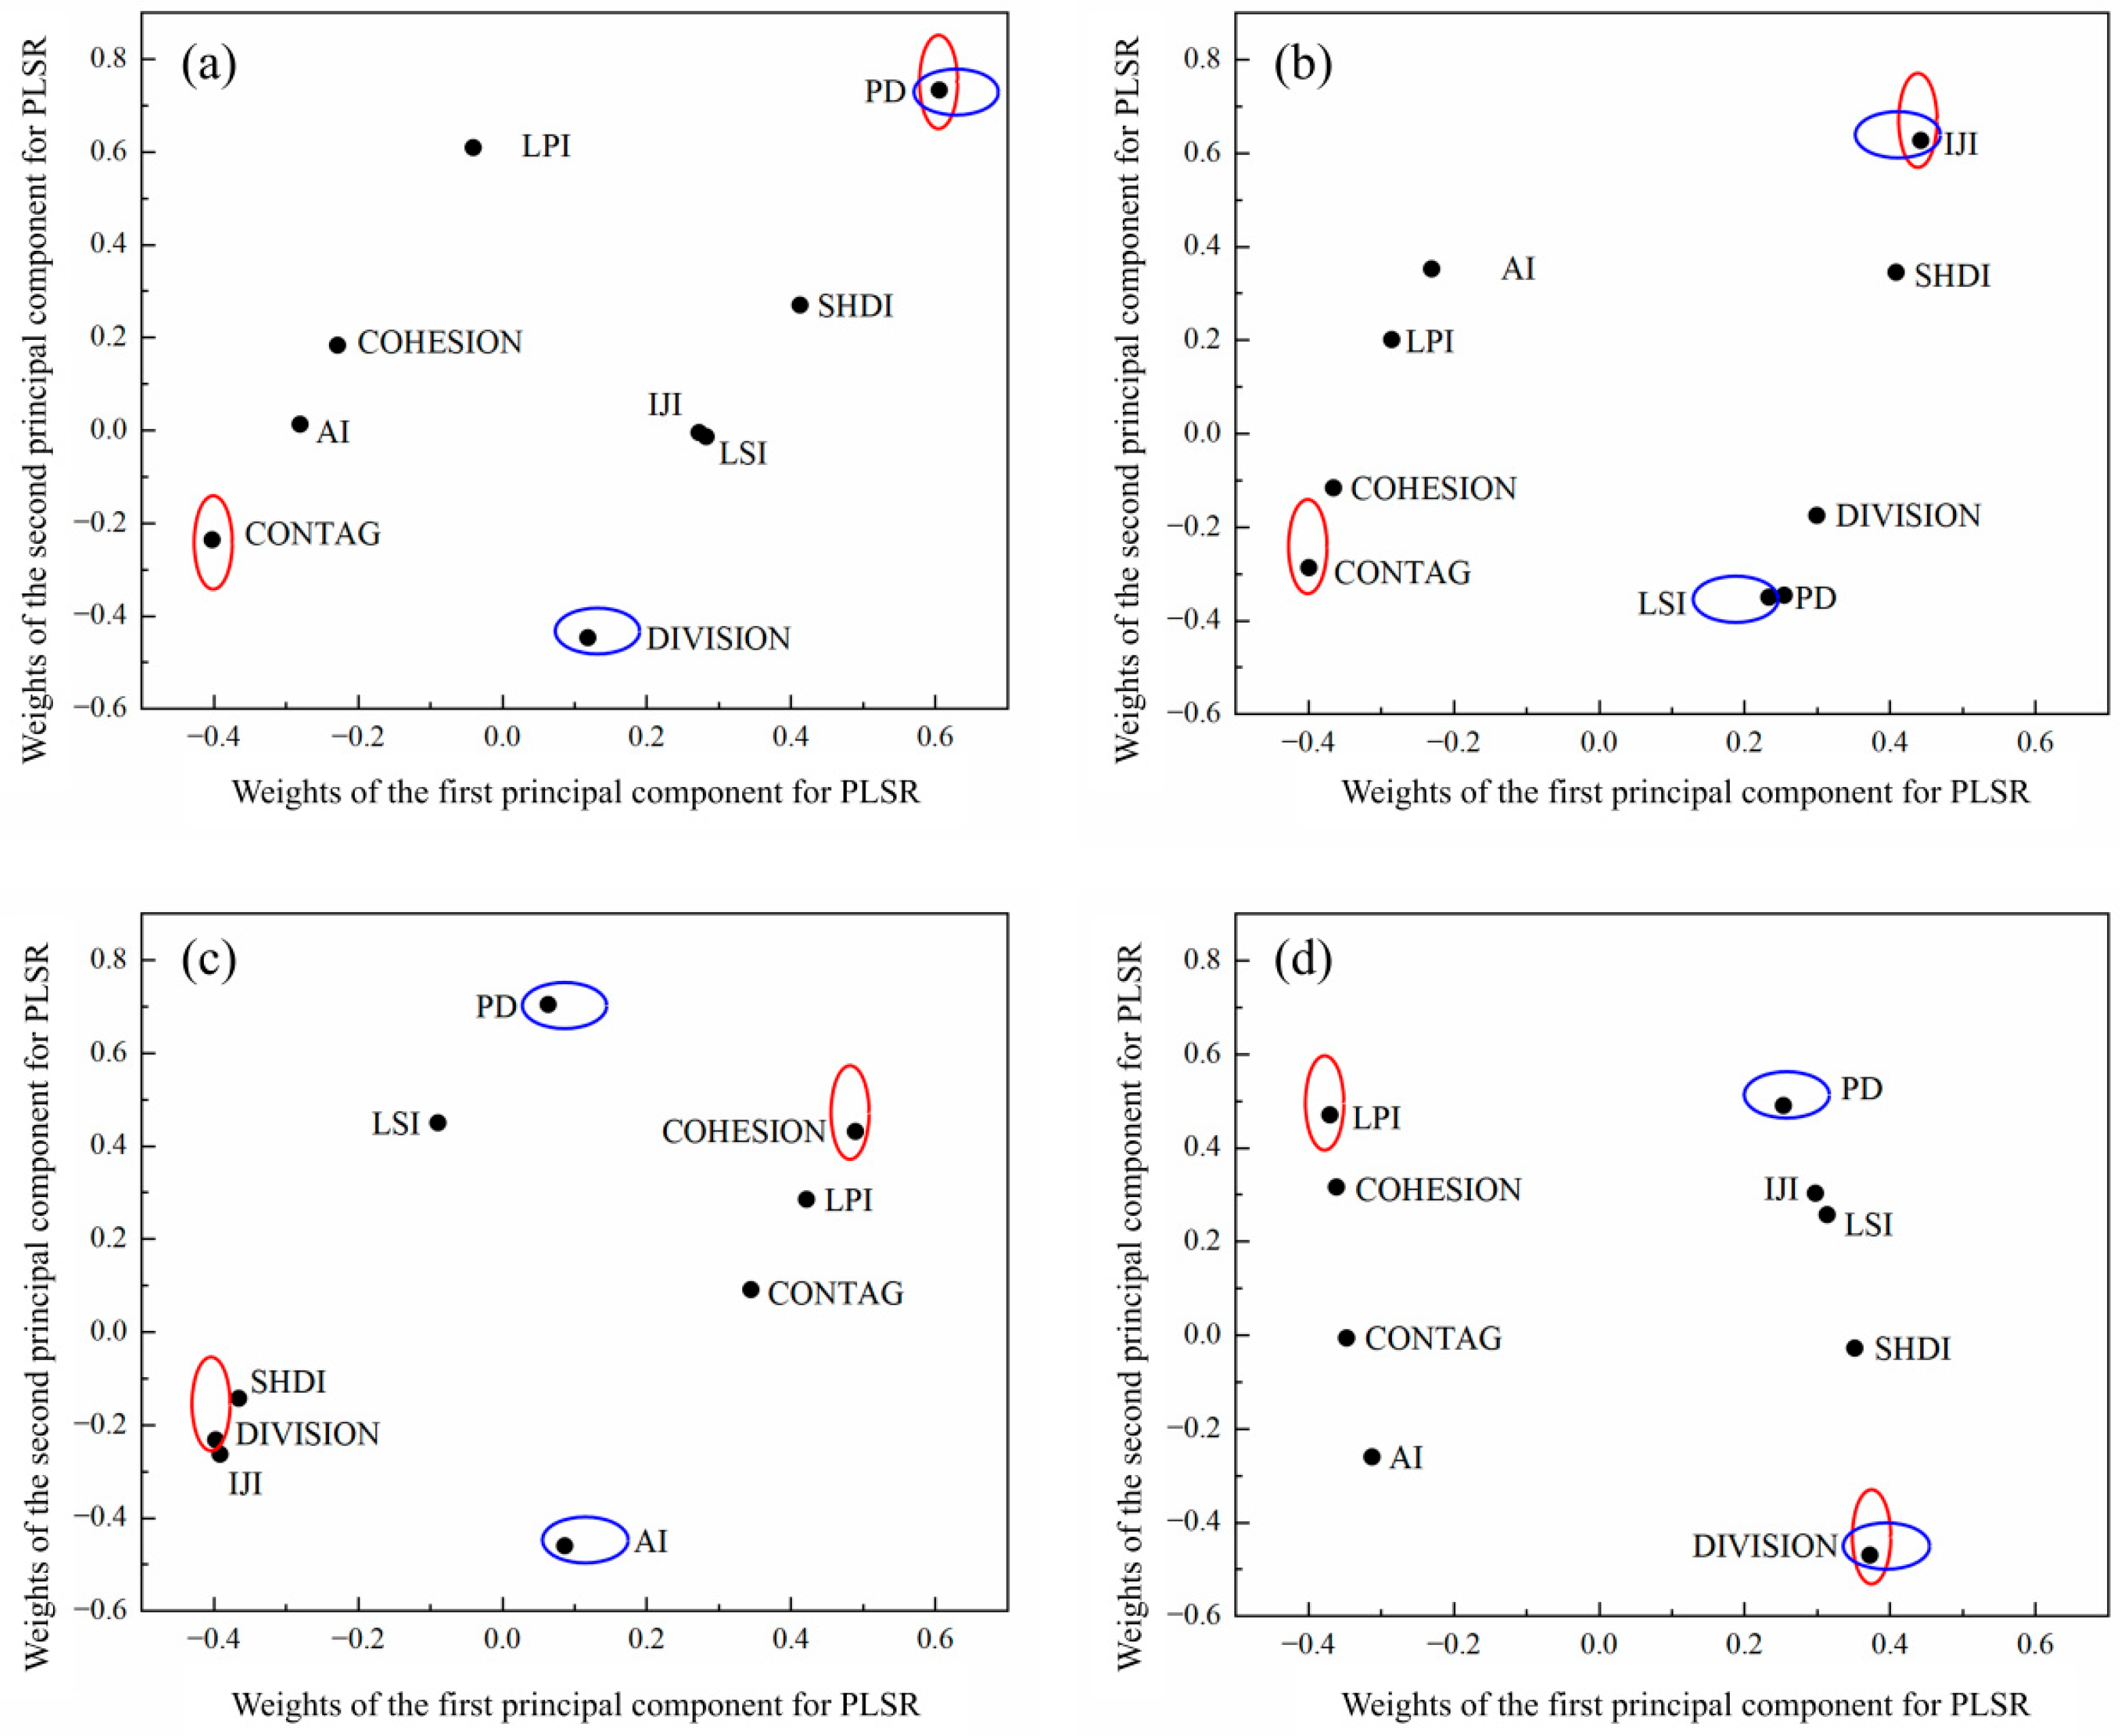
For the PLSR model, the first and second principal components carried most explanatory power of landscape metrics for water yield and sediment yield. Factor weights of the two principal components for water and sediment responses in QSR and KSR watersheds are illustrated in Figure 6. For the runoff process of the QSR watershed, PD and CONTAG have high weights and play dominant roles in the first principal component. PD delivers a positive dominant effect, while CONTAG delivers a negative dominant effect. The second principal component is dominated by PD and DIVISION. PD delivers a positive dominant effect, and DIVISION delivers a negative dominant effect. For the sediment yield process of the QSR watershed, IJI, SHDI, and CONTAG occupy large weights and dominate the first principal component of the PLSR model. IJI and SHDI deliver positive dominant effects, while CONTAG delivers a negative dominant effect. The second principal component of the PLSR model is dominated by IJI, PD, and LSI. LSI delivers a positive dominant effect, and both IJI and PD deliver negative dominant effects. For the runoff process of the KSR watershed, COHESION, DIVISION, and IJI have high weights and play major roles in the first principal component of the PLSR model. COHESION delivers a positive dominant effect, while DIVISION and IJI deliver negative dominant effects. PD and AI have large weights in the second principal component. PD delivers a positive dominant effect, and AI delivers a negative dominant effect. For the sediment yield process of the KSR watershed, LPI, COHESION, and DIVISION have large weights in the first principal component of the PLSR model. DIVISION delivers a positive dominant effect, while LPI and COHESION deliver negative dominant effects. The second principal component of the PLSR model is dominated by PD, LPI, and DIVISION. LPI and PD deliver positive dominant effects, and DIVISION delivers a negative dominant effect.
Figure 6.
Weights of the first and second principal components of PLSR for runoff yield and sediment yield in the QSR Basin and KSR Basin. ((a,b) Weights for runoff yield and sediment yield in the QSR Basin, respectively; and (c,d) weights for runoff yield and sediment yield in the KSR Basin, respectively). Note: The red circles represent the maximum and minimum values of the first component of PLSR, and the blue circles represent the maximum and minimum values of the second component of PLSR.
4. Discussion
4.1. Dominant Factors Driving RSD and Land-Use Changes in the Ningxia Reach of the Yellow River
The results of this study showed that the intra-annual distribution of RSD in major first-order tributaries of the Ningxia reach of the Yellow River is extremely uneven. Both values concentrate in July and August (flood season). In these major firs-order tributaries, sediment discharge showed a higher degree of intra-annual concentration than runoff. This seasonal synchrony of runoff and sediment is broadly consistent with findings from other loess tributaries of the Yellow River, where sediment discharge is strongly flood-pulsed and sediment is more seasonally concentrated than runoff [35,36]. Nevertheless, most prior studies focused on hilly-gully loess watersheds in the middle Yellow River, while our study area belongs to the arid and semi-arid, where annual precipitation is lower and rainfall events are more episodic; this makes the flood-season concentration of sediment more prominent in our two basins. However, the simultaneous concentration of RSD restricts the exploitation and utilization of water resources. Therefore, it is necessary to improve the ecological environment of the watershed, restore forest and grass vegetation, preserve water sources, improve water environment, and apply hydraulic engineering and soil and water conservation measures to regulate the annual distribution of RSD [37,38].
RSD of many large rivers around the world have significant changes affected by climate change, land-use change, soil and water conservation measures, and hydraulic engineering [2]. Most existing studies also proved that human activities are the dominant factor for the variation in RSD in both main stream and tributary areas of the Yellow River [3,39]. With the continuous progress of urbanization, human activities produce increasingly strong influences on watershed hydrological processes. These activities bring non-negligible changes to the spatial and temporal pattern and quantity of hydrological cycle [40,41]. Accordingly, for ecologically fragile regions with high-intensity human activities, human modification on hydrological conditions generates more obvious influences on watershed water and sediment processes. For example, the urbanization process and rapid socioeconomic development have caused remarkable changes in land-use modes and landscape patterns in watersheds. The results from two typical watersheds in the Ningxia reach of the Yellow River showed that grassland is the main land-use type. The major land-use conversion takes place from cropland to forest and urban built-up land. These changes in land use and landscape metrics result from national attention to ecological restoration in Western China and the continuous promotion and implementation of soil and water conservation projects. Since 1999, China has carried out pilot work of the Grain for Green Program in Western China to restore and improve ecological environment. The core of this policy is to systematically stop agricultural use of sloping farmland with high soil erosion risk, and carry out vegetation restoration in a scientific way according to the suitability principle of site conditions [42]. This further confirmed that land-use transition in typical watersheds of the Ningxia reach of the Yellow River mainly comes from human activities represented by the Grain for Green Program. Such human activities accelerate land-use transformation and ecological restoration in watersheds. They further alter watershed hydrological features and exert influences on RSD processes.
4.2. Response Mechanism of RSD Variation to Land-Use Landscape Pattern
This study makes an analysis of the relationship between watershed RSD variation and land-use landscape-pattern change. The results showed that human activities have significant influences on the change in land-use patterns in the two typical watersheds of the Ningxia reach of the Yellow River. Specifically, the forest area of both QSR and KSR watersheds showed an increasing trend in the past 30 years. The growth of forest affects watershed RSD processes via multiple mechanisms. On the one hand, vegetation interception capacity becomes stronger. It promotes soil infiltration, reduces the velocity of surface runoff, and adjusts local microclimate. These functions effectively weaken the formation of surface runoff. On the other hand, forest increases surface roughness and improves the retention capacity for surface water and sediment. It raises the infiltration amount of precipitation on the land surface and speeds up sediment deposition. As a result, the RSD of watersheds decrease. This regulatory function helped keep the water resource balance of watersheds. It also effectively reduced the occurrence frequency of disasters, including flood and sediment siltation, and supports the stability and sustainable development of ecosystems [43,44]. Relevant studies point out that forest has obvious runoff interception ability and a high interception rate for precipitation. The increase in forest area greatly reduced watershed runoff volume and delivers certain regulatory effects on runoff processes [45]. This general finding is consistent with many investigations on the Loess Plateau; however, most prior works focused on the subhumid middle reaches, while our semi-arid study area features scarce and episodic rainfall, so the sediment trapping benefit of forest expansion is particularly sensitive even at moderate forest coverage. In addition, the results indicated that the built-up land area of QSR and KSR watersheds also presented an upward trend. Its proportion was relatively small, but the expansion speed was fast. Existing studies showed that the rapid expansion of built-up land may produce adverse effects on watershed RSD processes [46]. Unlike many mid-Loess catchments, where large continuous impervious surfaces sharply amplify runoff and sediment peaks, built-up patches here are scattered, and their hydrological disturbance has not yet become the dominant driver of RSD change; however, the expanding trend requires ongoing concern. Therefore, it is suggested to further strengthen the implementation of the Grain for Green Program in the upper reaches of the Yellow River, and tighten the supervision of construction land expansion. These measures can ensure the health and sustainable development of watershed ecosystems.
The results of this study also showed that changes in land-use patterns also caused obvious variations in watershed landscape-pattern metrics. In particular, the shapes of landscape patches became increasingly complex and landscape heterogeneity increased. Landscape indices maintained a high concentration level and evolved toward diversification and fragmentation. Among these metrics, PD and LSI had a significant negative correlation with sediment discharge. This finding indicated that the growth of patch number and landscape fragmentation exerted a positive and significant effect on sediment retention. By contrast, CONTAG and COHESION showed a significant positive correlation with watershed sediment load. This meant that higher connectivity of landscape patches brought a smaller reduction range of watershed sediment load. Increases in the diversity and fragmentation degree of land-use types played a positive and significant role in reducing water and sediment. When ecological patches possessed strong connectivity, the continuity of surface runoff paths improved. The capacity of water flow to carry sediment remained relatively stable, which led to a small reduction range of sediment discharge. In addition, patches with high connectivity usually corresponded to large-scale homogeneous landscapes. Such landscapes had low spatial heterogeneity in ecological interception functions. When water flowed across homogeneous areas, surface resistance distributed evenly. Water flow could not dissipate energy to slow down sediment transport [47,48]. Previous studies also found that multiple landscape-pattern metrics had obvious correlations with RSD. Specifically, landscape pattern exerted notable influences on RSD. Landscapes with low aggregation and irregular patch shapes helped to lower watershed RSD [49,50]. In fragmented landscapes, patches dispersed flow energy through physical obstruction and rising surface roughness. They greatly reduced runoff velocity and trapped sediment. Small-sized patches within fragmented landscapes formed multilevel interception barriers. These barriers gradually cut down sediment transport through physical blocking, such as canopy interception and soil reinforcement by plant roots, and thus improved sediment retention performance [51]. Meanwhile, irregular and low aggregation patch shapes created more boundaries and smaller patch sizes. These conditions contributed to larger vegetation root area and more complex root structures, which stabilized soil and mitigated soil erosion and sand transport [52]. Accordingly, adjustments to land-use distribution within watersheds triggered corresponding changes in landscape patterns. Such changes could serve as an indirect approach to modify the dynamic trend of watershed RSD. Therefore, during comprehensive management of soil and water loss, the adjustment of land-use structure should follow the basic principle that treatment combines with development. Ecological protection measures such as Grain for Green Program should be actively implemented. Attention should also be paid to variations in landscape-pattern elements, including local patch shape, patch density, and contagion.
4.3. Limitations and Perspectives
This study adopted the Markov transition matrix model, land-use dynamic degree, landscape metrics, and partial least squares regression to explore the RSD responses to landscape changes in two Yellow River tributary basins. Several limitations should be acknowledged. The Markov model assumes stationary transition probabilities, which may be broken by abrupt ecological policies and extreme rainfall. Remote-sensing classification errors and mixed pixels bring uncertainty to land-use and landscape metric results. PLSR reveals statistical correlations rather than causal relationships, and the finite hydrological time series restricts the generalization of findings. In addition, land-use data cannot capture intra-class vegetation heterogeneity. For future perspectives, we will couple the Markov model with cellular automata (Markov–CA) to integrate spatial driving factors and realize spatially explicit land-use change simulation. High-resolution remote sensing and seasonal vegetation datasets will be used to capture dynamic vegetation features and mitigate the bias from intra-class heterogeneity. We will further couple distributed hydrological–sediment models with multi-source monitoring data to quantitatively disentangle the independent and interactive effects of climate, soil, and landscape patterns on runoff and sediment delivery.
5. Conclusions
In this study, we comprehensively investigated inter-annual characteristics, monthly distribution, intra-year distribution features, RSD relationship, and spatial temporal land-use variations in RSD, the major first order tributary of the Ningxia reach of the Yellow River. Based on these analyses, we further revealed the correlated response of RSD processes to changes in landscape-pattern metrics. The results reveal shared and divergent water–sediment characteristics between the two watersheds. For both basins, runoff and sediment discharge were relatively high during 1990–1999 and concentrated in July and August; sediment showed stronger flood-season concentration than runoff. The RSD relationship of QSR and KSR varied across periods. After 2000, the reduction of slope sediment yielding capacity might be explained by the implementation of effective soil and water conservation measures, which contributed to the downward trend of incoming sediment coefficient. Within the two typical watersheds, grassland showed the largest area variation. Spatially, grassland widely spread over the entire watersheds, whereas cropland was relatively concentrated along main streams and tributaries. Nevertheless, the two watersheds differed substantially in land-use transformation, landscape evolution, and water–sediment response. The KSR Basin underwent far more intense land-use adjustment, with a comprehensive land-use dynamic degree of 0.494% (1990–2020), compared with only 0.115% in the QSR Basin. Over the past 30 years, typical basins presented rising landscape fragmentation, landscape diversity, and landscape heterogeneity, together with weakened patch connectivity for identical land-use types. Landscape-pattern metrics generally have closer correlations with sediment yield than with runoff yield, and the dominant landscape indicators differ markedly between basins. In the QSR Basin, runoff yield had the strongest correlation with PD (r = 0.31), and sediment discharge yield had the strongest correlation with IJI (r = −0.89). In KSRBasin, runoff yield had the strongest correlation with COHESION (r = 0.43), and sediment discharge yield had the strongest correlation with DIVISION (r = −0.93). Accordingly, changes in landscape-pattern elements, including patch shape, patch density, and contagion, should be considered in comprehensive management of soil and water loss.
Author Contributions
Conceptualization, J.M. and T.W.; methodology, J.M.; software, J.M.; validation, J.M. and X.H.; formal analysis, J.M.; investigation, J.M. and X.H.; resources, J.M., T.W., and X.H.; data curation, J.M. and T.W.; writing—original draft preparation, J.M.; writing—review and editing, J.M., T.W., Z.L., P.W., and X.H.; visualization, J.M.; supervision, J.M., P.W., and X.H.; project administration, P.W. and X.H.; funding acquisition, X.H. All authors have read and agreed to the published version of the manuscript.
Funding
This research was funded by the National Key Research and Development Program of China (2023YFF1304403).
Data Availability Statement
The original contributions presented in this study are included in the article. Further inquiries regarding the data can be directed to the first author or the corresponding author.
Conflicts of Interest
The authors declare no conflicts of interest. The funders had no role in the design of the study; in the collection, analyses, or interpretation of data; in the writing of the manuscript; or in the decision to publish the results.
Abbreviations
The following abbreviations are used in this manuscript:
| RSD | Runoff and sediment discharge |
| QSR | QingShui River |
| KSR | KuShui River |
| PD | Patch Density |
| AI | Aggregation Index |
| LPI | Largest Patch Index |
| SHDI | SHannon’s Diversity Index |
| IJI | Interspersion and Juxtaposition Index |
| LSI | Landscape Shape Index |
| DVISION | DVISION index |
| COHESION | patch COHESION index |
| CONTAG | CONTAG index |
References
- Ty, T.V.; Sunada, K.; Ichikawa, Y.; Oishi, S. Scenario-based impact assessment of land use/cover and climate changes on water resources and demand: A case study in the Srepok River Basin, Vietnam—Cambodia. Water Resour. Manag. 2012, 26, 1387–1407. [Google Scholar] [CrossRef] [Scilit]
- Liang, W.; Bai, D.; Wang, F.; Fu, B.; Yan, J.; Wang, S.; Yang, Y.; Long, D.; Feng, M. Quantifying the impacts of climate change and ecological restoration on streamflow changes based on a Budyko hydrological model in China’s Loess Plateau. Water Resour. Res. 2015, 51, 6500–6519. [Google Scholar] [CrossRef] [Scilit]
- Wang, S.; Fu, B.; Piao, S.; Lü, Y.; Ciais, P.; Feng, X.; Wang, Y. Reduced sediment transport in the Yellow River due to anthropogenic changes. Nat. Geosci. 2016, 9, 38–41. [Google Scholar] [CrossRef] [Scilit]
- Gao, P.; Deng, J.; Chai, X.; Mu, X.; Zhao, G.; Shao, H.; Sun, W. Dynamic sediment discharge in the Hekou–Longmen region of Yellow River and soil and water conservation implications. Sci. Total Environ. 2017, 578, 56–66. [Google Scholar] [CrossRef] [Scilit]
- Syvitski, J.; Kettner, A.; Overeem, I.; Hutton, E.; Hannon, M.; Brakenridge, G.; Charles, V.; Yoshiki, S.; Liviu, G.; Robert, J. Sinking deltas due to human activities. Nat. Geosci. 2009, 2, 681–686. [Google Scholar] [CrossRef] [Scilit]
- Wu, J.; Liu, X.; Liu, T.; Deng, A.; Huang, H. Hundred-year changes in water and sediment in the Inner Mongolia reach of the Yellow River: Trend transitions, driving mechanisms, and attribution quantification. J. Hydrol. 2026, 675, 135605. [Google Scholar] [CrossRef] [Scilit]
- Shi, H.; Hu, C.; Wang, Y.; Liu, C.; Li, H. Analyses of trends and causes for variations in runoff and sediment load of the Yellow River. Int. J. Sediment Res. 2017, 32, 171–179. [Google Scholar] [CrossRef] [Scilit]
- Persichillo, M.; Bordoni, M.; Cavalli, M.; Crema, S.; Meisina, C. The role of human activities on sediment connectivity of shallow landslides. Catena 2018, 160, 261–274. [Google Scholar] [CrossRef] [Scilit]
- Hu, J.; Zhao, G.; Mu, X.; Tian, P.; Gao, P.; Sun, W. Quantifying the impacts of human activities on runoff and sediment load changes in a Loess Plateau catchment, China. J. Soils Sediments 2019, 19, 3866–3880. [Google Scholar] [CrossRef] [Scilit]
- Zhang, G.; Deng, A.; Chen, J.; Wang, D.; Yin, Y.; Wang, H. Impacts of climate change and human activities on sediment load in Longchuan River Basin, China. J. Hydrol. Reg. Stud. 2024, 51, 101613. [Google Scholar] [CrossRef] [Scilit]
- Han, X.; Fan, D.; Huang, J.; Tu, J.; Meng, L.; Chen, S. Cumulative impact of human activities on hydro-sediment dynamics and morphodynamics in the highly altered Yangtze Estuary. J. Hydrol. 2025, 651, 132625. [Google Scholar] [CrossRef] [Scilit]
- Syvitski, J.; Vörösmarty, C.; Kettner, A.; Green, P. Impact of humans on the flux of terrestrial sediment to the global coastal ocean. Science 2005, 308, 376–380. [Google Scholar] [CrossRef] [Scilit]
- Nilsson, C.; Reidy, C.A.; Dynesius, M.; Revenga, C. Fragmentation and flow regulation of the world’s large river systems. Science 2005, 308, 405–408. [Google Scholar] [CrossRef] [Scilit]
- Wang, H.; Bi, N.; Saito, Y.; Wang, Y.; Sun, X.; Zhang, J.; Yang, Z. Recent changes in sediment delivery by the Huanghe (Yellow River) to the sea: Causes and environmental implications in its estuary. J. Hydrol. 2010, 391, 302–313. [Google Scholar] [CrossRef] [Scilit]
- Wang, Y.; Ding, Y.; Ye, B.; Liu, F.; Wang, J.; Wang, J. Contributions of climate and human activities to changes in runoff of the Yellow and Yangtze rivers from 1950 to 2008. Sci. China Earth Sci. 2013, 56, 1398–1412. [Google Scholar] [CrossRef] [Scilit]
- Xin, Z.; Yu, B.; Han, Y. Spatiotemporal variations in annual sediment yield from the middle Yellow River, China, 1950–2010. J. Hydrol. Eng. 2015, 20, 04014090. [Google Scholar] [CrossRef] [Scilit]
- Li, X.; Kong, F.; Wang, H.; Guo, J.; Tian, Y. Spatiotemporal variations and driving factors of streamflow and sediment load across different geomorphic conditions in a sediment-laden river of the Loess Plateau. Ecol. Processes 2026, 15, 79. [Google Scholar] [CrossRef] [Scilit]
- Babaremu, K.; Taiwo, O.; Ajayi, D. Impacts of land use and land cover changes on hydrological response. TWIST 2024, 19, 256–267. [Google Scholar]
- Qiu, M.; Liu, Y.; Chen, P.; He, N.; Wang, S.; Huang, X.; Fu, B. Spatio-temporal changes and hydrological forces of wetland landscape pattern in the Yellow River Delta during 1986–2022. Landsc. Ecol. 2024, 39, 51. [Google Scholar] [CrossRef] [Scilit]
- Wang, F.; Ge, Q.; Yu, Q.; Wang, H.; Xu, X. Impacts of land-use and land-cover changes on river runoff in Yellow River basin for period of 1956–2012. Chin. Geogr. Sci. 2017, 27, 13–24. [Google Scholar] [CrossRef] [Scilit]
- Ma, X.; Li, Z.; Ren, Z.; Shen, Z.; Xu, G.; Xie, M. Predicting future impacts of climate and land use change on streamflow in the middle reaches of China’s Yellow River. J. Environ. Manag. 2024, 370, 123000. [Google Scholar] [CrossRef] [Scilit]
- Yu, W.; Zang, S.; Wu, C.; Liu, W.; Na, X. Analyzing and modeling land use land cover change (LUCC) in the Daqing City, China. Appl. Geogr. 2011, 31, 600–608. [Google Scholar] [CrossRef] [Scilit]
- Zhou, Y.; Chang, S.; Fan, X.; Shao, W. The influence of climate change and anthropogenic activities on annual runoff of Huangfuchuan basin in northwest China. Theor. Appl. Climatol. 2015, 120, 137–146. [Google Scholar] [CrossRef] [Scilit]
- Miao, J.; Zhang, X.; Zhang, G.; Wei, T.; Zhao, Y.; Ma, W.; Chen, Y.; Li, Y.; Wang, Y. Applications and interpretations of different machine learning models in runoff and sediment discharge simulations. Catena 2024, 238, 107848. [Google Scholar] [CrossRef] [Scilit]
- Ji, W.; Zhao, Y.; Hu, B.; Yang, L.; Gong, L.; Ma, Y. Transformation relationship between surface water and groundwater in Kushui River Basin of Ningxia. J. Arid Land 2024, 46, 1612–1621. [Google Scholar]
- Pettitt, A.N. A non-parametric approach to the change-point problem. Appl. Stat. 1979, 28, 126–135. [Google Scholar] [CrossRef] [Scilit]
- Lü, D.; Gao, G.; Lü, Y.; Xiao, F.; Fu, B. Detailed land use transition quantification matters for smart land management in drylands: An in-depth analysis in Northwest China. Land Use Policy 2020, 90, 104356. [Google Scholar] [CrossRef] [Scilit]
- Masoudi, M.; Richards, D.R.; Tan, P.Y. Assessment of the influence of spatial scale and type of land cover on urban landscape pattern analysis using landscape metrics. J. Geovis. Spat. Anal. 2024, 8, 8. [Google Scholar] [CrossRef] [Scilit]
- Turner, M.; Gardner, R. Landscape metrics. In Landscape Ecology in Theory and Practice: Pattern and Process; Springer: New York, NY, USA, 2015; pp. 97–142. [Google Scholar]
- Frazier, A.E.; Kedron, P. Landscape Metrics: Past Progress and Future Directions. Curr. Landsc. Ecol. Rep. 2017, 2, 63–72. [Google Scholar] [CrossRef] [Scilit]
- Grafius, D.; Corstanje, R.; Harris, J. Linking ecosystem services, urban form and green space configuration using multivariate landscape metric analysis. Landsc. Ecol. 2018, 33, 557–573. [Google Scholar] [CrossRef] [Scilit]
- Shi, Z.; Huang, X.; Ai, L.; Fang, N.; Wu, G. Quantitative analysis of factors controlling sediment yield in mountainous watersheds. Geomorphology 2014, 226, 193–201. [Google Scholar] [CrossRef] [Scilit]
- Norgaard, L.; Saudland, A.; Wagner, J.; Nielsen, J.; Munck, L.; Engelsen, S. Interval partial least-squares regression (iPLS): A comparative chemometric study with an example from near-infrared spectroscopy. Appl. Spectrosc. 2000, 54, 413–419. [Google Scholar] [CrossRef] [Scilit]
- Carrascal, L.M.; Galván, I.; Gordo, O. Partial least squares regression as an alternative to current regression methods used in ecology. Oikos 2009, 118, 681–690. [Google Scholar] [CrossRef] [Scilit]
- Zhao, J.; Zhang, J.; Hu, Y.; Li, Y.; Tang, P.; Gusarov, A.V.; Yu, Y. Effects of land uses and rainfall regimes on surface runoff and sediment yield in a nested watershed of the Loess Plateau, China. J. Hydrol. Reg. Stud. 2022, 44, 101277. [Google Scholar] [CrossRef] [Scilit]
- Wang, J.; Li, Y.; Wang, S.; Li, Q.; Li, M. Determining relative contributions of climate change and multiple human activities to runoff and sediment reduction in the eastern Loess Plateau, China. Catena 2023, 232, 107376. [Google Scholar] [CrossRef] [Scilit]
- Yaekob, T.; Tamene, L.; Gebrehiwot, S.; Demissie, S.; Adimassu, Z.; Woldearegay, K.; Mekonnen, K.; Amede, T.; Abera, W.W.; Recha, J.; et al. Assessing the impacts of different land uses and soil and water conservation interventions on runoff and sediment yield at different scales in the central highlands of Ethiopia. Renew. Agric. Food Syst. 2022, 37, S73–S87. [Google Scholar] [CrossRef] [Scilit]
- Zeng, Y.; Meng, X.; Wang, B.; Li, M.; Chen, D.; Ran, L.; Fang, N.; Ni, L.; Shi, Z. Effects of soil and water conservation measures on sediment delivery processes in a hilly and gully watershed. J. Hydrol. 2023, 616, 128804. [Google Scholar] [CrossRef] [Scilit]
- Zheng, H.; Zhang, L.; Zhu, R.; Liu, C.; Sato, Y.; Fukushima, Y. Responses of streamflow to climate and land surface change in the headwaters of the Yellow River Basin. Water Resour. Res. 2009, 45, 641–648. [Google Scholar] [CrossRef] [Scilit]
- Wang, Z.; Xu, M.; Liu, X.; Singh, D.; Fu, X. Quantifying the impact of climate change and anthropogenic activities on runoff and sediment load reduction in a typical Loess Plateau watershed. J. Hydrol. Reg. Stud. 2022, 39, 100992. [Google Scholar] [CrossRef] [Scilit]
- Wei, D.; Liu, S.; Wu, Y.; Feng, S.; Gao, H.; Qin, C.; Ren, D.; Tang, W.; Zhang, Y. Impacts of human activities and climate change on water and sediment evolution in four large subtropical river basins in China. Ecol. Indic. 2023, 155, 110958. [Google Scholar] [CrossRef] [Scilit]
- Yi, H.; Zhang, X.; He, L.; He, J.; Tian, Q.; Zou, Y.; An, Z. Detecting the impact of the “Grain for Green” program on land use/land cover and hydrological regimes in a watershed of the Chinese Loess Plateau over the next 30 years. Ecol. Indic. 2023, 150, 110181. [Google Scholar] [CrossRef] [Scilit]
- Zhu, X.; Liu, W.; Jiang, X.; Wang, P.; Li, W. Effects of land-use changes on runoff and sediment yield: Implications for soil conservation and forest management in Xishuangbanna, Southwest China. Land Degrad. Dev. 2018, 29, 2962–2974. [Google Scholar] [CrossRef] [Scilit]
- Gao, H.; Wu, Z.; Jia, L.; Pang, G. Vegetation change and its influence on runoff and sediment in different landform units, Wei River, China. Ecol. Eng. 2019, 141, 105609. [Google Scholar] [CrossRef] [Scilit]
- Wasis, B.; Harlan, D.; Putra, M. Impact of forest land cover on runoff, erosion and sedimentation in the Karai Watershed, Simalungun Regency, North Sumatra Province, Indonesia. Arch. Agric. Environ. Sci. 2020, 5, 40–49. [Google Scholar] [CrossRef] [Scilit]
- Santikari, V.; Murdoch, L. Effects of construction-related land use change on streamflow and sediment yield. J. Environ. Manag. 2019, 252, 109605. [Google Scholar] [CrossRef] [Scilit]
- Zhang, Y.; Bi, Z.; Zhang, X.; Yu, Y. Influence of landscape pattern changes on runoff and sediment in the Dali River watershed on the Loess Plateau of China. Land 2019, 8, 180. [Google Scholar] [CrossRef] [Scilit]
- Tian, C.; Gao, S.; Zhang, X.; Zhang, Y.; Li, J.; Zha, T. Precipitation, landscape pattern and sediment connectivity differ in their effects on runoff and sediment transport. J. Hydrol. Reg. Stud. 2025, 62, 102889. [Google Scholar] [CrossRef] [Scilit]
- Li, Z.; Xu, X.; Wang, K. Effects of distribution patterns of karst landscapes on runoff and sediment yield in karst watersheds. Catena 2023, 223, 106947. [Google Scholar] [CrossRef] [Scilit]
- Xu, G.; Cheng, Y.; Zhao, C.; Mao, J.; Li, Z.; Jia, L.; Wang, B. Effects of driving factors at multi-spatial scales on seasonal runoff and sediment changes. Catena 2023, 222, 106867. [Google Scholar] [CrossRef] [Scilit]
- Yang, M.; Li, X.; Hu, Y.; He, X. Assessing effects of landscape pattern on sediment yield using sediment delivery distributed model and a landscape indicator. Ecol. Indic. 2012, 22, 38–52. [Google Scholar] [CrossRef] [Scilit]
- Wu, H.; Huang, K.; Mei, J.; Yao, Y.; Zhao, S.; Dai, J.; Dai, Y. Impacts of sediment deposition on landscape pattern in Dongting Lake and Poyang Lake wetlands, China. Ecol. Indic. 2025, 177, 113801. [Google Scholar] [CrossRef] [Scilit]

Disclaimer/Publisher’s Note: The statements, opinions and data contained in all publications are solely those of the individual author(s) and contributor(s) and not of MDPI and/or the editor(s). MDPI and/or the editor(s) disclaim responsibility for any injury to people or property resulting from any ideas, methods, instructions or products referred to in the content. |
© 2026 by the authors. Licensee MDPI, Basel, Switzerland. This article is an open access article distributed under the terms and conditions of the Creative Commons Attribution (CC BY) license.