


Abstract
Reservoir storage capacity is a fundamental parameter for sustainable water infrastructure. Over time, progressive sedimentation reduces usable storage, intensified by climate-driven flow variations and limited flushing. This study evaluates sediment dynamics and management strategies for the shallow lowland Sĺňava Reservoir on the Váh River, Slovakia. The methodology integrates: (i) field sampling and optical granulometry to determine bed material grain-size distribution; (ii) 1D analytical formulations to establish threshold discharge for incipient sediment motion; and (iii) 2D morphodynamic modeling in HEC-RAS 2D to simulate spatial erosion and deposition patterns. Investigated scenarios included baseline natural evolution, maintenance dredging, proposed engineered sedimentation pits, and bank groins under operational flow series and extreme floods (Q100). Results demonstrate that backwater delta aggradation is concentrated in the narrow upstream inlet reach between critical bridge profiles. Implementing targeted sedimentation pits combined with localized maintenance dredging proved to be the most effective strategy, trapping coarse bedload while mitigating scour near bridge piers. Conversely, groins provide localized flow redirection but complicate mechanical sediment removal. These findings highlight the necessity of shifting from reactive dredging to proactive morphodynamic management in regulated lowland reservoirs.
1. Introduction
Reservoirs are critical infrastructure for water supply, flood control, irrigation, hydropower, recreation, and environmental management [1,2,3]. However, sedimentation remains a primary threat to their long-term functionality, as it irreversibly reduces storage capacity and compromises operational efficiency [4,5].
Global estimates indicate that reservoirs lose approximately 0.5–1% of their storage capacity annually due to sedimentation [6,7], with mean global loss rates reaching around 0.94% per year [3,6]. At this pace, without mitigation, many reservoirs may lose the equivalent of half their original capacity over several decades, undermining their reliability and sustainability.
Sedimentation is especially problematic when waters entering reservoirs carry high sediment loads, typically due to upstream soil erosion or land-use changes. Upon impoundment, the sharp decline in flow velocity causes sediment settling, gradually creating subsurface and surface deposit layers [8]. The reduction in usable storage impacts hydropower operations, water supply reliability, navigation, and flood attenuation [9,10,11,12]. In addition to capacity loss, sediment accumulation can clog or erode outlet structures, impair turbine efficiency, and increase maintenance costs [13,14].
To address sedimentation, both hydraulic (sluicing, flushing, bypass) and mechanical (dredging) techniques are used depending on reservoir and basin characteristics [4,15,16]. However, reservoir sedimentation poses a major challenge to the sustainable operation of water infrastructure, especially in lowland reservoirs characterized by low flow velocities and high sediment deposition potential. These reservoirs often have extensive shallow zones, low longitudinal gradients, and long retention times, which increase sediment settling and accelerate the loss of usable storage volume. The accumulation of fine sediments near dam walls, inlets, or bridge piers not only reduces operational efficiency but also poses a threat to structural stability and increases the risk of upstream flooding.
Globally, various strategies have been implemented to manage sedimentation. Dredging remains the most common method for sediment removal; however, it is capital- and energy-intensive and often unsustainable in the long term due to high costs, limited disposal options, and ecological disruption [4,8]. To complement or replace dredging, many countries employ sediment bypass tunnels, flushing operations, sluicing techniques, or sediment traps to reduce accumulation [2,11]. In lowland reservoirs, however, flushing is significantly less feasible due to insufficient hydraulic head and low scouring velocities.
Recent advancements in numerical modeling allow engineers to predict and analyze sediment transport processes with higher precision. Two- or three-dimensional (2D, 3D) hydraulic models, such as HEC-RAS 2D, FLOW-3D, and Delft3D, have become standard tools for simulating sediment dynamics in complex environments [17,18]. These models account for flow patterns, bedload and suspended-load transport, erosion and deposition rates, and morphological evolution over time. The integration of sediment transport modules into hydraulic models enables decision-makers to test various sediment management strategies (e.g., optimized dredging layout, placement of groins or potential sedimentation pits) under current and future hydrological scenarios [10,19].
This study focuses on the Sĺňava Reservoir, a shallow, lowland reservoir located on the Váh River in Slovakia. The reservoir has experienced progressive sedimentation, particularly in recent years, due to changing hydrological conditions and the absence of cost-effective sediment removal strategies. The main scientific objective of this study is to determine how targeted structural interventions and engineered sediment traps can mitigate progressive backwater delta sedimentation in shallow lowland reservoirs under climate-induced declining flow regimes while simultaneously protecting critical hydraulic infrastructure from bed scour.
To achieve this objective, the specific research objectives of this study are: (i) to quantify the grain-size distribution of active bed material along the reservoir and establish the hydraulic threshold for incipient sediment motion using empirical transport formulations calibrated to local Slovak river conditions; (ii) to analyze multi-decadal hydrological discharge trends (1997–2021) at the downstream gauging station to evaluate the frequency of natural sediment flushing flows; (iii) to set up, calibrate, and execute a 2D morphodynamical HEC-RAS model to simulate short- to medium-term spatial erosion/deposition dynamics under five distinct management scenarios (baseline, dredging, proposed sedimentation pits, groins, and Q100 flood conditions); (iv) to deliver actionable guidelines for proactive sediment control and infrastructure safety (specifically bridge pier scour monitoring) in lowland reservoir cascades.
2. Materials and Methods
2.1. Reservoir Description
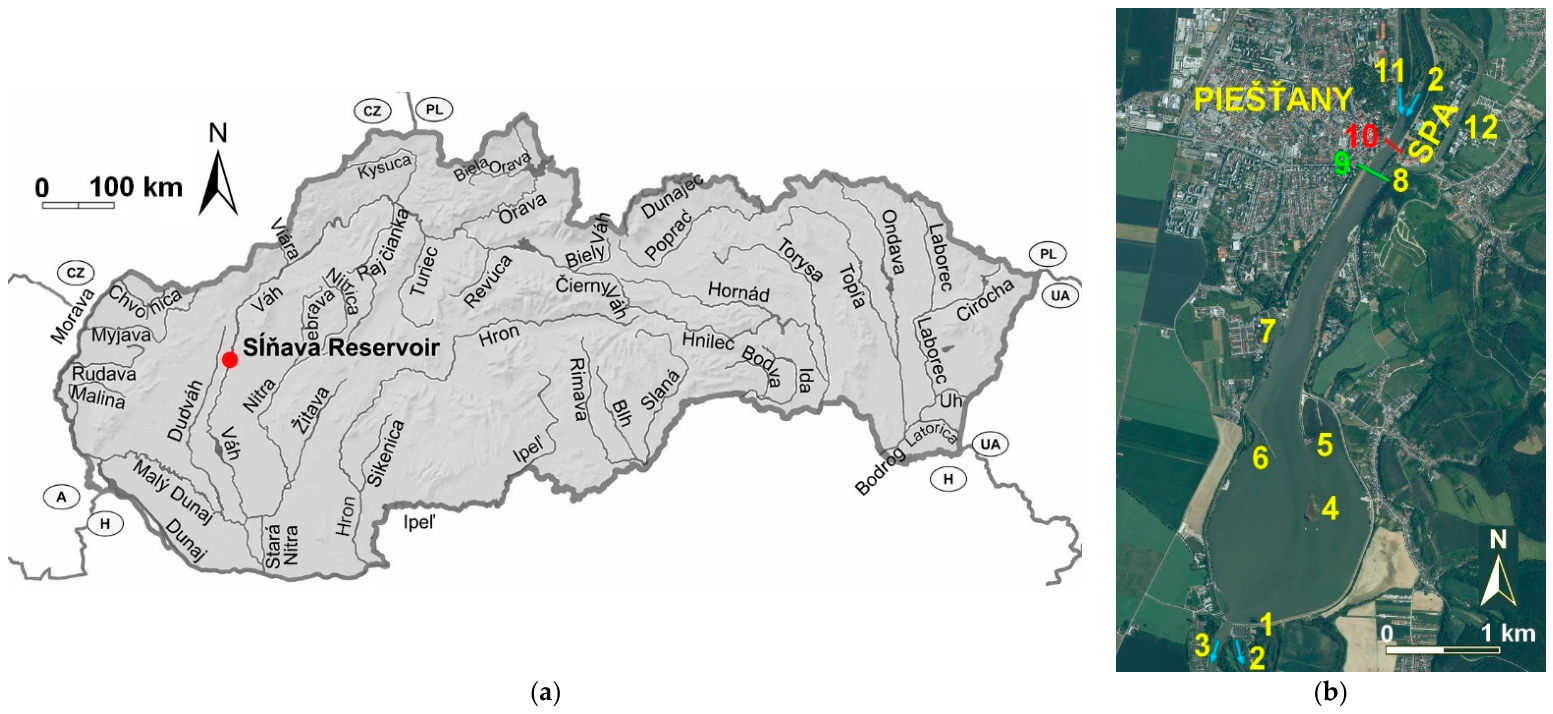
The Sĺňava Reservoir (Figure 1) was constructed between 1956 and 1960 on the Váh River as part of the Váh Cascade system. It serves as a component of the Madunice hydropower structure located near the spa town of Piešťany in western Slovakia. The structure was put into permanent operation in 1967. Sĺňava is situated in a lowland area and was formed by a weir and a system of two levees (on the right and left banks of the Váh River), creating a shallow-water reservoir. According to the 2020 operating manual [20], total catchment area is 10,289 km2, long-term annual discharge is 139.9 m3 · s−1 and mean annual precipitation is 611 mm, the total storage volume of the reservoir at the maximum operational water level of 158.1 m a.s.l. is 12.5 million m3, with a water surface area of 4.1 km2 (the original volume was 13.5 million m3). At the minimum operational water level of 157.1 m a.s.l., the volume is 8.6 million m3, and the surface area is 3.9 km2. The active storage capacity is therefore 3.9 million m3.
Figure 1.
(a) Map of Slovakia with the location of the Sĺňava Reservoir; (b) detailed object descriptions shown in the orthophoto map: 1—Drahovce weir. 2—Váh River. 3—Derivation canal. 4—Bird Island (called Seagull). 5—Water sports complex. 6—Spur dike. 7—Dockyard. 8—Lower weir. 9—Road Bridge. 10—Colonnade (Glass) Bridge. 11—Derivation canal Horná Streda. 12—Bypass canal. PIEŠŤANY indicates the spa town of Piešťany, and SPA refers to the Piešťany Health Spa resort area.
The Váh River catchment upstream of the Sĺňava Reservoir represents a transition zone between the mountainous geomorphological units of the Western Carpathians and the lowland environment of the Danubian Lowland. The geological structure consists predominantly of crystalline rocks, flysch formations, and Quaternary fluvial deposits. Sediment transported to the reservoir is mainly composed of gravel, sand, and finer alluvial material derived from upstream river reaches. These geological and geomorphological conditions significantly influence sediment production, transport processes, and the spatial distribution of sediment deposition within the reservoir [12,20,21].
The reservoir features a water-ski lift, a dockyard, a guiding structure (spur dike), and two major bridges (a road bridge and a pedestrian bridge known as the Colonnade Bridge, or so-called “Glass Bridge”). A prominent feature in the reservoir is “Bird Island” (Čajka/Seagull Island), an island covering approximately 2.8 hectares that was intentionally constructed in 1976 using material excavated during reservoir maintenance and dredging [20]. It was deliberately created as a protected bird sanctuary and nesting site, serving as the core of the designated Sĺňava Protected Bird Area, which has been further complemented in recent years by artificial floating nesting structures. Sĺňava is a multipurpose reservoir serving hydroelectric power generation, flood protection, irrigation supply, and as a water-cooling source for a nuclear power plant.
In the past, comprehensive reservoir surveys—combining cross-sectional bathymetric soundings of the underwater bed with terrestrial topographic surveying of the embankments—were carried out in 1963, 1967, 1978, and 2014 [21] to update the stage-storage volume curve. Surveys between 1963 and 1978 relied on a stabilized terrestrial geodetic boundary network paired with manual boat soundings using a sounding lead, whereas the 2014 campaign utilized single-beam acoustic bathymetry integrated with GNSS land surveying. These surveys were conducted in cross-sections with stabilized endpoints, extending beyond the channel to the banks or embankments. This facilitated volume comparisons calculated using the mean-section method. Sedimentation was defined as a reduction in the profile flow area compared to the previous measurement or design state, while erosion was defined as an enlargement of the flow area.
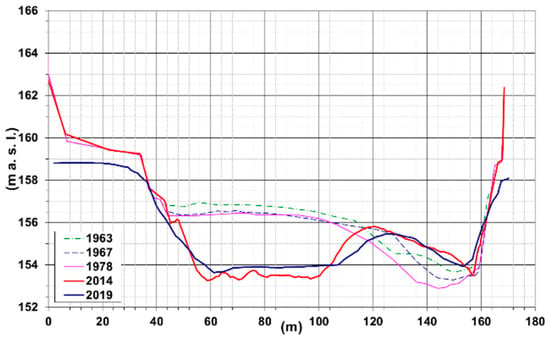
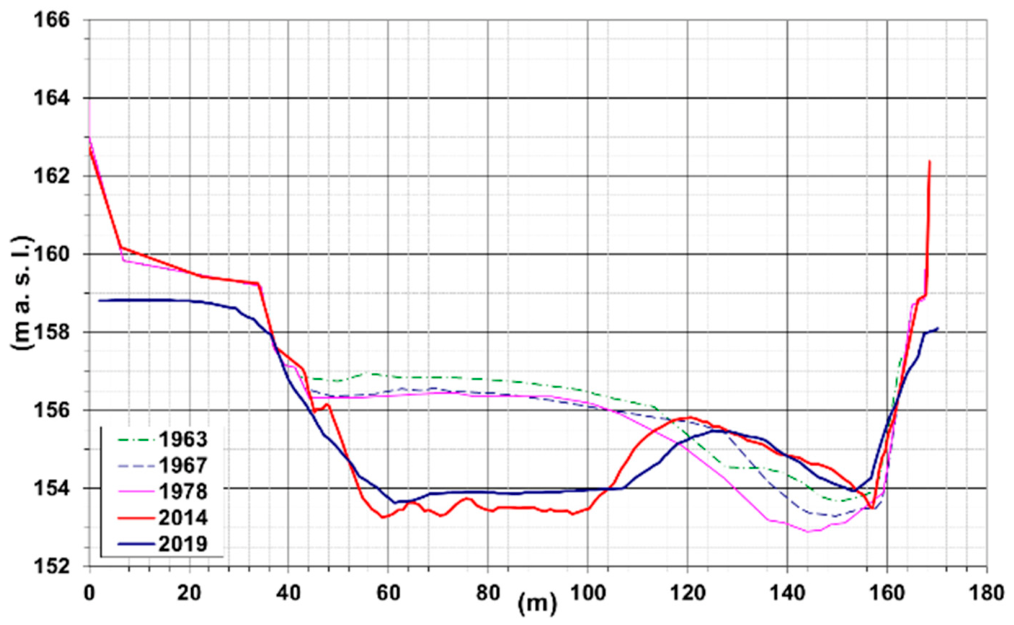
In 2019, a detailed bathymetric survey of the reservoir was conducted [21]. A major issue of the Sĺňava Reservoir is the relatively narrow “neck” at the upstream inlet (approximately 150 m upstream of the Colonnade (Glass) Bridge)—specifically at the confluence of the derivation canal from the Horná Streda hydropower plant and the old Váh riverbed—where sedimentation is most severe (Figure 2). This accumulation results from altered flow dynamics and decreased flow velocity caused by the reservoir impoundment. As with most reservoirs, the largest and heaviest particles settle immediately upon entry. The size of deposited particles gradually decreases longitudinally until fine materials—previously transported as suspended sediment—begin to settle [22]. Consequently, dredging was carried out in this section as a corrective measure.
Figure 2.
Comparison of cross-section surveys in the narrow neck of the reservoir (150 m upstream Colonnade (Glass) Bridge) for the period 1963–2019 showing the visible impact of dredging [21].
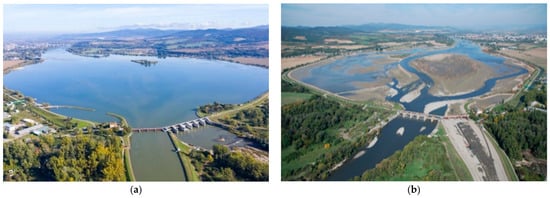
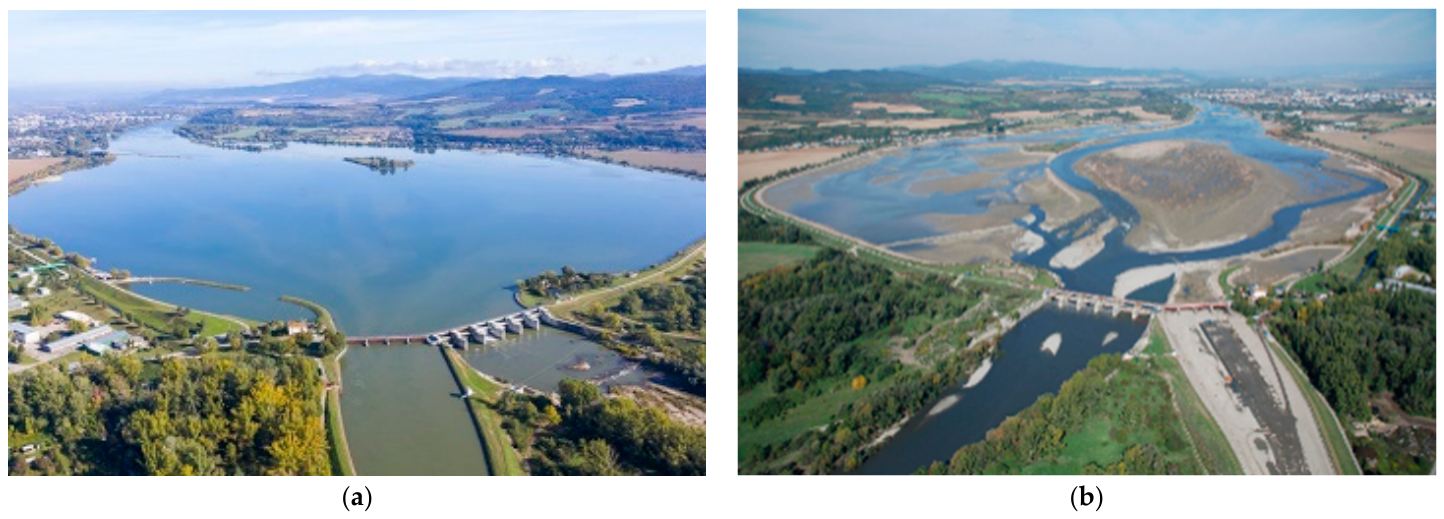
The last major inspection of hydraulic structure was conducted in 2007 (Figure 3). The reservoir was emptied to allow for the inspection of technical equipment at the Drahovce and Madunice weirs, as well as to repair the concrete seal of the canal beneath the weir. However, it was not possible to remove all sediments as planned due to hydrological conditions (increased flow rates).
Figure 3.
Aerial view of Sĺňava Reservoir: at normal stage (a) and during water level drawdown in 2007 (b) [23,24].
2.2. Data Sources, Bathymetric Surveys and Field Sampling Strategy
2.2.1. Hydrological Data Sources
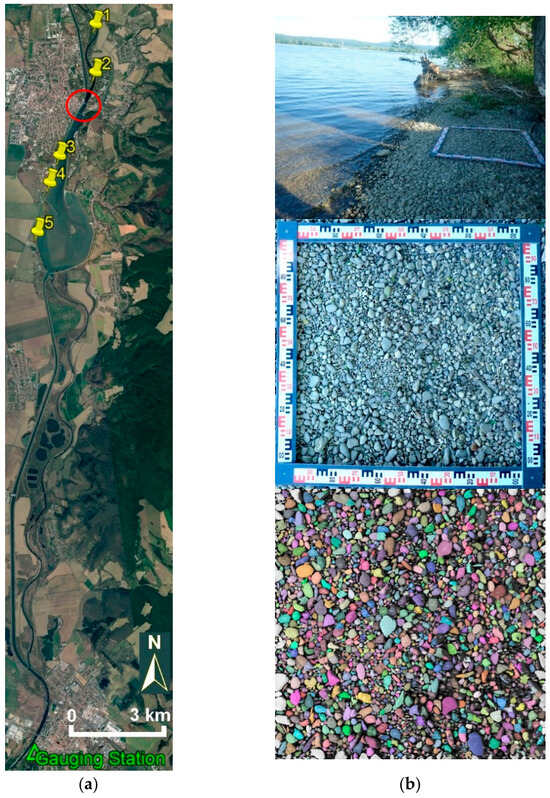
Hydrological discharge records for the Váh River system were obtained from the Slovak Hydrometeorological Institute (SHMI). Long-term daily discharge data for the period 1997–2021 were sourced from the Hlohovec gauging station (SHMI station ID 6475) (Figure 4a). This station is situated downstream of the Drahovce–Madunice water structure and provides continuous, reliable discharge series for the regional catchment. Due to the presence of the hydropower cascade, water levels within the reservoir are continuously influenced by operational peaking at upstream power plants; thus, the Hlohovec station serves as the primary reference profile for evaluating natural hydrological trends and high-flow events.
Figure 4.
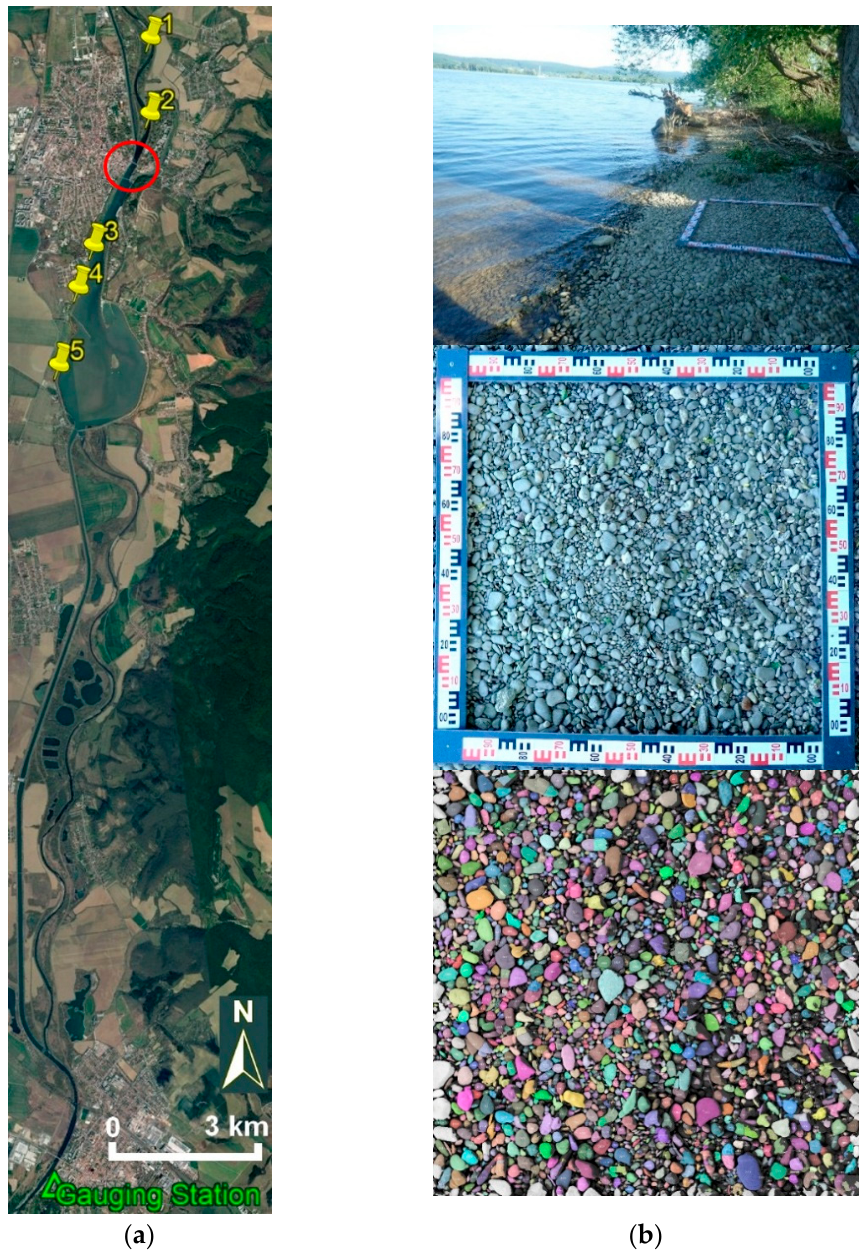
Orthophoto map of the Sĺňava Reservoir with sampling sites, narrow “neck” in the backwater zone (red circle), and position of the Hlohovec gauging station (a) and, as an example, sampling site no. 5 (b).
Furthermore, operational and return-period discharges (ranging from 520 to 2460 m3·s−1, e.g., Q2 ≈ 1090 m3 ⋅ s−1, Q20 ≈ 1726 m3 ⋅ s−1, Q100 ≈ 2100 m3 ⋅ s−1) were derived from the official stage-discharge rating curve for the Váh River at the Colonnade (Glass) Bridge cross-section, as prescribed in the reservoir operational manual [20].
2.2.2. Historical and Recent Bathymetric Survey
Historical bathymetric data from 1963, 1967, and 1978 [21] were obtained from cross-sectional surveys, with depths measured manually from a vessel using a sounding lead in the earlier surveys. The 2014 survey [21] employed single-beam sonar (Sontec) integrated with a Trimble GPS receiver to map the submerged areas, supplemented by above-water bank surveys. The 2019 survey [21] employed a Norbit WBMS compact multibeam sonar and a high-precision NovAtel GNSS receiver to obtain high-resolution bathymetric data. The submerged terrain survey was complemented by LiDAR mapping of exposed banks and areas above the water surface up to the maximum retention level.
2.2.3. Grain-Size Field Sampling via Optical Granulometry
Field sampling for sediment grain-size analysis was conducted on 20 May 2022, across five representative locations along the Váh River and Sĺňava Reservoir. Sampling was intentionally performed during a period of low water level, exposing the active surface bed material along the shorelines. The active surface layer directly interacts with flow dynamics and dictates initial sediment motion.
The five sampling sites (Samples 01–05) (Figure 4) were selected to capture longitudinal grain-size evolution:
- Samples 01 and 02: Located in the old Váh riverbed upstream of the confluence with the Horná Streda derivation canal.
- Sample 03: Located near the Piešťany dockyard.
- Sample 04: Located near the embankment behind the Piešťany wastewater treatment plant.
- Sample 05: Located near the Drahovce weir at the downstream end of the reservoir, capturing the finest exposed shoreline material.
Grain-size distributions were evaluated using optical (photographic) granulometry. This method operates on the principle that the surface area proportion of a given grain fraction corresponds directly to its volumetric and mass proportion. This approach provides suitable accuracy for engineering analyses of gravel-bed.
2.3. Sediment Transport
The transport and deposition of sediments in reservoirs are critical aspects of hydraulic engineering and water resource management. Accurate quantification of sediment inflow and accumulation is essential for reservoir operation, maintenance, and long-term sustainability. Over the decades, several methods have been developed to estimate sedimentation rates and spatial distribution within reservoirs.
Sediment quantities can be determined using three primary approaches: (1) calculations based on theoretical–experimental, or empirical relationships; (2) investigations conducted using hydraulic models; and (3) direct field measurements. The appropriate approach depends on the study objectives and the spatial scale of the investigated sediment processes. In this study, the focus is on the transport and redistribution of existing bed material within the Sĺňava Reservoir and on evaluating potential sediment management measures, rather than on quantifying catchment-wide sediment production and erosion. Therefore, watershed erosion processes were not directly simulated in this study.
Theoretical–experimental relationships provide a basis for estimating reservoir sedimentation [4,22]. However, empirical and theoretical–experimental formulations require detailed input parameters—such as the representative grain size (d50, def), exact cross-sectional hydraulic geometry, and flow velocities across individual channel segments [10,19]. Consequently, these methods impose significant demands on long-term field monitoring. Furthermore, empirical estimates often yield transport rates that deviate from real-world observations because they cannot fully account for site-specific operational changes (e.g., hydropeaking or reservoir water-level regulation) or upstream catchment land-use shifts [8,12,22].
Physical and numerical hydraulic modeling offer a more detailed understanding of sediment behavior. Physical models replicate flow and sedimentation patterns in a scaled-down laboratory environment, while numerical models couple hydrodynamic simulations with sediment transport processes to assess depositional zones and stratification [4,25]. Although these models provide high-resolution insights into sediment distribution, they generally require extensive calibration, high-quality field data, and, in the case of complex 3D simulations, significant computational resources.
The most reliable data on the sedimentation of existing reservoirs are obtained from direct measurements. These are typically carried out through bathymetric surveys at predefined monitoring cross-sections. By comparing repeated measurements taken over time, it is possible to quantify changes in bed elevation, estimate the volume of accumulated sediments, and analyze their spatial distribution [26,27,28]. Based on such measurements, temporal forecasts of future sedimentation trends can be developed.
Each approach has distinct strengths and limitations. Theoretical methods are useful for preliminary assessments and long-term planning, while hydraulic modeling provides deeper insights into complex flow-sediment interactions. However, for accurate, site-specific validation, direct measurements remain indispensable.
2.3.1. Grain-Size Analysis
The grain-size distribution of bed material—comprising both the surface (armor) and sub-surface layers—is, alongside flow velocity, a critical factor governing sediment transport. In theoretical and empirical equations describing the movement of gravel-bed sediment, the representative grain diameter is a primary parameter. Natural gravel-bed channels typically consist of heterogeneous mixtures with variable grain sizes. For calculation purposes, this heterogeneous material is often approximated by an equivalent uniform grain size that exhibits similar behavior under identical hydraulic conditions.
Various authors have proposed different representative grain size metrics. For instance, Krey recommended using the median diameter d50, while Einstein suggested a range between d35 and d45 (both cited in [29]). In Central European hydraulic engineering practice, the effective grain diameter def is frequently employed [29].
The traditional method for determining grain size distribution is sieve analysis. While highly accurate, it is labor-intensive and challenging to implement extensively in the field. An efficient, non-intrusive alternative is the photographic (optical) granulometry method [29,30]. This approach provides adequate accuracy for practical engineering applications and is particularly well-suited for gravel-bed rivers and exposed reservoir banks during low water periods. This method focuses on the grain-size distribution of the surface (active) layer, which is of particular hydraulic interest as it interacts directly with the flow. Therefore, the grain-size distribution of the surface layer was considered representative of the bed material exposed to the flow and potentially available for initial motion. Optical granulometry operates on the assumption that the percentage of the surface area covered by a specific sediment fraction corresponds to its volumetric or mass percentage. The surface area of each fraction is derived from calibrated photographs of the undisturbed bed, allowing for rapid granulometric assessment without physical sampling [29].
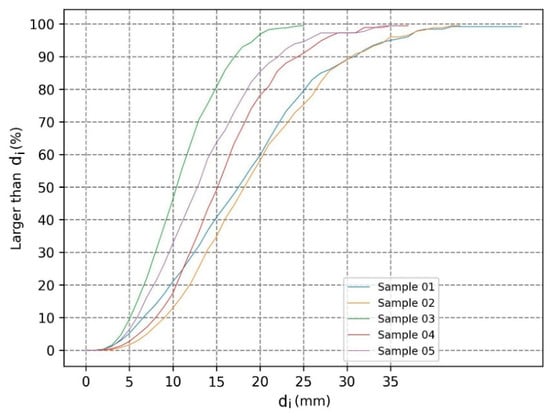
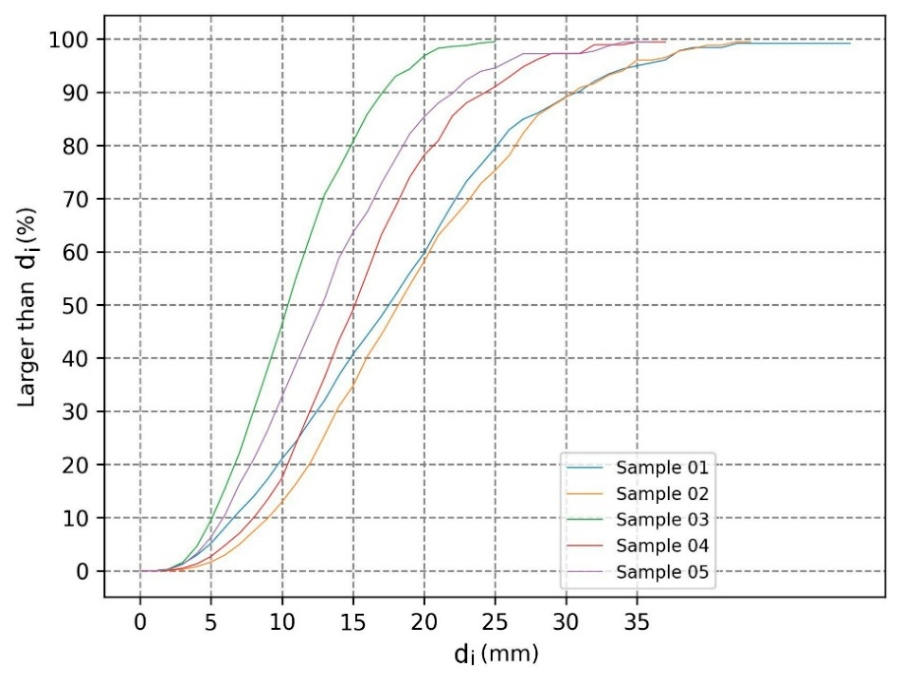
Grain-size distributions were evaluated using photographic (optical) granulometry based on high-resolution field imagery processed in ImageJ software (version 1.46r), an open-source image analysis software developed by the U.S. National Institutes of Health [30]. The resulting grain-size distribution curves (Figure 5) established the spatial grain-size variability along the reservoir. Specifically, the mean representative grain diameter (dm) was considered equivalent to d50, while the effective grain diameter (def) was approximated as d10. Across the five sampling locations, local median diameters ranged from dm = 18 mm in the coarse upstream backwater reach (Samples 01–02) to finer fractions downstream, yielding an overall spatial average median diameter of dm = 14.7 mm. These measured grain-size parameters serve as fundamental baseline sediment inputs for both the 1D analytical transport formulations and the 2D morphodynamic HEC-RAS model.
Figure 5.
Grain size distribution curves for individual locations, where di represents the representative particle diameter of the i-th grain-size fraction, determined by image-based granulometric analysis (mm).
2.3.2. Methodology for Sediment Transport Rate Calculation
The sediment transport regime is analyzed by identifying the incipient motion discharge (Q0), defined as the flow rate at which bedload motion initiates. For discharges Q > Q0, the sediment transport rate (Qs in kg·s−1) is calculated. To quantify sediment transport, the modified Meyer–Peter formula, as adapted by Kališ [31], was applied. This method has been verified and recommended for Slovak river conditions [32].
To execute these analytical transport calculations (Equations (1)–(7)), the fundamental hydrodynamic parameters at each sampling profile, including the average cross-sectional flow velocity (v), water surface slope (i), energy grade line slope (ie), and surface width (B), were determined for specific discharges within the operational flow range defined by the reservoir’s rating curve [20]. These parameters were obtained using a 1D hydraulic HEC-RAS model of the Sĺňava Reservoir prepared specifically for this purpose, extending from the Drahovce weir to the downstream end of the backwater zone at the confluence of the Váh River and the Horná Streda derivation canal, based on bathymetric soundings from 2014 and 2019 [21,33].
The calculation procedure is as follows:
- Critical shear stress (τcrit)—determined for each location based on the granulometric analysis results:
τcrit = 0.047 ⋅ g ⋅ (ρs − ρ) ⋅ dm
- Bed roughness coefficient (nd)—estimated for each location using the modified Strickler formula:
- Effective Hydraulic Radius (Ref)—approximated by the hydraulic radius (Rd), calculated from the Manning equation for each discharge with available hydraulic parameters:
- Actual shear stress (τ)—calculated from the hydraulic parameters for each discharge:
τ = ρ ⋅ g ⋅ Ref ⋅ ie
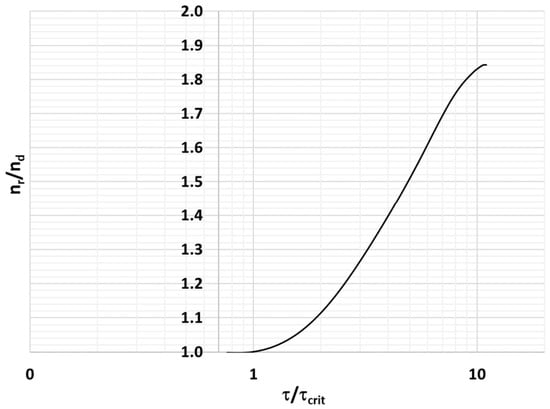
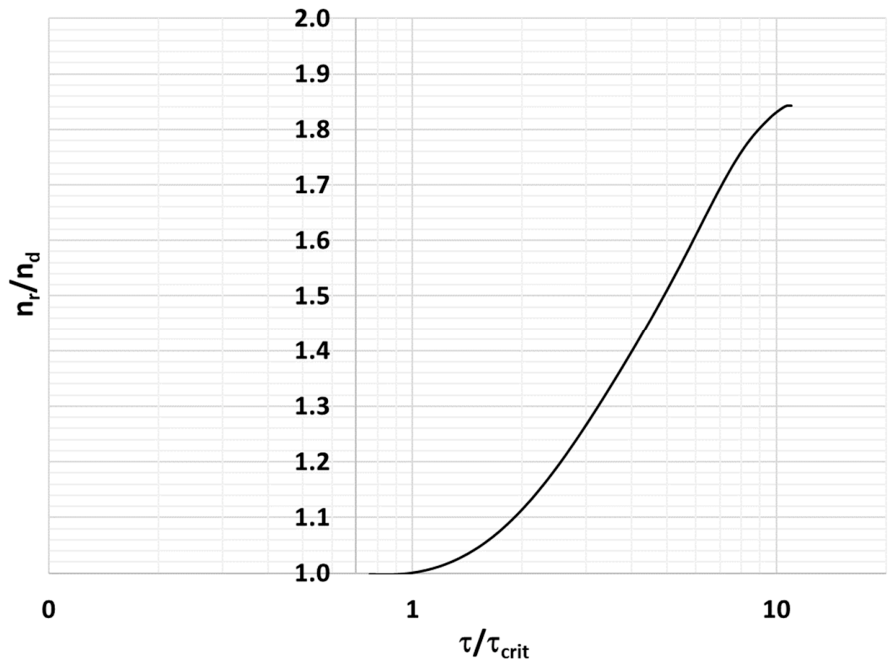
- Initiation of sediment motion—assumed to occur when τ ≥ τcrit. Once this condition is met, sediment is considered mobile. Under these conditions, the effective shear stress (τef) is calculated as [31]:
Figure 6.
Graph of the influence of sediment transport on bed roughness for Fr < 0.7 (in river flow conditions, where Fr is dimensionless Froude number), showing the relationship between the shear stress ratio (τ/τcrit) and the roughness coefficient ratio (nr/nd) [31].
- Unit sediment transport rate (qs in kg·s−1·m−1)—calculated using the modified Meyer–Peter equation:
- Total sediment transport rate (Qs in kg·s−1)—obtained by multiplying the unit transport rate (qs)⋅by the channel width (B):
Qs = qs ⋅ B
2.4. Sediment Transport in HEC-RAS
To simulate sediment transport dynamics in the studied reservoir reach, the Hydrologic Engineering Center’s River Analysis System (HEC-RAS), developed by the U.S. Army Corps of Engineers, was employed. HEC-RAS is a widely used, open-source software that supports one-dimensional (1D) steady and unsteady flow, as well as two-dimensional (2D) hydrodynamic and morphodynamic simulations [33].
In standard 1D applications, sediment transport is modeled as bed-material movement, resulting in erosion (scour) or deposition over time scales ranging from individual flood events to multi-year periods. Transport typically occurs through two principal mechanisms: bedload and suspended load, governed by variables such as sediment bed gradation, sediment layers, and sediment boundary conditions. The software estimates transport capacity by treating each cross-section as a control volume. The fundamental principle underlying sediment routing is mass conservation, represented by the Exner equation [33], which defines the relationship between sediment inflow, outflow, and the resulting change in bed elevation (aggradation or degradation).
HEC-RAS includes a suite of widely used sediment transport functions [17,19,33,34]. Their applicable grain size ranges and primary underlying principles are summarized in Table 1.
Table 1.
Overview of sediment transport functions available in HEC-RAS and their applicable grain size ranges [17,19,33].
For this study, the advanced 2D sediment transport capabilities of HEC-RAS (version 6.3.1) were utilized. This allows for the simulation of mixed cohesive/non-cohesive sediments, multiple grain size classes, and sub-grid morphological adjustments. The sediment continuity equation is solved using an implicit finite volume method applied to the same computational mesh as the hydrodynamic model. While robust, the model is primarily suited for short- to medium-term simulations due to computational demands and limitations in long-term bathymetric change modeling [17,19,33].
2.4.1. Hydrodynamic Setup
The geometry of the reservoir reach was defined using cross-sectional and bathymetric survey data from 2019, supplemented by historical measurements from 2014. The morphodynamical simulations were based on the hydrodynamic computational domain which was discretized using an unstructured 2D mesh within the HEC-RAS environment, carefully configured to accurately capture the complex geometry and morphological features of the study area. The generated mesh comprised a total of 39,252 computational cells with a typical spatial resolution of 4 m. This resolution was chosen to achieve an optimal balance between computational efficiency and the detailed spatial representation required for accurate 2D mobile bed and sediment transport simulations. The quality and reliability of the hydrodynamic model also depend on the computational step ∆t. The temporal discretization of the numerical model was set with a fixed time step of ∆t = 0.5 s. This time step was carefully selected to ensure numerical stability, satisfy the Courant–Friedrichs–Lewy (CFL) condition, and accurately capture rapid hydrodynamic changes and sediment transport dynamics during the mobile bed simulations.
The 2D numerical model was calibrated under steady-state hydraulic conditions using water surface elevation measurements and the official rating curve at the Colonnade (Glass) Bridge profile for discharges ranging between 600 m3 · s−1 and 1200 m3 · s−1. Manning’s roughness coefficients (n = 0.040) were adjusted iteratively across the bed and channel banks. This coefficient adequately represented hydraulic resistance, boundary friction, and bed characteristics of the submerged zone during the simulations.
2.4.2. Sediment Transport Formulations and Model Setup
Sediment transport dynamics were simulated using the Meyer-Peter and Müller transport function. Vertical sediment sorting and bed armoring processes were accounted for by employing the active layer method, and particle fall velocity was calculated using the Soulsby formulation. The sediment material was characterized by a grain-size fraction ranging from fine sand (FS) to medium gravel (MG) [21], implemented as a single representative gradation curve derived from field sampling (dm = 18 mm and 14.7 mm) and applied uniformly across the domain. Boundary flow conditions were derived from hydrographs covering the 2014–2019 period, specifically focusing on transport-effective discharges equal to or exceeding the initiation threshold.
Quantitative validation of net long-term sediment volumes in Sĺňava Reservoir is inherently constrained by historical maintenance dredging. Historically, dredged sediment volumes were recorded only when material was commercially sold. In recent years, excavated material has been deposited directly onto internal spoil islands/depots within the reservoir, or dredging was suspended (e.g., between 2002 and 2007). Consequently, morphodynamical model predictions focus on spatial erosion/deposition patterns and relative mitigation efficiency rather than absolute historical volume matching. Catchment soil erosion was excluded from boundary inputs as bedload entering from the upstream Váh riverbed represents the primary contributor to reservoir delta aggradation.
To assess alternative management strategies, the simulated flow series (Q ≥ 600 m3 ⋅ s−1) and extreme flood hydrographs were applied across five distinct computational scenarios. The management scenarios were compared based on the simulated spatial patterns of erosion and deposition, with particular attention to the critical backwater zone:
- Scenario 1: Prediction of bed morphology evolution over a short- to medium-term time frame without any river management interventions.
- Scenario 2: Prediction of bed morphology evolution over a short- to medium-term time frame with maintenance dredging in the riverbed in the area at the confluence of the derivation canal and the Váh River, and downstream of the Road Bridge.
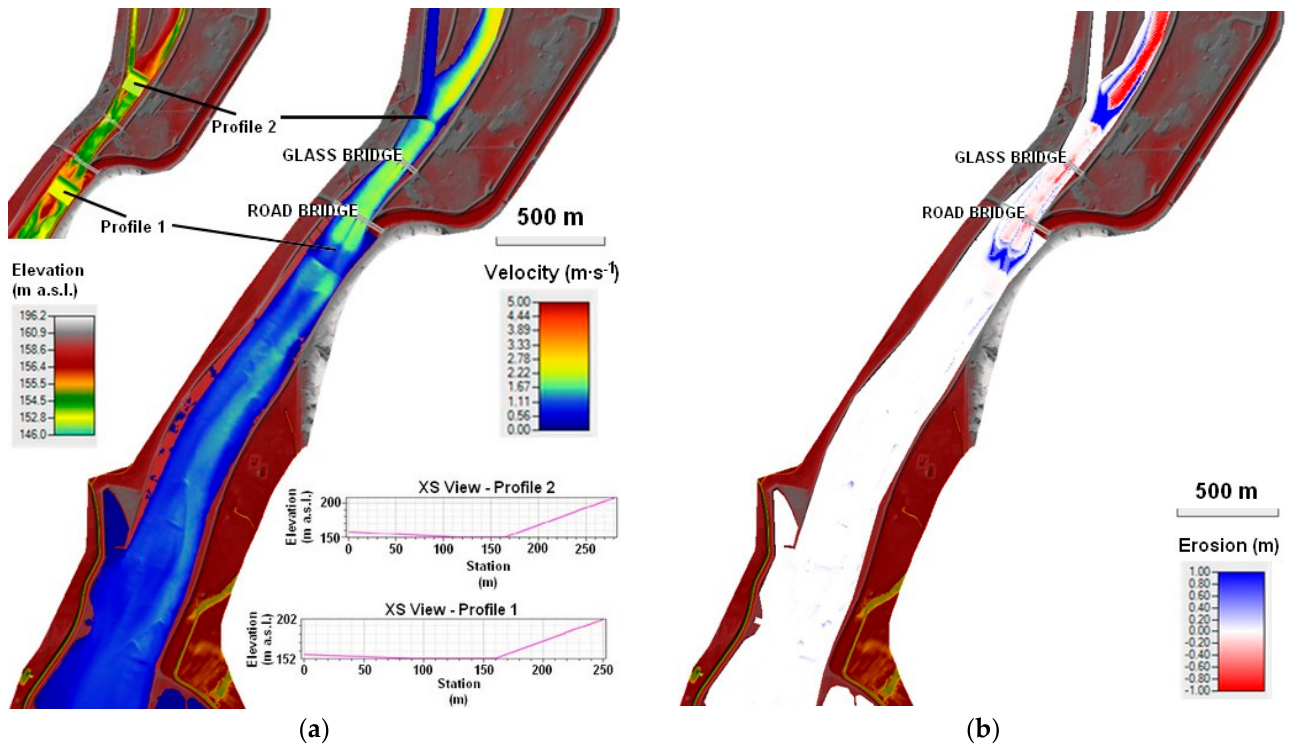
- Scenario 3: Prediction of bed morphology evolution over a short- to medium-term time frame with excavation of 2 proposed sedimentation pits (Profile 1 and Profile 2) as part of maintenance activities. Note: Profile 1 (downstream of the Road Bridge)—sedimentation pit, width 70 m, bed elevation 152 m a.s.l., upstream slope 1:20, downstream slope 1:2. Profile 2 (at the confluence of the derivation canal and the Váh River)—sedimentation pit, width 50 m, bed elevation 150 m a.s.l., upstream slope 1:15, downstream slope 1:2.
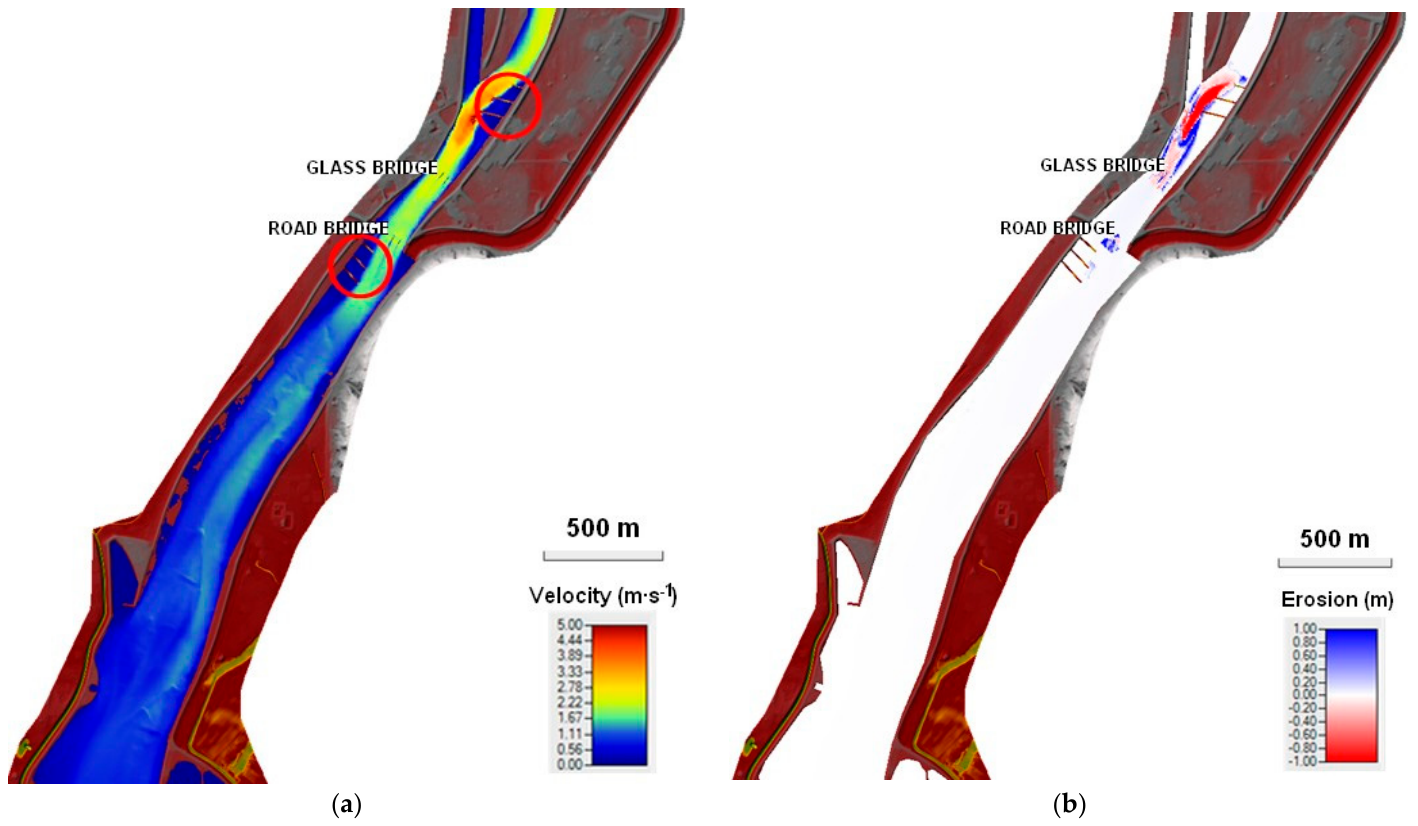
- Scenario 4: Prediction of bed morphology evolution over a short- to medium-term time frame with the construction of groins. This scenario investigated bed morphology modifications induced by the construction of two groups of concentrating structures (groins) in critical sections of the river channel: (i) at the confluence of the derivation canal and the Váh River, where three groins were placed along the left bank, and (ii) downstream of the Road Bridge, where three groins were constructed along the right bank. The design also included dredging between the groin groups.
- Scenario 5: Bed morphology evolution during a flood event corresponding to a Q100 discharge (2100 m3∙s−1).
3. Results
This study employed all of the previously discussed methods for assessing sediment transport and forecasting its future evolution, considering the implementation of proposed management measures.
3.1. Grain-Size Analysis and Transport-Rate Values
To assess total bedload transport rates (Qs) in the critical backwater zone of the reservoir (Table 2, Figure 7), representative grain-size parameters were selected based on standard hydraulic formulations where the mean representative grain diameter dm corresponds to the median diameter d50 [29]. Two distinct representative grain sizes were evaluated:
Table 2.
Bedload transport rates (Qs) in the reservoir backwater zone for various flow conditions (Q) and representative grain diameters, dm = 18 mm and dm = 14.7 mm.
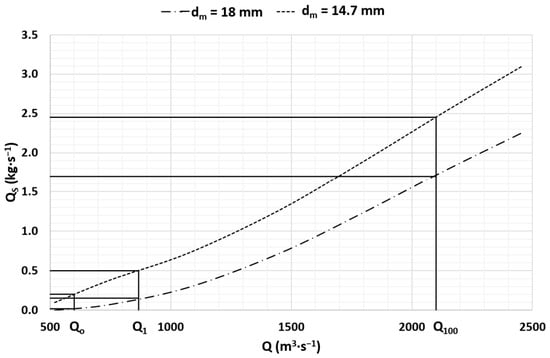
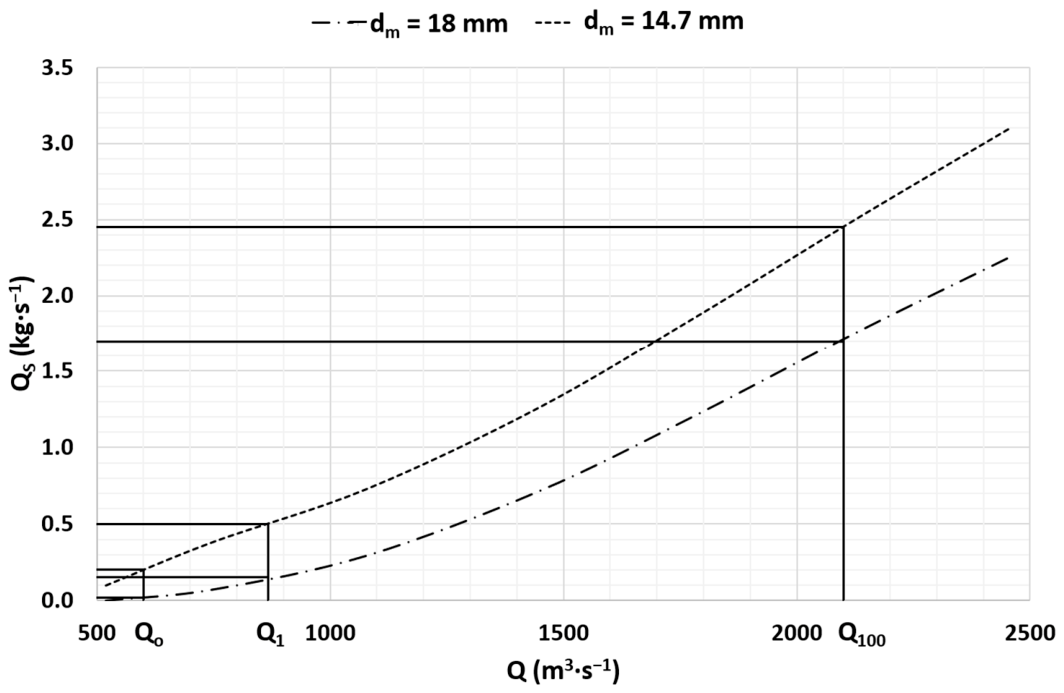
Figure 7.
Evaluation of bedload transport (Qs = f(Q)) at the critical section of the reservoir (backwater zone) under various flow conditions and for representative grain diameters dm = 18 mm and dm = 14.7 mm, where Q (m3 ⋅ s−1) on the horizontal axis represents volumetric water discharge and Qs (kg ⋅ s−1) on the vertical axis represents the calculated instantaneous bedload mass flux. The graph illustrates the continuous theoretical transport capacity across operational and flood discharges, highlighting key hydrological thresholds (critical threshold discharge Q0 = 600 m3 ⋅ s−1 for incipient sediment motion, and Q1 = 868 m3 ⋅ s−1, and Q100 = 2100 m3 ⋅ s−1).
- A local representative diameter (dm = 18 mm), corresponding to the measured d50 of active bed material sampled directly within the upstream backwater delta reach (Samples 01–02), where coarse gravel accumulation is most severe.
- An overall spatial mean diameter (dm = 14.7 mm), representing the arithmetic average d50 across all five sampling locations (Samples 01–05), capturing the longitudinal downstream fining trend along the reservoir domain.
Water discharges (Q) listed in Table 2 were specified based on hydrometric water-level measurements and the official stage-discharge rating curve for the Váh River reach at the Colonnade (Glass) Bridge, while bedload transport rates (Qs) were evaluated analytically using the transport formulations outlined in Section 2.3.2 (Equations 6 and 7) for local (dm = 18 mm) and spatial mean (dm = 14.7 mm) grain diameters to establish analytical boundary conditions for subsequent 2D numerical modeling.
The analytical results in Table 2 and Figure 7 evaluate total bedload transport capacity (Qs) as a direct function of water discharge (Q) for the representative cross-sectional geometry of the critical backwater reach. Hydraulically, as flow transitions from the confined river channel into the wider reservoir reach, the increase in channel cross-sectional area leads to a marked reduction in mean flow velocity and bed shear stress for any given discharge Q. Consequently, the transport capacity Qs drops below the threshold required for bedload movement, driving progressive aggradation and delta formation in the upstream backwater zone. The initiation of gravel movement at a threshold discharge of approximately 600 m3 ⋅ s−1 in the River Váh—derived analytically using the 1D threshold formulations described in Section 2.3.2 for dm = 18 mm—applies specifically to the narrow backwater zone (the constricted upstream reach). Notably, this analytical finding aligns with the official reservoir operational rules [20], which similarly identify 600 m3 ⋅ s−1 as the operational threshold for bedload transport onset.
3.2. Hydrological Assessment
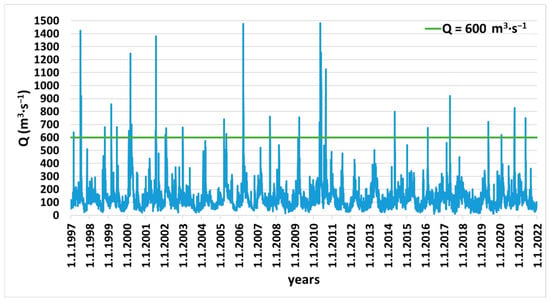
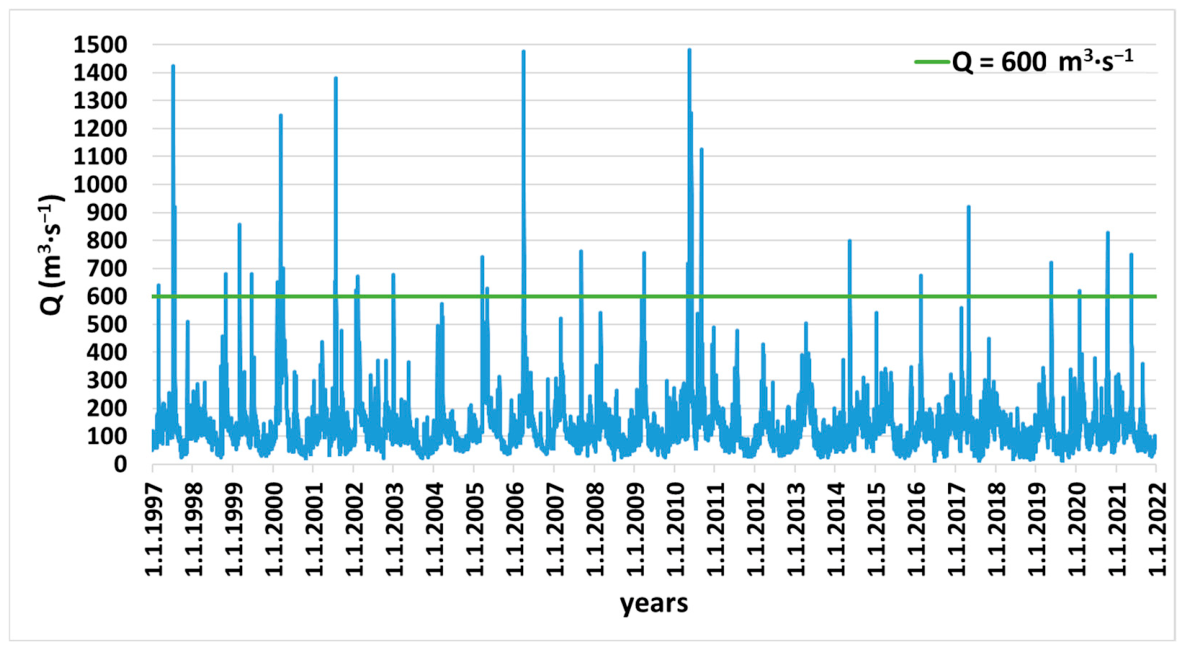
Based on the discharge required to initiate sediment motion (Q0 = 600 m3∙s−1), which is lower than the one -year flood discharge (Q1 = 868 m3∙s−1), a hydrological analysis was performed to assess the likelihood of natural sediment mobilization. Data from the Hlohovec gauging station on the Váh River (mean daily discharges), located downstream of the Drahovce–Madunice water structure, show a decreasing discharge trend over the period 1997–2021 (Figure 8) consistent with climate-related hydrological changes reported for the region [35,36,37].
Figure 8.
Assessment of long-term mean daily discharge data (Q) for the period 1997–2021 at the Hlohovec gauging station in relation to the threshold discharge for sediment transport initiation (Q0 = 600 m3 ⋅ s−1).
Although mean daily discharges above 600 m3∙s−1 occurred on 74 days over the 25 years, only 10 such days were recorded in the last decade. This indicates that natural sediment mobilization in the Sĺňava Reservoir has become increasingly unlikely under current hydrological conditions.
3.3. Sediment Transport Modeling Using HEC-RAS
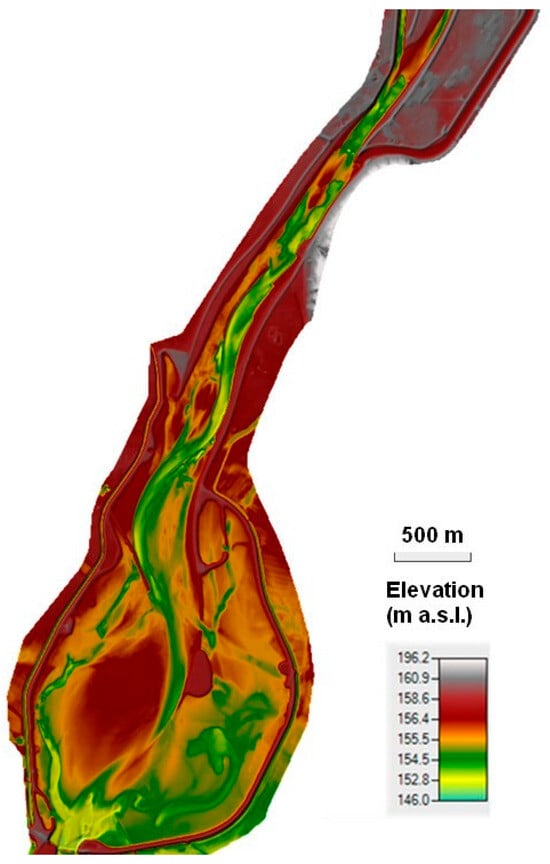
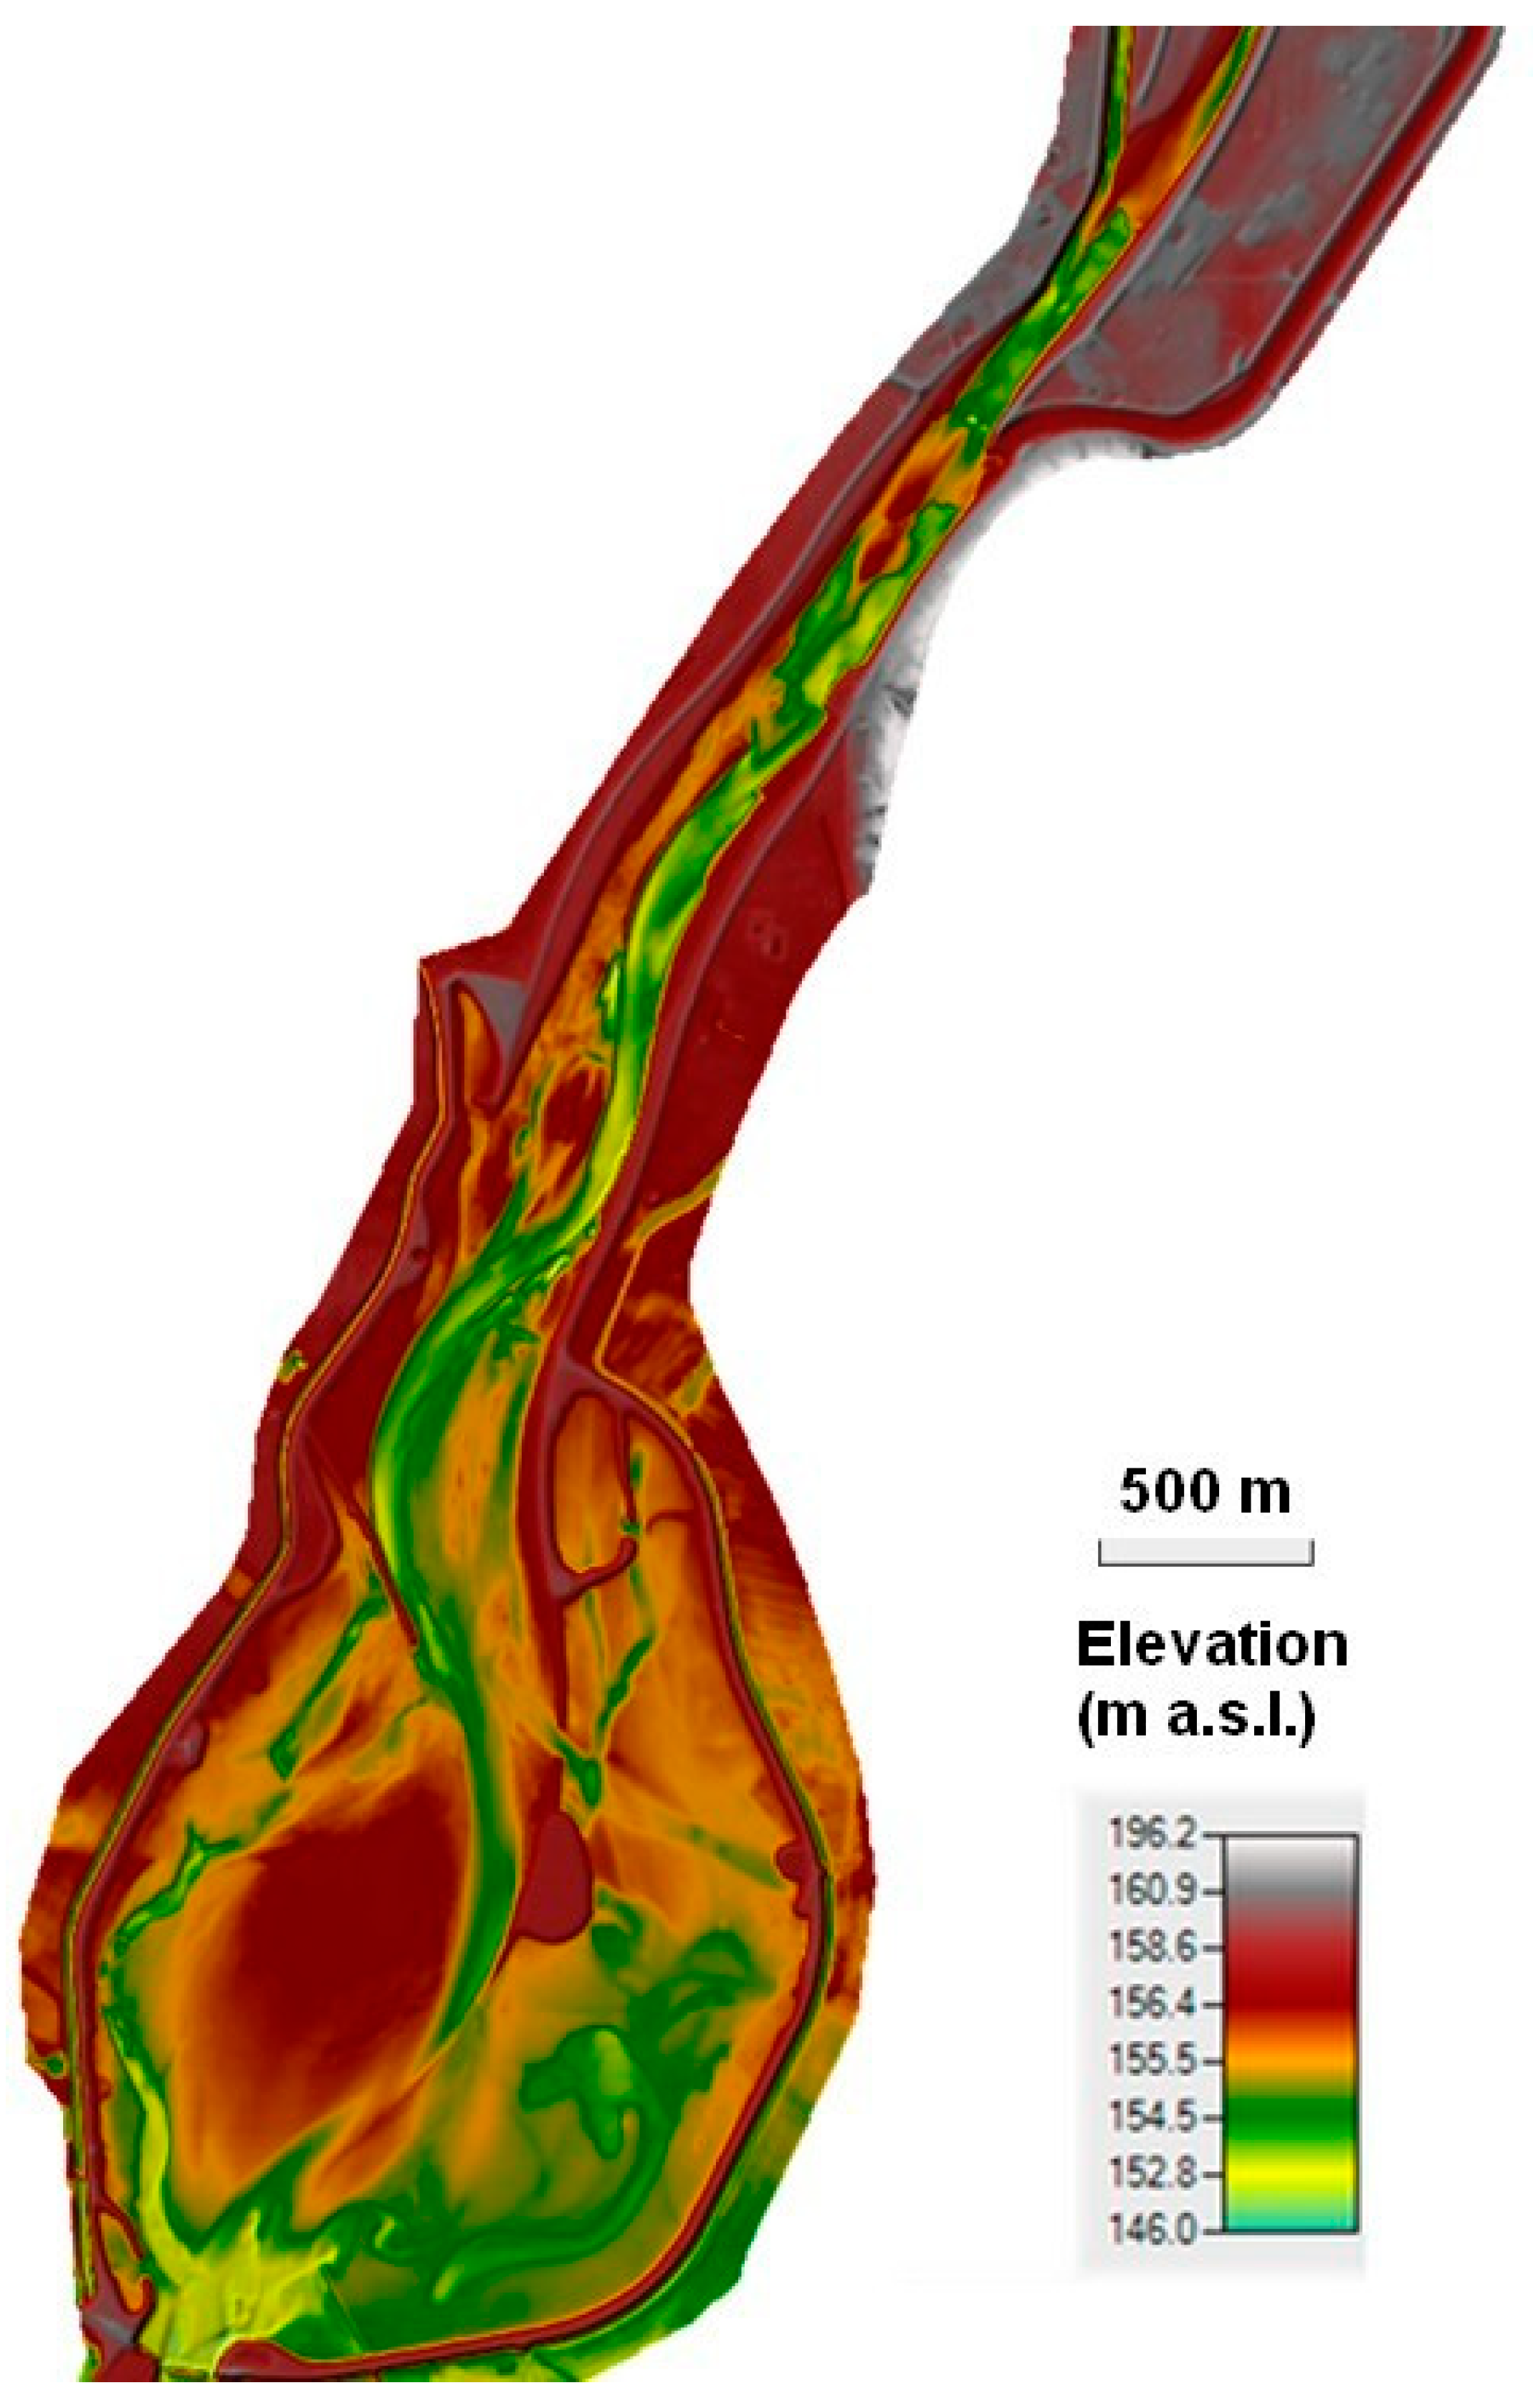
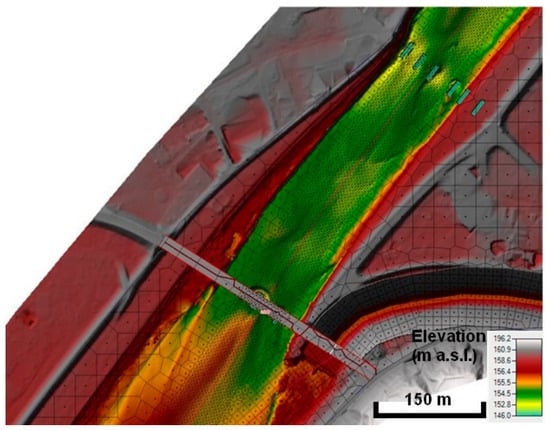
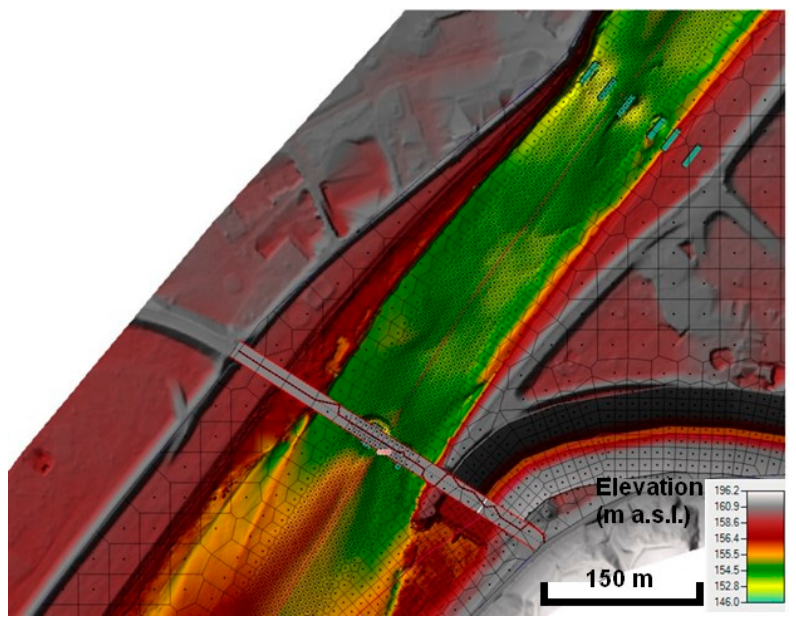
The spatial morphodynamic evaluation of the Sĺňava Reservoir was performed using the calibrated 2D HEC-RAS model based on the combined bathymetric (2019) and topographic (2014) dataset (Figure 9). The unstructured computational mesh (Figure 10) successfully captured the complex spatial channel geometry, shoreline contours, and bridge pier structures across the critical backwater reach.
Figure 9.
Computational domain of the Sĺňava Reservoir area of interest.
Figure 10.
Example of computational mesh detail–area between bridges.
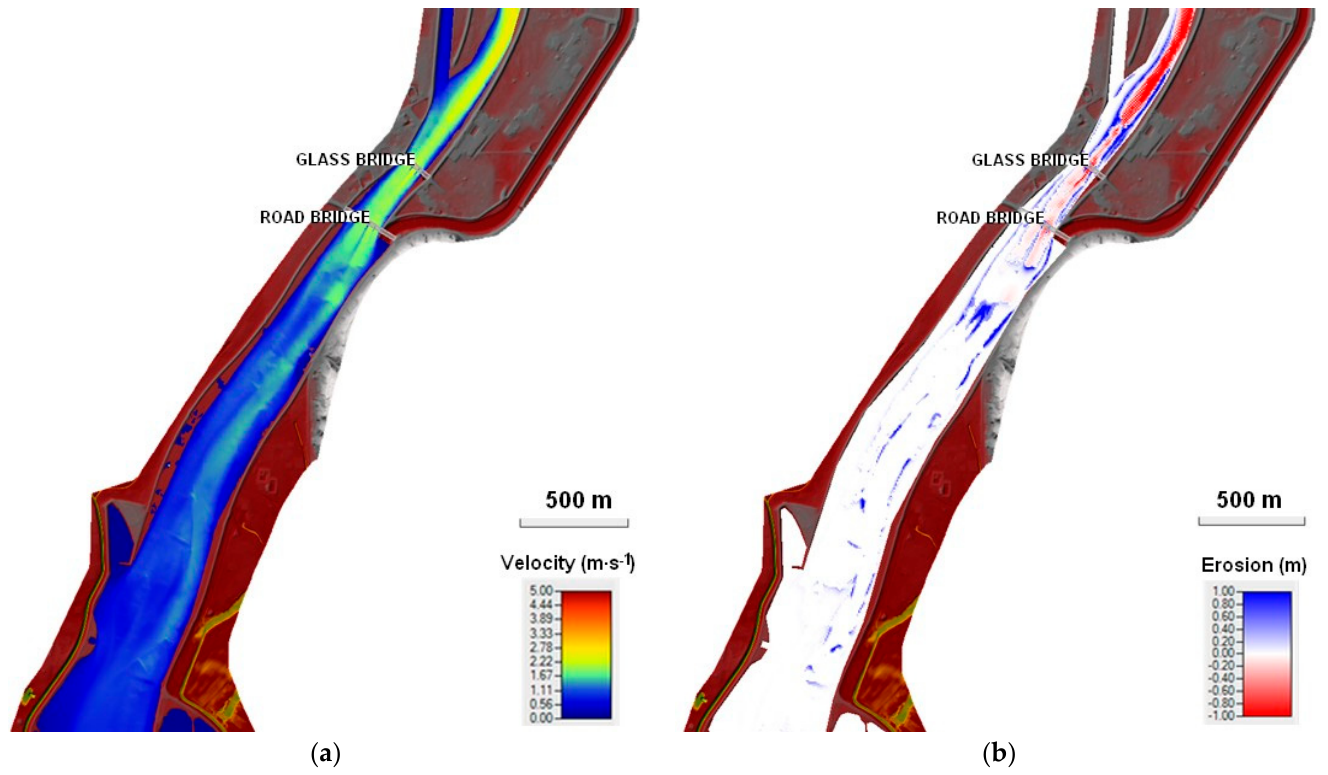
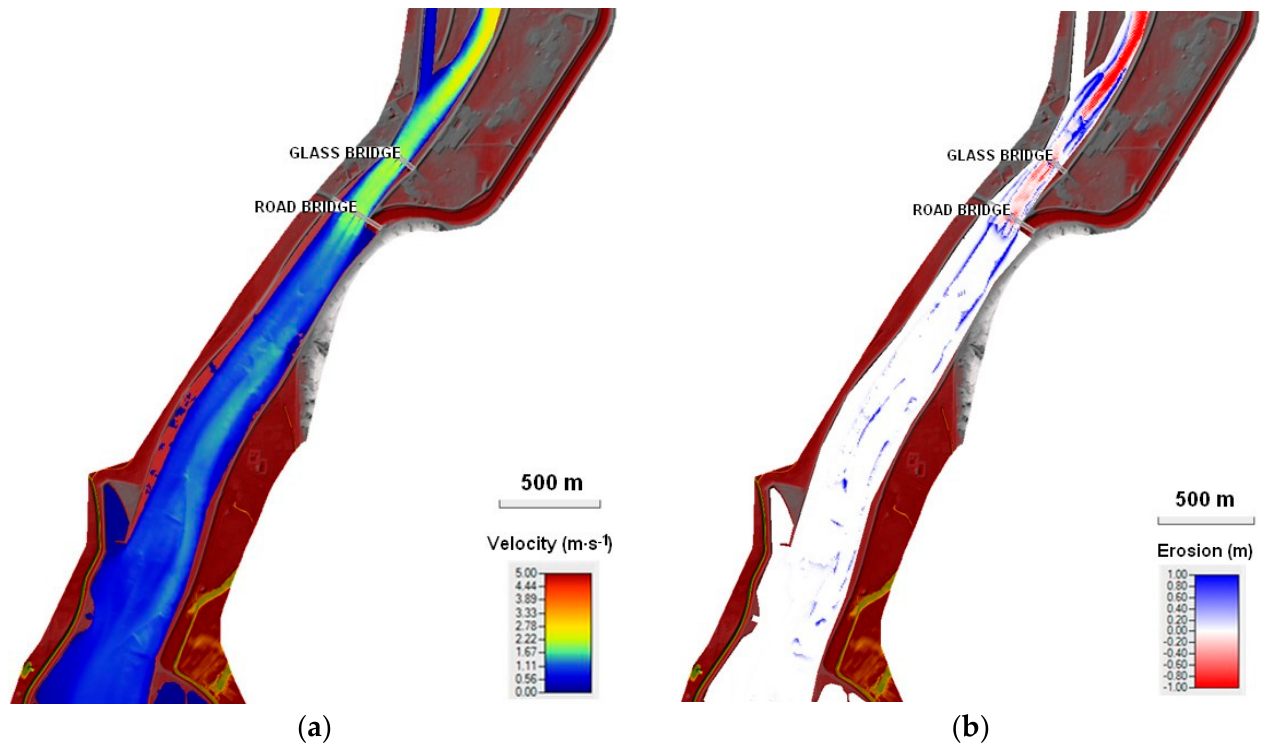
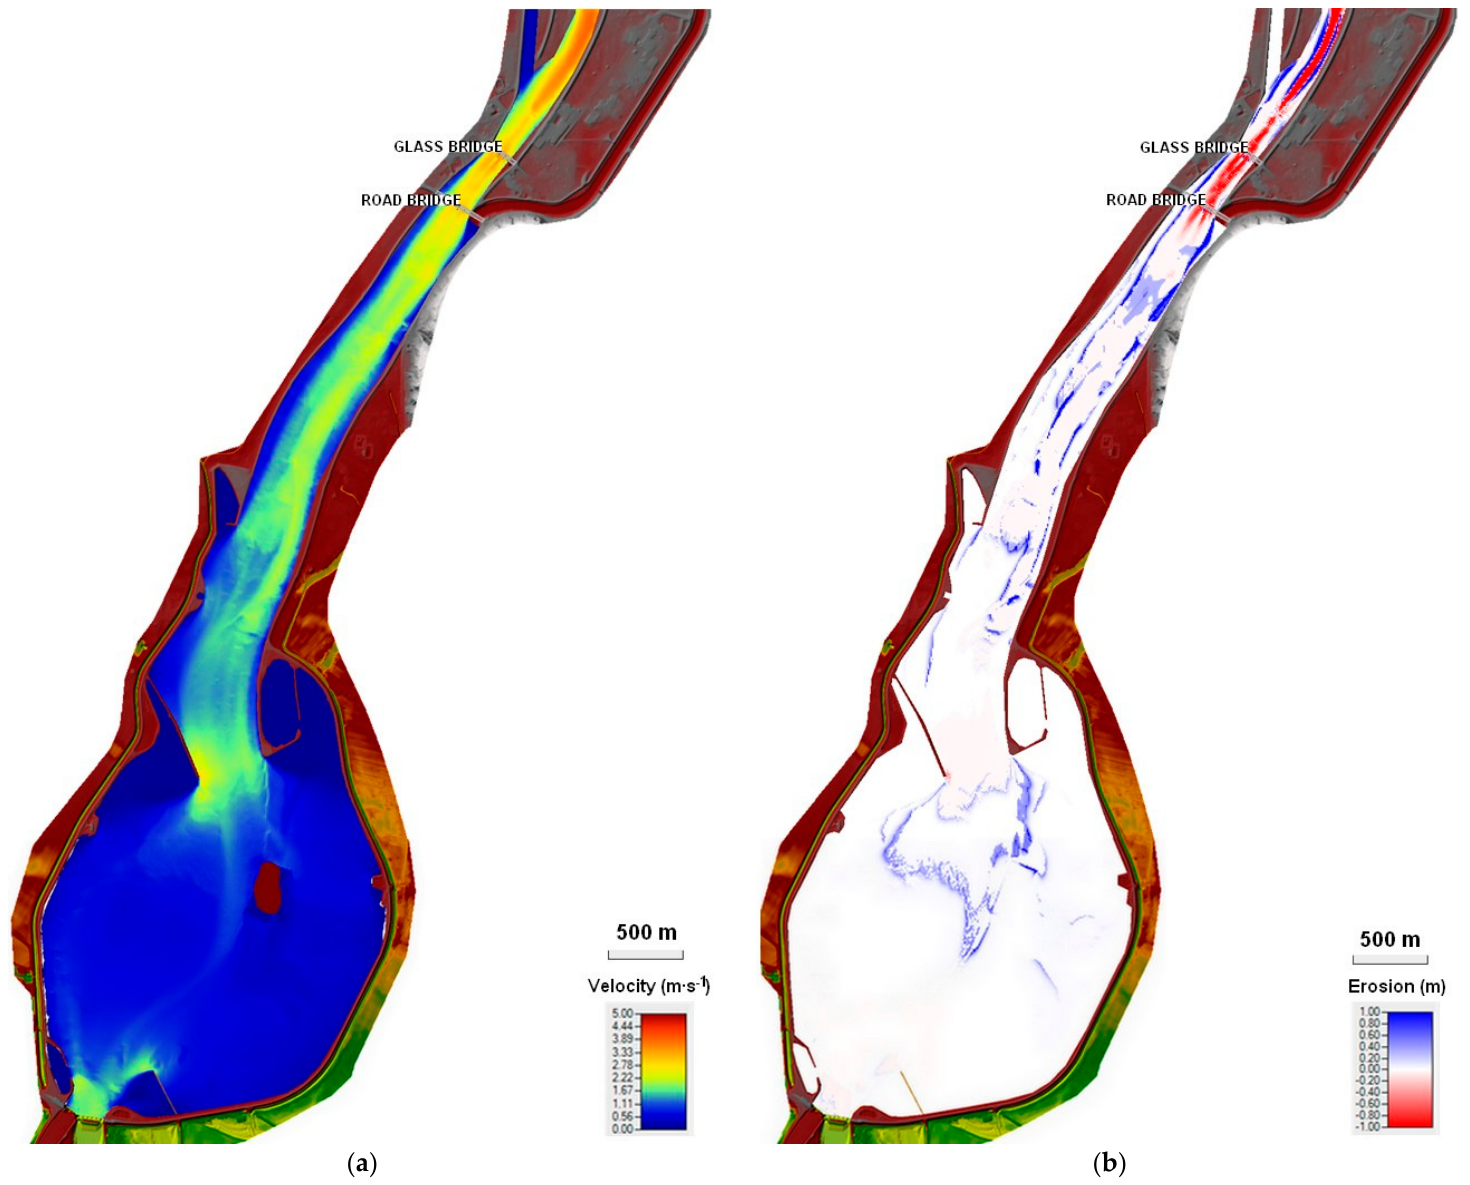
In scenarios 1–4, the most significant sediment transport occurred in the section between the two bridges, i.e., within the backwater zone, while in the rest of the reservoir, the effect was negligible. Accordingly, Figure 11, Figure 12, Figure 13 and Figure 14 display only this section (the narrow reach with the bridges and the upstream limit of the backwater zone), where the most pronounced changes were observed. In scenario 5, however, erosion processes affected the entire reservoir area (Figure 15). The results confirmed that significant bed deformation occurs only under flood conditions.
3.3.1. Scenario 1: Results
Under natural bed evolution without management interventions, discharges of Q ≥ 600 m3∙s−1 are expected to cause almost complete sedimentation at the upstream backwater limit (the confluence with the derivation canal). The gravel bar progressively extends to the Colonnade (Glass) Bridge, forming a zone of pronounced deposition. Accumulation downstream of the Road Bridge is also projected to intensify (Figure 11).
Figure 11.
Scenario 1. (a) Velocity map of the backwater zone. (b) Map of erosion and deposition in the backwater zone.
3.3.2. Scenario 2: Results
Dredging at the confluence (upstream backwater limit) and downstream of the Colonnade (Glass) Bridge substantially reduces sedimentation intensity, while erosion below both the Colonnade (Glass) and Road Bridges decreases accordingly (Figure 12). This represents an effective method of sediment management. However, the placement of dredged material must be carefully selected to avoid significant reductions in the storage or retention capacity of the Sĺňava Reservoir.
Figure 12.
Scenario 2. (a) Velocity map of the backwater zone. (b) Map of erosion and deposition in the backwater zone.
3.3.3. Scenario 3: Results
The application of proposed sedimentation pits (profile 1 and profile 2) at the confluence and downstream of the Colonnade (Glass) Bridge modifies the spatial pattern of sediment deposition, with less pronounced sediment accumulation in the critical sections of the backwater zone (Figure 13). Erosion downstream of the Colonnade (Glass) and Road Bridges is also reduced. This suggests that proposed sedimentation pits may provide a targeted alternative to the more extensive dredging considered in Scenario 2.
Figure 13.
Scenario 3. (a) Velocity map of the backwater zone showing the exact locations and cross-sectional geometries of the two proposed sedimentation pits (Profile 1 downstream of the Road Bridge and Profile 2 at the confluence). (b) Map of erosion and deposition in the backwater zone with proposed sedimentation pits.
3.3.4. Scenario 4: Results
Groins installed along the left bank upstream of the Colonnade (Glass) Bridge redirected the main current toward the confluence with the derivation canal. This intervention mitigated erosion downstream of the Colonnade (Glass) and Road Bridges and slowed gravel bar formation at the confluence (Figure 14). Nevertheless, these morphological effects are limited to the short- to medium-term timeframe, and material continues to accumulate between the groins, complicating large-scale gravel removal by dredging.
Figure 14.
Scenario 4. (a) Velocity map of the backwater zone with red circles highlighting the locations of the two groups of proposed bank groins (upstream of the Colonnade (Glass) Bridge on the left bank and downstream of the Road Bridge on the right bank). (b) Map of erosion and deposition in the backwater zone with groins.
3.3.5. Scenario 5: Results
Flood events in the Sĺňava Reservoir exhibit a strongly erosive character. During a Q100 flood, the gravel bar at the confluence is markedly reduced, while scour downstream of the Road and Colonnade (Glass) Bridges substantially exceeds the erosion observed under Scenarios 1–4. High-flow conditions, therefore, reshape the morphology of the entire reservoir (Figure 15).
Figure 15.
Scenario 5. (a) Velocity map of the backwater zone, area of whole reservoir. (b) Map of erosion and deposition in the backwater zone, area of the whole reservoir.
4. Discussion
The numerical modeling results provide critical insights into the morphodynamic behavior of the Sĺňava Reservoir, emphasizing the spatial heterogeneity of erosion and deposition processes within shallow lowland reservoirs. The primary zone of sediment accumulation was consistently identified in the upstream backwater reach—specifically within the constricted “neck” section between the Colonnade (Glass) Bridge and the Road Bridge at the confluence of the Váh River and the Horná Streda derivation canal. This depositional pattern aligns with classic reservoir delta formation theory, where the transition from riverine to lacustrine flow conditions causes a sharp drop in flow velocity and hydraulic conveyance capacity, forcing coarse bedload particles to settle immediately. Similar delta formation dynamics in backwater zones of lowland run-of-river reservoirs have been widely documented in global literature [8,10,17].
A key finding of the multi-decadal hydrological evaluation (1997–2021) is the significant decline in the frequency of natural flushing flows. While mean daily discharges exceeding the sediment motion threshold () occurred on 74 days over the 25 years, only 10 such days were recorded in the last decade. This hydrological shift reflects regional climate-driven discharge reductions documented across Central Europe [22,35,36]. Consequently, natural self-flushing of the Sĺňava Reservoir delta has become increasingly rare, exacerbating progressive storage loss and forcing reservoir managers to transition from passive reliance on natural scour to active, engineered morphodynamic control.
Scenario-specific comparative evaluations (Table 3) reveal distinct operational trade-offs among the tested management strategies:
Table 3.
Comparison of sediment-management scenarios evaluated for the Sĺňava Reservoir.
- Baseline Evolution (Scenario 1—S1.): Unmitigated sediment transport leads to continuous aggradation of the gravel bar at the confluence, extending progressively downstream toward the Colonnade (Glass) Bridge. This ongoing aggradation threatens long-term hydraulic conveyance during flood events, mirroring findings from similar impounded river reaches [33,38].
- Maintenance Dredging (Scenario 2—S2.): Targeted dredging effectively restores profile flow areas and reduces immediate sedimentation intensity. However, as highlighted in broader sediment management frameworks [4,39], dredging represents a recurring, capital-intensive intervention. Furthermore, its long-term viability is constrained by the availability of suitable disposal sites and potential ecological disruption.
- Sedimentation Pits (Scenario 3—S3.): The implementation of proposed engineered sedimentation pits (Profile 1 and Profile 2) proved to be the most efficient strategy. By altering local hydraulic gradients and creating designated trapping zones, pits concentrate coarse sediment deposition within predictable boundaries. This targeted accumulation facilitates mechanical removal during maintenance, minimizing required dredging volumes and substantially reducing downstream bed scour near bridge piers. Similar localized sediment trapping techniques and long-term capacity preservation models have been successfully investigated and implemented worldwide in other reservoir systems (e.g., refs. [15,40]).
- Bank Groins (Scenario 4—S4.): Groins successfully redirected the main flow thread toward the derivation canal confluence, slowing gravel bar expansion and protecting vulnerable banks. This behavior is consistent with experimental flume studies on groin field hydraulics [41,42]. Nevertheless, sediment accumulation within the sheltered groin fields complicates future mechanical dredging operations. Therefore, groins should be regarded as localized structural protection for critical infrastructure (such as bridge piers) rather than a primary tool for overall reservoir capacity maintenance.
- Extreme Flood Event (Q100, Scenario 5—S5.): High-magnitude flood flows (2100 m3 · s−1) exert substantial shear stress across the entire reservoir bed, causing widespread morphological reshaping [43]. While these extreme flows flush portions of the upstream gravel bar, they simultaneously induce severe localized bed erosion downstream of the Colonnade (Glass) and Road Bridges. This underscores the critical need for continuous bathymetric monitoring around bridge pier foundations to prevent structural destabilization during major floods.
Several model limitations and sources of uncertainty must be acknowledged when interpreting the simulated morphodynamic patterns. First, the 2D numerical model relies on constant boundary conditions and discrete flood discharges rather than continuous long-term hydrographs, which may smooth out short-term transient erosion-deposition fluctuations. Second, while the spatial grain size distribution was defined based on field sampling data, natural bed armor layer degradation and non-uniform sediment transport under extreme flood events introduce inherent uncertainties in local bed shear stress calculations. Furthermore, secondary 3D flow structures near complex hydraulic geometries—such as bridge piers and weir bays—are simplified within the depth-averaged 2D shallow water equations. Despite these conceptual simplifications, the analytical and numerical findings consistently align with historical bathymetric survey trends, confirming that the model effectively captures the dominant decadal sediment transport dynamics and delta formation mechanisms in the backwater zone.
As summarized in Table 3, the tested management scenarios were evaluated across four core performance indicators: sediment control, maintenance efficiency, bridge protection, and long-term sustainability. Among the individual structural options, engineered sedimentation pits (Scenario 3) received the highest performance rating. Ultimately, an integrated strategy combining targeted sedimentation pits with periodic maintenance dredging provides the most effective framework for balancing operational sustainability with infrastructure safety. From a practical management perspective, the evaluated structural measures present distinct operational and qualitative maintenance trade-offs. While baseline evolution (Scenario 1) requires no immediate intervention, it leads to continuous loss of operational capacity. Conventional dredging (Scenario 2) provides immediate capacity restoration but requires ongoing operational expenditure. Excavating proposed sedimentation pits (Scenario 3) offers a cost-effective, targeted solution by trapping coarse material in designated zones for efficient mechanical removal. Bank groins (Scenario 4) require higher initial structural construction but offer long-term hydraulic stabilization. Quantitative financial cost analysis was outside the scope of this study; however, these qualitative operational trade-offs support the selection of an integrated management strategy.
5. Conclusions
This study investigated sediment transport dynamics and potential sediment management strategies in the shallow lowland Sĺňava Reservoir on the Váh River, combining field measurements, hydrological analysis, empirical transport thresholds, and 2D morphodynamical modeling using HEC-RAS 2D. The main findings and recommendations are summarized as follows:
- Critical sedimentation zones: Sediment accumulation is concentrated in the upstream backwater reach at the confluence of the derivation canal and the former Váh riverbed, between the Colonnade (Glass) and Road Bridges. Flow deceleration in this transition zone promotes the deposition of coarse bed material.
- Sediment management: Periodic dredging provides temporary relief but requires repeated sediment removal and appropriate disposal or reuse. Scenario 3, involving proposed sedimentation pits, represents a promising alternative by concentrating coarse sediment deposition in designated areas and facilitating targeted removal during maintenance.
- Structural measures: Groins (Scenario 4) improve flow conveyance and provide localized bank protection. However, they should primarily be considered for protecting specific infrastructure rather than as a standalone measure for maintaining reservoir capacity.
- Hydrological trends and infrastructure safety: The hydrological analysis for 1997–2021 revealed a lower frequency of discharges exceeding the estimated sediment-motion threshold in the last decade, suggesting fewer opportunities for natural sediment mobilization. The Scenario 5 simulation also indicated localized bed erosion near the bridges under high-flow conditions, highlighting the importance of bathymetric monitoring to assess potential changes in bed levels around bridge piers.
In summary, sustainable sediment management in the Sĺňava Reservoir requires a proactive approach combining targeted sediment removal, consideration of proposed sedimentation pits, and monitoring of critical infrastructure. Future research should investigate local scour around bridge piers using 3D numerical modeling and assess opportunities for the beneficial reuse of dredged sediment.
Author Contributions
Conceptualization, L.Č., A.Š. and D.B.; methodology, L.Č. and A.Š.; software M.O., formal analysis, L.Č. and D.B.; investigation, L.Č., M.O., P.Š. and D.P.; writing—original draft preparation, L.Č.; writing—review and editing, D.B., A.Š. and D.P.; visualization, L.Č.; supervision, L.Č. and A.Š. All authors have read and agreed to the published version of the manuscript.
Funding
This research received no external funding.
Data Availability Statement
The complete modeling, bathymetric, and operational dataset is not publicly available due to site-specific data management considerations and third-party data ownership by the river basin authority (Slovak Water Management Enterprise). Selected processed datasets supporting the findings of this study can be made available from the corresponding author upon reasonable request.
Acknowledgments
This contribution was developed within the framework and based on the financial support of the Slovak Research and Development Agency, grant numbers APVV-19-0383 and APVV-20-0023, and by the Scientific Grant Agency of the Ministry of Education, Research and Youth of the Slovak Republic (VEGA), grant number 1/0699/25.
Conflicts of Interest
The authors declare no conflicts of interest.
References
- Duchan, D.; Dráb, A.; Říha, J. Flood Protection in the Czech Republic. In Management of Water Quality and Quantity; Springer Water; Springer: Cham, Switzerland, 2020; pp. 333–363. [Google Scholar] [CrossRef] [Scilit]
- Annandale, G.W. Quenching the Thirst: Sustainable Water Supply and Climate Change; CreateSpace Independent Publishing Platform: North Charleston, SC, USA, 2013. [Google Scholar]
- Wisser, D.; Frolking, S.; Hagen, S.; Bierkens, M.F.P. Beyond Peak Reservoir Storage? A Global Estimate of Declining Water Storage Capacity in Large Reservoirs. Water Resour. Res. 2013, 49, 5732–5739. [Google Scholar] [CrossRef] [Scilit]
- Morris, G.L.; Fan, J. Reservoir Sedimentation Handbook: Design and Management of Dams, Reservoirs, and Watersheds for Sustainable Use; McGraw Hill Professional: New York, NY, USA, 1998. [Google Scholar]
- Brandt, S.A. Classification of Geomorphological Effects Downstream of Dams. Catena 2000, 40, 375–401. [Google Scholar] [CrossRef] [Scilit]
- Mahmood, K. Reservoir Sedimentation: Impact, Extent, and Mitigation; World Bank Technical Paper; No. WTP 71; World Bank Group: Washington, DC, USA, 1987; Available online: https://documents1.worldbank.org/curated/en/888541468762328736/pdf/IBArchive-d5104c74-8b15-44ce-b645-09d5e1c13108.pdf (accessed on 14 September 2026).
- Basson, G. Reservoir Sedimentation: An Overview of Global Sedimentation Rates and Predicted Sediment Deposition. In Proceedings of the International CHR Workshop: Expert Consultation on Erosion, Transport and Deposition of Sediments, Berne, Switzerland, 28–30 April 2008; pp. 74–79. [Google Scholar]
- Schleiss, A.J.; Franca, M.J.; Juez, C.; De Cesare, G. Reservoir Sedimentation. J. Hydraul. Res. 2016, 54, 595–614. [Google Scholar] [CrossRef] [Scilit]
- Alam, S. The Influence and Management of Sediment at Hydro Projects. Int. J. Hydropower Dams 1999, 6, 54–57. [Google Scholar]
- Fan, J.; Morris, G.L. Reservoir Sedimentation. I: Delta and Density Current Deposits. J. Hydraul. Eng. 1992, 118, 354–369. [Google Scholar] [CrossRef] [Scilit]
- ICOLD Committee on Reservoir Sedimentation. Sedimentation and Sustainable Use of Reservoirs and River Systems: Draft ICOLD Bulletin; International Commission on Large Dams (ICOLD): Paris, France, 2009; Available online: https://www.icold-cigb.org/userfiles/files/CIRCULAR/CL1793Annex.pdf (accessed on 11 December 2025).
- Buček, D.; Orfánus, M.; Dušička, P.; Šulek, P. The Impact of Hydropeaking on Sediment Transport. Pollack Period. 2021, 16, 120–125. [Google Scholar] [CrossRef] [Scilit]
- Faghihirad, S.; Lin, B.; Falconer, R.A. Application of a 3D Layer Integrated Numerical Model of Flow and Sediment Transport Processes to a Reservoir. Water 2015, 7, 5239–5257. [Google Scholar] [CrossRef] [Scilit]
- De Cesare, G.; Schleiss, A.; Hermann, F. Impact of Turbidity Currents on Reservoir Sedimentation. J. Hydraul. Eng. 2001, 127, 6–16. [Google Scholar] [CrossRef] [Scilit]
- Kantoush, S.A.; Sumi, T. River Morphology and Sediment Management Strategies for Sustainable Reservoir in Japan and European Alps. Annu. Disaster Prev. Res. Inst. 2010, 53B, 821–839. Available online: https://www.dpri.kyoto-u.ac.jp/nenpo/no53/ronbunB/a53b0p83.pdf (accessed on 2 September 2026).
- Chamoun, S.; Zordan, J.; De Cesare, G.; Franca, M.J. Measurement of the Deposition of Fine Sediments in a Channel Bed. Flow Meas. Instrum. 2016, 50, 49–56. [Google Scholar] [CrossRef] [Scilit]
- Ahn, J.; Song, C.G.; Park, S.W. Integrated Prediction Model for Upstream Reservoir Sedimentation in a Weir: A Comprehensive Analysis Using Numerical and Experimental Approaches. Water 2024, 16, 574. [Google Scholar] [CrossRef] [Scilit]
- Duchan, D.; Julínek, T. Modelling of Open Channel Flow with FLOW-3D. In Proceedings of the 14th International Symposium Water Management and Hydraulic Engineering (WMHE 2015), Brno, Czech Republic, 8–10 September 2015; pp. 87–94. [Google Scholar]
- Bilal, R.A.; Beebo, Q. Simulating Bathymetric Changes in Reservoirs Due to Sedimentation: Application to Sakuma Dam, Japan. Master’s Thesis, Lund University, Lund, Sweden, 2012. Available online: https://www.researchgate.net/publication/235631455_Simulating_bathymetric_changes_in_reservoirs_due_to_sedimentation (accessed on 14 September 2026).
- Slovak Water Management Enterprise (SVP). Operational Manual of the Drahovce-Madunice Water Structure [In Slovak: Manipulačný Poriadok pre Vodnú Stavbu Drahovce-Madunice]; Piešťany Branch Office, Middle Váh River Basin Administration II: Piešťany, Slovakia, 2020. [Google Scholar]
- Šoltész, A.; Orfánus, M.; Čubanová, L.; Buček, D. Analysis and Prognosis of Sedimentation Processes in the Sĺňava Reservoir and Proposed Measures for Sediment Removal by Dredging [In Slovak: Analýza a Prognóza Vývoja Zanášania VN Sĺňava a Návrh Opatrení na Odstránenie Sedimentov Bagrovaním]; Technical Report; Department of Hydraulic Engineering, Faculty of Civil Engineering, Slovak University of Technology in Bratislava: Bratislava, Slovakia, 2022. [Google Scholar]
- Annandale, G.W.; Morris, G.L.; Karki, P. Climate Change, Sediment Management, and Sustainable Development. In Extending the Life of Reservoirs: Sustainable Sediment Management for Dams and Run-of-River Hydropower; World Bank Group: Washington, DC, USA, 2016; pp. 7–22. [Google Scholar] [CrossRef] [Scilit]
- Slovak Water Management Enterprise (SVP, š. p.). Photo of the Sĺňava Reservoir and Drahovce Weir. Available online: https://www.pic-piestany.sk/oznamy/detail-oznamu/uzavretie-hate-drahovce-7191/?tx_ttnews%5Bpointer%5D=2 (accessed on 11 December 2025).
- Sĺňava Piešťany Facebook. Sĺňava Reservoir Photo. Available online: https://www.facebook.com/photo?fbid=1218482164891691 (accessed on 14 September 2026).
- Fošumpaur, P.; Králík, M.; Zukal, M. Physical and Numerical Modelling in the Research of Hydraulic Structures. In Proceedings of the International Conference on Modelling and Simulation, Prague, Czech Republic, 22–25 June 2010. [Google Scholar]
- Randle, T.J.; Yang, C.T.; Daraio, J. Erosion and Reservoir Sedimentation. In Erosion and Sedimentation Manual; U.S. Department of the Interior, Bureau of Reclamation, Technical Service Center, Sedimentation and River Hydraulics Group: Denver, CO, USA, 2006; Available online: http://www.riversimulator.org/Resources/USBR/ErosionSedimentManual.pdf (accessed on 14 September 2026).
- Estigoni, M.S.; Sanchez, N.P.R.; de Miranda, R.B.; Kuwajima, J.I.; Mauad, F.F. Comparison of Methods to Assess Reservoir Volume and Sedimentation Based on Bathymetric Surveys. In Proceedings of the 3rd IAHR Europe Congress, Porto, Portugal, 14–16 April 2014; Paper 10753. Available online: https://www.iahr.org/library/infor?pid=10753 (accessed on 14 September 2026).
- Sočuvka, V.; Velísková, Y. Evaluation of Reservoir Degradation State by Autonomous Underwater Vehicle (AUV). In Proceedings of the 14th International Symposium in the Field of Water Management and Hydraulic Engineering 2015; Litera: Brno, Czech Republic, 2015; pp. 191–198. Available online: https://vst.fce.vutbr.cz/wp-content/uploads/2017/04/WMHE_2015_text.pdf (accessed on 14 September 2026).
- Raplík, M.; Macura, V. Granulometric Analysis of Gravel–Sand Riverbeds Using a Photographic Method [In Slovak: Analýza granulometrie štrkopieskových korýt fotografickou metódou]. In Proceedings of the Professional Seminar: Surface Water Flow and Its Effects on the Environment, Tatranská Štrba, Slovakia, 1983; Meander: Prague, Czech Republic, 1983; pp. 31–38. [Google Scholar]
- Ferreira, T.; Rasband, W. ImageJ User Guide: Adjustable Watershed. Documentation. 2012. Available online: https://imagej.net/ij/docs/guide/ (accessed on 14 September 2026).
- Kališ, J. Bed Roughness in Relation to Bedload Transport [In Slovak: Stupeň drsnosti pri pohybe splavenín]. In Proceedings of the Professional Seminar: Surface Water Flow and Its Effects on the Environment, Tatranská Štrba, Slovakia, 1983; Meander: Prague, Czech Republic, 1983; pp. 27–30. [Google Scholar]
- Bačík, M. Mathematical Modeling of Erosion-Sedimentation Processes in Watercourses: Methodology of the Stage [In Slovak: Matematické Modelovanie Erózno-Sedimentačných Procesov vo Vodných Tokoch: Metodika Etapy]; Water Research Institute: Bratislava, Slovakia, 1996. [Google Scholar]
- Brunner, G.W. HEC-RAS River Analysis System: Hydraulic Reference Manual; U.S. Army Corps of Engineers, Institute for Water Resources, Hydrologic Engineering Center: Davis, CA, USA, 2020. [Google Scholar]
- Honek, D.; Michalková, M.Š.; Smetanová, A.; Sočuvka, V.; Velísková, Y.; Karásek, P.; Konečná, J.; Németová, Z.; Danáčová, M. Estimating Sedimentation Rates in Small Reservoirs: Suitable Approaches for Local Municipalities in Central Europe. J. Environ. Manag. 2020, 261, 109958. [Google Scholar] [CrossRef] [Scilit]
- Almikaeel, W.; Čubanová, L.; Šoltész, A. Hydrological Drought Forecasting Using Machine Learning: Gidra River Case Study. Water 2022, 14, 387. [Google Scholar] [CrossRef] [Scilit]
- Pavelková, D.; Kandra, B.; Tall, A.; Hlavatá, H.; Gomboš, M. Comparison of Meteorological Drought over Two Normal Periods. Acta Hydrol. Slovaca 2023, 24, 221–231. [Google Scholar] [CrossRef] [Scilit]
- Annandale, G.W. Reservoir Sedimentation; Elsevier: Amsterdam, The Netherlands, 1987. [Google Scholar]
- Graf, W.L. Downstream Hydrologic and Geomorphic Effects of Large Dams on American Rivers. Geomorphology 2006, 79, 336–360. [Google Scholar] [CrossRef] [Scilit]
- Kondolf, G.M.; Gao, Y.; Annandale, G.W.; Morris, G.L.; Jiang, E.; Zhang, J.; Cao, Y.; Carling, P.; Fu, K.; Guo, Q.; et al. Sustainable Sediment Management in Reservoirs and Regulated Rivers: Experiences from Five Continents. Earth’s Future 2014, 2, 256–280. [Google Scholar] [CrossRef] [Scilit]
- Molino, B.; De Vincenzo, A.; Minó, A.; Ambrosone, L. Long-Term Water Management Model for Preserving Sustainable Useful Capacity of Reservoirs. Water Resour. Manag. 2023, 37, 1879–1894. [Google Scholar] [CrossRef] [Scilit]
- Uijttewaal, W.S.J. Effects of Groyne Layout on the Flow in Groyne Fields: Laboratory Experiments. J. Hydraul. Eng. 2005, 131, 782–791. [Google Scholar] [CrossRef] [Scilit]
- Yossef, M.F.M.; de Vriend, H.J. Sediment Exchange between a River and Its Groyne Fields: Mobile-Bed Experiment. J. Hydraul. Eng. 2010, 136, 754–767. [Google Scholar] [CrossRef] [Scilit]
- Abdul Razad, A.Z.; Abbas, N.A.; Mohd Sidek, L.; Alexander, J.L.; Jung, K. Sediment Management Strategies for Hydropower Reservoirs in Active Agricultural Area. Int. J. Eng. Technol. 2018, 7, 228–233. [Google Scholar] [CrossRef] [Scilit]

Disclaimer/Publisher’s Note: The statements, opinions and data contained in all publications are solely those of the individual author(s) and contributor(s) and not of MDPI and/or the editor(s). MDPI and/or the editor(s) disclaim responsibility for any injury to people or property resulting from any ideas, methods, instructions or products referred to in the content. |
© 2026 by the authors. Licensee MDPI, Basel, Switzerland. This article is an open access article distributed under the terms and conditions of the Creative Commons Attribution (CC BY) license.