


Abstract
Silver-recovery photographic wastewater (SR-PW) constitutes a challenging wastewater stream owing to its high chemical oxygen demand (COD), acidic pH, and the presence of oxidizable, inhibitory, and toxic compounds. This study evaluated the feasibility of its anaerobic pretreatment with skimmed milk powder (SMP) supplementation. SMP was added to improve the unfavorable C/N balance, replenish nutrient deficiencies, and supply readily assimilable nutrients to support the activity of anaerobic microorganisms. Raw SR-PW was characterized by a pH of 5.09 ± 0.32, total organic carbon (TOC) of 7638 ± 824 mg C/L, COD of 60,540 ± 10,086 mg O2/L, an imbalanced COD/TOC ratio of 7.9 ± 1.6, and an unfavorable C/N ratio of 385 ± 197. During the laboratory stage (S1), SMP supplementation improved TOC removal, CH4 production, and the development of methanogenic biomass. The most favorable results were obtained at doses of 7–8 g SMP/L SR-PW, with TOC removal of 66.9 ± 3.2–68.4 ± 3.0%, COD removal of 42.2 ± 3.6–43.5 ± 3.5%, and CH4 yields of 87.0 ± 5.4–91.9 ± 7.2 mL CH4/g TOC. The CH4 content in biogas increased from 7.5 ± 0.6% in the control variant to 18.5 ± 0.9–18.9 ± 0.8% in V5–V6. Stage 2 (S2) used a flow-through reactor whose design increased biomass retention and improved process performance. Variant V6 achieved TOC and COD removal of 82.7 ± 1.5% and 52.7 ± 1.7%, respectively, with a CH4 yield of 115.5 ± 6.2 mL CH4/g TOC. The CH4 content in biogas increased to 20.4 ± 0.8%, and the biofilm and granular sludge favored higher proportions of Archaea and Methanosarcinaceae in the anaerobic microbial biomass. The results showed that anaerobic digestion can be considered only a pretreatment technology for SR-PW, rather than a method for complete treatment with energy recovery.
1. Introduction
Wastewater generated during the processing of photographic, radiographic, and printing materials is a distinct industrial wastewater stream whose composition differs substantially from that of typical municipal wastewater and most organic effluents from the agri-food industry [1]. Despite the ongoing digitization of imaging techniques, spent developing, fixing, and rinsing solutions continue to be generated by photographic laboratories, reprographic and printing facilities, diagnostic imaging units, dental practices, research laboratories, and facilities recovering silver from spent films, photosensitive papers, and processing reagents [2].
The need for controlled management of these effluents arises from both their specific chemical composition and the applicable regulatory requirements for industrial wastewater and hazardous waste [3]. Under the current European legal framework for wastewater management, discharges of non-domestic wastewater into sewerage systems and urban wastewater treatment plants should be subject to prior regulation or specific authorization, particularly where their composition may disrupt biological treatment, damage sewerage infrastructure, endanger workers, impair receiving-water quality, or restrict resource recovery from wastewater and sludge [4]. The European List of Waste also identifies photographic industry wastes as a separate category, including aqueous liquid waste from on-site silver recovery, classified as hazardous waste under code 09 01 13* [3]. A similar approach applies internationally: the Basel Convention identifies photographic waste containing silver halides and metallic silver as a specific waste stream requiring controlled management [5].
Conventional processing of photosensitive materials relies on the photochemical transformation of silver halides. During development, exposed AgX crystals are reduced to metallic silver, whereas during fixing, unreduced silver halides are removed from the photographic emulsion through complexation [6]. Sodium thiosulfate, which forms soluble silver complexes, is the most commonly used fixing agent. Consequently, spent photographic solutions may contain organic constituents, including reducing and developing agents such as hydroquinone, metol, pyrogallol, glycine, and other phenolic derivatives, as well as inorganic constituents, including thiosulfates, sulfites, bromides, borates, carbonates, silver complexes, and, depending on the technology used, iron complexes or cyanides [7].
From a treatment perspective, photographic wastewater should not be regarded as a typical readily biodegradable effluent. Its high chemical oxygen demand (COD) may reflect not only organic compounds but also reduced inorganic compounds, particularly thiosulfates and sulfites. Thus, COD may describe the total load of oxidizable substances without being proportional to the actual load of biodegradable organic carbon [8]. This distinction is important for the design and interpretation of biological reactor operation, because a loading rate expressed solely as COD may overestimate the available organic substrate and misrepresent the potential for biochemical pollutant conversion. In such cases, parallel use of organic-carbon-based indicators, particularly total organic carbon (TOC), is justified, as TOC better describes the actual load of carbon compounds introduced into the biological system [9].
Phenolic compounds, metal complexes, reduced sulfur compounds, high salinity, and variable pH in photographic wastewater may limit the effectiveness of conventional biological treatment. Owing to their aromatic structures and reducing properties, compounds such as hydroquinone and pyrogallol may be toxic to microorganisms and aquatic organisms, and their biodegradation requires an appropriately acclimated microbial community [10]. Silver, although frequently present in photographic wastewater as silver–thiosulfate complexes, is also a persistent element that can become incorporated into sludge following biological and chemical transformations, including as silver sulfide or metallic silver [11]. Effective treatment of such effluents should therefore address both organic-load removal and the risks of microbial inhibition and secondary accumulation of contaminants in sludge.
Anaerobic processes may provide a viable alternative or pretreatment stage for wastewater with a high load of oxidizable substances and limited susceptibility to rapid aerobic degradation [12]. Compared with activated sludge processes, anaerobic technologies do not require intensive aeration, produce less excess sludge, and enable partial conversion of organic compounds into biogas [13]. Operation at a long sludge retention time is particularly important because it supports slow-growing microbial consortia responsible for successive stages of anaerobic digestion, including hydrolysis, acidogenesis, acetogenesis, and methanogenesis [14]. Immobilized-biomass reactors, biological filters, multistage systems, and effective sludge separators may further increase process resilience to variations in influent composition and limit the washout of active biomass [15].
Nevertheless, the use of anaerobic digestion to treat photographic wastewater remains poorly understood. Most available studies on this stream focus on silver recovery [16], chemical or electrochemical oxidation, Fenton processes, photocatalysis [17], sorption, or aerobic and hybrid systems based on sulfur-oxidizing bacteria [18]. Far fewer data are available on anaerobic systems treating real wastewater generated after silver recovery from spent photographic reagents, particularly at full scale and during long-term operation. Knowledge is also limited regarding the simultaneous assessment of TOC and COD removal, pH stability, biogas quality, and the response of anaerobic microbial communities to the specific constituents of these effluents. The research gap therefore concerns not the feasibility of biological treatment itself, but whether anaerobic digestion can provide a stable and technologically justified pretreatment stage for a real silver-recovery effluent characterized by a high load of oxidizable substances, recalcitrant compounds, and potential microbial inhibition. Distinguishing between COD and TOC is particularly important because it allows the total load of oxidizable compounds to be differentiated from the actual organic carbon load available for biological transformation.
This study evaluated the feasibility of using anaerobic digestion to pretreat wastewater generated after silver recovery from spent photographic reagents. The study assessed pollutant removal in terms of TOC and COD, process stability, biogas production and composition, and the effects of the specific wastewater composition on the activity and structure of the anaerobic microbial community. Experiments were conducted at laboratory scale and in a semi-technical-scale anaerobic reactor.
2. Materials and Methods
2.1. Experimental Design
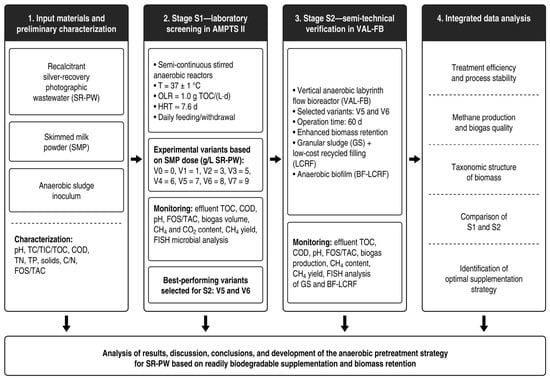
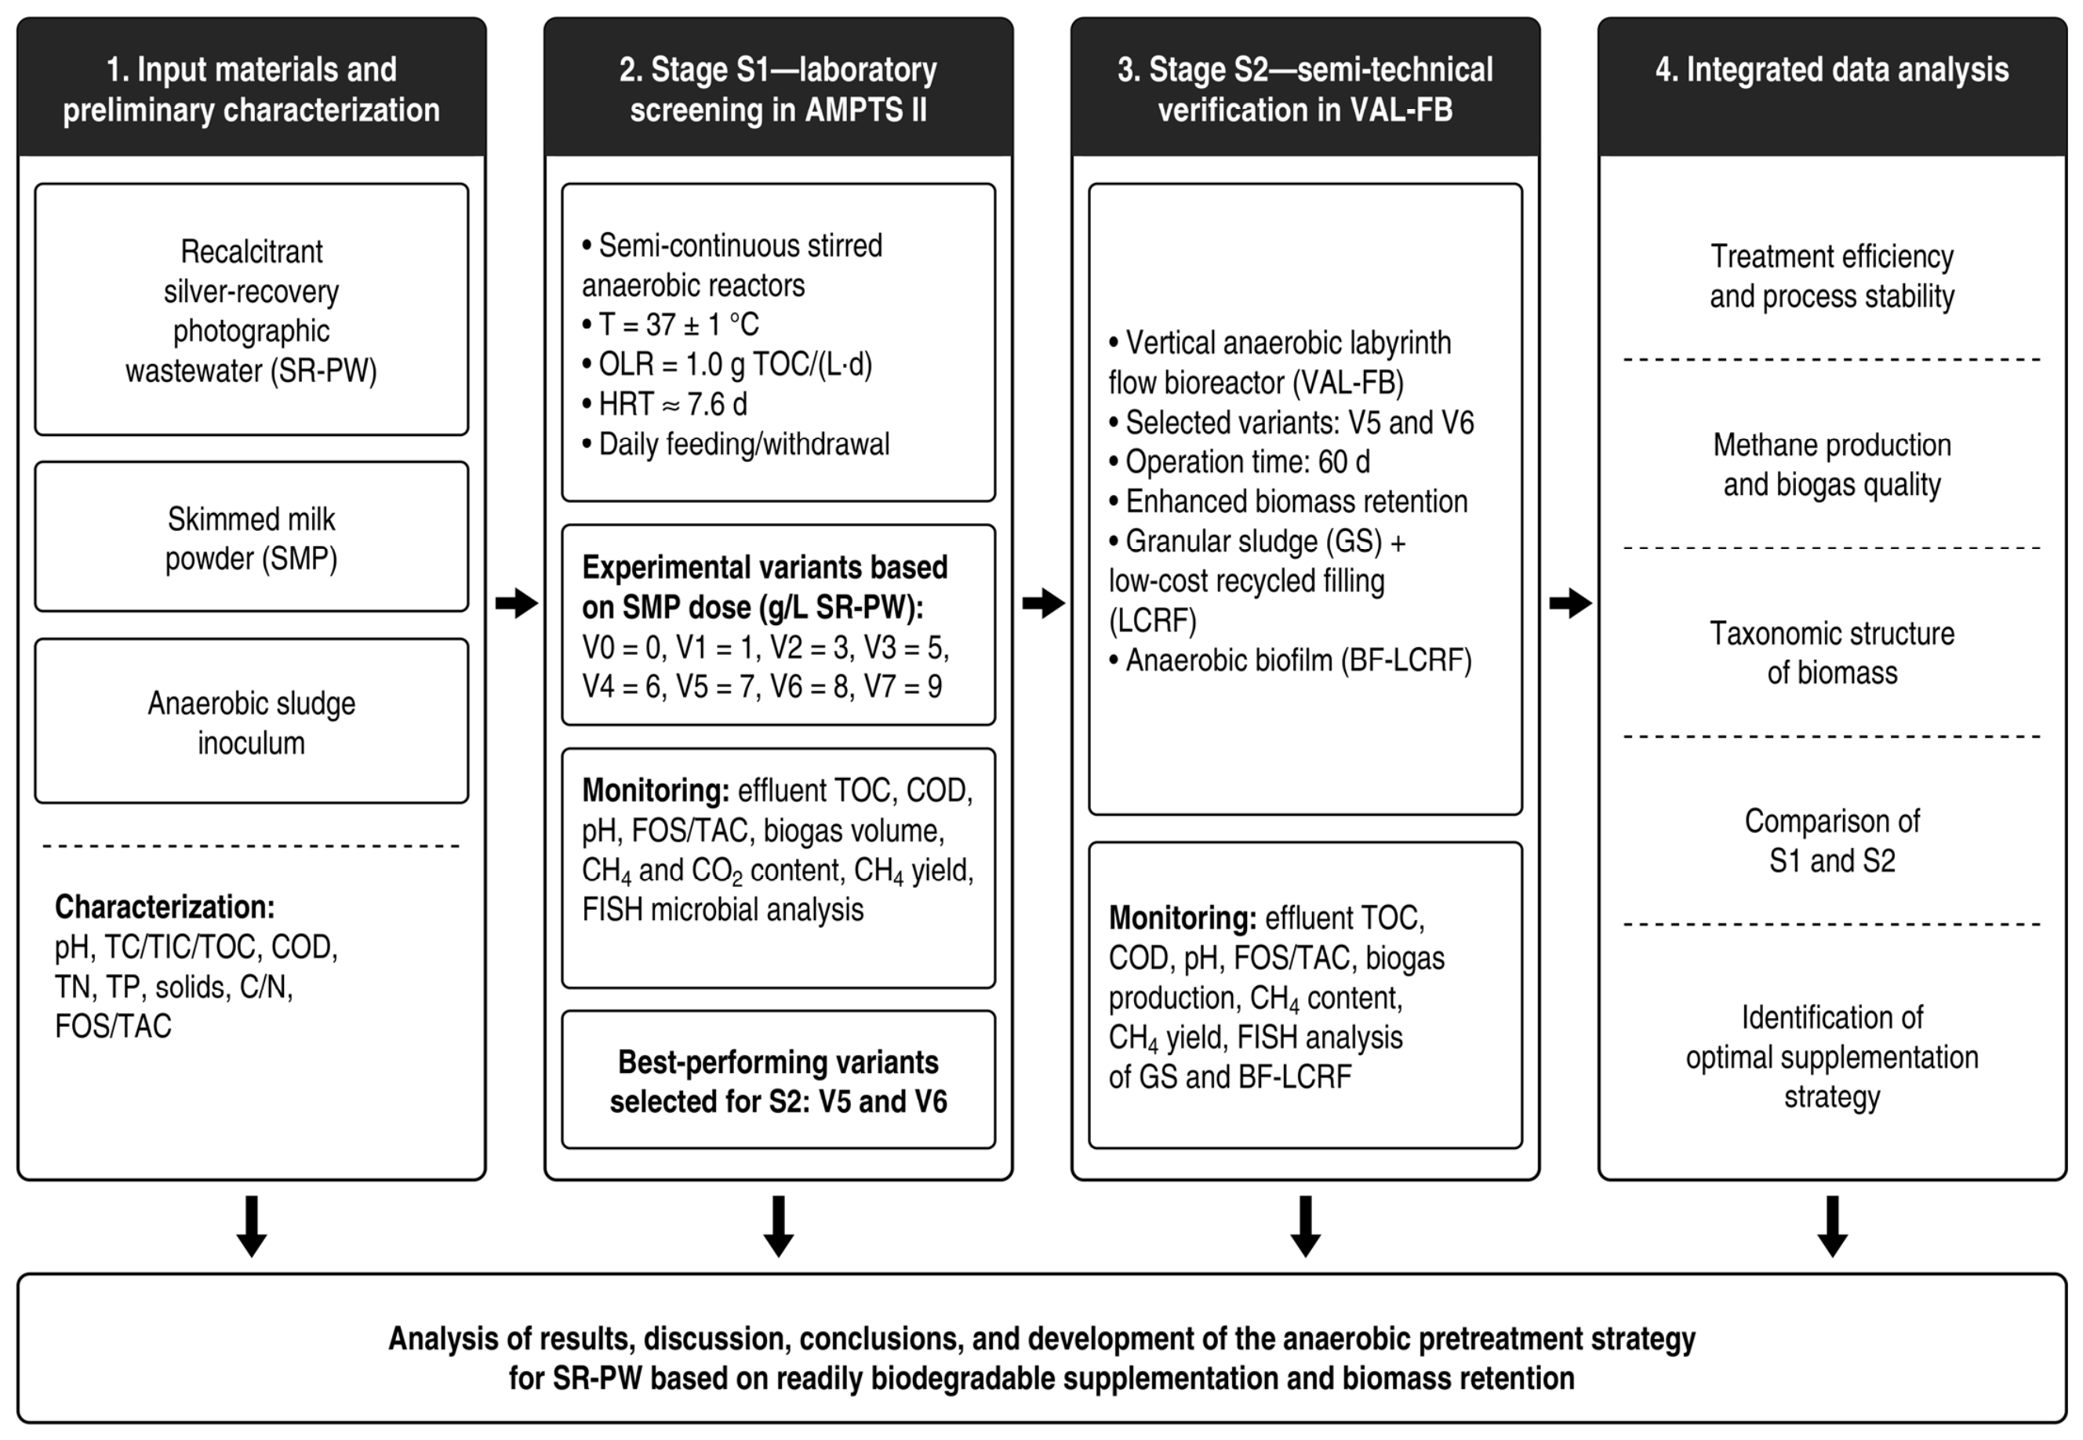
The study comprised two stages. Stage 1 (S1) consisted of laboratory-scale experiments designed to determine the optimal supplementation level of recalcitrant silver-recovery photographic wastewater (SR-PW) with a readily biodegradable nutrient supplement prepared from skimmed milk powder (SMP). SMP was intended to improve the C:N balance of SR-PW, replenish nitrogen and phosphorus deficiencies, and provide readily assimilable substrates supporting anaerobic microbial activity, thereby improving anaerobic digestion stability and wastewater treatment efficiency. S1 comprised eight experimental variants (V), differentiated by the SMP dose introduced into SR-PW at the beginning of the experimental cycle. The control variant, V0, contained SR-PW alone, without SMP. The remaining variants received the following doses (g SMP/L SR-PW): V1, 1.0; V2, 3.0; V3, 5.0; V4, 6.0; V5, 7.0; V6, 8.0; and V7, 9.0. Stage 2 (S2) tested the two variants (V5–V6) that achieved the best treatment performance in the laboratory experiments. S2 was conducted at semi-technical scale in a vertical anaerobic labyrinth flow bioreactor (VAL-FB). Figure 1 presents the experimental workflow.
Figure 1.
Experimental workflow of the study. AMPTS II, Automatic Methane Potential Test System II; OLR, organic loading rate; HRT, hydraulic retention time; TC, total carbon; TIC, total inorganic carbon; TOC, total organic carbon; COD, chemical oxygen demand; TN, total nitrogen; TP, total phosphorus; FOS/TAC, ratio of volatile organic acids to total inorganic carbon; FISH, fluorescence in situ hybridization.
2.2. Materials
2.2.1. Recalcitrant Silver-Recovery Photographic Wastewater (SR-PW)
Wastewater was obtained from a facility processing spent photographic reagents, after electrochemical silver recovery. Before use, SR-PW was homogenized and stored in sealed polyethylene containers at 4 ± 1 °C. Before daily feeding, SR-PW was brought to 20 ± 1 °C and homogenized in 500 mL laboratory beakers using a C-MAG HS 7 magnetic stirrer (IKA-Werke GmbH & Co. KG, Staufen, Germany). Mixing was performed for 10 min at 500 rpm using a 40 mm cylindrical PTFE-coated magnetic stirring bar. Table 1 presents the principal physicochemical characteristics of SR-PW.
Table 1.
Principal physicochemical characteristics of silver-recovery photographic wastewater (SR-PW).
2.2.2. Skimmed Milk Powder (SMP)
Skimmed milk powder (SMP; Mlekovita, Wysokie Mazowieckie, Poland) was used as a source of readily biodegradable organic compounds and nutrients. SMP was added to improve the C:N balance of SR-PW, replenish nutrient deficiencies, and support anaerobic microbial activity. In each experimental variant, an appropriately weighed quantity of SMP was added directly to the daily SR-PW feed. The mixture was then homogenized and introduced into the anaerobic reactors. Table 2 presents the characteristics of SMP.
Table 2.
Chemical composition and elemental characteristics of SMP.
2.2.3. Reactor Influent Characteristics (SR-PW + SMP)
Table 3 presents the composition of the actual influent supplied to the bioreactors operated in S1. The influent was prepared daily immediately before reactor feeding. An appropriate volume of SR-PW was placed in 500 mL laboratory beakers, followed by SMP at the dose specified for each experimental variant (Table 3). The mixture was homogenized for 10 min using a C-MAG HS 7 magnetic stirrer (IKA-Werke GmbH & Co. KG, Staufen, Germany) equipped with a 40 mm cylindrical PTFE-coated stirring bar. Mixing was performed at 500 rpm and room temperature (20 ± 2 °C), without additional heating. Immediately after homogenization, the prepared mixture was fed to Automatic Methane Potential Test System II reactors (AMPTS II; Bioprocess Control AB, Lund, Sweden; now BPC Instruments AB, Lund, Sweden). Before each feeding, an equivalent volume of reactor liquid was withdrawn, and 52 ± 1 mL of fresh influent was introduced. The daily feed volume was calculated using the SR-PW TOC concentration of 7.64 ± 0.8 g C/L and a target organic loading rate (OLR) of 1.0 ± 0.1 g TOC/(L·d), referring exclusively to the TOC load contributed by SR-PW.
Table 3.
Characteristics of the influent (SR-PW + SMP) supplied to AMPTS bioreactors in the S1 variants.
2.2.4. Anaerobic Sludge Inoculum
In S1, anaerobic sludge (AS) from the enclosed digesters of the municipal wastewater treatment plant in Olsztyn, Poland (Q ≈ 60,000 m3/d), was used as the inoculum. The plant uses activated sludge with enhanced nutrient removal, and sludge is stabilized by anaerobic digestion in enclosed digesters (OLR ≈ 2.4 kg VS/(m3·d), hydraulic retention time (HRT) ≈ 20 d, T = 35 ± 1 °C). After collection, the sludge was transported to the laboratory in sealed containers to limit contact with atmospheric oxygen. Before the experiments, the sludge was pre-incubated for 7 days at the operating temperature of the AMPTS bioreactors, 37 ± 1 °C, without an external substrate. This step was intended to reduce endogenous biogas production [19], stabilize anaerobic microbial activity, and equilibrate the inoculum temperature before the semi-continuous tests.
Two forms of anaerobic biomass were used in S2: granular sludge (GS) and anaerobic biofilm grown on low-cost recycled filling (BF-LCRF). Granular sludge was introduced into the central VAL-FB zone, which served as the hydrolysis and acidogenic chamber. It originated from an upflow anaerobic sludge blanket (UASB) reactor treating fruit and vegetable processing wastewater (Tymbark GMW Sp. z o.o., Olsztynek, Poland). LCRF carrying an established anaerobic biofilm was placed in the methanogenic zone. The biofilm carriers originated from pilot-scale reactors previously used to treat dairy wastewater, in which the filling had been inoculated with anaerobic sludge for 10 weeks, followed by 20 weeks of operation, allowing a stable biofilm to develop on the LCRF surface. Before the S2 experiments, the biomass was conditioned anaerobically by gradually introducing SR-PW/SMP influent to reduce the risk of substrate shock. The use of granular sludge and LCRF-supported biofilm was motivated by S1 observations of biomass flotation and washout with the effluent in completely mixed systems. Table 4 presents the characteristics of the anaerobic biomass used in the respective stages.
Table 4.
Characteristics of the anaerobic biomass used in the experiments.
2.3. Stage 1 (S1): Experiments in AMPTS II Bioreactors
This stage used an Automatic Methane Potential Test System II (AMPTS II; Bioprocess Control AB, Lund, Sweden; now BPC Instruments AB, Lund, Sweden). The system comprised a thermostatic sample incubation unit, glass digestion bioreactors, a mechanical mixing system, a CO2 absorption module, and an automated CH4 volume measurement module. The bioreactors had a total volume of 500 mL and a working volume of 400 mL; the remaining 100 mL provided the headspace. Each experimental variant was run in triplicate. The bioreactors were filled with pre-incubated anaerobic sludge and operated semi-continuously, with daily withdrawal of part of the reactor liquid and addition of an equivalent volume of fresh influent (SR-PW + SMP). The process was conducted under mesophilic conditions at 37 ± 1 °C. Reactor contents were mechanically mixed intermittently, with 5 min of mixing followed by a 15 min pause. The mixing speed during the active phase was 100 rpm. This operating mode periodically homogenized the reactor contents while limiting excessive mechanical stress on the anaerobic biomass. The reactors were fed once daily at a fixed time. Before each feeding, 52 ± 1 mL of reactor liquid was withdrawn and replaced with 52 ± 1 mL of freshly prepared SR-PW/SMP influent. The daily feed volume was calculated from the reactor working volume and the SR-PW TOC concentration. The nominal HRT, calculated as the reactor working volume divided by the daily influent volume, was 7.7 ± 0.2 d and was maintained throughout S1. The experiment lasted 31 days, corresponding to approximately four nominal HRT periods under continued daily feeding. Treatment performance was assessed using results obtained from day 8 onward, after the first nominal HRT.
Gas produced in the bioreactors was first directed to the CO2 absorption module and then to the automated AMPTS II measurement module. CO2 was absorbed in trap bottles containing 80 mL of 3 M NaOH solution (Merck KGaA, Darmstadt, Germany) with a pH indicator. After CO2 removal, the recorded gas volume corresponded to the CH4 volume. CH4 volume was recorded automatically in real time using a measurement system based on liquid displacement and buoyancy. The system software corrected and normalized the results for the measurement conditions, including temperature and pressure. CO2 absorption efficiency in the AMPTS II module exceeds 98% [20], allowing the measured gas volume to be interpreted directly as CH4 volume. To determine biogas composition, gas samples were collected upstream of the CO2 absorption module and analyzed chromatographically.
2.4. Stage 2 (S2): Semi-Technical-Scale Experiments in the VAL-FB Reactor
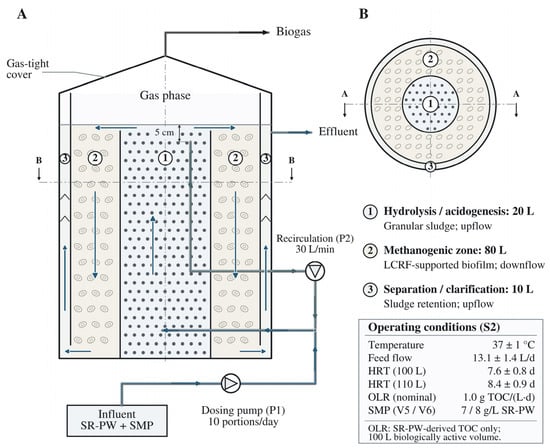
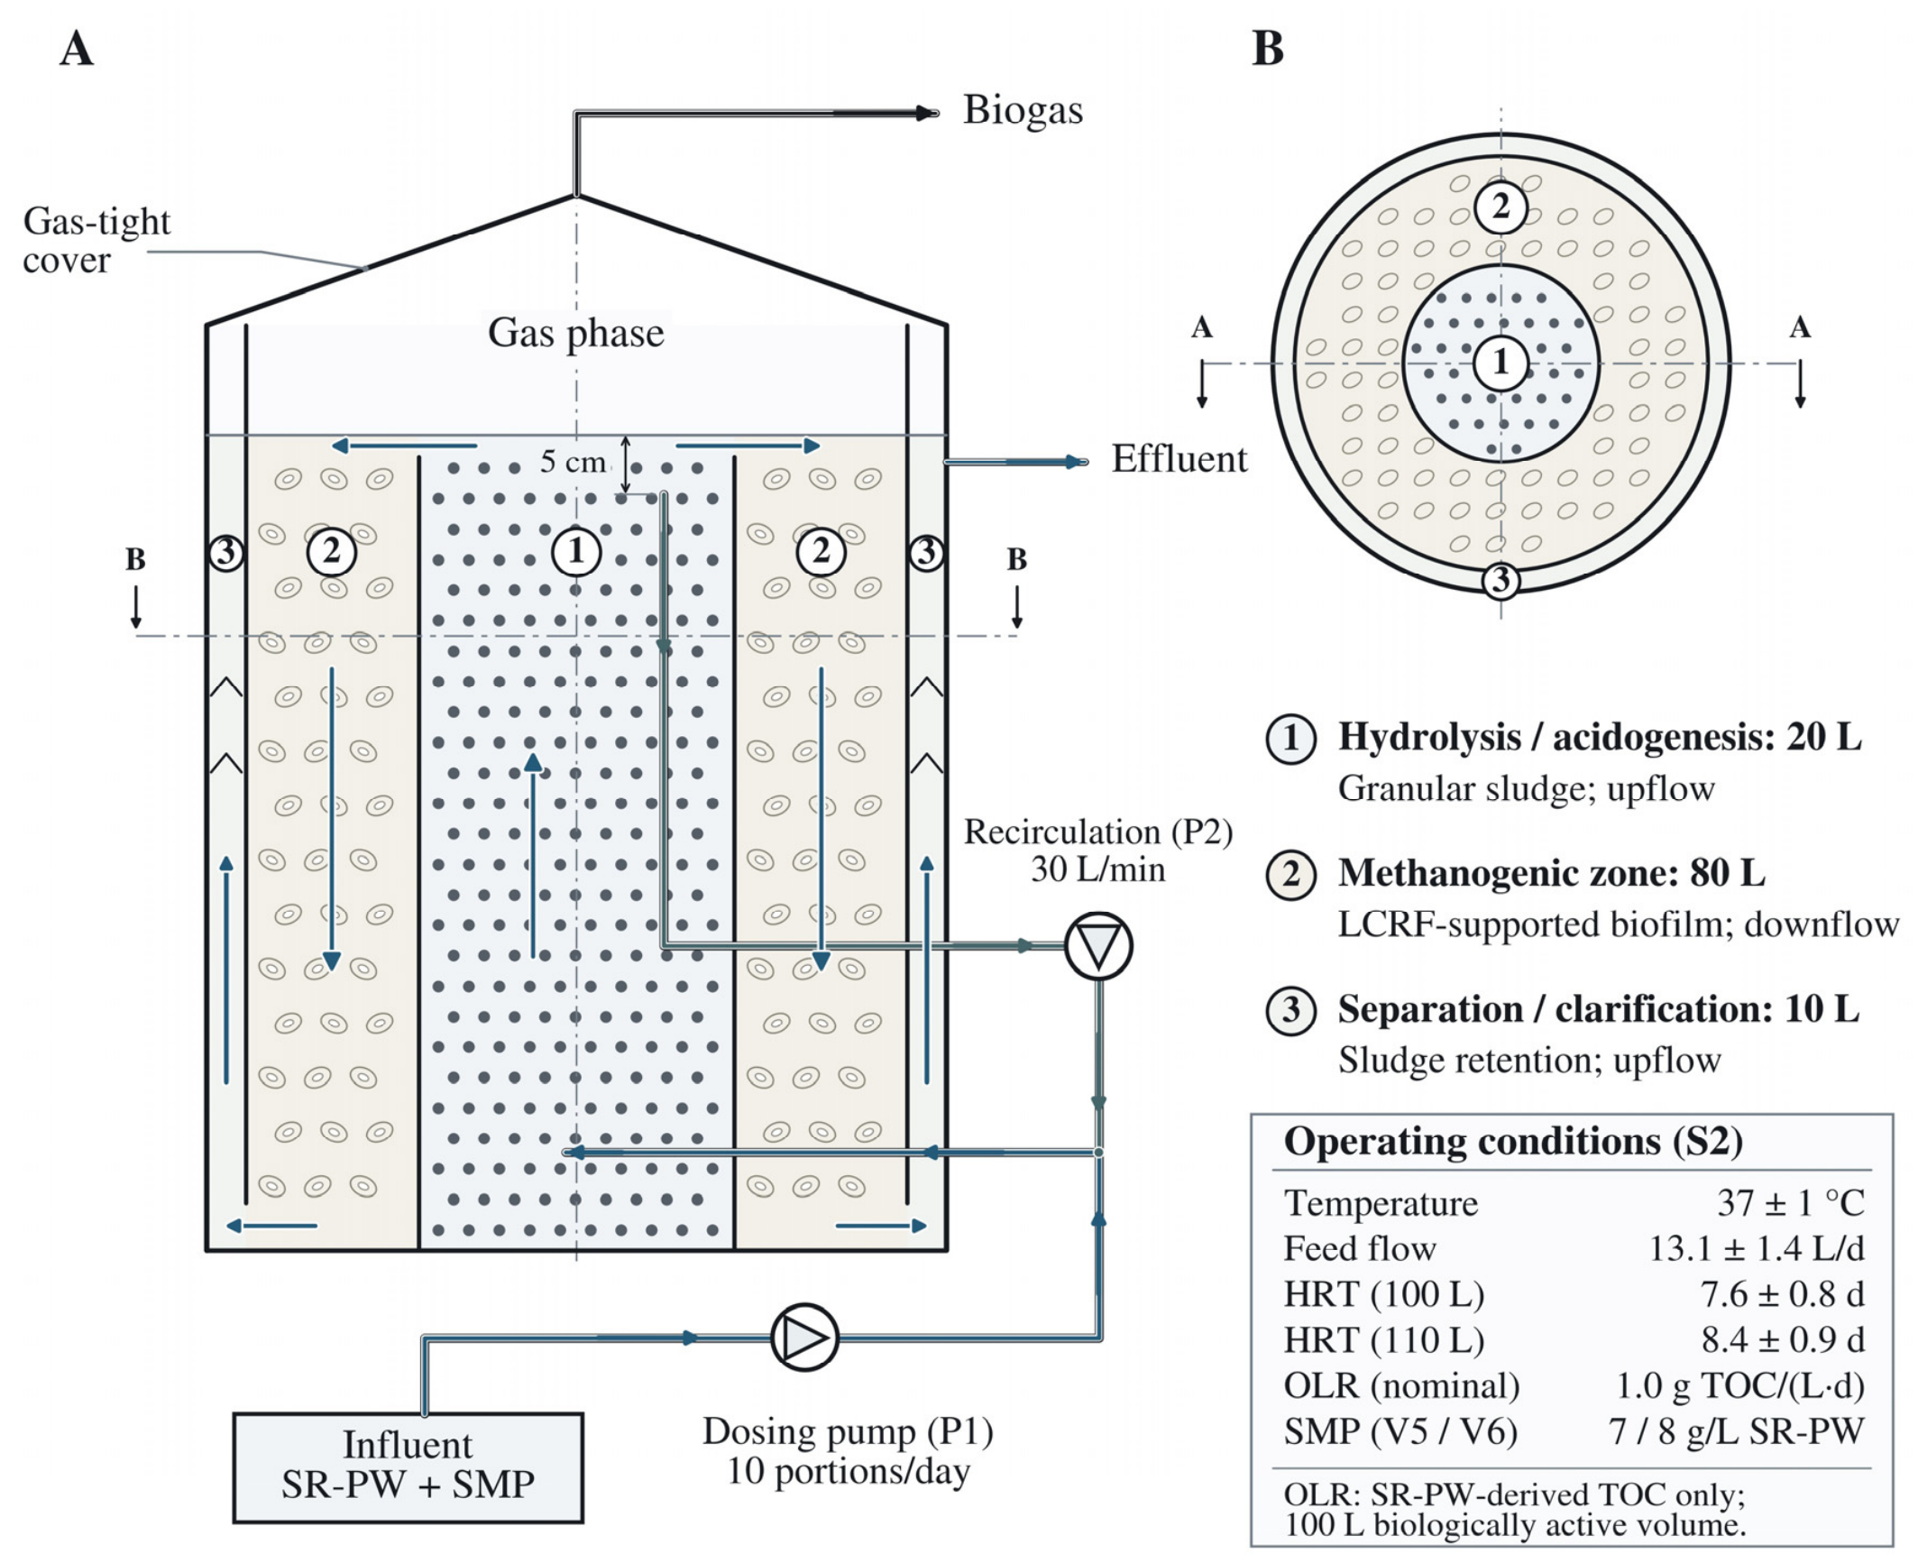
In S2, the best-performing laboratory variants (V5, 7 g SMP/L SR-PW; V6, 8 g SMP/L SR-PW) were verified using a vertical anaerobic labyrinth flow bioreactor (VAL-FB). The reactor design was based on the VAL-FB/LCRF configuration [21], a hybrid system combining granular sludge retention with an anaerobic biological filter. The VAL-FB has a total working volume of 110 L and comprises three coaxial treatment zones: a hydrolysis and acidogenic zone, a methanogenic zone, and a separation/clarification zone. Its use was motivated by S1 observations of anaerobic biomass flotation and washout with the effluent from completely mixed bioreactors. To mitigate this phenomenon, S2 used a hybrid configuration comprising granular sludge in the hydrolysis and acidogenic zone and LCRF in the methanogenic zone. This arrangement was intended to increase biomass retention, limit washout, and improve contact between SR-PW/SMP and active anaerobic microorganisms. Low-cost recycled filling (LCRF) was used in the methanogenic zone as a carrier for anaerobic biofilm development [22]. Individual LCRF elements were porous cylindrical pieces with an extensive active surface. The specific surface area was 500 m2/m3; element height was 24 mm, external diameter 18 mm, internal diameter 10 mm, and bulk density 300 kg/m3 [21]. The final section was a 10 L separation and clarification zone designed to limit sludge carryover into the effluent. The reactor was operated under mesophilic conditions at 37 ± 1 °C, maintained by a water jacket. The heating system comprised a heating-water tank, an electric heater, a circulation pump, and automatic temperature control. The reactor body was insulated with mineral wool, and biogas was discharged through an outlet in the gas-tight lid with a water seal. The VAL-FB configuration and operating conditions applied in S2 are shown in Figure 2. Table 5 presents the reactor specifications.
Figure 2.
Schematic of the vertical anaerobic labyrinth flow bioreactor (VAL-FB) used in stage S2: (A) longitudinal section; (B) transverse section. 1, hydrolysis and acidogenic zone containing granular sludge (20 L); 2, methanogenic zone containing LCRF-supported anaerobic biofilm (80 L); 3, separation and clarification zone (10 L). P1, dosing pump; P2, recirculation pump. SR-PW, silver-recovery photographic wastewater; SMP, skimmed milk powder; LCRF, low-cost recycled filling; HRT, hydraulic retention time; OLR, organic loading rate; TOC, total organic carbon.
Table 5.
Design specifications of the VAL-FB reactor used in S2.
The SR-PW/SMP influent was prepared daily. The mixture was fed to the hydrolysis and acidogenic zone in 10 portions per day. Flow rate, HRT, and loads were calculated from the TOC concentration in SR-PW. The SR-PW-derived OLR referred exclusively to the TOC load contributed by photographic wastewater and was calculated for the biologically active reactor volume (100 L), comprising the hydrolysis and acidogenic zone and the LCRF-packed methanogenic zone. The 10 L separation/clarification zone was included only when calculating the total HRT. The daily SR-PW/SMP influent volume was 13.1 ± 1.4 L/d, providing an HRT of 7.6 ± 0.8 d in the biologically active zones and 8.4 ± 0.9 d in the entire VAL-FB system.
2.5. Analytical Methods
In S1, reactor liquid samples were collected daily during routine operation of the AMPTS II bioreactors, immediately before withdrawal of the daily liquid volume and addition of fresh SR-PW/SMP influent. pH and the ratio of volatile organic acids to total inorganic carbonate (FOS/TAC) were determined immediately after sampling because these parameters were used for ongoing monitoring of process stability. TOC and COD were measured every 3 days. Samples intended for these analyses were homogenized, divided into aliquots, and stored frozen until analysis. After thawing, the samples were brought to room temperature, re-homogenized, and analyzed using the same procedure for all variants. In S2, VAL-FB influent and effluent samples were collected every 3 days and analyzed immediately, without prior freezing. Samples were collected at the same time of day, before the next reactor feeding cycle, to limit the effects of short-term hydraulic and loading fluctuations on the analytical results. Biogas composition in S2 was determined every 24 h using samples collected from the reactor gas line.
Chemical oxygen demand (COD), total nitrogen (TN), ammonium nitrogen (NH4+-N), total phosphorus (TP), and orthophosphate phosphorus (PO43−-P) were determined using cuvette tests with a DR 2800 spectrophotometer and digestion unit (Hach Lange, Düsseldorf, Germany) [23]. Total organic carbon (TOC) was determined using a TOC 1200 analyzer (Thermo Scientific, Waltham, MA, USA) [24]. pH was measured using a VWR 1000 L pH meter (VWR International, Radnor, PA, USA). The FOS/TAC ratio was determined by titration using a TitraLab/Tritlab AT 1000 automatic titrator (Hach, Düsseldorf, Germany) [25]. Total solids (TS), mineral solids (MS), and volatile solids (VS) were determined gravimetrically according to Standard Method 2540 [26]. Suspended solids were determined gravimetrically by filtering the sample through pre-weighed filters and drying to constant mass. SMP, anaerobic sludge, granular sludge, and biofilm were characterized in terms of TS, VS, MS, total carbon (TC), TOC, TN, TP, pH, and the principal organic fractions. TC, TOC, and TN were determined using a Flash 2000 elemental analyzer (Thermo Scientific, Waltham, MA, USA). TP and sugar contents were measured spectrophotometrically using the DR 2800 (Hach Lange, Düsseldorf, Germany). Lipid content was determined by Soxhlet extraction using a B-811 extractor (Büchi, Flawil, Switzerland) [27]. Total protein content was calculated from TN using a conversion factor of 6.25 for biological materials and 6.38 for milk proteins [28]. Methane production in S1 was recorded automatically using AMPTS II (Bioprocess Control AB, Lund, Sweden; now BPC Instruments AB, Lund, Sweden). Gas generated in the bioreactors was directed to a CO2 absorption module containing NaOH solution and then to the automated measurement module. After CO2 removal, the recorded gas volume corresponded to the CH4 volume. In S2, instantaneous and cumulative biogas flow were measured using an XFM17S digital gas flow meter (Aalborg Instruments and Controls, Inc., Orangeburg, NY, USA) equipped with an instantaneous flow display and a total volume counter. Biogas was discharged from the VAL-FB headspace through an outlet in the gas-tight lid. Biogas volume was measured continuously, and samples for composition analysis were collected from the gas line every 24 h. Biogas composition was determined using a GC 7890A gas chromatograph (Agilent Technologies, Santa Clara, CA, USA) equipped with a thermal conductivity detector (TCD). Gas samples of 20 mL were collected with a gas-tight syringe and injected into the chromatographic system. The chromatograph was equipped with two Hayesep Q 80/100 mesh columns, two molecular sieve 60/80 mesh columns, and one Porapak Q 80/100 mesh column. The columns were operated at 70 °C, the injection port at 150 °C, and the detector at 250 °C. Helium and argon were used as carrier gases at 15 mL/min. Biogas composition was additionally verified using a GMF 430 analyzer (Gas Data, Coventry, UK). In this study, TOCadded denotes the total mass of organic carbon supplied with the influent, i.e., the sum of the SR-PW-derived and SMP-derived organic carbon. The microbial community structure in selected sludge and biofilm samples was analyzed by fluorescence in situ hybridization (FISH) [29]. Preparations were examined using a Nikon Eclipse epifluorescence microscope (Nikon, Tokyo, Japan), with a 100× objective and 1000× total magnification. The abundance of the microbial groups was determined microscopically in randomly selected fields of view by relating the number of cells hybridizing with a given oligonucleotide probe (Eurofins Genomics Germany GmbH, Ebersberg, Germany) [30,31] to the total number of cells stained with 4′,6-diamidino-2-phenylindole (DAPI; Merck KGaA, Darmstadt, Germany). Results were expressed as the percentage of probe-positive cells relative to DAPI-stained cells.
2.6. Statistical Analysis
Data normality was assessed using the Shapiro–Wilk test, and homogeneity of variance using Levene’s test. When the assumptions of normality and homogeneity of variance were met, differences between experimental variants were assessed using one-way analysis of variance (ANOVA). Tukey’s post hoc test was used to identify significant differences between individual variants. Differences were considered statistically significant at p < 0.05. Relationship strength was assessed using Pearson’s correlation coefficient (r), the coefficient of determination (R2), and p-values. For relationships exhibiting a plateau, regression analysis was performed over the range of variants preceding saturation, whereas variants outside the linear response range were interpreted as indicating process stabilization or limitation. S1 analyses used results obtained from day 8 onward, after the first nominal HRT, whereas S2 analyses used results from the stable operating period of the VAL-FB reactor. All statistical analyses used a significance level of α = 0.05. Statistical analyses were performed using STATISTICA software (version 13.3; TIBCO Software Inc., Palo Alto, CA, USA).
3. Results and Discussion
3.1. Laboratory-Scale Experiments (S1)
In S1, SMP supplementation of SR-PW affected both the initial load of the monitored pollutants and their removal efficiency, as well as the pathways of biological transformation in the AMPTS bioreactors. Table 6 presents a detailed balance of the initial TOC and COD loads, distinguishing the fractions contributed by SR-PW and SMP, together with final concentrations and treatment efficiencies. SMP addition increased the initial influent TOC concentration from 7638 ± 824 mg C/L in V0 to 11,328 ± 844 mg C/L in V7. Initial COD simultaneously increased from 60,540 ± 10,080 mg O2/L in V0 to 69,720 ± 10,125 mg O2/L in V7 (Table 6). The proportion of TOC derived from SMP increased from 5.1 ± 0.6% in V1 to 32.6 ± 2.7% in V7, indicating that the supplement substantially increased the pool of readily biodegradable organic carbon in the SR-PW/SMP mixture. The contribution of SMP to the COD load was markedly lower, increasing from 1.7 ± 0.4% in V1 to 13.2 ± 1.6% in V7 (Table 6). Thus, despite SMP addition, SR-PW continued to dominate the total load of oxidizable substances. This is crucial for interpreting the results because COD encompassed not only biodegradable organic matter but also less degradable fractions and inorganic reducing substances present in photographic wastewater [8]. Consequently, the improvement in TOC removal was markedly greater than that in COD removal. Process stability, methanogenic activity, and biomass taxonomic composition are summarized in Table 7.
Table 6.
Balance of the initial TOC and COD loads and treatment efficiency in S1.
Table 7.
Process stability, methanogenic activity, and biomass taxonomic composition in AMPTS bioreactors across the S1 variants.
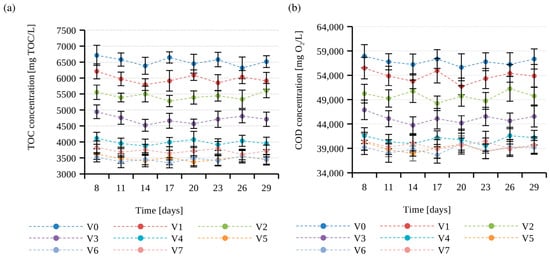
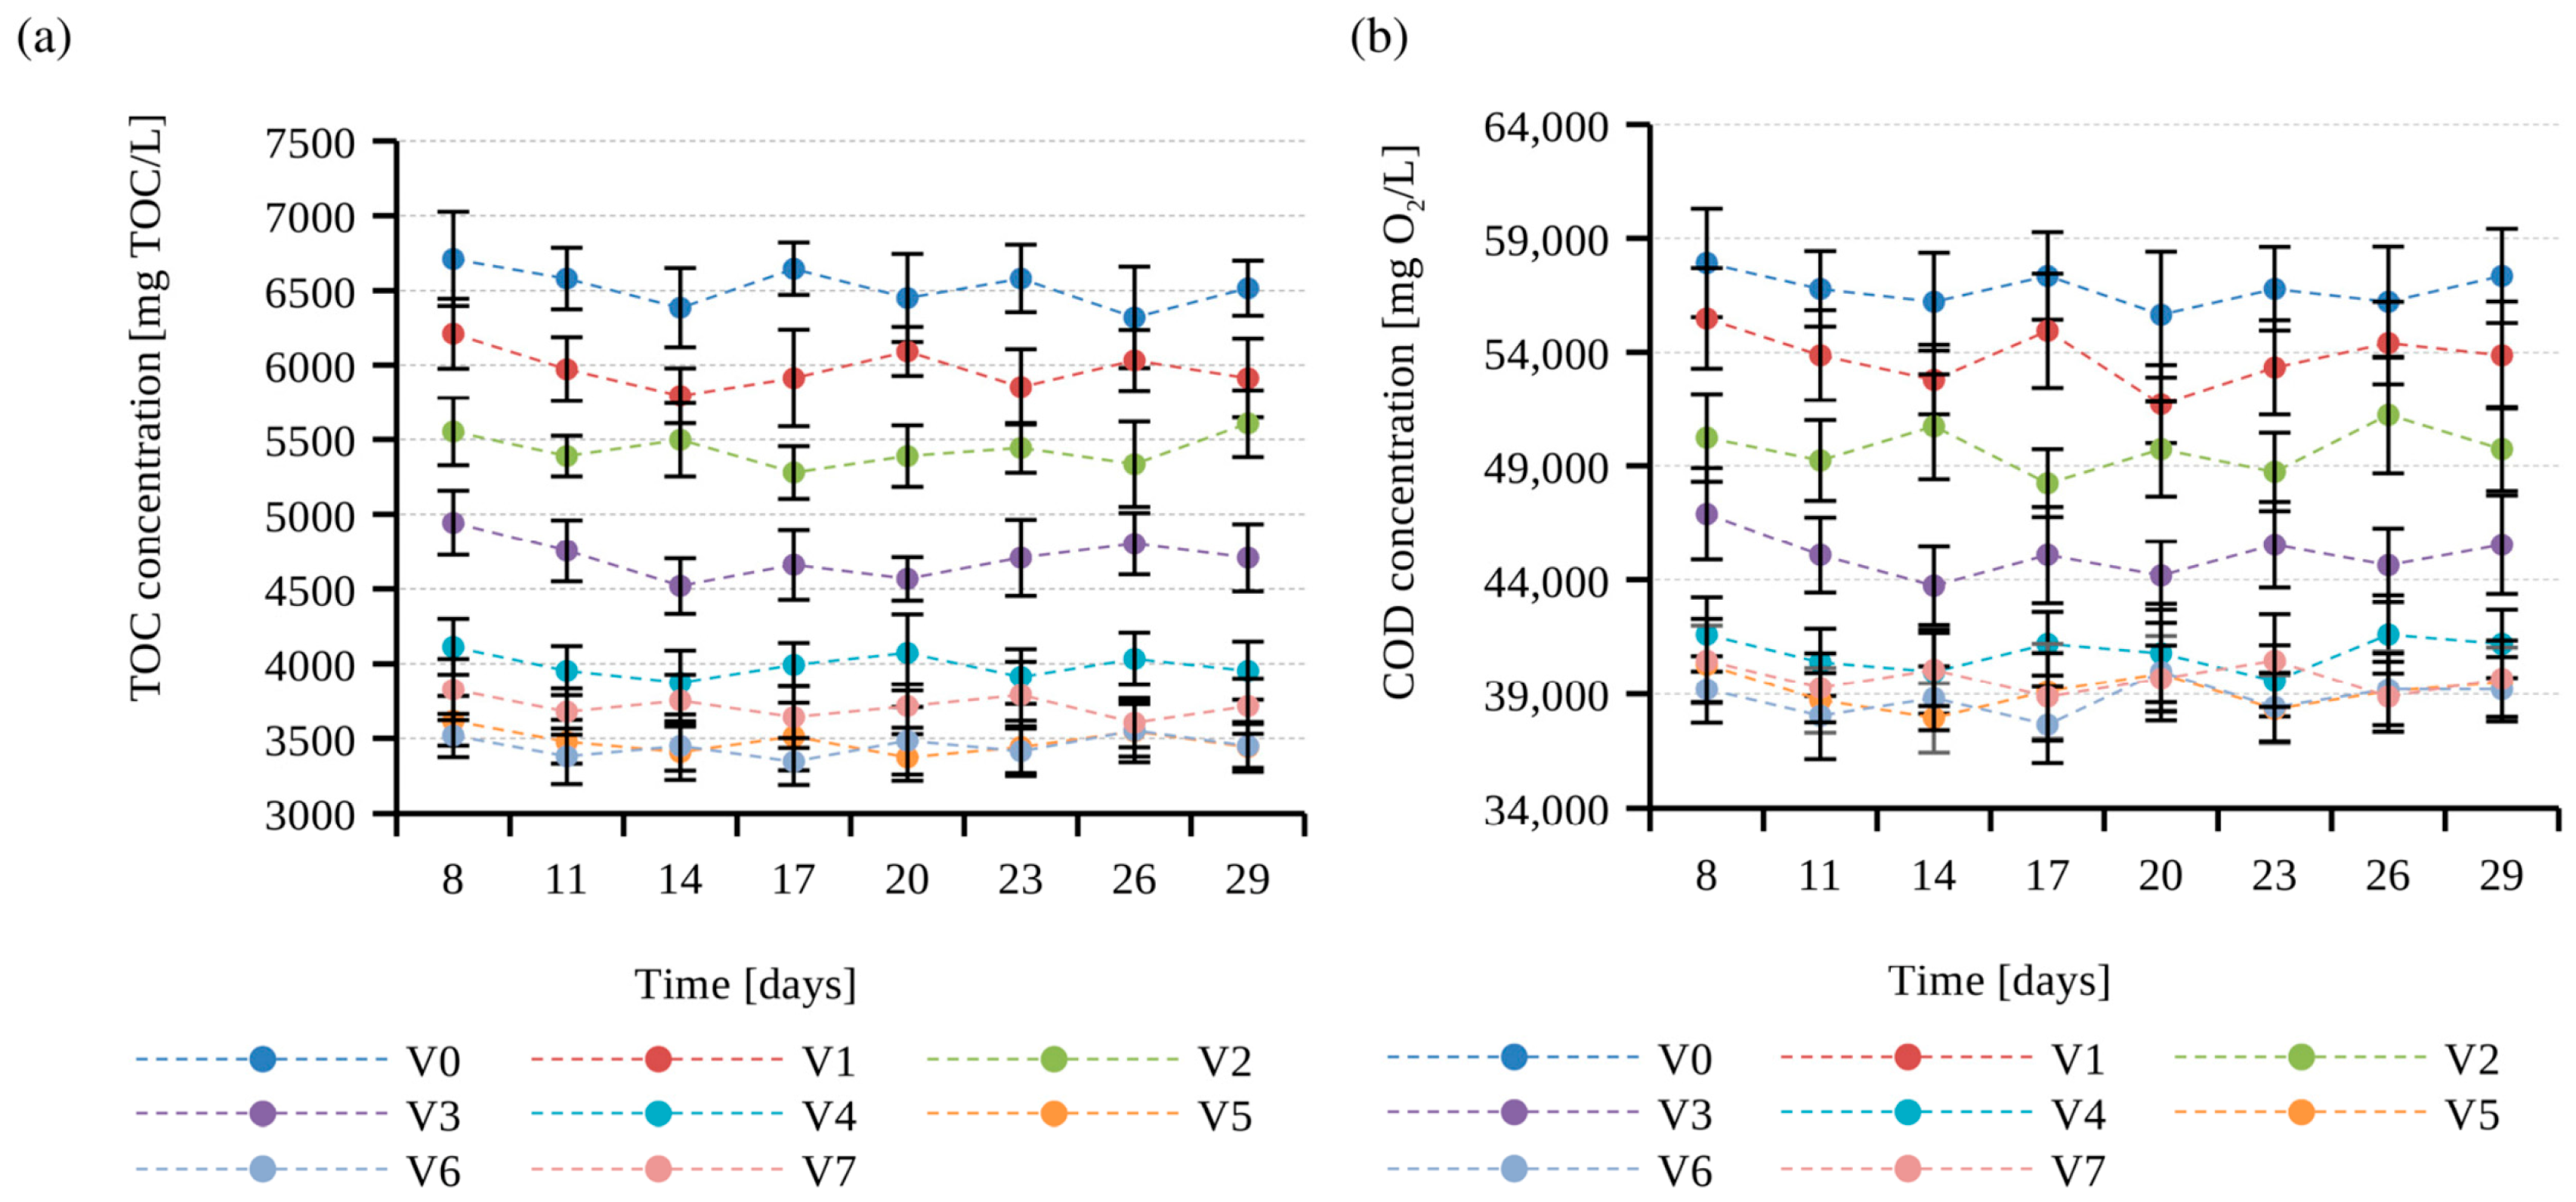
Process performance was poor in the control variant, V0, which received SR-PW alone. TOC and COD removal were 14.6 ± 3.8% and 6.2 ± 2.6%, respectively, while their final concentrations remained at 6523 ± 251 mg C/L and 56,787 ± 2145 mg O2/L (Table 6, Figure 3a,b). These values were significantly less favorable than those in the SMP-supplemented variants, and V0 differed significantly from all other variants in TOC and COD removal (p < 0.05). The particularly low COD reduction indicates that most oxidizable substances present in SR-PW were not effectively transformed under anaerobic conditions.
Figure 3.
Changes in effluent TOC (a) and COD (b) concentrations in AMPTS bioreactors across the S1 experimental variants.
From day 8 onward, effluent TOC concentrations fluctuated without a clear progressive decline (Figure 3a), indicating relatively consistent pretreatment performance under daily feeding at a fixed nominal HRT. Successive HRT periods represent elapsed operation under the same hydraulic conditions. These data do not resolve TOC removal kinetics during the first HRT; experiments comparing different HRTs are needed to determine whether comparable performance could be achieved at a shorter retention time.
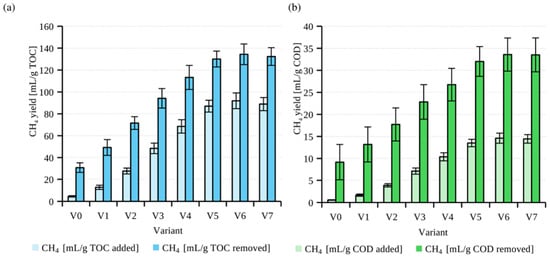
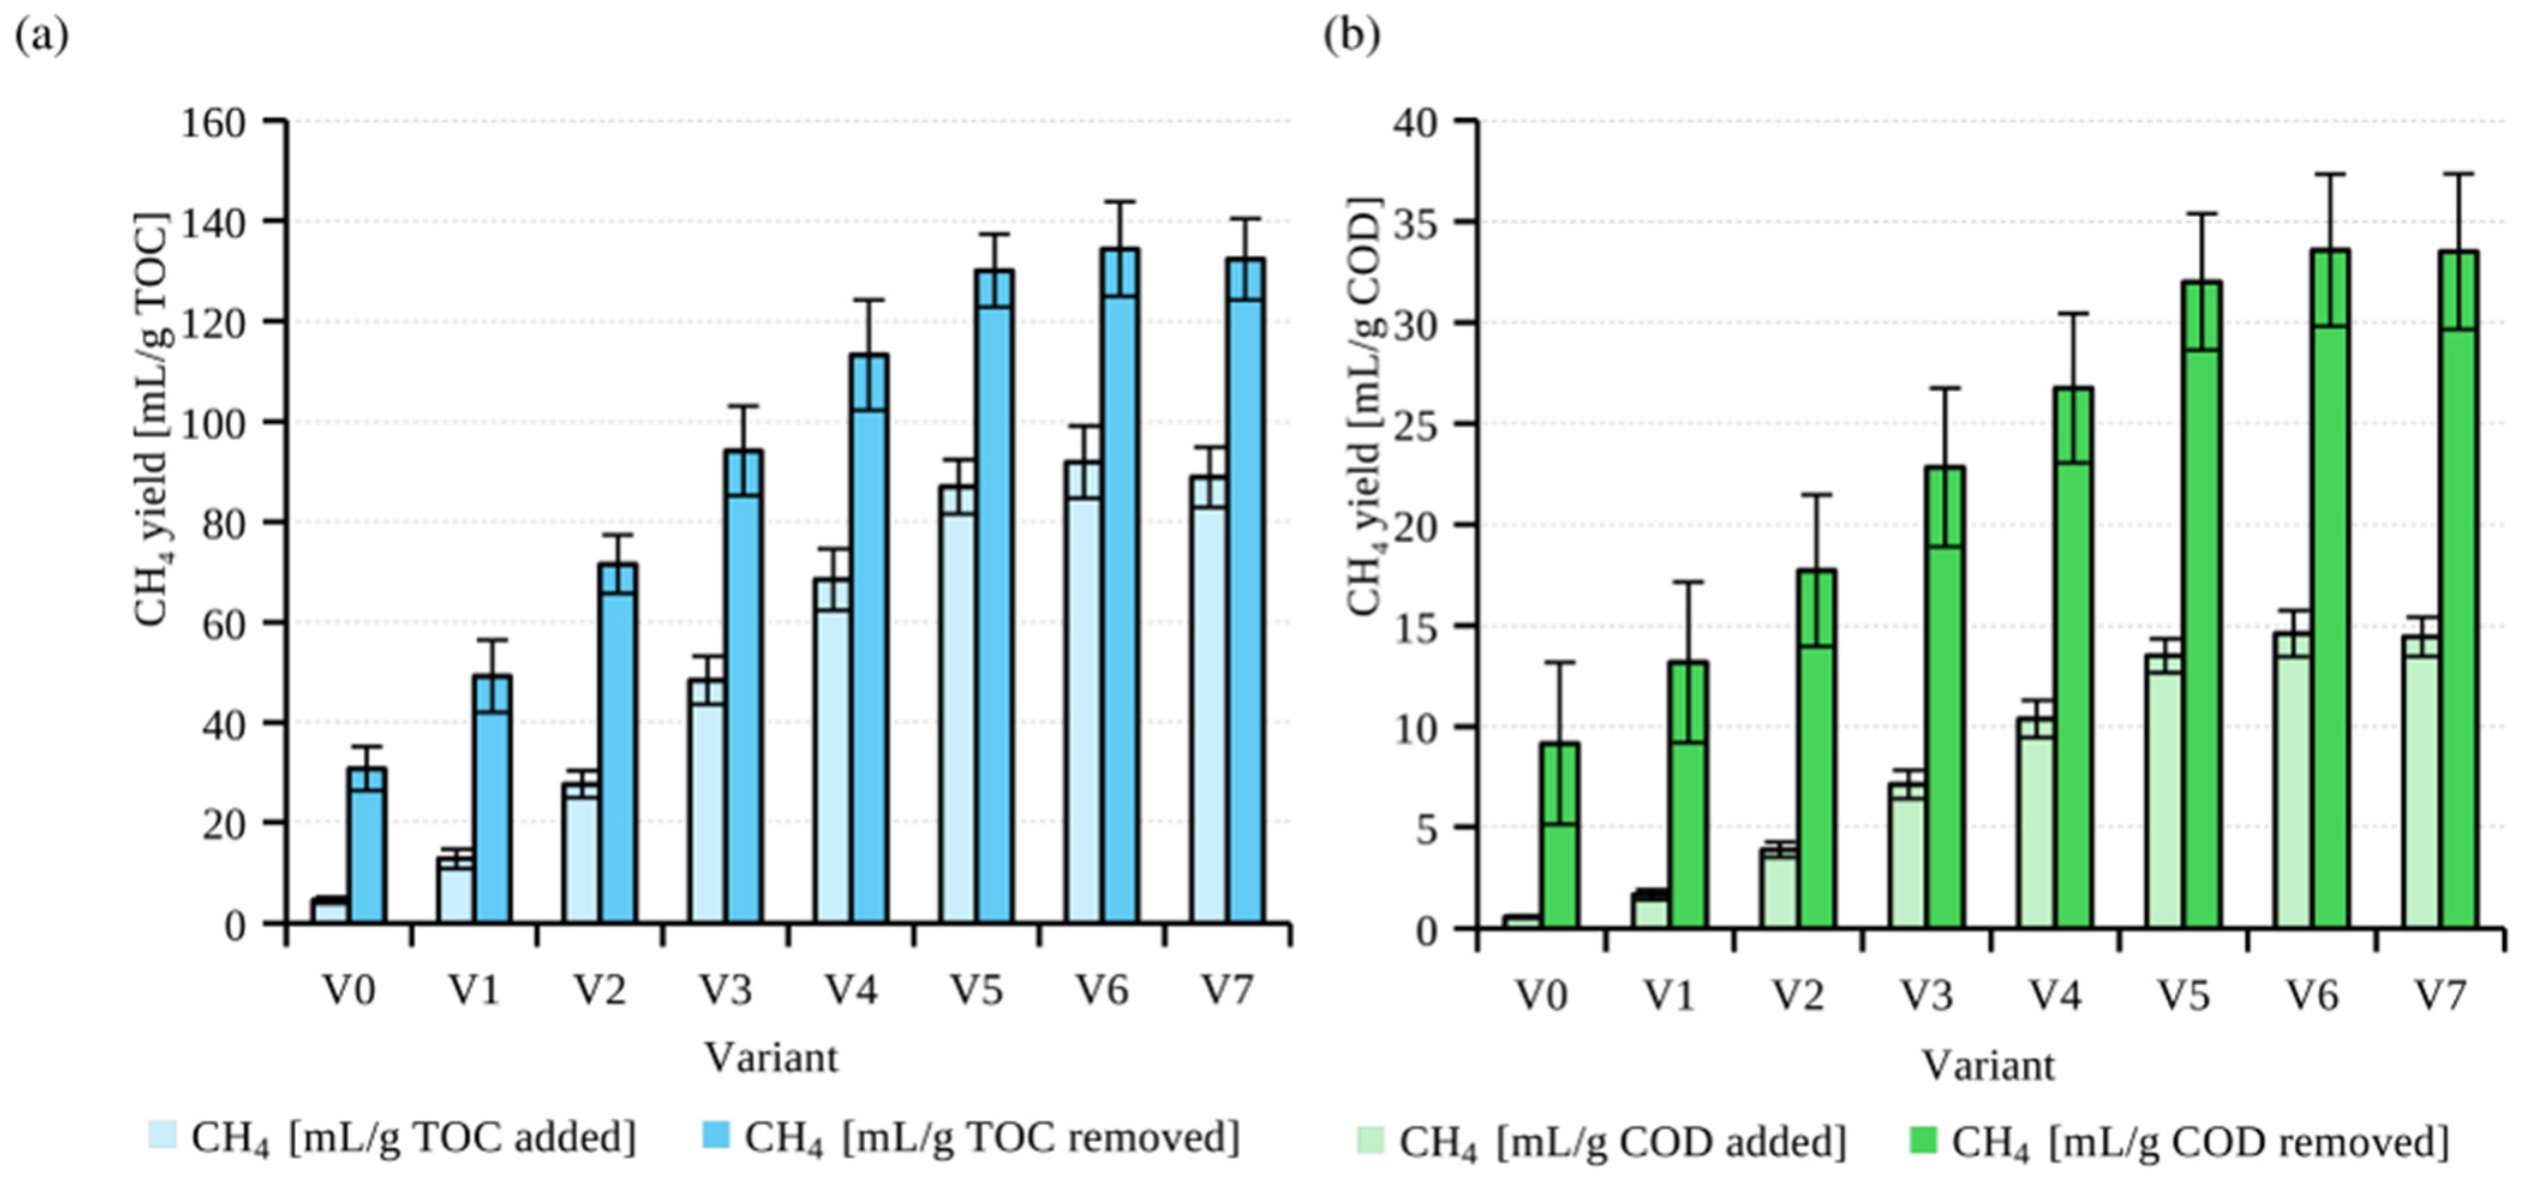
Although raw SR-PW was acidic, with a pH of 5.09 ± 0.32 (Table 1), partial neutralization to pH 6.11 ± 0.20 was observed in the treated wastewater from V0 (Table 7). Nevertheless, this value remained below the optimal range for stable methanogenesis [19]. The high FOS/TAC ratio of 0.62 ± 0.08 indicated an unfavorable balance between intermediate formation and subsequent utilization by methanogens (Table 7). In V0, pH was significantly lower and FOS/TAC significantly higher than in V1–V7 (p < 0.05), confirming that the least stable environmental conditions occurred without SMP supplementation. Biogas production was also limited, at 60.5 ± 8.9 mL/g TOCadded, with a marginal CH4 yield of 4.5 ± 0.6 mL/g TOCadded (Figure 4a) and a biogas CH4 content of 7.5 ± 0.6% (Table 7). Both biogas CH4 content and CH4 yield in V0 were significantly lower than in all SMP-supplemented variants (p < 0.05).
Figure 4.
Specific methane production per unit of TOC (a) and COD (b) added and removed in the S1 experimental variants.
This weak methanogenic response was consistent with the microbial community structure. In V0, EUB338-positive bacteria dominated, accounting for 82 ± 4% of DAPI-stained cells, whereas ARC915-positive Archaea accounted for only 4 ± 1%. Methanogen abundance was also very low: Methanosarcinaceae represented 1.4 ± 0.4% and Methanosaeta 0.6 ± 0.3% of DAPI-stained cells (Table 7). The proportion of Bacteria/EUB338 did not differ significantly between variants at the 0.05 significance level, whereas the proportions of Archaea/ARC915 and selected methanogen groups increased significantly with SMP dose, particularly from V2–V3 to V6.
The results indicate that SR-PW alone had limited susceptibility to complete anaerobic conversion, with system activity shifted toward bacterial transformations without effective methanogenesis. The high FOS/TAC values in the initial variants were not attributable to organic overloading because S1 was operated at a low OLR. Rather, they reflected the acidic nature of the SR-PW influent, limited system alkalinity and buffering capacity, and weak methanogenic biomass activity. This interpretation was supported by the low pH values, ranging from 6.11 ± 0.20 in V0 to 6.91 ± 0.15 in V2, and the elevated FOS/TAC ratios of 0.62 ± 0.08 (V0), 0.54 ± 0.07 (V1), and 0.44 ± 0.06 (V2) (Table 7).
SMP addition progressively improved the biological response of the system despite the increase in initial TOC and COD concentrations. Across V1–V4, TOC removal increased from 25.8 ± 4.5% to 60.5 ± 4.1%, and COD removal from 12.6 ± 3.3% to 38.8 ± 4.1% (Table 6). These increases were statistically significant (p < 0.05), with successive variants differing from one another, confirming the effect of SMP supplementation. COD reduction improved substantially, although less than TOC removal, indicating that part of the COD load was associated with poorly biodegradable fractions. Biogas production increased concurrently from 135.2 ± 15.4 to 405.6 ± 32.5 mL/g TOCadded, and CH4 yield from 12.7 ± 1.9 to 68.5 ± 6.1 mL/g TOCadded (Figure 4a). Both biogas CH4 content and CH4 yield also increased significantly between successive variants (p < 0.05; Table 7). These changes were accompanied by improved reactor stability. pH increased from 6.47 ± 0.18 in V1 to 7.22 ± 0.10 in V4, while FOS/TAC decreased from 0.54 ± 0.07 to 0.32 ± 0.04 (Table 7). SMP addition increased the availability of readily biodegradable substrate, improved the acid–base balance, and reduced the relative accumulation of intermediates. The microbial community structure also changed. The proportion of Archaea ARC915 increased from 5 ± 1% in V1 to 11 ± 2% in V4, and Methanosarcinaceae from 1.5 ± 0.5% to 4.0 ± 1.0%. Over the same range, Methanosaeta increased from 0.6 ± 0.3% to 2.1 ± 0.5% (Table 7). SMP supported methanogen development, but the response was stronger for Methanosarcinaceae than for Methanosaeta. This suggests selection for more resilient and metabolically versatile methanogens, better adapted to stressful conditions and variable loading [32]. The effect of SMP may be associated not only with the supply of additional biodegradable carbon but, above all, with improved metabolic substrate availability and C:N:P balance [33]. Lactose and milk proteins could rapidly support hydrolysis and acidogenesis, increasing intermediate availability for subsequent anaerobic transformations [34]. The importance of dissolved organic matter availability for CH4 yield has also been demonstrated during digestion of dairy substrates [35]. SMP simultaneously supplied nitrogen, phosphorus, and building blocks required for new biomass synthesis (Table 2). This effect was particularly important for SR-PW, which exhibited a very high COD/TOC ratio and an unfavorable nutrient balance. Consequently, the supplement could partly compensate for nutrient deficiencies and sustain the activity of microorganisms exposed to inhibitory wastewater [36].
The best results were obtained in V5–V6. TOC removal was 66.9 ± 3.2% in V5 and 68.4 ± 3.0% in V6, while COD removal reached 42.2 ± 3.6% and 43.5 ± 3.5%, respectively (Table 6). Final TOC concentrations decreased to 3478 ± 178 and 3450 ± 170 mg C/L (Figure 3a), and COD to 39,119 ± 1646 and 38,815 ± 1635 mg O2/L in V5 and V6, respectively (Figure 3b). V5 and V6 did not differ significantly in TOC removal, COD removal, final TOC and COD concentrations, CH4 content, or CH4 yield at the 0.05 significance level. Both variants were significantly more effective than V0–V4 (p < 0.05), confirming that the highest process efficiency occurred at 7–8 g SMP/L SR-PW. Thus, even within the most favorable supplementation range, more than half of the initial COD remained in the effluent, whereas approximately two-thirds of TOC was removed. This divergence between TOC and COD is one of the key S1 findings: SMP improved biological conversion of the organic fraction but did not eliminate the high, poorly removable COD characteristic of SR-PW.
V5–V6 achieved the highest CH4 production, with yields of 87.0 ± 5.4 and 91.9 ± 7.2 mL/g TOCadded, respectively (Figure 4a). These variants also exhibited the most favorable process stability parameters. pH was 7.31 ± 0.08 in V5 and 7.34 ± 0.08 in V6, while FOS/TAC decreased to 0.30 ± 0.03 and 0.28 ± 0.03, respectively (Table 7). The pH and FOS/TAC values in V5–V6 did not differ significantly from V7 at the 0.05 significance level but were more favorable than those in the initial variants, V0–V3. These values indicate that V5–V6 achieved the best balance between fermentative intermediate production and subsequent conversion toward CH4.
The microbial community structure likewise confirmed that V5–V6 provided the most favorable conditions for methanogenic activity. Archaea ARC915 accounted for 13 ± 2% in both variants, while Methanosarcinaceae reached 7.3 ± 1.5% and 9.1 ± 1.8%, respectively. Methanosaeta abundance was lower, at 2.5 ± 0.6% in V5 and 2.3 ± 0.7% in V6 (Table 7). The proportion of Archaea/ARC915 in V5–V6 was significantly higher than in V0–V3 (p < 0.05). The highest Methanosarcinaceae proportion occurred in V6, which differed significantly from V0–V4 (p < 0.05) but not from V5 or V7. This pattern indicates that SMP supplementation at 7–8 g/L SR-PW enabled partial recovery of biomass methanogenic potential without establishing full methanogen dominance in the consortium.
V7 did not provide further improvement despite having the highest proportions of SMP-derived TOC and COD. TOC and COD removal were 67.2 ± 3.6% and 43.1 ± 4.0%, respectively (Table 6), and CH4 yield was 88.9 ± 6.0 mL/g TOCadded (Figure 4a). V7 did not differ significantly from V5 or V6 in TOC removal, COD removal, CH4 content, CH4 yield, pH, or FOS/TAC at the 0.05 significance level. The absence of further COD reduction in V7 confirms that the process was no longer limited by readily biodegradable substrate availability, but by the chemical nature of SR-PW and the presence of COD fractions resistant to anaerobic transformation. In V7, pH remained at 7.33 ± 0.09 and FOS/TAC at 0.29 ± 0.03, providing no indication of process destabilization or organic overloading. The lack of a further increase in CH4 yield should therefore be interpreted as a plateau associated with SR-PW properties, rather than as a consequence of system acidification. Archaea ARC915 decreased to 12 ± 2% and Methanosarcinaceae to 8.2 ± 1.1%, consistent with the absence of further improvement in methane yield. The lack of significant differences between V5, V6, and V7 at the 0.05 significance level indicates that a plateau was reached beyond 7–8 g SMP/L SR-PW. Once supplementation reached a certain level, the availability of readily biodegradable substrate or nutrients ceased to be the limiting factor. Instead, SR-PW properties, including recalcitrant and potentially inhibitory fractions, became dominant. Selection of the co-substrate proportion requires consideration of mixture composition and digestion conditions [37].
Correlation analysis confirmed that process improvement depended strongly on SMP dose and that the relationship was linear before the plateau. Across V0–V5, SMP dose was very strongly positively correlated with TOC and COD removal, with r = 0.998 and r = 0.998, respectively, R2 = 0.995–0.996, and p < 0.001 (Table 8). Similarly strong relationships were observed for biogas CH4 content across V0–V5 (r = 0.999, R2 = 0.999, p < 0.001) and for CH4 yield per unit of TOC added across V0–V6 (r = 0.987, R2 = 0.974, p < 0.001; Table 8). Final TOC and COD concentrations were very strongly negatively correlated with SMP dose, with r = −0.991 for TOC and r = −0.996 for COD. Increasing the SMP dose effectively improved pollutant removal and methanogenic biomass activity, but only up to V5–V6, beyond which further supplementation no longer significantly improved the process (Table 8).
Table 8.
Linear correlations between SMP dose and process performance indicators, determined over the variant ranges exhibiting the strongest significant linear response before the plateau.
Despite increased biogas and CH4 production, biogas composition remained atypical of stable anaerobic digestion. CH4 content increased from 7.5 ± 0.6% in V0 to 18.5 ± 0.9–18.9 ± 0.8% in V5–V6, but CO2 remained dominant, accounting for approximately 81% of the biogas. CO2 dominance was consistent with the high proportion of EUB338-positive bacteria, which represented 78–83% of DAPI-stained cells across all variants (Table 7). Thus, SMP stimulated hydrolytic, fermentative, and partly methanogenic transformations without eliminating limitations at the final methanogenesis stage. Even with favorable pH and FOS/TAC values in V5–V7, the low biogas CH4 content indicated that methanogenesis was limited not only by the acid–base balance but also by the inhibitory and recalcitrant nature of SR-PW. A substantial proportion of removed TOC could therefore have been directed toward CO2 and dissolved intermediates, while their subsequent reduction to CH4 remained limited. This phenomenon may be associated with phenolic compounds, sulfites, thiosulfates, silver complexes, and complexing agents in SR-PW, which can limit methanogenic activity and disrupt electron flow during the final stages of digestion [11]. In sulfate-containing wastewater, sulfate reduction may compete with methanogenesis for available organic substrates [38].
The divergence between TOC removal, COD removal, and CH4 production indicates that COD in SR-PW cannot be interpreted as a straightforward equivalent of biodegradable organic load. In typical organic wastewater, COD reduction is often directly linked to mineralization or conversion into biogas [39]. In SR-PW, this relationship was disrupted because COD also encompassed reducing compounds, sulfites, thiosulfates, and other photographic wastewater constituents that increase COD without necessarily producing a proportional increase in CH4 production [8]. Low CH4 yield per unit of COD therefore reflected not only limited biomass activity but also the chemically complex basis of COD in this wastewater [8].
The S1 results indicate that SMP activated anaerobic pretreatment of SR-PW, improving TOC removal, partially improving COD removal, and increasing biogas and CH4 production. These improvements were accompanied by a shift in pH from acidic/subneutral conditions toward values favorable for methanogenesis and a decrease in FOS/TAC, confirming improved process stability. However, the effect remained constrained by the specific inhibitory nature of SR-PW. V5–V6 achieved the highest pollutant removal and CH4 production, the most favorable pH and FOS/TAC values, and the highest methanogen proportions, with no additional benefit from a further increase in SMP dose. These results justified selecting V5–V6 for subsequent verification in S2.
3.2. Semi-Technical-Scale Experiments (S2)
In S2, V5 and V6, selected on the basis of the S1 results, were verified in a VAL-FB reactor containing granular sludge and biofilm grown on LCRF [21]. Compared with the laboratory system, the VAL-FB configuration provided greater biomass retention, spatial separation of transformation zones, and more favorable conditions for maintaining specialized methanogenic groups [22]. Biomass retention and organic loading are important determinants of anaerobic reactor performance [40,41]. S2 assessed whether the treatment outcomes achieved in S1 could be enhanced in a system with greater biological stability.
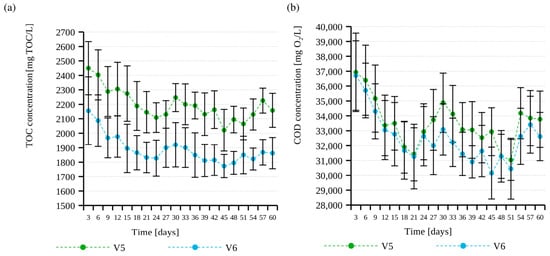
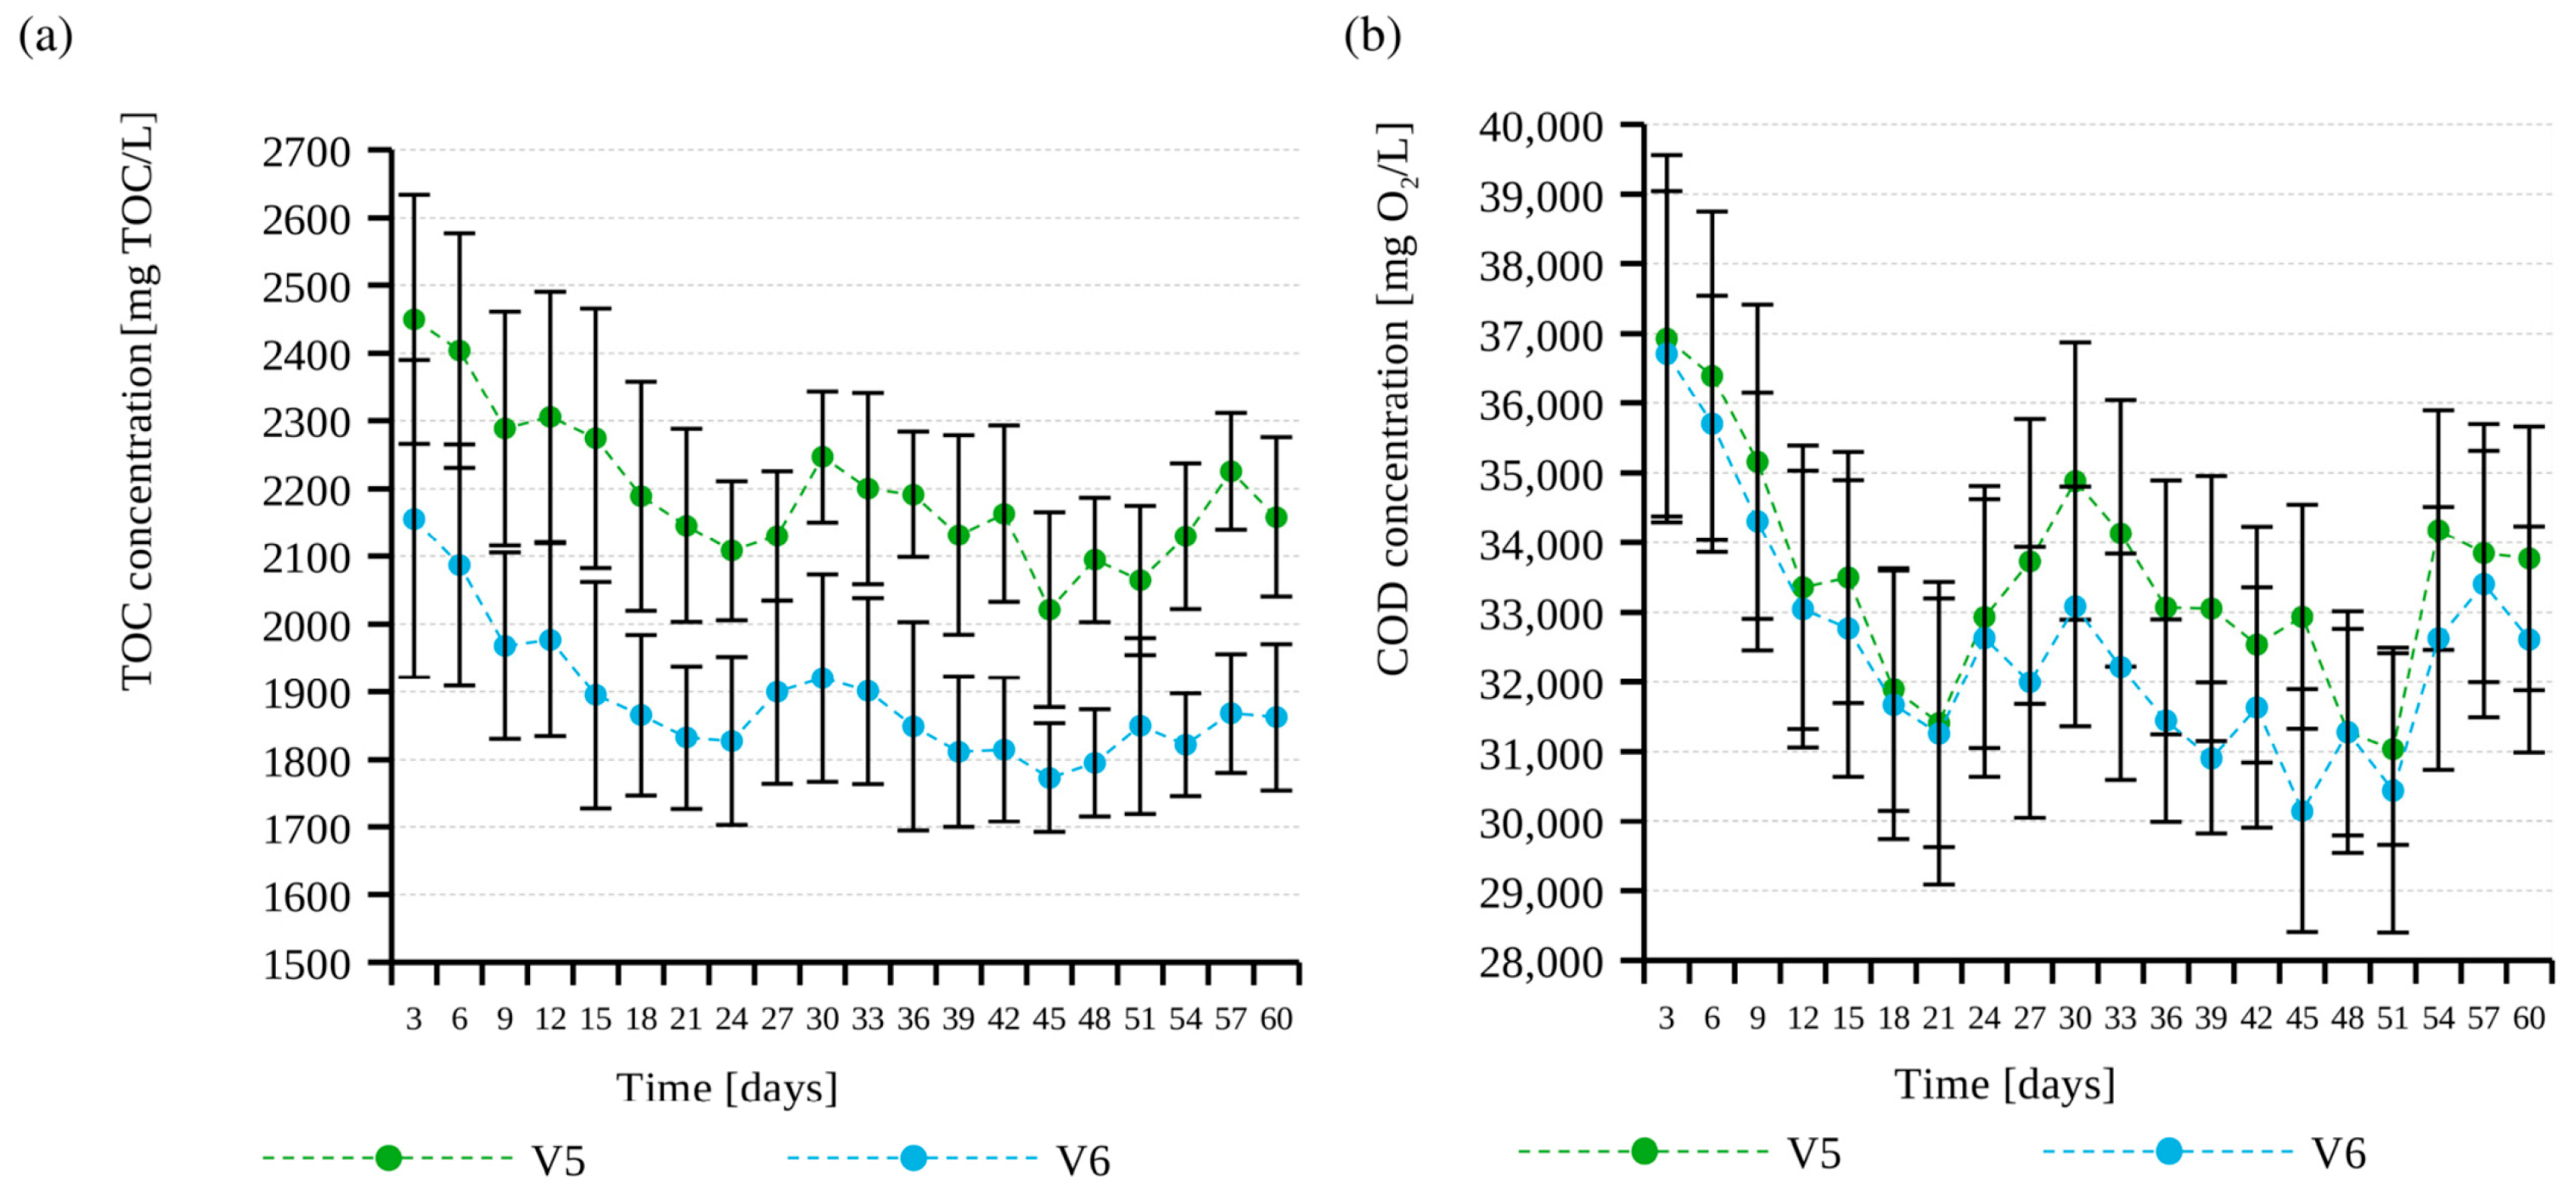
Both S2 variants operated within stable pH and FOS/TAC ranges. In V5, pH was 7.42 ± 0.07 and FOS/TAC was 0.24 ± 0.03, compared with 7.45 ± 0.06 and 0.22 ± 0.02, respectively, in V6 (Table 9). These values indicate that the process was not limited by acidification or organic overloading. Compared with S1, the FOS/TAC values in S2 indicated a better balance between the formation of digestion intermediates and their subsequent utilization in methanogenic transformations. By retaining granular sludge and biofilm, the VAL-FB configuration improved reactor stability. Pollutant removal was significantly higher than in S1 (p < 0.05). In V5, TOC and COD removal were 79.1 ± 1.9% and 50.5 ± 2.0%, respectively, increasing to 82.7 ± 1.5% and 52.7 ± 1.7% in V6 (Table 9). These efficiencies corresponded to mean effluent TOC concentrations of 2196 ± 156 mg C/L in V5 and 1889 ± 145 mg C/L in V6 (Figure 5a), and mean COD concentrations of 33,502 ± 2192 and 32,495 ± 2221 mg O2/L, respectively (Figure 5b). V6 was significantly more effective than V5 in both TOC and COD removal (p < 0.05).
Table 9.
Process stability, methanogenic activity, and biomass taxonomic composition in the S2 variants operated in the VAL-FB reactor.
Figure 5.
Changes in effluent TOC (a) and COD (b) concentrations in the VAL-FB reactor across the S2 experimental variants. Values are presented as mean ± SD.
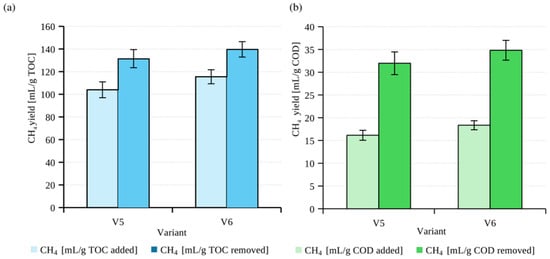
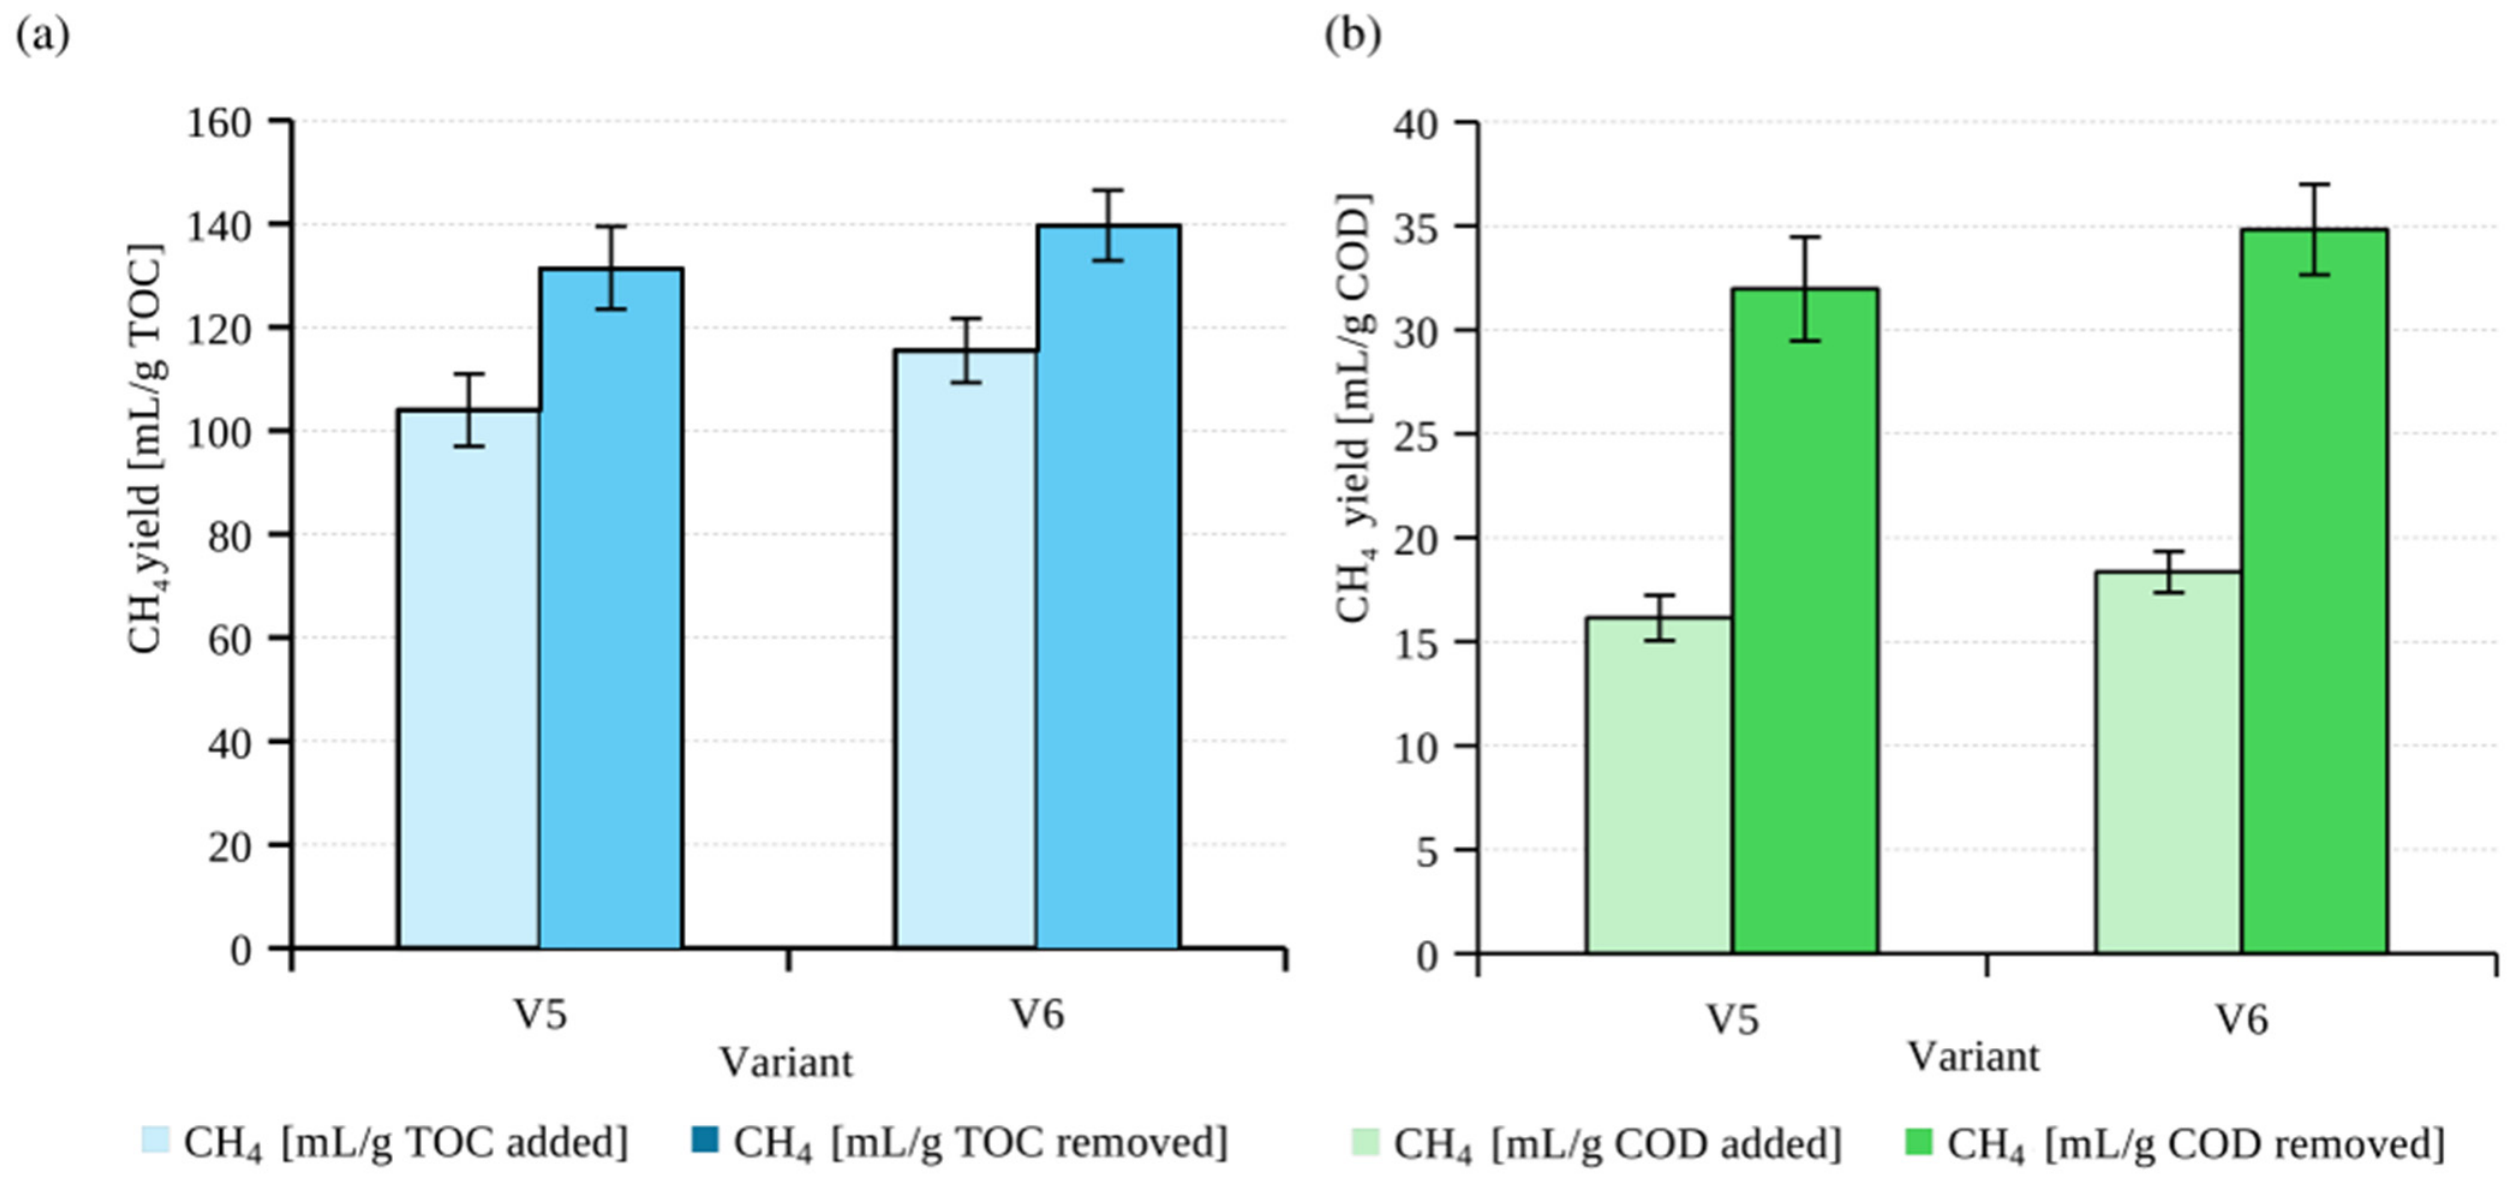
Anaerobic digestion performance was higher in V6. Biogas CH4 content was 19.2 ± 0.9% in V5 and 20.4 ± 0.8% in V6, while specific CH4 yield increased from 104.0 ± 7.0 to 115.5 ± 6.2 mL/g TOCadded (Figure 6a). Lower methane yields were obtained when expressed per unit of CODadded, at 16.15 ± 1.09 mL/g COD in V5 and 18.36 ± 0.99 mL/g COD in V6, confirming that COD in SR-PW was not a straightforward equivalent of biologically available organic load (Figure 6).
Figure 6.
CH4 yield expressed per unit of TOC (a) and COD (b) in the S2 variants.
The microbial community structure indicates that BF-LCRF biofilm played a particularly important role in maintaining methanogenic activity. In both variants, the proportion of Archaea ARC915 was higher in granular sludge than in biofilm. In V5, it was 46.5 ± 3.1% in GS compared with 9.2 ± 1.3% in BF-LCRF; the corresponding V6 values were 43.8 ± 2.8% and 11.5 ± 1.4% (Table 9). A similar pattern was observed for Methanosarcinaceae, which accounted for 14.8 ± 1.9% in V5 and 17.6 ± 2.0% in V6 in granular sludge, compared with 1.6 ± 0.4% and 2.1 ± 0.5%, respectively, in biofilm (Table 9). Differences in the microbial structure of GS and BF-LCRF may also be associated with the location of these biomass fractions in different VAL-FB zones. Wastewater entering the methanogenic zone had previously contacted granular sludge in the hydrolysis and acidogenic zone, which may have reduced the direct impact of the raw SR-PW/SMP load on methanogenic microorganisms and provided more stable conditions for their retention and growth. Methanosaeta abundance was lower than that of Methanosarcinaceae in granular sludge, whereas the opposite relationship occurred in biofilm. In V6, Methanosaeta accounted for 3.6 ± 0.7% in BF-LCRF and 10.4 ± 1.5% in GS. Despite improved process stability, higher biomass retention, and the increased proportion of Archaea in the biofilm, biogas CH4 content remained low, at approximately 19–20% (Table 9). This was not attributable to unfavorable pH or high FOS/TAC, as pH was 7.42 ± 0.07–7.45 ± 0.06 and FOS/TAC remained at 0.22 ± 0.02–0.24 ± 0.03. Methanogenic limitation should therefore be associated primarily with the chemical characteristics of SR-PW, including recalcitrant and potentially inhibitory fractions [42]. S2 thus confirmed that VAL-FB improved treatment efficiency and methanogenic activity without fully eliminating the constraints imposed by silver-recovery photographic wastewater.
Reactor performance does not establish standardized biodegradability. Strotmann et al. [43] emphasize challenges in testing complex mixtures and the importance of inoculum characterization and appropriate analytical endpoints. The 82.7% TOC removal in S2 characterizes SR-PW/SMP treatment under the applied conditions, establishing neither ultimate SR-PW biodegradation nor degradation of individual photographic contaminants. No complete carbon balance separated sludge/biofilm retention, abiotic removal, and SMP conversion.
OECD 311 and ISO 11734 assess ultimate anaerobic biodegradability through gas production [44,45]. OECD 311 includes gaseous carbon, dissolved inorganic carbon, inoculum-blank correction, and reference-substrate and inhibition controls [44]. Concentration series comparing SR-PW, SMP, and their mixtures under controlled inoculum and nutrient conditions could distinguish concentration-dependent inhibition from limited anaerobic conversion. An SMP-only control would assess its contribution, although co-digestion interactions preclude attributing wastewater-derived methane by simple subtraction. Complementary Zahn–Wellens tests (OECD 302B; ISO 9888) assess aerobic organic-carbon removal under favorable biodegradation conditions [46,47]. Reduced inorganic constituents contribute to COD, favoring carbon measurements; DOC removal nevertheless requires accounting for sorption and other abiotic losses. These assays were not performed; removal efficiencies and methane yields do not establish a standardized SR-PW biodegradability classification.
Strotmann et al. [48] review standardized microbial toxicity assays complementing chemical analyses. Toxicity was unmeasured: improved TOC/COD removal, increased CH4 production, and altered methanogen proportions do not demonstrate reduced effluent toxicity. Nutrient supplementation, acclimation, and biomass retention may sustain performance despite residual inhibitors. Raw SR-PW, supplemented influent, and effluents should be compared using anaerobic gas-production inhibition (OECD 224; ISO 13641-1) [49,50], activated-sludge respiration inhibition covering heterotrophic oxidation and nitrification (OECD 209) [51], and bacterial luminescence inhibition tests (ISO 11348-3) [52]. Paired influent–effluent tests should use the same biological material within each assay and concentration–response series expressed as wastewater volume fractions, reporting EC50 where estimable. Controls should address pH, salinity, and SMP. Respiration tests should quantify abiotic oxygen consumption from reduced inorganic constituents [51]; luminescence tests should check optical interference from coloration or turbidity. Results would establish whether chemical-load reduction accompanies reduced microbial inhibition and guide subsequent treatment.
Residual V6 effluent concentrations in S2 (1889 ± 145 mg TOC/L; 32,495 ± 2221 mg COD/L) justify further treatment after VAL-FB. Acclimated suspended or attached aerobic biomass could remove biodegradable organics and reduced sulfur compounds, where present, depending on residual composition, bioavailability, and inhibition. For photographic wastewater, Pavlostathis and Morrison [8] reported sulfite and thiosulfate oxidation with substantial alkalinity consumption, while EDTA remained recalcitrant. Pavlostathis and Maeng [53] demonstrated complete thiosulfate oxidation to sulfate and extensive silver partitioning into sludge during aerobic treatment of simulated silver-bearing photographic wastewater. Sulfur conversion and sludge-associated contaminants therefore merit assessment alongside organic-carbon removal. Sequential anaerobic–aerobic treatment of synthetic paint wastewaters showed composition-dependent aerobic contributions and process stability [54]; efficiencies from these matrices cannot be transferred directly to real SR-PW.
Coupled VAL-FB–aerobic treatment should be compared with an aerobic-only reference under controlled feeding, selecting aerobic loading, hydraulic retention time, and sludge retention time using biodegradability and inhibition data. Monitoring oxygen uptake, alkalinity, TOC, COD, and sulfur species would distinguish organic-carbon removal from oxidation of inorganic reducing compounds. Aeration demand and SMP contributions to treatment load require assessment given the high residual COD.
4. Conclusions
SR-PW was difficult to treat directly under anaerobic conditions because of its acidity, high TOC and COD concentrations, and highly unfavorable nutrient balance. Raw SR-PW exhibited a pH of 5.09 ± 0.32, COD of 60,540 ± 10,086 mg O2/L, and a very high C/N ratio of 385 ± 197. SMP supplementation significantly improved SR-PW biodegradation efficiency. Increasing the SMP dose improved the process environment: pH increased from 6.11 ± 0.20 in V0 to 7.34 ± 0.08 in V6, while FOS/TAC decreased from 0.62 ± 0.08 to 0.28 ± 0.03. TOC and COD removal and CH4 production increased concurrently. Biogas CH4 content rose from 7.5 ± 0.6% in V0 to 18.5 ± 0.9–18.9 ± 0.8% in V5–V6. The optimal supplementation range in S1 was 7–8 g SMP/L SR-PW.
Microbiological analysis confirmed that SMP supplementation favored methanogen development, particularly Methanosarcinaceae. In S1, Archaea ARC915 increased from 4 ± 1% in V0 to 13 ± 2% in V5–V6, and Methanosarcinaceae from 1.4 ± 0.4% to 7.3 ± 1.5–9.1 ± 1.8% of DAPI-stained cells. EUB338-positive bacteria nevertheless remained the dominant microbial group in all variants.
Semi-technical-scale verification improved process performance compared with S1. In V6, TOC and COD removal increased to 82.7 ± 1.5% and 52.7 ± 1.7%, respectively, and CH4 yield reached 115.5 ± 6.2 mL CH4/g TOCadded. In V6, Archaea and Methanosarcinaceae accounted for 11.5 ± 1.4% and 2.1 ± 0.5% of DAPI-stained cells in BF-LCRF, respectively, compared with 43.8 ± 2.8% and 17.6 ± 2.0% in granular sludge. Despite improved process stability in S2, with pH 7.42–7.45 and FOS/TAC 0.22–0.24, biogas CH4 content remained low, at 19.2–20.4%.
Anaerobic treatment of SR-PW should therefore be regarded primarily as a pretreatment strategy aimed at TOC reduction, partial COD removal, and wastewater stabilization before further treatment. Combining SMP supplementation with biomass retention in the VAL-FB reactor is a technologically justified approach; however, an additional polishing stage would be required for such chemically complex wastewater to meet stringent discharge requirements.
Author Contributions
Conceptualization, J.K. and M.D.; methodology, J.K., M.D. and M.Z.; formal analysis, J.K. and M.D.; investigation, J.K., M.D. and M.Z.; resources, J.K., M.D. and M.Z.; writing—original draft preparation, J.K. and M.D.; writing—review and editing, J.K. and M.D.; visualization, J.K. and M.D.; supervision, J.K. and M.D.; project administration, J.K.; funding acquisition, J.K. All authors have read and agreed to the published version of the manuscript.
Funding
This research was financially supported by the projects WZ/WB-IIŚ/3/2022 of the Bialystok University of Technology and No. 29.610.023-110 of the University of Warmia and Mazury in Olsztyn, funded by the Ministry of Science and Higher Education.
Data Availability Statement
The original contributions presented in this study are included in the article. Further inquiries can be directed to the corresponding author.
Acknowledgments
During the preparation of this manuscript, ChatGPT (GPT-6.1 Sol, Max reasoning level; OpenAI; accessed on 11 October 2026) was used to translate the authors’ Polish manuscript into English and assist with language editing and formatting. The authors take full responsibility for the content of this publication.
Conflicts of Interest
The authors declare no conflicts of interest.
References
- Yu, H.; Zhang, H.; Zhang, C.; Wang, R.; Liu, S.; Du, R.; Sun, W. Advances in treatment technologies for silver-containing wastewater. Chem. Eng. J. 2024, 496, 153689. [Google Scholar] [CrossRef] [Scilit]
- United States Environmental Protection Agency. Photographic Processing Effluent Guidelines (40 CFR Part 459). Available online: https://www.epa.gov/eg/photographic-processing-effluent-guidelines (accessed on 22 September 2026).
- European Commission. Commission Decision 2014/955/EU of 18 December 2014 Amending Decision 2000/532/EC on the List of Waste Pursuant to Directive 2008/98/EC of the European Parliament and of the Council. 2014. Available online: https://eur-lex.europa.eu/eli/dec/2014/955/oj/eng (accessed on 22 September 2026).
- European Parliament and Council of the European Union. Directive (EU) 2024/3019 of the European Parliament and of the Council of 27 November 2024 Concerning Urban Wastewater Treatment (Recast). 2024. Available online: https://eur-lex.europa.eu/eli/dir/2024/3019/oj/eng (accessed on 22 September 2026).
- Secretariat of the Basel Convention. Basel Convention on the Control of Transboundary Movements of Hazardous Wastes and Their Disposal: Text and Annexes; United Nations Environment Programme: Geneva, Switzerland, 2014; Available online: https://www.basel.int/portals/4/basel%20convention/docs/text/baselconventiontext-e.pdf (accessed on 22 September 2026).
- Mikhailov, O.V. Gelatin Matrix as Functional Biomaterial for Immobilization of Nanoparticles of Metal-Containing Compounds. J. Funct. Biomater. 2023, 14, 92. [Google Scholar] [CrossRef] [Scilit]
- United States Environmental Protection Agency. Development Document for Interim Final Effluent Limitations Guidelines and Proposed New Source Performance Standards for the Photographic Processing Subcategory of the Photographic Point Source Category; U.S. EPA: Washington, DC, USA, 1976. Available online: https://www.epa.gov/sites/default/files/2015-11/documents/photographic-eg_dd_1976.pdf (accessed on 22 September 2026).
- Pavlostathis, S.G.; Morrison, D. Response of continuous-flow activated sludge reactors to photoprocessing wastewaters. Water Res. 1994, 28, 269–276. [Google Scholar] [CrossRef] [Scilit]
- Wojnárovits, L.; Homlok, R.; Kovács, K.; Tegze, A.; Takács, E. Wastewater Characterization: Chemical Oxygen Demand or Total Organic Carbon Content Measurement? Molecules 2024, 29, 405. [Google Scholar] [CrossRef] [Scilit]
- Zhang, X.; Linghu, S.; Chen, Z.; Gu, H.; Chen, X.; Wei, X.; Hu, X.; Yang, Y.; Gao, Y. Bacterial diversity evolution process based on physicochemical characteristics of sludge treating hydroquinone during acclimation. Environ. Sci. Pollut. Res. 2022, 29, 31686–31699. [Google Scholar] [CrossRef] [Scilit]
- Pavlostathis, S.G.; Maeng, S.K. Fate and effect of silver on the anaerobic digestion process. Water Res. 2000, 34, 3957–3966. [Google Scholar] [CrossRef] [Scilit]
- Elliott, J.A.K.; Krohn, C.; Ball, A.S. Source-Separated Industrial Wastewater Is a Candidate for Biogas Production through Anaerobic Digestion. Fermentation 2024, 10, 165. [Google Scholar] [CrossRef] [Scilit]
- Rong, C.; Wang, T.; Luo, Z.; Li, Y.Y. Achieving low-carbon municipal wastewater treatment by anaerobic membrane bioreactor at seasonal temperatures: A pilot scale investigation on reducing sludge yield and greenhouse gas emissions. Chem. Eng. J. 2023, 463, 142415. [Google Scholar] [CrossRef] [Scilit]
- Guo, G.; Zhou, S.; Chen, Y.; Qin, Y.; Huang, X.; Li, Y.Y. Enhanced methanogenic degradation and membrane fouling associated with protein-EPS by extending sludge retention time in a high-solid anaerobic membrane bioreactor treating concentrated organic sludge. Water Res. 2024, 248, 120879. [Google Scholar] [CrossRef] [Scilit]
- Zhang, G.; Chen, W.; Dou, M.; Su, D.; Zhang, J.; Zhao, Z. Application of iron oxides modified volcanic rock in continuous phenol wastewater anaerobic treatment: Performance and underlying mechanisms. Renew. Energy 2023, 217, 119214. [Google Scholar] [CrossRef] [Scilit]
- Mitov, M.; Chorbadzhiyska, E.; Bardarov, I.; Kostov, K.L.; Hubenova, Y. Silver recovery by microbial electrochemical snorkel and microbial fuel cell. Electrochim. Acta 2022, 408, 139941. [Google Scholar] [CrossRef] [Scilit]
- Shao, H.; Li, X.; Zhang, J.; Zhao, X. Peroxymonosulfate enhanced photoelectrocatalytic oxidation of organic contaminants and simultaneously cathodic recycling of silver. J. Environ. Sci. 2022, 120, 74–83. [Google Scholar] [CrossRef] [Scilit]
- Pethkar, A.V.; Paknikar, K.M. Thiosulfate biodegradation–silver biosorption process for the treatment of photofilm processing wastewater. Process Biochem. 2003, 38, 855–860. [Google Scholar] [CrossRef] [Scilit]
- Holliger, C.; Alves, M.; Andrade, D.; Angelidaki, I.; Astals, S.; Baier, U.; Bougrier, C.; Buffière, P.; Carballa, M.; de Wilde, V.; et al. Towards a standardization of biomethane potential tests. Water Sci. Technol. 2016, 74, 2515–2522. [Google Scholar] [CrossRef] [Scilit]
- BPC Instruments AB. AMPTS II & AMPTS II Light: Automatic Methane Potential Test System. Operation and Maintenance Manual; BPC Instruments AB: Lund, Sweden, 2022; Available online: https://bpcinstruments.com/support/bpc-academy/ (accessed on 25 October 2026).
- Dębowski, M.; Kazimierowicz, J.; Ignaciuk, A.; Mlonek, S.; Zieliński, M. Application of Recycled Filling to Improve the Purification Performance of Confectionery Wastewater in a Vertical Anaerobic Labyrinth Flow Bioreactor. Energies 2024, 17, 2551. [Google Scholar] [CrossRef] [Scilit]
- Zieliński, M.; Dębowski, M.; Kazimierowicz, J. Performance of an Innovative Low-Cost Recycled Filling (LCRF) in Anaerobic Treatment of Dairy Effluent—A Pilot-Scale Study. Materials 2022, 15, 7815. [Google Scholar] [CrossRef] [Scilit]
- Hach Company. Water Analysis Handbook. Available online: https://www.hach.com/resources/water-analysis-handbook (accessed on 22 September 2026).
- ISO 8245:1999; Water Quality—Guidelines for the Determination of Total Organic Carbon (TOC) and Dissolved Organic Carbon (DOC). International Organization for Standardization (ISO): Geneva, Switzerland, 1999. Available online: https://www.iso.org/standard/29920.html (accessed on 22 September 2026).
- Liu, X.; André, L.; Mercier-Huat, M.; Grosmaître, J.M.; Pauss, A.; Ribeiro, T. Accurate Estimation of Bicarbonate and Acetic Acid Concentrations with Wider Ranges in Anaerobic Media Using Classical FOS/TAC Titration Method. Appl. Sci. 2021, 11, 11843. [Google Scholar] [CrossRef] [Scilit]
- American Public Health Association; American Water Works Association; Water Environment Federation. Standard Methods for the Examination of Water and Wastewater, 24th ed.; APHA Press: Washington, DC, USA, 2023. [Google Scholar]
- BÜCHI Labortechnik AG. Extraction System B-811: Operation Manual, Version H; BÜCHI Labortechnik AG: Flawil, Switzerland, 2016; Available online: https://www.manualslib.com/manual/1472241/Buchi-B-811.html (accessed on 22 September 2026).
- Food and Agriculture Organization of the United Nations. Food Energy—Methods of Analysis and Conversion Factors; FAO Food and Nutrition Paper 77; FAO: Rome, Italy, 2003; Available online: https://www.fao.org/uploads/media/FAO_2003_Food_Energy_02.pdf (accessed on 22 September 2026).
- Amann, R.I.; Krumholz, L.; Stahl, D.A. Fluorescent-oligonucleotide probing of whole cells for determinative, phylogenetic, and environmental studies in microbiology. J. Bacteriol. 1990, 172, 762–770. [Google Scholar] [CrossRef] [Scilit]
- Raskin, L.; Stromley, J.M.; Rittmann, B.E.; Stahl, D.A. Group-specific 16S rRNA hybridization probes to describe natural communities of methanogens. Appl. Environ. Microbiol. 1994, 60, 1232–1240. [Google Scholar] [CrossRef] [Scilit]
- Crocetti, G.; Murto, M.; Björnsson, L. An update and optimisation of oligonucleotide probes targeting methanogenic Archaea for use in fluorescence in situ hybridisation (FISH). J. Microbiol. Methods 2006, 65, 194–201. [Google Scholar] [CrossRef] [Scilit]
- Alex Kibangou, V.; Lilly, M.; Busani Mpofu, A.; de Jonge, N.; Oyekola, O.O.; Jean Welz, P. Sulfate-reducing and methanogenic microbial community responses during anaerobic digestion of tannery effluent. Bioresour. Technol. 2022, 347, 126308. [Google Scholar] [CrossRef] [Scilit]
- Berzal de Frutos, O.; Götze, M.; Pidou, M.; Bajón Fernández, Y. Anaerobic Co-Digestion of Sewage Sludge and Trade Wastes: Beneficial and Inhibitory Effects of Individual Constituents. Processes 2023, 11, 519. [Google Scholar] [CrossRef] [Scilit]
- Tarapata, J.; Zieliński, M.; Zulewska, J. Valorization of Dairy By-Products: Efficiency of Energy Production from Biogas Obtained in Anaerobic Digestion of Ultrafiltration Permeates. Energies 2022, 15, 6829. [Google Scholar] [CrossRef] [Scilit]
- Kazimierowicz, J.; Zieliński, M.; Bartkowska, I.; Dębowski, M. Effect of Acid Whey Pretreatment Using Ultrasonic Disintegration on the Removal of Organic Compounds and Anaerobic Digestion Efficiency. Int. J. Environ. Res. Public Health 2022, 19, 11362. [Google Scholar] [CrossRef] [Scilit]
- Li, P.; Zhao, H.; Cheng, C.; Hou, T.; Shen, D.; Jiao, Y. A review on anaerobic co-digestion of sewage sludge with other organic wastes for methane production: Mechanism, process, improvement and industrial application. Biomass Bioenergy 2024, 185, 107241. [Google Scholar] [CrossRef] [Scilit]
- Dębowski, M.; Zieliński, M.; Kazimierowicz, J.; Nowicka, A.; Dudek, M. Optimisation of Biogas Production in the Co-Digestion of Pre-Hydrodynamically Cavitated Aerobic Granular Sludge with Waste Fats. Energies 2024, 17, 922. [Google Scholar] [CrossRef] [Scilit]
- Mateo, O.; Sanchis-Perucho, P.; Giménez, J.B.; Robles, Á.; Martí, N.; Serralta, J.; Seco, A. Coupling AnMBR, Primary Settling and Anaerobic Digestion to Improve Carbon Fate When Treating Sulfate-Rich Wastewater. Water 2023, 15, 3574. [Google Scholar] [CrossRef] [Scilit]
- Yilmaz, F.; Özbayram, E.G.; Perendeci, N.A.; Sahinkaya, E.; İnce, O. Performance evaluation and microbial dynamics of submerged anaerobic membrane bioreactors for municipal wastewater treatment. J. Water Process Eng. 2024, 59, 104935. [Google Scholar] [CrossRef] [Scilit]
- Abera, G.B.; Trømborg, E.; Solli, L.; Walter, J.M.; Wahid, R.; Govasmark, E.; Horn, S.J.; Aryal, N.; Feng, L. Biofilm application for anaerobic digestion: A systematic review and an industrial scale case. Biotechnol. Biofuels Bioprod. 2024, 17, 145. [Google Scholar] [CrossRef] [Scilit]
- Dębowski, M.; Zieliński, M.; Kisielewska, M.; Kazimierowicz, J. Evaluation of Anaerobic Digestion of Dairy Wastewater in an Innovative Multi-Section Horizontal Flow Reactor. Energies 2020, 13, 2392. [Google Scholar] [CrossRef] [Scilit]
- Chen, H.; Luo, Z.; Wei, Y.; Deng, Z.; Yang, E.; Wang, H.; Chen, J.; Sanjaya, E.H.; Liu, Z.; Wu, S. Complex inhibitions on anaerobic degradation of monosodium glutamate in wastewater under low COD/sulfate ratios. Int. Biodeterior. Biodegrad. 2023, 177, 105526. [Google Scholar] [CrossRef] [Scilit]
- Strotmann, U.; Heipieper, H.J.; Eberlein, C.; Mayer, P.; Birch, H.; Gartiser, S.; Pagga, U.; Daturpalli, S.; Battagliarin, G.; McDonough, K.; et al. Testing the biodegradability of difficult compounds: A future challenge for the OECD/ISO standardization. Appl. Microbiol. Biotechnol. 2026, 110, 122. [Google Scholar] [CrossRef] [Scilit]
- OECD. Test No. 311: Anaerobic Biodegradability of Organic Compounds in Digested Sludge: By Measurement of Gas Production; OECD Publishing: Paris, France, 2006. [Google Scholar] [CrossRef] [Scilit]
- ISO 11734:1995; Water Quality—Evaluation of the “Ultimate” Anaerobic Biodegradability of Organic Compounds in Digested Sludge—Method by Measurement of the Biogas Production. International Organization for Standardization (ISO): Geneva, Switzerland, 1995. Available online: https://www.iso.org/standard/19656.html (accessed on 22 September 2026).
- OECD. Test No. 302B: Inherent Biodegradability: Zahn–Wellens/EVPA Test; OECD Publishing: Paris, France, 1992. [Google Scholar] [CrossRef] [Scilit]
- ISO 9888:1999; Water Quality—Evaluation of Ultimate Aerobic Biodegradability of Organic Compounds in Aqueous Medium—Static Test (Zahn–Wellens Method). International Organization for Standardization (ISO): Geneva, Switzerland, 1999. Available online: https://www.iso.org/standard/28121.html (accessed on 30 September 2026).
- Strotmann, U.; Durand, M.-J.; Thouand, G.; Eberlein, C.; Heipieper, H.J.; Gartiser, S.; Pagga, U. Microbiological toxicity tests using standardized ISO/OECD methods—Current state and outlook. Appl. Microbiol. Biotechnol. 2024, 108, 454. [Google Scholar] [CrossRef] [Scilit]
- OECD. Test No. 224: Determination of the Inhibition of the Activity of Anaerobic Bacteria: Reduction of Gas Production from Anaerobically Digesting (Sewage) Sludge; OECD Publishing: Paris, France, 2007. [Google Scholar] [CrossRef] [Scilit]
- ISO 13641-1:2003; Water Quality—Determination of Inhibition of Gas Production of Anaerobic Bacteria—Part 1: General Test. International Organization for Standardization (ISO): Geneva, Switzerland, 2003. Available online: https://www.iso.org/standard/36232.html (accessed on 30 September 2026).
- OECD. Test No. 209: Activated Sludge, Respiration Inhibition Test (Carbon and Ammonium Oxidation); OECD Publishing: Paris, France, 2010. [Google Scholar] [CrossRef] [Scilit]
- ISO 11348-3:2007; Water Quality—Determination of the Inhibitory Effect of Water Samples on the Light Emission of Vibrio fischeri (Luminescent Bacteria Test)—Part 3: Method Using Freeze-Dried Bacteria. International Organization for Standardization (ISO): Geneva, Switzerland, 2007. Available online: https://www.iso.org/standard/40518.html (accessed on 30 September 2026).
- Pavlostathis, S.G.; Maeng, S.K. Aerobic biodegradation of a silver-bearing photoprocessing wastewater. Environ. Toxicol. Chem. 1998, 17, 617–624. [Google Scholar] [CrossRef] [Scilit]
- Manju, E.S.; Manu, B. Sequential anaerobic–aerobic treatment of paint wastewater: Performance and LC–MS pollutant transformation. ChemEngineering 2026, 10, 38. [Google Scholar] [CrossRef] [Scilit]

Disclaimer/Publisher’s Note: The statements, opinions and data contained in all publications are solely those of the individual author(s) and contributor(s) and not of MDPI and/or the editor(s). MDPI and/or the editor(s) disclaim responsibility for any injury to people or property resulting from any ideas, methods, instructions or products referred to in the content. |
© 2026 by the authors. Licensee MDPI, Basel, Switzerland. This article is an open access article distributed under the terms and conditions of the Creative Commons Attribution (CC BY) license.