


Abstract
The pile–caisson anchorage (PCA) is a hybrid anchorage foundation for suspension bridges, combining the advantages of both caisson anchorages and steel pipe piles. This paper investigates the displacement and mechanical responses of the PCA under the main cable tension. Three-dimensional finite element models of the conventional caisson anchorage and the proposed PCA were constructed in PLAXIS 3D for a comparative analysis. The mechanical responses of the piles within the PCA were analyzed in detail, including lateral displacements, axial forces, and bending moments. Furthermore, a parametric study was carried out to explore the key parameters affecting the performance of the PCA. The results show that both the conventional caisson anchorage and the PCA strictly satisfy the code-specified displacement limits, with the safety factors of both anchorage systems reaching 2.5, confirming the feasibility of the PCA. The piles within the PCA exhibit pronounced spatial non-uniformity in displacement and internal force distribution. Moreover, increasing the caisson height significantly enhances the PCA’s overall stability, whereas enlarging the pile diameter and extending the pile length improve its structural performance through increased flexural rigidity and deeper mobilized shaft resistance, respectively. These findings offer valuable insights and practical guidance for the design and structural optimization of suspension bridge anchorage foundations.
Keywords:
anchorage; caisson; steel pipe pile; displacement; mechanical response; numerical analysis 1. Introduction
Suspension bridges serve as vital transport corridors across seas and rivers to overcome geographical barriers, promoting regional integration and economic development. Notable examples include the Golden Gate Bridge [1], the Great Belt Bridge [2], the Xihoumen Bridge [3], and the Bosphorus Bridge [4]. Anchorage foundations are essential to the stability of suspension bridges as they counteract the main cable tension, and can be divided into tunnel-type and gravity-type anchorages [5,6]. Tunnel-type anchorages derive resistance from rock embedment and are more suitable for hard rock formations [7,8,9,10]. Gravity-type anchorages mobilize self-weight and base friction to resist the main cable tension, making them suitable for a broader range of geological conditions, from rock to soft soils, which can be further classified into spread foundations [11,12], caisson anchorages [13,14], and diaphragm wall anchorages [15,16,17].
Among the various anchorage types, caisson anchorages are widely adopted in thick, soft soil strata, owing to their superior structural rigidity and load-bearing capacity [18,19,20,21]. Nevertheless, as suspension bridge spans continue to expand, the main cable tension increases substantially. Consequently, traditional caisson anchorages require excessively large dimensions, leading to substantial consumption of materials, such as steel and concrete, and a steep rise in construction costs. Therefore, developing cost-effective and structurally efficient anchorage foundations has become paramount for advancing long-span suspension bridges. Combining piles with gravity anchorages to share the main cable tension has been studied. Wang et al. [22] reported that piles significantly enhance the ultimate bearing capacity of spread foundations through model tests and numerical simulations. Furthermore, the successful application of composite pile–diaphragm wall anchorages in the Longmen Bridge considerably improved construction efficiency, demonstrating their great potential for engineering applications [23]. In addition, the combination of steel pipe piles and spread foundations was successfully applied in the Vincent Thomas Bridge [24] and the New Carquinez Bridge [25].
Based on the aforementioned considerations, we propose the pile–caisson anchorage (PCA), a hybrid anchorage foundation for suspension bridges that combines the advantages of conventional caisson anchorages and steel pipe piles. The PCA shares structural similarities with the caisson composite-pile foundation (CCPF), with its core distinction lying in the caisson anchorage design and load-bearing characteristics. In practice, the CCPF is widely used in coastal and marine structures, including bridge piers, wharf platforms, breakwaters, and offshore energy infrastructure [26]. Zhang et al. [27] demonstrated that reducing the caisson height by connecting it to the underlying pile group can improve the lateral load response of the foundation. Numerous investigations have confirmed the outstanding performance of CCPFs, particularly in load-bearing capacity, resistance to shock and erosion, efficient load redistribution, and settlement control [28,29,30,31,32]. However, the CCPF and the PCA inherently differ in structural configuration, applied loads, and load transfer mechanisms, ultimately resulting in distinctly different displacement and mechanical responses of the two foundation types.
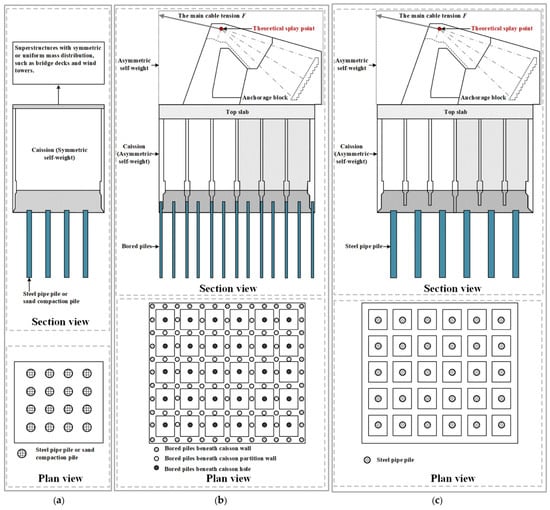
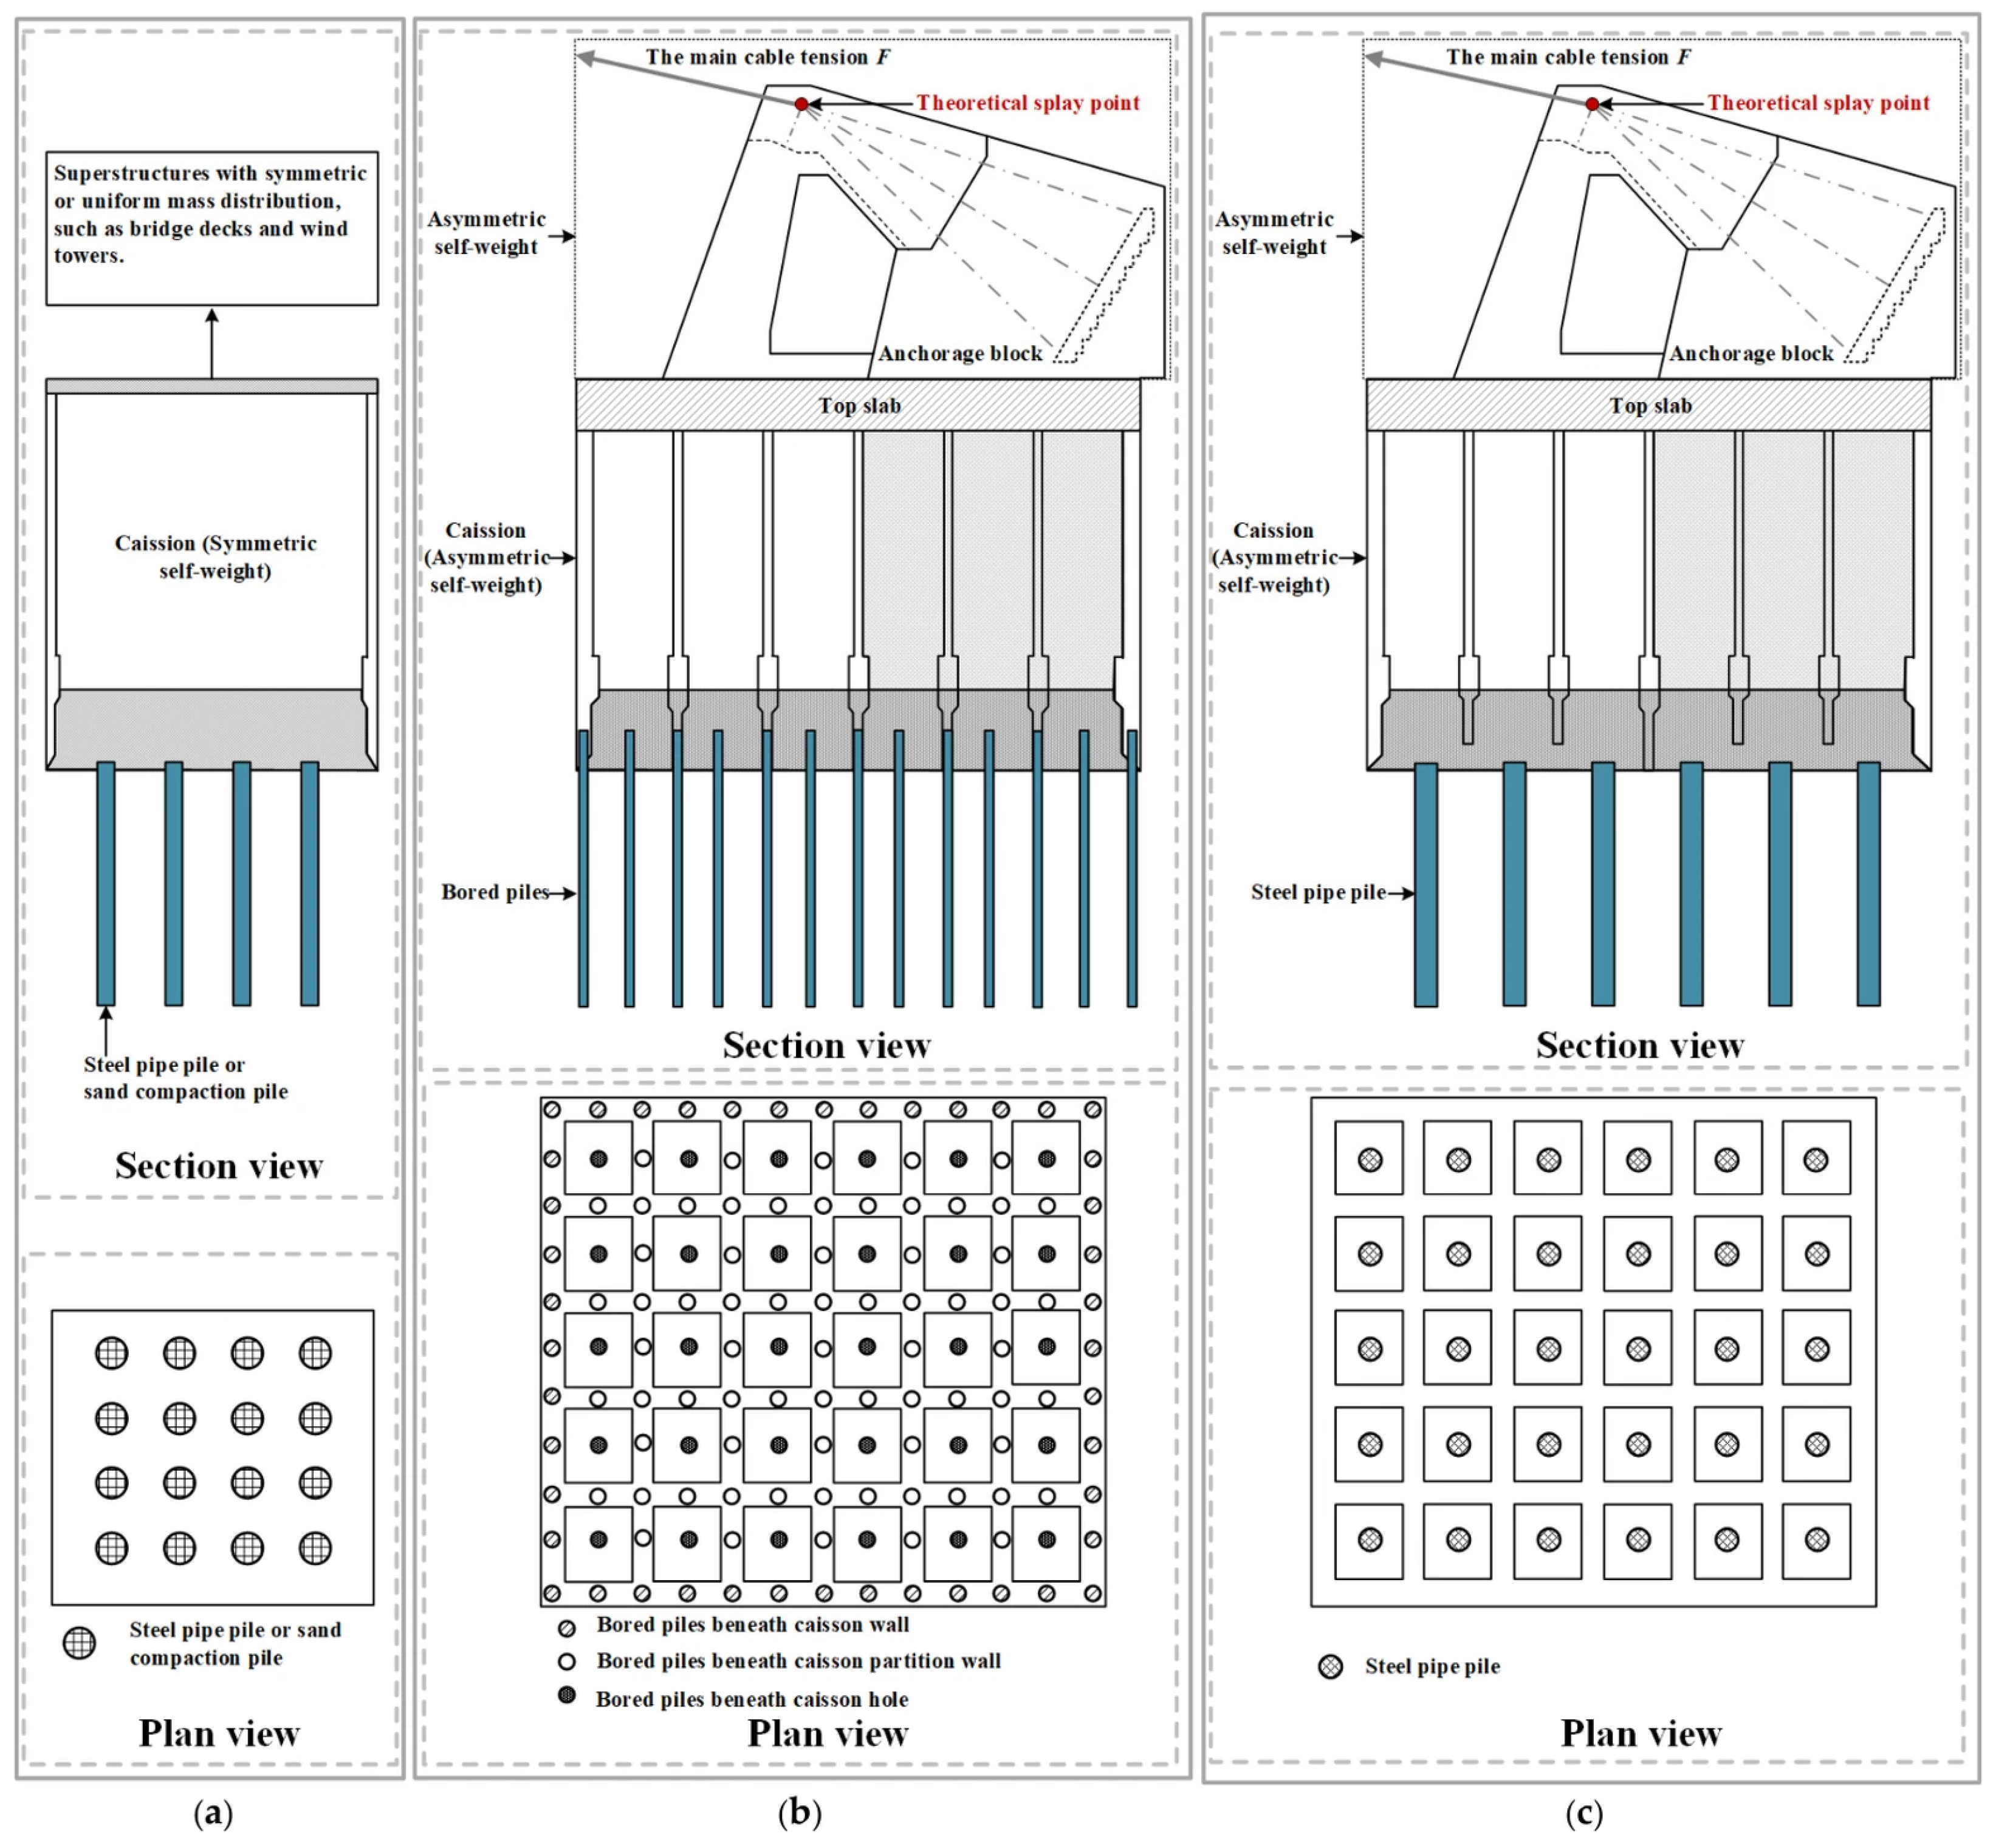
In our previous study, the caisson-bored pile composite anchorage (CBPCA) was proposed based on the north anchorage of the Nanjing Xianxin Road Bridge, demonstrating high bearing capacity. However, in the CBPCA, bored piles were distributed across the caisson walls, partition walls, and caisson holes, presenting significant constructability challenges in engineering practice [33,34,35,36]. To overcome this limitation, the proposed PCA in this study features steel pipe piles installed exclusively within the caisson holes, thereby substantially improving constructability. As illustrated in Figure 1, the CCPF, CBPCA, and PCA feature distinct structural layouts, a detailed comparison of which is summarized in Table 1. The primary advantages of the proposed PCA lie in its superior constructability and mechanical performance. In particular, compared with the CBPCA, restricting the steel pipe piles exclusively to the internal caisson holes eliminates the complexities of wall-penetrating pile installation to streamline site construction, while the integration of a reduced caisson height with internal steel pipe pile groups effectively restrains lateral and rotational displacements, thereby achieving high cost-efficiency. Therefore, using the south anchorage of the Oujiang North Estuary Bridge as a case study, this paper conducts three-dimensional numerical simulations of both the conventional caisson anchorage and the PCA to compare their displacement responses under the main cable tension. The mechanical responses of the steel pipe piles within the PCA are then examined in detail. Furthermore, a parametric study is carried out to systematically evaluate the effects of the caisson height, pile diameter, pile length, and pile wall thickness on the performance of the PCA.
Figure 1.
Structural layouts of the CCPF, CBPCA and PCA: (a) CCPF, (b) CBPCA, and (c) PCA.
Table 1.
Comparison among CCPF, CBPCA, and PCA.
2. Project Description
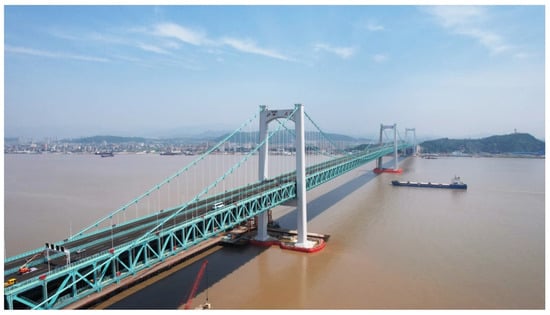
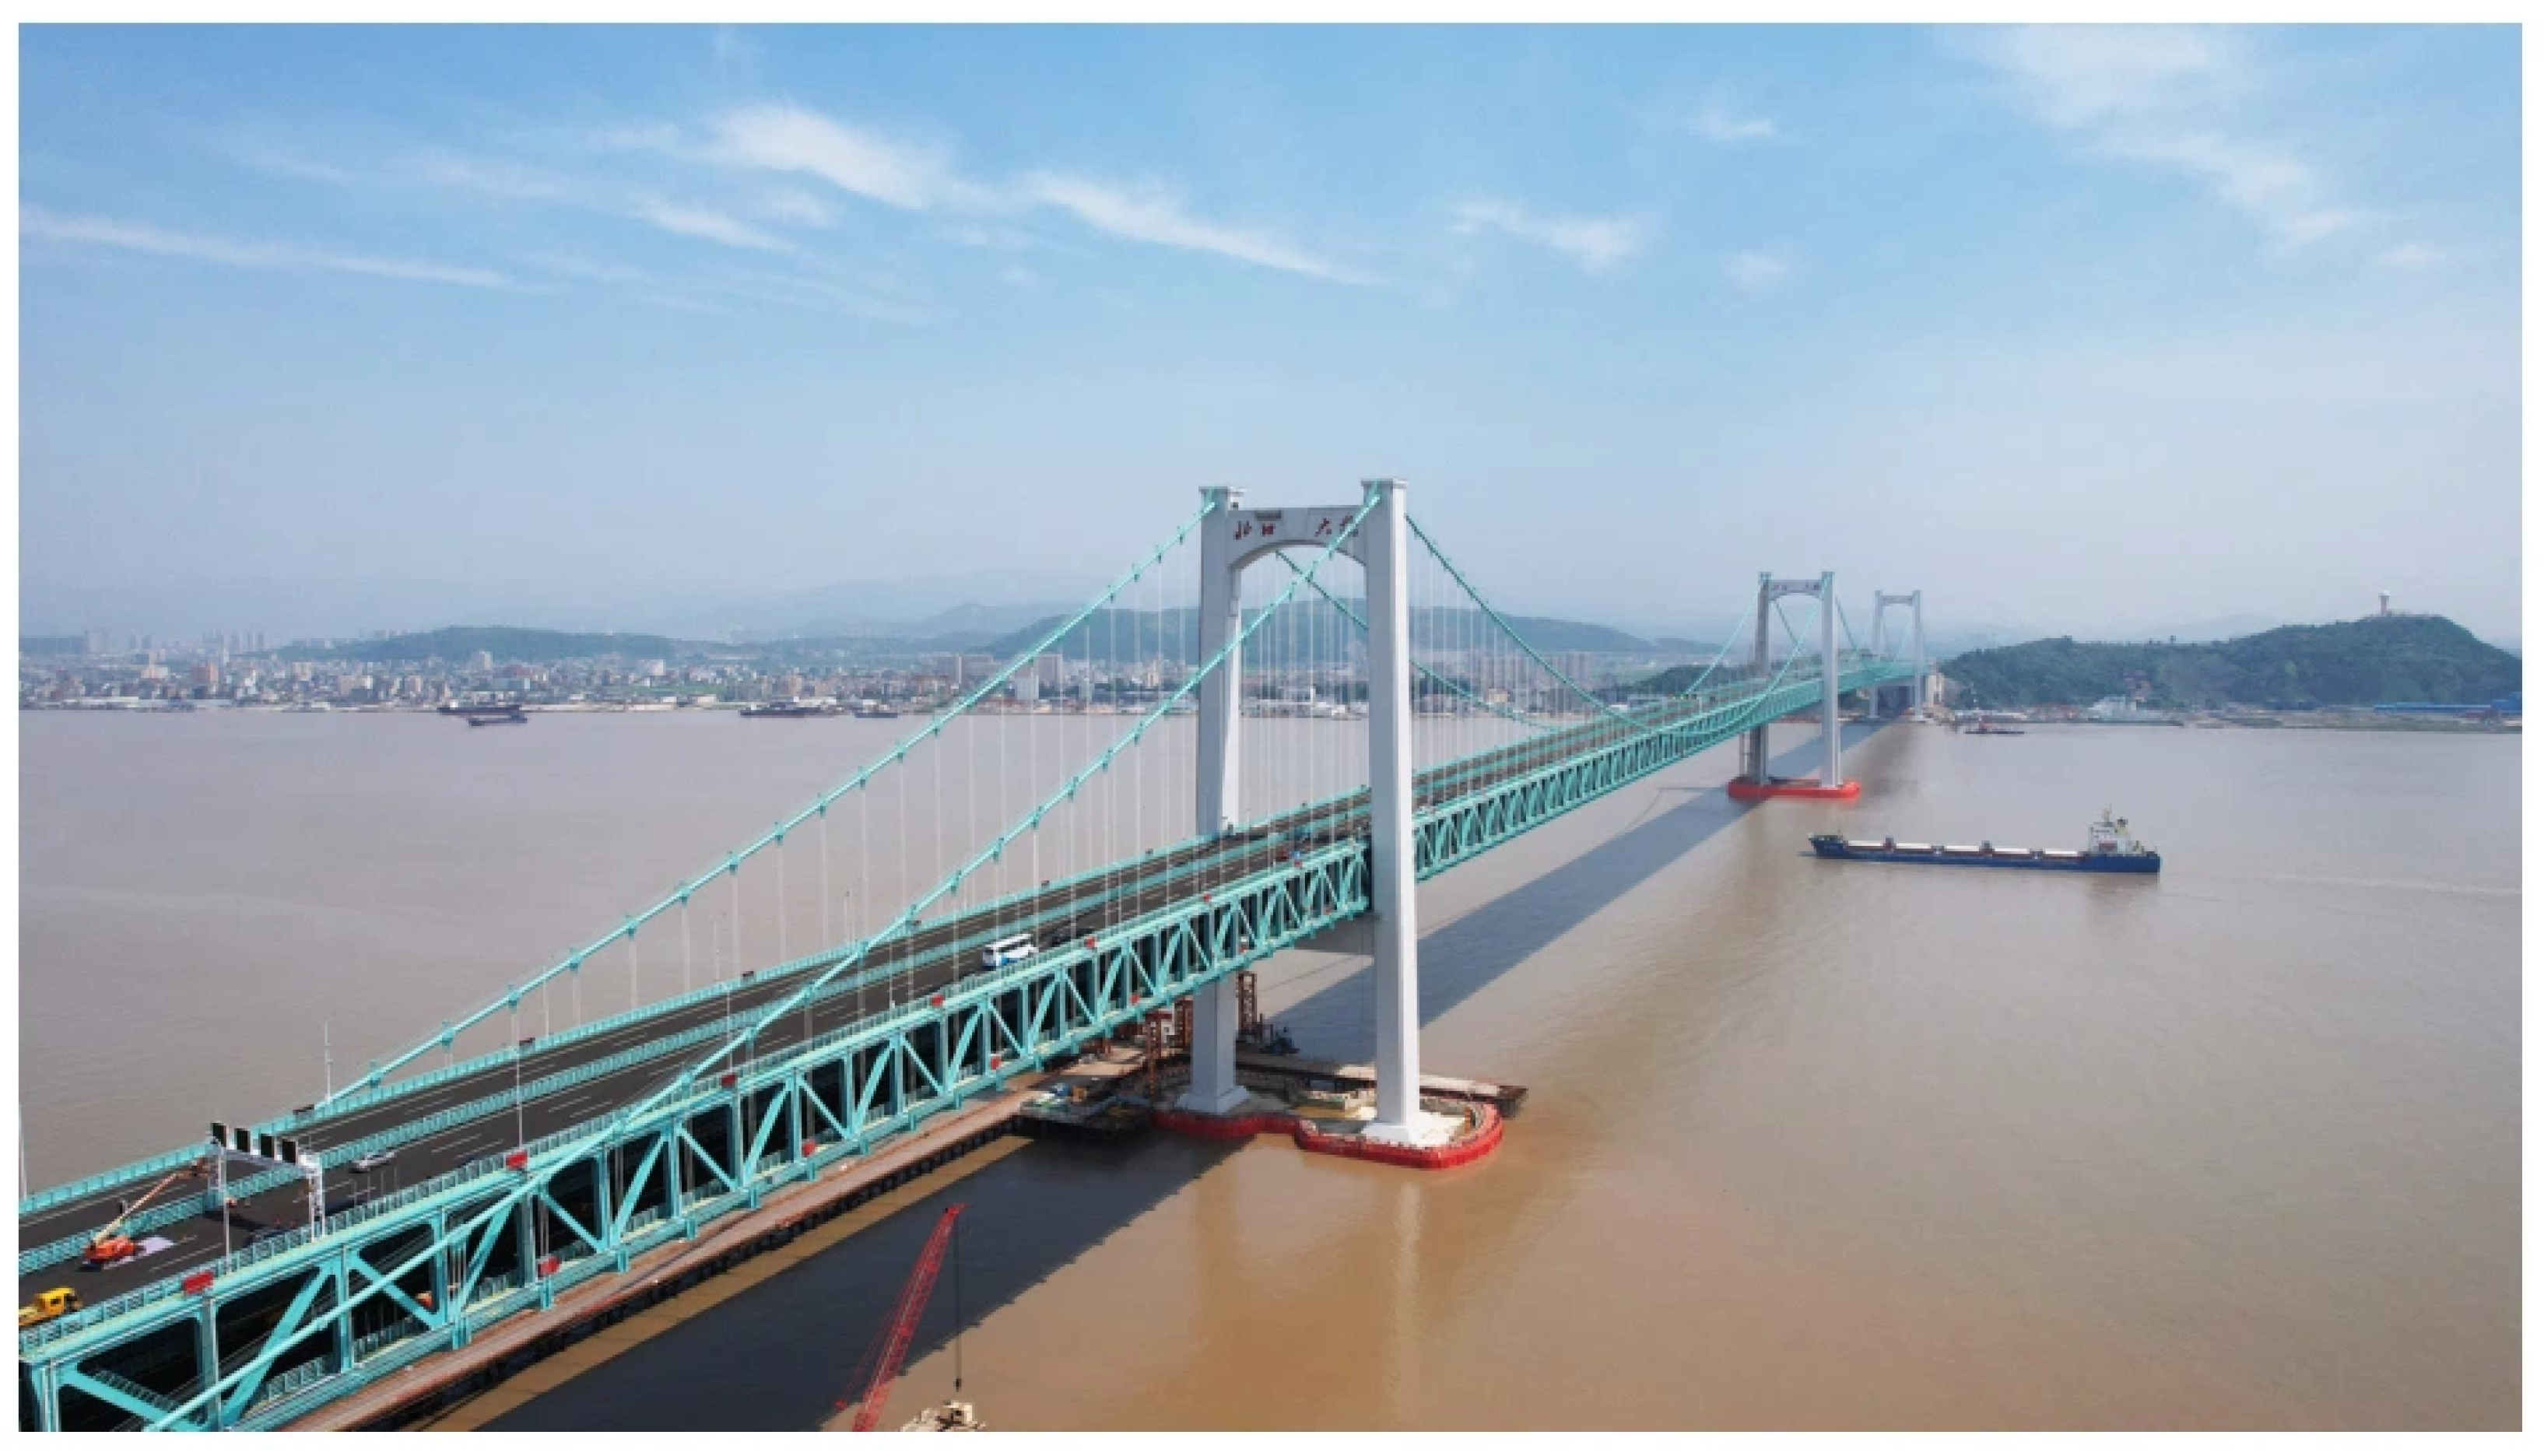
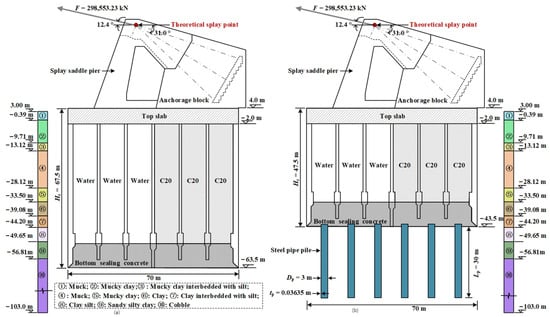
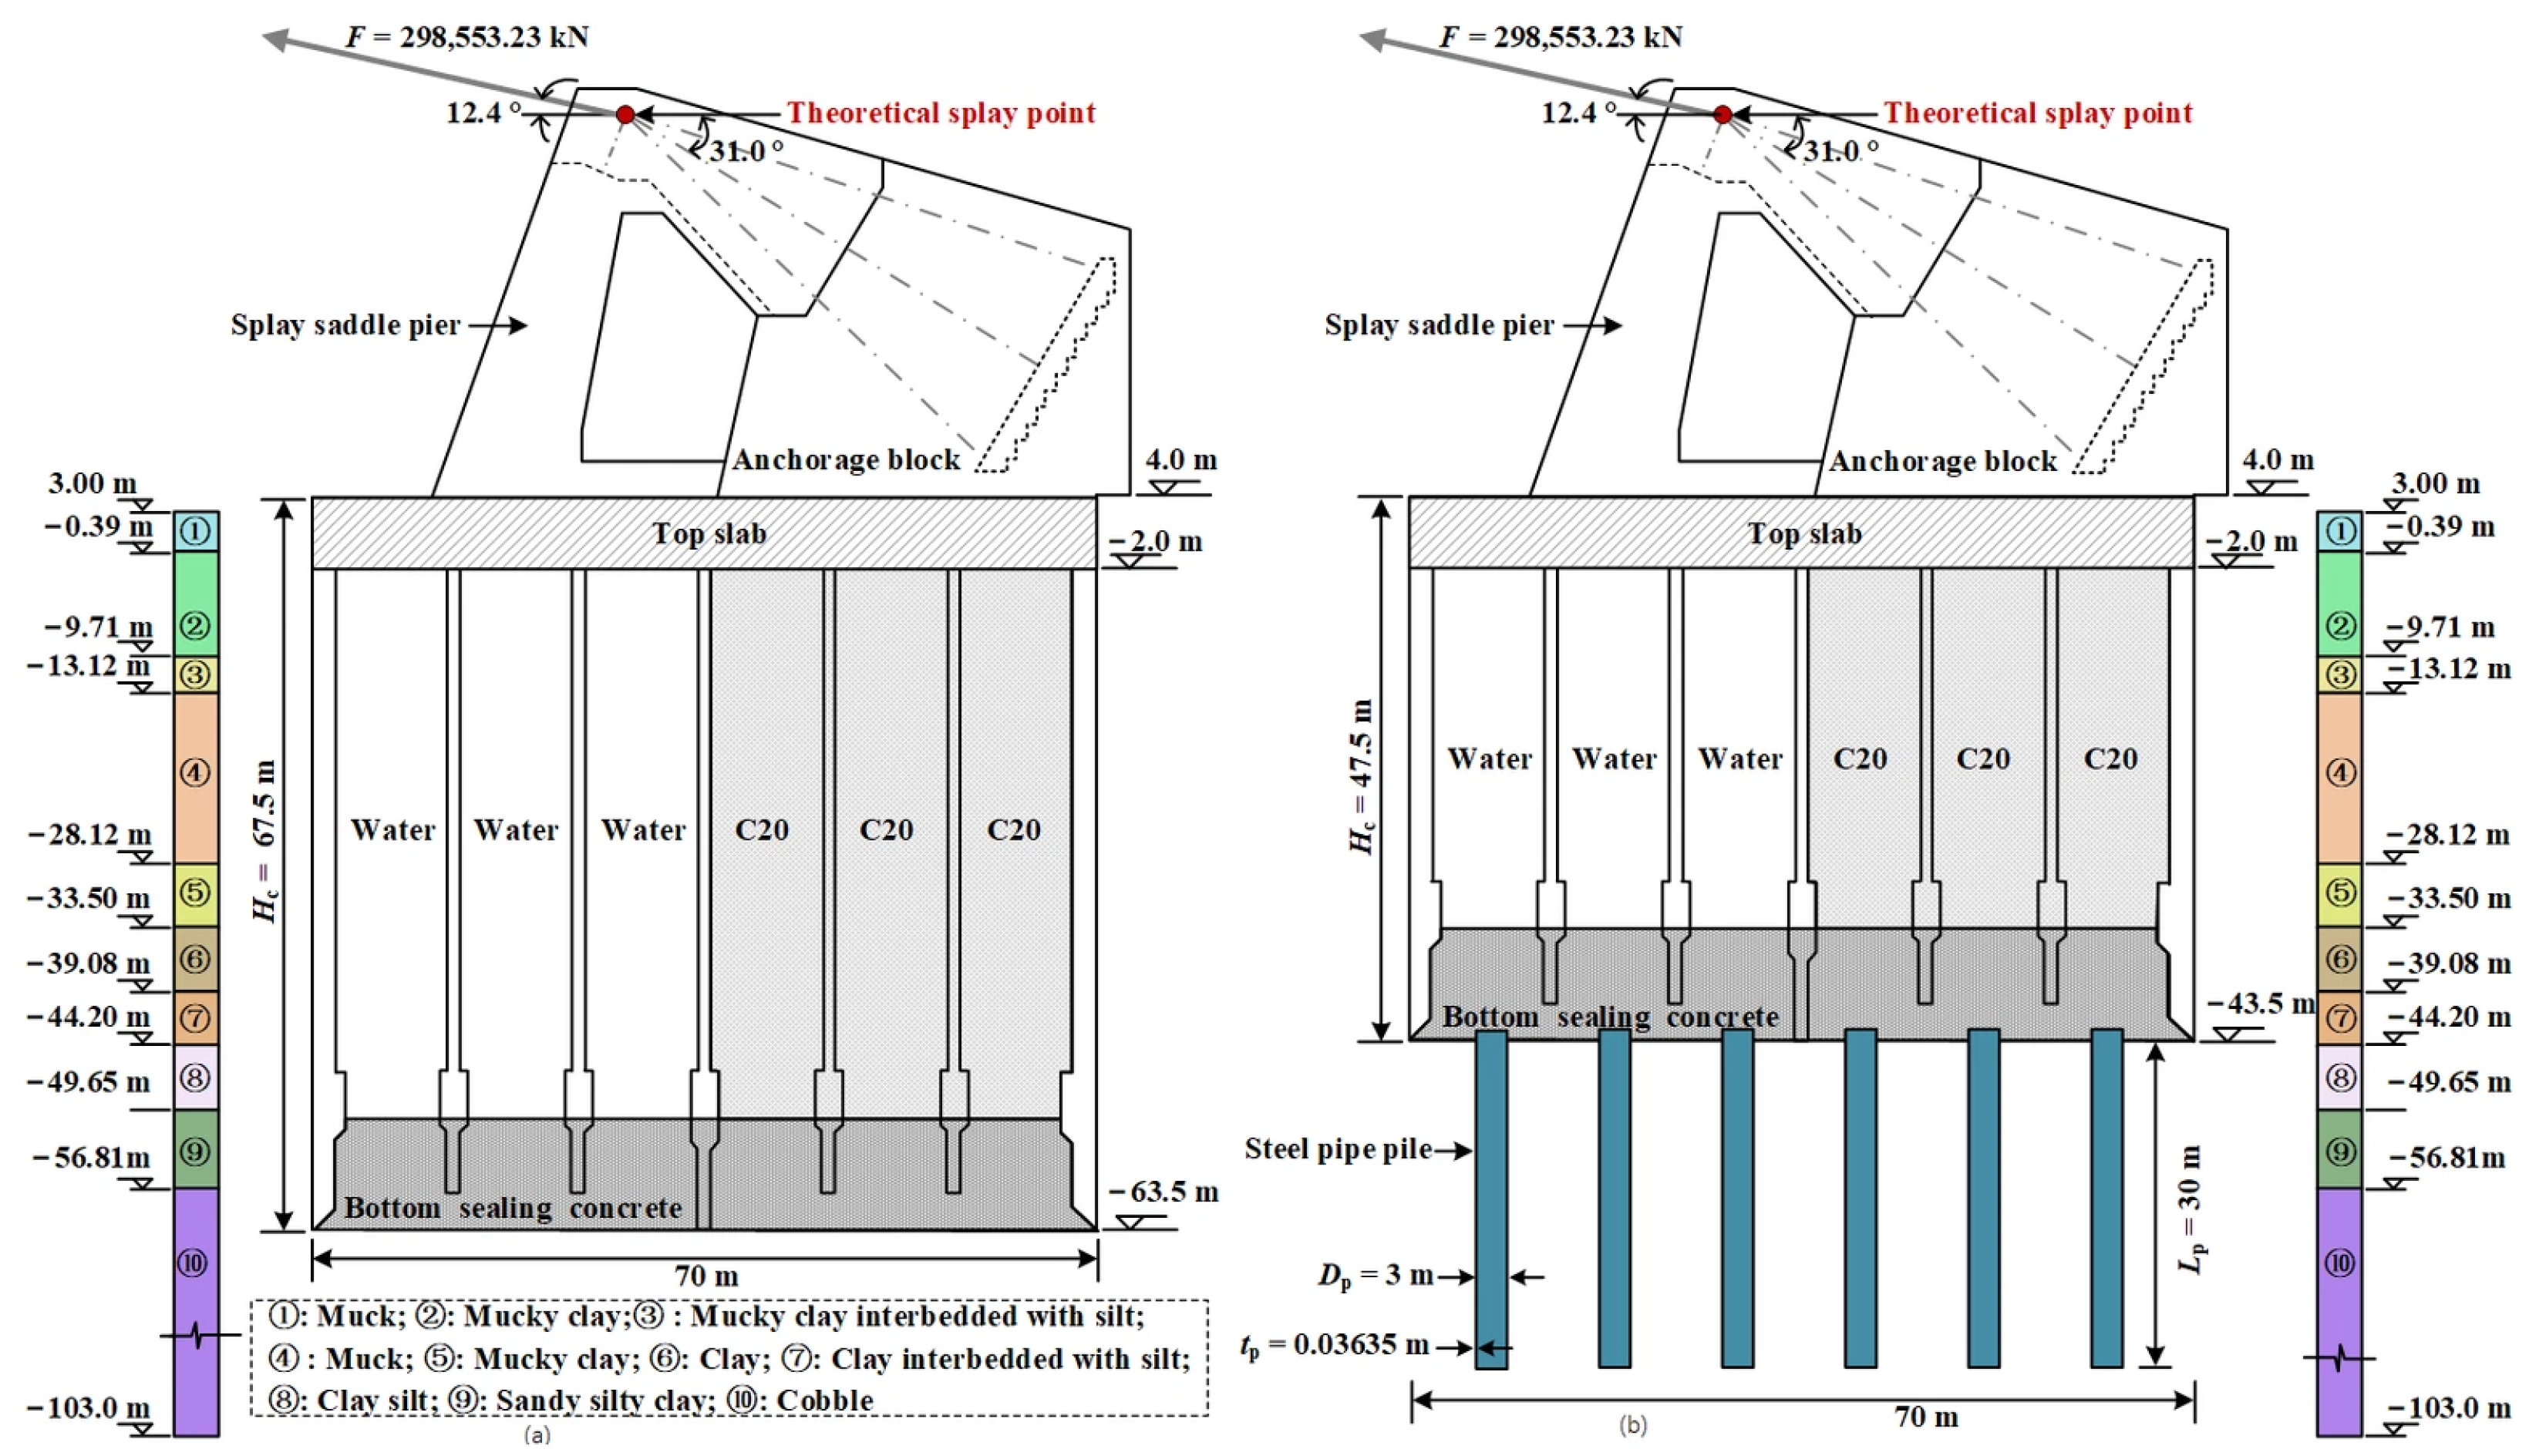
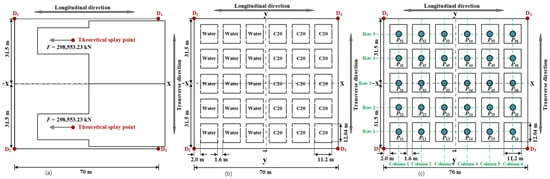
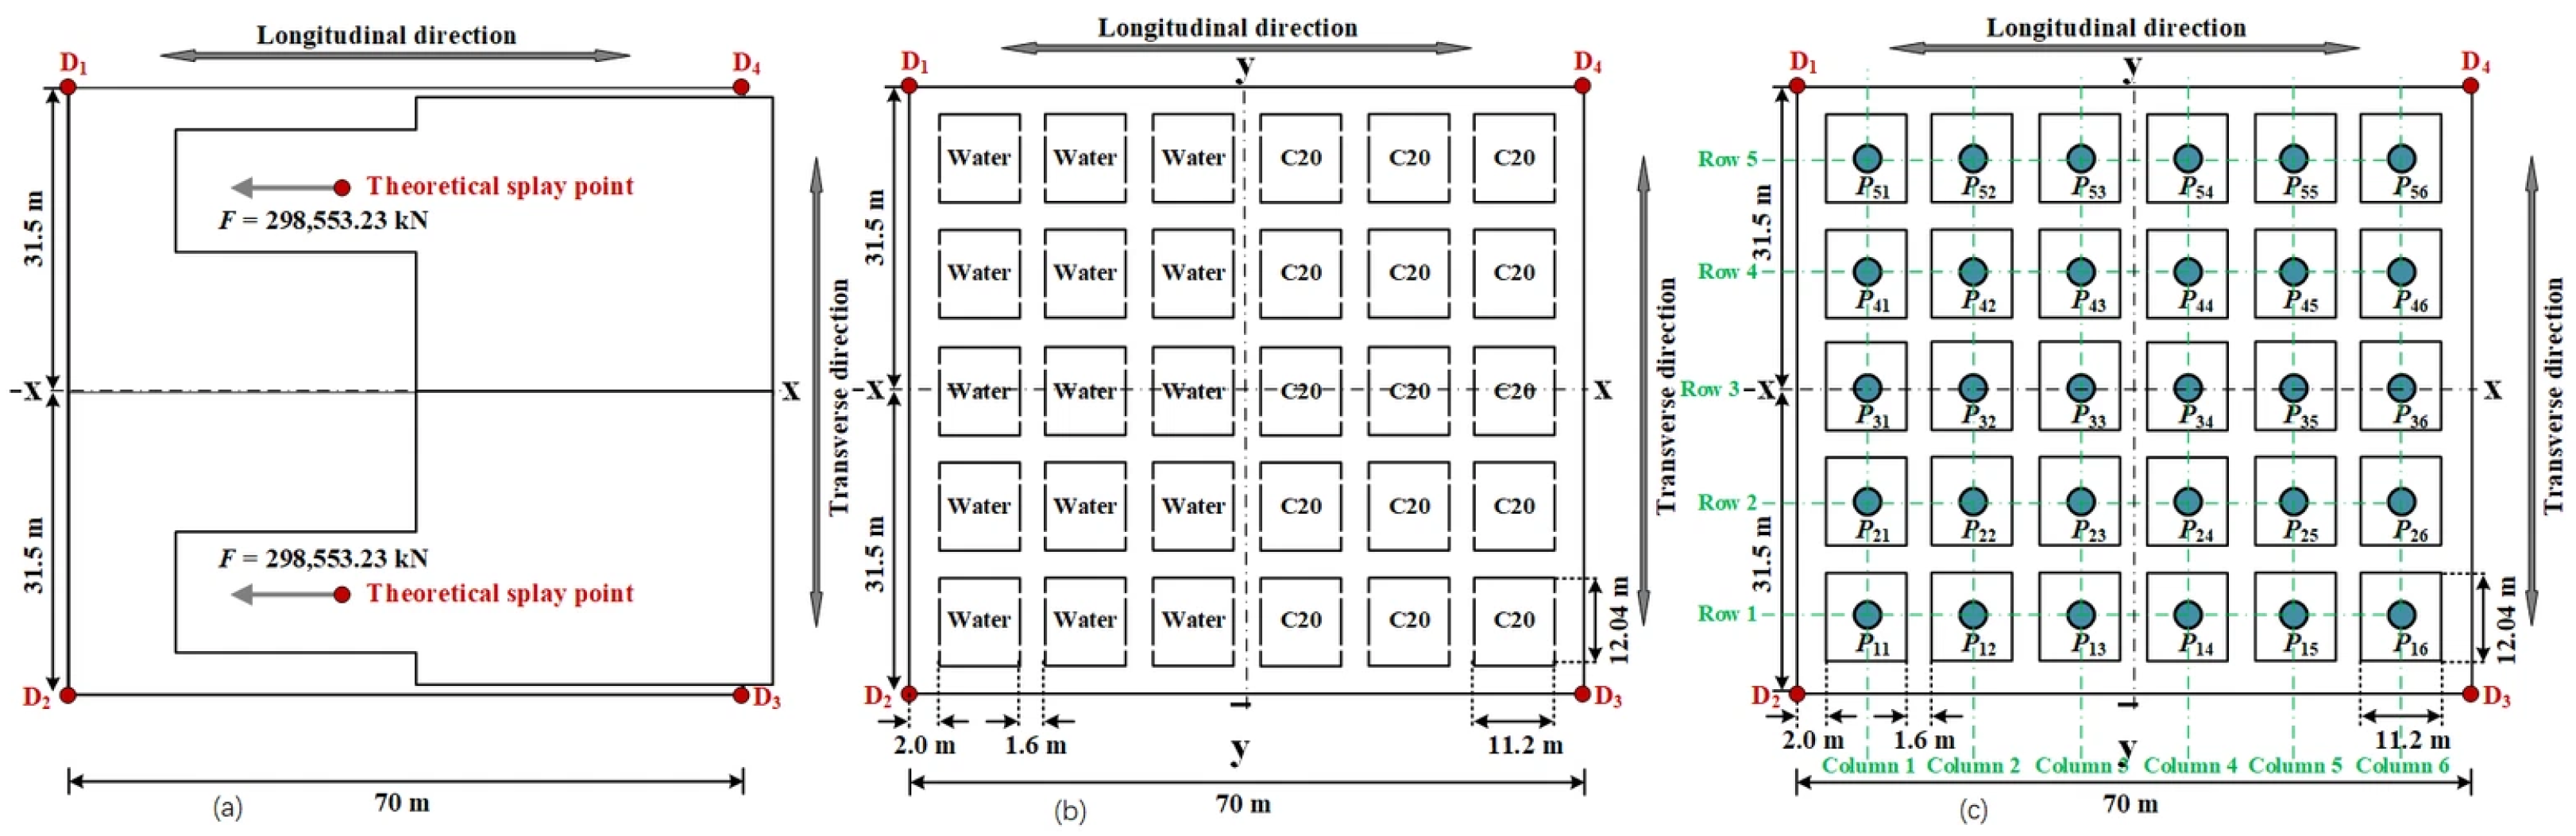
The Oujiang North Estuary Bridge (Figure 2), recognized as the world’s first three-tower, four-span continuous steel-truss suspension bridge, is located at the confluence of the Oujiang River and the East China Sea in Wenzhou City, Zhejiang Province, China. The bridge features a span arrangement of (215 m + 800 m + 800 m + 275 m). Figure 3a and Figure 4a show the south anchorage of the bridge, which adopts a caisson anchorage foundation, measuring 70.0 m × 63.0 m × 67.5 m [37]. The anchorage is symmetrical in the transverse direction of the bridge, and the tension in a single main cable is F = 298,553.23 kN. There are two main cables, and both cables and the anchorage foundations are symmetric about the x-direction (Figure 4). Four displacement monitoring points (D1, D2, D3, and D4) were installed on the top slab of the caisson anchorage during construction [38]. The PCA, as shown in Figure 3b and Figure 4b, proposed based on the original caisson anchorage, reduces the caisson height Hc from 67.5 m to 47.5 m and incorporates 30 steel pipe piles within the caisson holes. Each pile has an outer diameter of Dp = 3 m, a length of Lp = 30 m, and a wall thickness of tp = 0.03635 m.
Figure 2.
Oujiang North Estuary Bridge.
Figure 3.
Section view of anchorage foundations: (a) caisson anchorage and (b) PCA.
Figure 4.
Plan views of anchorage foundations: (a) top view showing loading conditions; (b) bottom view of caisson anchorage; and (c) bottom view of PCA.
3. Numerical Modelling Method
3.1. Three-Dimensional Finite Element Model
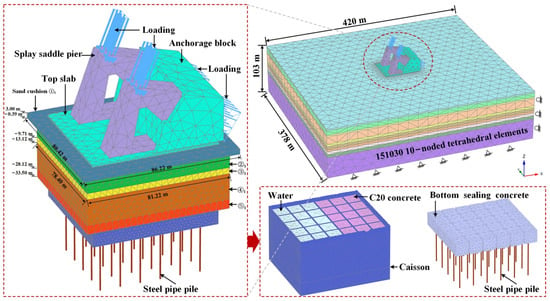
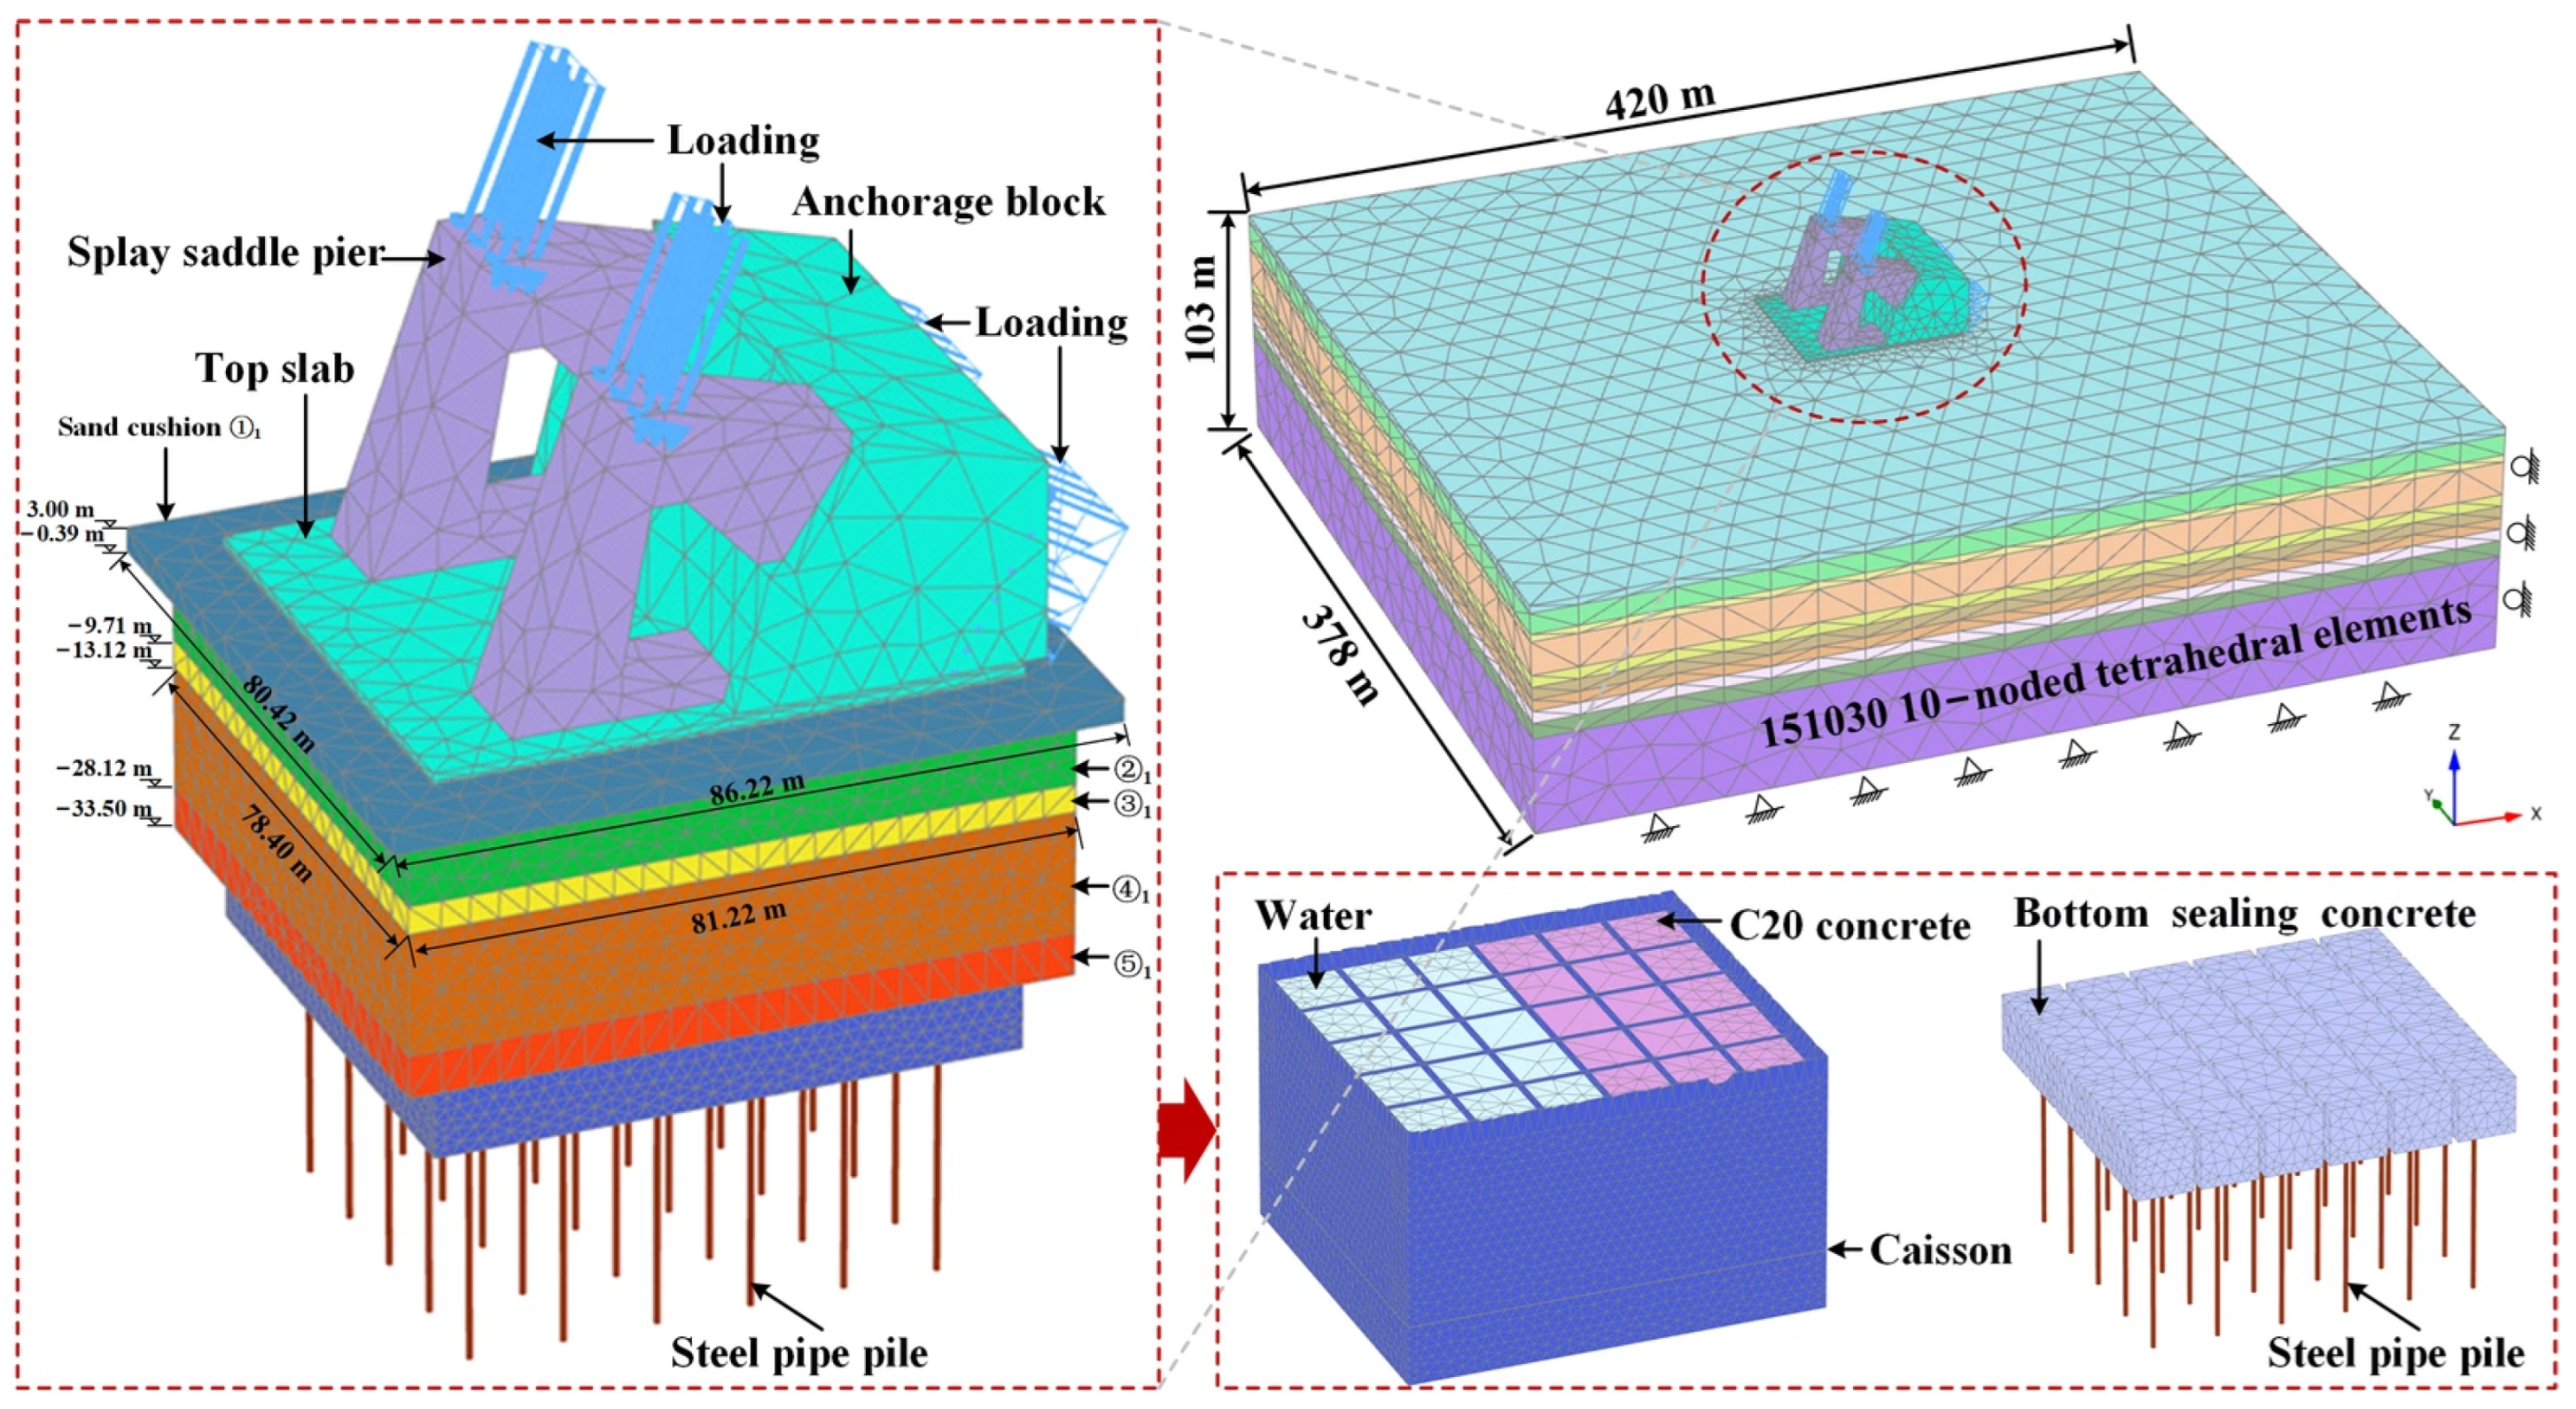
Three-dimensional finite element models of the caisson anchorage and the PCA were established in PLAXIS 3D (v2024, Bentley Systems, Exton, PA, USA). Figure 5 shows a typical three-dimensional finite element model of the PCA, which consists of 151,030 10-node tetrahedral elements. To minimize boundary effects, the computational domain was established with dimensions of 420 m × 378 m × 103 m, corresponding to 6 times the caisson length and width, with the bottom boundary located at least 5 pile diameters below the pile tip. The lateral boundaries were constrained to permit only vertical displacement, whereas the model’s bottom was fully fixed. An alternative domain size of 490 m × 441 m × 123.5 m (equivalent to 7 times the caisson length and width, with the bottom boundary located at least 10 pile diameters below the pile tip) was also evaluated to conduct the domain size sensitivity analysis. As summarized in Table 2, the results confirm that enlarging the model boundaries yields negligible variations (less than 2%) in the responses of the PCA. Solid elements were employed to model the structural components, including the caisson, splay saddle pier, anchorage block, top slab, bottom sealing concrete, C20 concrete, and water. The steel pipe piles within the PCA were simulated using embedded beam elements. Table 3 summarizes the properties assigned to the PCA. The only difference between the caisson anchorage and the PCA lies in caisson height and the absence of piles (see Figure 3), which is not detailed further.
Figure 5.
A typical three-dimensional finite element model of the PCA.
Table 2.
Comparison of computational responses under different domain sizes.
Table 3.
Properties of the PCA.
The numerical modelling procedure is summarized as follows: (1) The initial in situ stress conditions are established (K0-procedure); (2) The caisson, steel pipe piles, bottom sealing concrete, water, C20 concrete, top slab, splay saddle pier, and anchorage block are sequentially activated (modelled as “wished-in-place”); (3) The main cable tension is subsequently applied.
In this study, the structural components of the caisson anchorage are activated directly without simulating the caisson sinking process. This simplification is adopted to focus primarily on the displacement and mechanical responses of the PCA under the main cable tension. While this simplification ignores the transient soil disturbance induced by caisson sinking (such as wall-adjacent stress release and temporary skin-friction reduction), its potential calculation bias is well-bounded. Specifically, because the overall stability of the PCA is predominantly governed by the undisturbed base strata and deep passive resistance rather than side wall friction, neglecting these sinking dynamics yields a reliable and slightly conservative evaluation. Therefore, this simplified approach is well-suited and applicable for evaluating the overall stability of the PCA under the main cable tension, whereas the localized soil disturbance during caisson sinking warrants further exploration in future studies.
A mesh convergence evaluation was carried out to verify that the simulation results were insensitive to grid resolution. Four mesh schemes with increasing mesh density (Meshes M1 to M4) were established, and the main characteristics are detailed in Table 4. Although Meshes M3 and M4 produced closely matched predictions (with variations under 2.5%) regarding the theoretical splay point (TSP) displacements as well as the peak axial forces and bending moments along the pile shafts, Mesh M3 was significantly more computationally efficient. Therefore, Mesh M3 was employed in this study.
Table 4.
Characteristics of the evaluated mesh schemes.
3.2. Geotechnical Conditions
As shown in Figure 3, the geological profile consists of ten soil strata (①–⑩) that vary in thickness and geotechnical properties. The Hardening Soil (HS) model was employed to describe the constitutive behavior of the soil layers, and the corresponding parameters are presented in Table 5. Undrained behavior was specified for the soil models. Among these parameters, the unit weight (γ), void ratio (e), the compression modulus (Es), effective cohesion (c′), effective friction angle (φ′), unit shaft resistance (fs), and unit base resistance (fb) were reported by Chen [39]. The reference oedometric stiffness (), reference primary loading stiffness (), and reference unloading/reloading stiffness () can be calculated empirically from Es [40]. Soil layers ①, ②, ③, ④, and ⑤ exhibit poor engineering properties. After ground improvement via sand compaction piles, these layers are renamed as ①1, ②1, ③1, ④1, and ⑤1, respectively. The treated zone covers a plan area of 81.22 m × 78.40 m for soil layers ②1, ③1, ④1, and ⑤1, while the overlying sand cushion layer (①1) measures 86.22 m × 80.42 m (Figure 5). The caisson–soil interface strength is defined as a reduced fraction of the surrounding soil strength, controlled by the interface reduction factor (Rinter). In addition, the elevation of the groundwater level at the south anchorage site is 3.1 m.
Table 5.
Soil parameters.
Additionally, embedded beam elements in PLAXIS 3D circumvent the use of solid volume elements, thereby significantly enhancing computational efficiency. The pile heads are rigidly connected to the caisson base. Virtual interfaces are incorporated along the pile shaft and at the pile tip to characterize the pile-soil interaction, with the interface stiffness governed by the surrounding soil [41]. Furthermore, the shaft resistance (Tskin) and base resistance (Tbase) are given in Equations (1) and (2).
where fs is the unit shaft resistance; pp is the perimeter of the pile; fb is the unit base resistance; and Ab is the cross-sectional area of the pile base.
Tskin = fspp
Tbase = fb Ab
3.3. Loading Conditions
The main cable tension is categorized into 11 loading cases covering the construction stages from girder segment erection to deck pavement. There are two symmetrical main cables and the corresponding tension for a single main cable is presented in Table 6, with Loading Case 10 representing the maximum main cable tension (i.e., Fmax). Notably, the data in Table 6 were originally reported by Hu [38].
Table 6.
The tension in a single main cable under different loading cases.
3.4. Validation of the Numerical Method
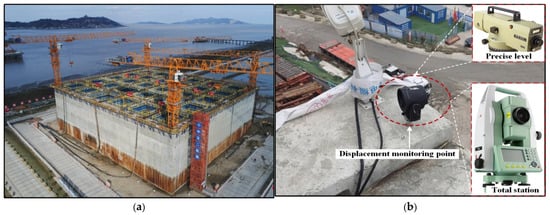
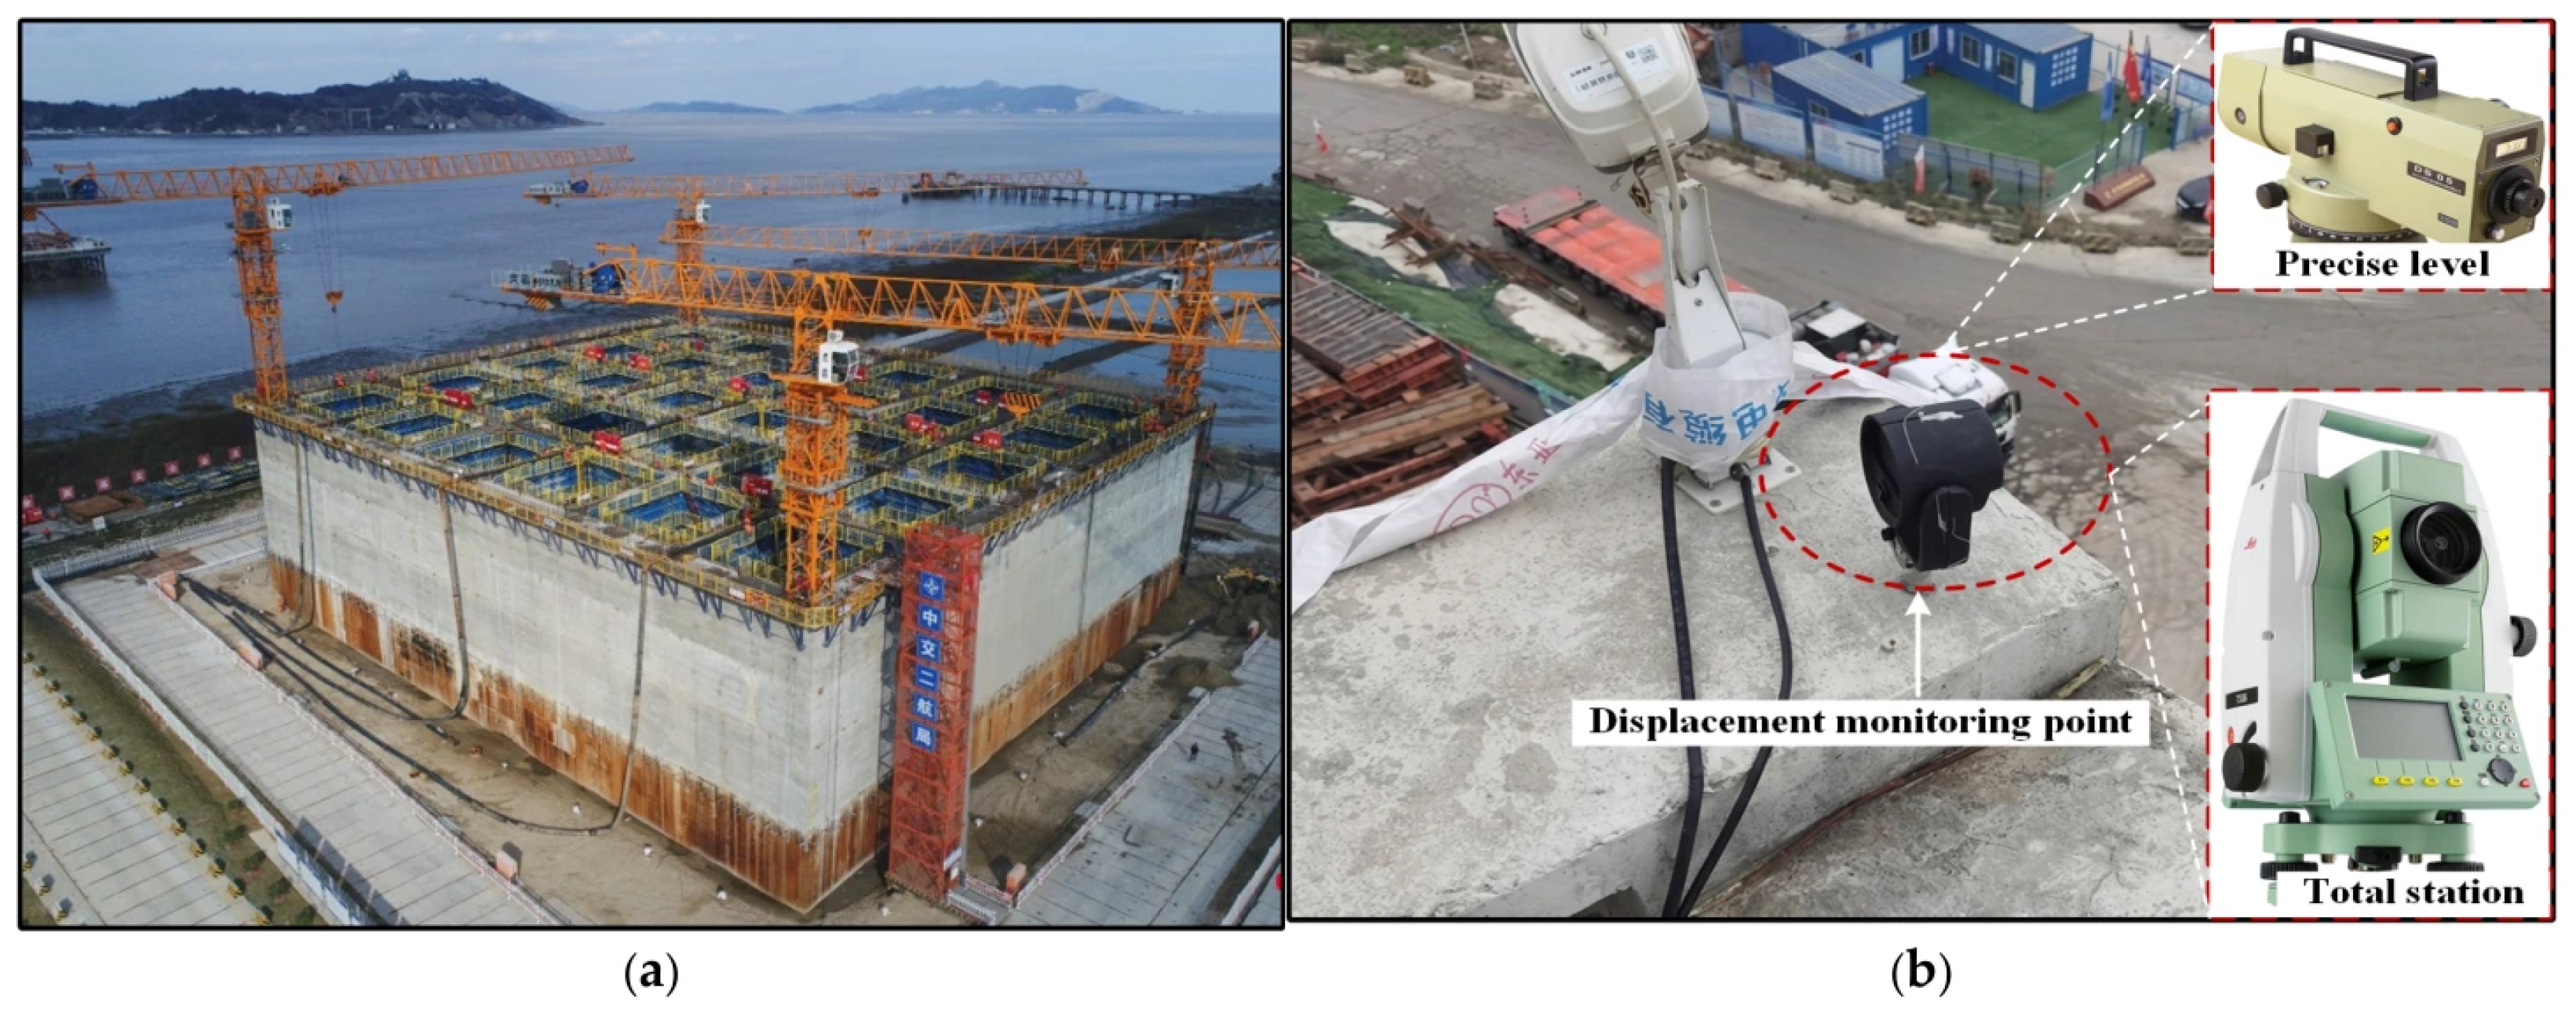
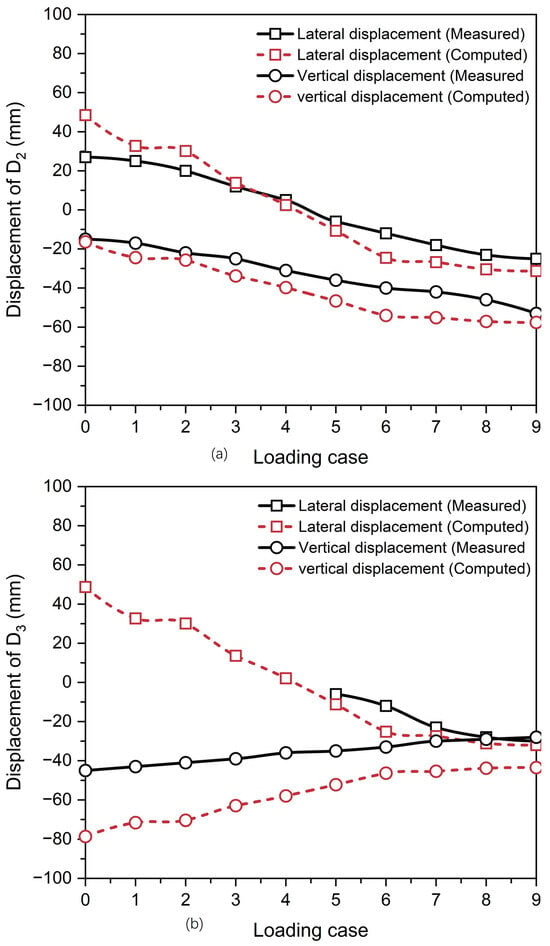
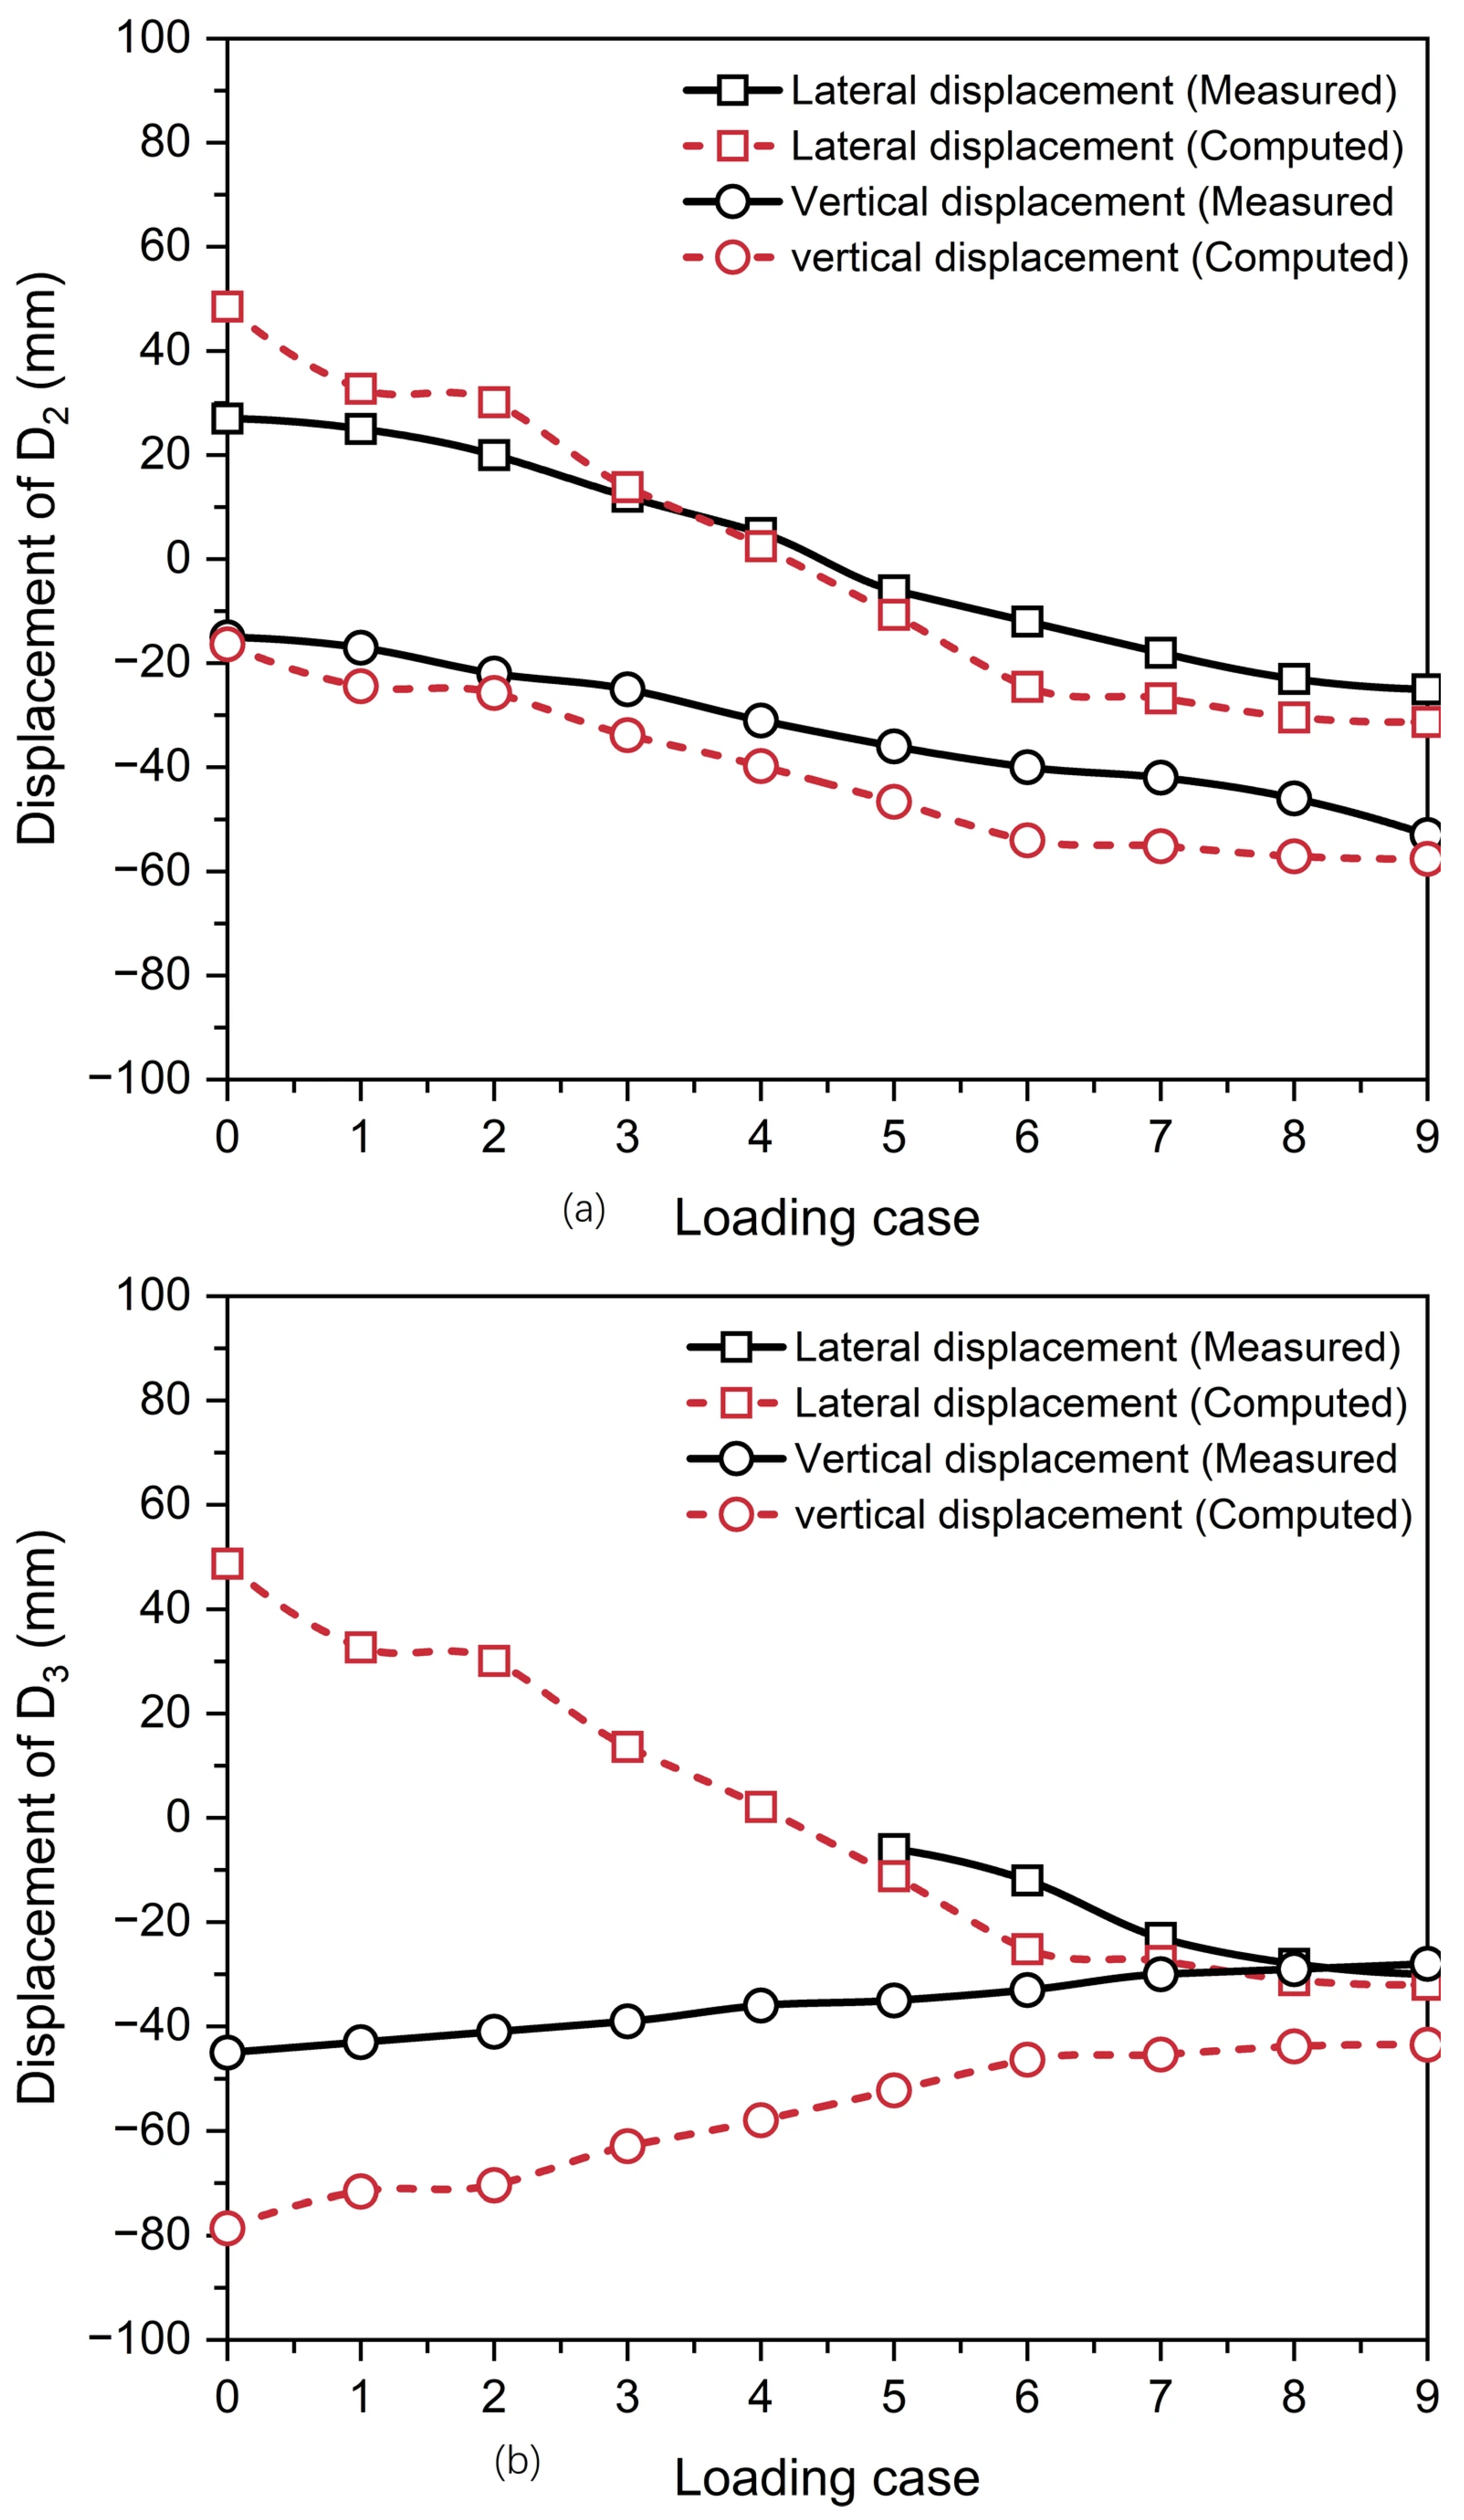
Figure 6 presents photographs of the caisson anchorage for the Oujiang North Estuary Bridge, where lateral and vertical displacements of the caisson anchorage were measured using a total station and a precise level, respectively, during the application of the main cable tension. Figure 7 compares the measured and computed displacements of monitoring points D2 and D3. Due to symmetry along the x-direction, the responses at points D1 and D4 are identical to those at D2 and D3, respectively, and are thus omitted for brevity (see Figure 4a). The missing values in Figure 7b are attributed to on-site construction interference, which also accounts for the absence of displacement data under Loading Case 10 [38].
Figure 6.
Photographs of the caisson anchorage for the Oujiang North Estuary Bridge: (a) caisson and (b) displacement monitoring point.
Figure 7.
Displacements of monitoring points D2 and D3 for the caisson anchorage: (a) D2 and (b) D3.
To evaluate the prediction accuracy across all monitoring stages (Loading Cases 0 to 9), the statistical error evaluations for each displacement component are summarized in Table 7. For monitoring point D3, the vertical displacement exhibits the highest RMSE (21.34 mm), which is heavily skewed by the initial displacement at Loading Case 0 (computed −78.62 mm versus measured −45.00 mm, error = 33.62 mm). This initial deviation stems directly from the “wished-in-place” numerical simplification, wherein all structural elements are activated simultaneously without simulating the sequential construction process. However, a stage-by-stage analysis confirms a clear error attenuation trend: if Case 0 is excluded from the operational evaluation, the vertical MAE and RMSE at D3 immediately drop to 15.12 mm and 16.20 mm, respectively, with the error systematically decreasing from 33.62 mm at Loading Case 0 to 28.56 mm at Loading Case 1 and 23.96 mm at Loading Case 3, before stabilizing between 13.38 and 15.48 mm in later stages (Loading Cases 6–9).
Table 7.
Summary of measured versus computed displacements and statistical error evaluation across monitoring stages.
The conclusion that these remaining discrepancies are acceptable is now rigorously derived from quantitative assessment against design standards. According to Clause 8.4.3 of the Specifications for Design of Highway Suspension Bridge (JTG/T D65-05-2015, MoT 2015) [42], the lateral and vertical displacements of the TSP during bridge operation stage (i.e., Loading Case 10) should be limited to 0.01% and 0.02% of the main span, which correspond to 80 mm and 160 mm, respectively, for the south anchorage of the Oujiang North Estuary Bridge. The residual MAE of approximately 11.24 mm (lateral) and approximately 15.12 mm (vertical) accounts for less than 10% of the code-governed allowable serviceability limits. Furthermore, the incremental displacements between loading stages match measured trends within an average deviation of less than 3.5 mm, proving that the model accurately captures the governing stiffness and soil-structure interaction behavior despite the initial zero-point shift. Therefore, based on these quantitative metrics (MAE/RMSE) and code-based allowable thresholds, the model predictions are formally demonstrated to be acceptable and reliable for engineering application.
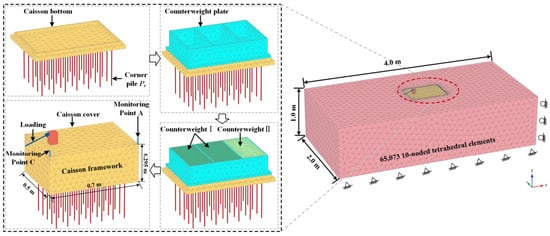
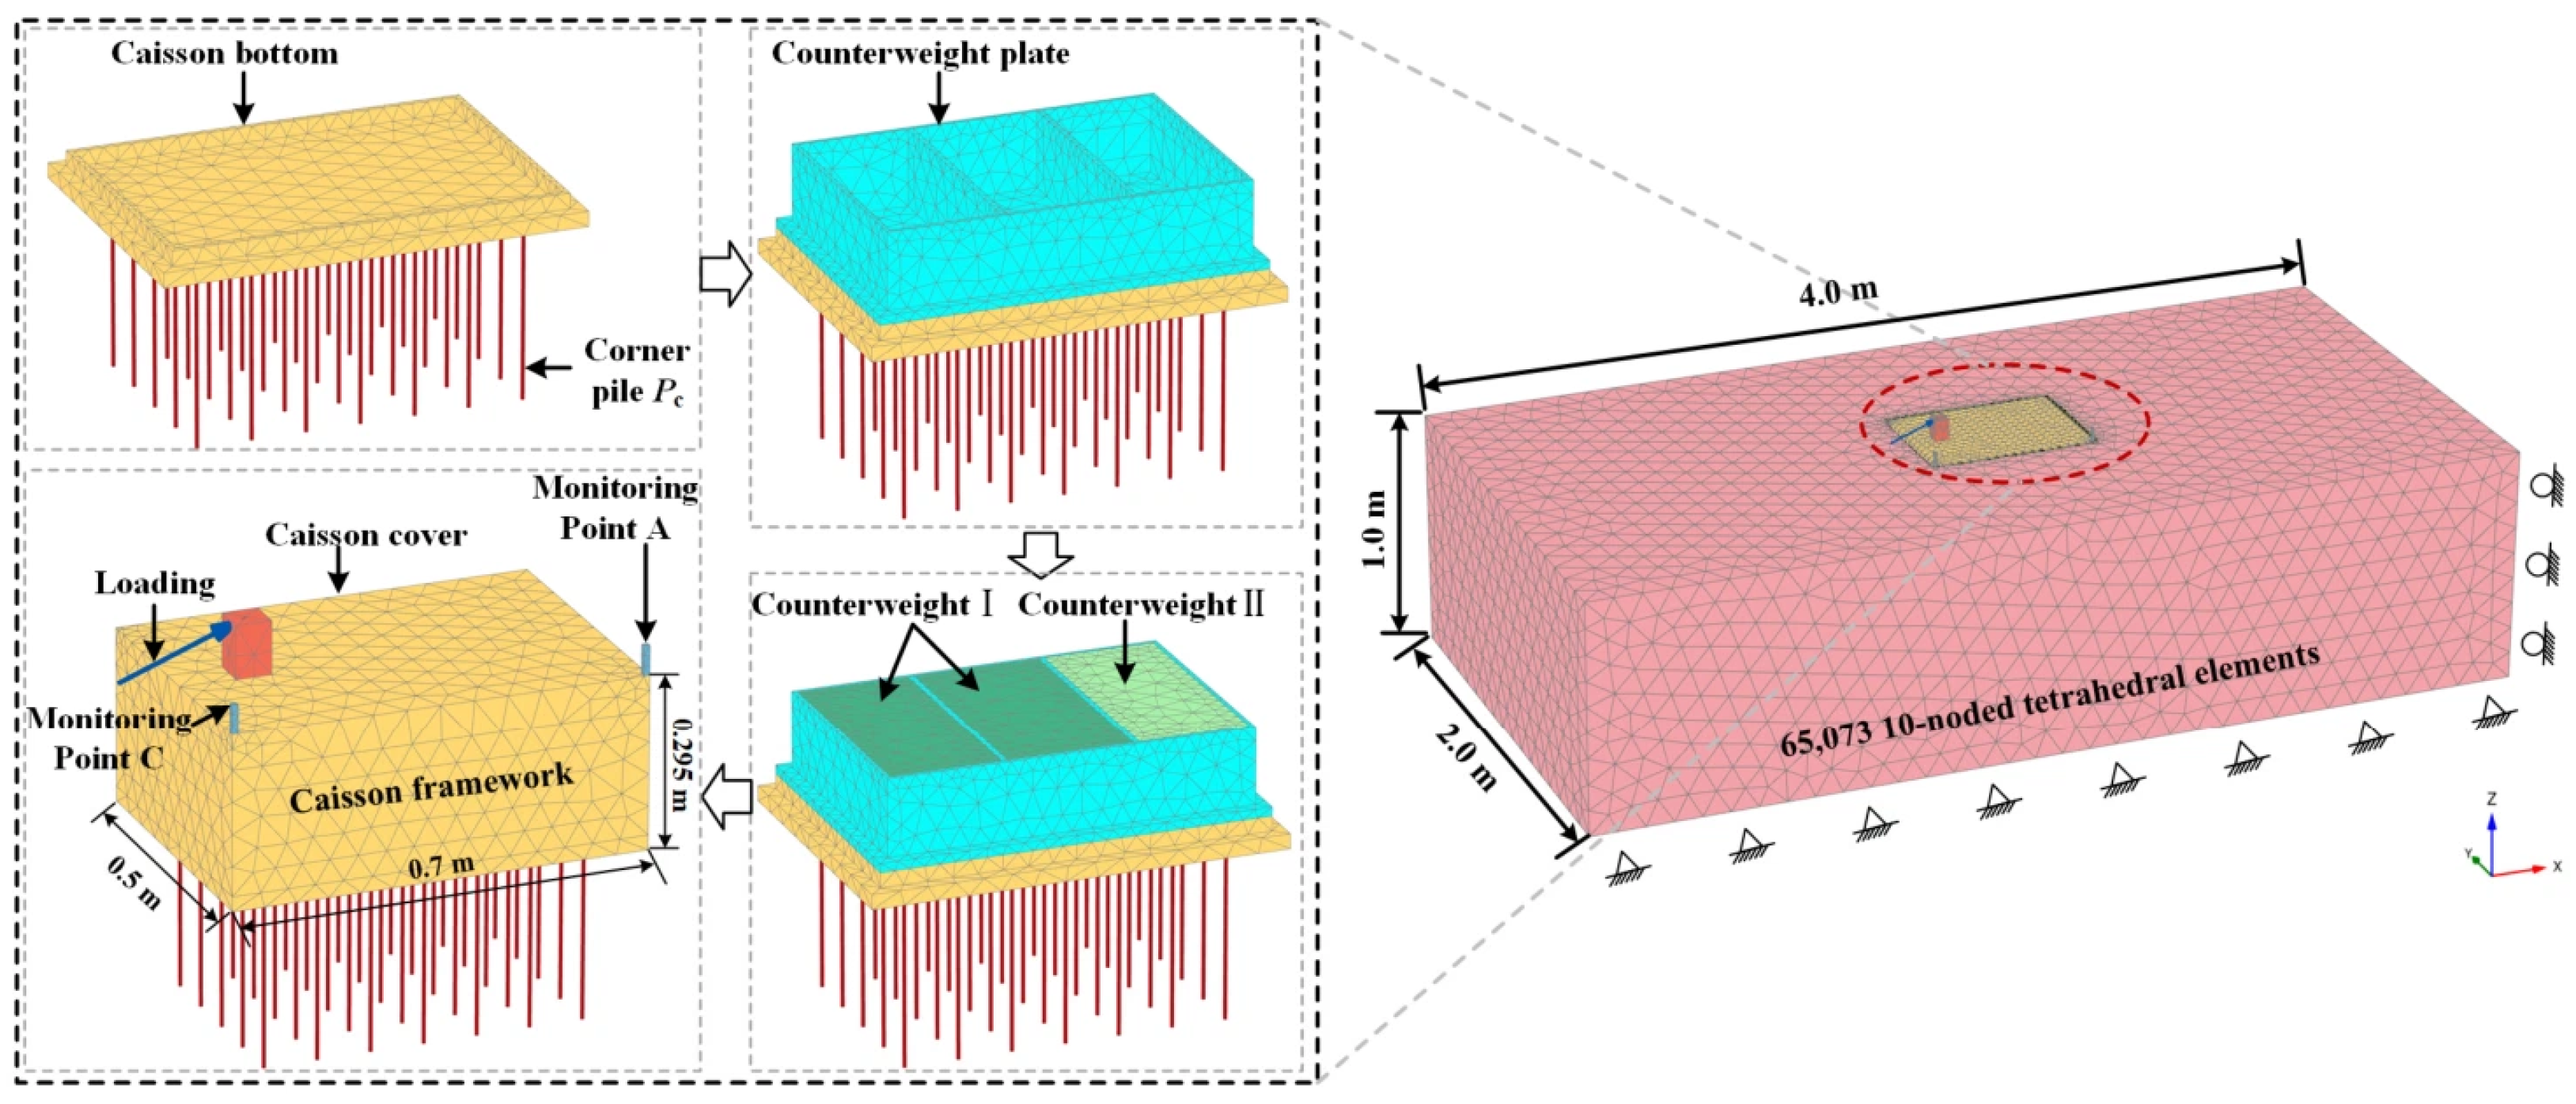
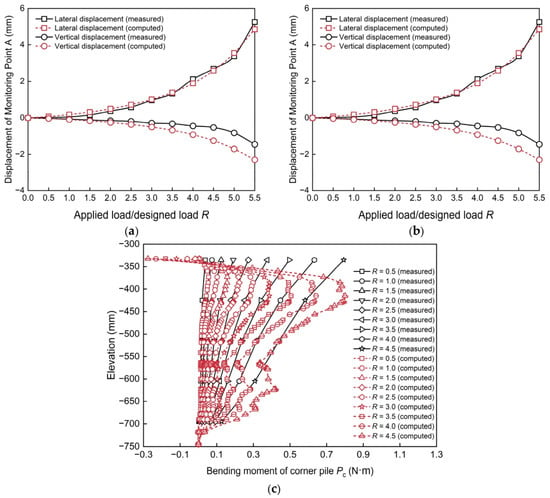
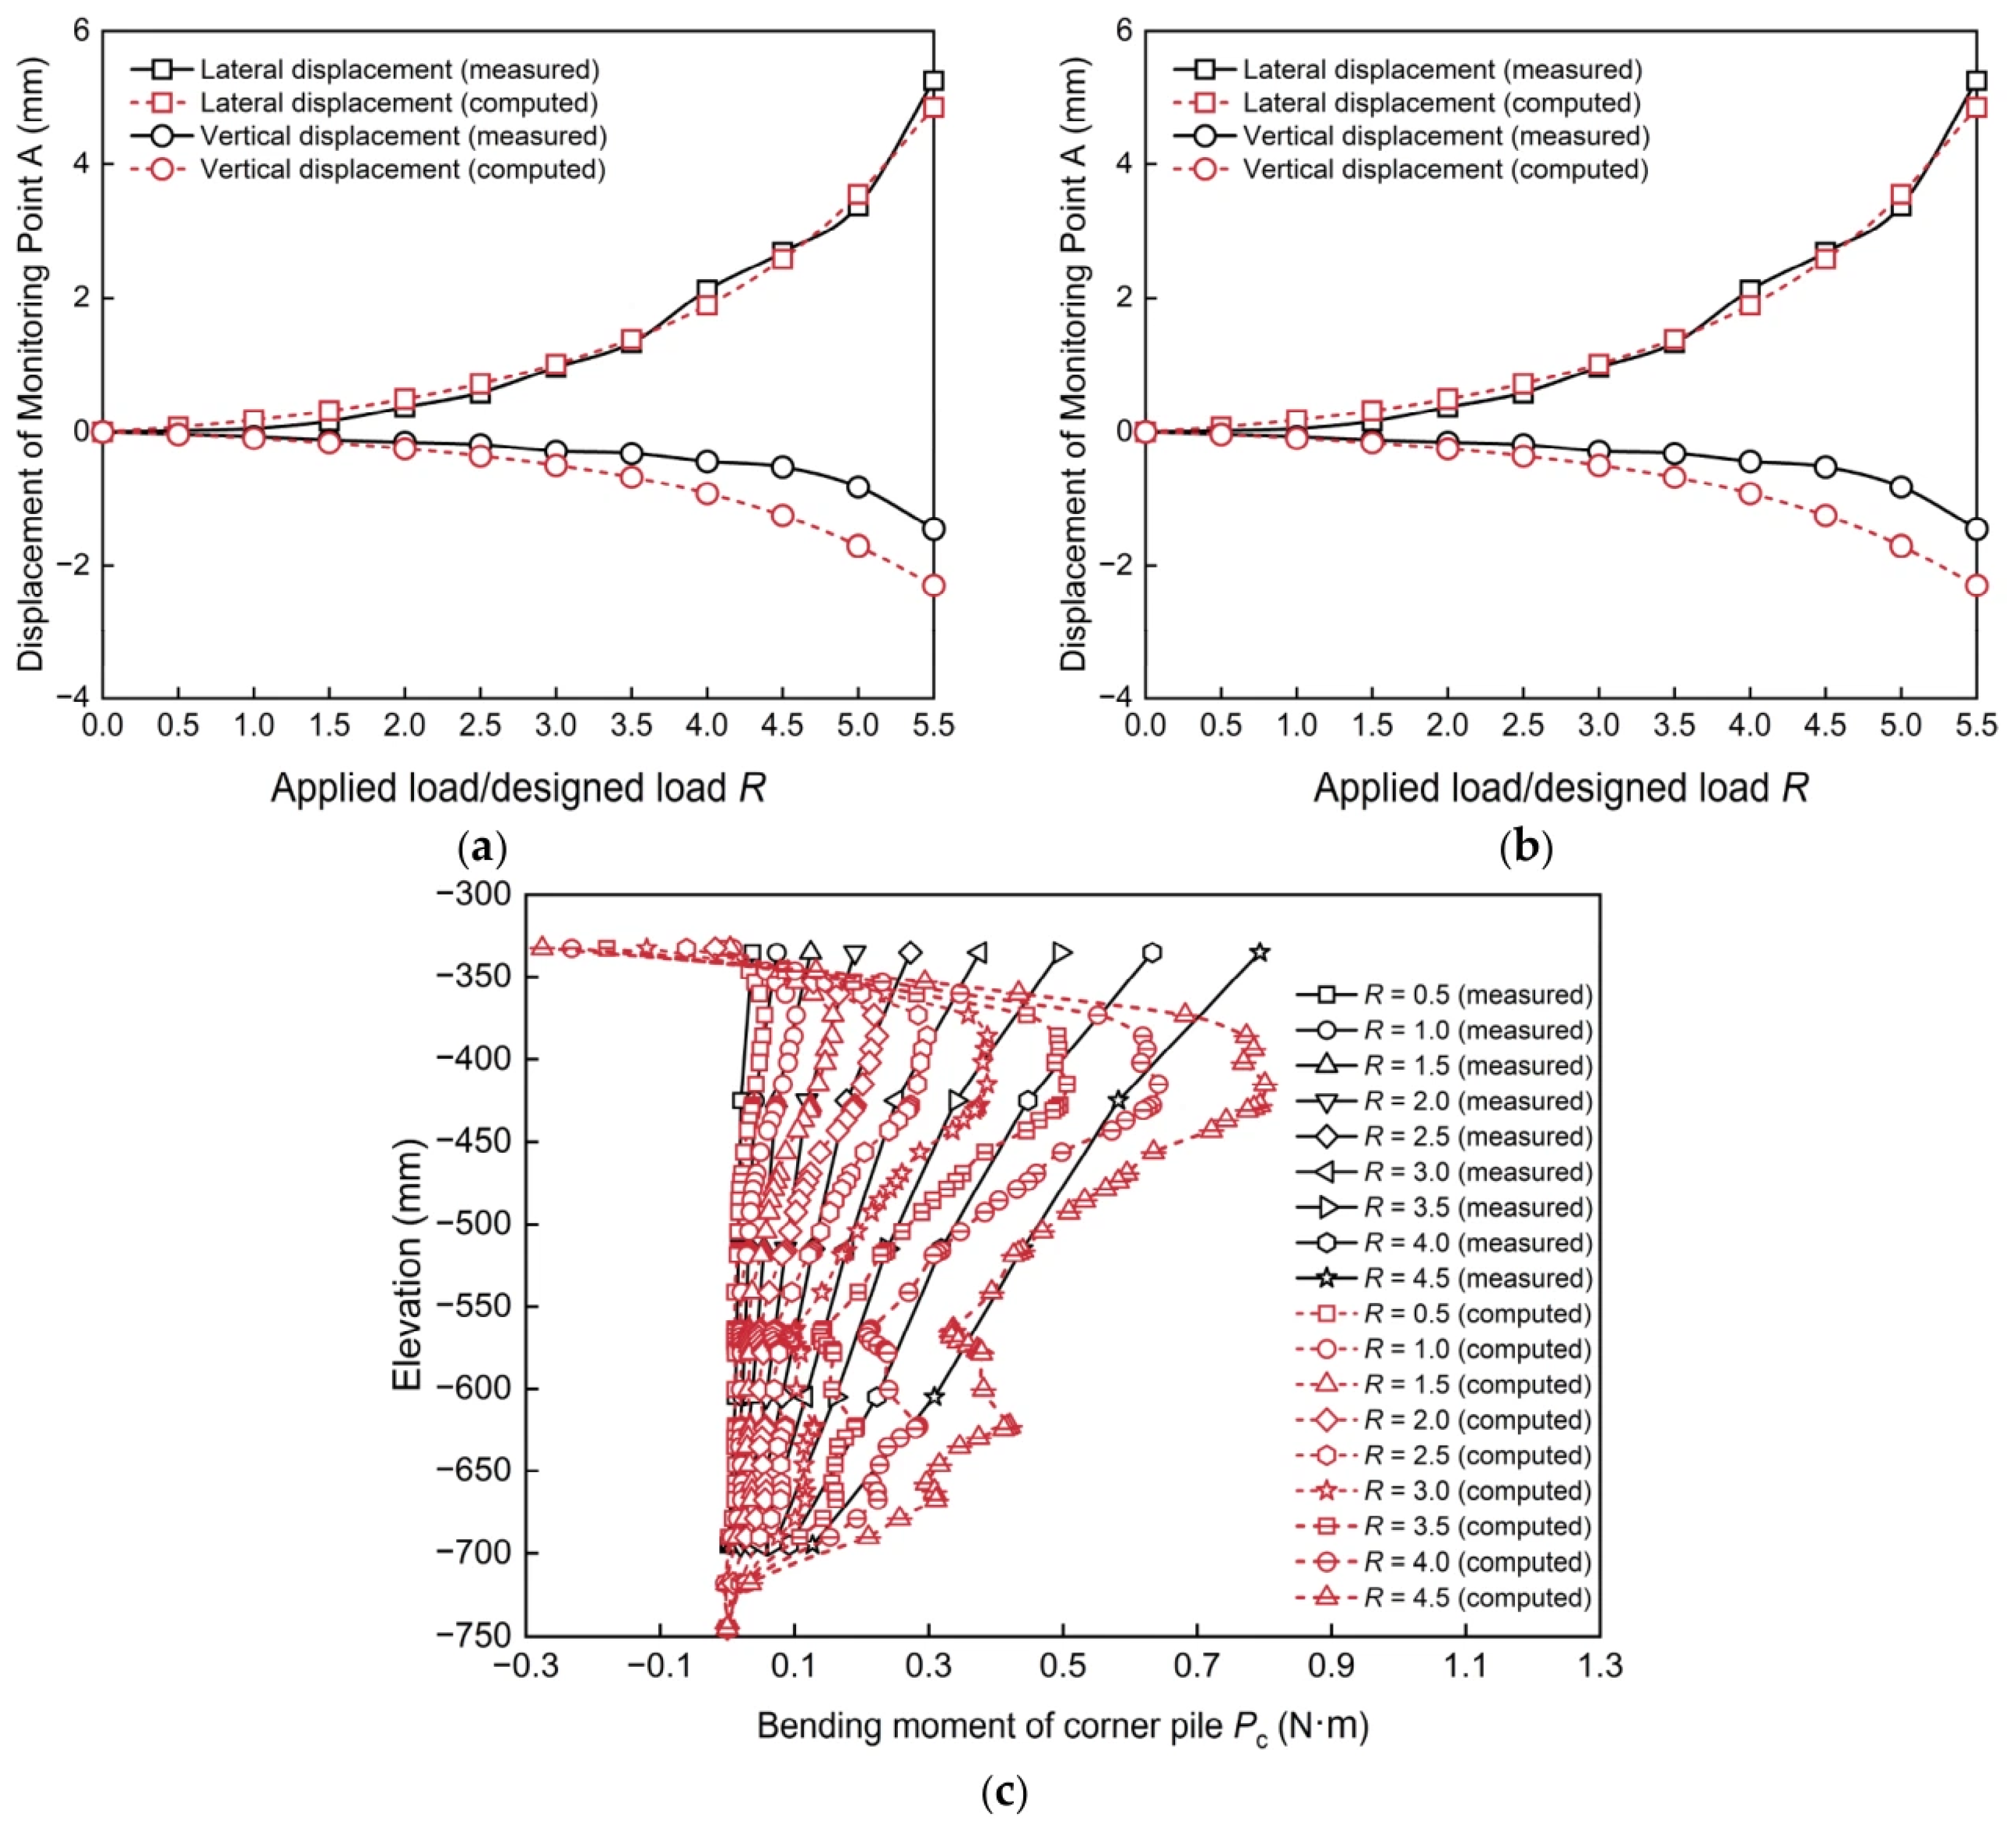
Furthermore, the applicability of the embedded pile element in PLAXIS 3D for simulating piles under combined V-H-M (vertical, horizontal, and moment) loading was validated through comparisons with a model test reported by Zhao et al. [33], which focused on the mechanical behavior of a caisson-bored pile composite anchorage (CBPCA). Figure 8 illustrates the 3D finite element mesh constructed to emulate the model test, with geometric dimensions identical to the experimental setup. Parameters for this numerical model are summarized in Table 8 and Table 9. It is worth noting that specific values for the shaft resistance and base resistance were not measured explicitly in the model test. Consequently, they were set as soil-dependent in PLAXIS 3D. As demonstrated in Figure 9, a satisfactory agreement is achieved between the present numerical estimates and the experimental observations of Zhao et al. [33]. This close correspondence verifies the efficacy of the embedded pile element for analyzing the performance of piles in the PCA.
Figure 8.
Three-dimensional finite element mesh used to reproduce the model test.
Table 8.
Properties of the CBPCA in the model test.
Table 9.
HS model parameters of the soil in the model test.
Figure 9.
Comparison between the present simulation results and the measured data from the model test reported by Zhao et al.: (a) displacement of Monitoring Point A; (b) displacement of Monitoring Point C; and (c) bending moment of corner pile Pc.
3.5. Numerical Results
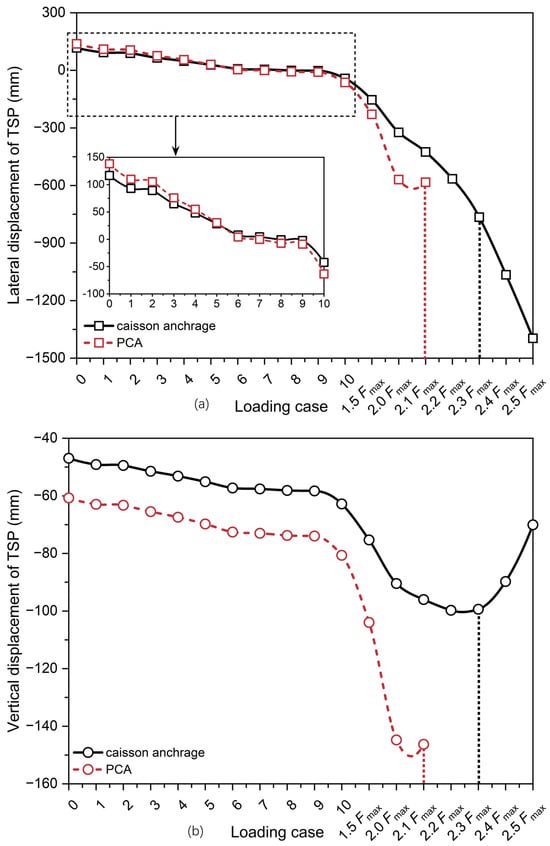
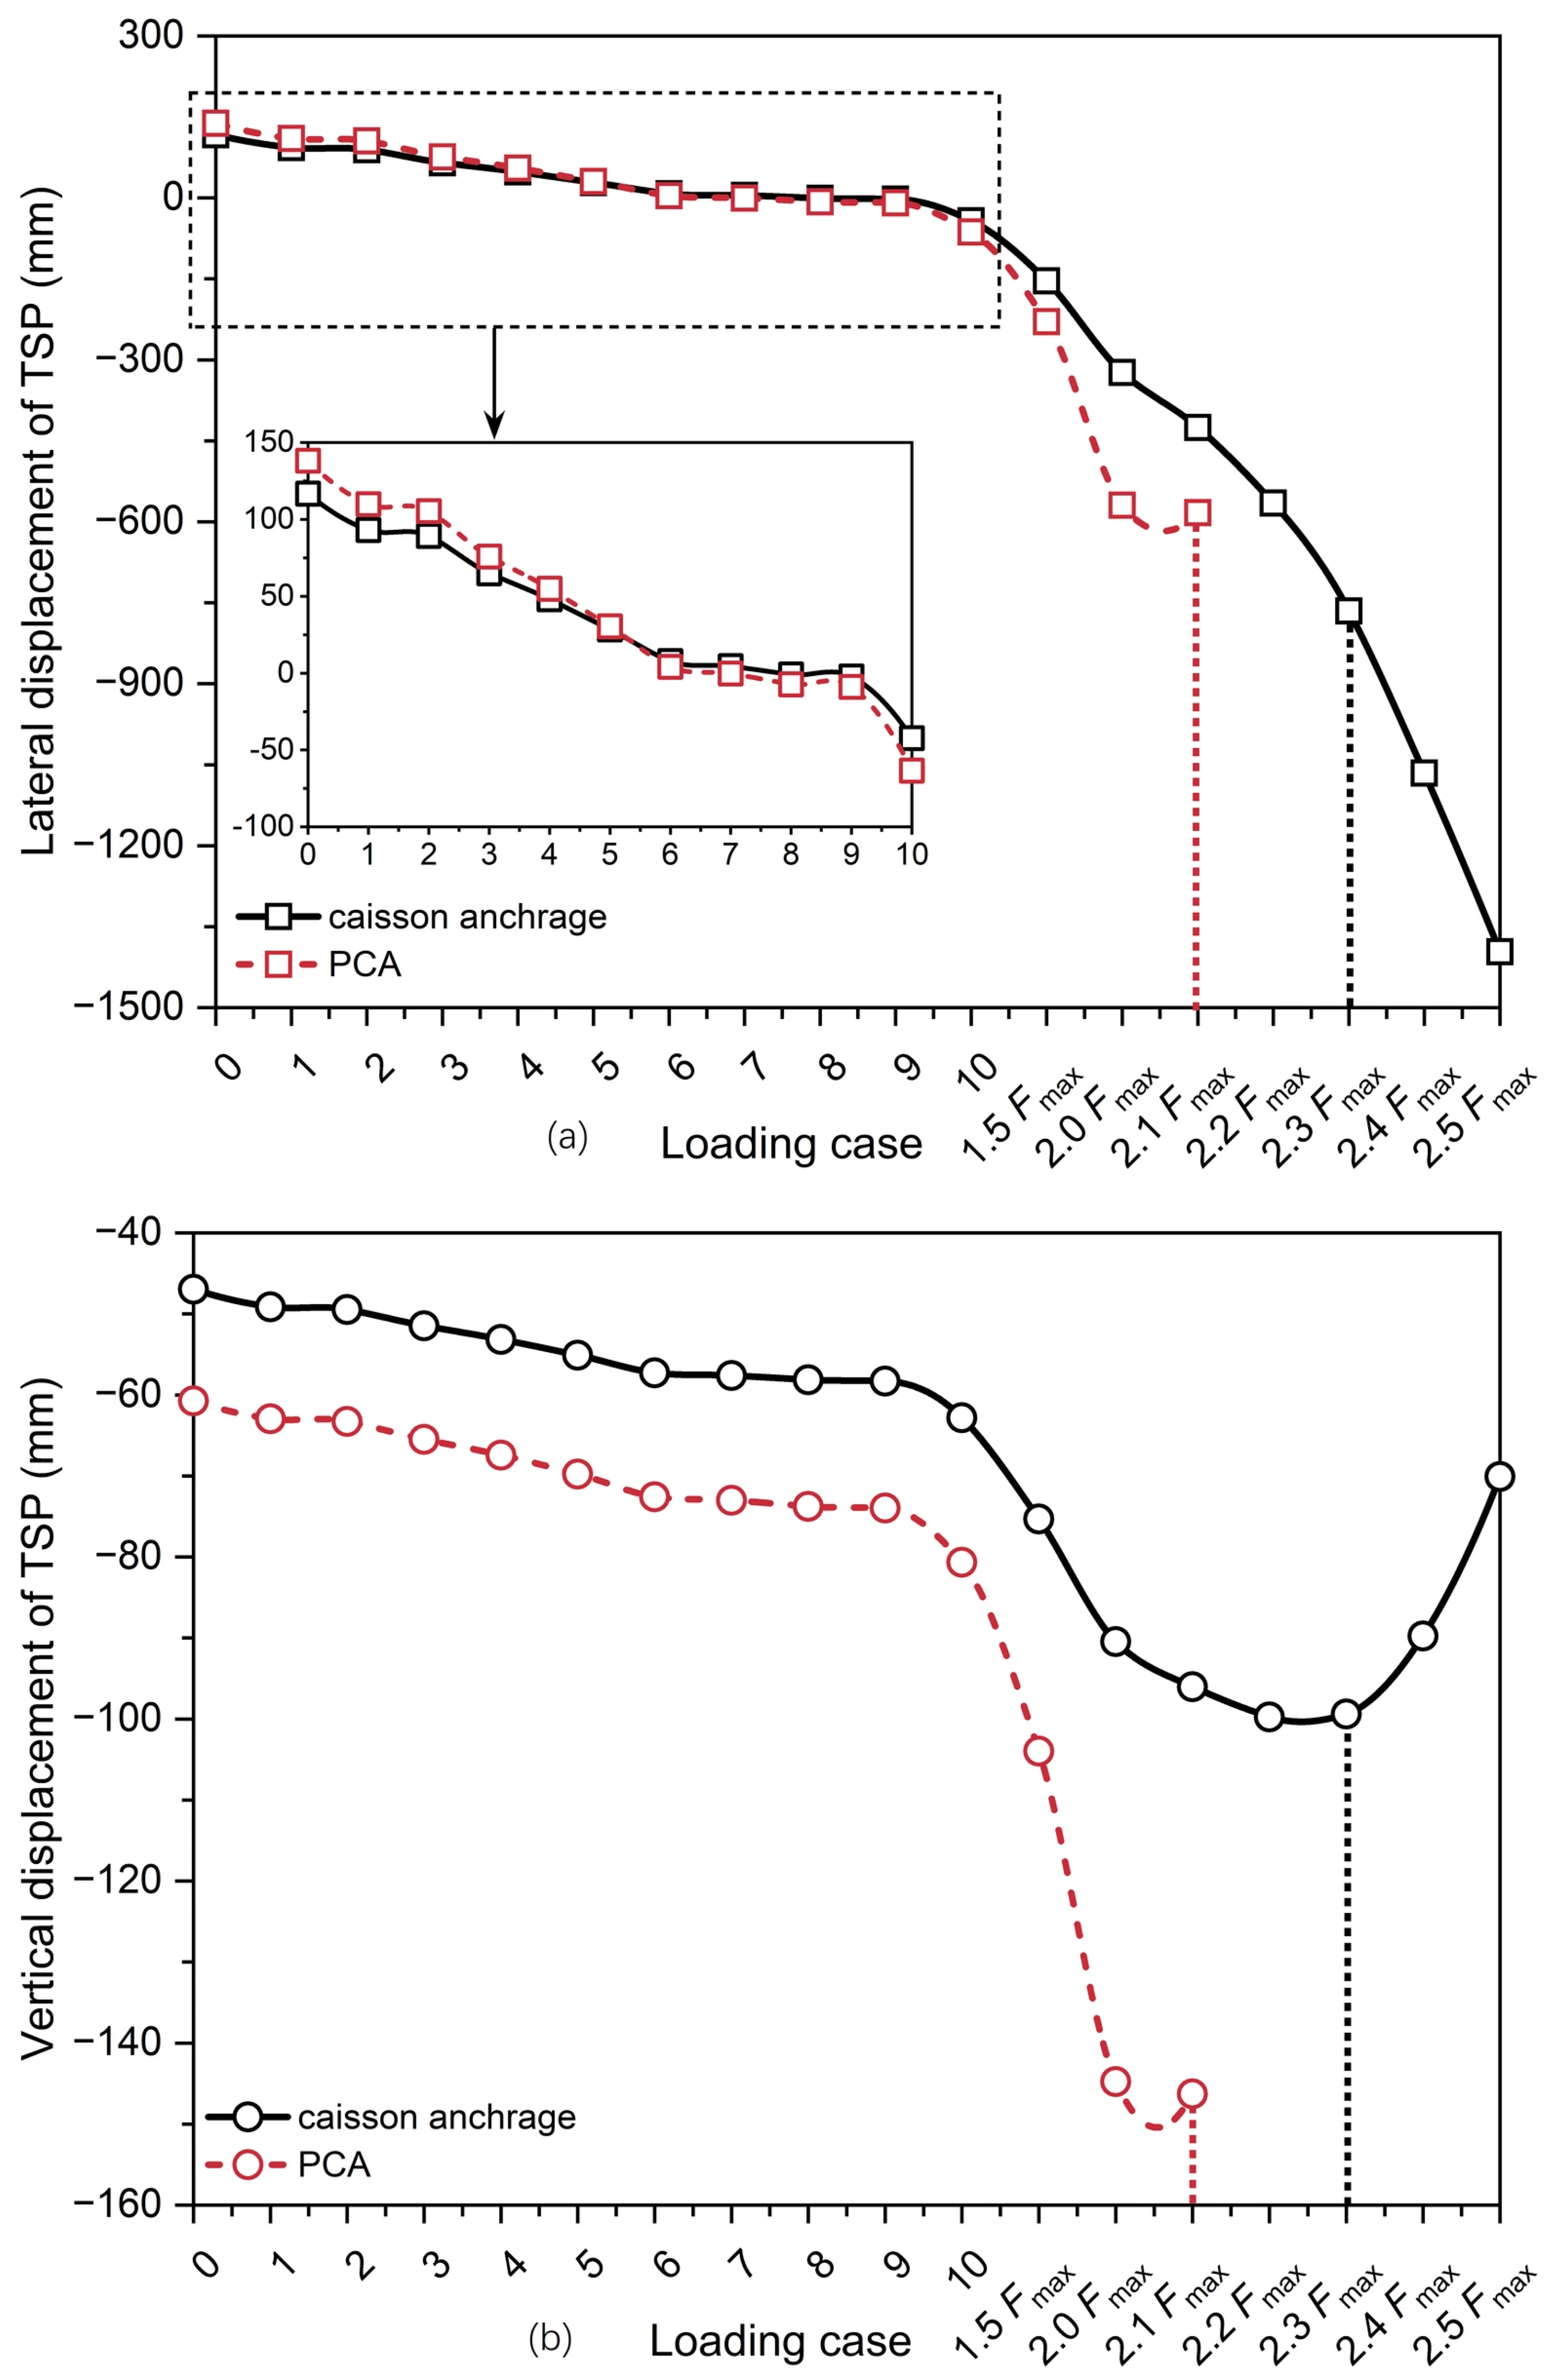
Under Loading Case 10, the TSP of the caisson anchorage exhibits lateral and vertical displacements of −42.29 mm and −62.82 mm, respectively (Figure 10), whereas those for the PCA are −63.41 mm and −80.67 mm. Accordingly, both anchorage foundations strictly satisfy the allowable design limitations of 80 mm (lateral) and 160 mm (vertical) stipulated by the specification [42]. Note that all negative signs in this study denote direction rather than magnitude.
Figure 10.
Displacements of the TSP for the caisson anchorage and the PCA: (a) lateral displacement; and (b) vertical displacement.
To accurately capture the ultimate bearing capacity, the loading steps near failure were refined from 0.5Fmax to 0.1Fmax. Starting from Loading Case 10 (i.e., 1.0Fmax), the main cable tension was increased in increments of 0.5Fmax up to 2.0Fmax, and subsequently in fine increments of 0.1Fmax, as illustrated in Figure 10. Furthermore, the soil failure criteria have been strictly defined using numerical convergence indicators and displacement characteristics: numerical soil collapse was identified when PLAXIS 3D post-processing explicitly issued the warning “Soil seems to collapse. Check output” and was cross-verified by a sudden acceleration or anomalous behavior in the displacement path. Accordingly, the ultimate bearing capacity is determined to occur at F = 2.3Fmax for the conventional caisson anchorage and F = 2.1Fmax for the PCA. Since the current PLAXIS 3D model employs linear elastic embedded pile elements, back-calculation demonstrates that at the ultimate bearing capacity level of F = 2.1Fmax, the calculated maximum stress at the pile head reaches 429.46 MPa. This confirms that when high-strength Q490 steel piles (with a yield strength of 490 MPa) are utilized, the pile head stress remains below the yield limit at this ultimate bearing capacity (2.1Fmax), thereby verifying that premature structural yielding is successfully prevented.
In addition, by reducing the caisson height by 20 m (from 67.5 m to 47.5 m), the PCA significantly reduces construction costs and deep foundation operations. Although incorporating 2391.08 tons of high-strength Q490 steel pipe piles incurs an estimated cost of 10.28–11.60 million RMB, this expense is effectively offset by the major reductions in C30/C20 concrete (66,800 m3 in total) and Q235 steel. Consequently, the net direct cost savings range between 13.34 and 15.90 million RMB, alongside a shortened construction schedule for caisson sinking. In summary, although the PCA exhibits slightly larger displacements under Loading Case 10 and a marginally lower ultimate bearing capacity (by 0.2 Fmax) than the conventional caisson anchorage, it demonstrates superior cost-effectiveness, proving to be a highly promising novel anchorage foundation.
As illustrated in Figure 3, the design coordinates of the theoretical splay saddle point in the three-dimensional coordinate system are (±6.73 m, 20.8 m, 38.0 m), serving as the displacement datum. Prior to the application of the main cable tension (i.e., at Loading Case 0), the caisson, steel pipe piles, bottom sealing concrete, water, C20 concrete, top slab, splay saddle pier, and anchorage block were sequentially activated. The non-uniform counterweight distribution of the PCA resulted in significant lateral displacements of the TSP, which were primarily driven by the eccentric self-weight of the anchorage block and C20 concrete. With the progressive application of the main cable tension, the load distribution on the PCA gradually balanced out until the completion of Loading Case 10. Therefore, Loading Case 10 represents the final load state of the PCA. Furthermore, all displacements of the TSP evaluated under Loading Case 10 to satisfy the specification requirements in this study refer specifically to the displacement datum (±6.73 m, 20.8 m, 38.0 m), and displacements were not reset at any construction stage.
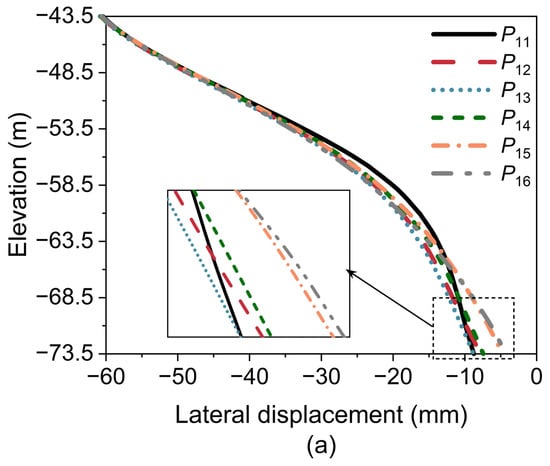
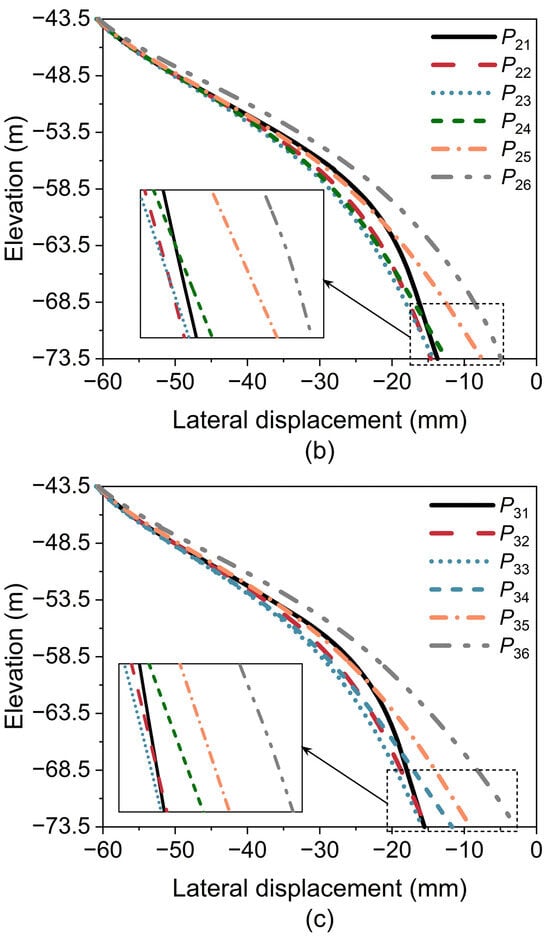
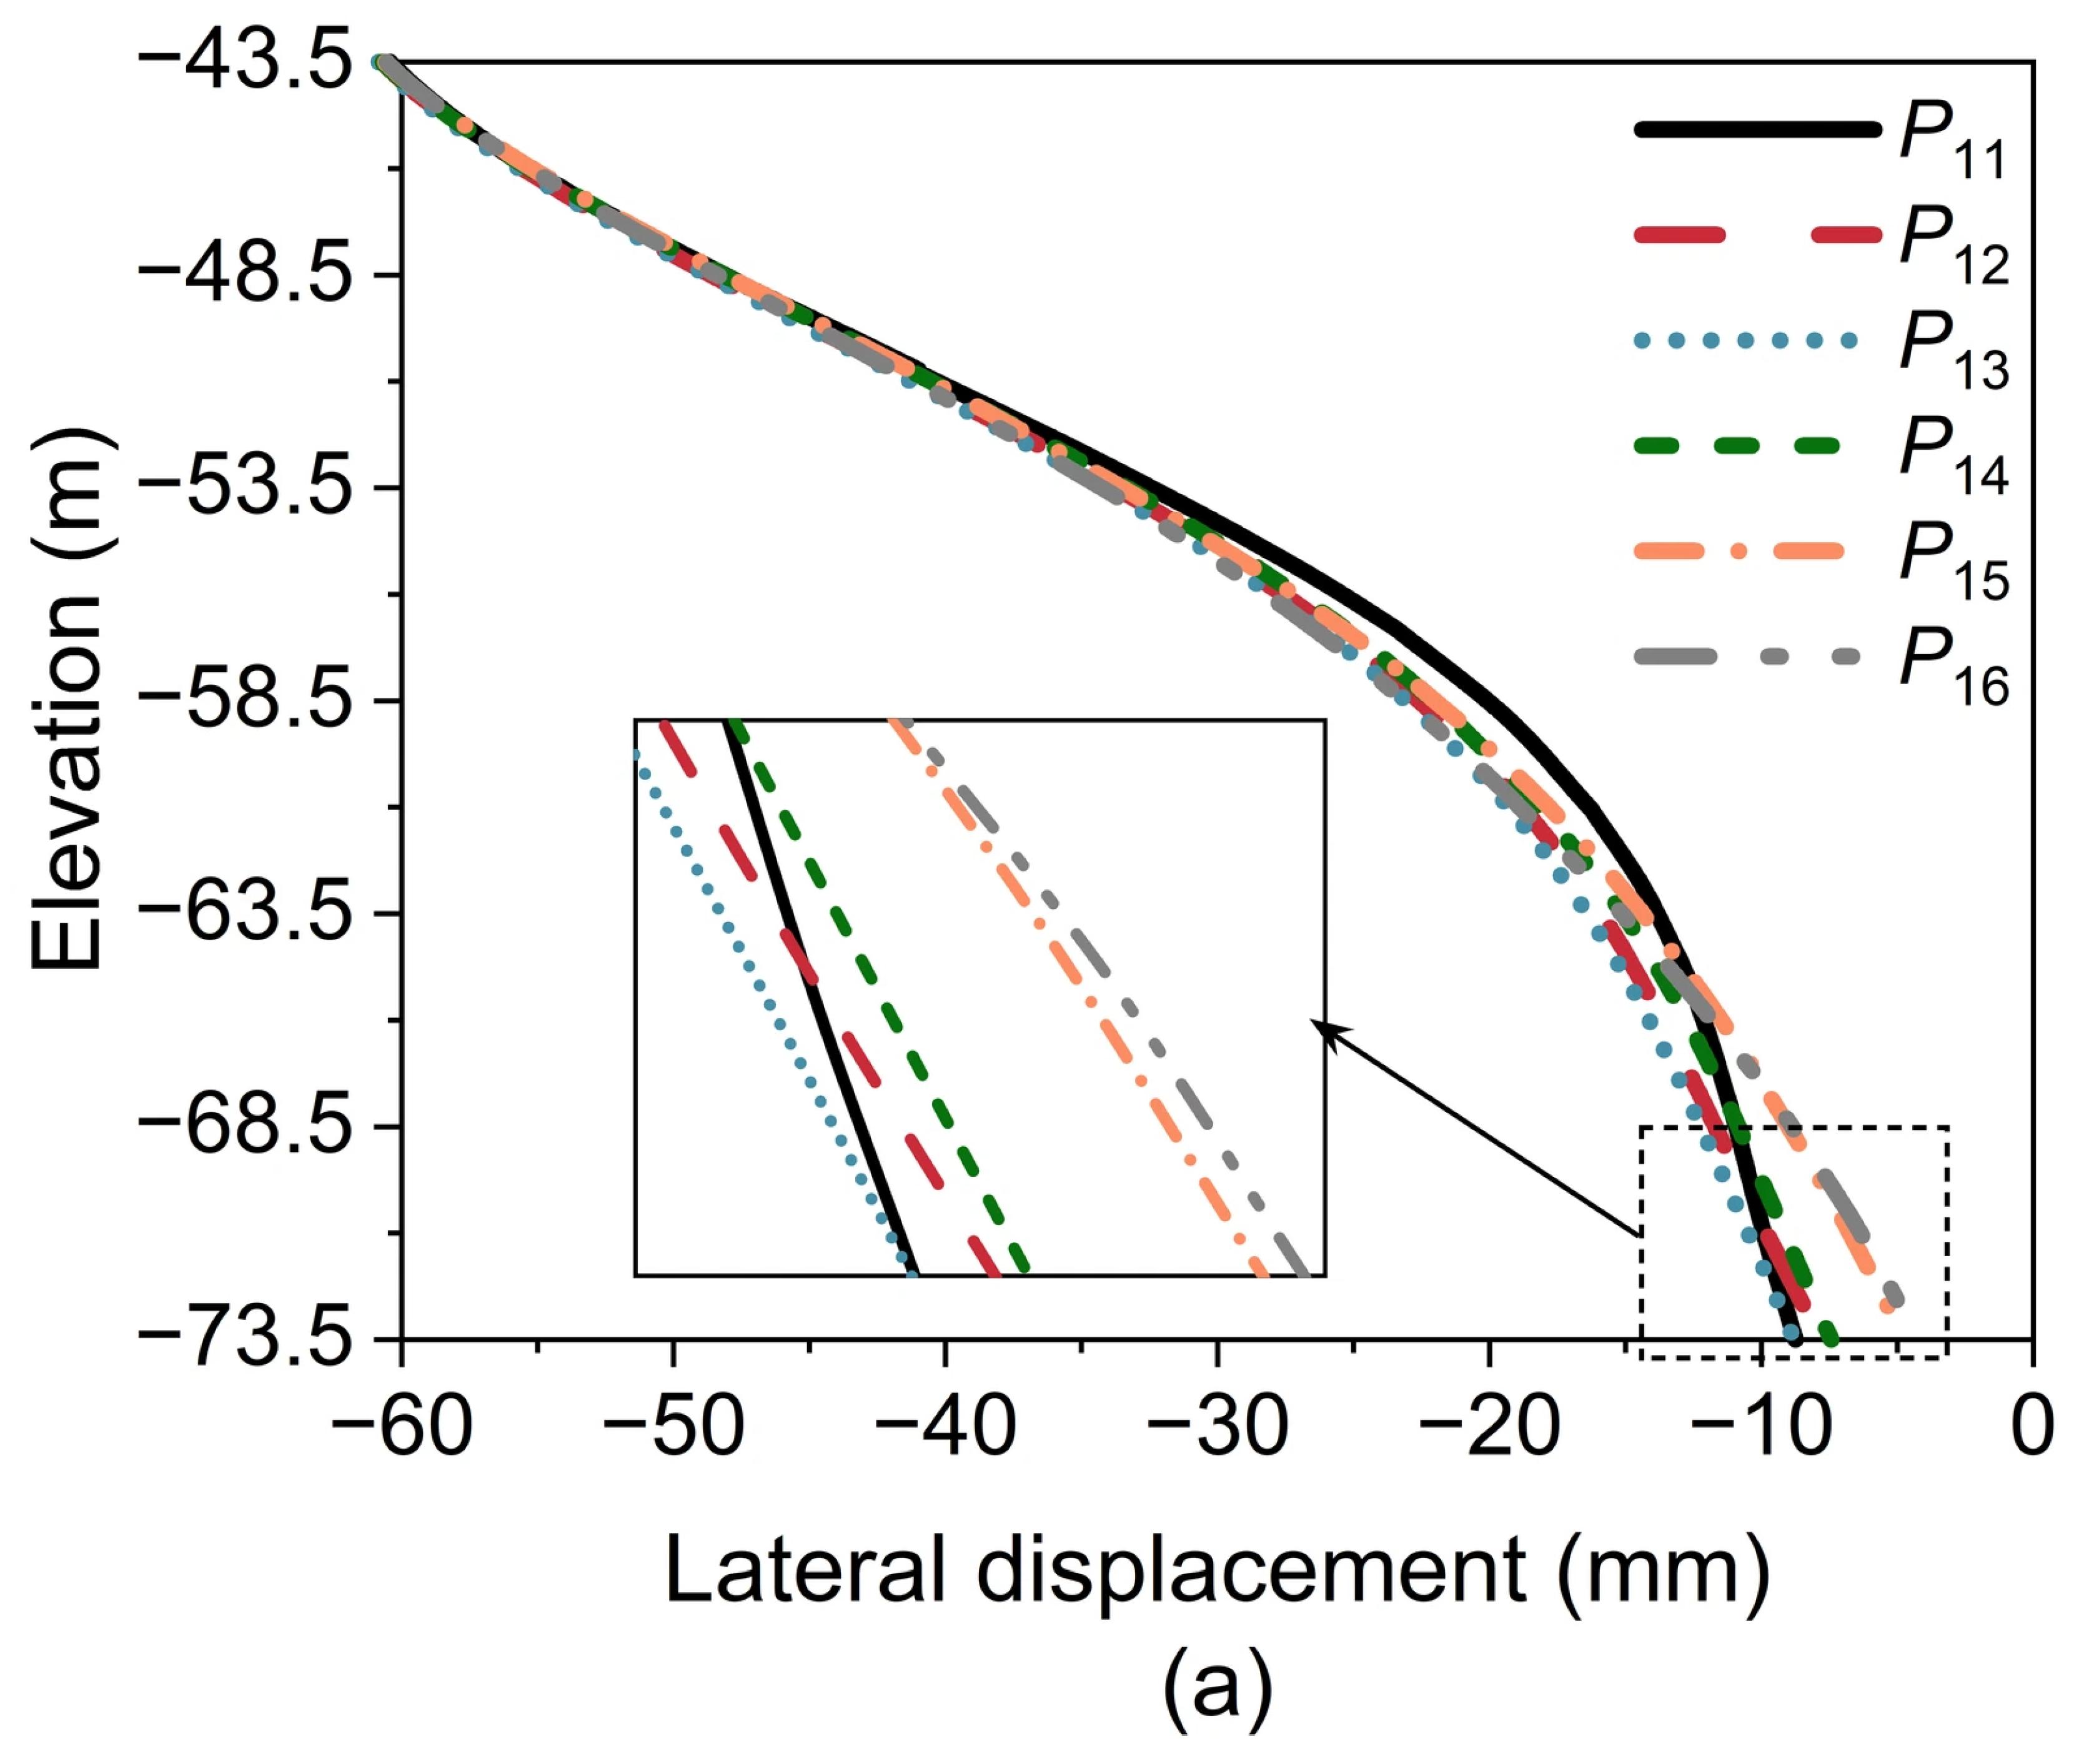
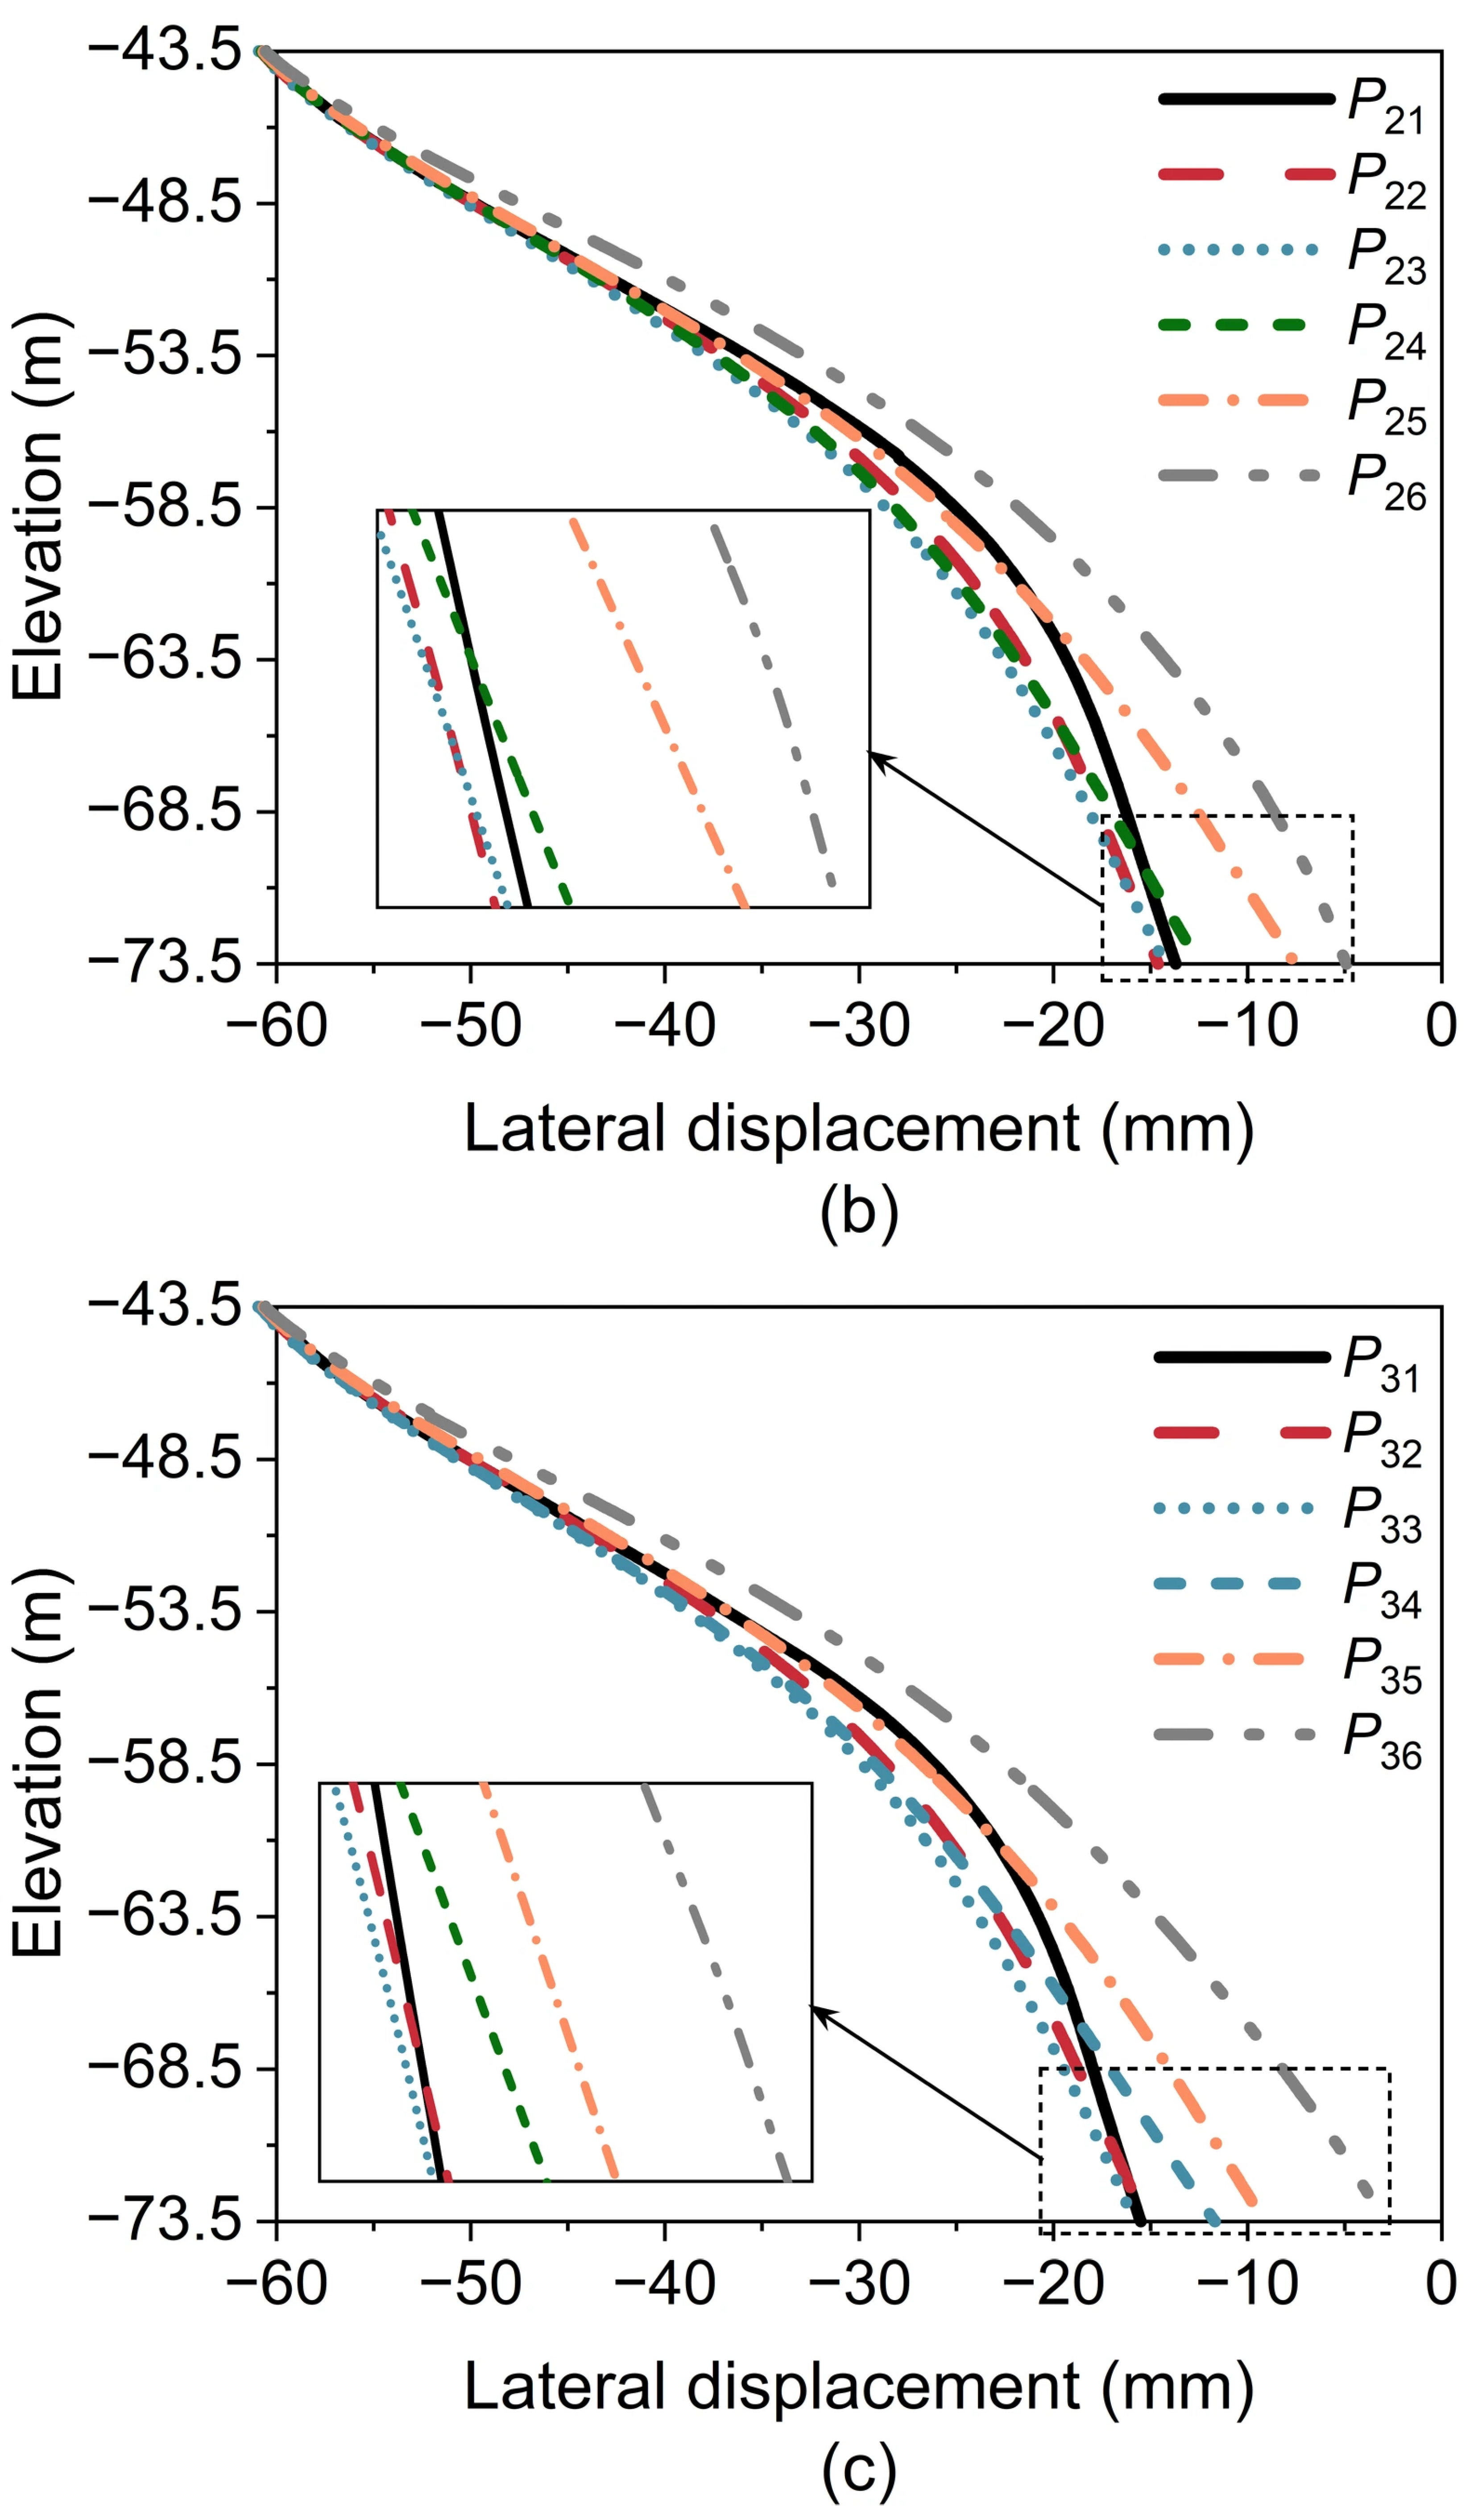
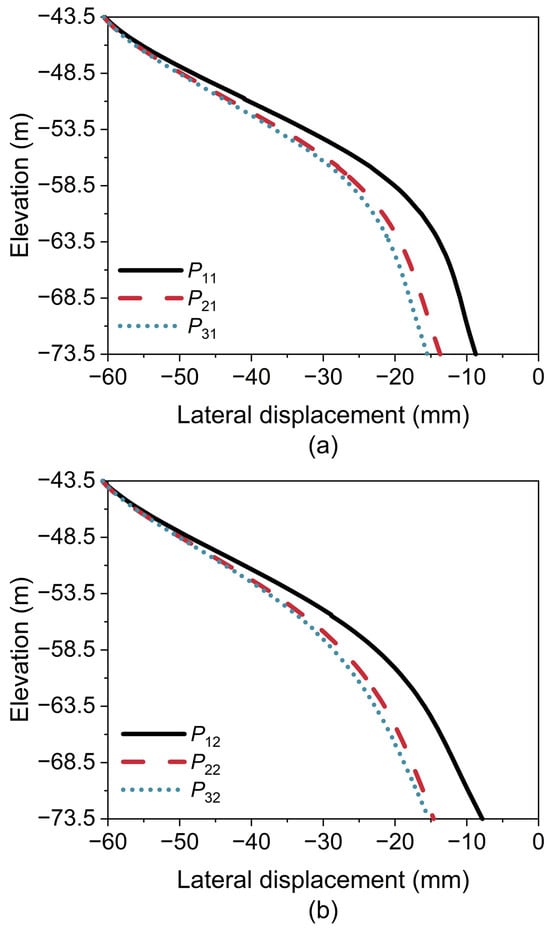
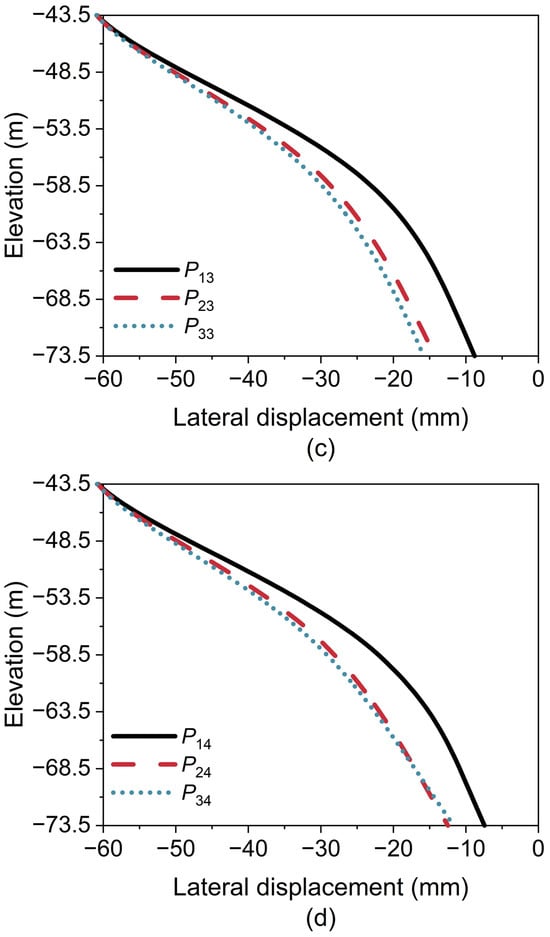
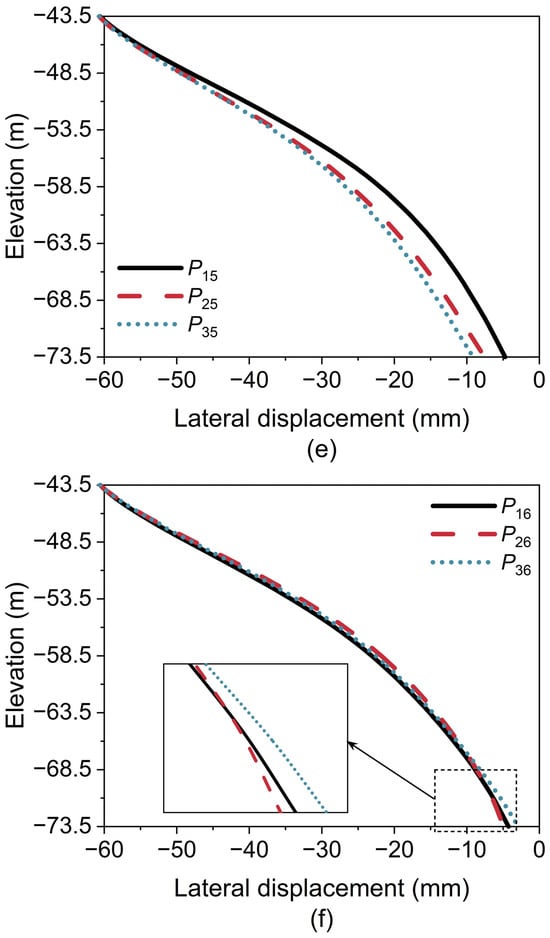
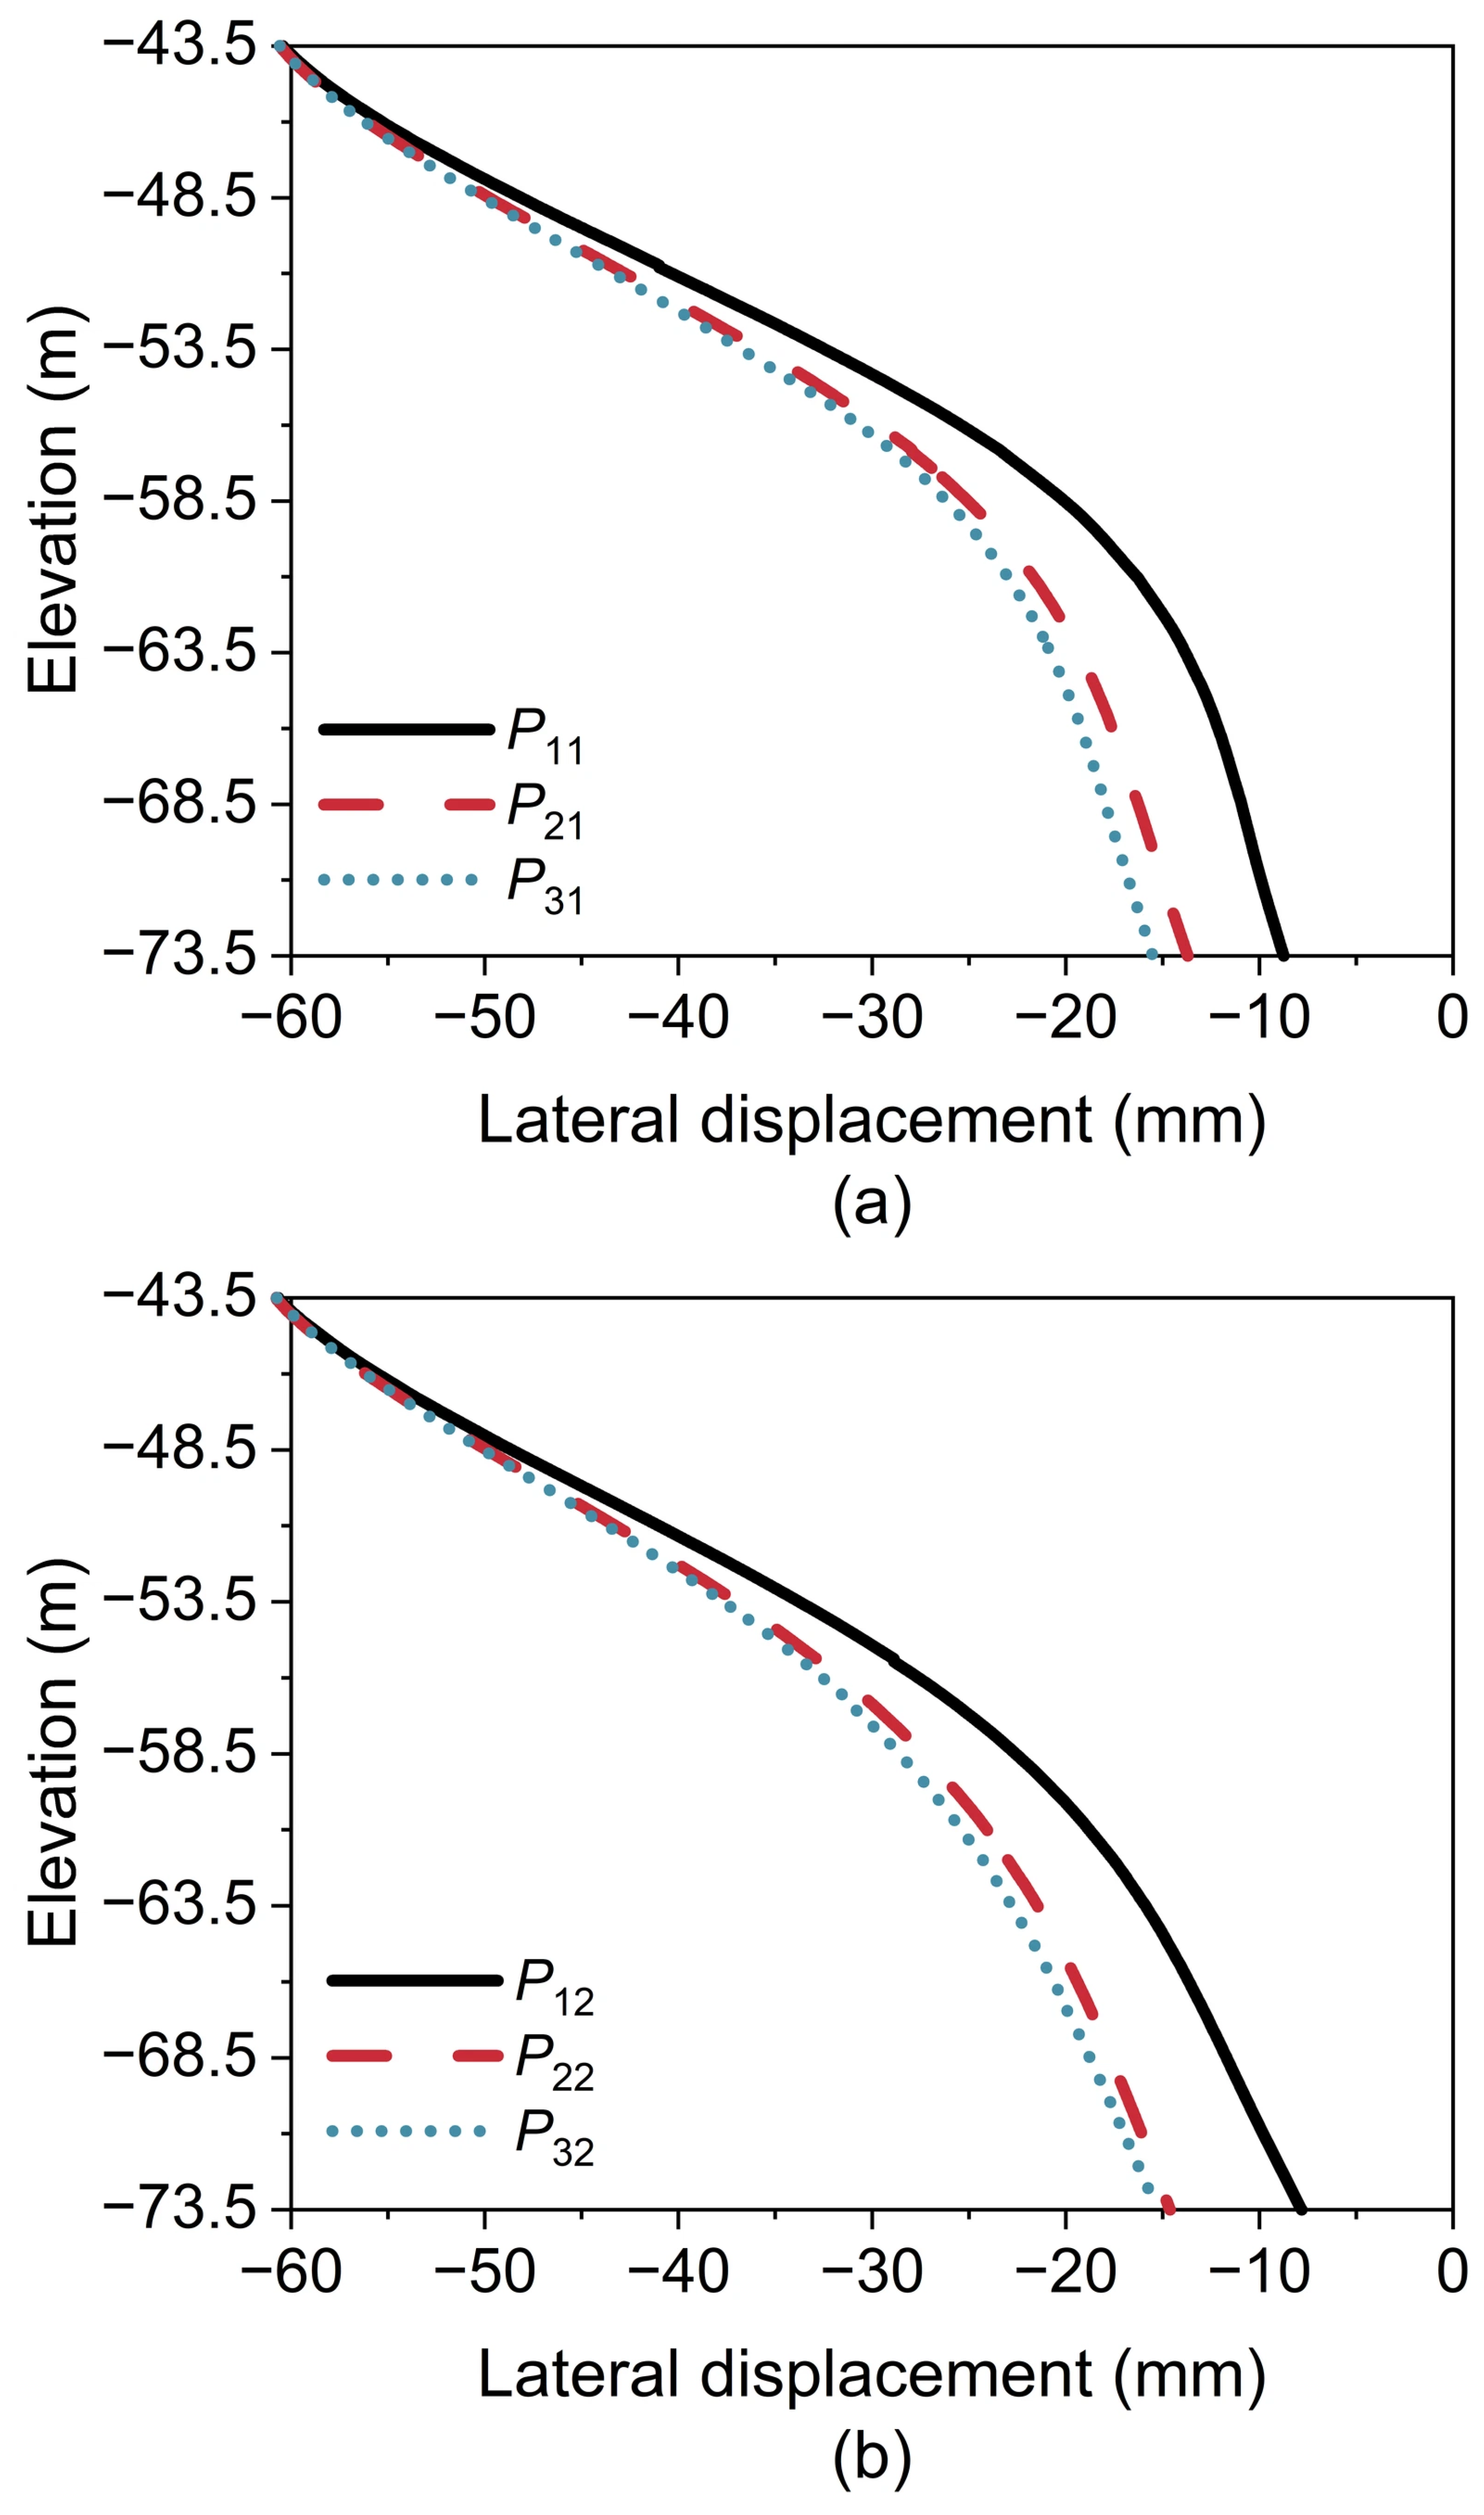
In contrast to the caisson anchorage, the incorporation of piles within the PCA plays a crucial role in ensuring its overall stability. Due to the transverse symmetry of the PCA pile arrangement, detailed analyses are conducted on the 18 representative piles (Rows 1–3, Columns 1–6) shown in Figure 4b. The symbol Pmn denotes the pile located at Row m, Column n. Each individual pile is subjected to the combined V-H-M loading resulting from the self-weight of the superstructure and the tension in the main cables.
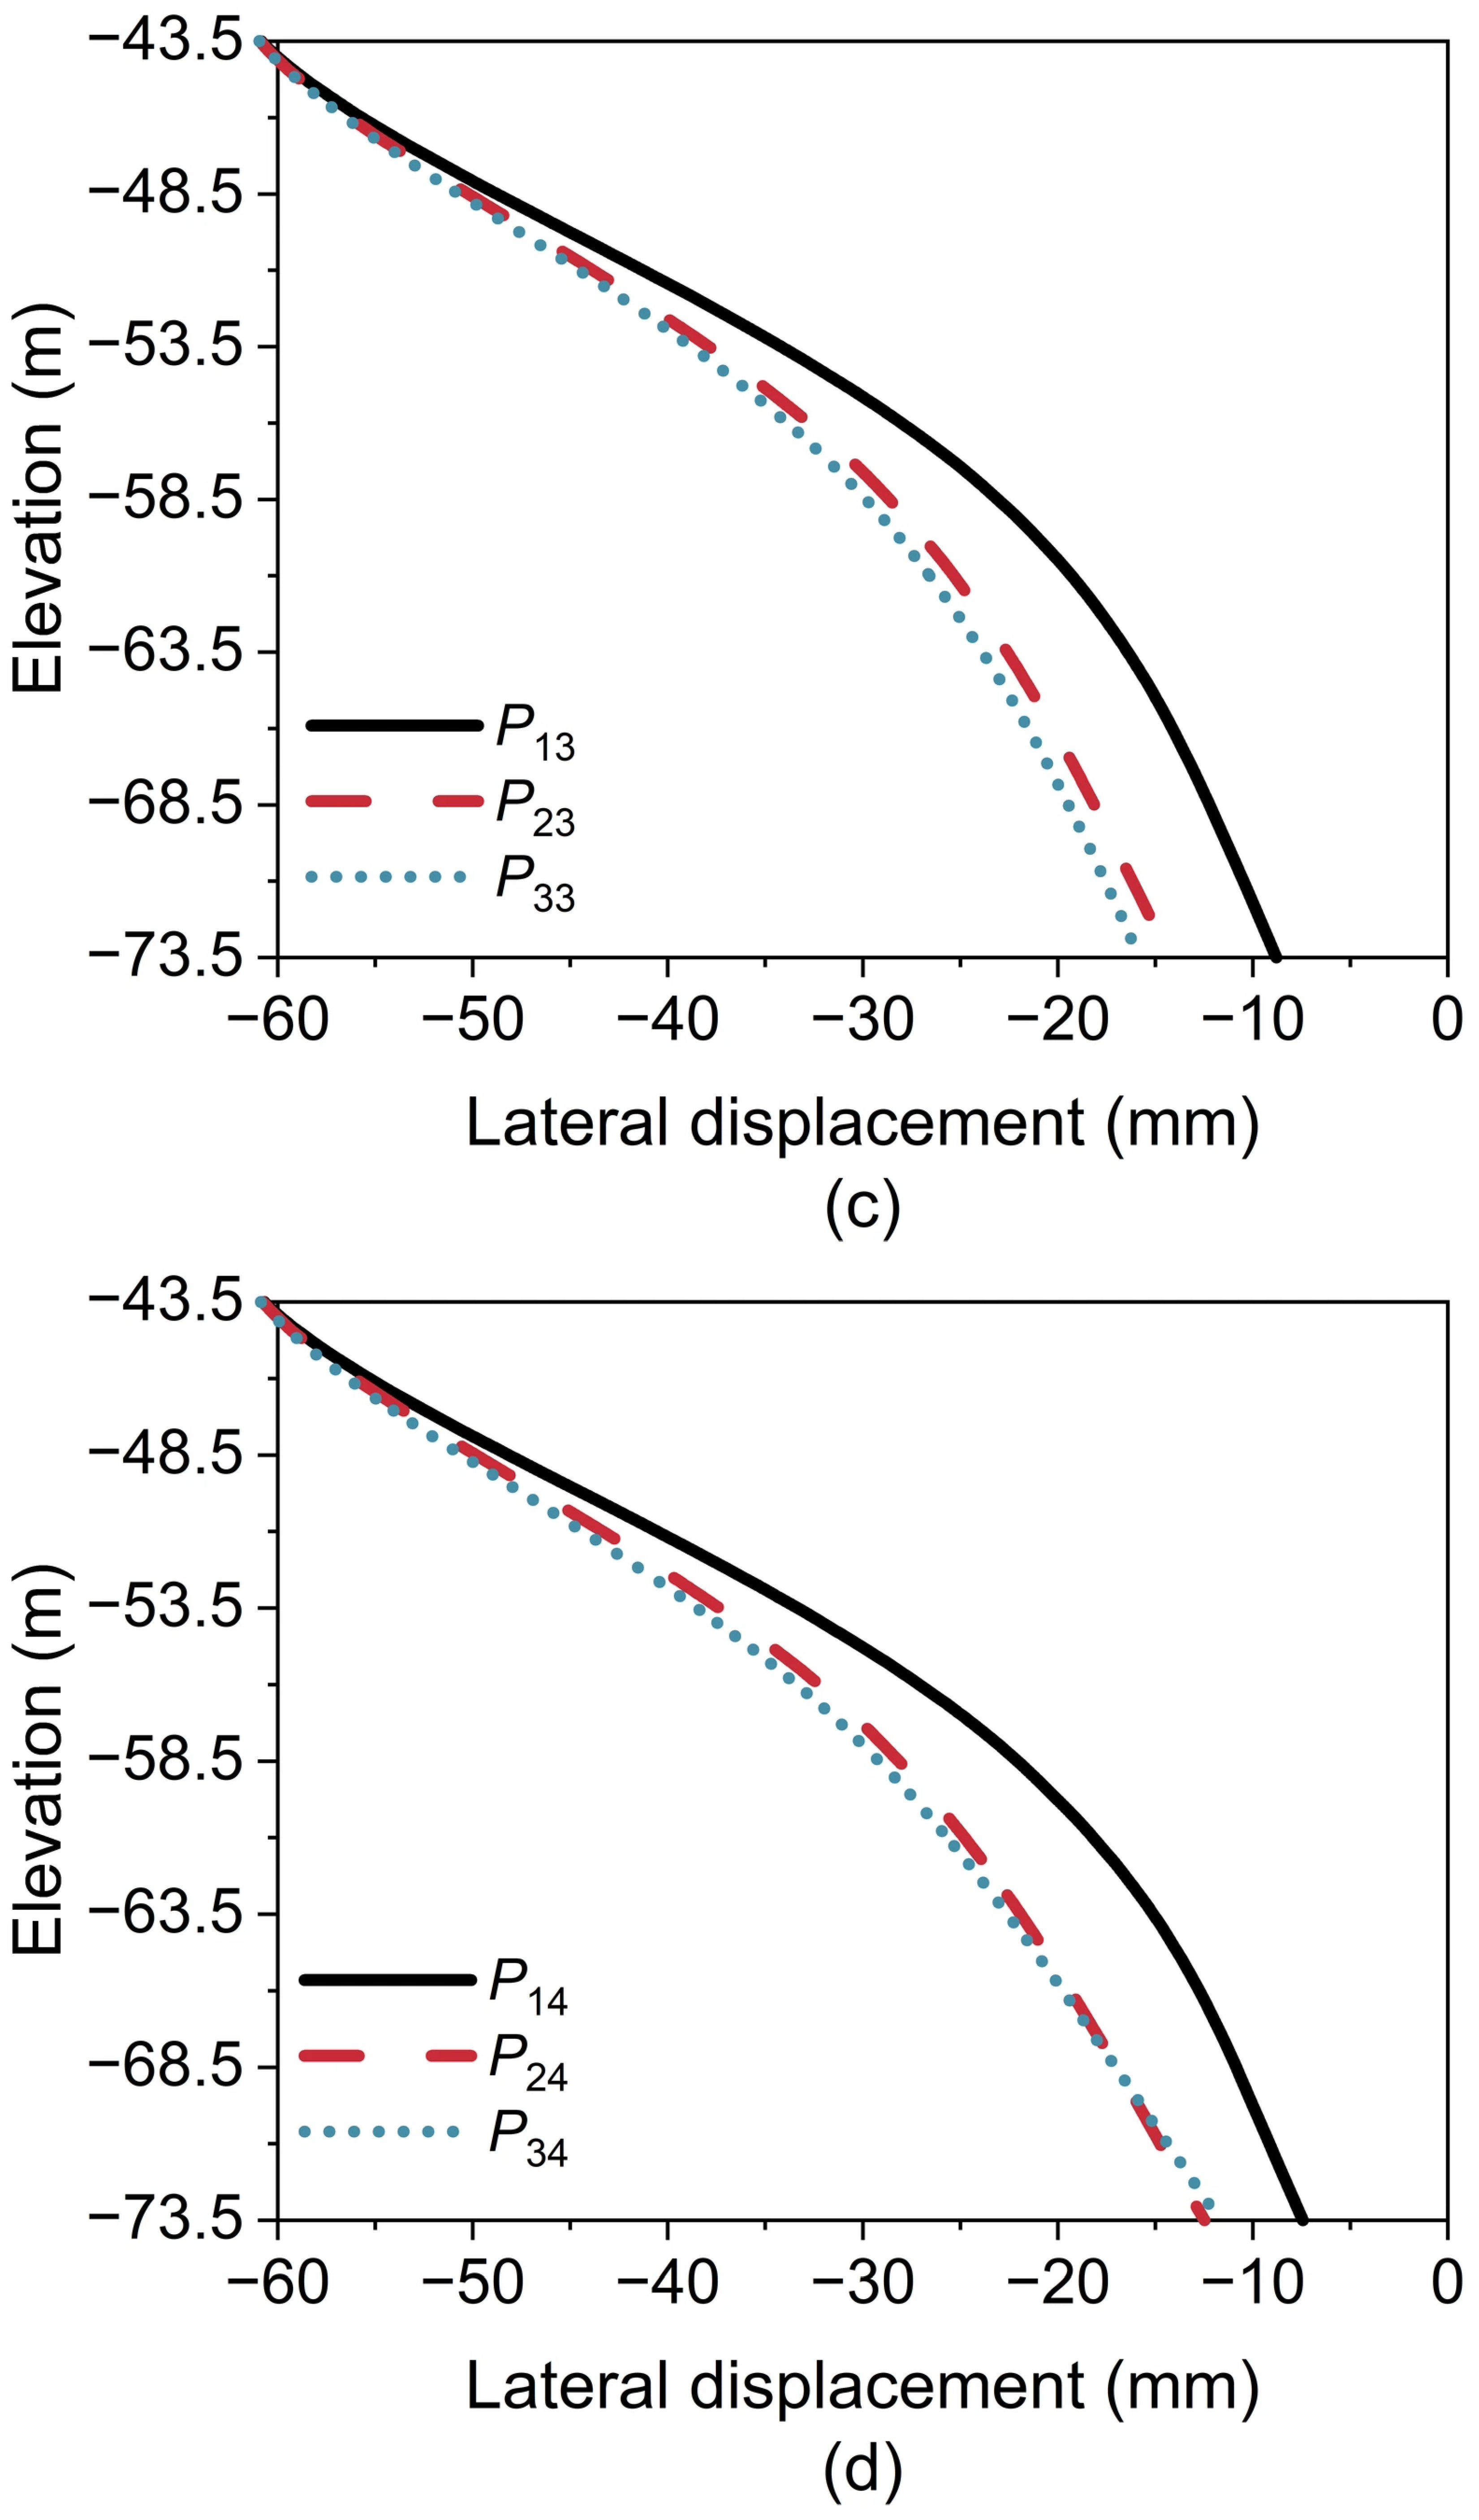
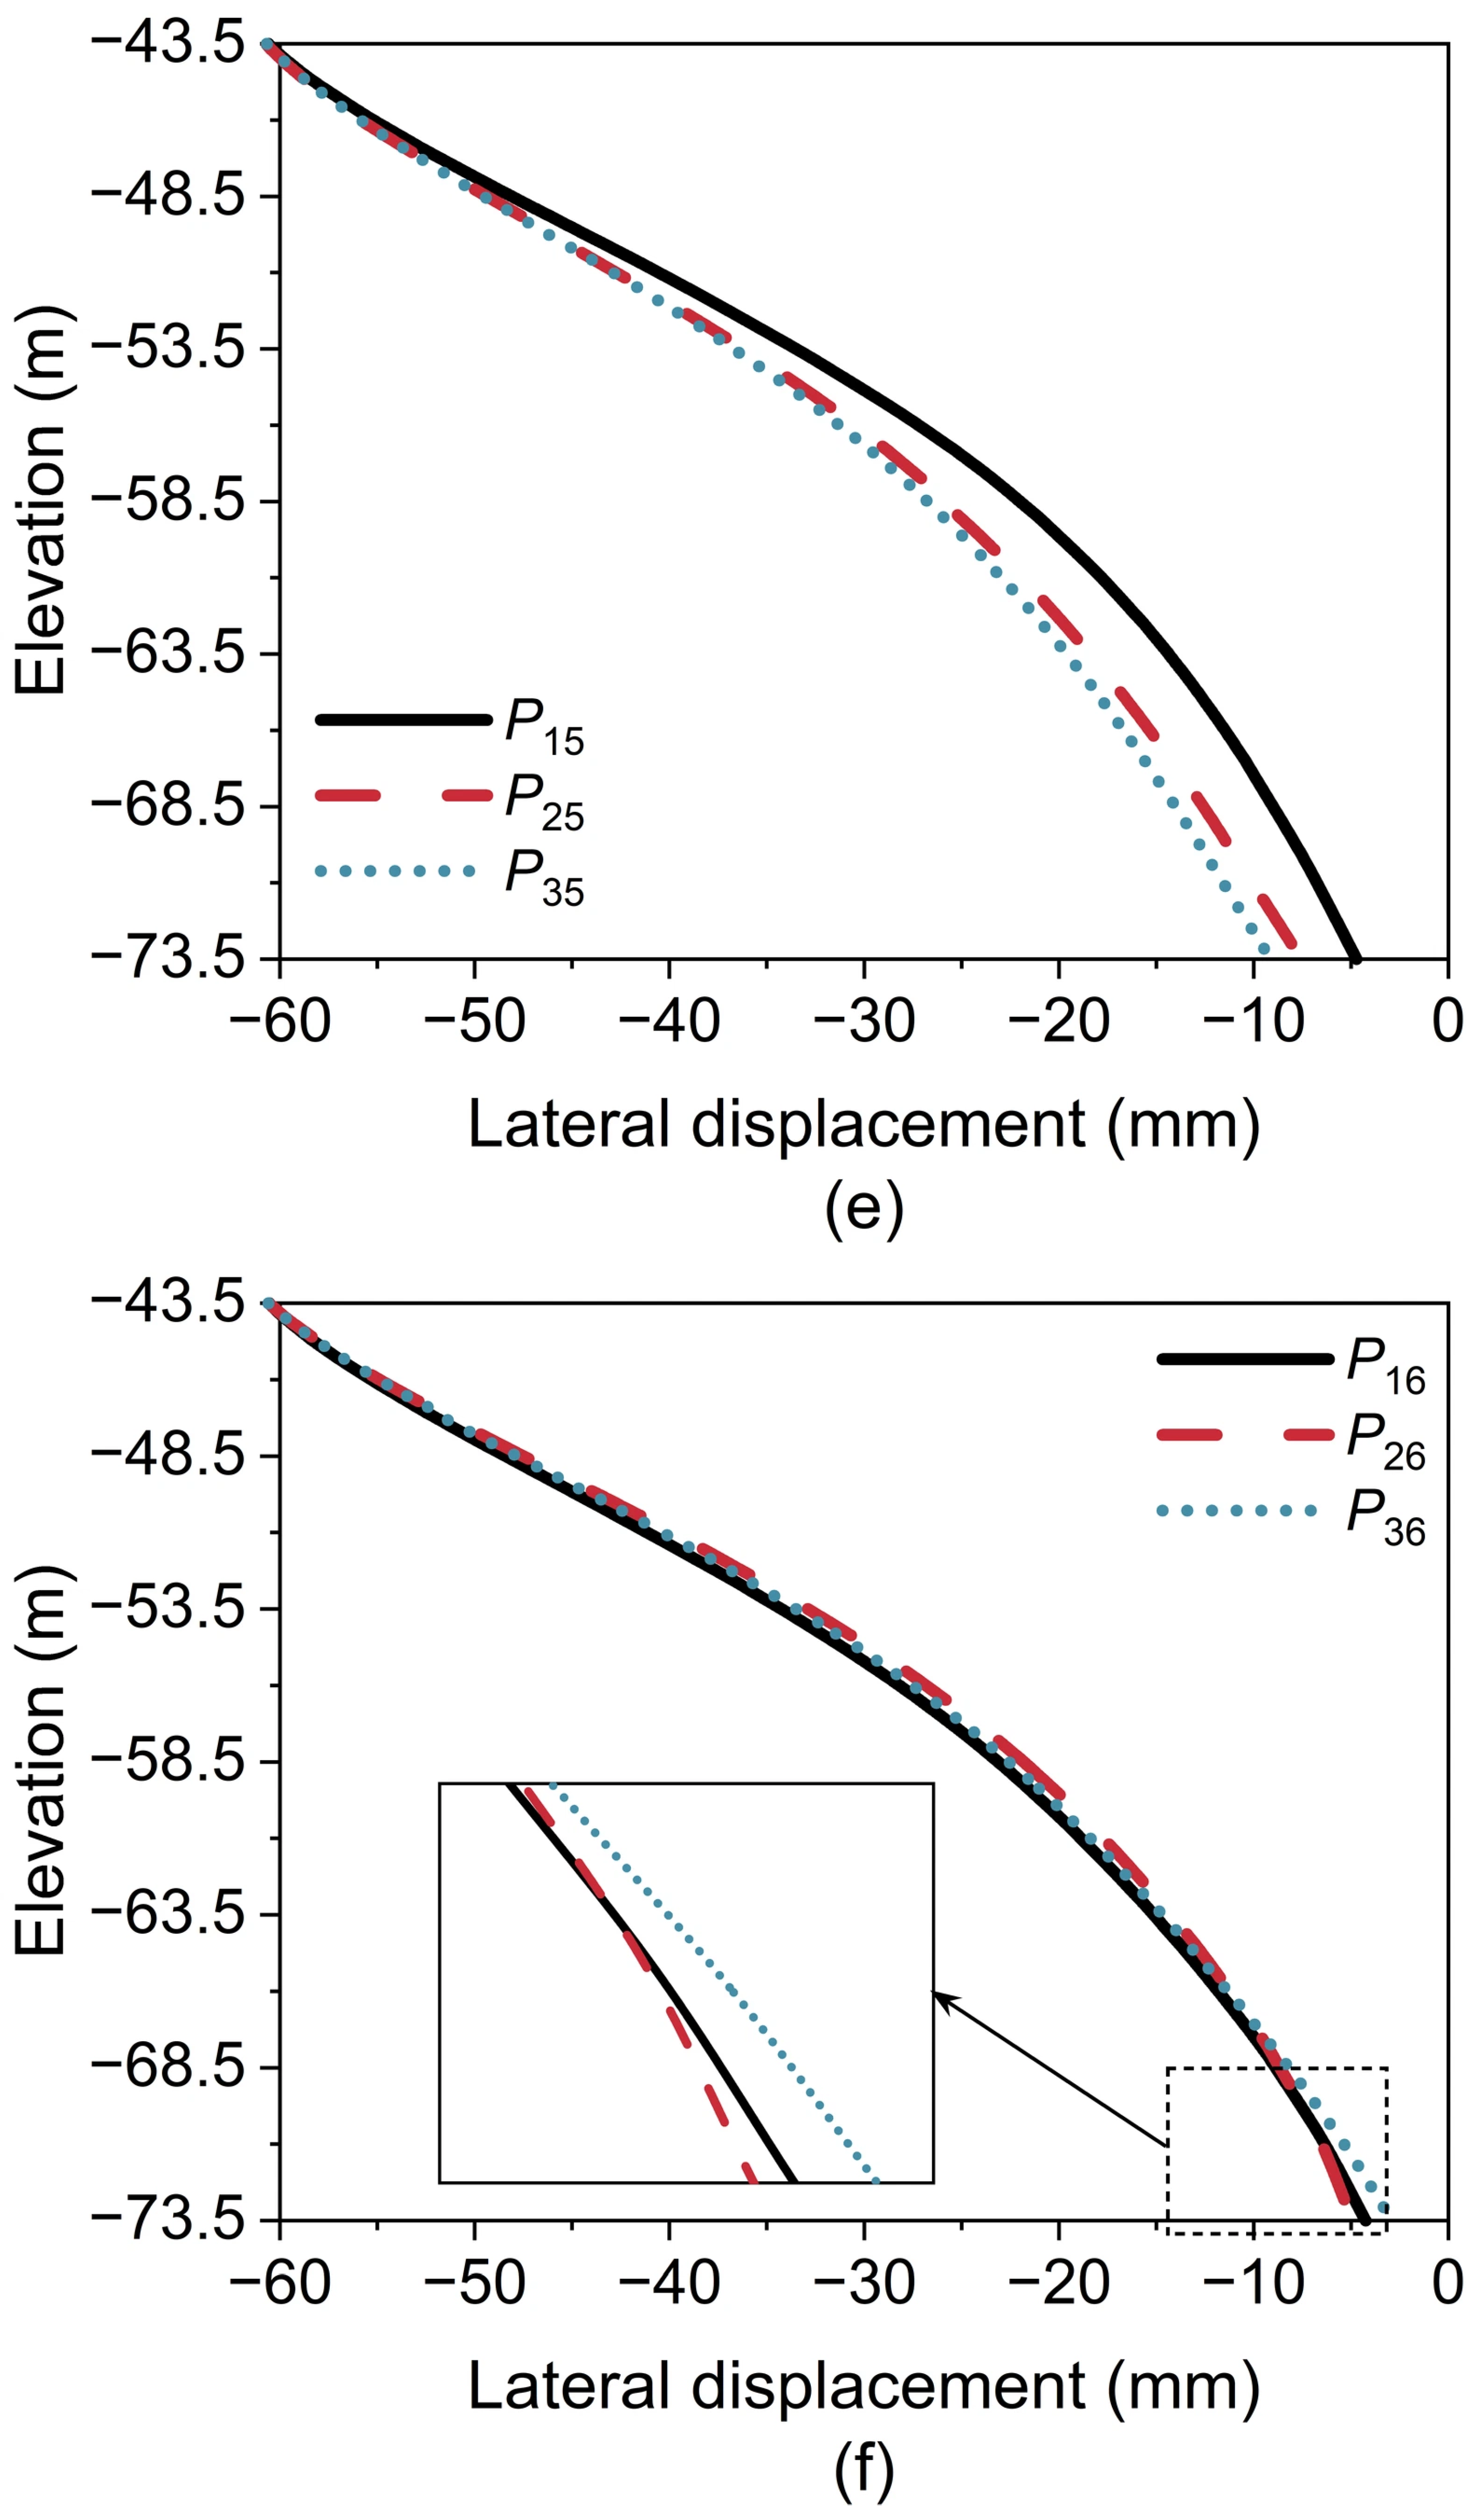
Figure 11 and Figure 12 show lateral displacements along pile shafts in the longitudinal and transverse directions (Loading Case 10), respectively. The pile heads are embedded in the bottom sealing concrete of the caisson, resulting in uniform displacements at the pile heads, whereas the shaft displacements vary along the depth. In the longitudinal direction (Figure 11), for Rows 1 to 3, the displacements of piles in Column 6 (4.25 mm at pile tip) are generally lower than those observed in Columns 1–5 (4.72–8.75 mm at pile tip). In the transverse direction (Figure 12), for Columns 1–5, the displacements of piles in Row 1 (4.72–7.82 mm at pile tip) are moderately smaller than those in Rows 2 and 3 (7.55–15.5 mm at pile tip). By contrast, in Column 6, the three piles (4.25 mm for P16, 4.91 mm for P26, and 2.91 mm for P36 at pile tip) display comparable lateral displacements, with pile P36 exhibiting the minimum displacement, which is attributable to the combined V-H-M loading on the pile heads.
Figure 11.
Lateral displacements along pile shafts in the longitudinal direction (Loading Case 10): (a) Row 1; (b) Row 2; and (c) Row 3.
Figure 12.
Lateral displacements along pile shafts in the transverse direction (Loading Case 10): (a) Column 1; (b) Column 2; (c) Column 3; (d) Column 4; (e) Column 5; and (f) Column 6.
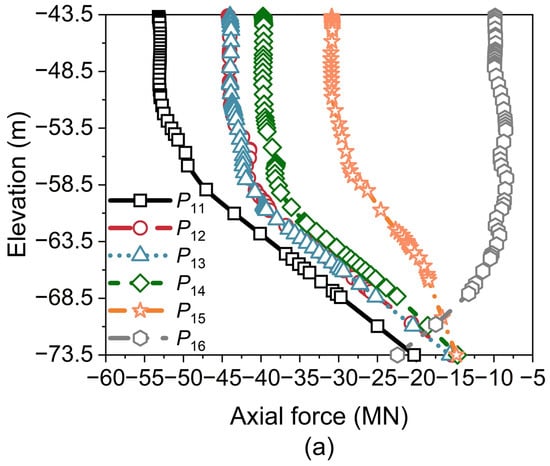
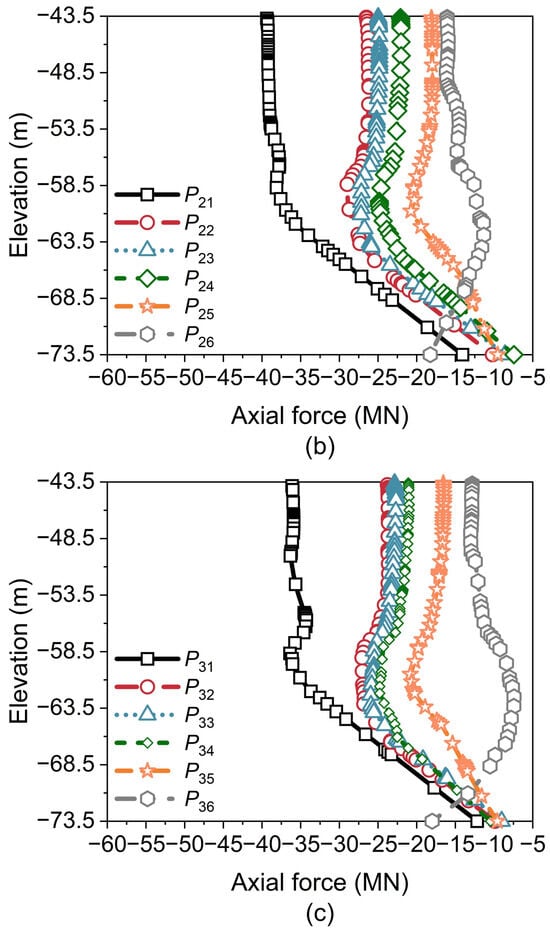
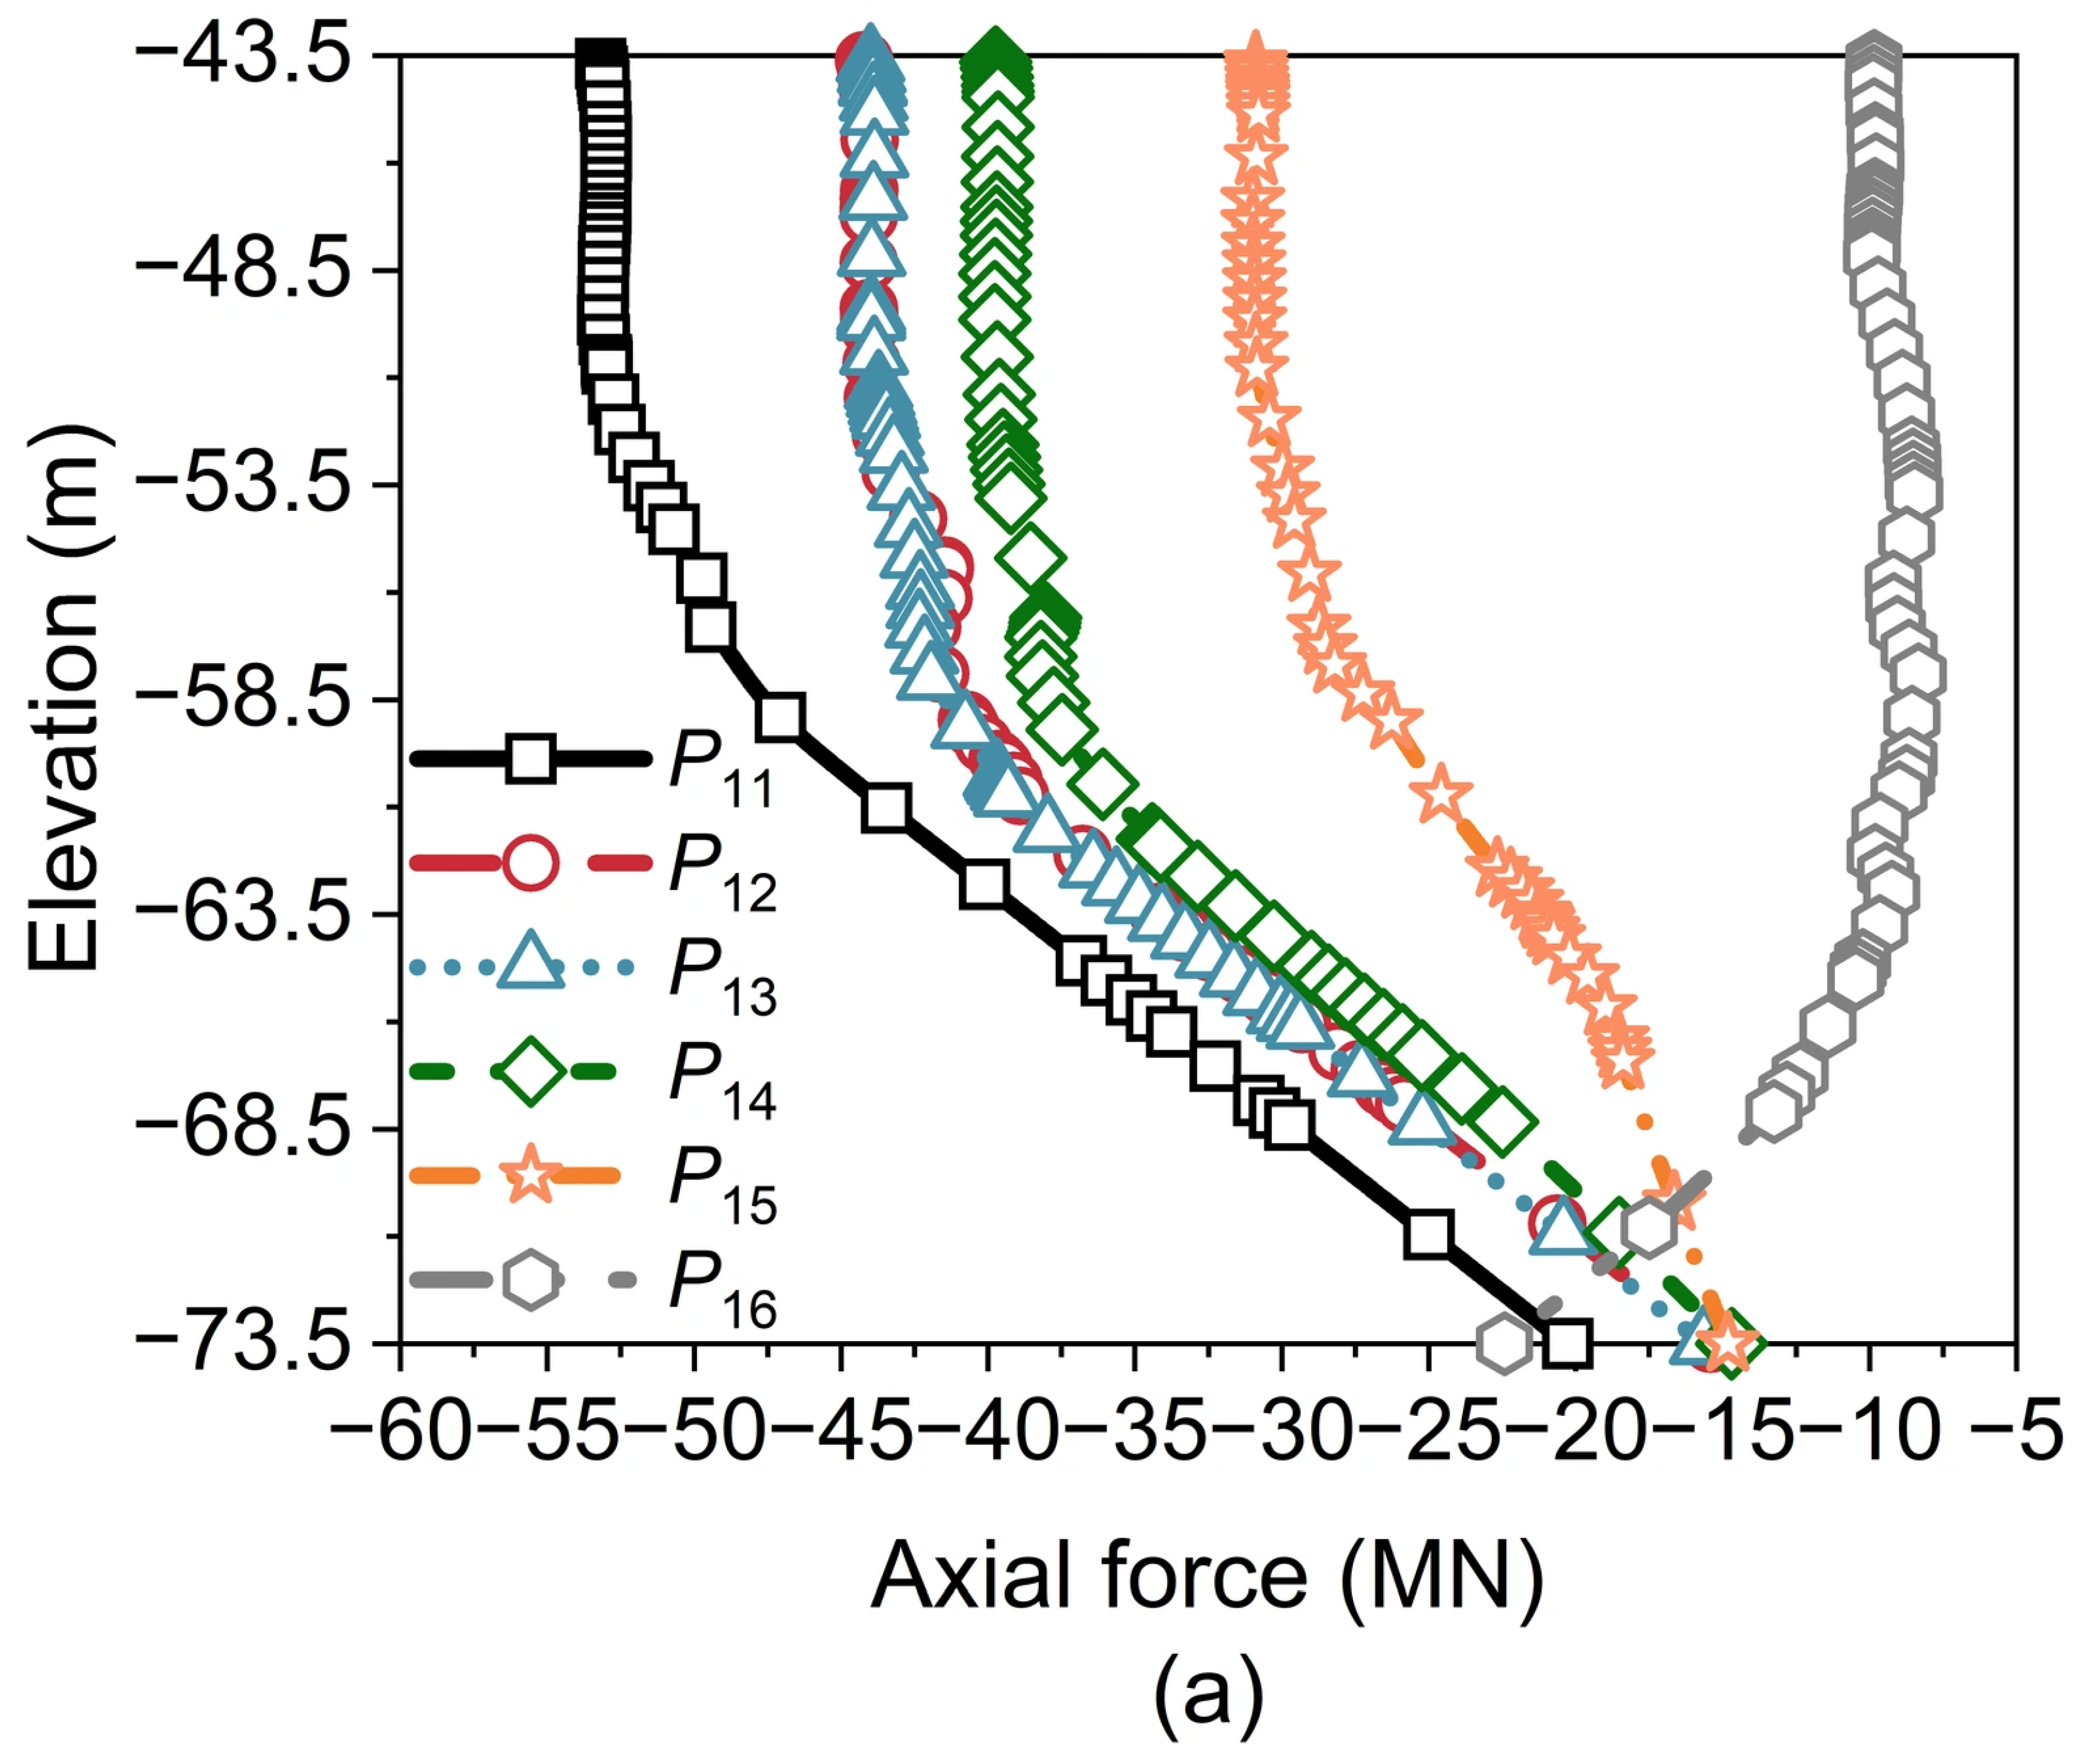
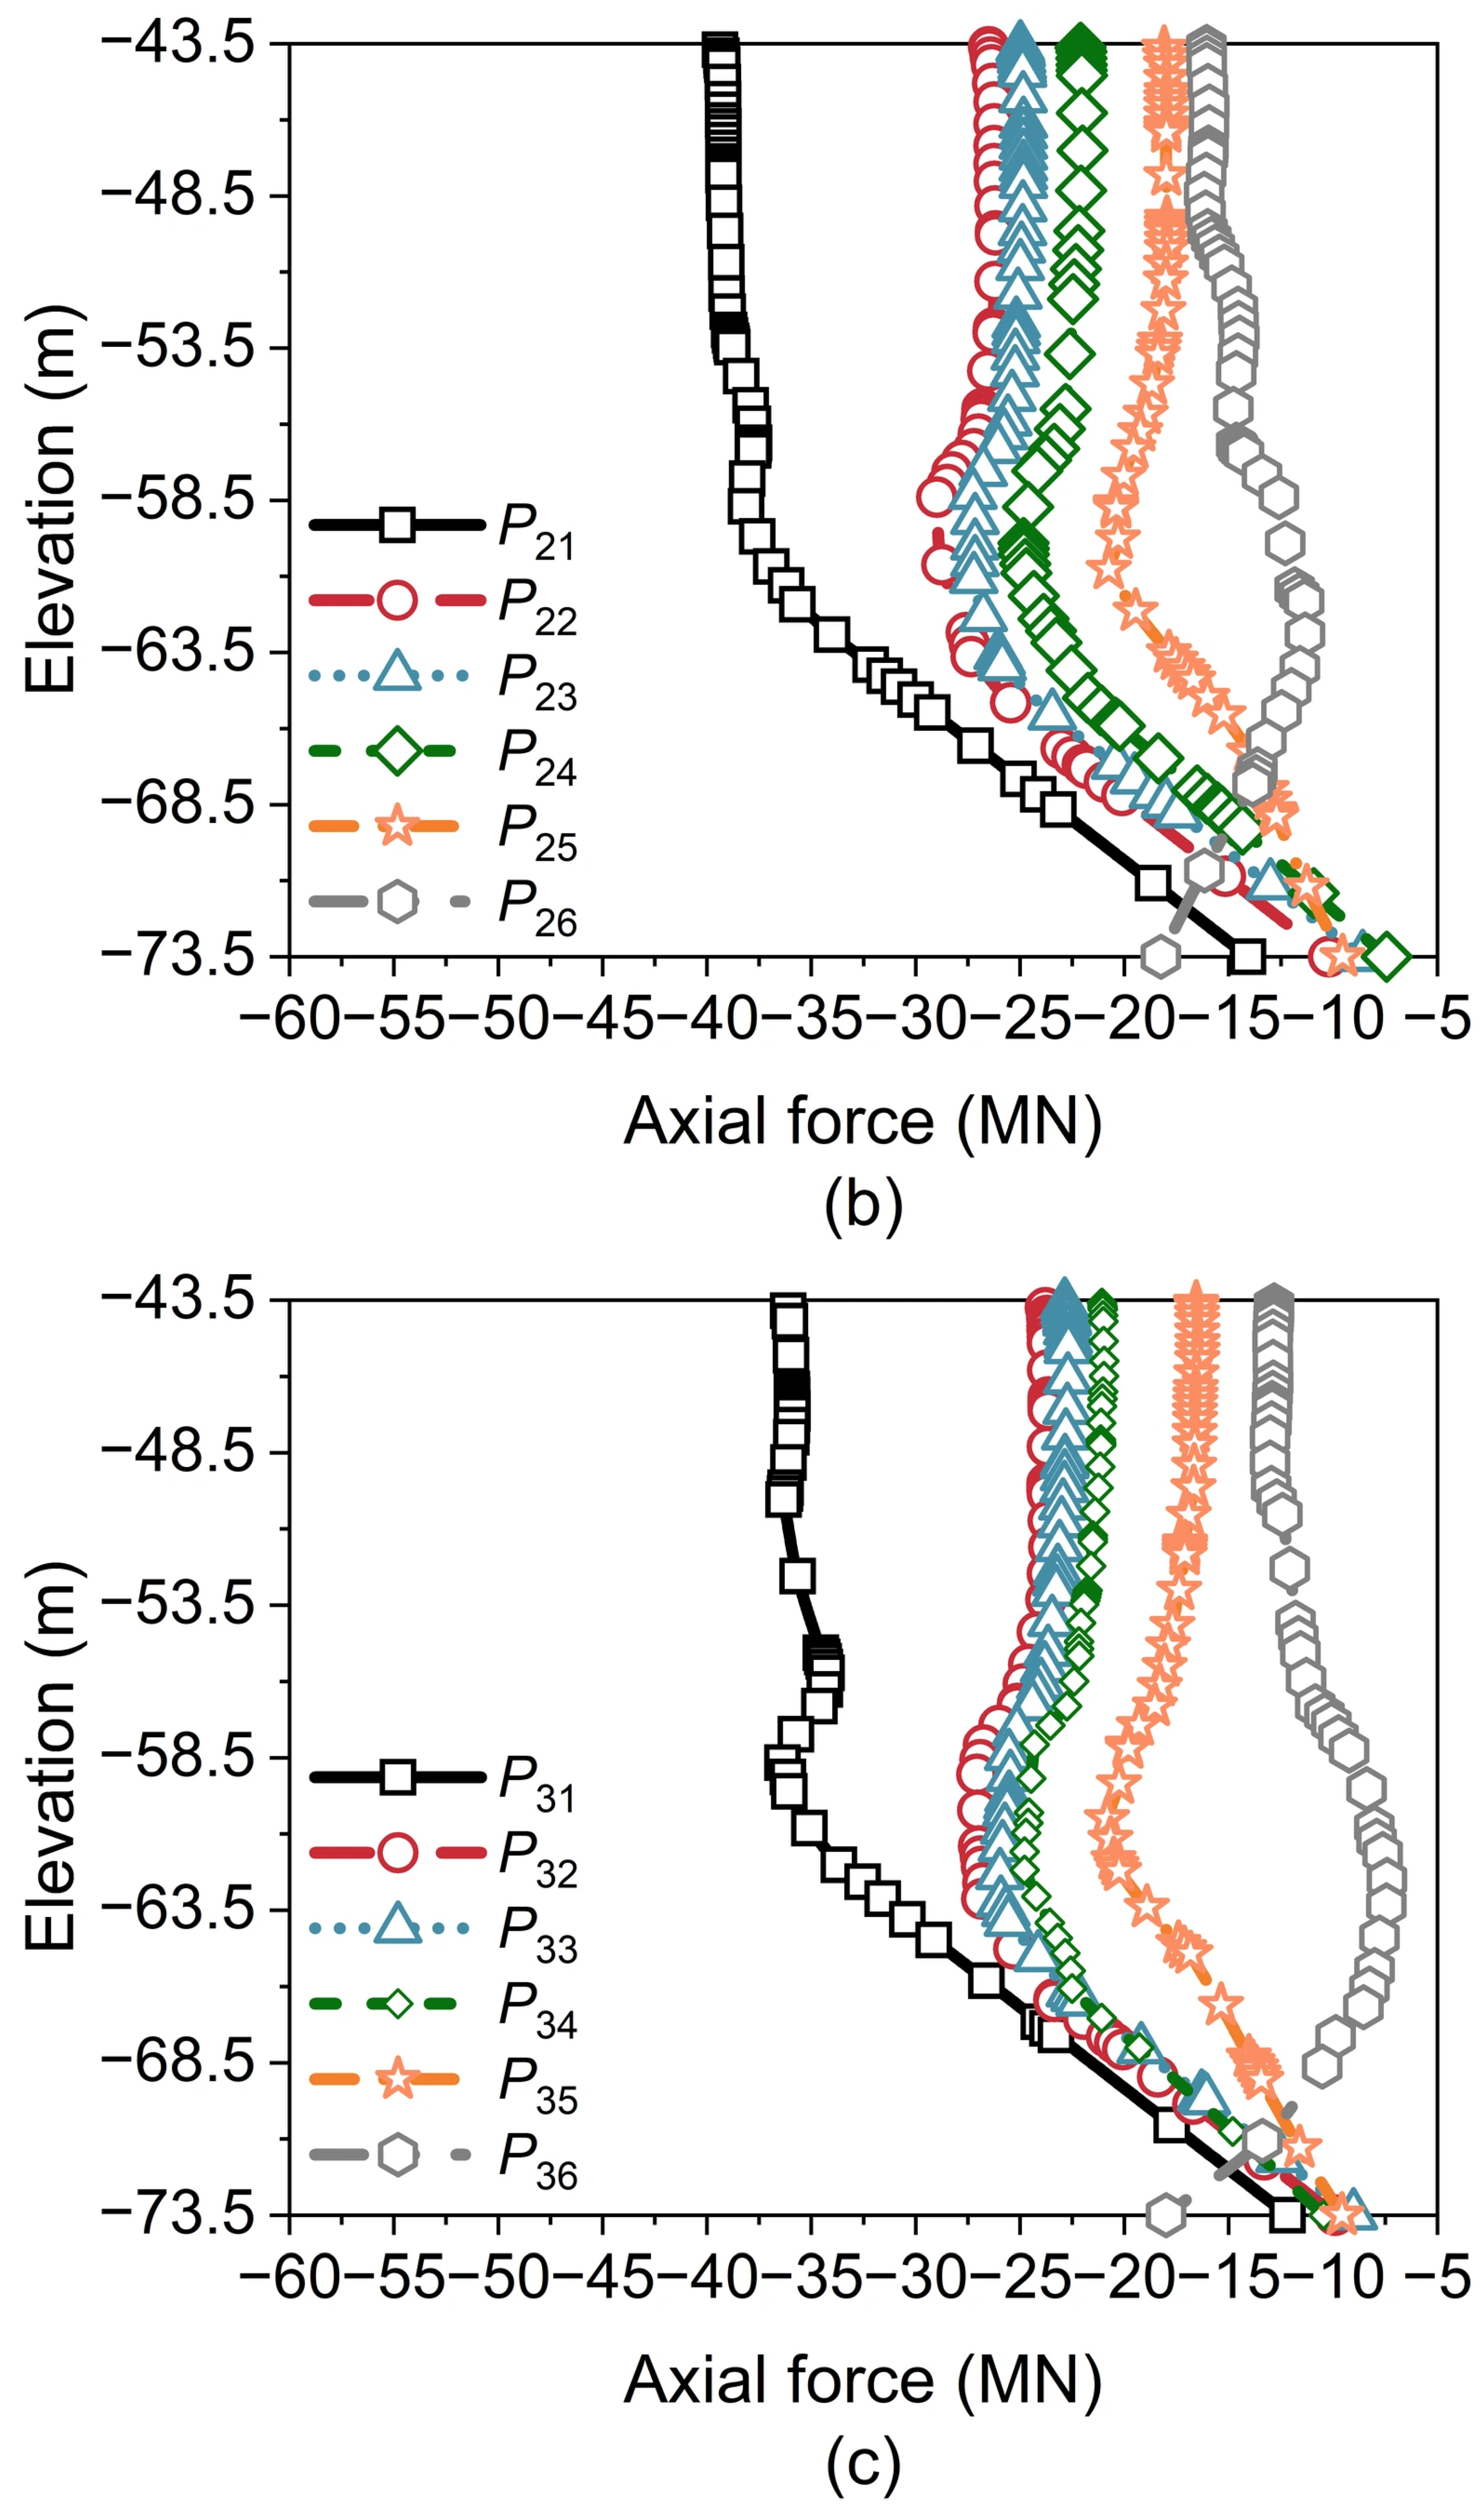
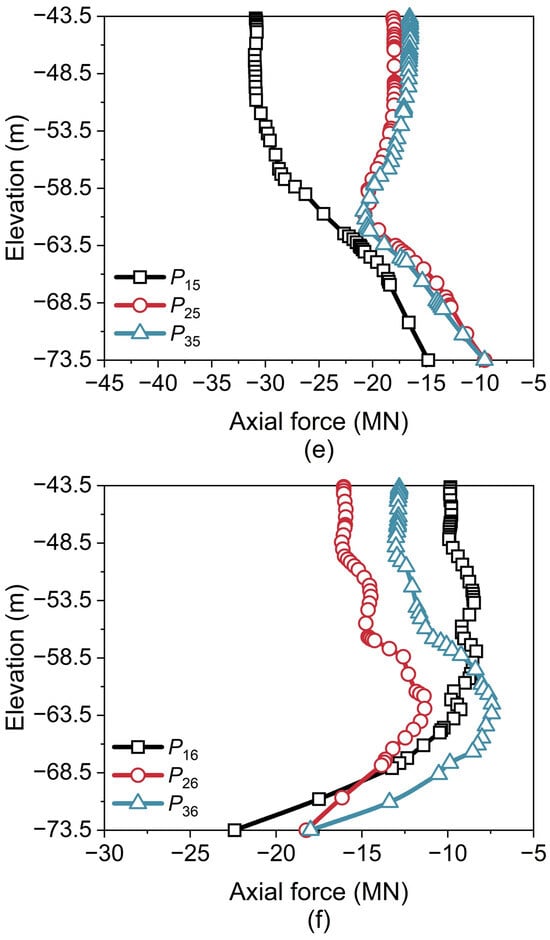
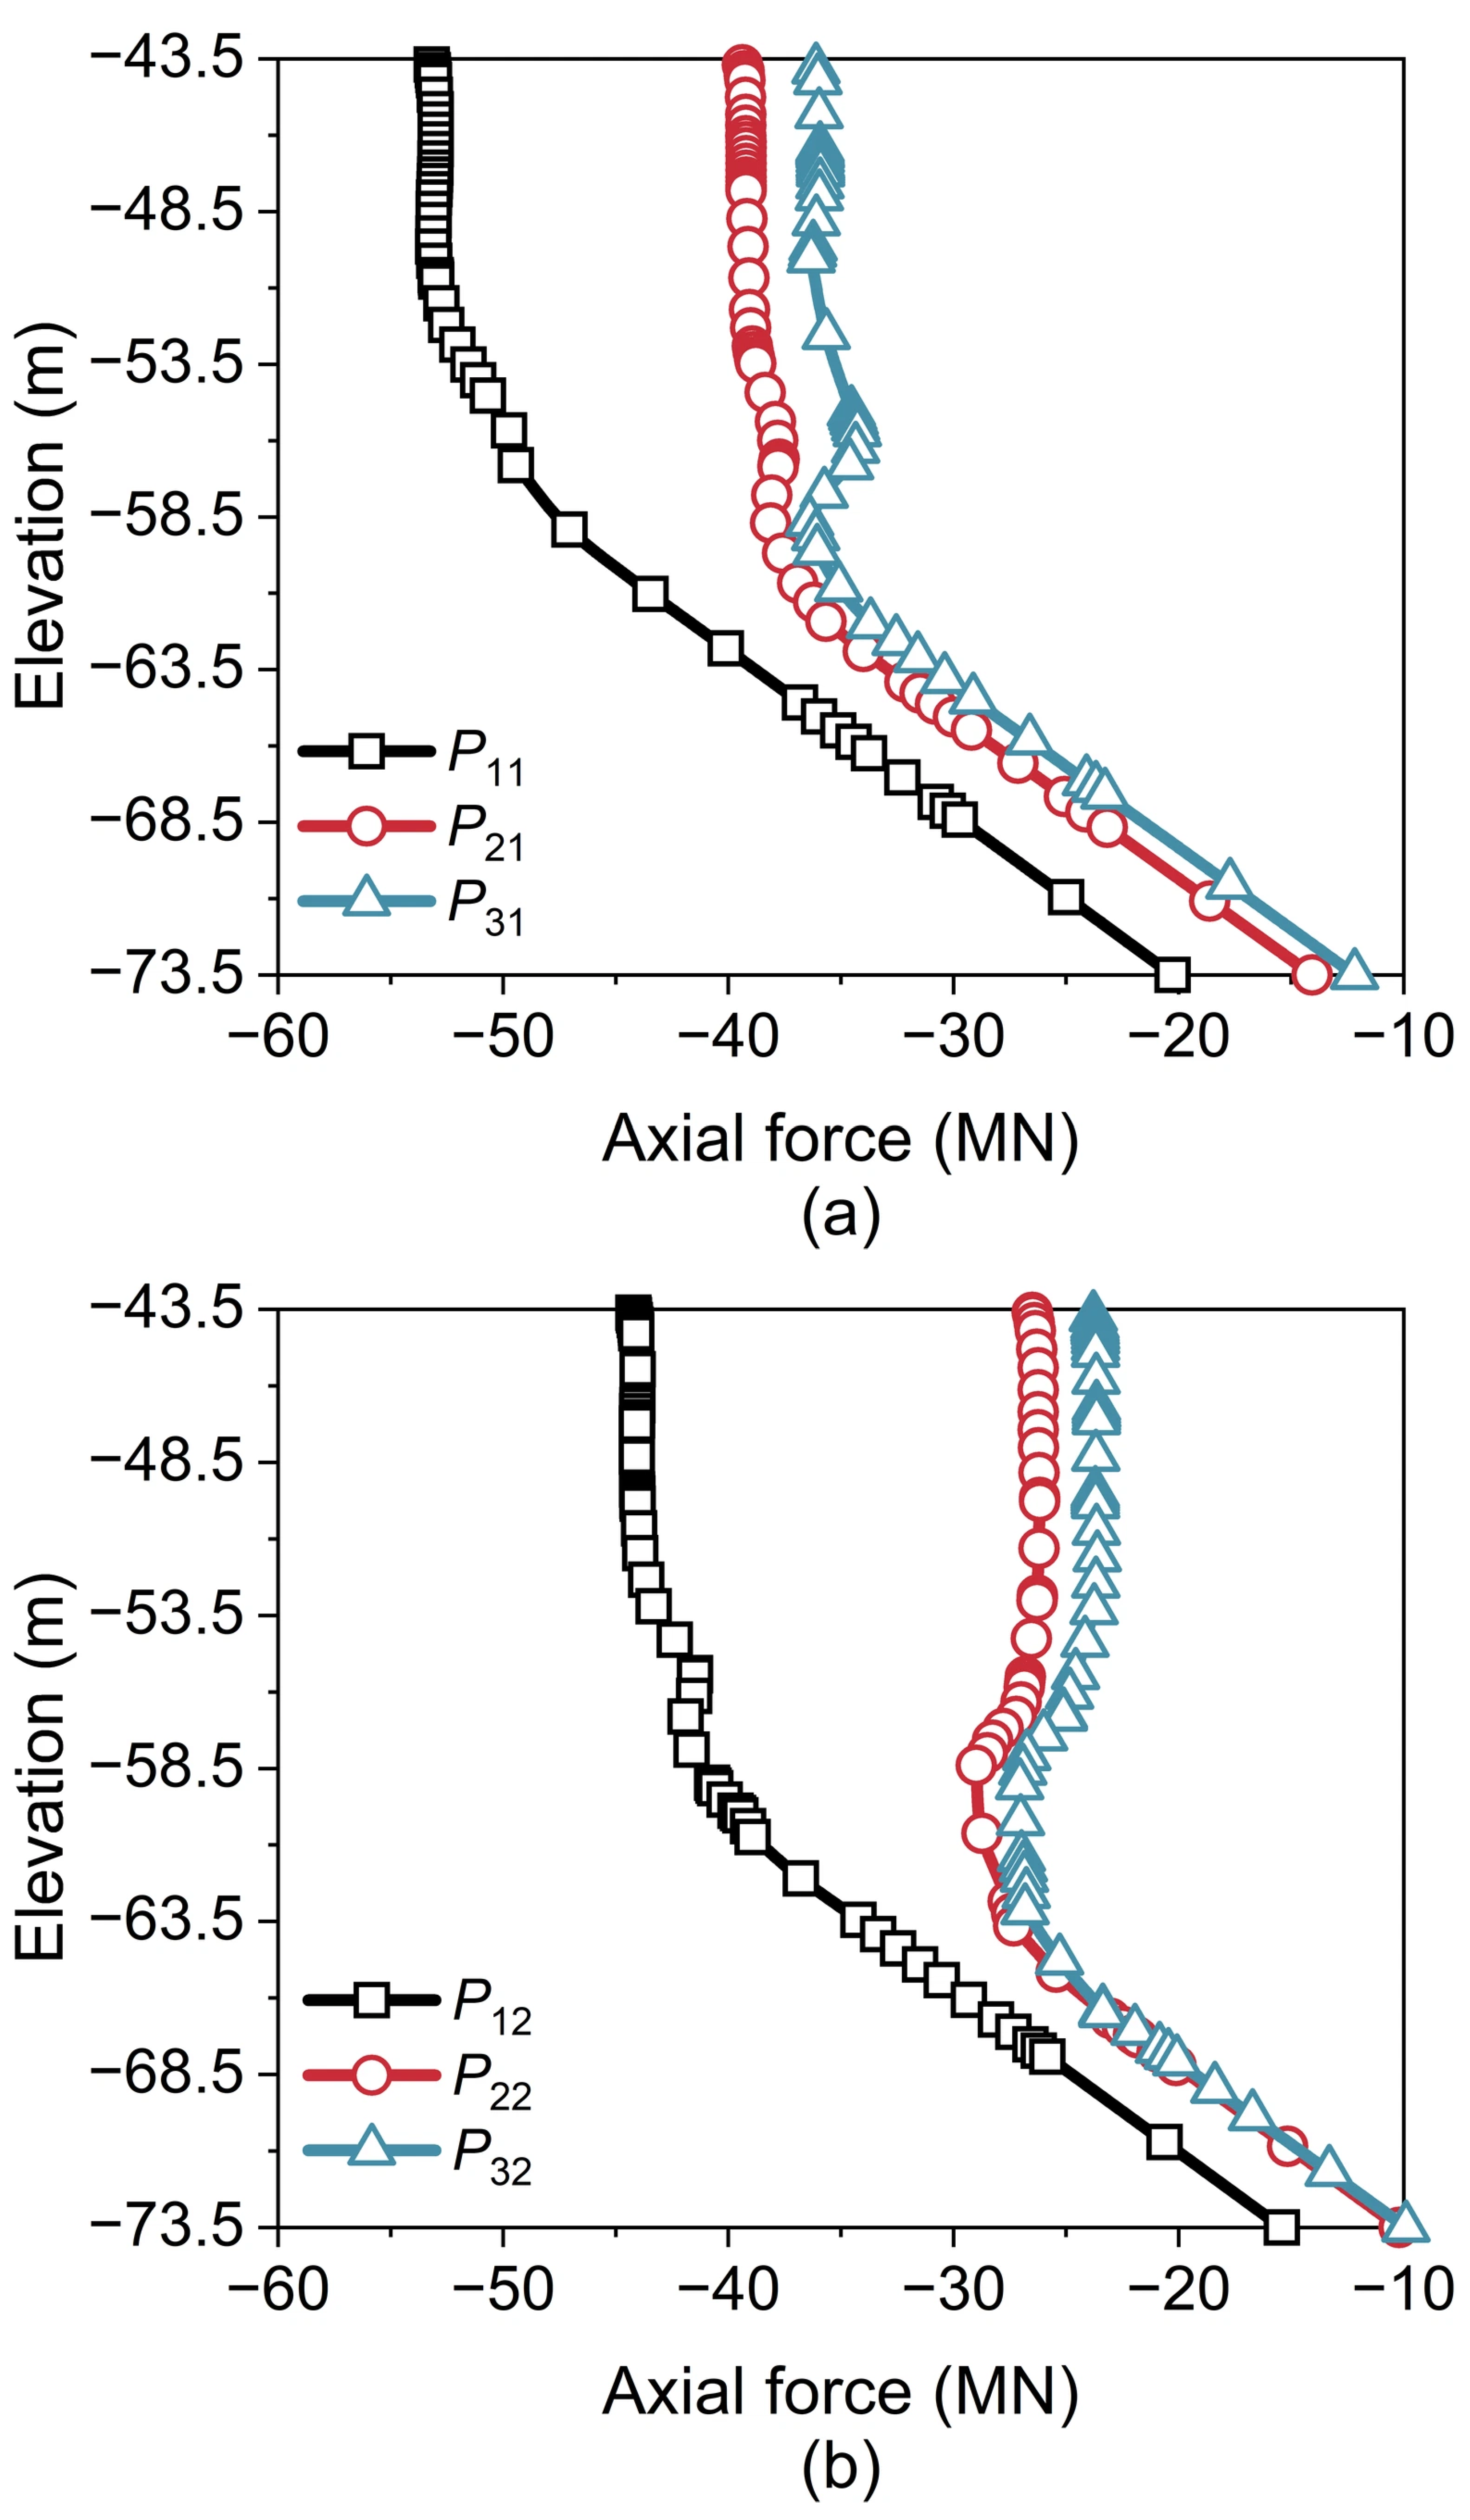
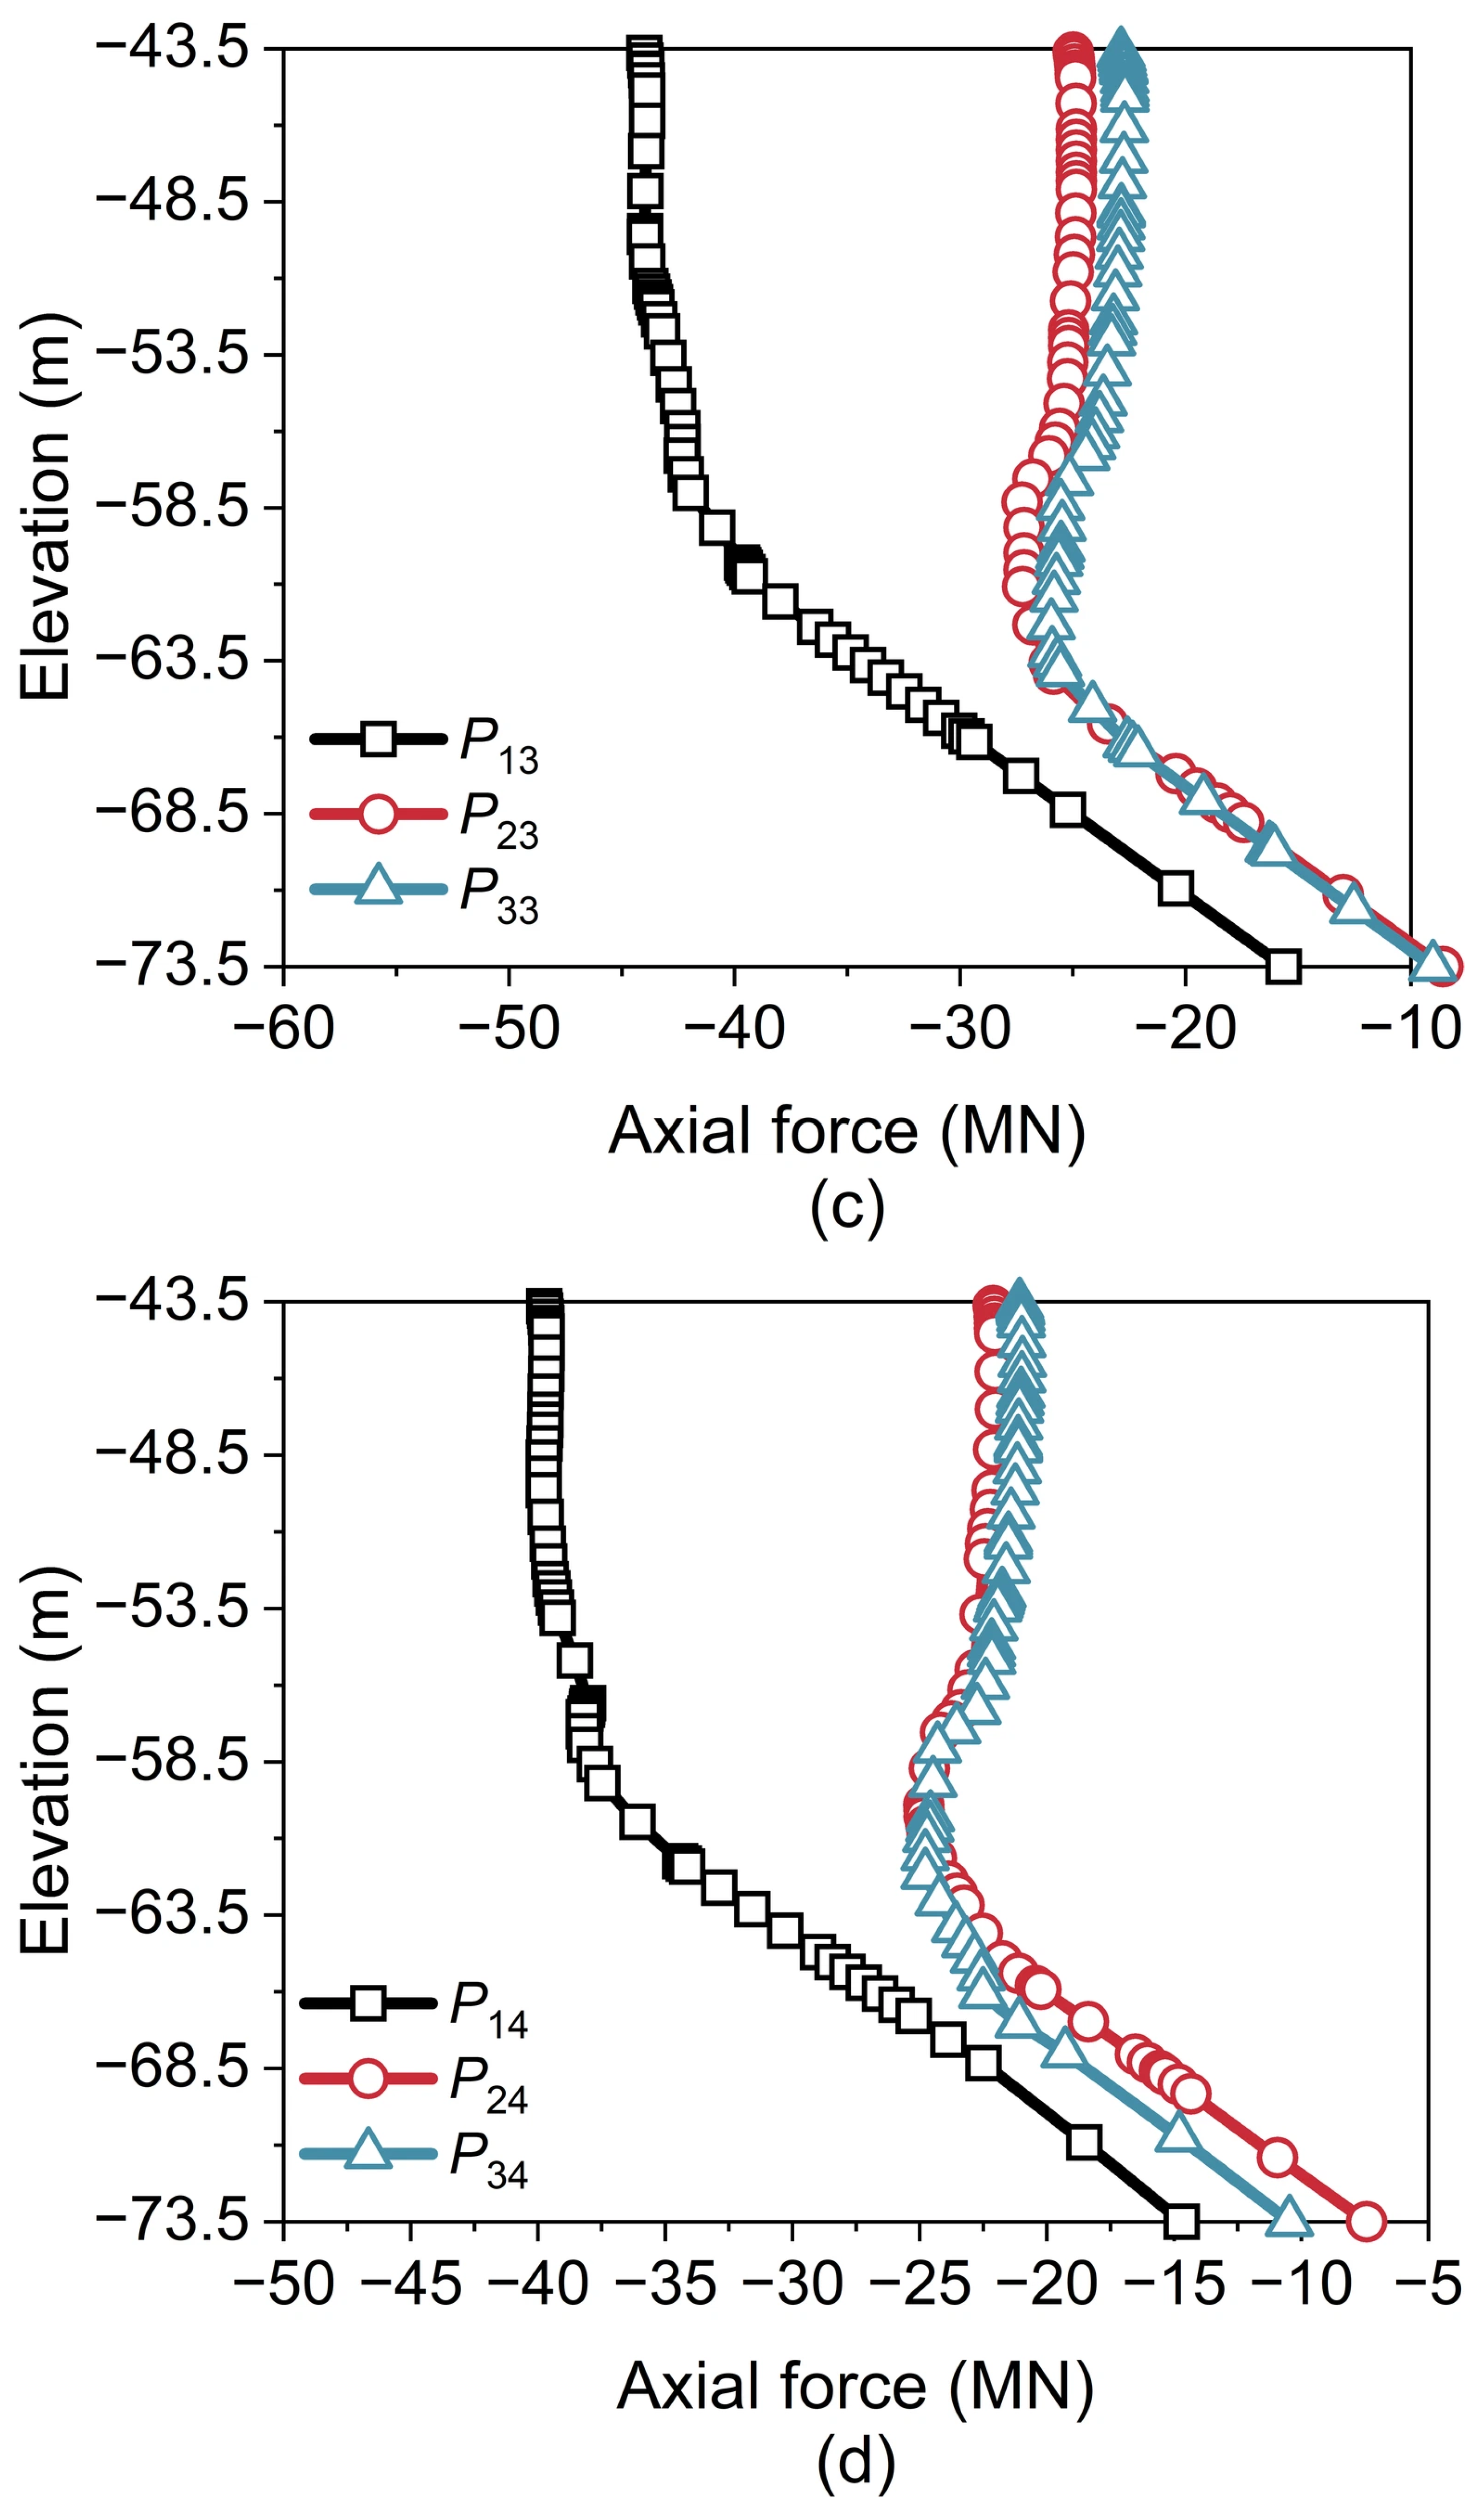
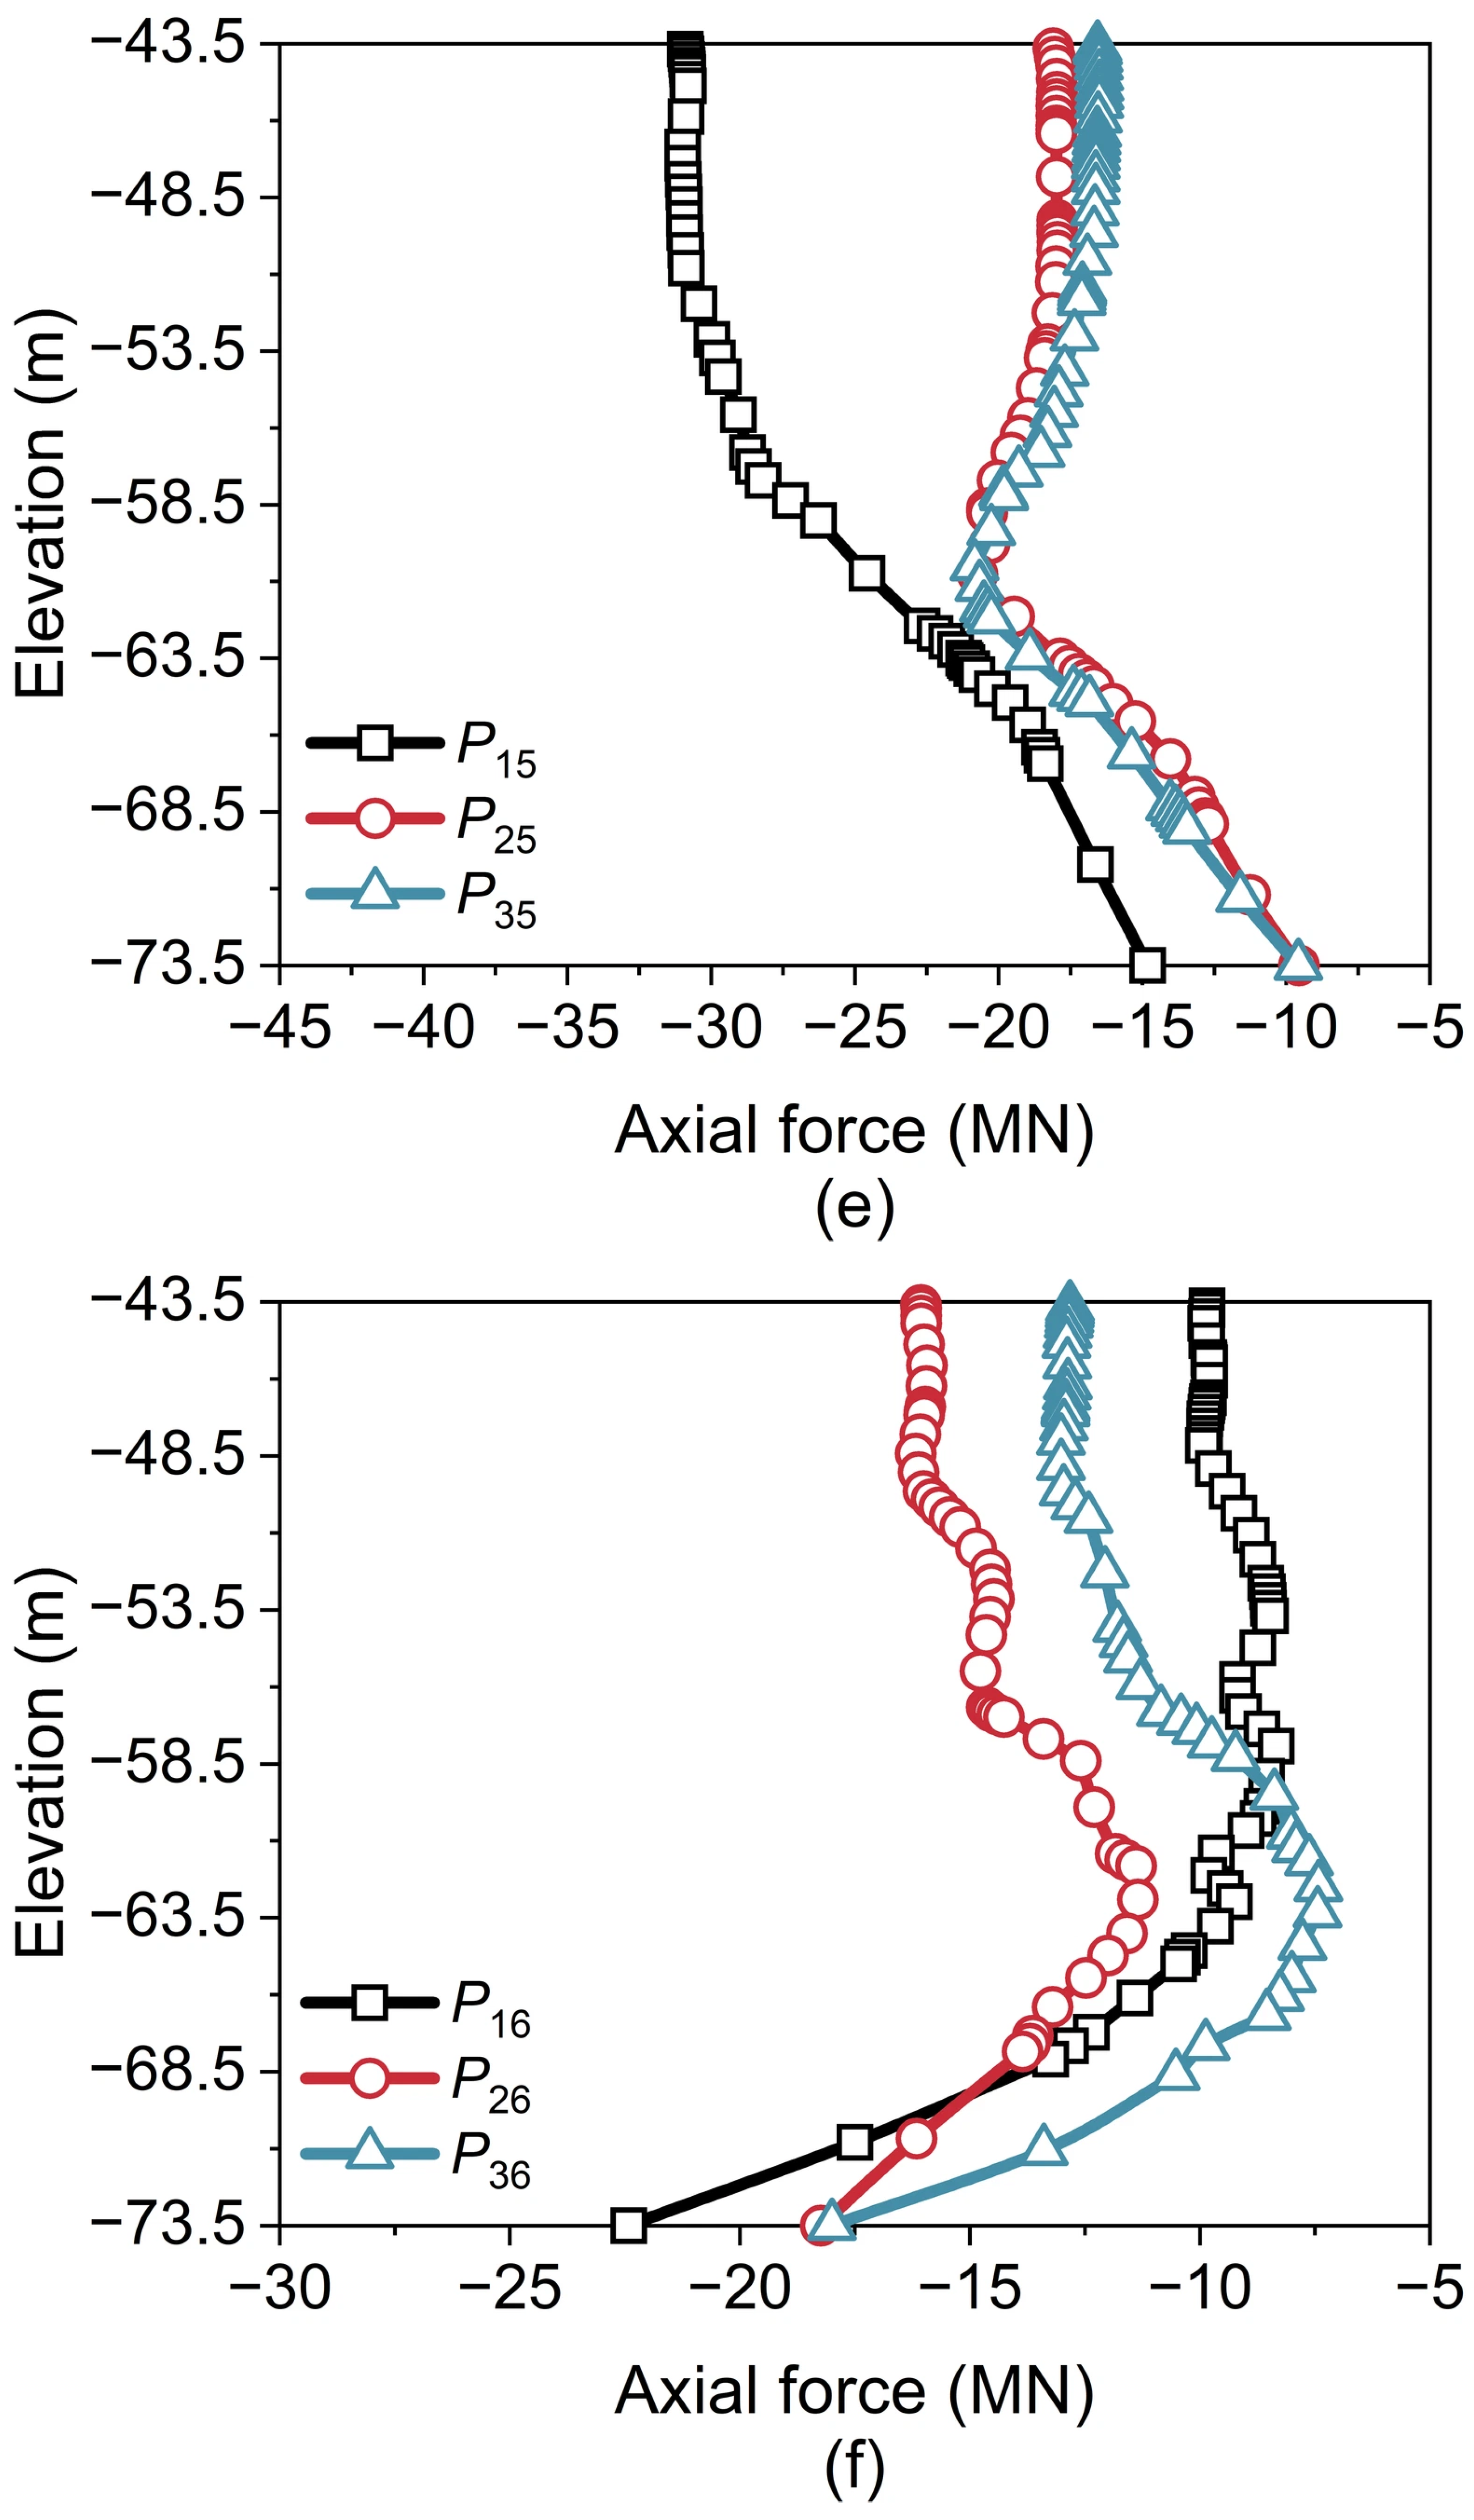
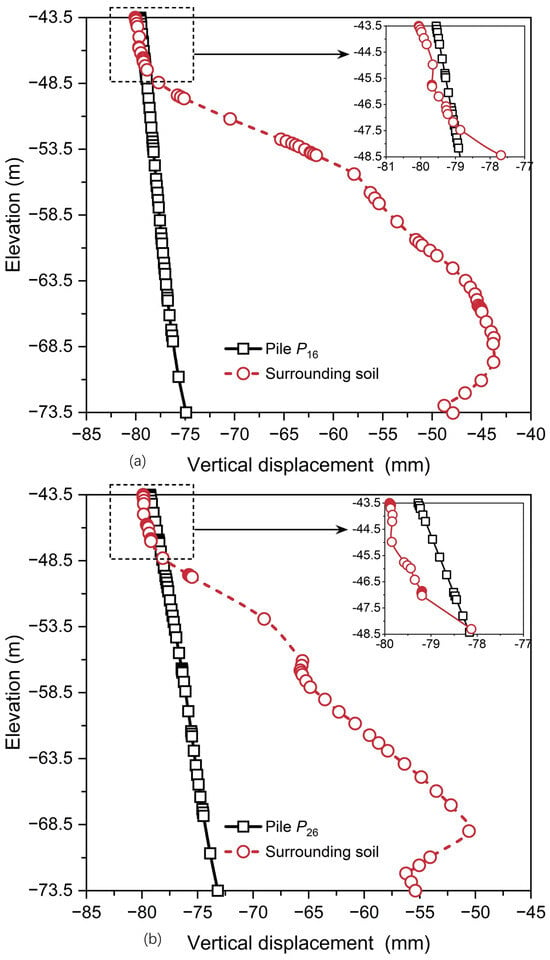
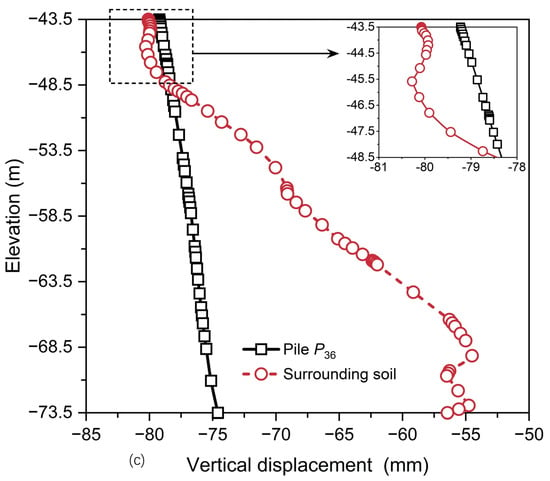
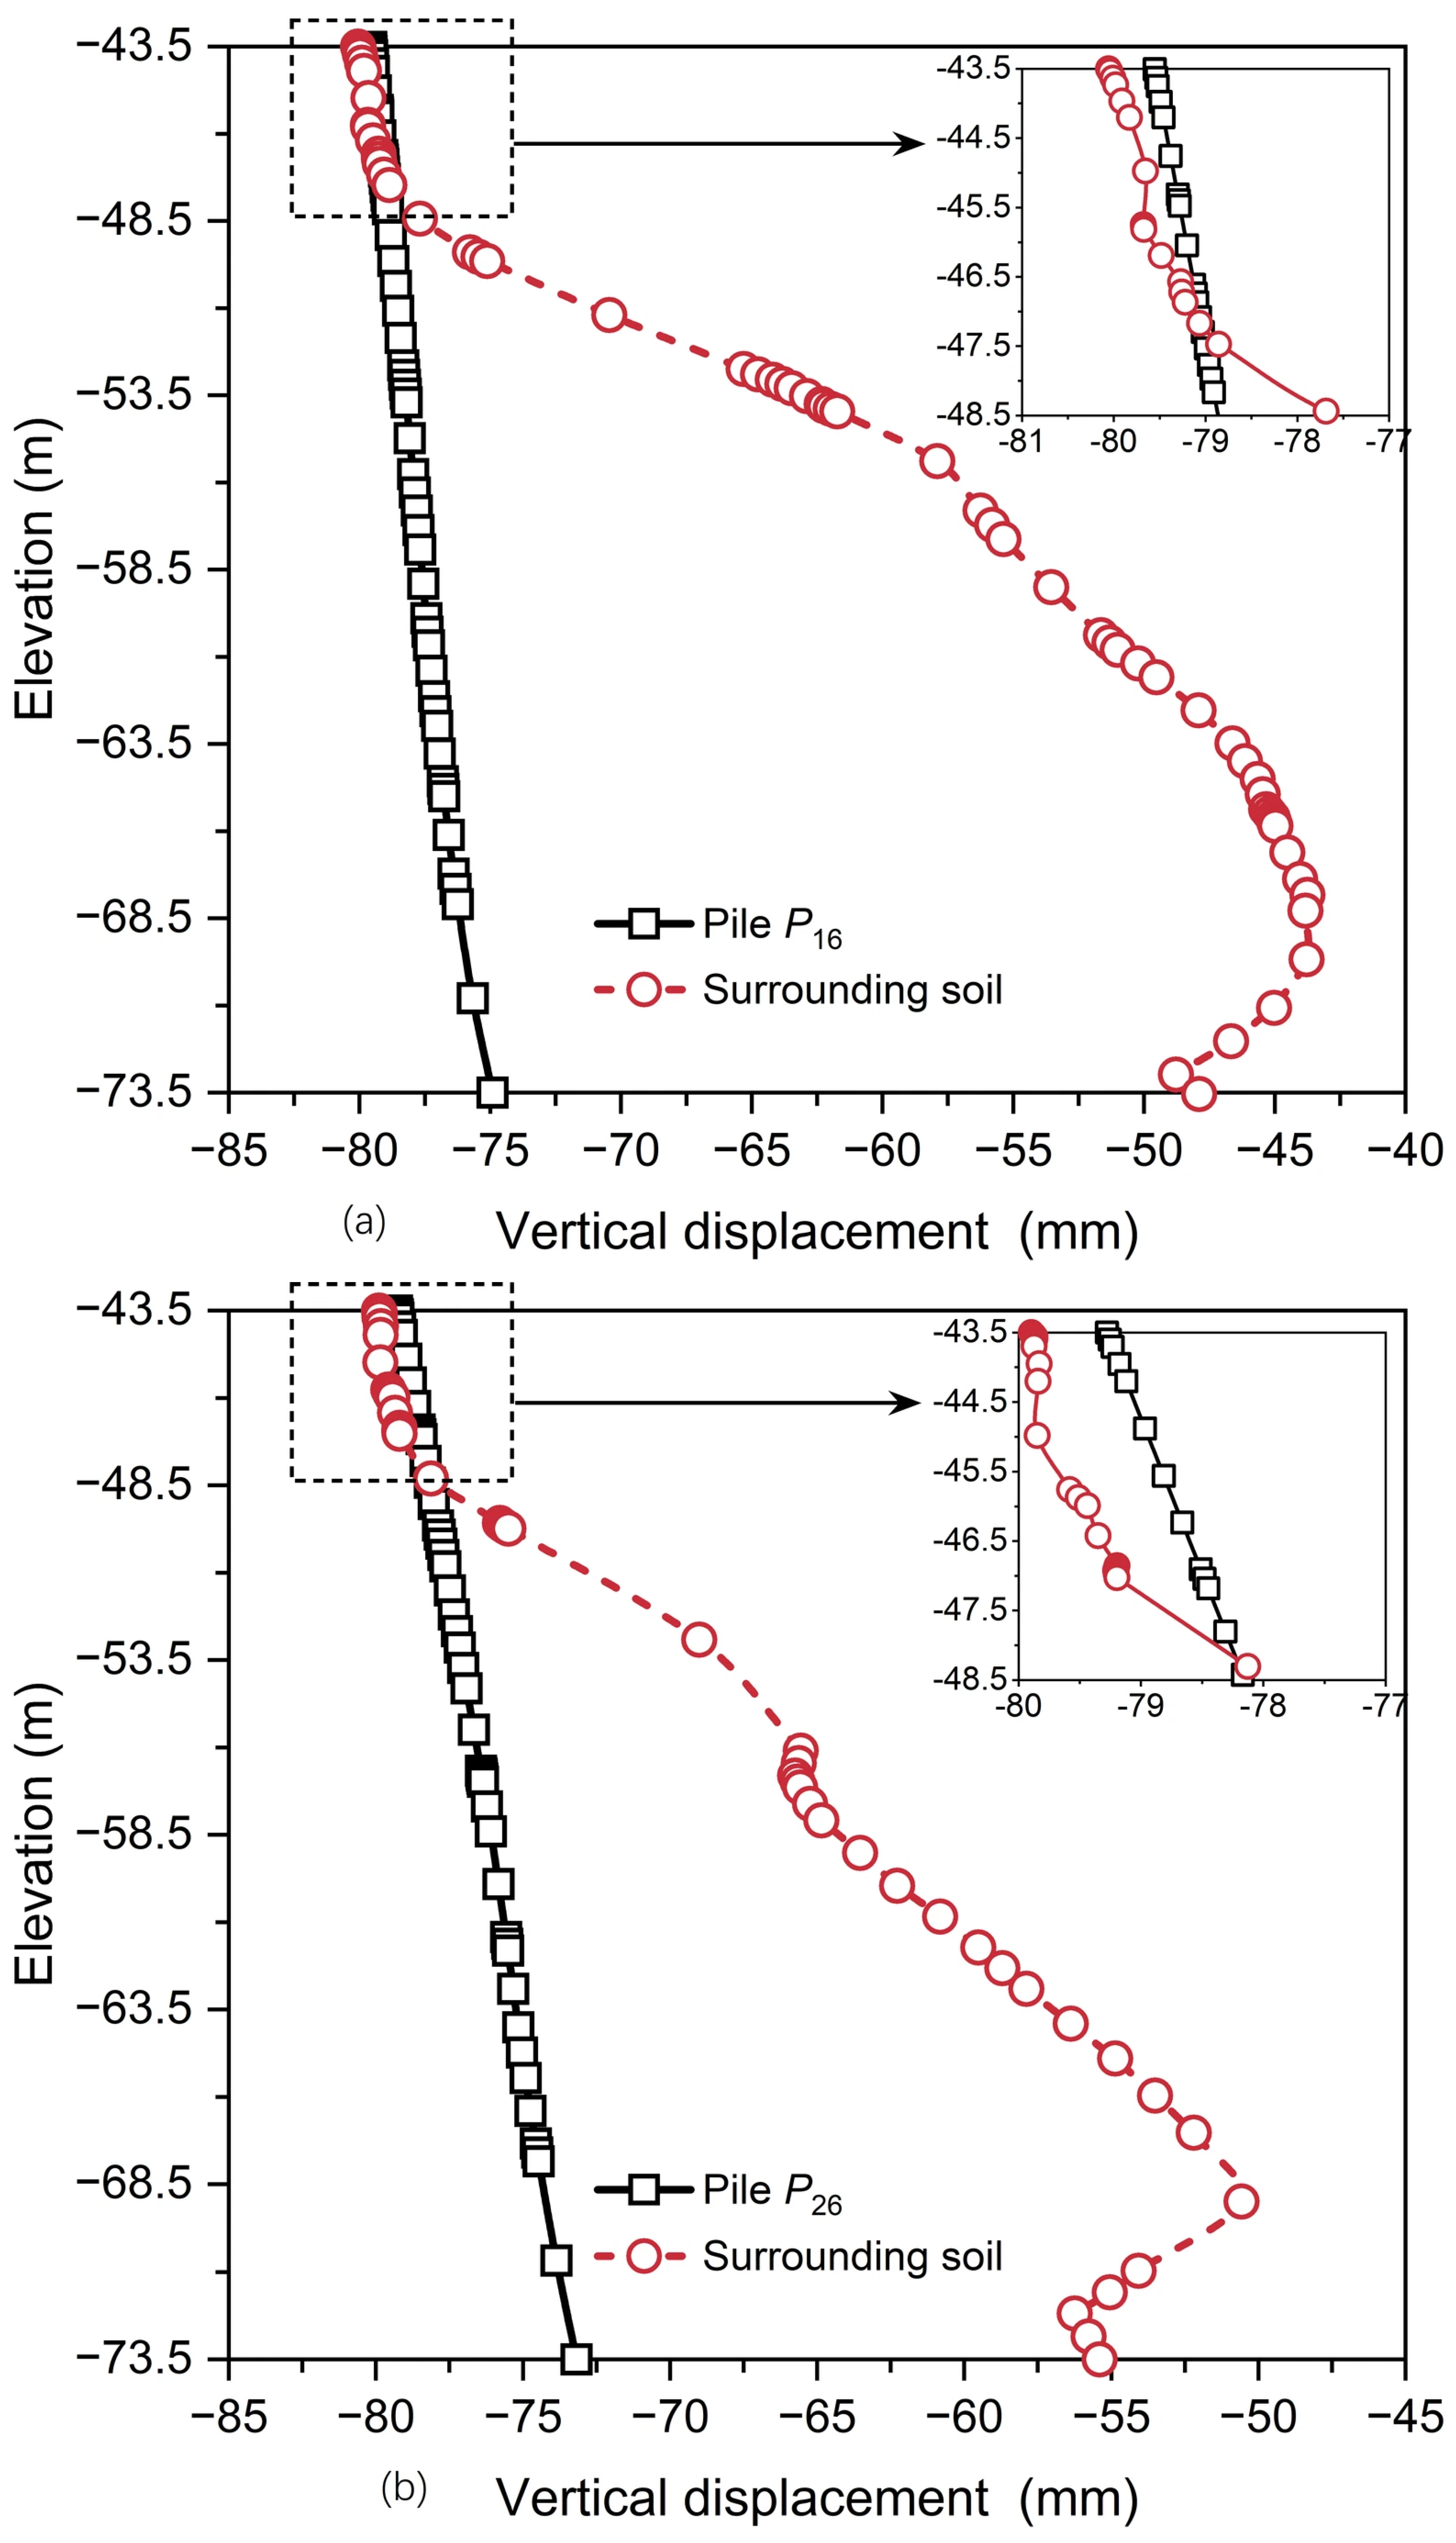
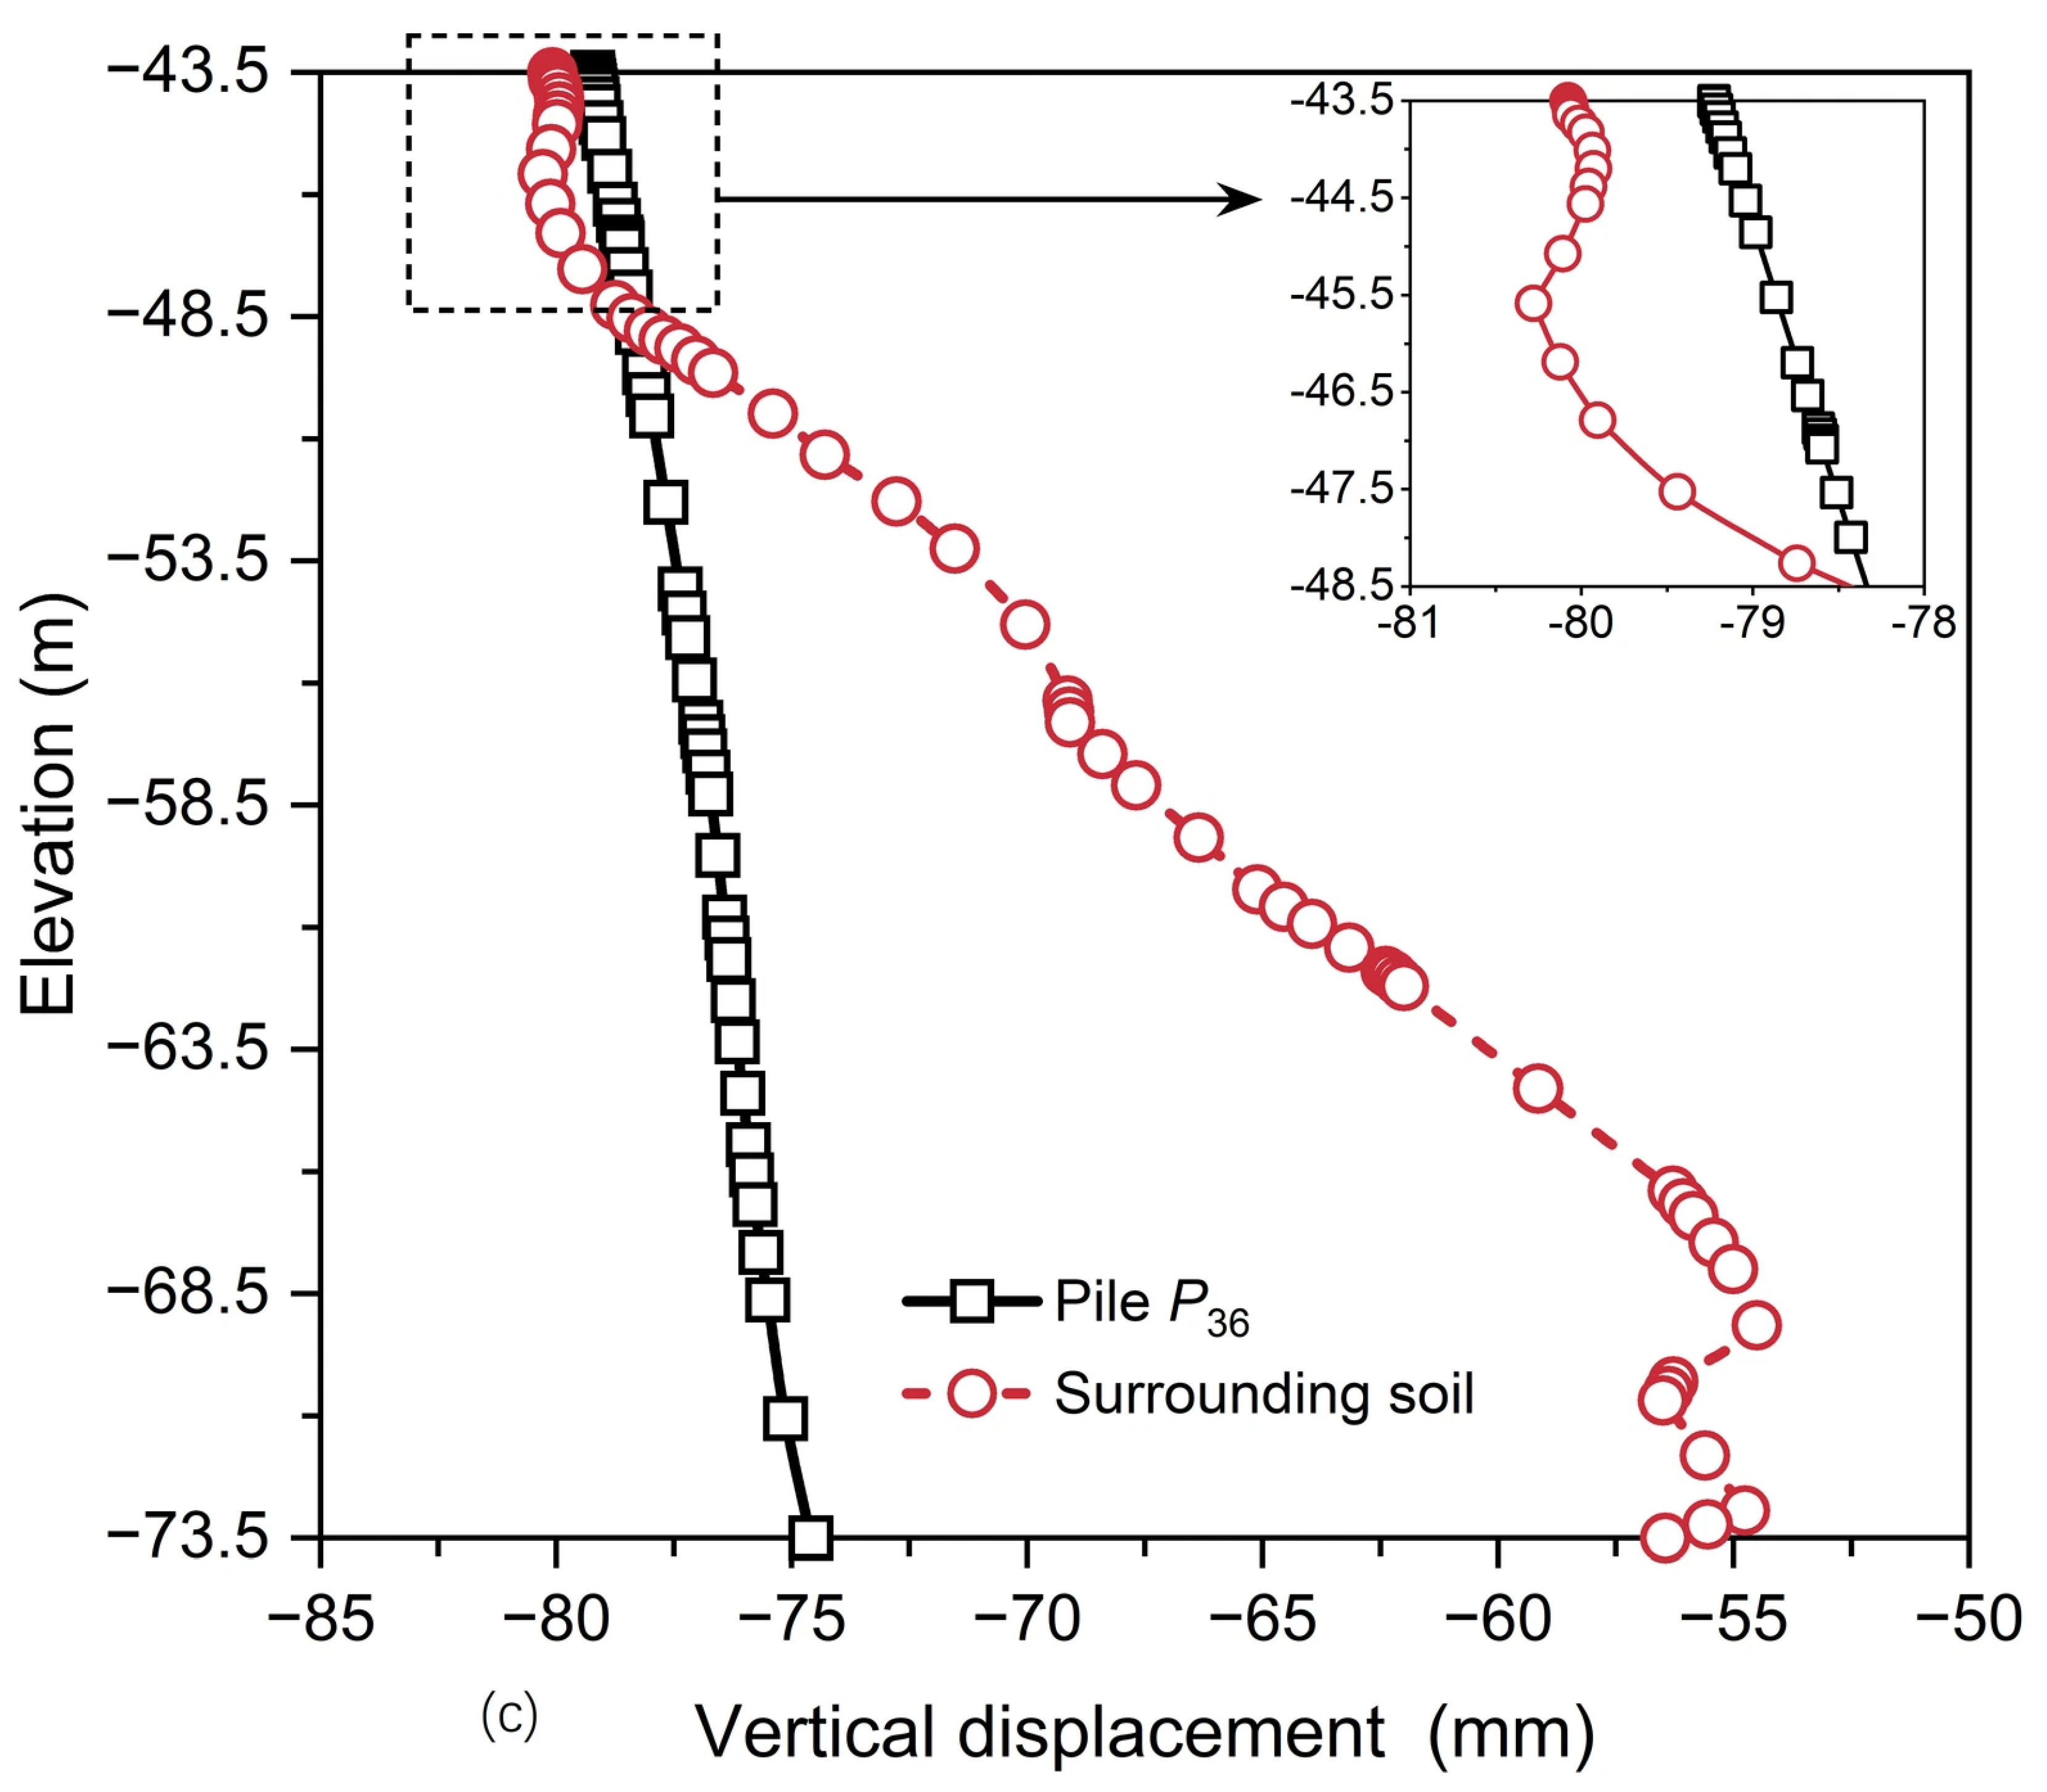
Figure 13 and Figure 14 present axial forces along pile shafts in the longitudinal and transverse directions (Loading Case 10), respectively. As shown in Figure 13, the axial force along pile shafts in Columns 1–5 decreases with depth, suggesting that the upper shaft resistance is predominantly mobilized. In contrast, for Column 6, the axial force increases with depth, indicating the development of negative skin friction along the lower pile shaft. This is attributed to the fact that, as the main cable tension increases from Loading Case 1 to 10, the rotation of the caisson causes the piles in Column 6 to move upward, as shown in Figure 15.
Figure 13.
Axial forces along pile shafts in the longitudinal direction (Loading Case 10): (a) Row 1; (b) Row 2; and (c) Row 3.
Figure 14.
Axial forces along pile shafts in the transverse direction (Loading Case 10): (a) Column 1; (b) Column 2; (c) Column 3; (d) Column 4; (e) Column 5; and (f) Column 6.
Figure 15.
Vertical displacements of piles in Column 6 and the surrounding soil: (a) P16; (b) P26; and (c) P36.
In addition, in the longitudinal direction (Figure 13), for Rows 1–3, the axial forces along pile shafts in Column 1 are considerably larger than those in Columns 2–6. In the transverse direction (Figure 14), for Columns 1–5, the axial forces along pile shafts in Row 1 are significantly larger than those in Rows 2 and 3. However, for Column 6, the axial force near the pile tip of P16 is markedly higher than that of P26 or P36 (Figure 14f). Ultimately, as the main cable tension increases from Loading Case 1 to 10, the overall load redistribution induced by caisson rotation and pile group effects leads to pile P11 carrying the maximum axial force among all piles.
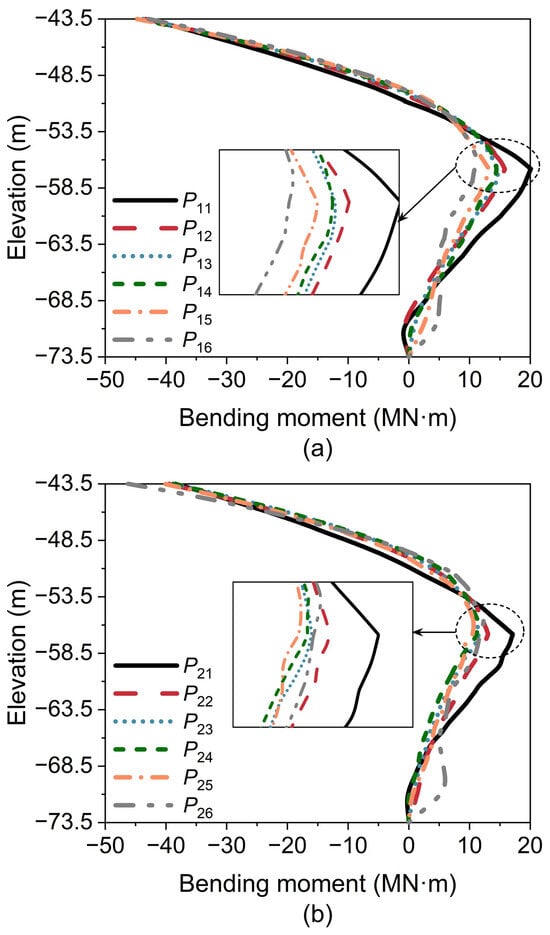
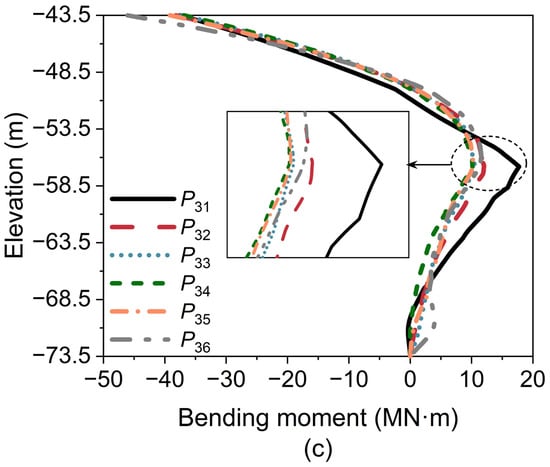
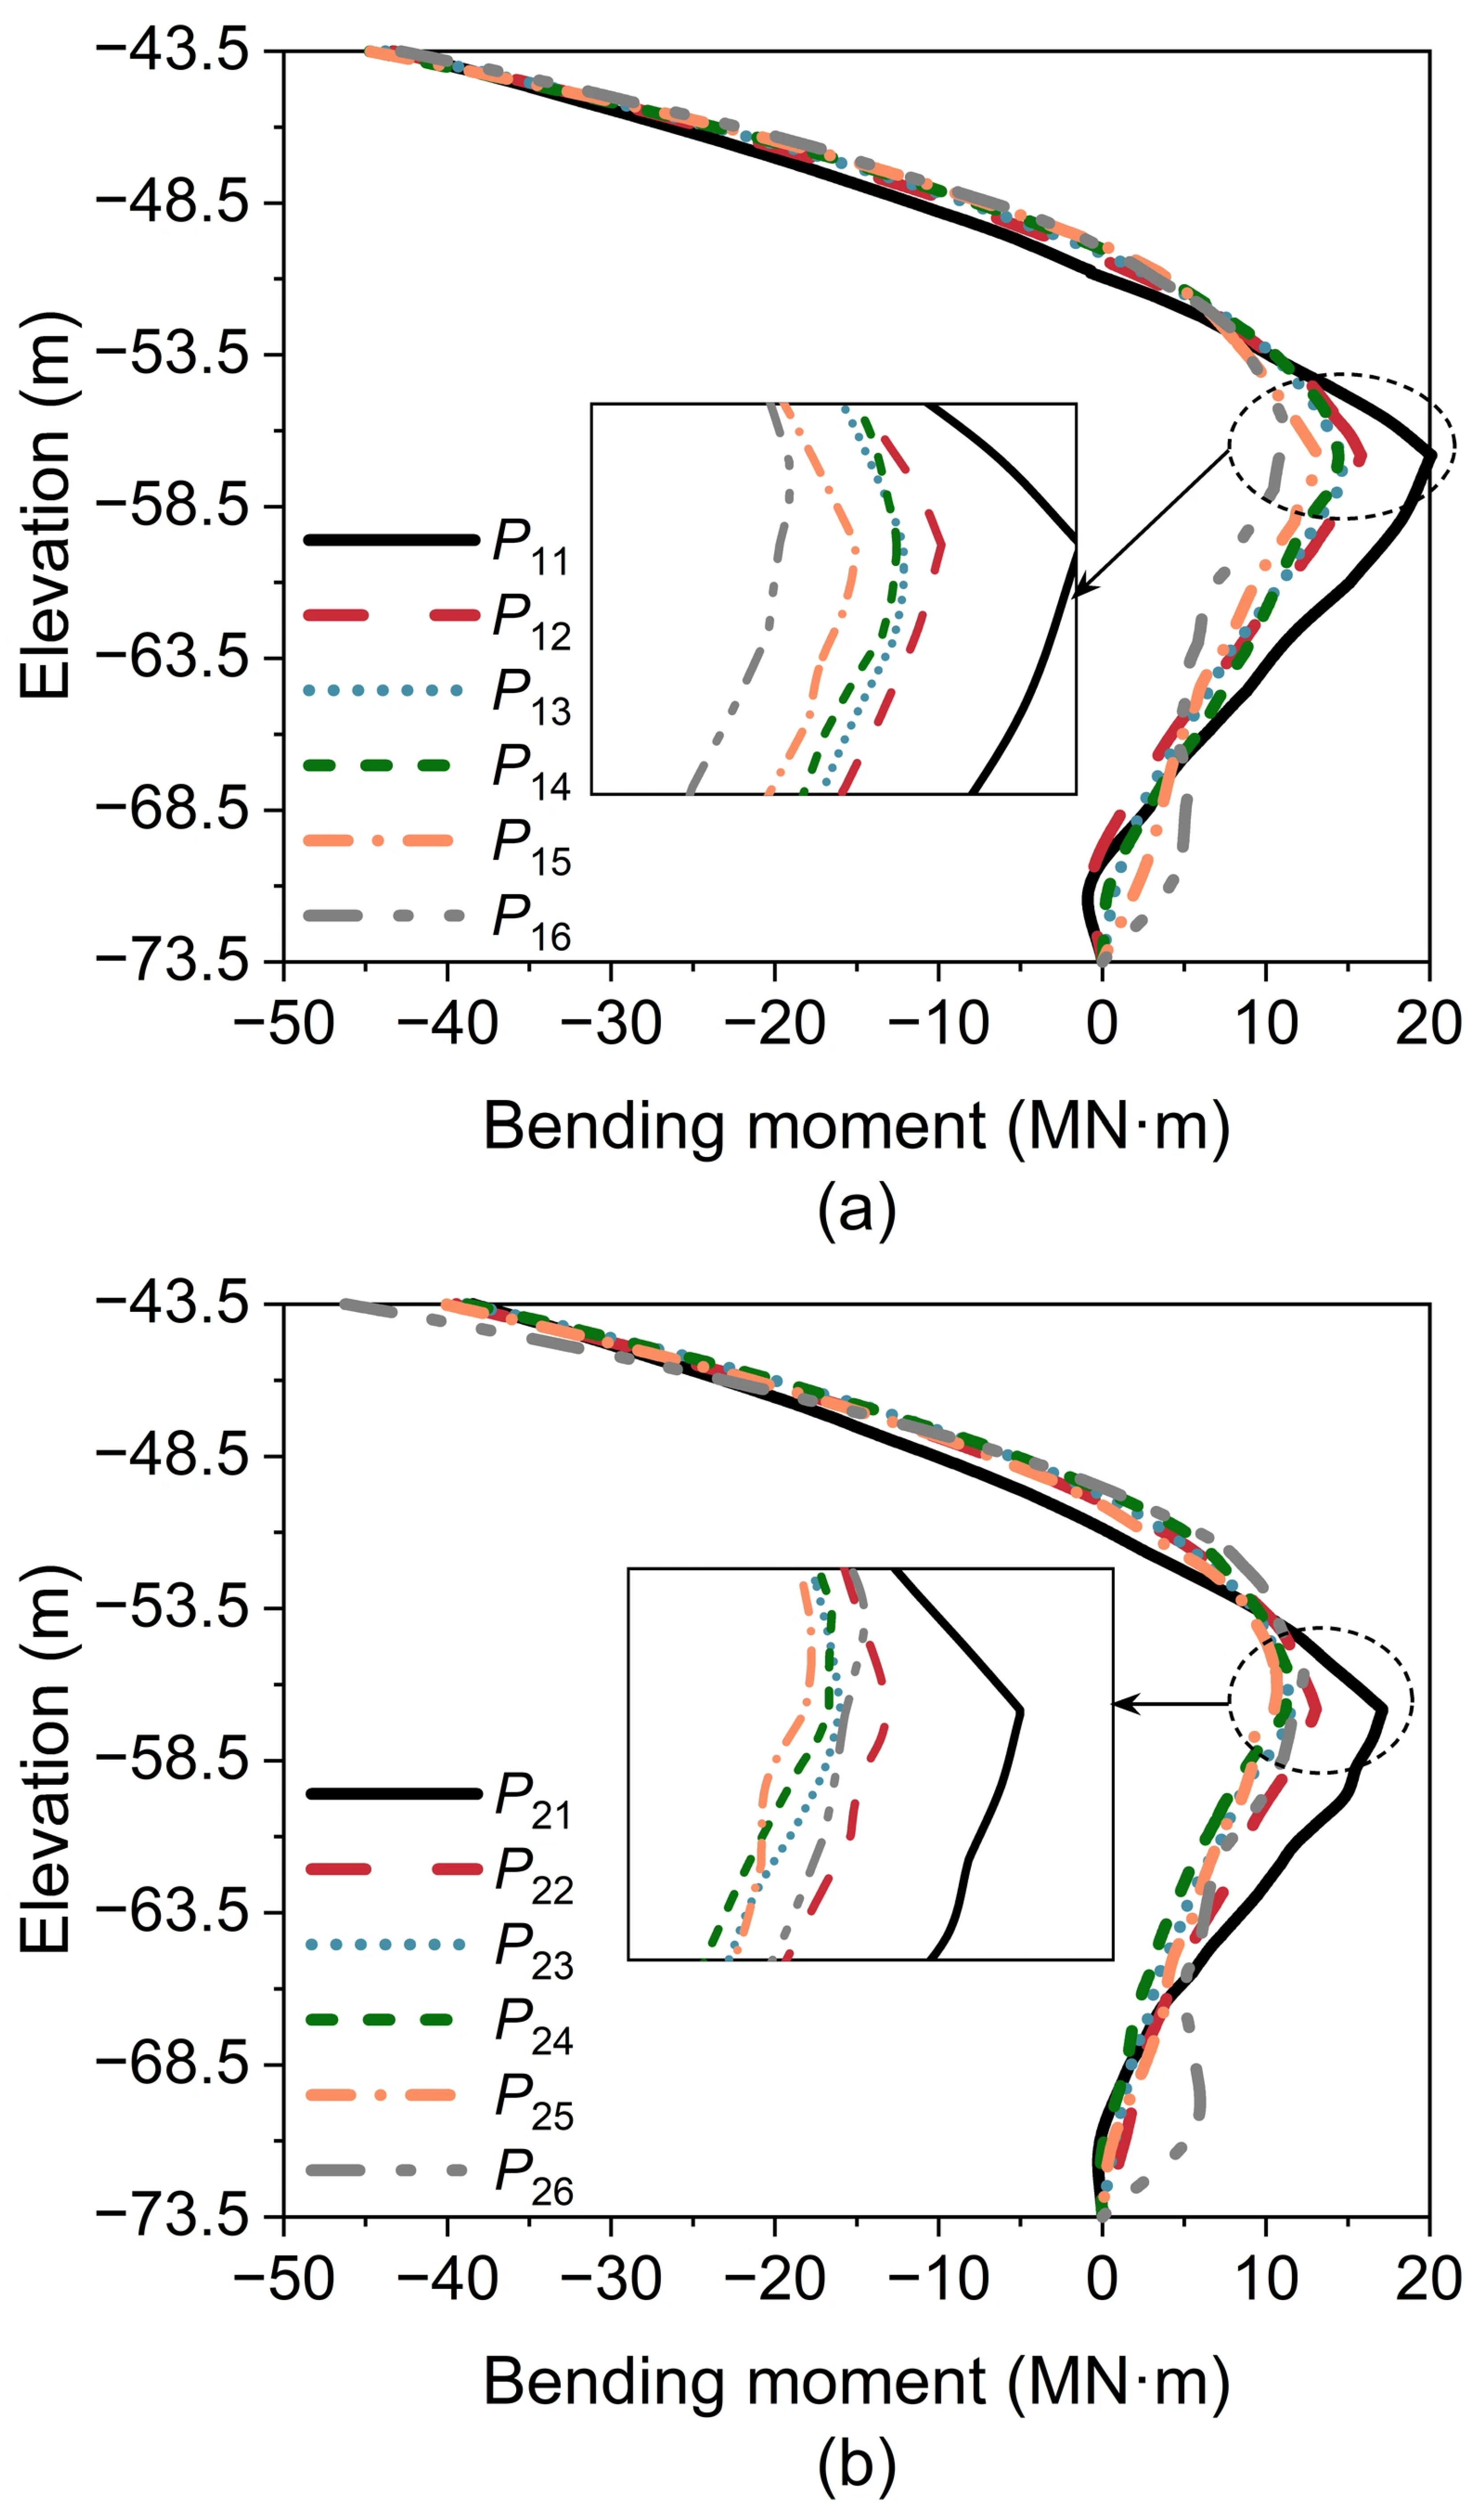
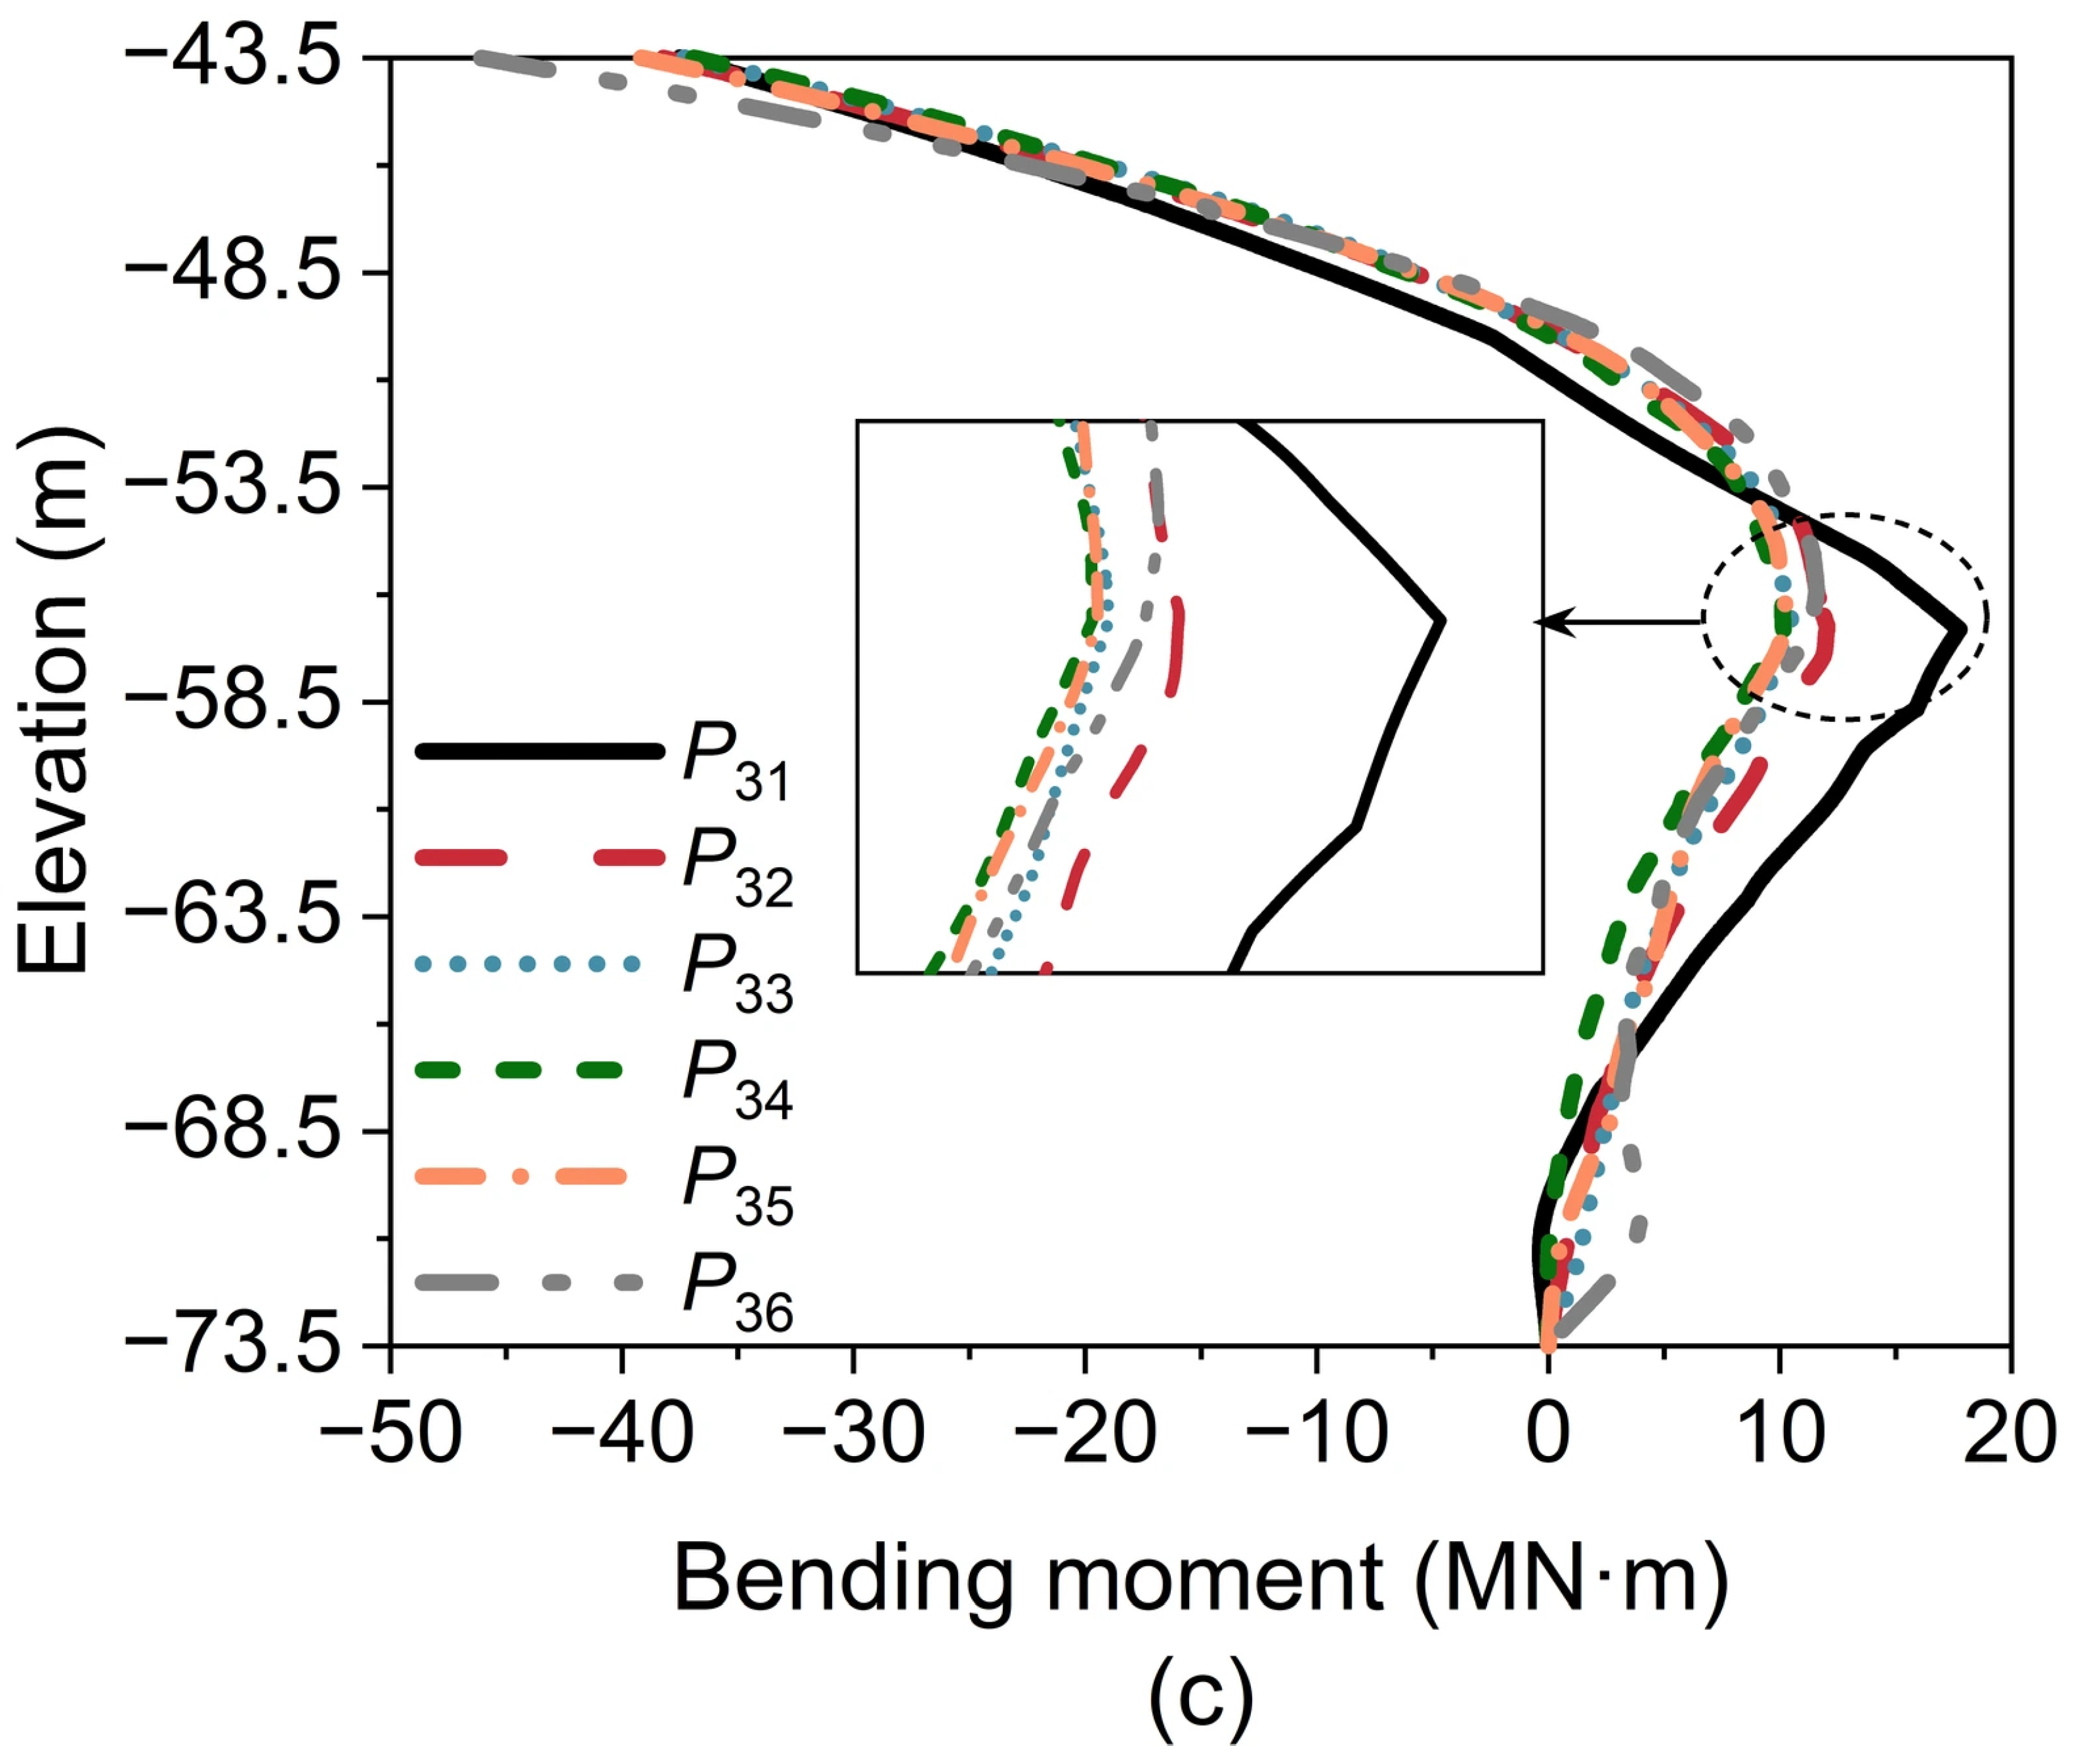
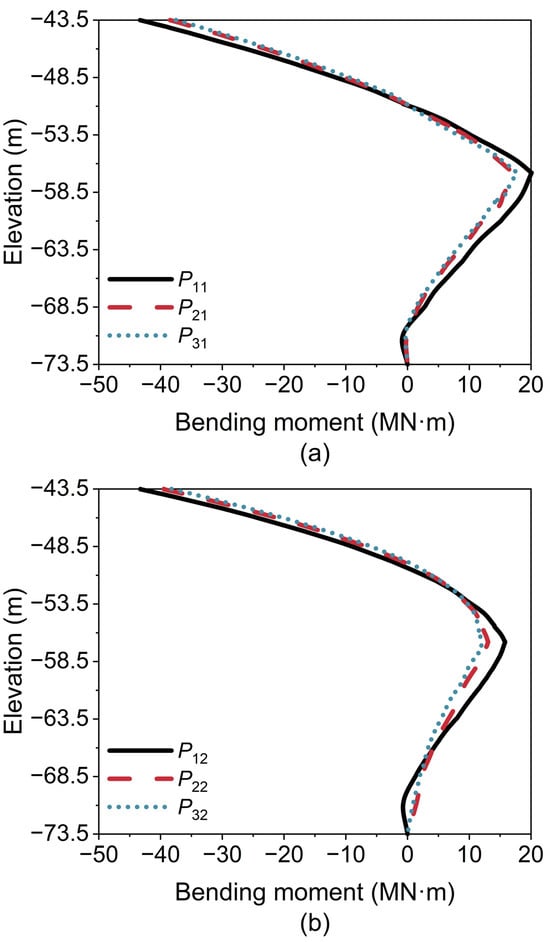
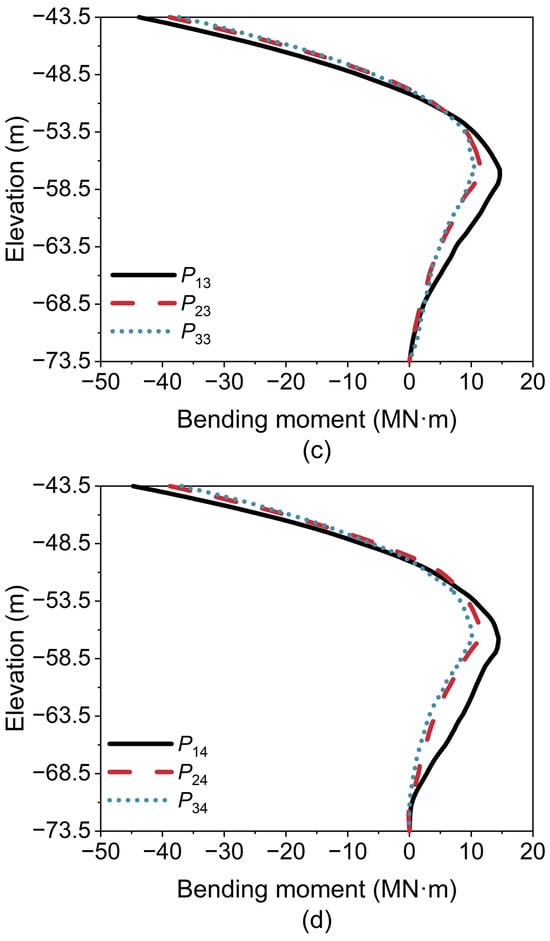
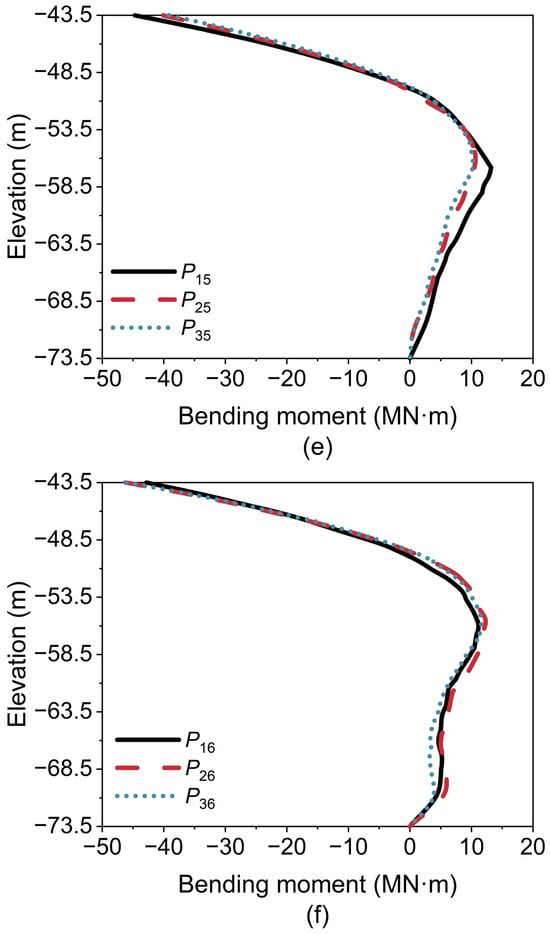
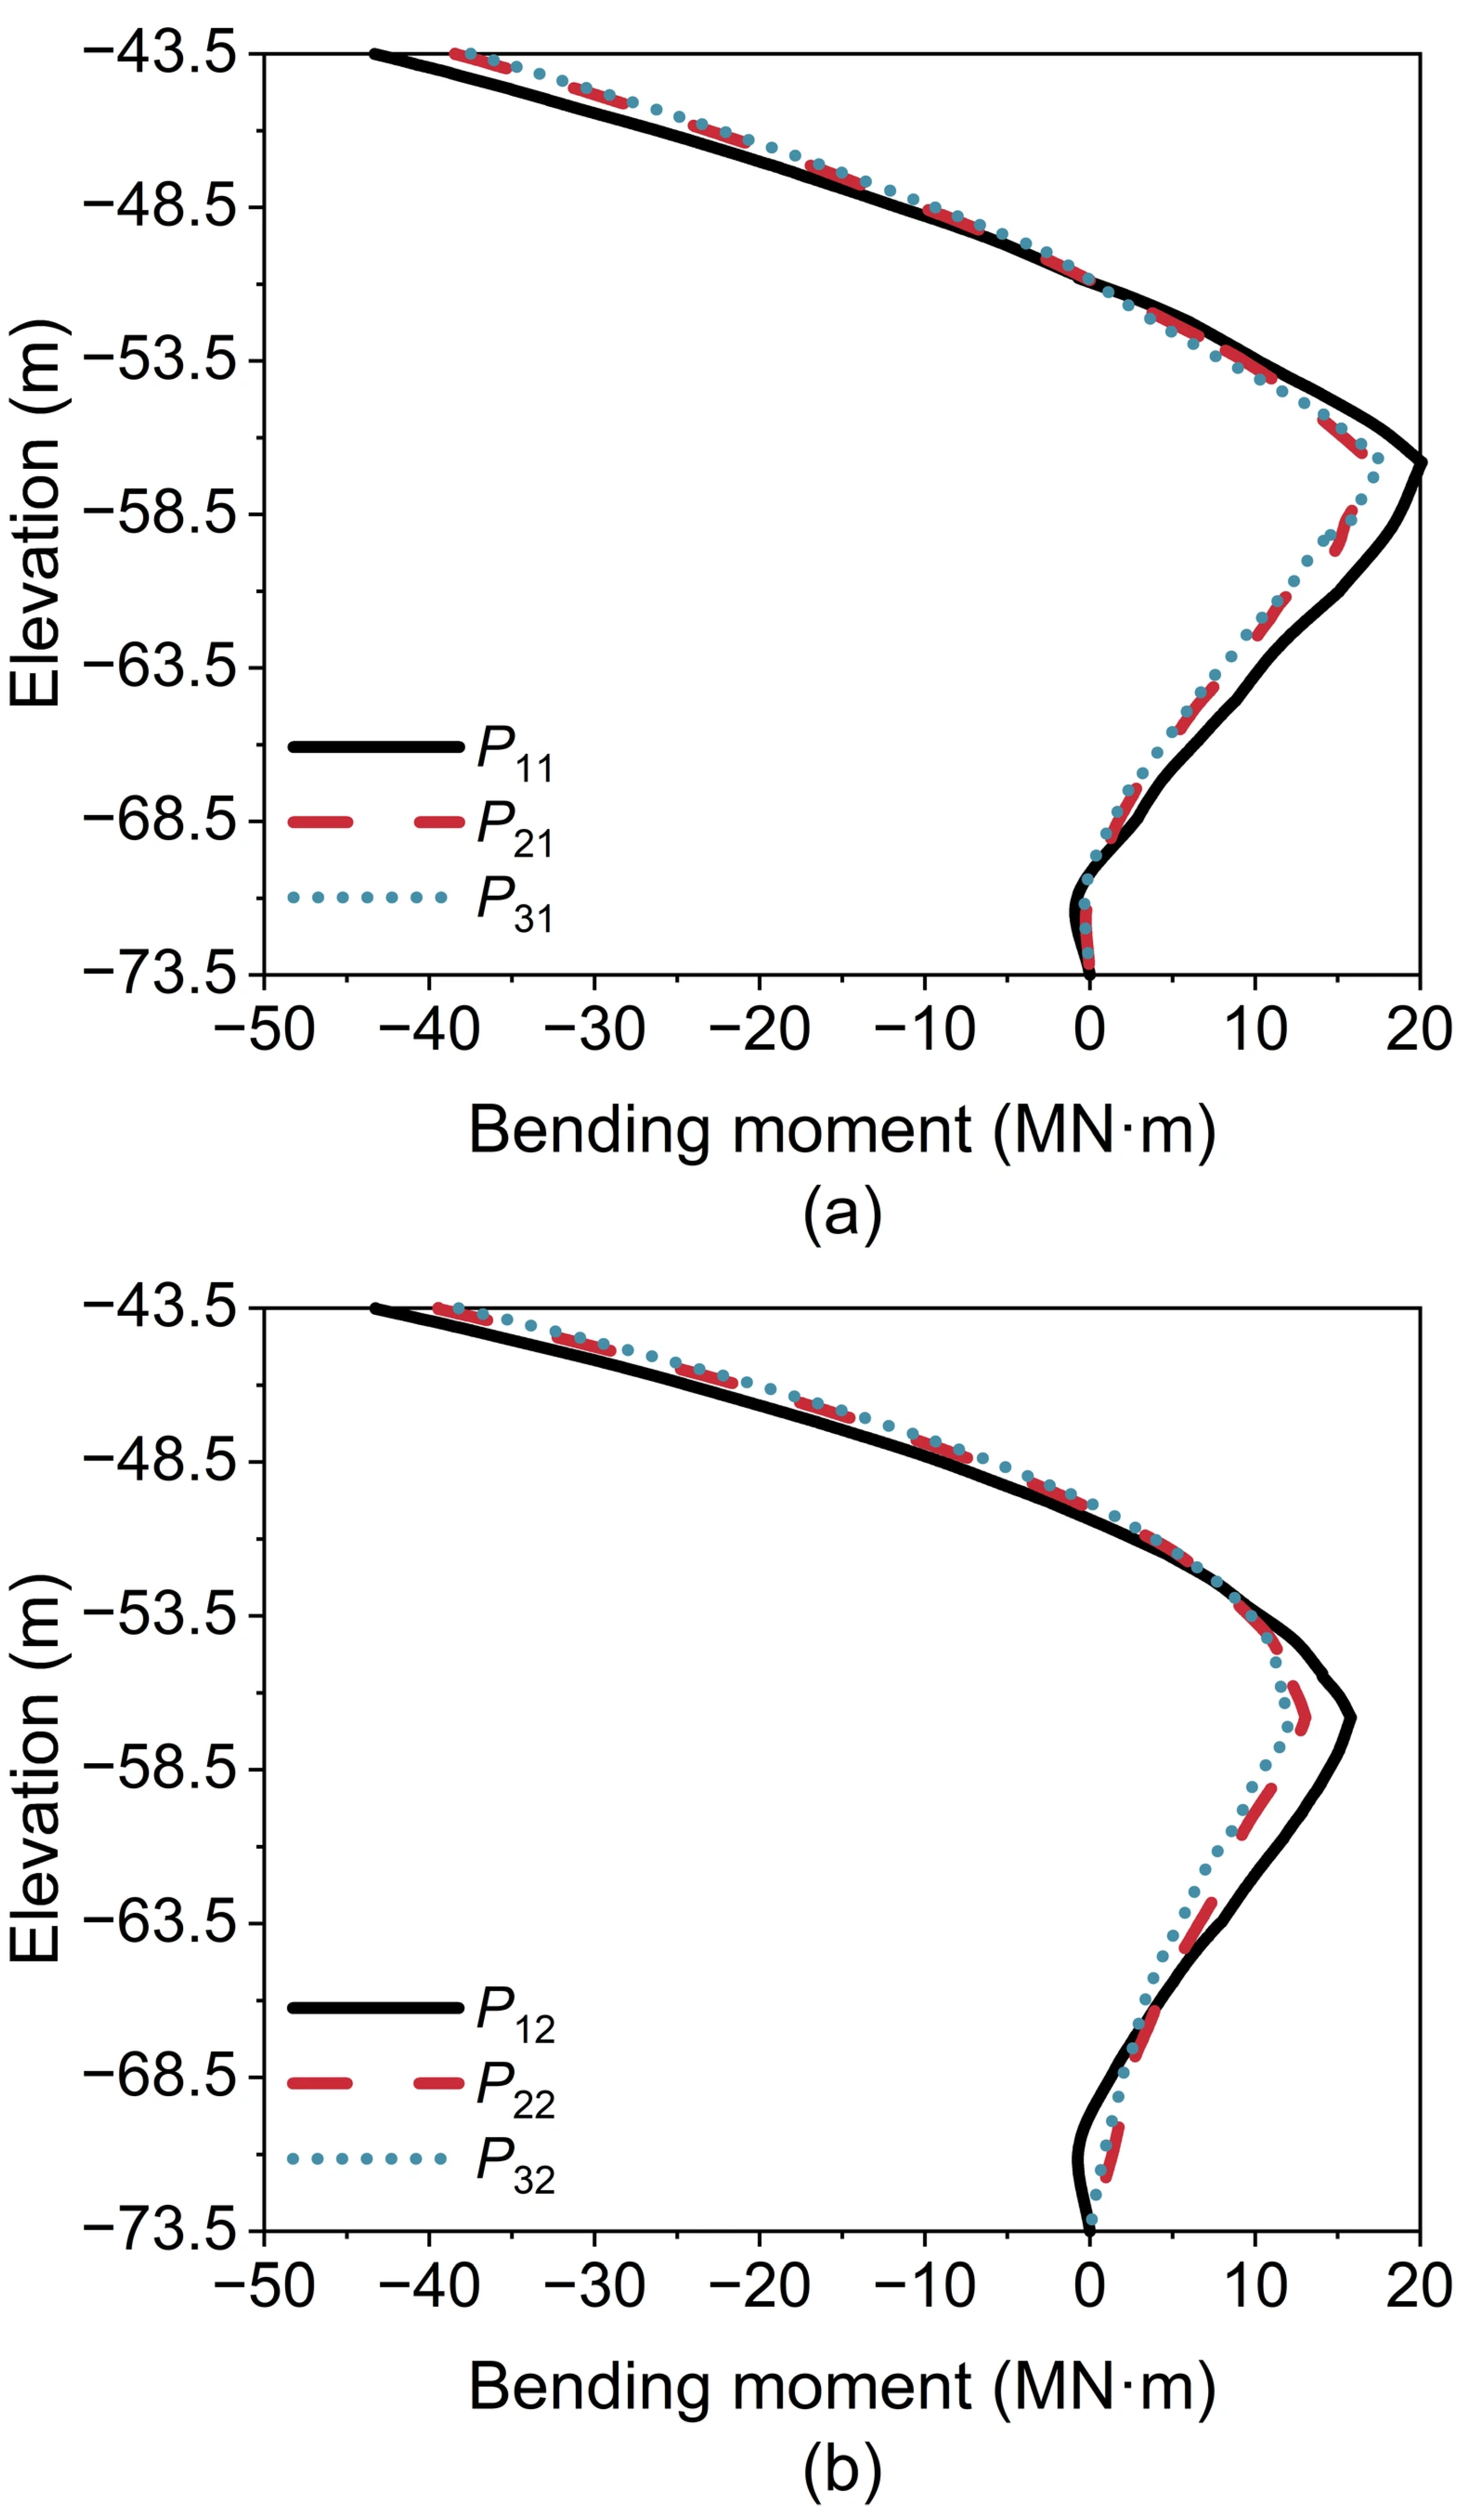
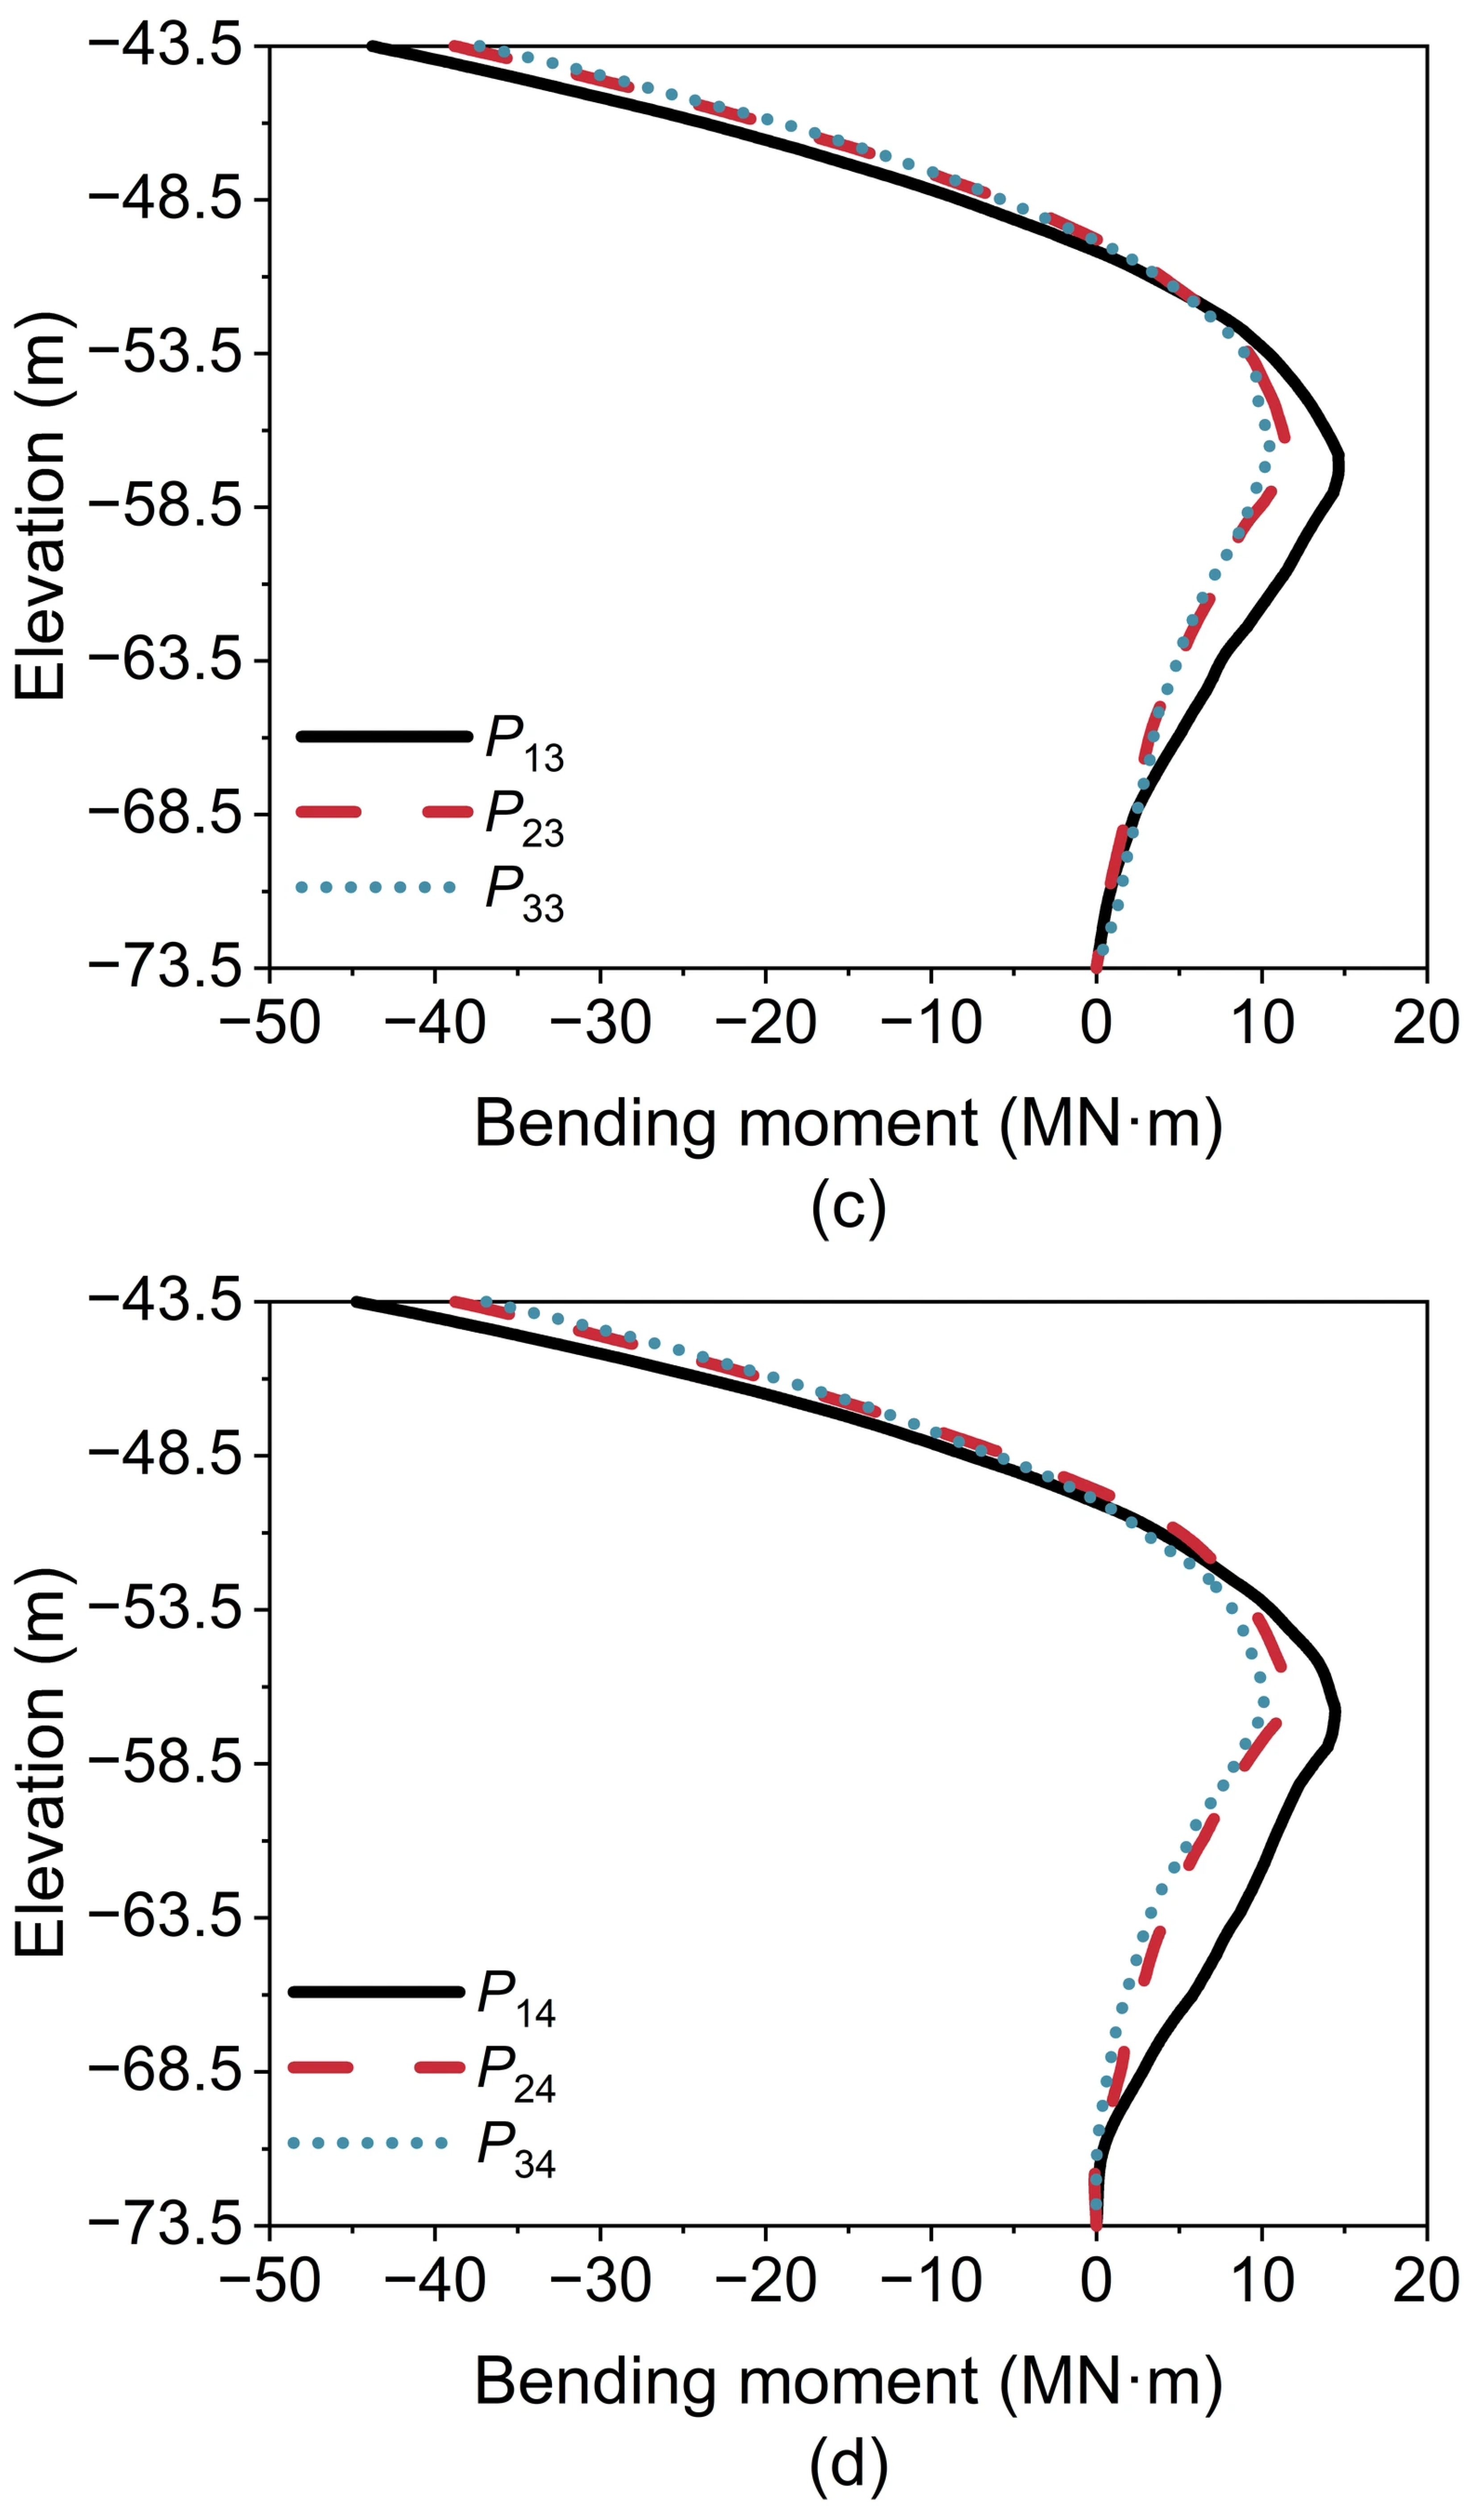
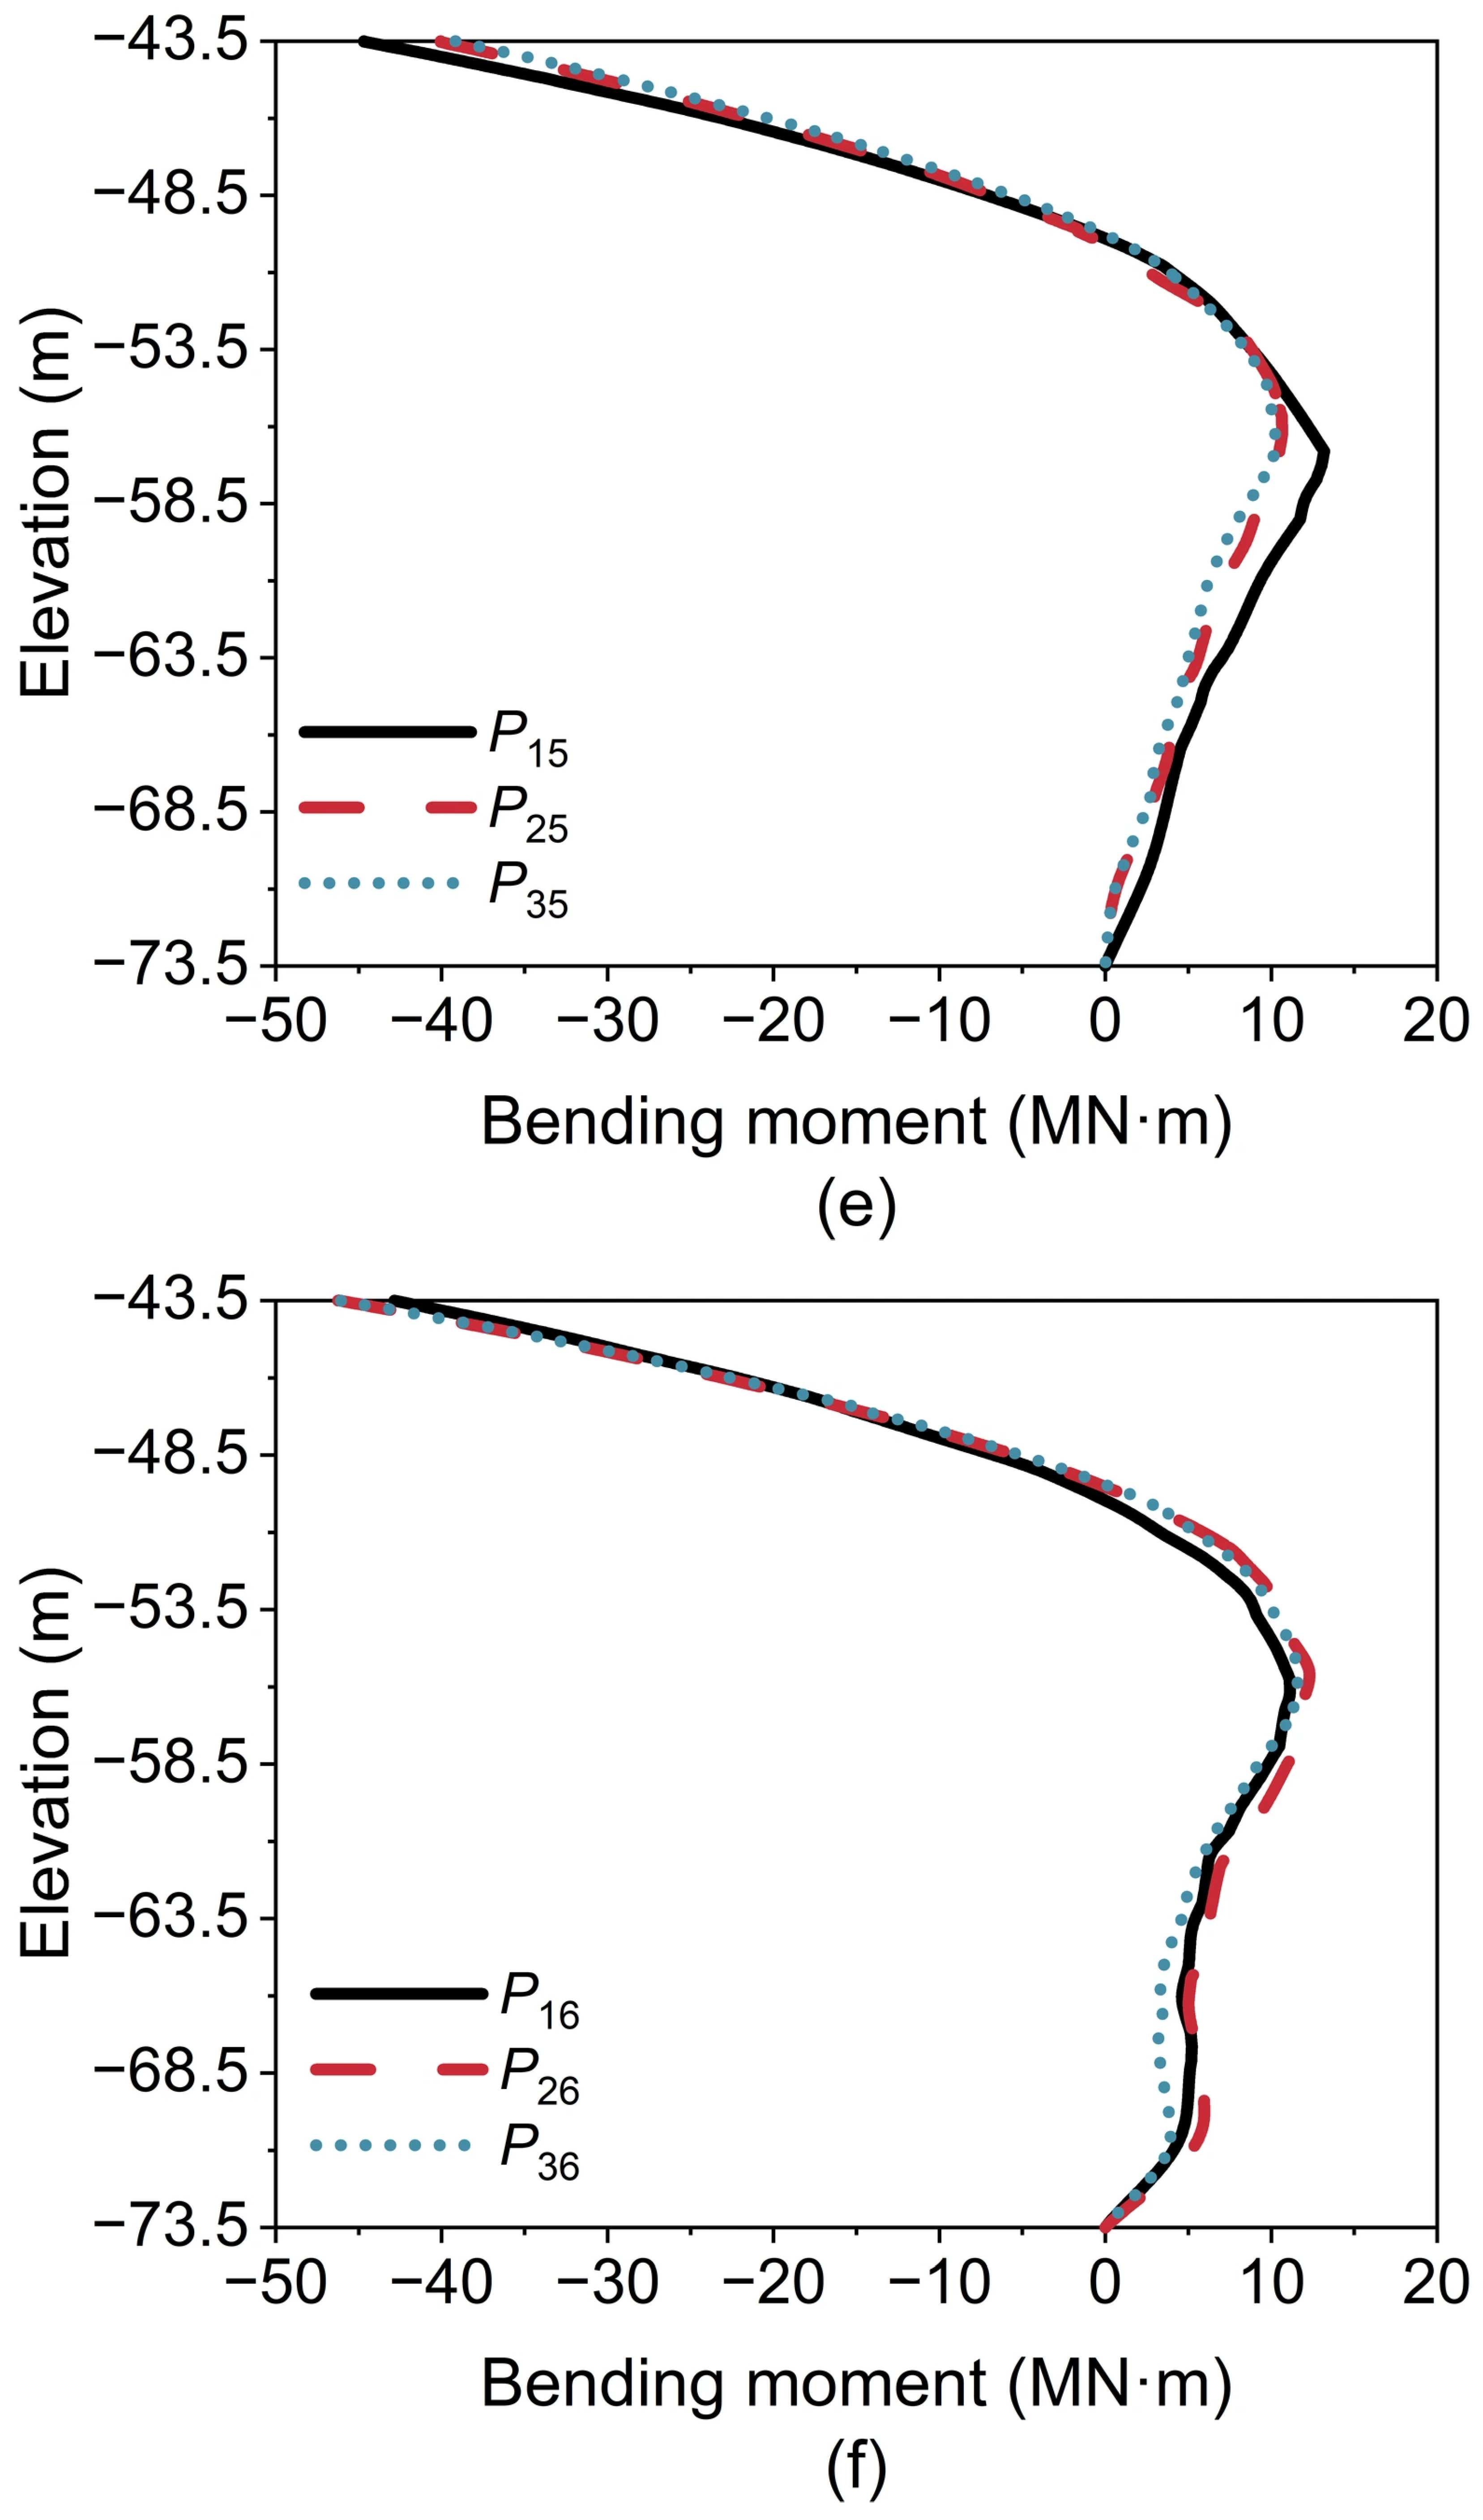
Figure 16 and Figure 17 illustrate bending moments along pile shafts in the longitudinal and transverse directions (Loading Case 10), respectively. In the longitudinal direction (Figure 16), for Rows 1 to 3, the bending moments along pile shafts in Column 1 slightly exceed those in Columns 2–6. In the transverse direction (Figure 17), for Columns 1–5, the bending moments along pile shafts in Row 1 are marginally larger than those in Rows 2 and 3. In contrast, for Column 6, the bending moments in the three piles (P16, P26, and P36) are comparable (Figure 17f). Consequently, P11 experiences the maximum bending moment.
Figure 16.
Bending moments along pile shafts in the longitudinal direction (Loading Case 10): (a) Row 1; (b) Row 2; and (c) Row 3.
Figure 17.
Bending moments along pile shafts in the transverse direction (Loading Case 10): (a) Column 1; (b) Column 2; (c) Column 3; (d) Column 4; (e) Column 5; and (f) Column 6.
4. Parameter Analysis
The caisson height (Hc), pile diameter (Dp), pile length (Lp), and pile wall thickness (tp) are important parameters that affect the displacement and mechanical response of the PCA, and their effects were parametrically analyzed based on the reference case, whose geometry and soil parameters are detailed across Section 2 and Section 3.1, Section 3.2 and Section 3.3. The key geometric values are Hc = 47.5 m, Dp = 3 m, Lp = 30 m, tp = 0.03635 m. A total of 24 cases are considered in this section, with pile P11 selected for detailed analysis as it carries the maximum axial force and bending moment among all piles (see Section 3.5). It is worth noting that among all simulated cases in this study, pile P11 remains the critical pile.
4.1. Influence of Caisson Height
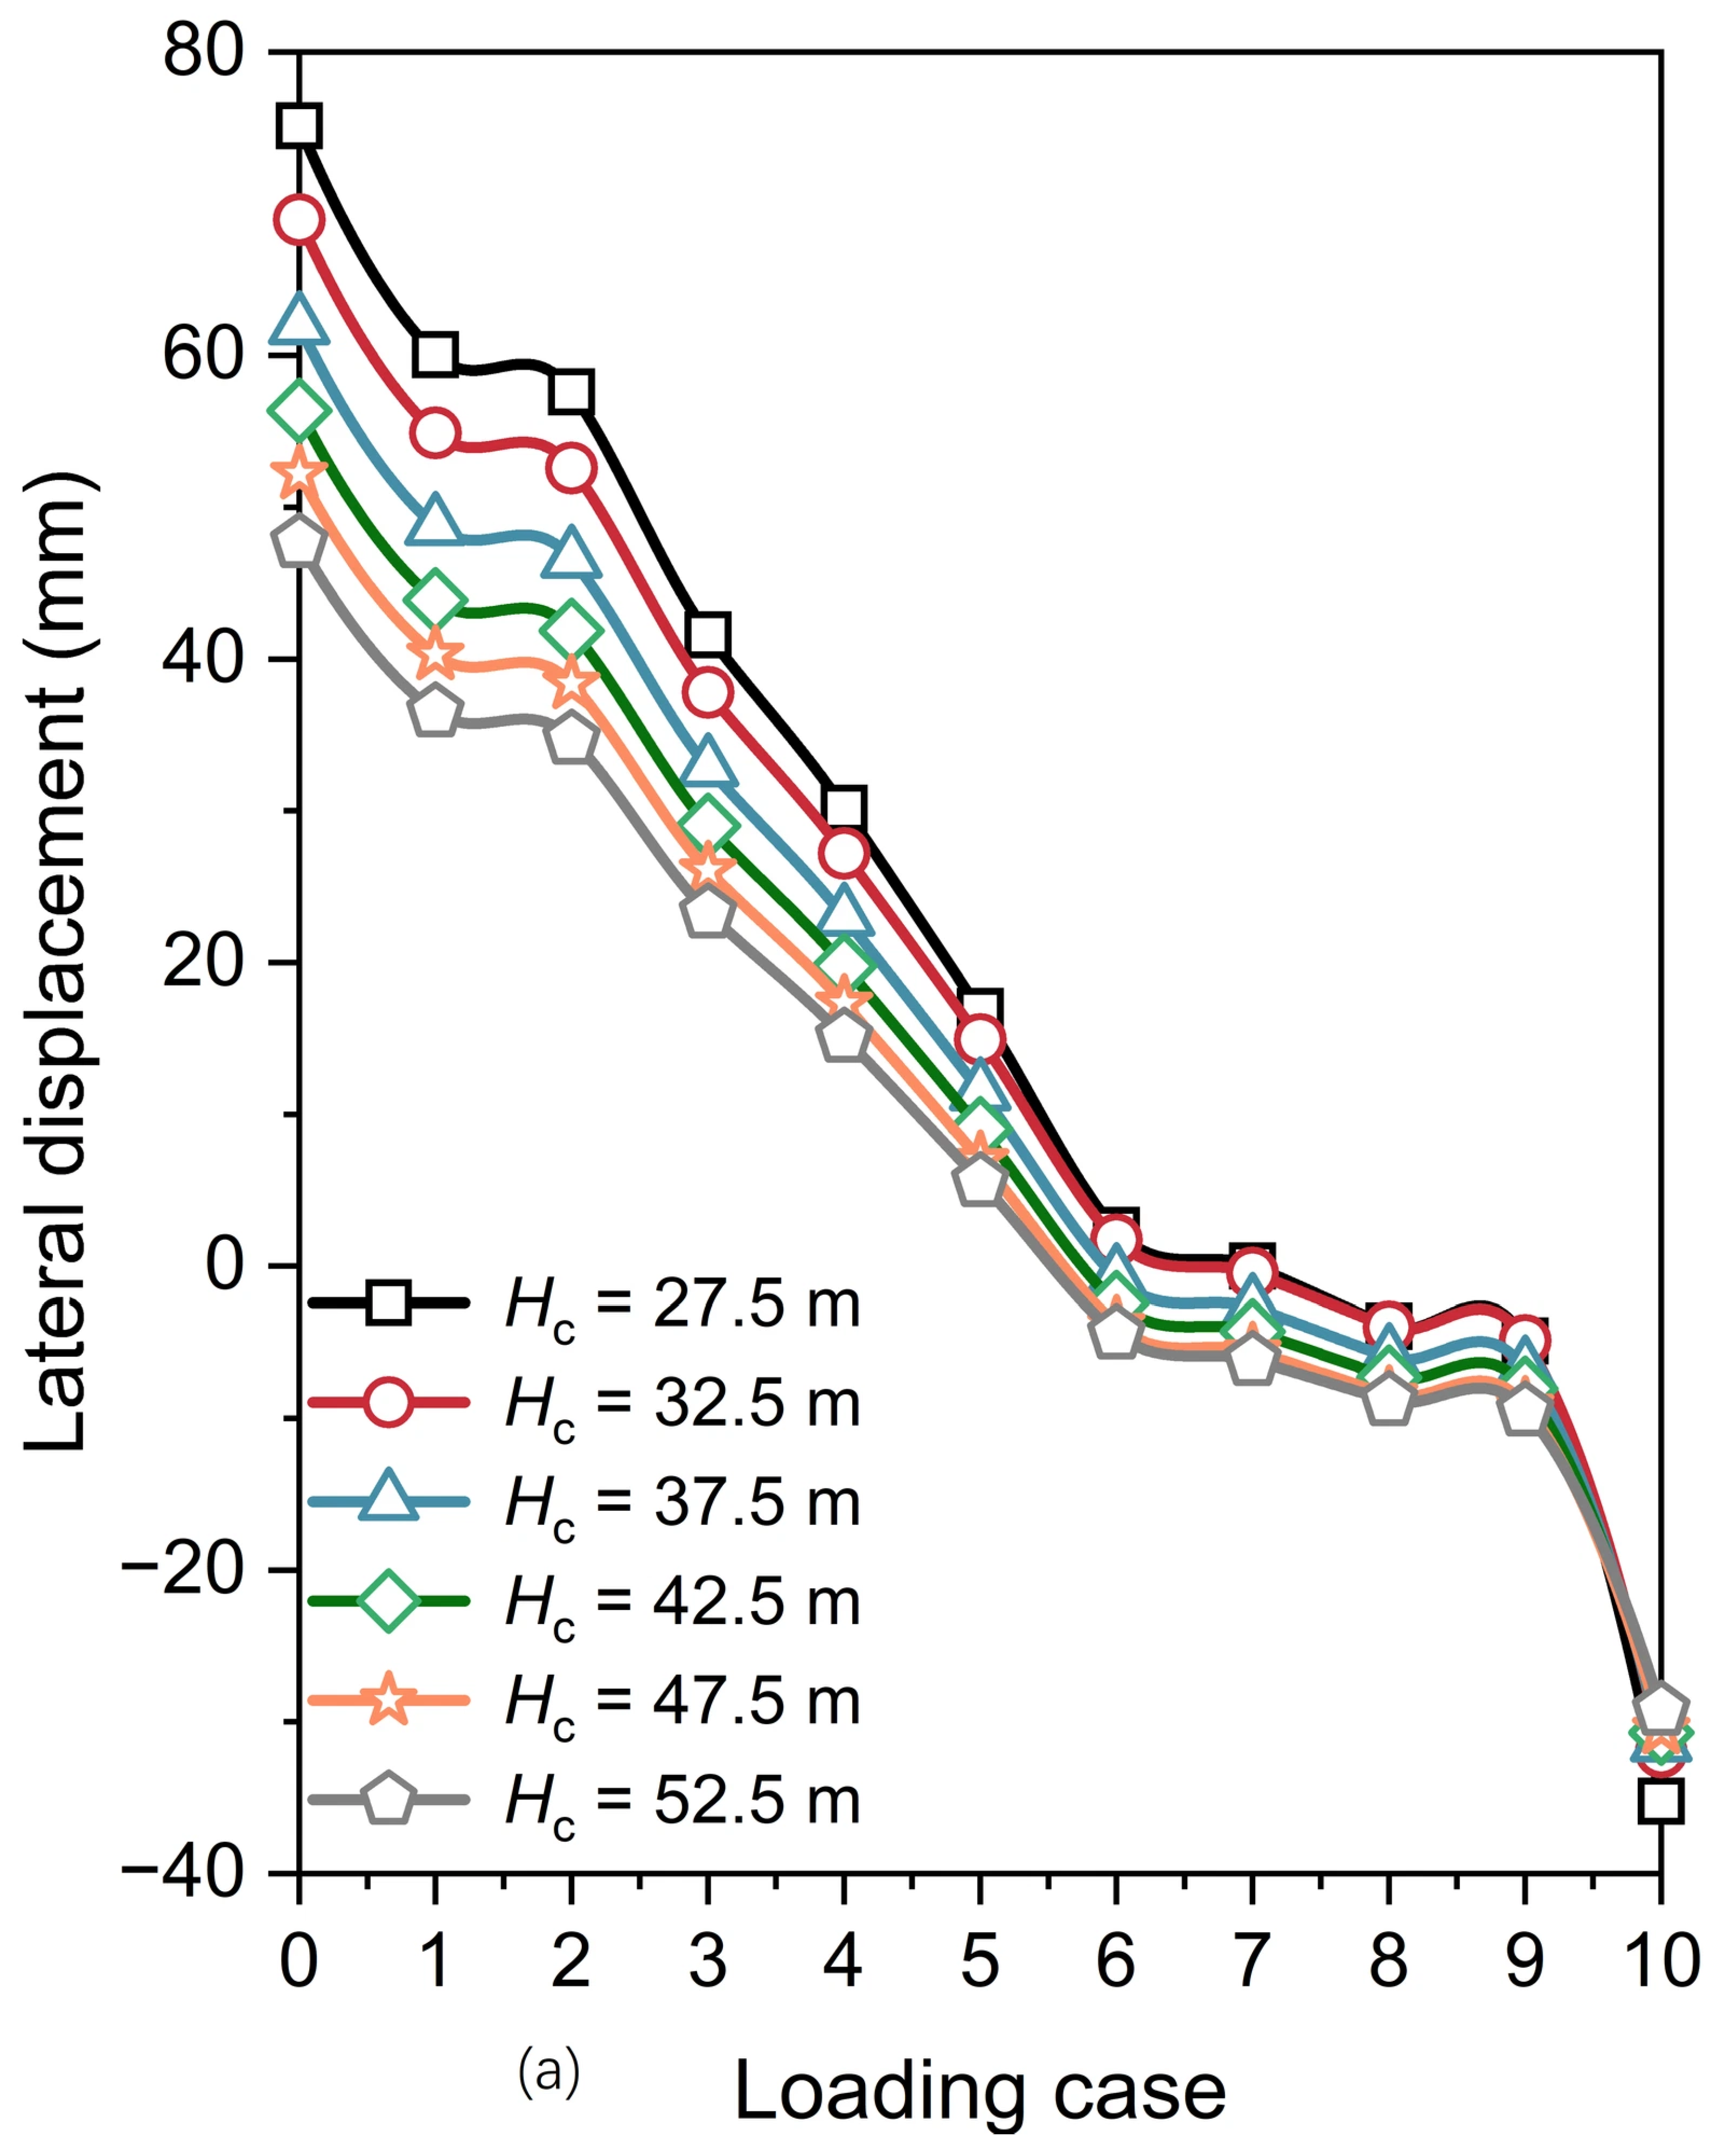
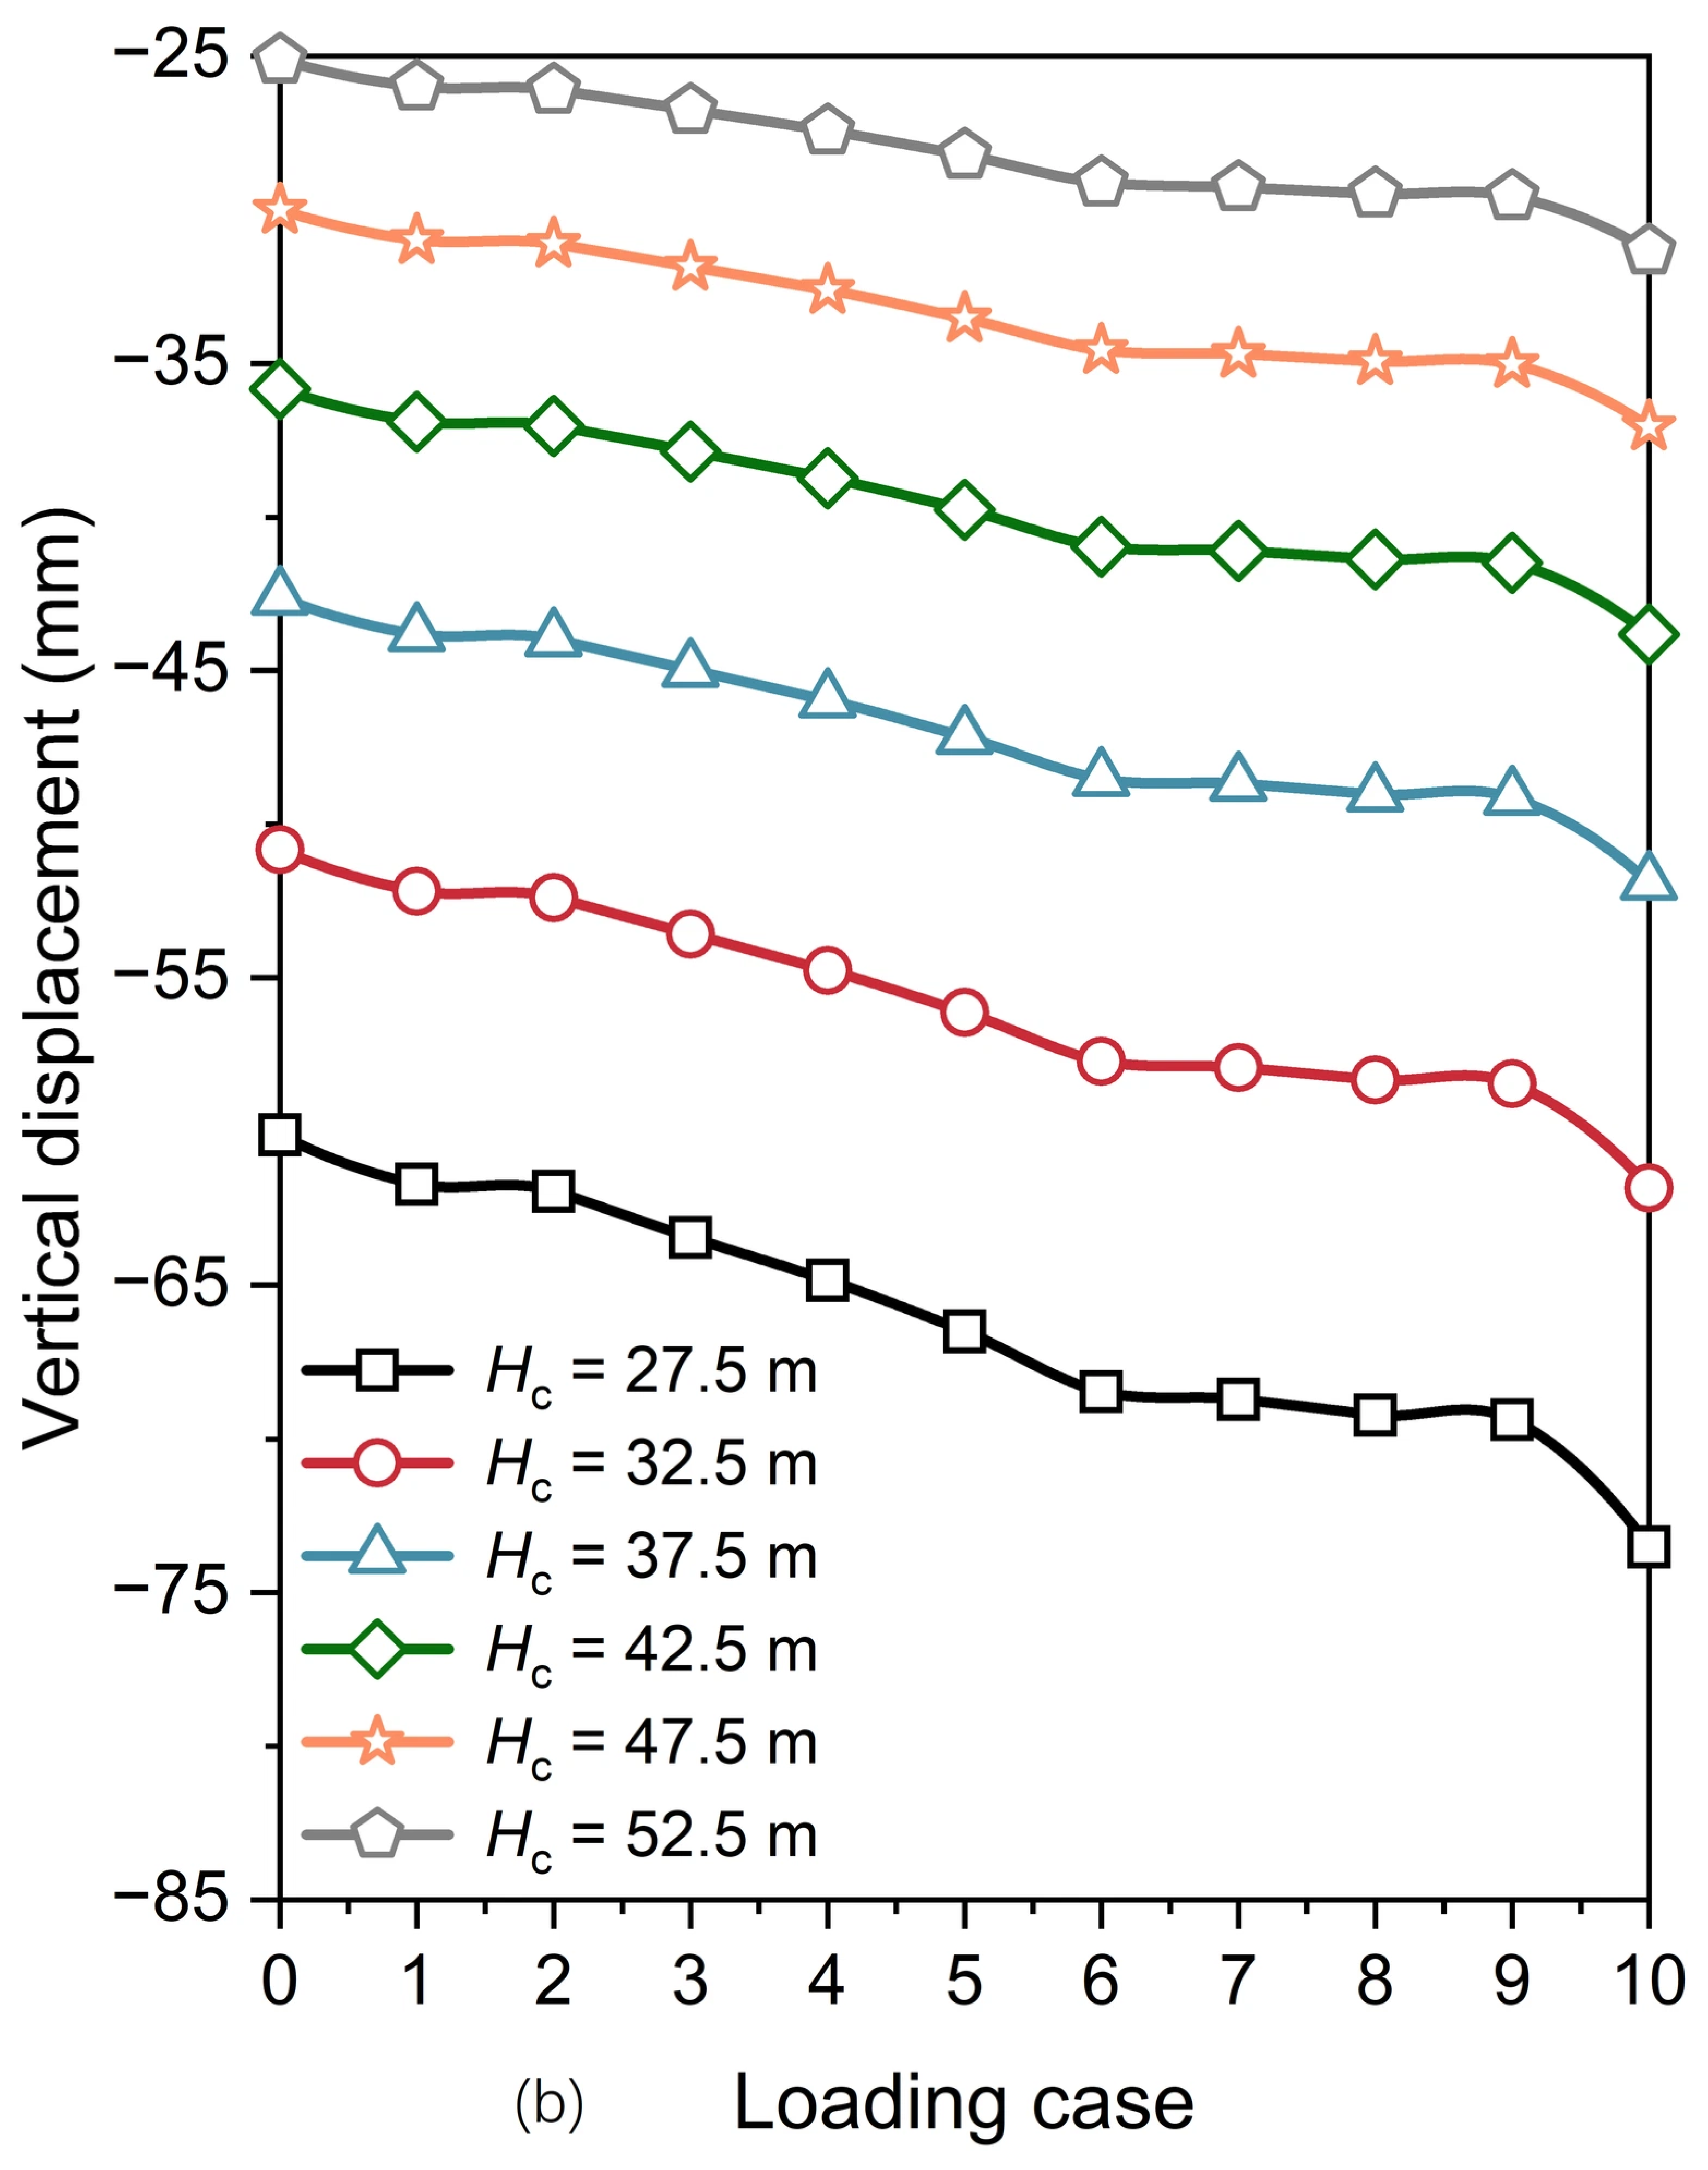
To assess the influence of the caisson height Hc on the responses of the PCA, six caisson heights were considered: Hc = 27.5, 32.5, 37.5, 42.5, 47.5, and 52.5 m. An increase in the caisson height causes the PCA to interact with different soil layers. To eliminate the effect of variations in the caisson height on the soil layers surrounding the PCA, the soil in this section was set entirely as cobble, with all other parameters kept consistent with the reference case.
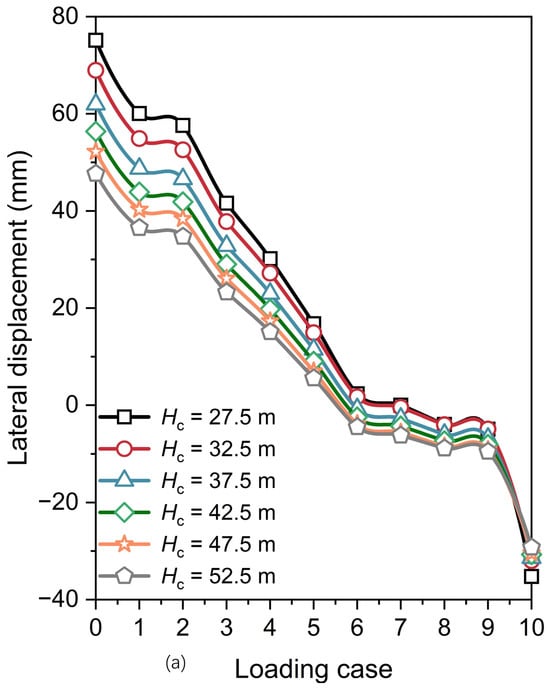
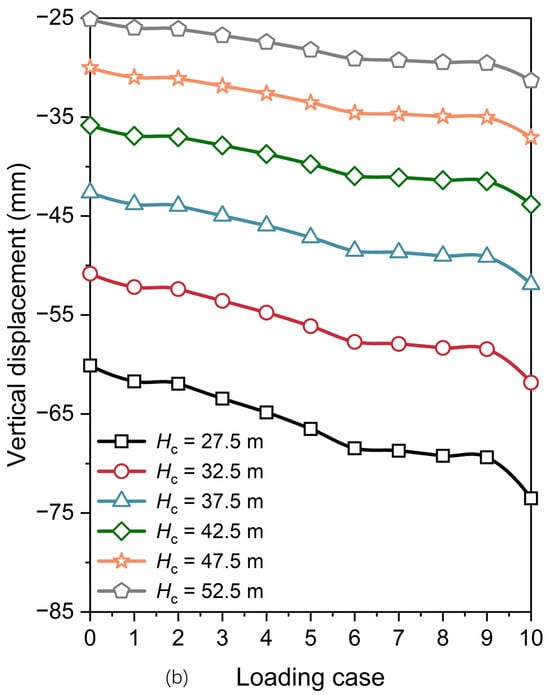
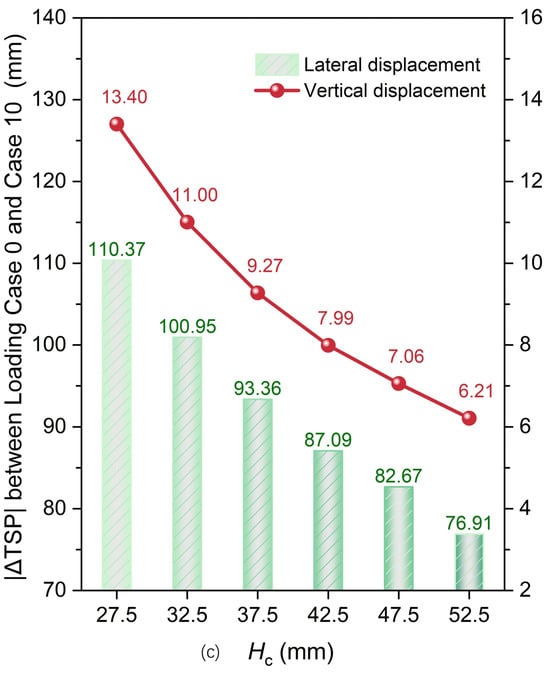
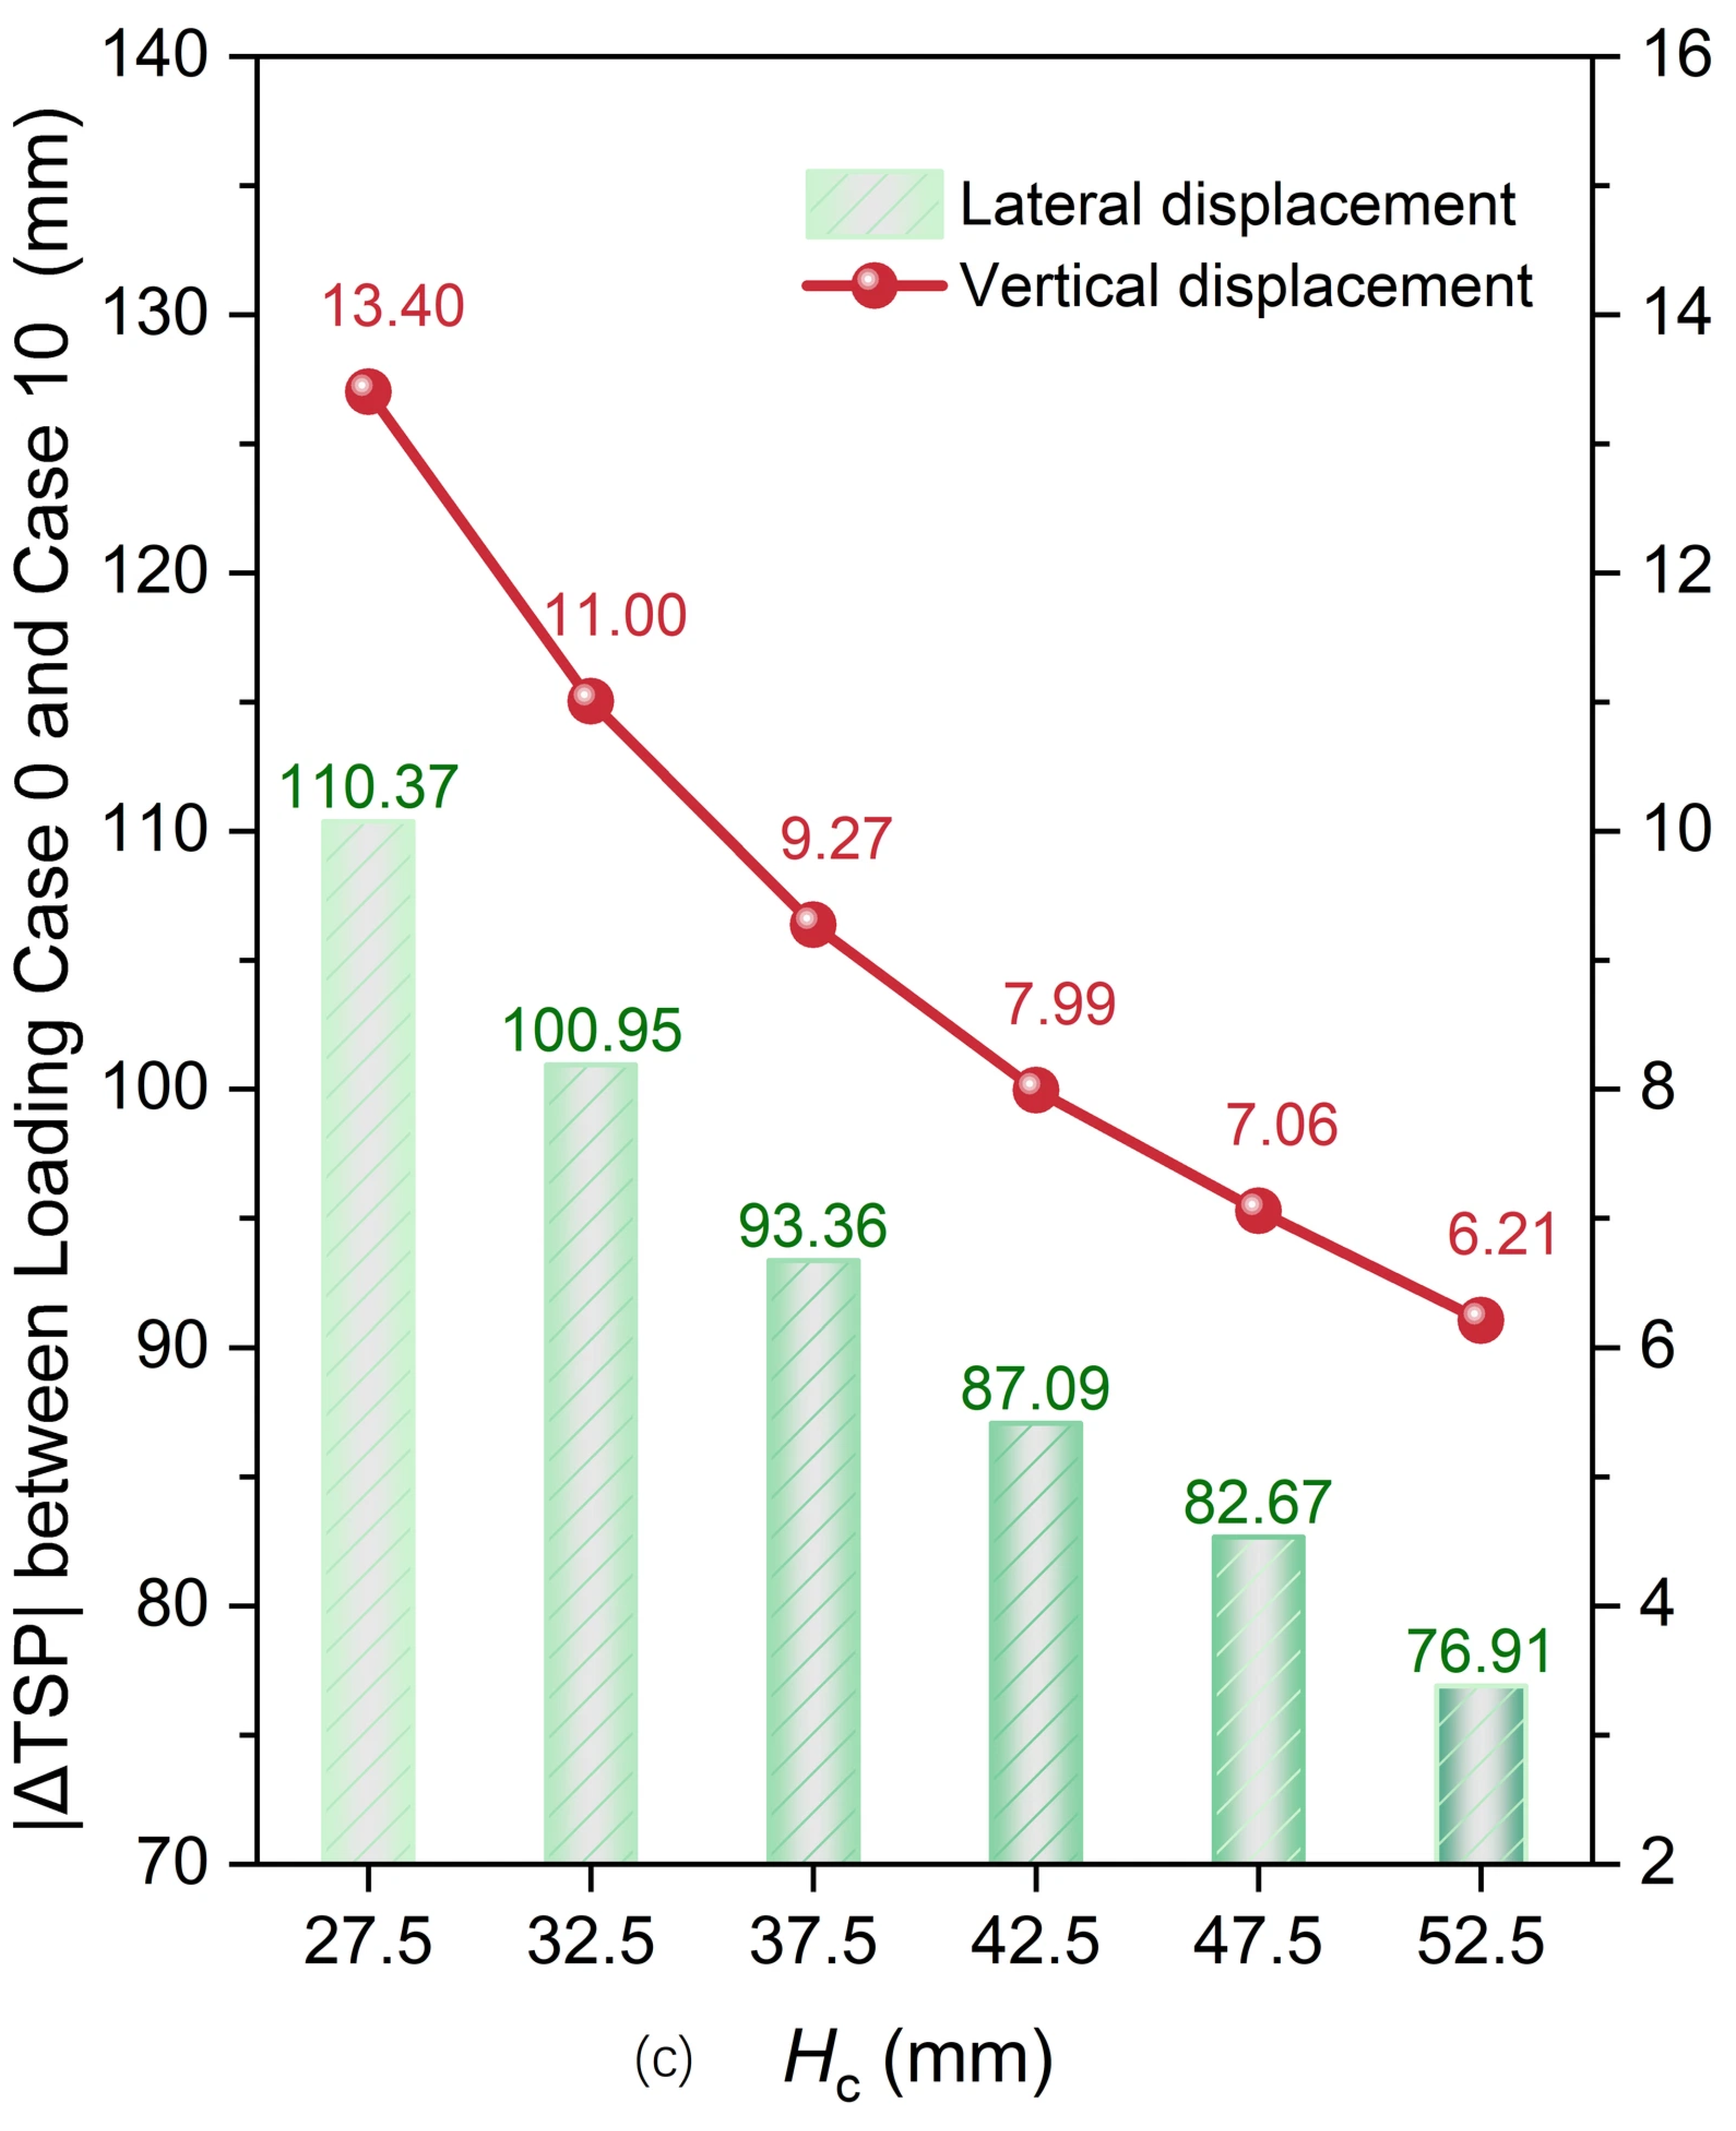
Figure 18 presents the TSP displacements for the PCA with varying caisson heights. The lateral displacements vary considerably under different loading cases (Figure 18a), whereas the vertical displacements exhibit little variation (Figure 18b). Figure 18c shows the absolute difference in TSP displacement (|ΔTSP|) from Loading Case 0 to Case 10. As the Hc increases from 27.5 m to 52.5 m, the corresponding incremental reduction rates of |ΔTSP| (i.e., the reduction relative to the preceding case) for lateral displacement are 8.54%, 7.52%, 6.72%, 5.06%, and 6.97%, while those for vertical displacement are 17.91%, 15.73%, 13.81%, 11.76%, and 11.91%. A smaller |ΔTSP| suggests that the stability of the PCA increases significantly with Hc. This is primarily attributed to the superior capacity of the caisson to resist the main cable tension compared with the steel pipe piles within the PCA. Nevertheless, a larger Hc leads to higher construction costs. Therefore, a reasonable balance between safety and economic efficiency should be rigorously evaluated in engineering practice.
Figure 18.
Displacements of the TSP for the PCA with varying caisson heights: (a) lateral displacement; (b) vertical displacement; and (c) |ΔTSP| from Loading Case 0 to Case 10.
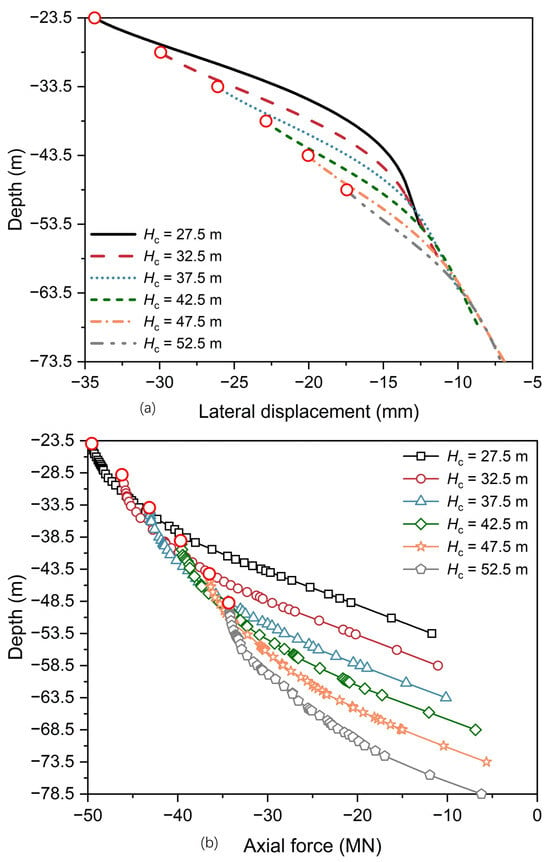
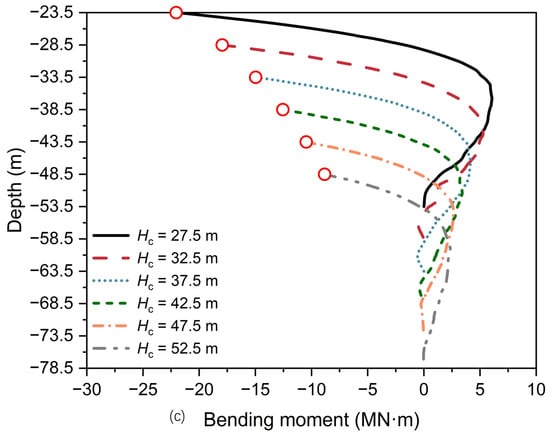
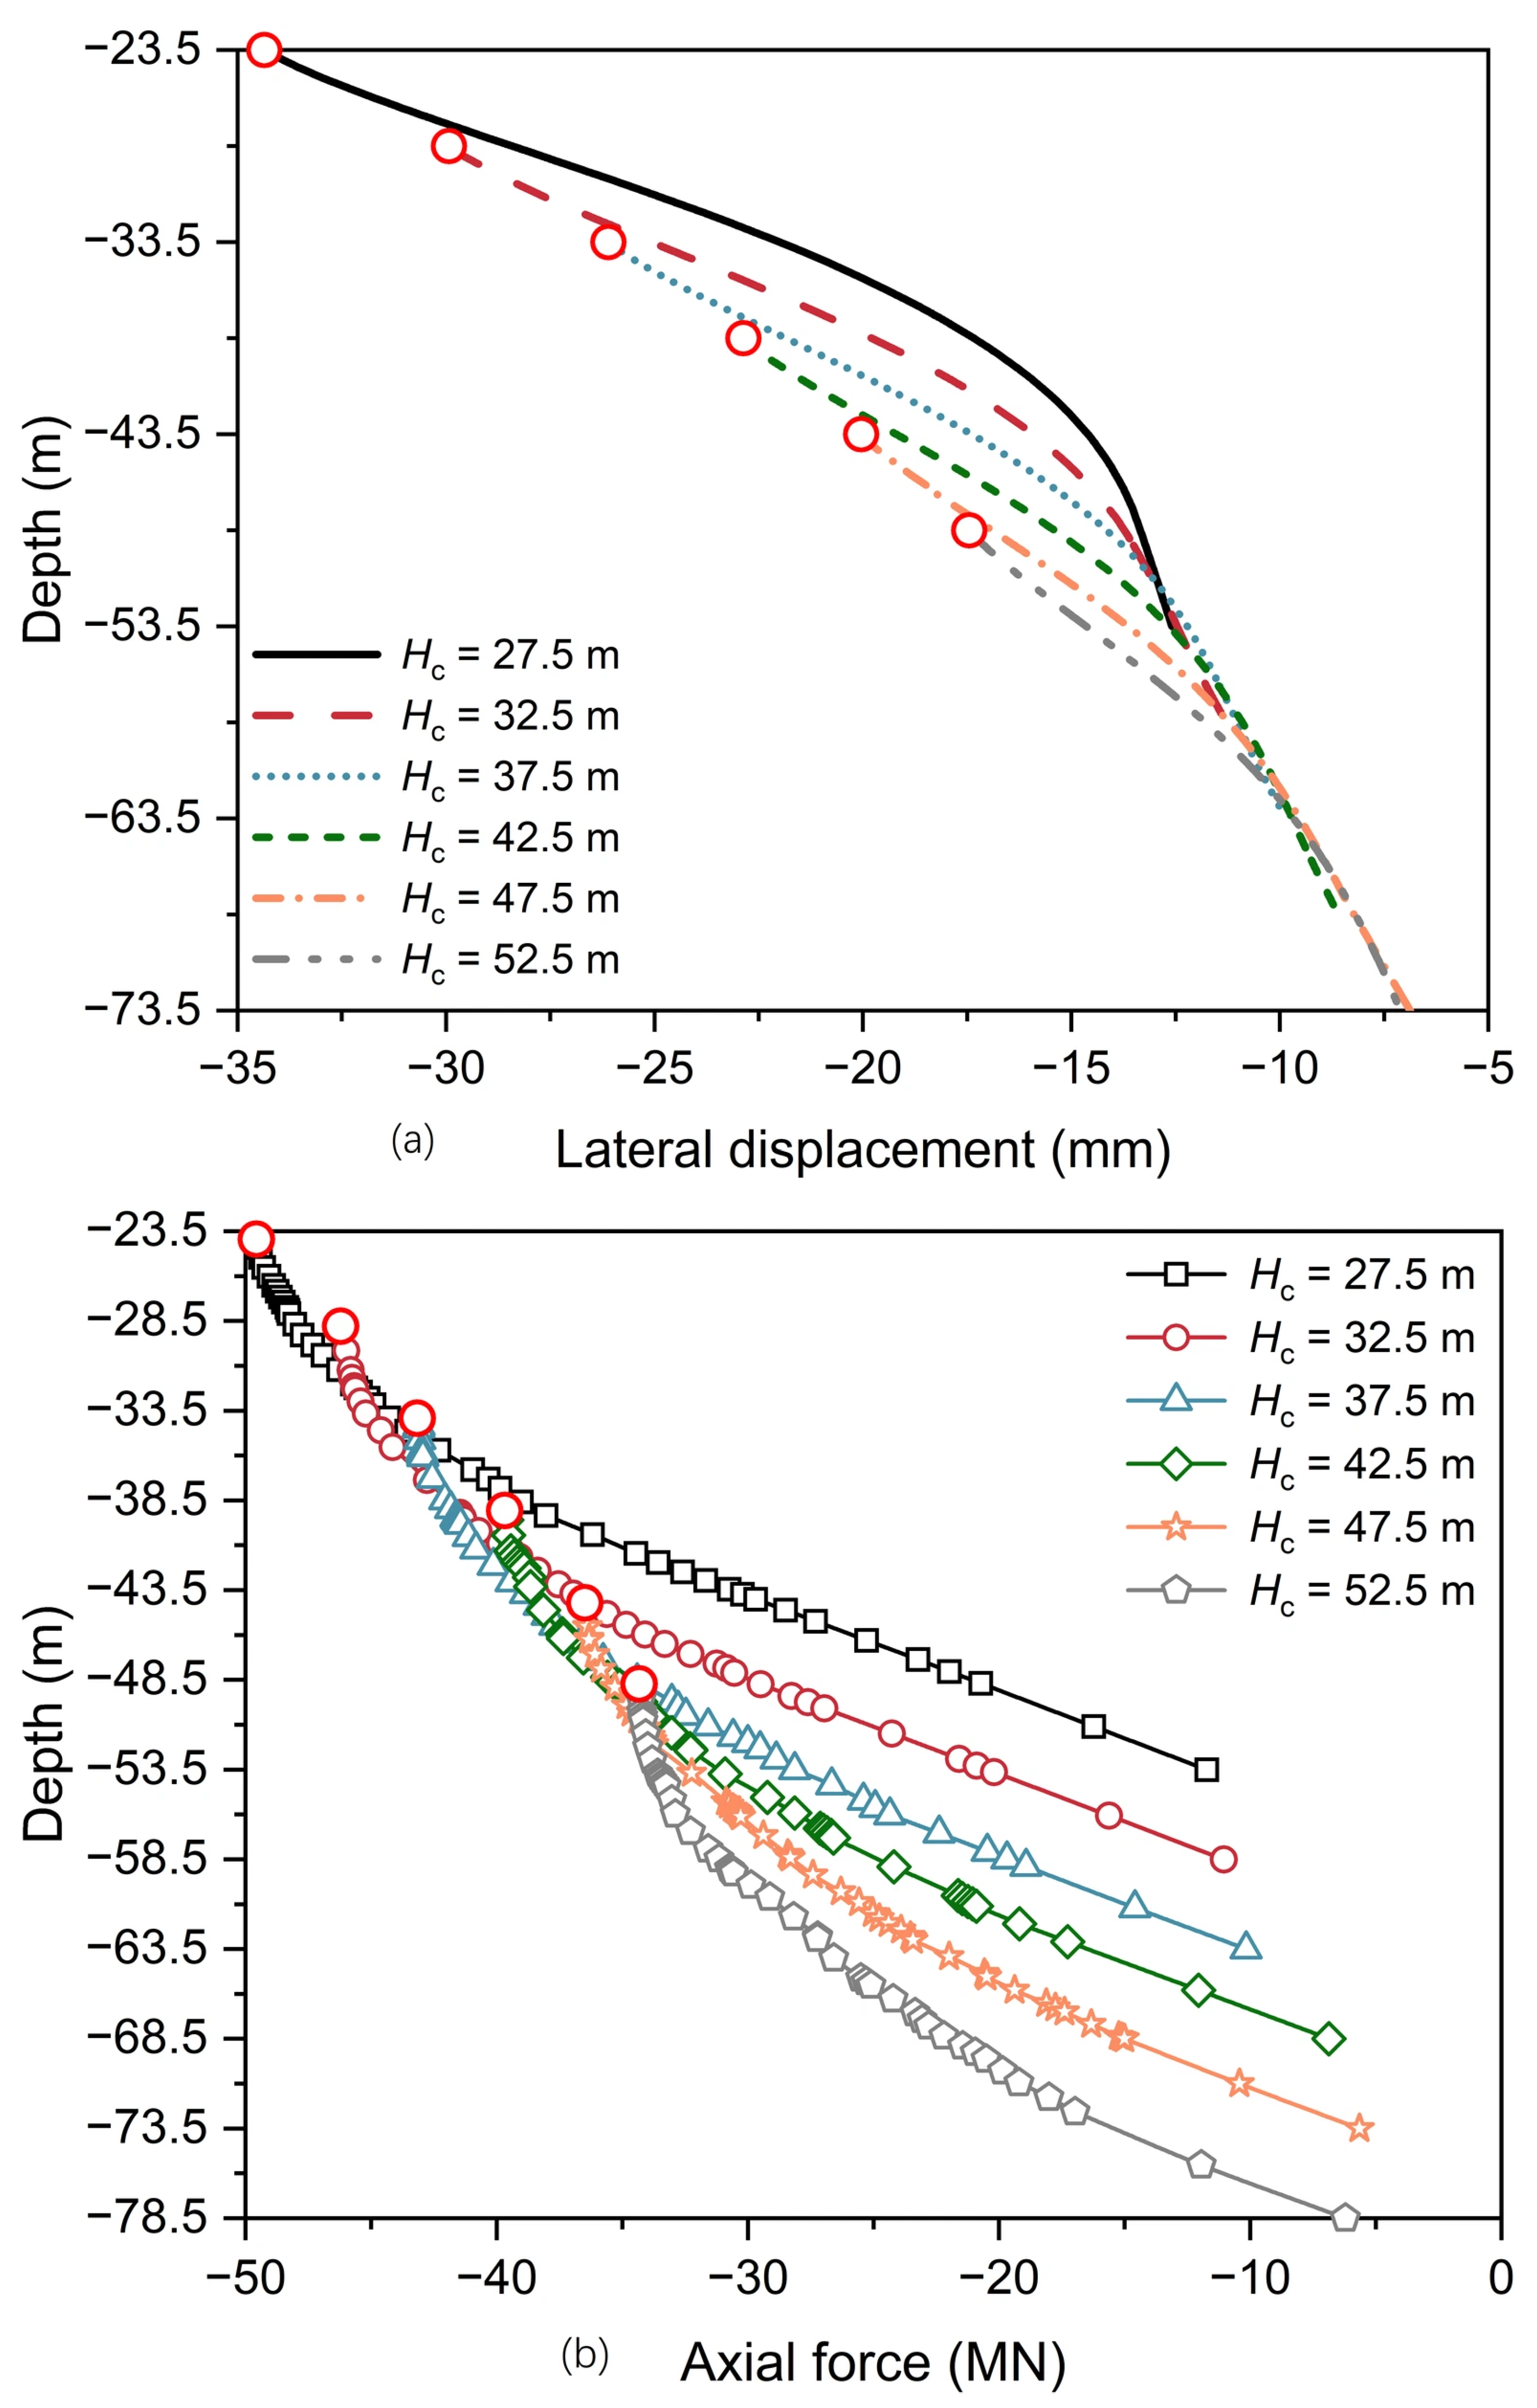
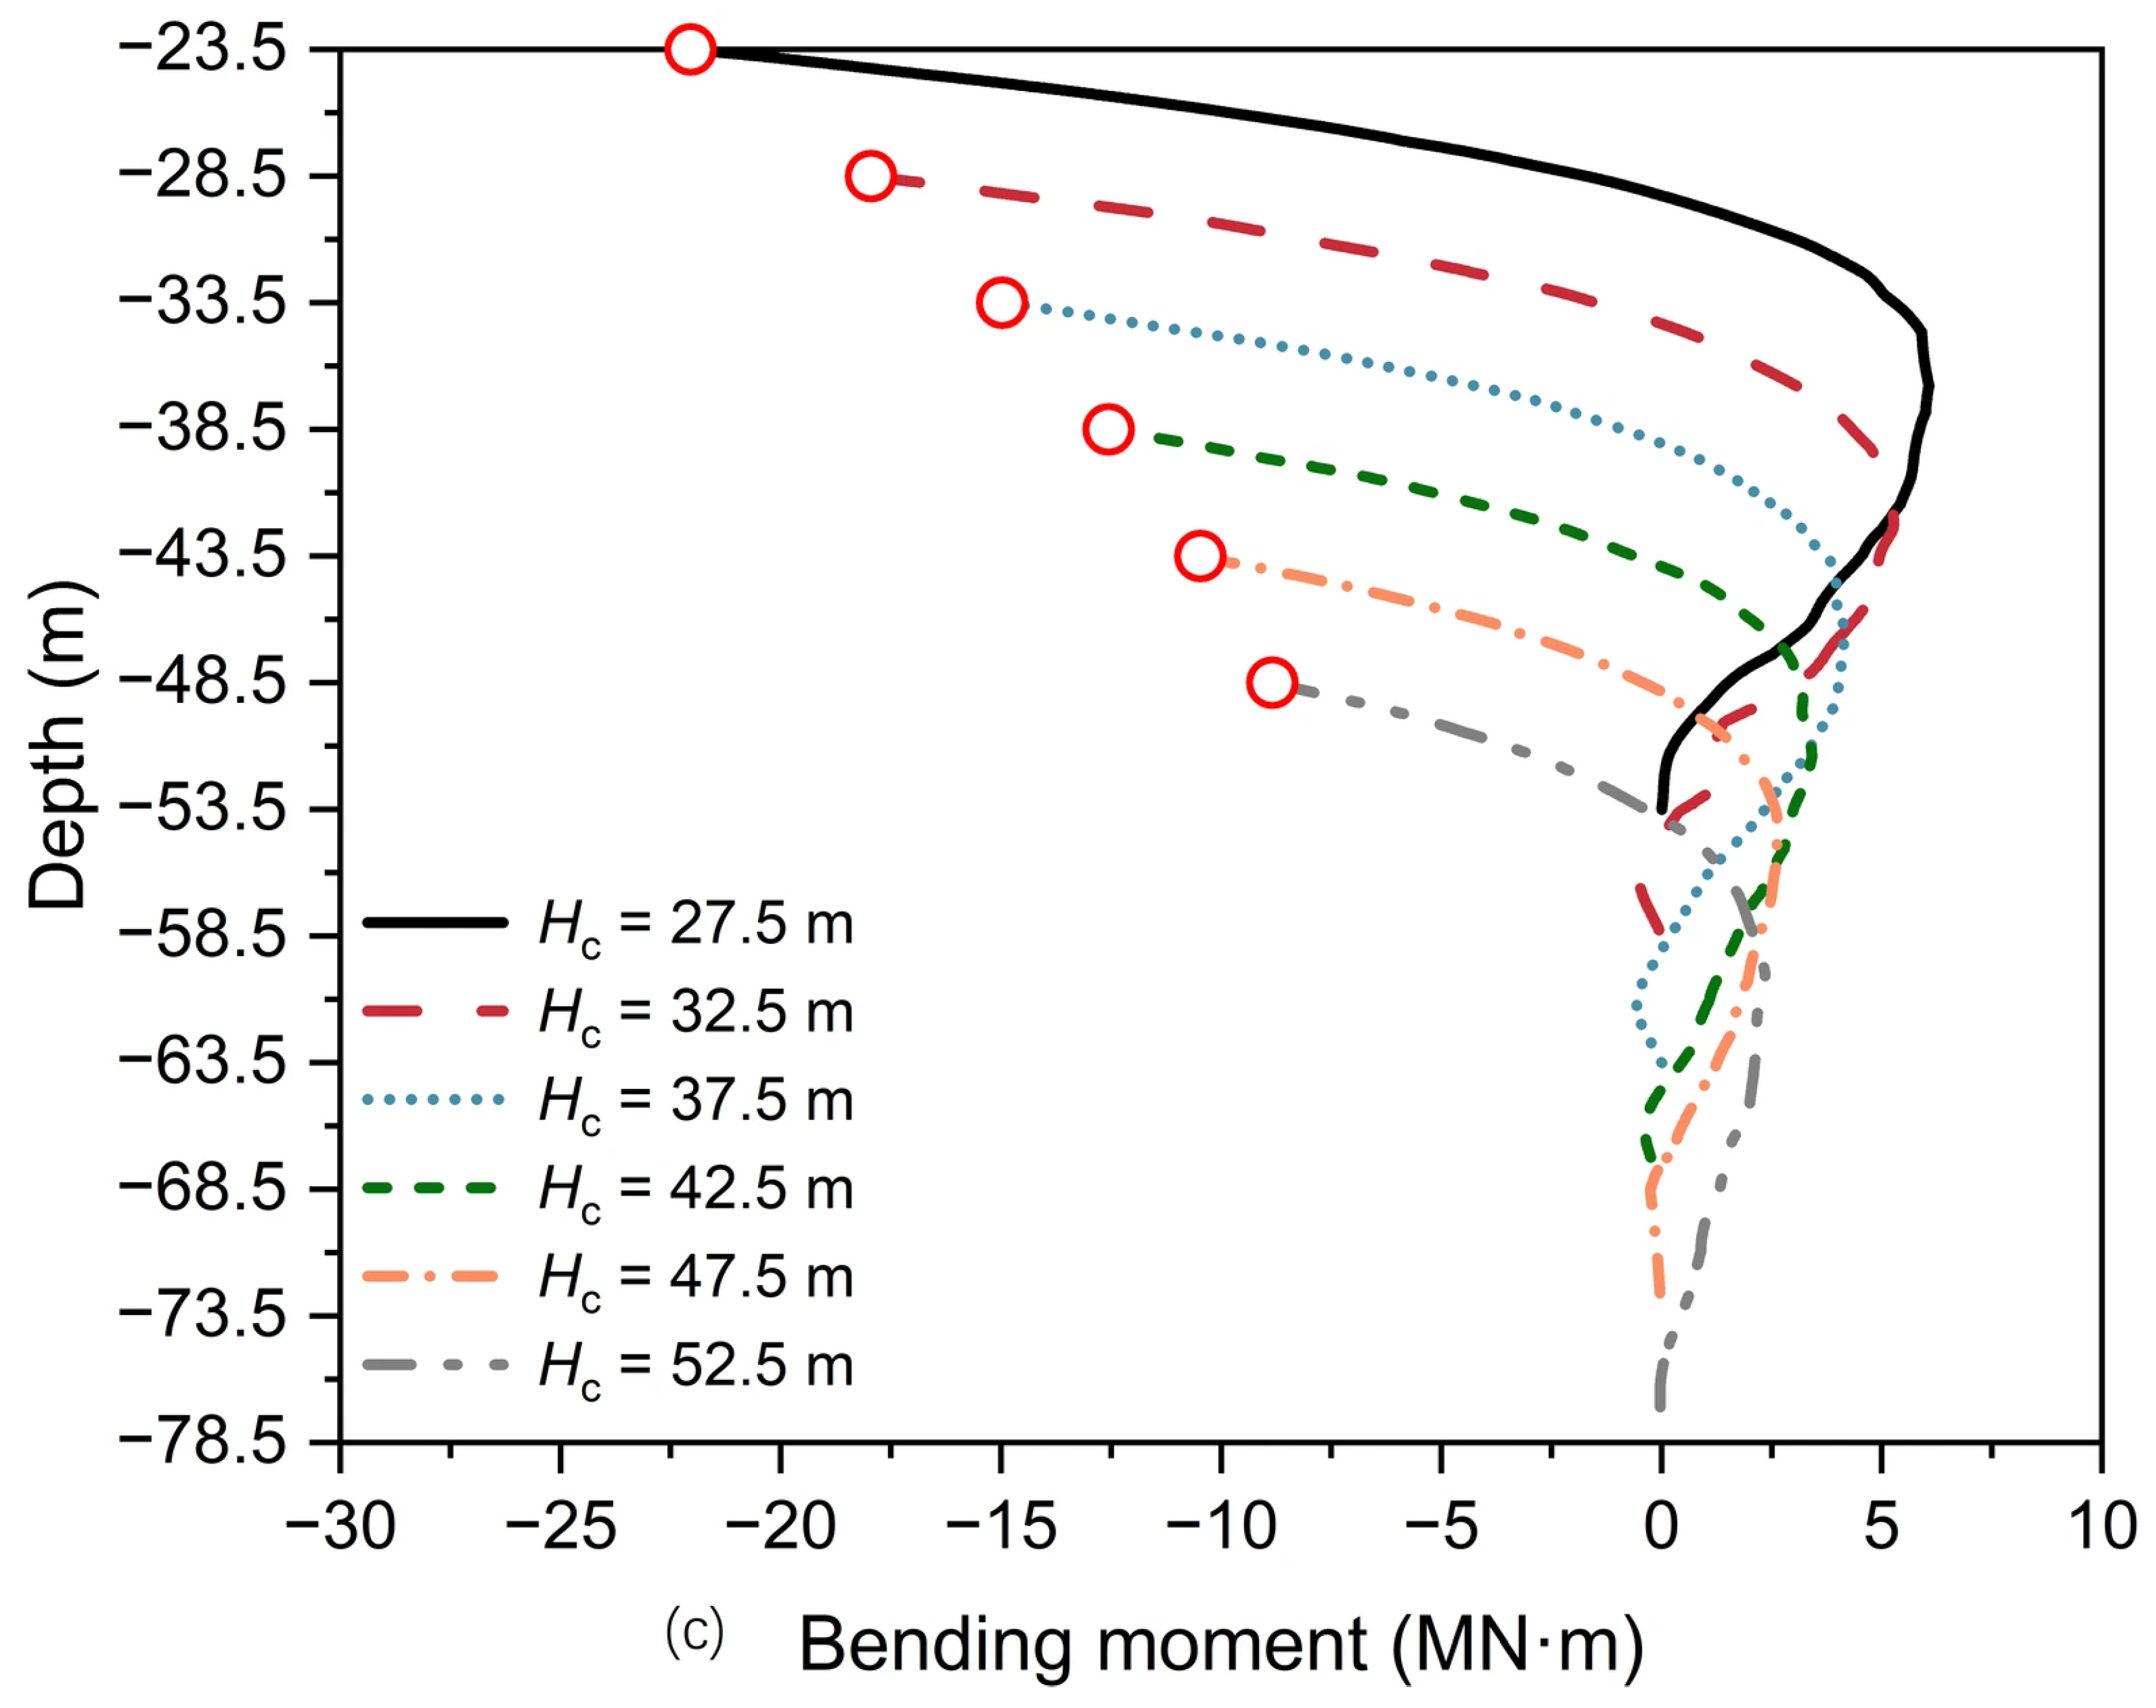
Figure 19 illustrates mechanical responses along pile P11 for the PCA with varying caisson heights (Loading Case 10). As Hc increases from 27.5 m to 52.5 m, the maximum lateral displacement at the pile head decreases significantly from 34.63 mm to 17.83 mm (a total decrease of 48.51%) (Figure 19a), while the axial force at the pile head reduces from 49.57 MN to 34.3 MN (a total decrease of 30.73%) (Figure 19b). Meanwhile, the maximum bending moment along the pile decreases from 22.05 MN·m to 8.84 MN·m (a total decrease of 59.91%) (Figure 19c). These results indicate that the mechanical responses of the pile are markedly reduced with increasing Hc. Accordingly, increasing the caisson height can effectively enhance the load-sharing ratio of the caisson.
Figure 19.
Mechanical responses along pile P11 for the PCA with varying caisson heights (Loading Case 10): (a) lateral displacement; (b) axial force; and (c) bending moment.
4.2. Influence of Pile Diameter
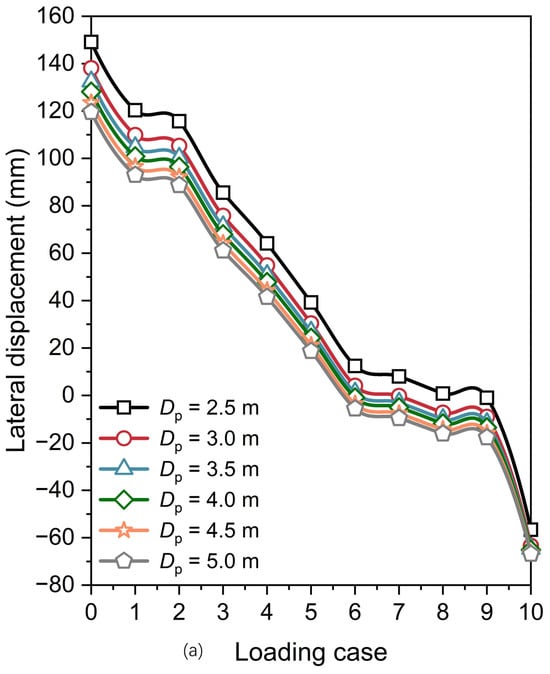
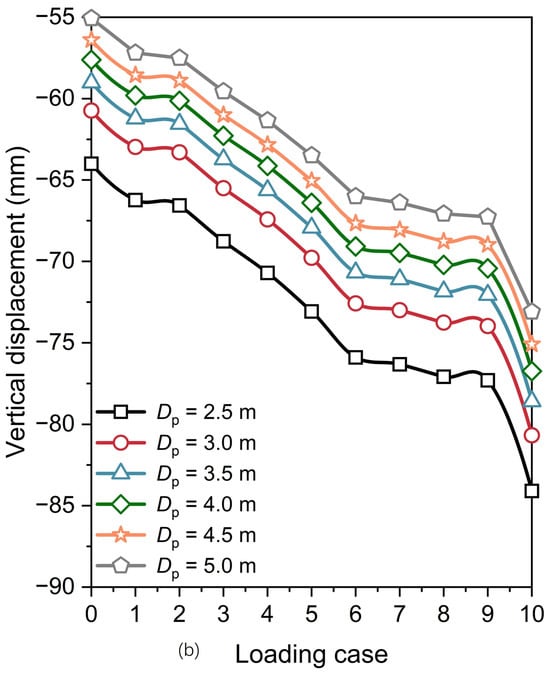
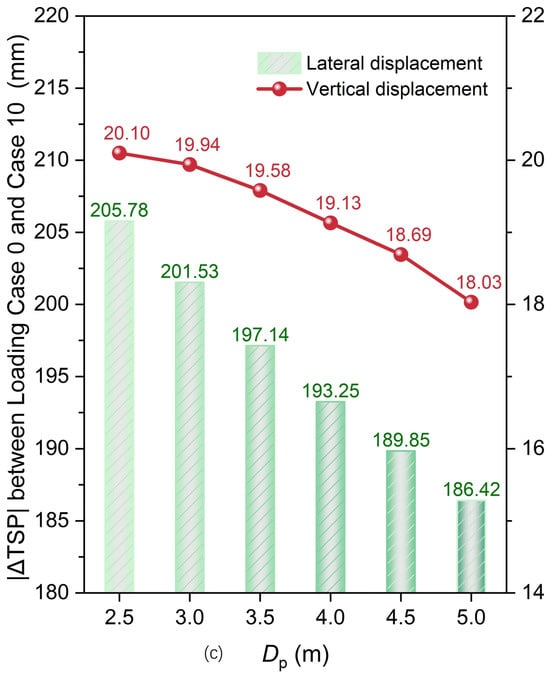
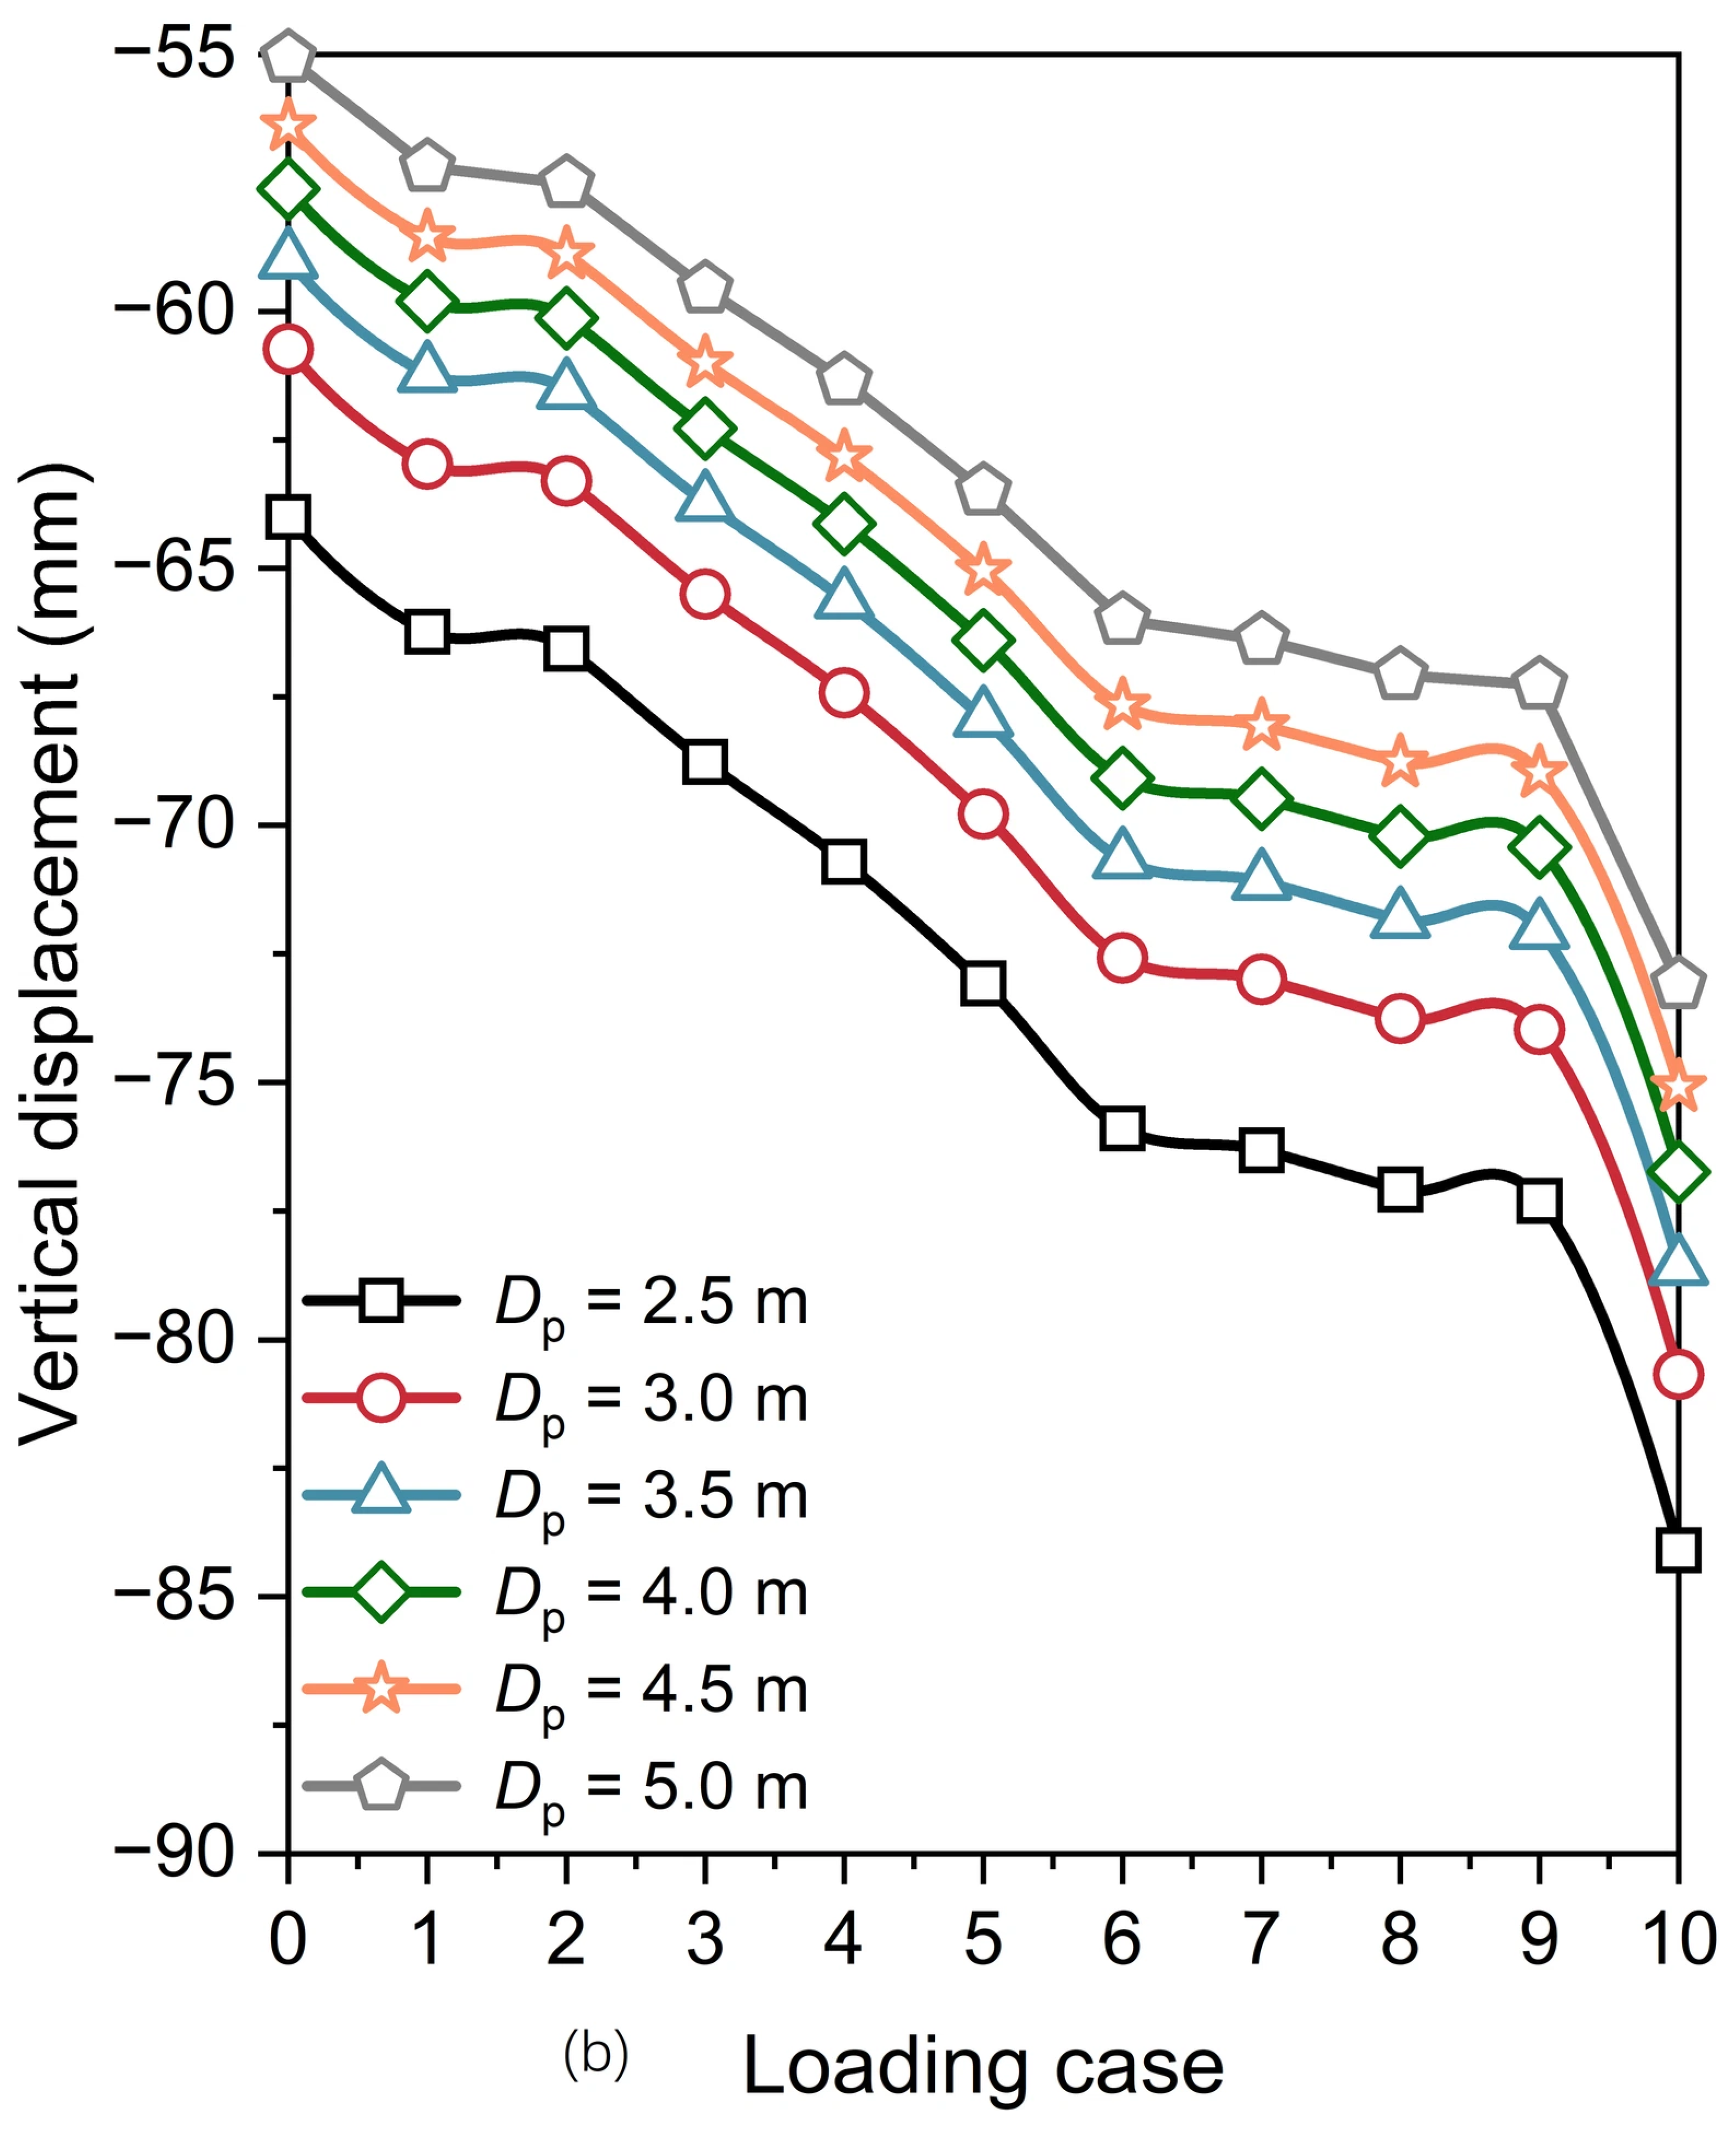
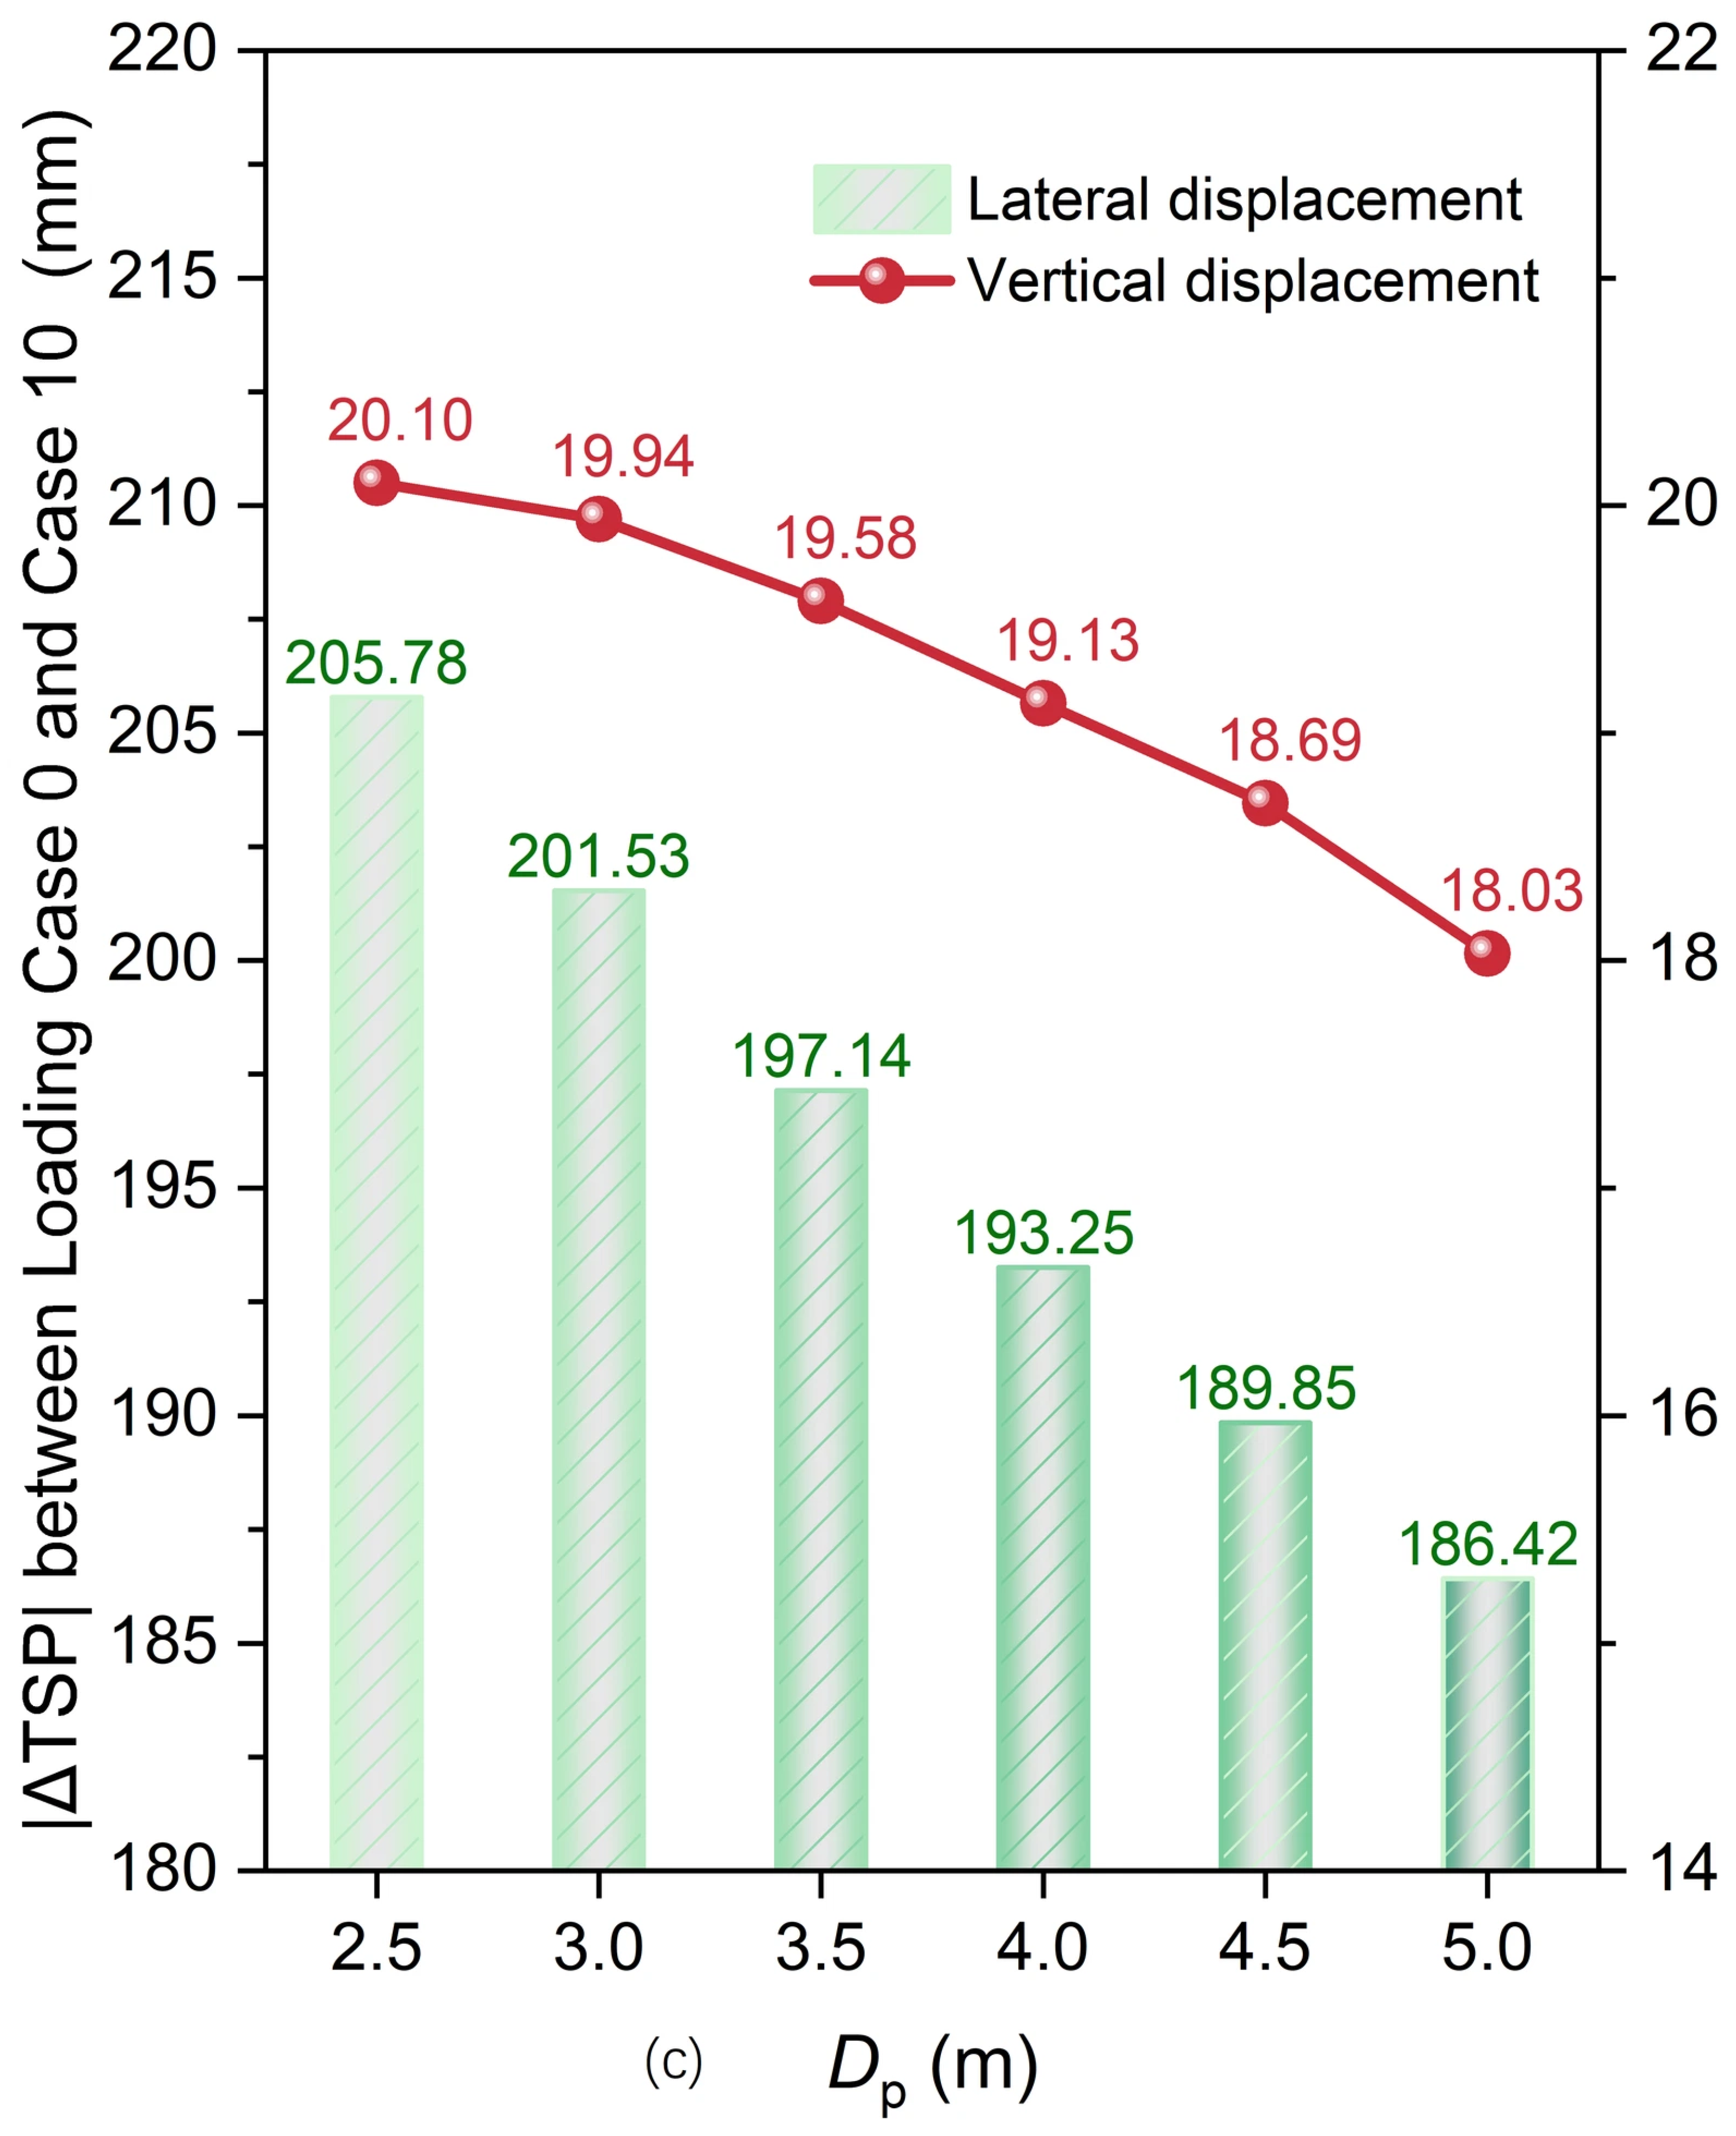
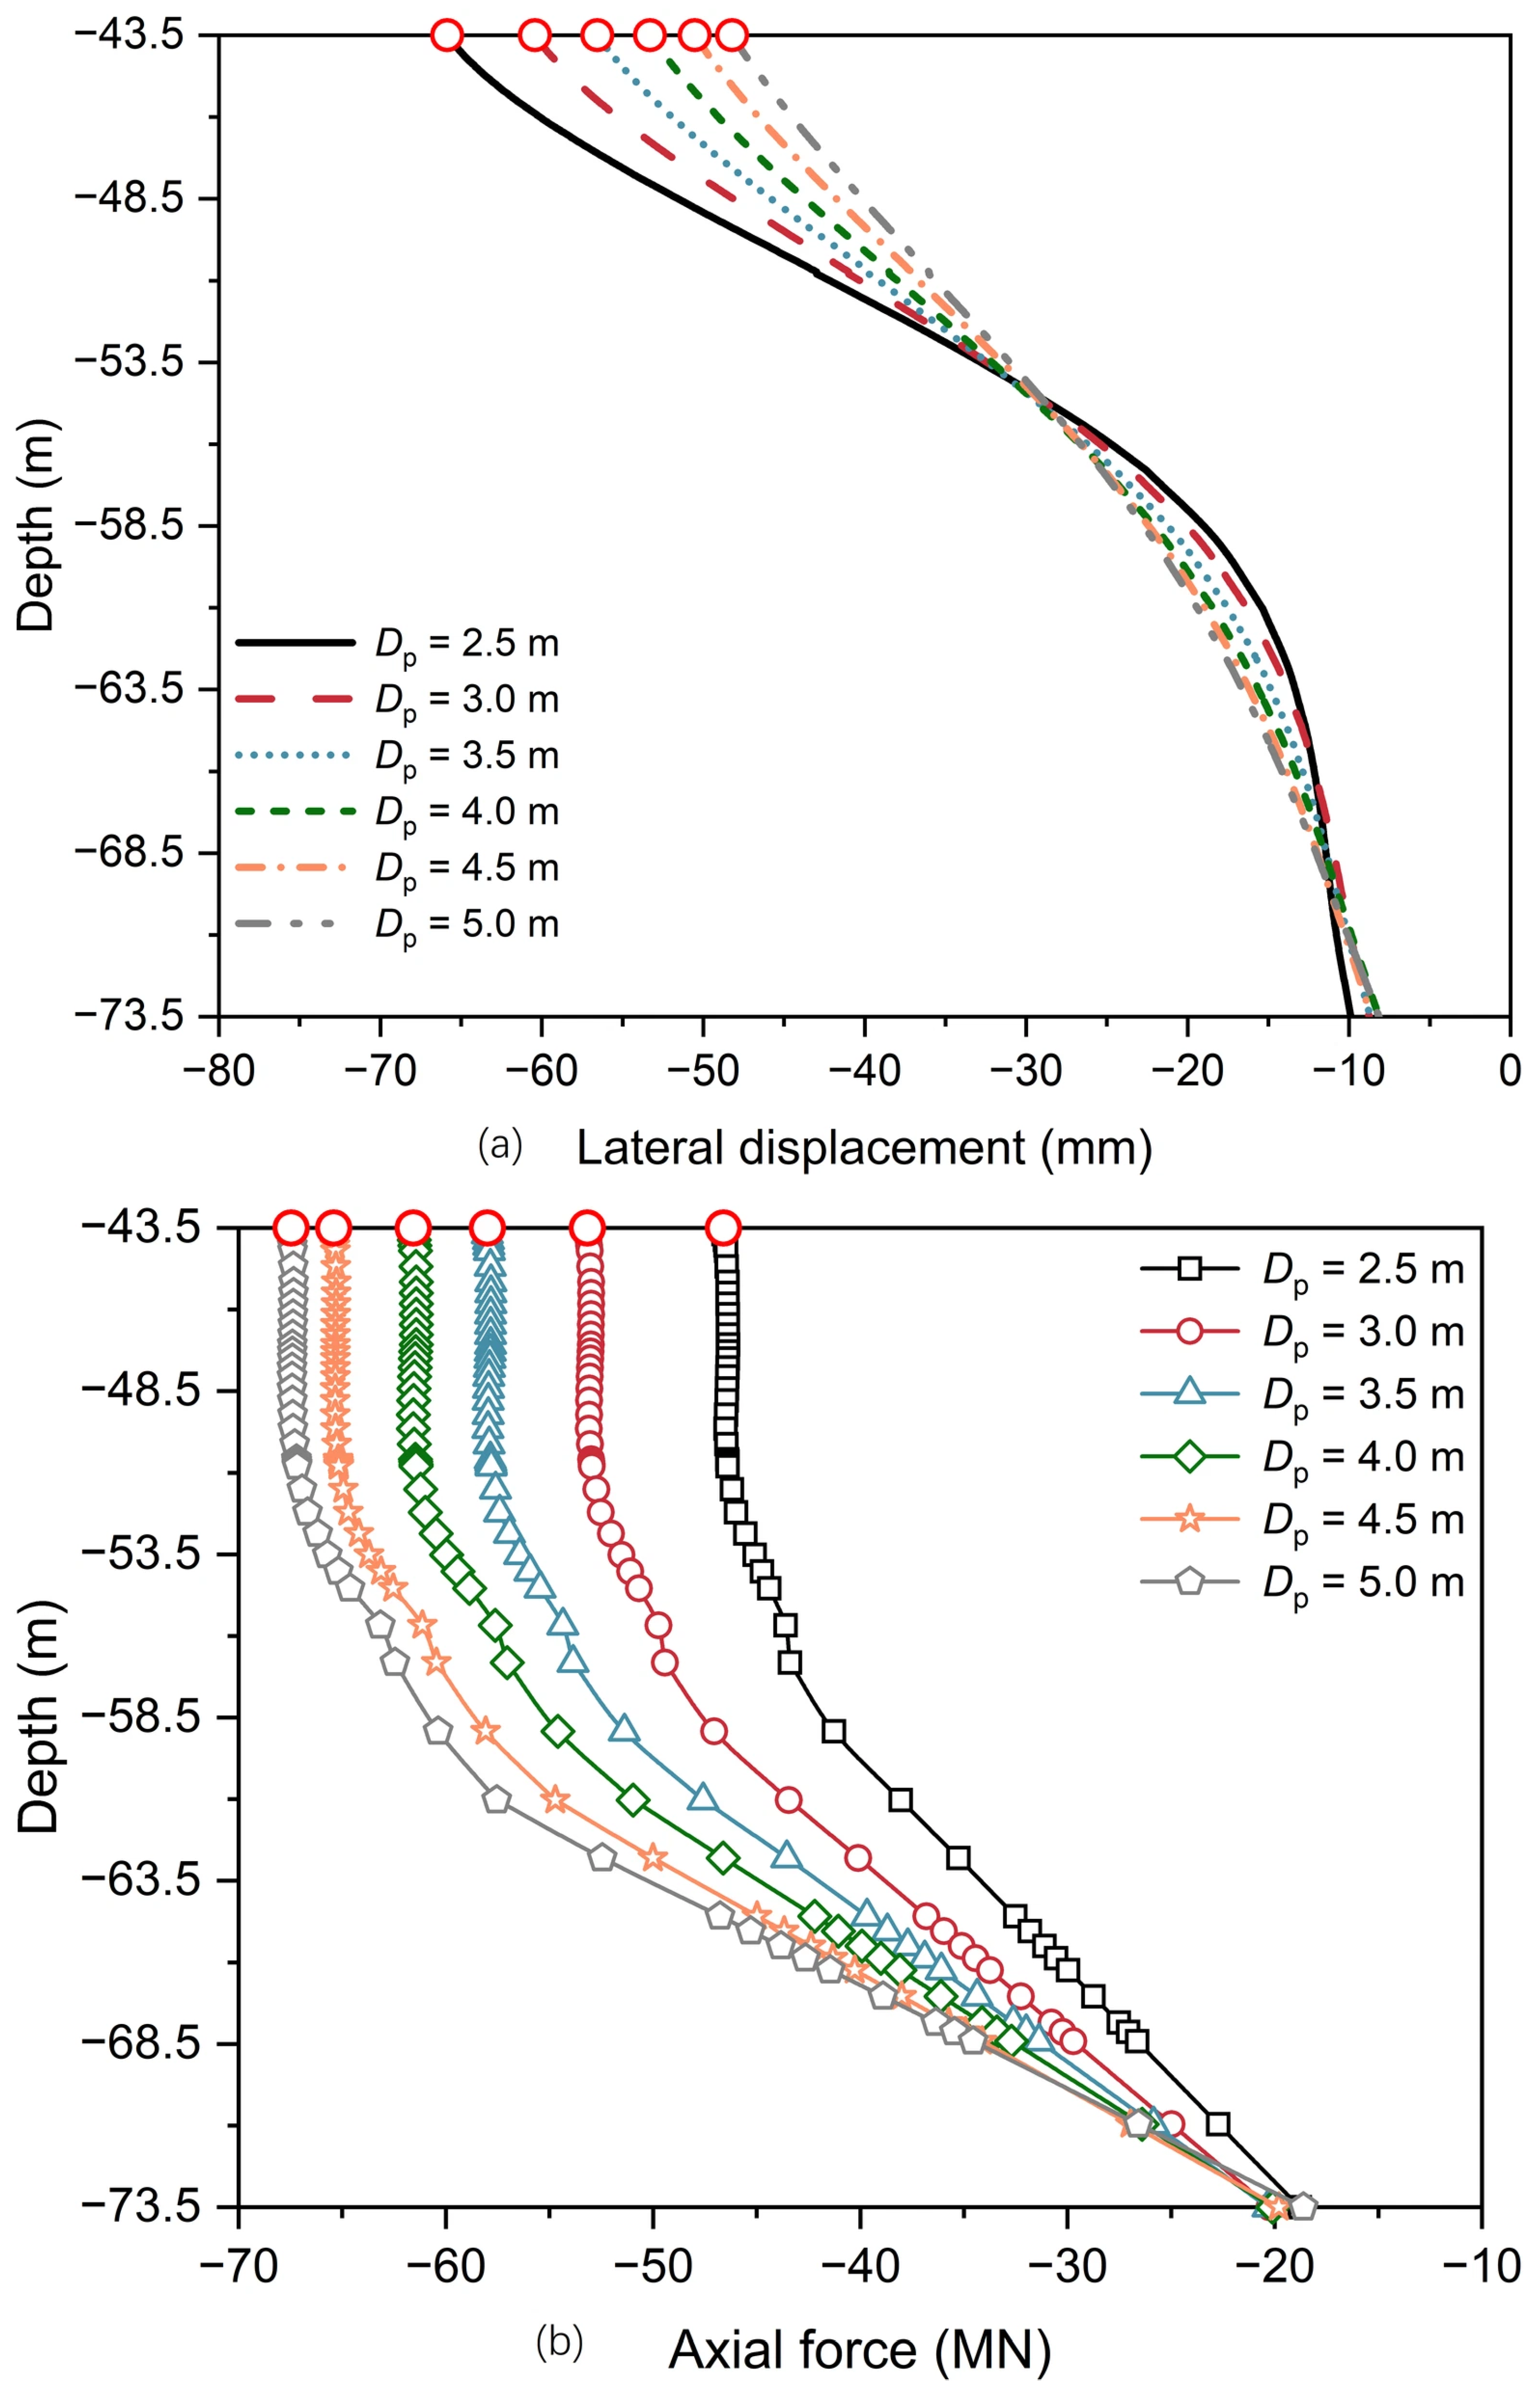
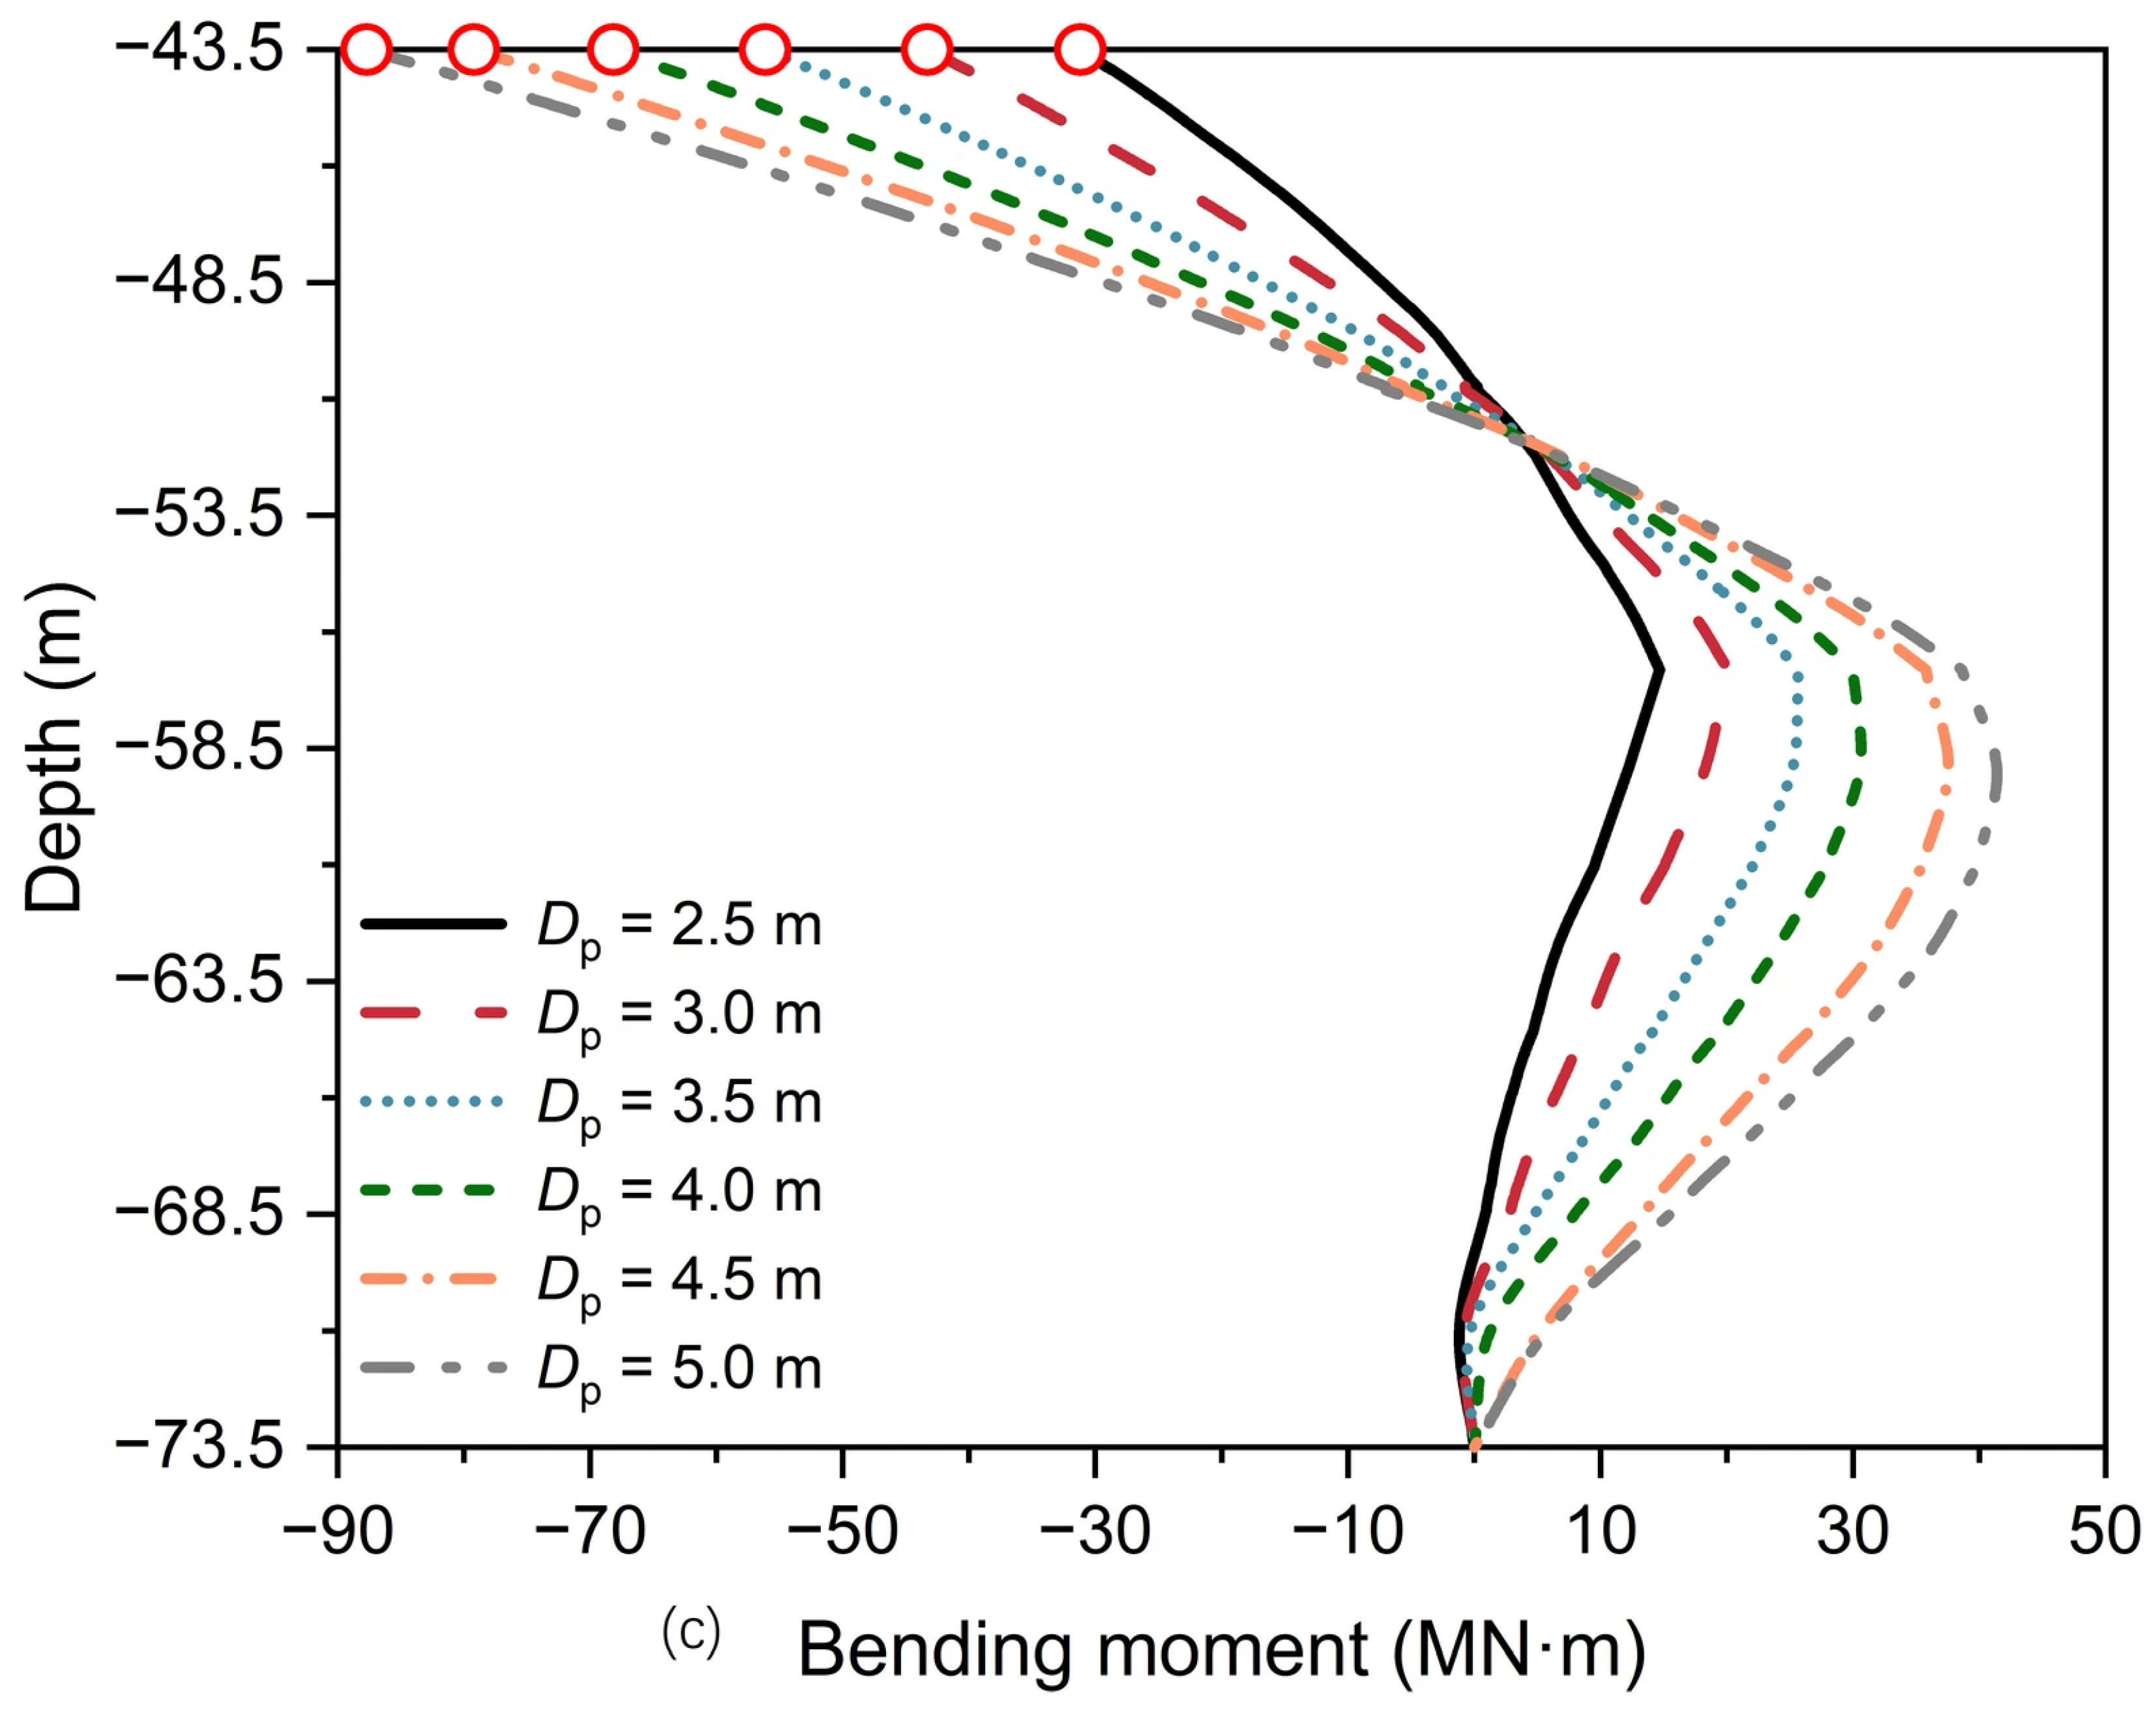
To evaluate the effect of pile diameter on the response of the PCA, analyses were performed for Dp = 2.5, 3.0, 3.5, 4.0, 4.5, and 5.0 m, with corresponding wall thicknesses tp of 0.03135, 0.03635, 0.04135, 0.04635, 0.05135, and 0.05635 m, respectively, while all other parameters were maintained identical to those of the reference case. The wall thickness tp was determined in accordance with Designing, and Constructing Fixed Offshore Platforms-Working Stress Design (API Recommended Practice 2A-WSD) [43] as follows:
Figure 20 presents the TSP displacements for the PCA with varying pile diameters. As Dp increases from 2.5 m to 5.0 m, the corresponding incremental rates of reduction in |ΔTSP| for lateral displacement are 2.07%, 2.18%, 1.97%, 1.76%, and 1.81%, while those for vertical displacement are 0.80%, 1.81%, 2.30%, 2.30%, and 3.53%. This suggests that increasing the pile diameter has a marginal effect on the overall displacement of the PCA.
Figure 20.
Displacements of the TSP for the PCA with varying pile diameters: (a) lateral displacement; (b) vertical displacement; and (c) |ΔTSP| from Loading Case 0 to Case 10.
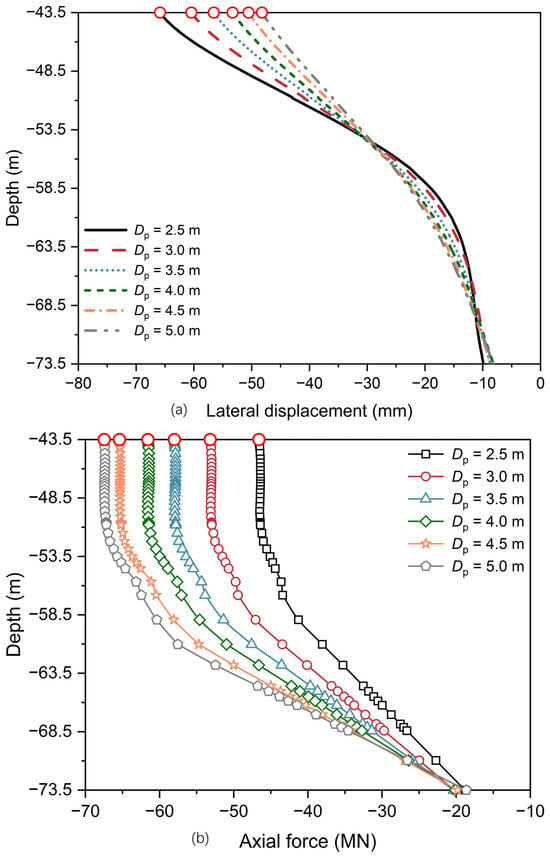
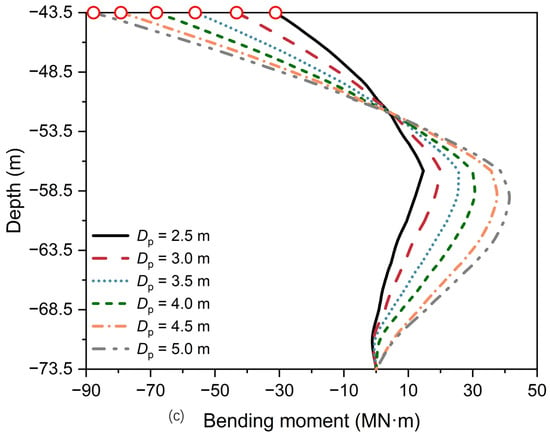
Figure 21 shows the mechanical response along pile P11 for the PCA with varying pile diameters (Loading Case 10). With an increase in Dp from 2.5 m to 5.0 m, the maximum lateral displacement at the pile head reduces from 65.85 mm to 48.22 mm (a total decrease of 26.78%) (Figure 21a). Meanwhile, the maximum axial force along the pile increases from 46.60 MN to 67.47 MN (a total increase of 44.79%) (Figure 21b), while the maximum bending moment rises from 31.20 MN·m to 87.71 MN·m (a total increase of 181.09%) (Figure 21c). These findings demonstrate that Dp has a notable effect on the mechanical responses of the pile for the PCA. Specifically, increasing the pile diameter enhances the axial and flexural rigidity of the pile shaft, thereby attracting greater axial forces and bending moments while efficiently decreasing lateral displacement. Furthermore, both the maximum axial force and bending moment of pile P11 occur at the pile head, yielding maximum combined stresses of 400.35, 331.86, 272.30, 226.24, 191.62, and 161.18 MPa for Dp = 2.5, 3.0, 3.5, 4.0, 4.5, and 5.0 m, respectively, representing a total reduction of 59.74%. Assuming a steel yield strength of 490 MPa for the pile, the cross-sectional utilization ratios remain below 1.0 (specifically 0.68 for Dp = 3.0 m). Therefore, increasing the pile diameter effectively reduces the maximum combined stress at the critical section, thereby enhancing its structural safety.
Figure 21.
Mechanical responses along pile P11 for the PCA with varying pile diameters (Loading Case 10): (a) lateral displacement; (b) axial force; and (c) bending moment.
4.3. Influence of Pile Length
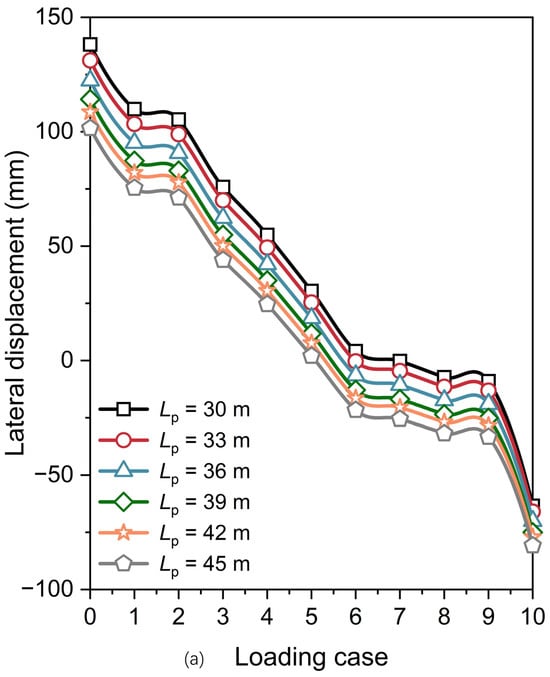
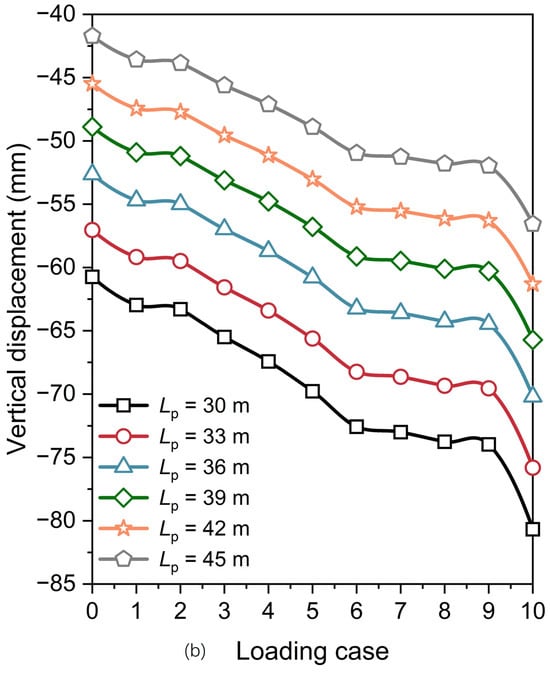
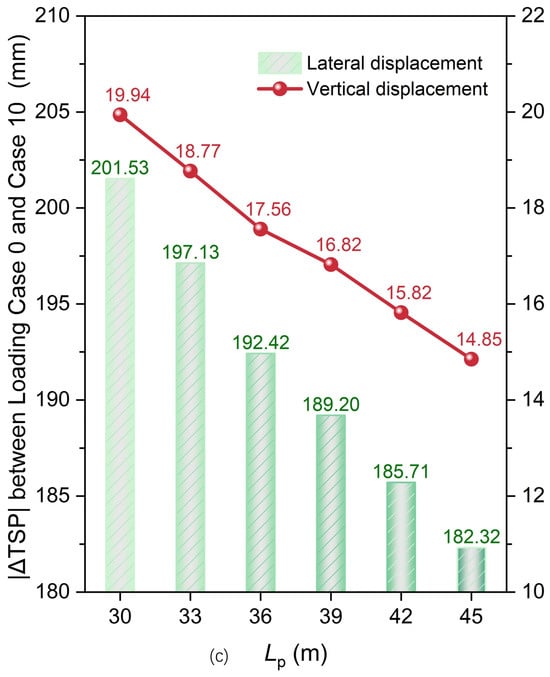
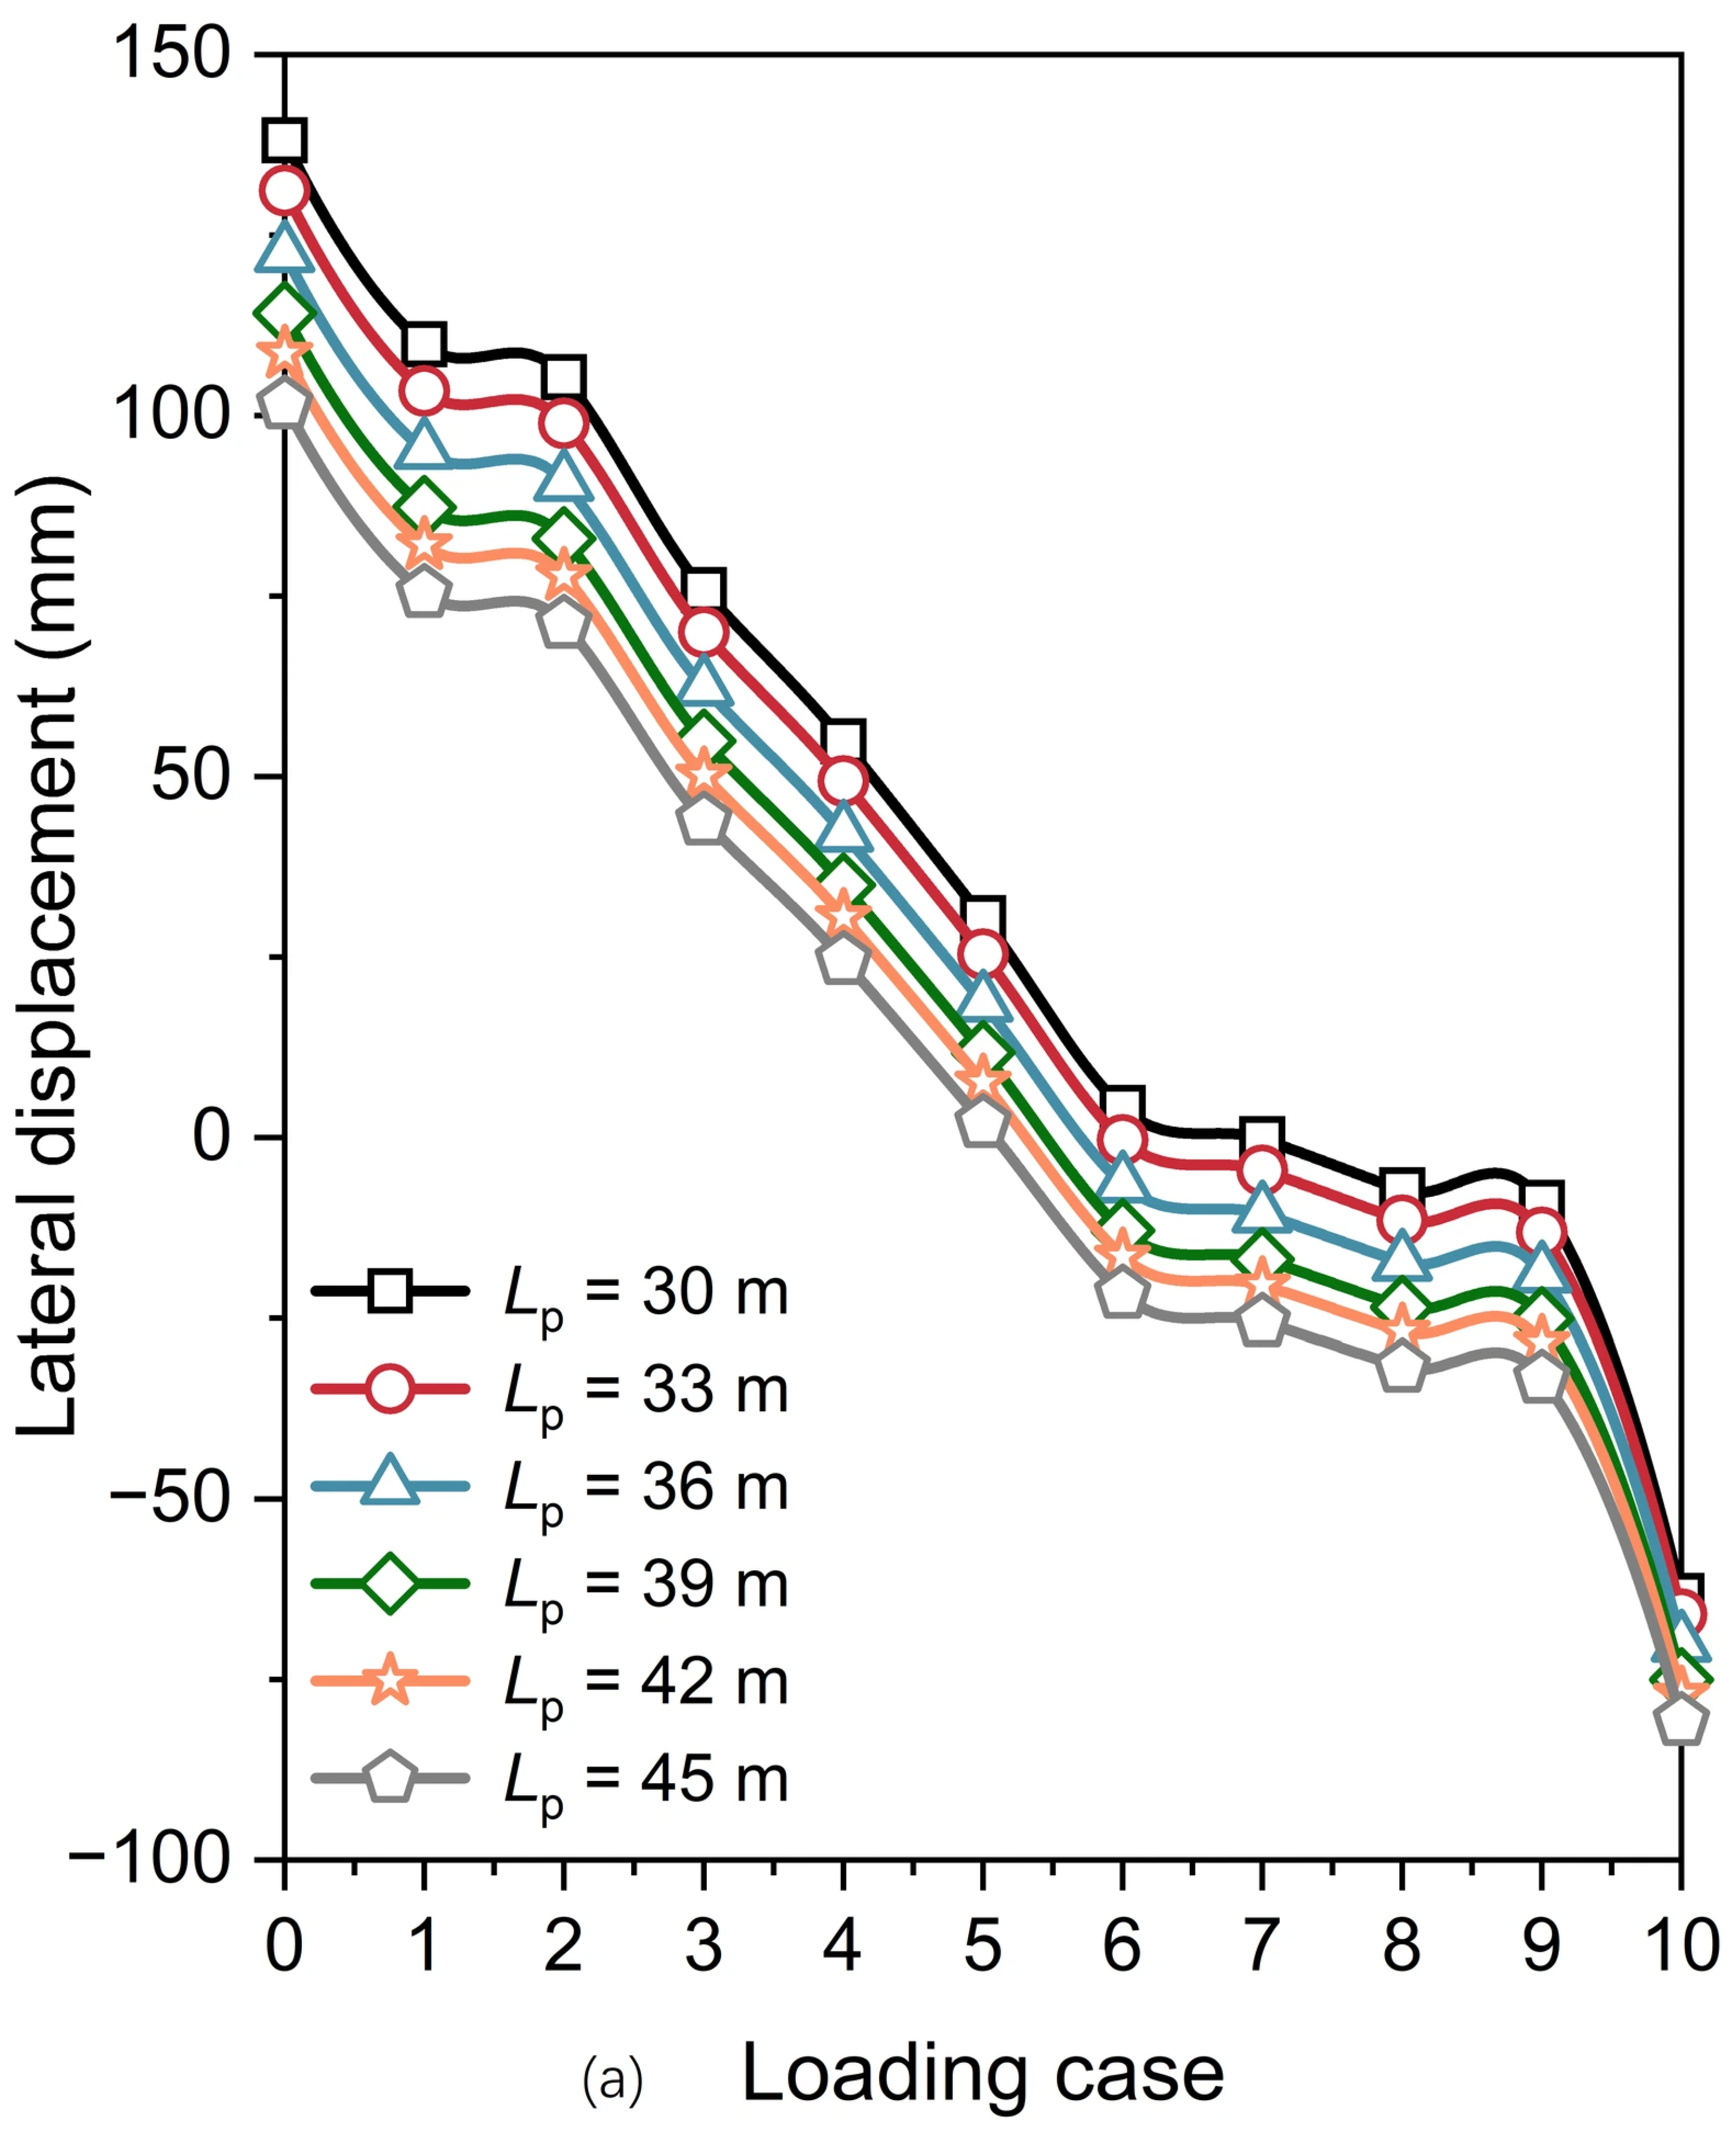
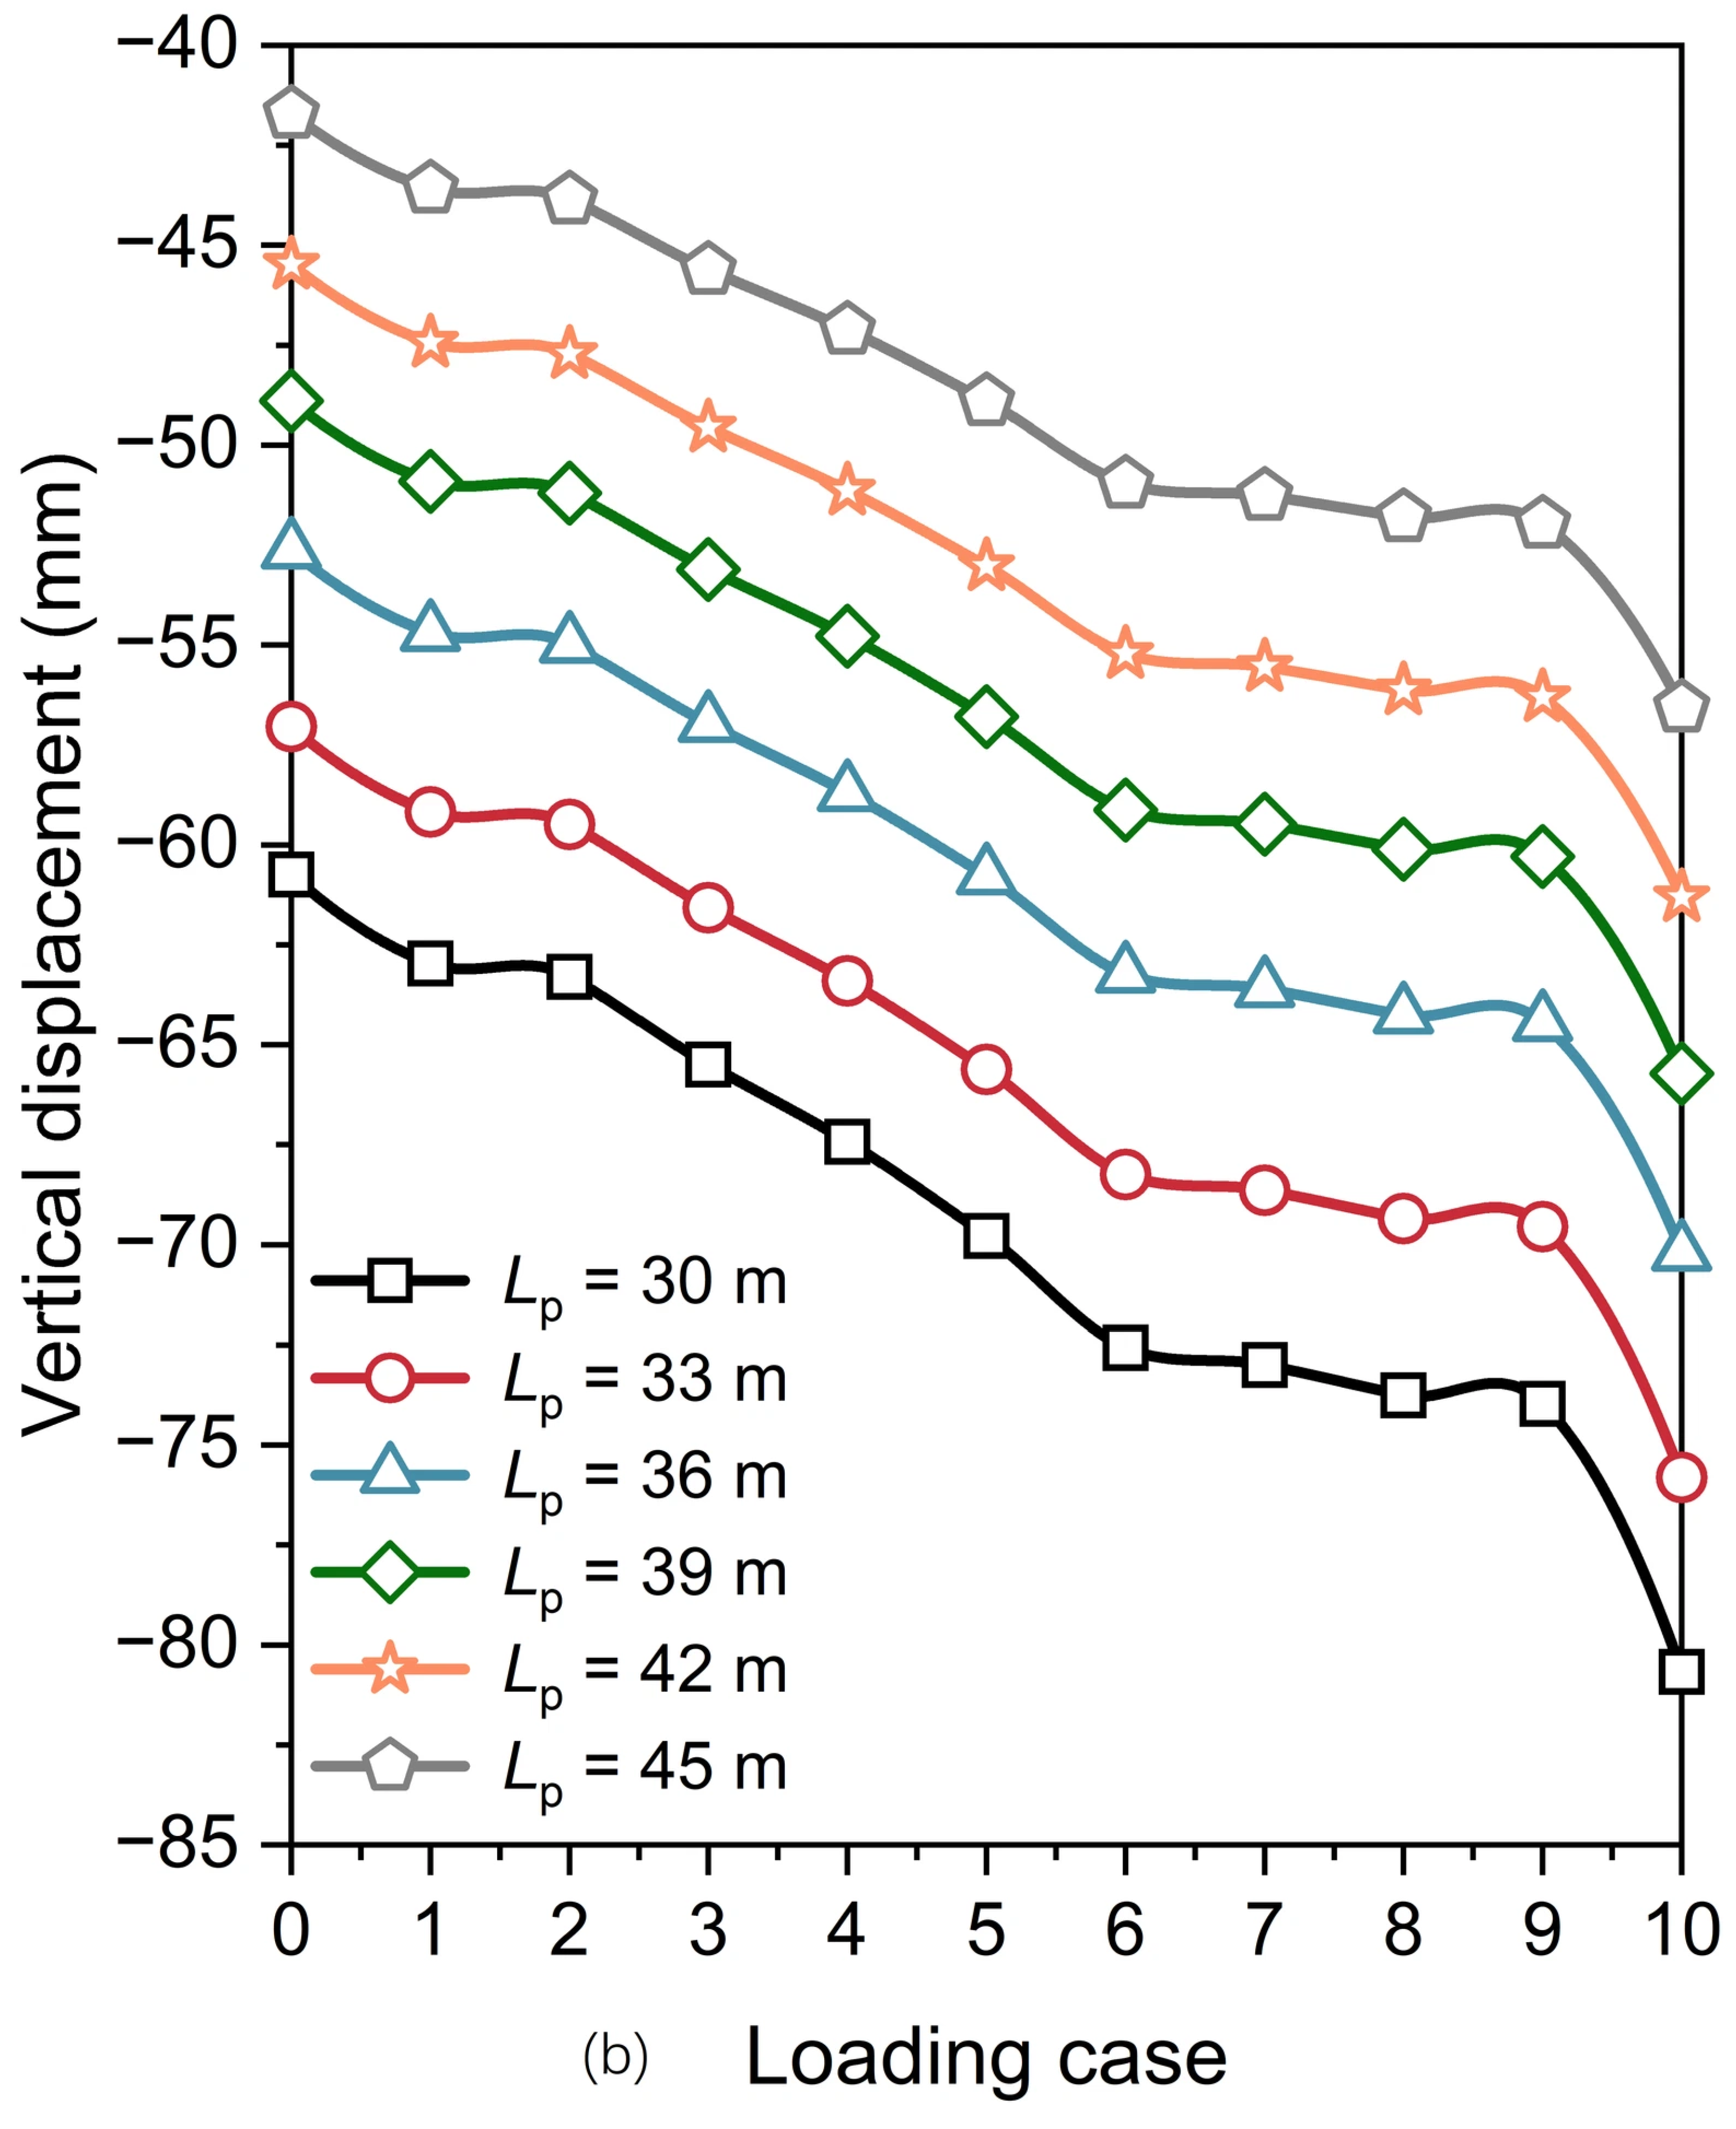
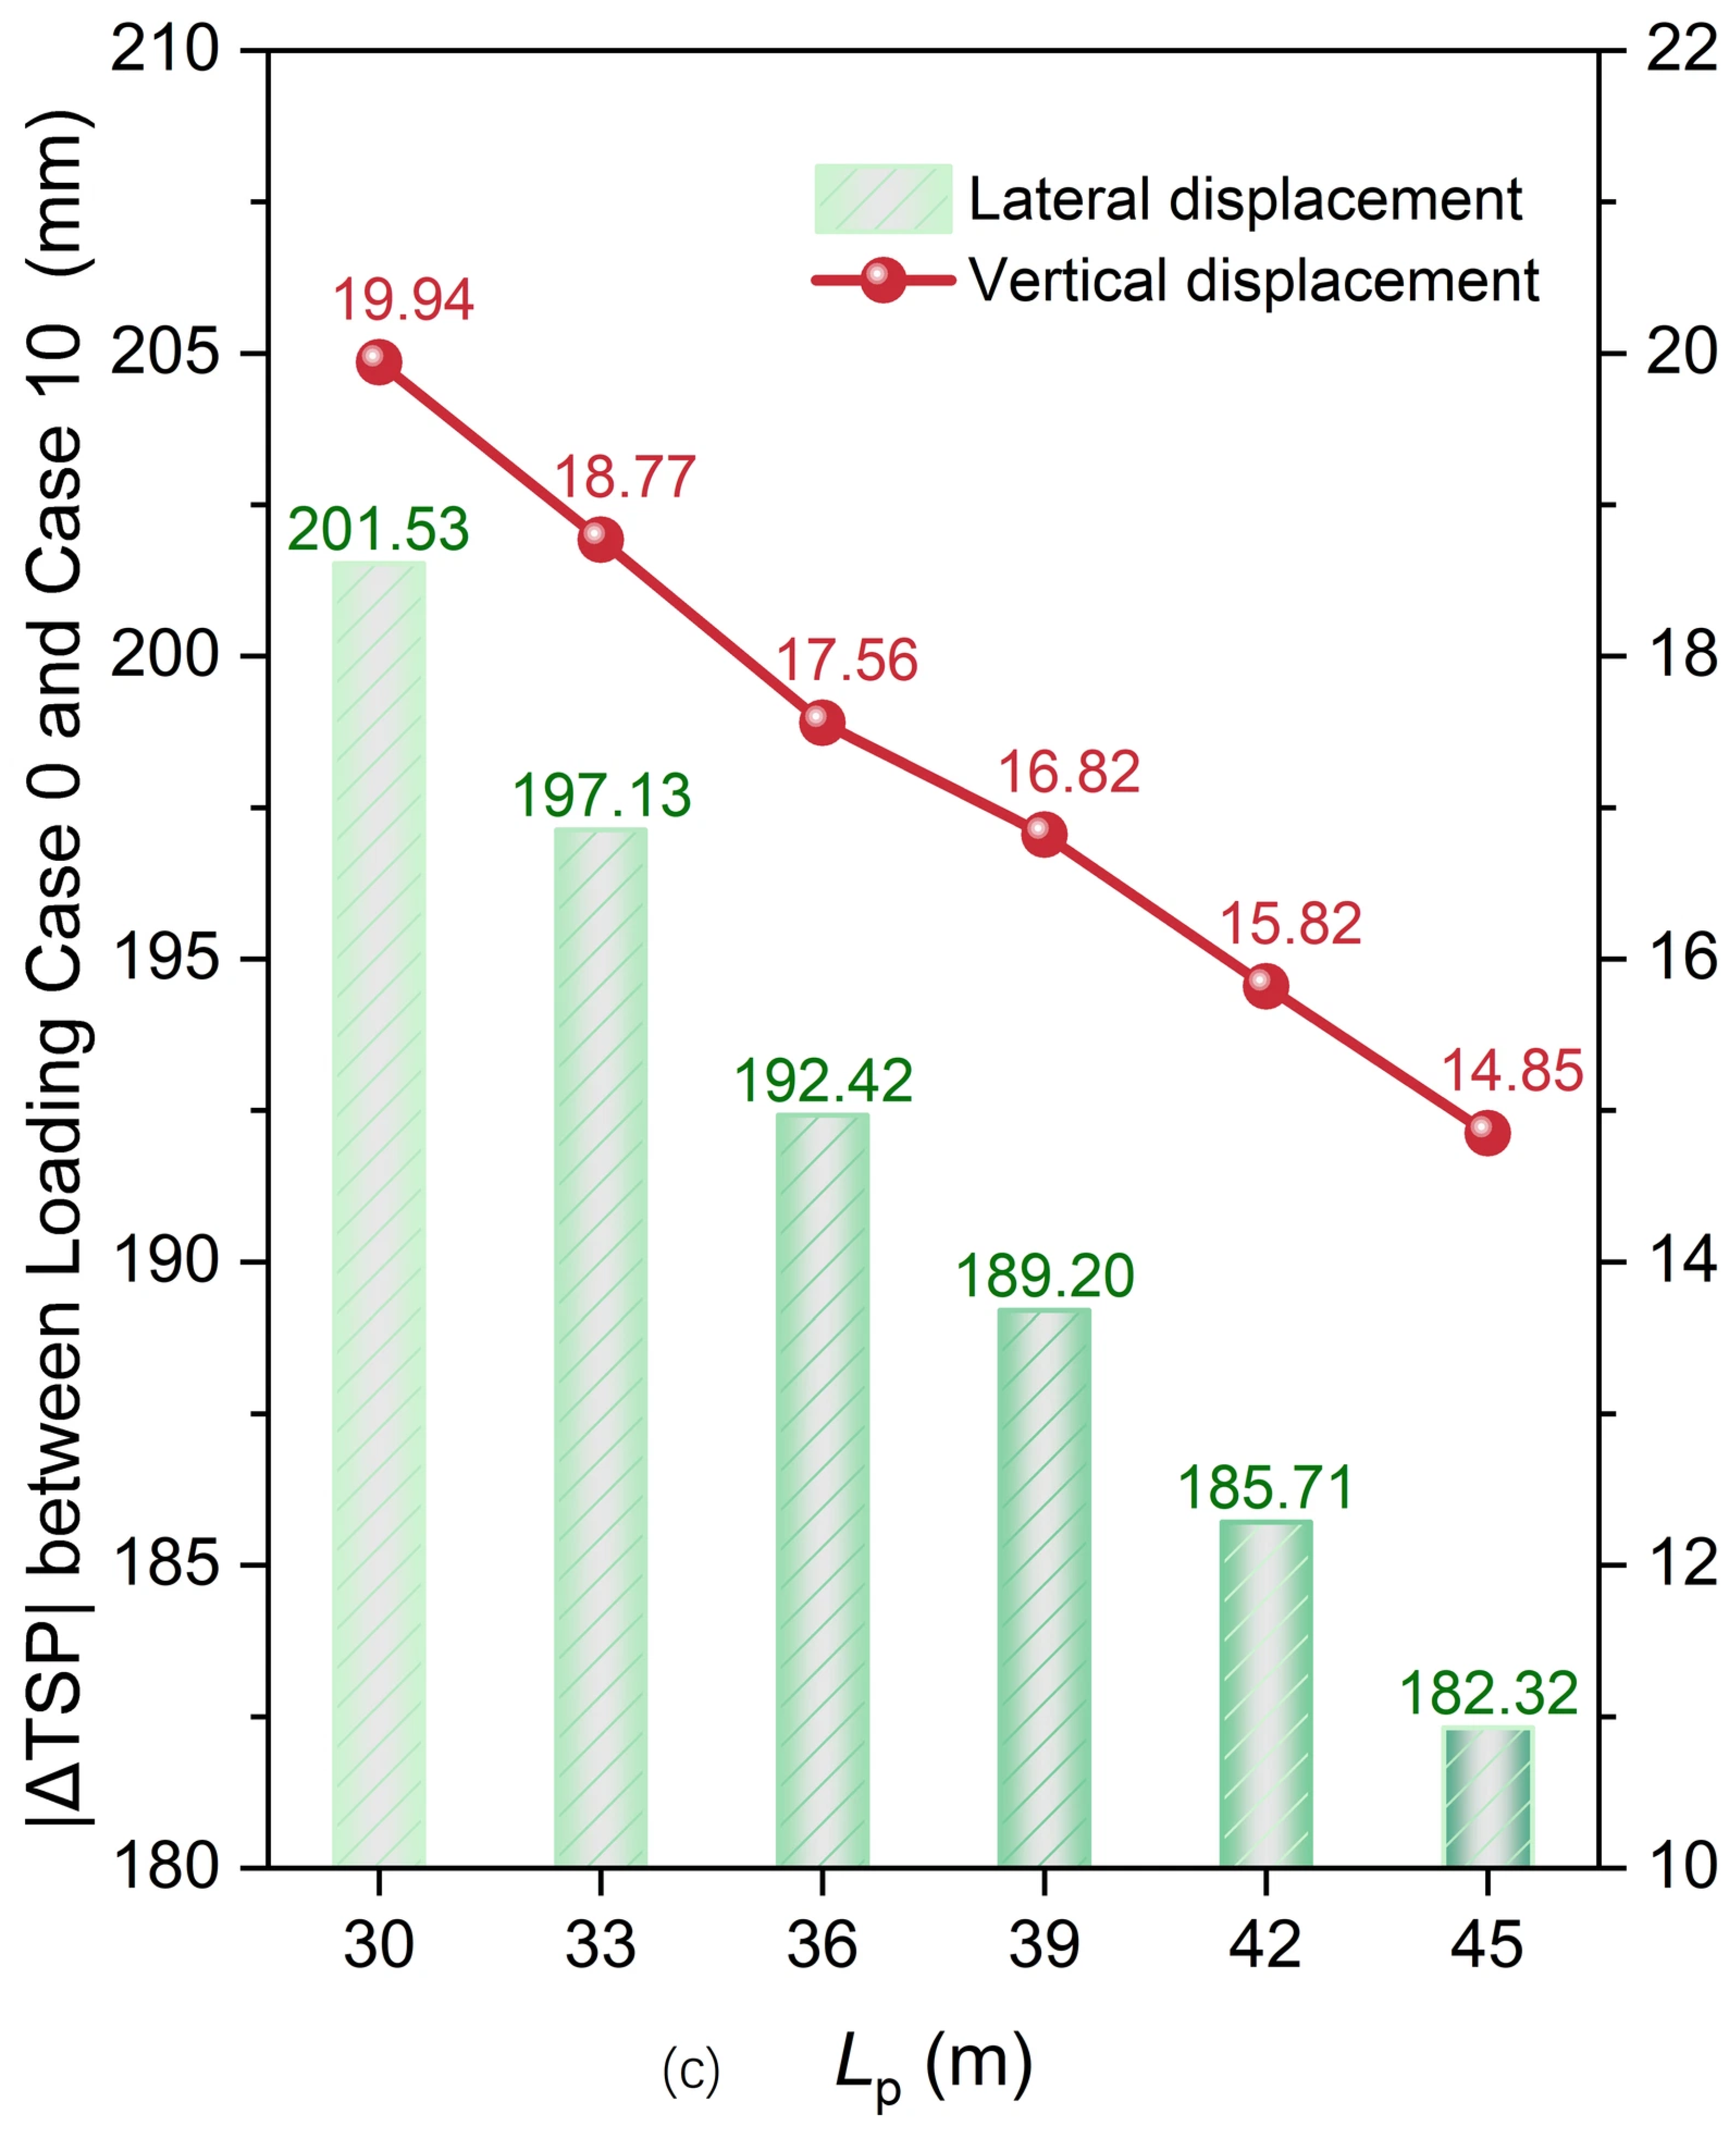
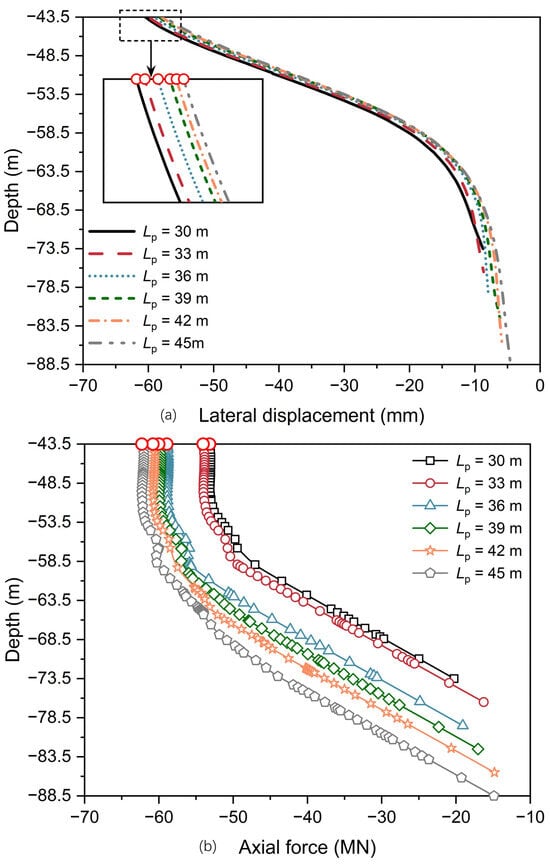
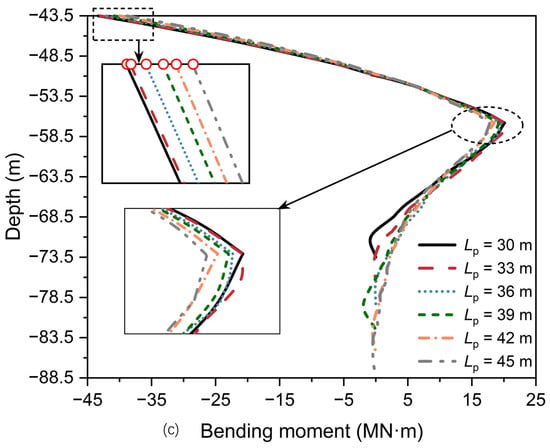
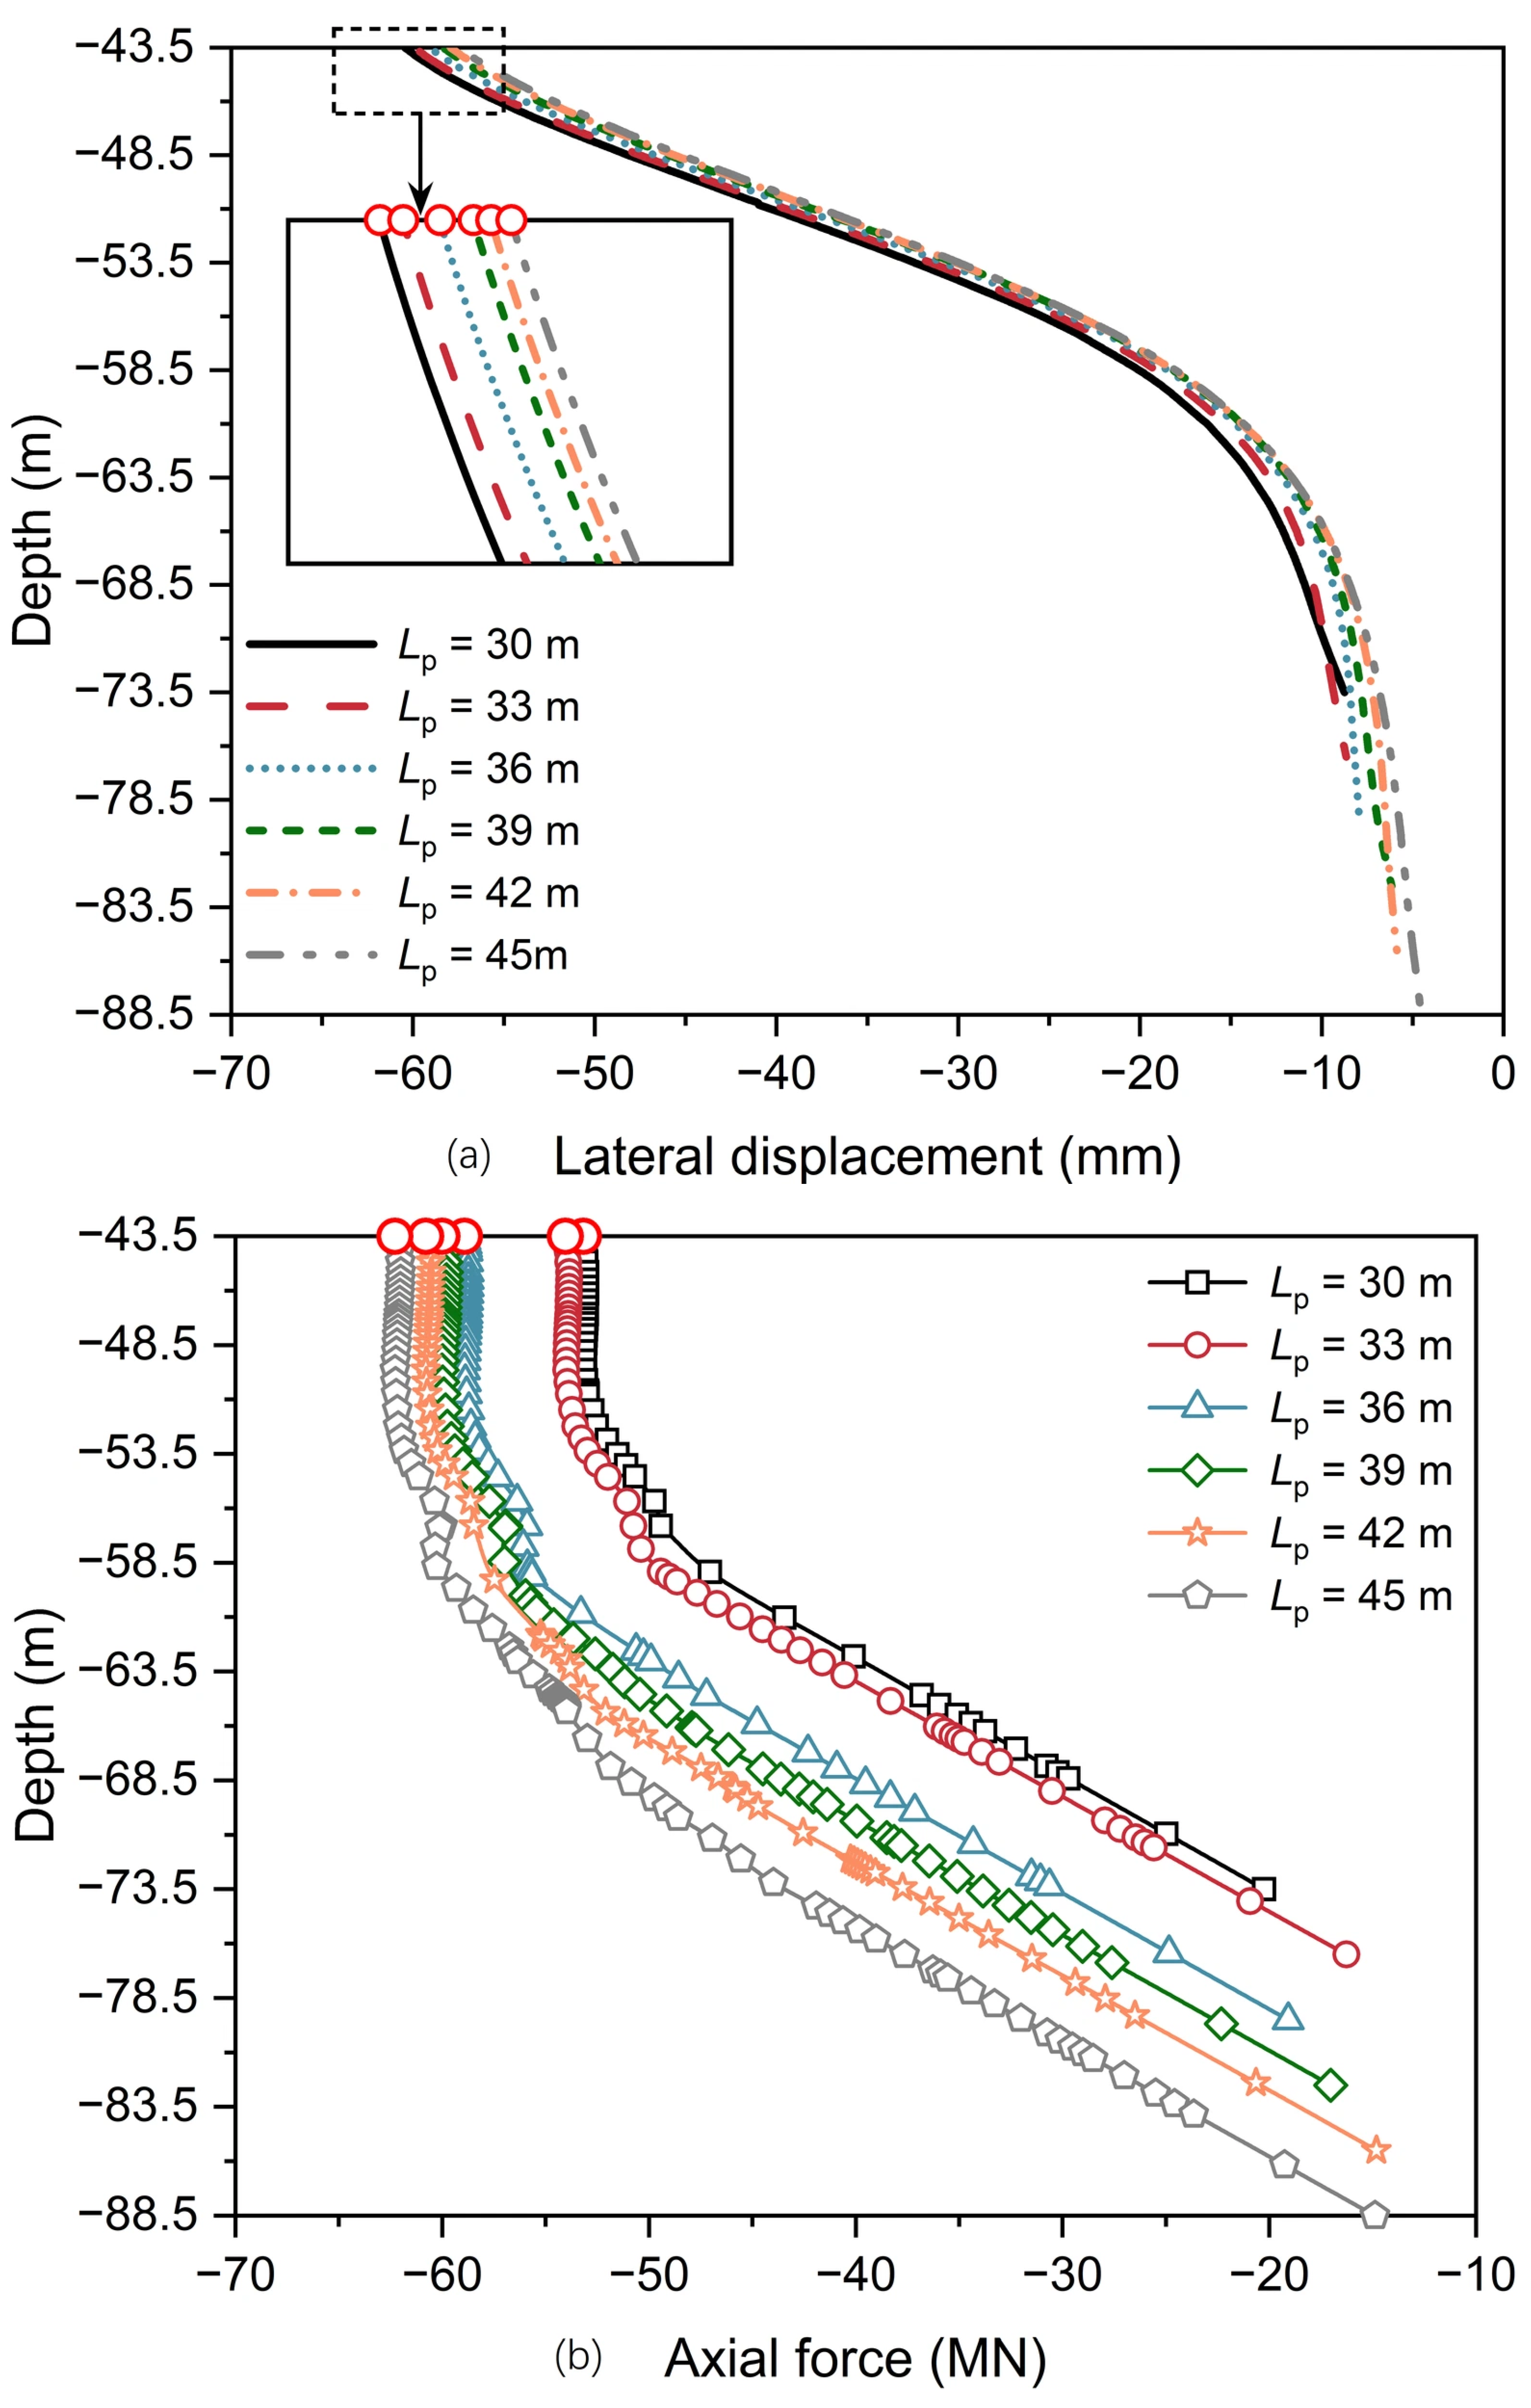
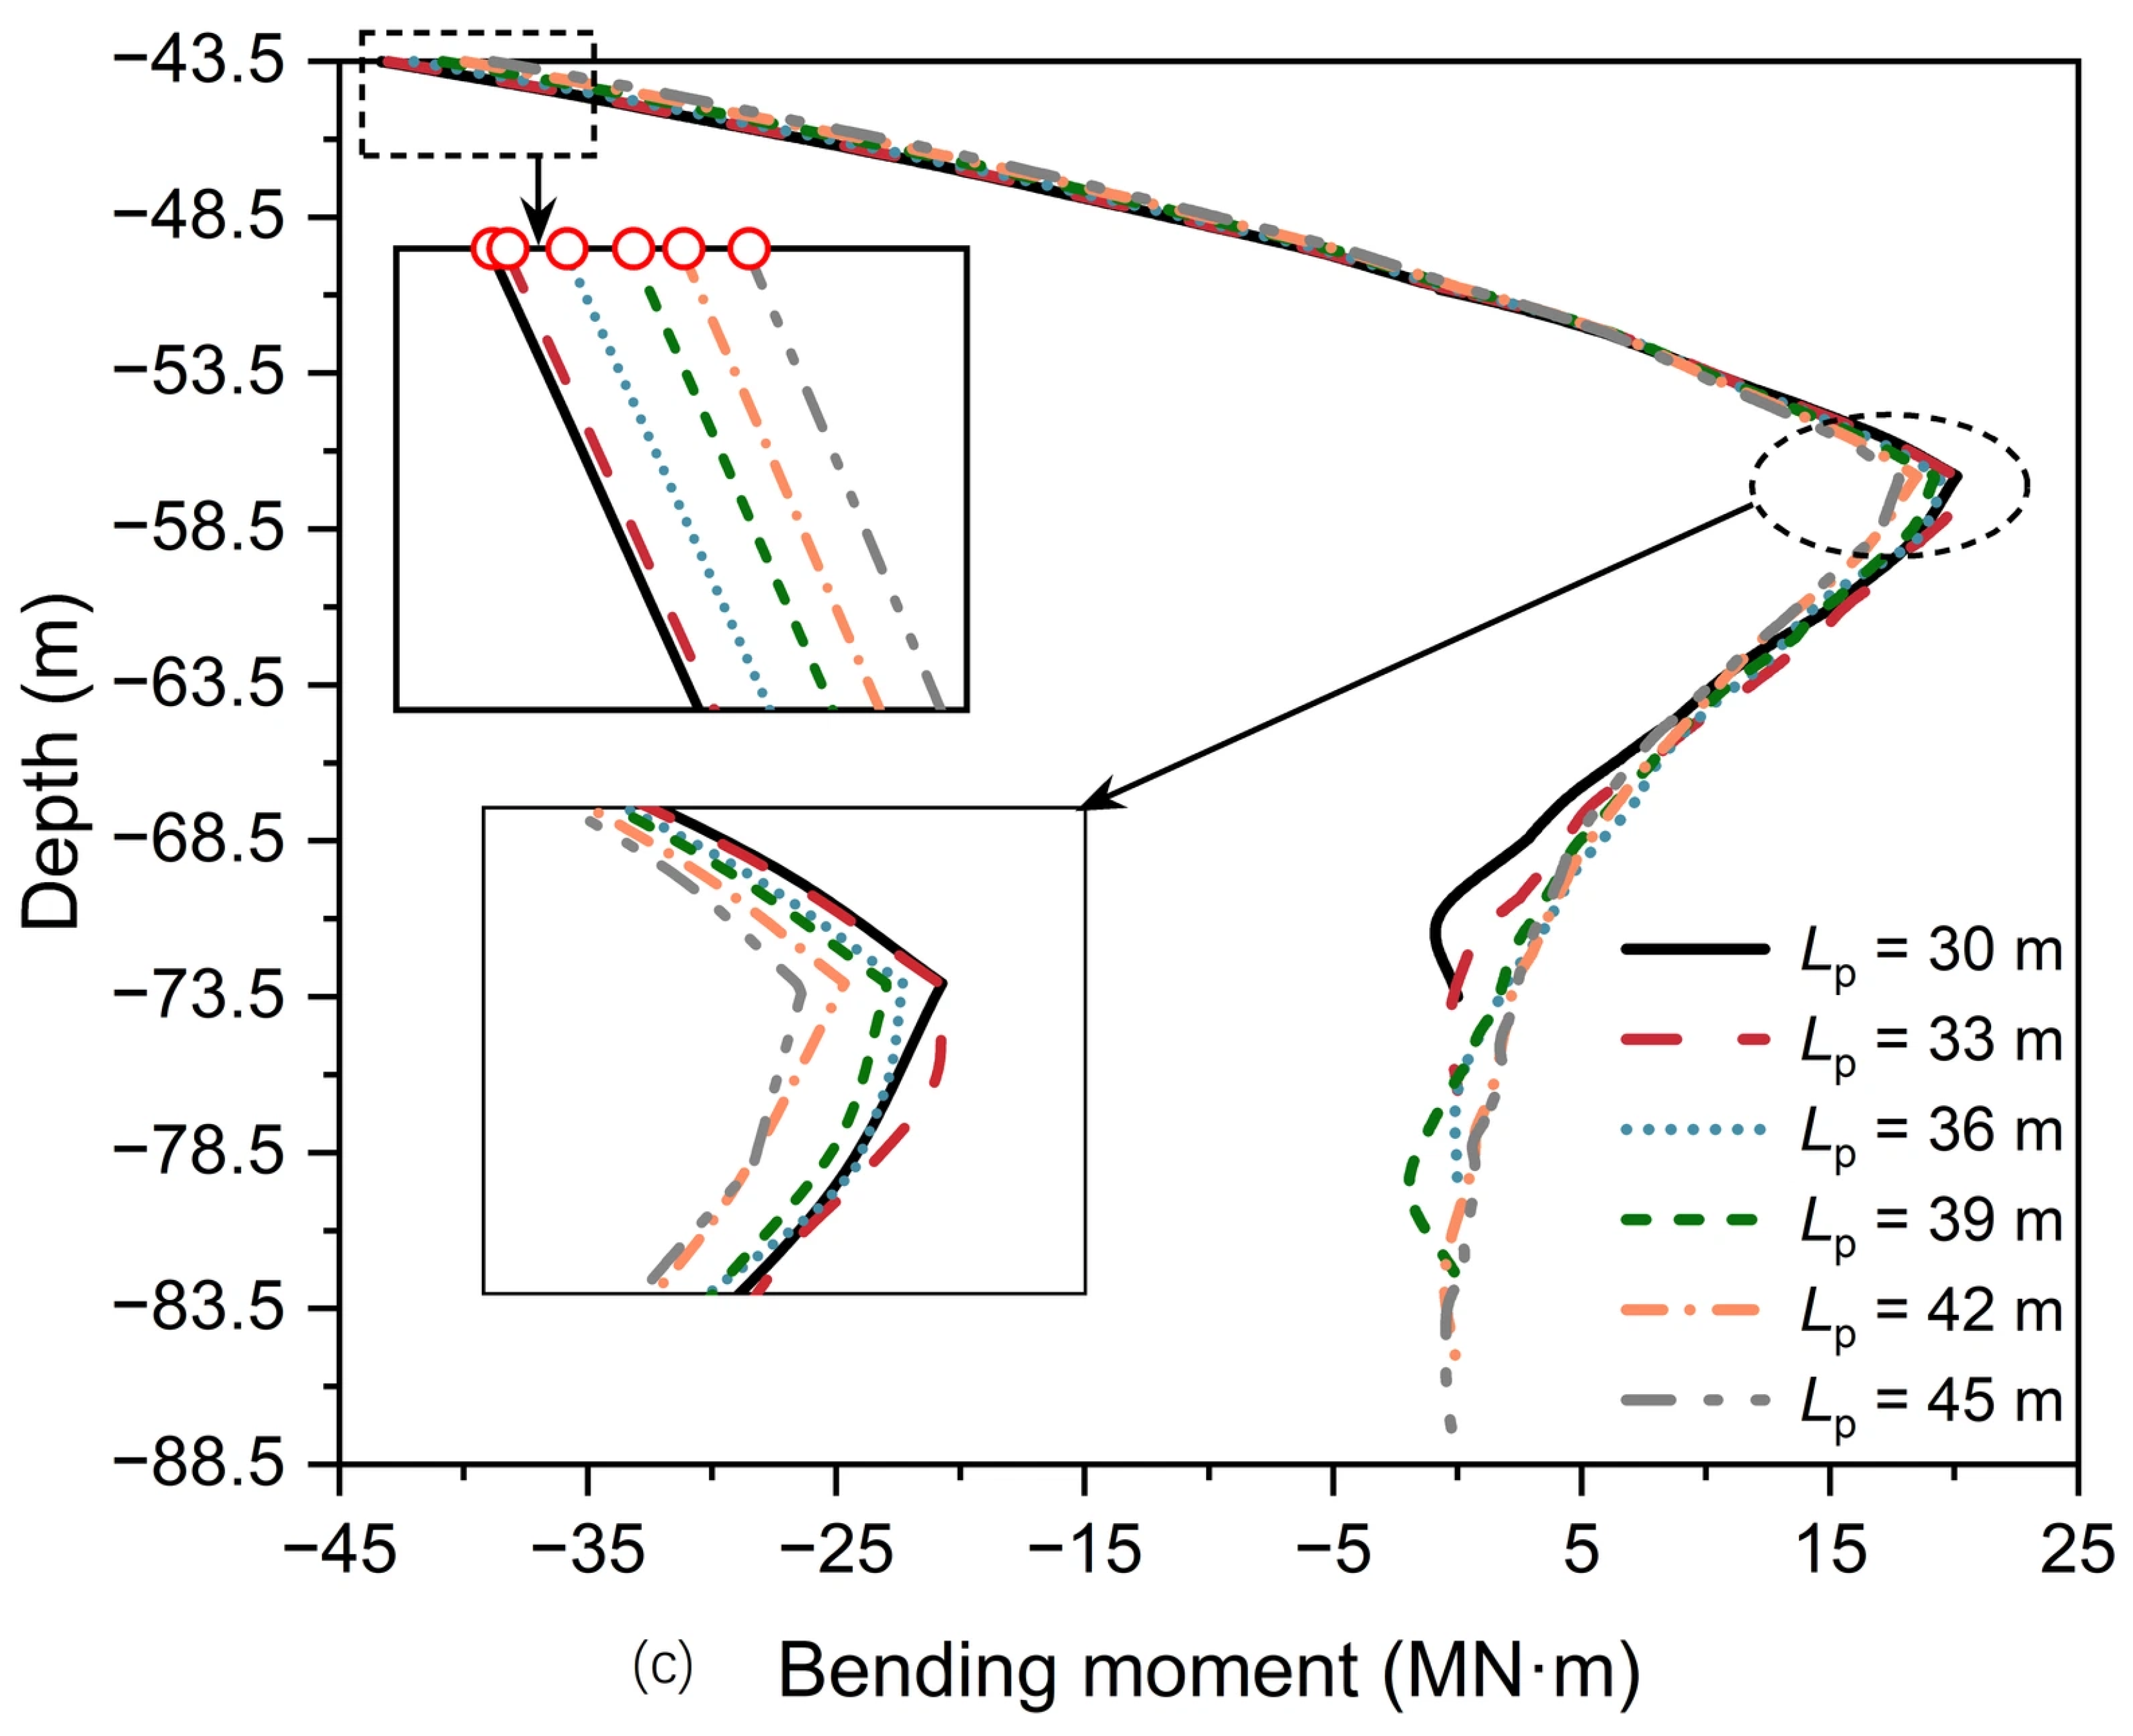
To examine the influence of pile length on the response of the PCA, the considered Lp were 30, 33, 36, 39, 42, and 45 m. Figure 22 depicts the TSP displacements for the PCA with varying pile lengths. When Lp increases from 30 m to 45 m, the corresponding incremental rates of reduction in |ΔTSP| for lateral displacement are 2.18%, 2.39%, 1.67%, 1.84%, and 1.83%, while those for vertical displacement are 5.87%, 6.45%, 4.21%, 5.95%, and 6.13%. These results reveal that increasing pile length is significantly more effective in mitigating vertical displacement than restraining lateral displacement at the TSP.
Figure 22.
Displacements of the TSP for the PCA with varying pile lengths: (a) lateral displacement; (b) vertical displacement; and (c) |ΔTSP| from Loading Case 0 to Case 10.
Figure 23 illustrates the mechanical response along pile P11 for the PCA with varying pile lengths (Loading Case 10). When Lp increases from 30 m to 45 m, the maximum lateral displacement at the pile head drops from 60.43 mm to 57.46 mm (a total decrease of 4.91%) (Figure 23a). Conversely, the maximum axial force along the pile increases from 53.18 MN to 62.29 MN (a total increase of 17.13%) (Figure 23b). However, the maximum bending moment decreases from 43.32 MN·m to 38.82 MN·m (a total decrease of 10.39%) (Figure 23c). This phenomenon suggests that, under the combined V-H-M loading on the pile heads, increasing the pile length mobilizes additional shaft resistance from deeper soil strata. This mobilization alters the internal force distribution of the piles, leading to an increase in the axial force while reducing the bending moment along the pile shaft. Consequently, the lateral displacement of the piles is restrained, thereby improving the stability of the PCA.
Figure 23.
Mechanical responses along pile P11 for the PCA with varying pile lengths (Loading Case 10): (a) lateral displacement; (b) axial force; and (c) bending moment.
4.4. Influence of Pile Wall Thickness
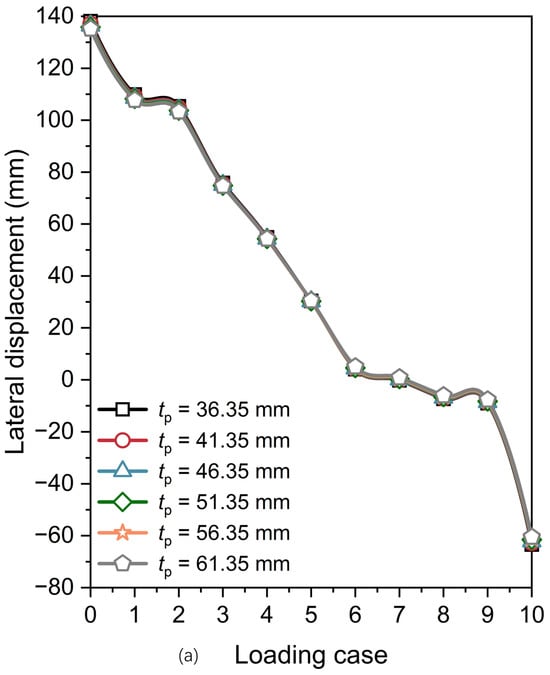
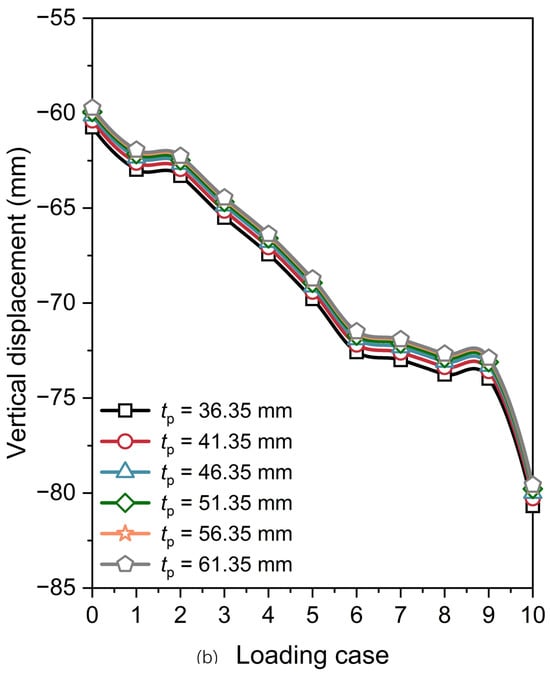
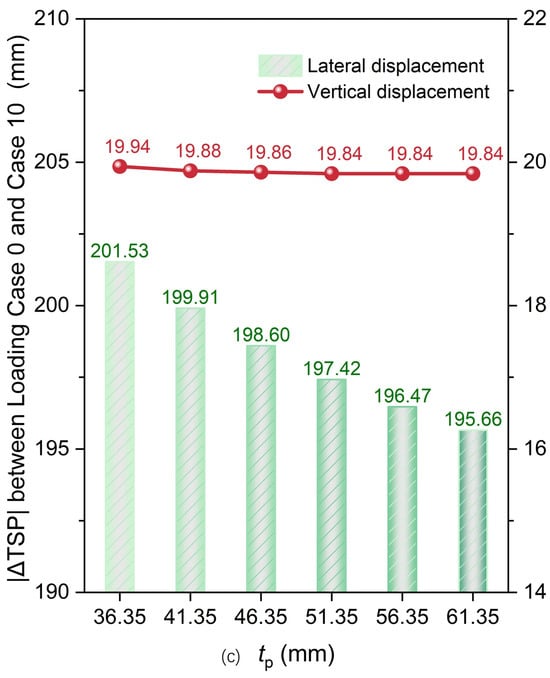
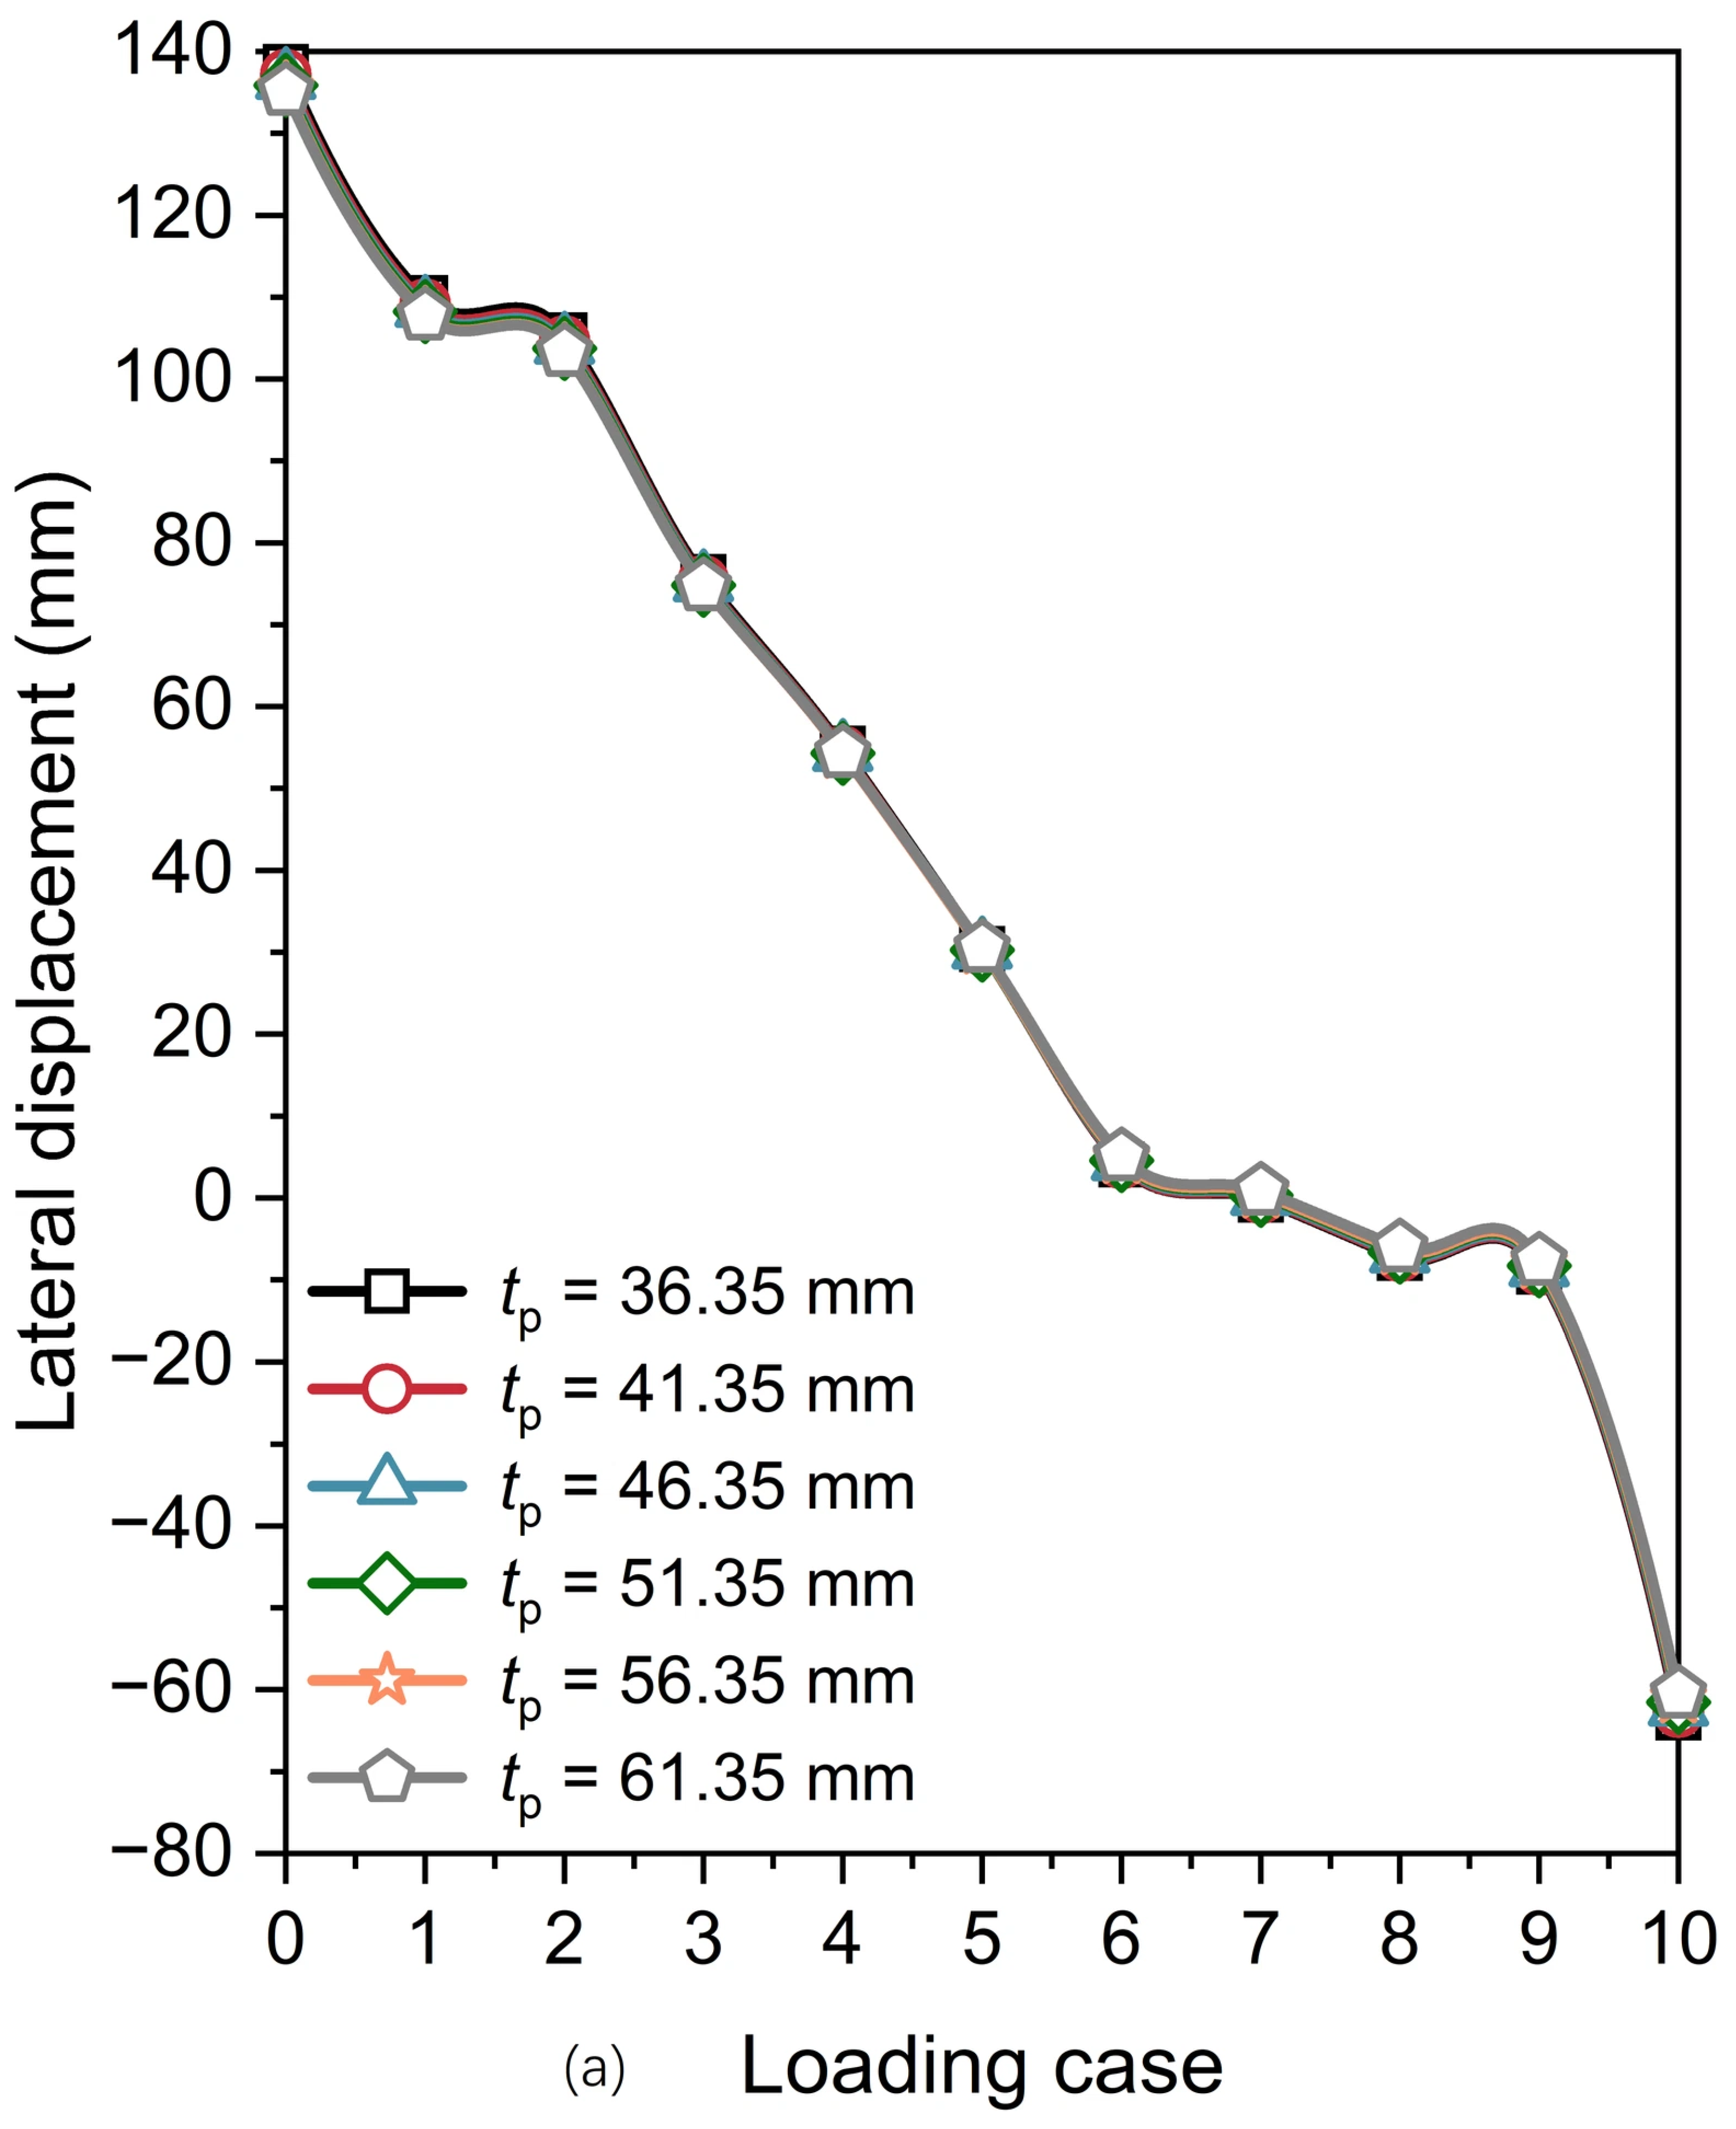
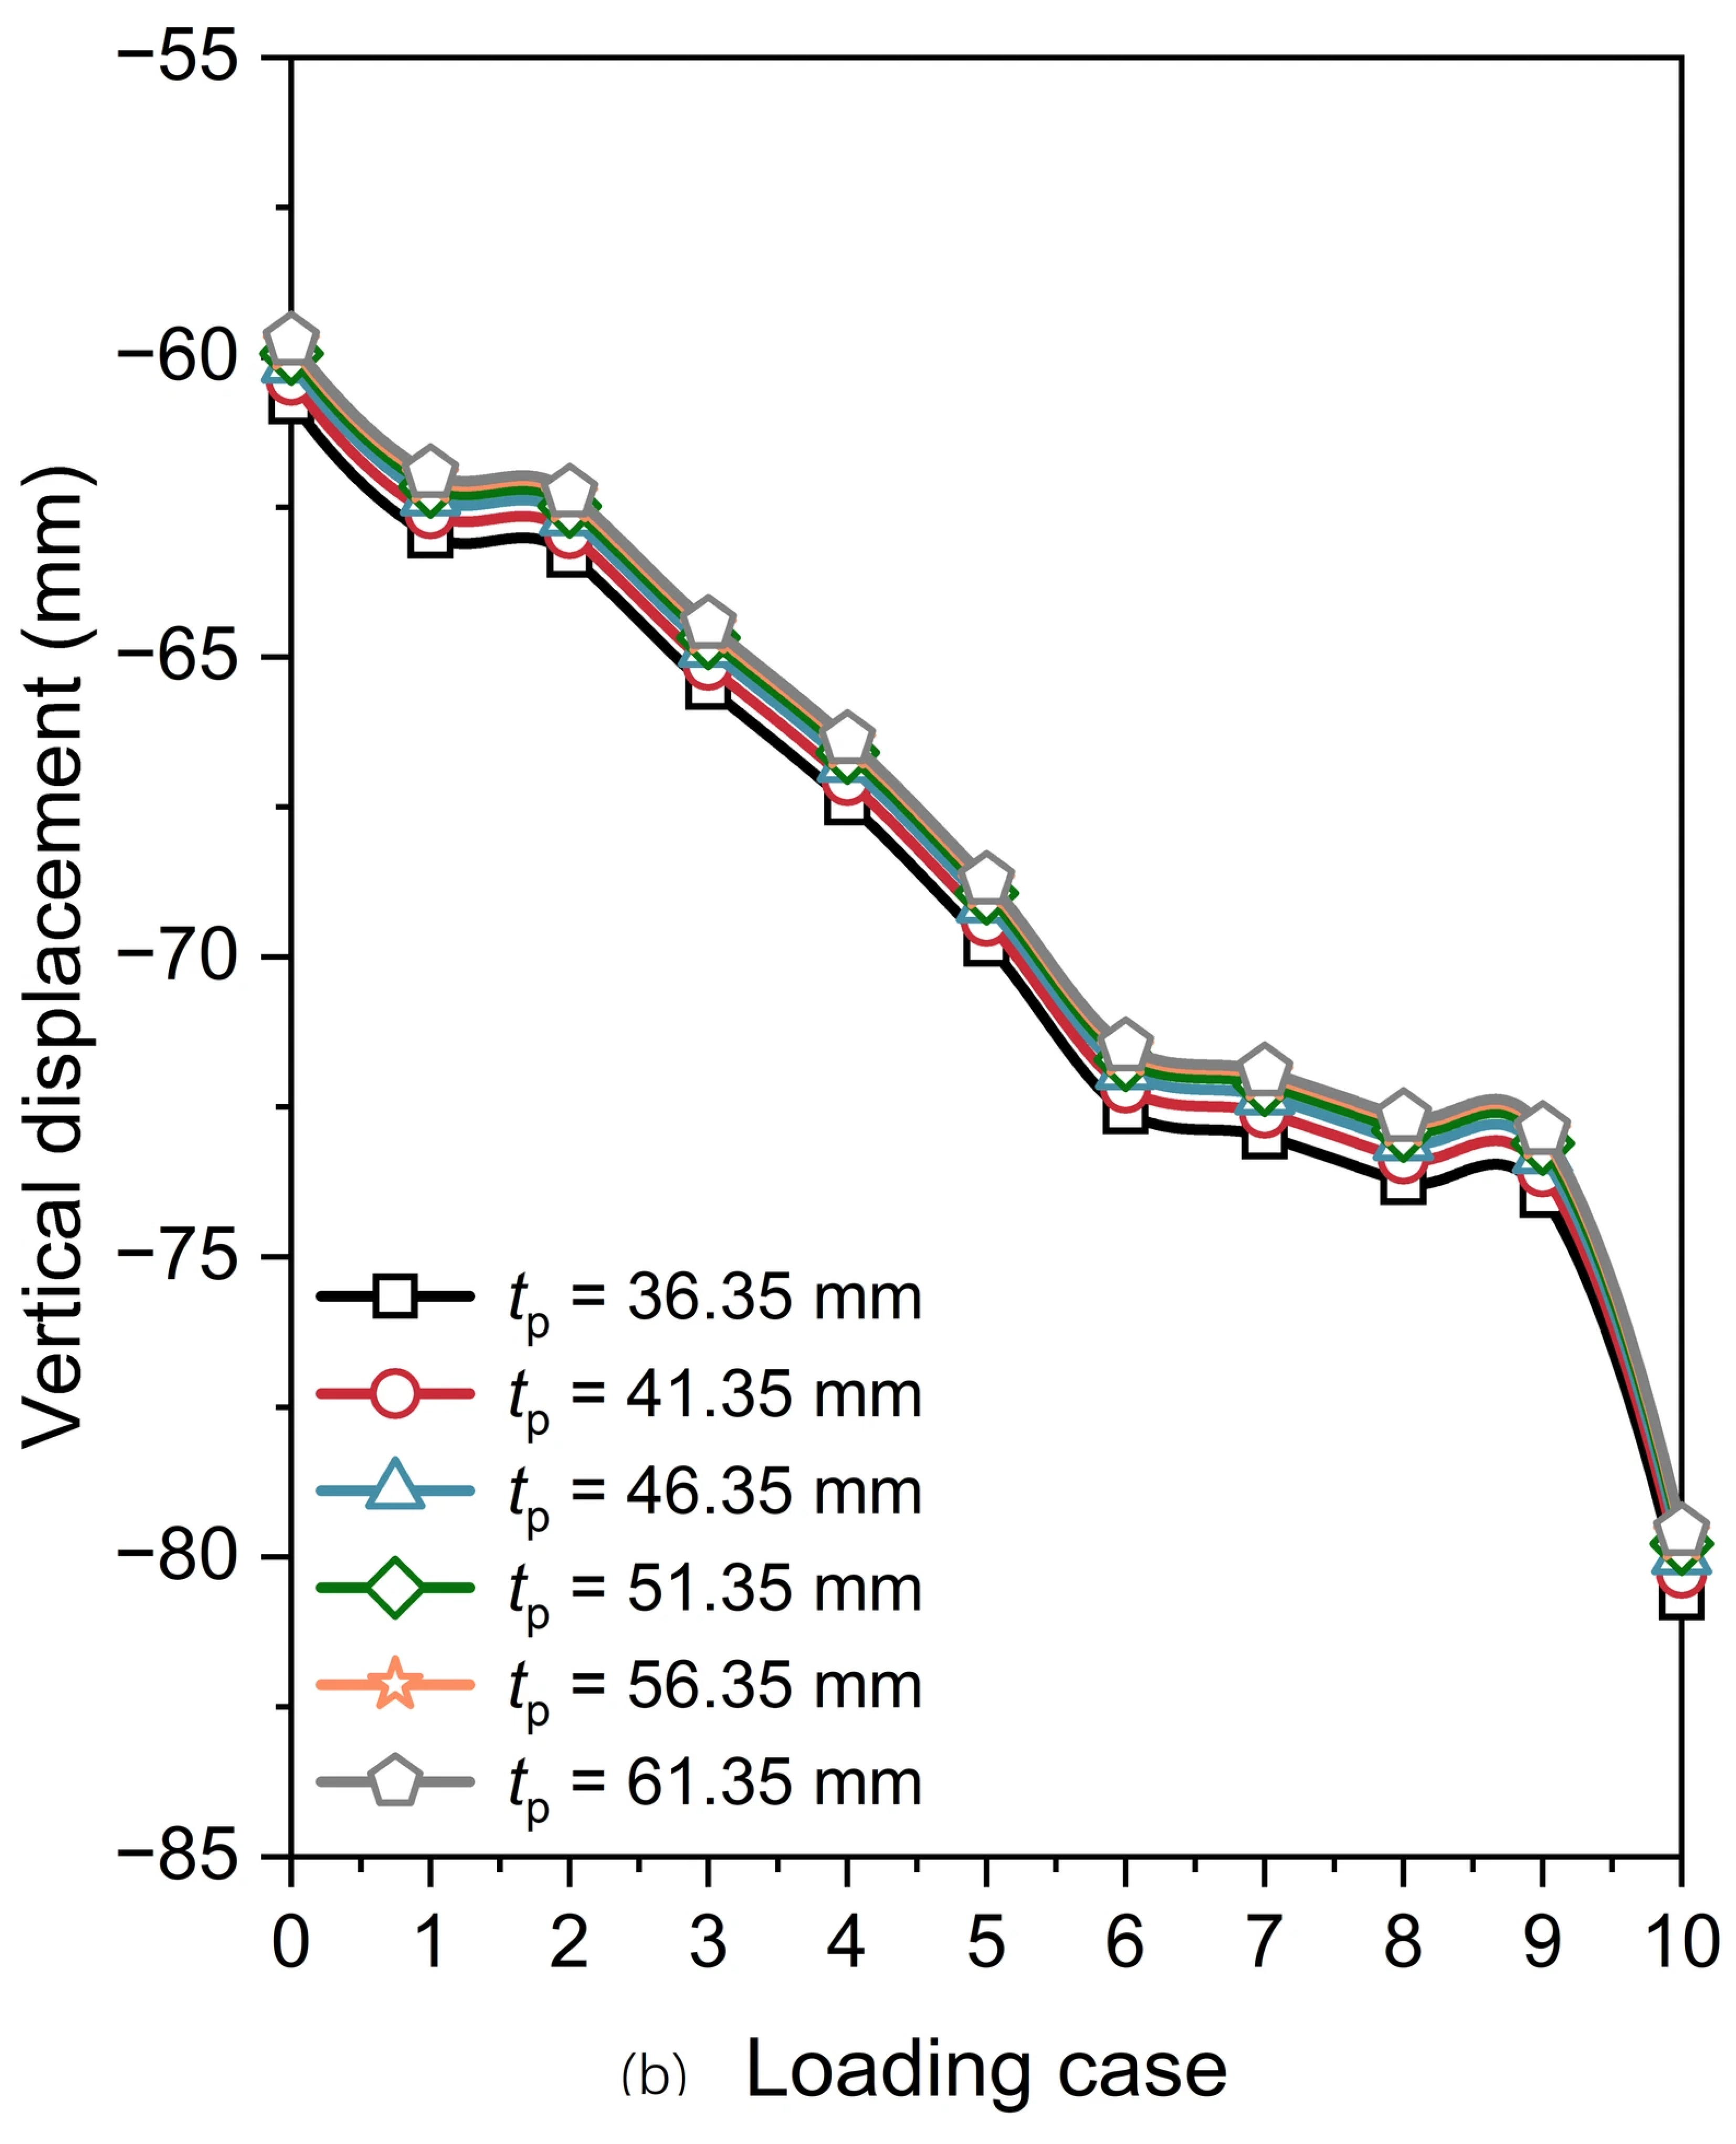
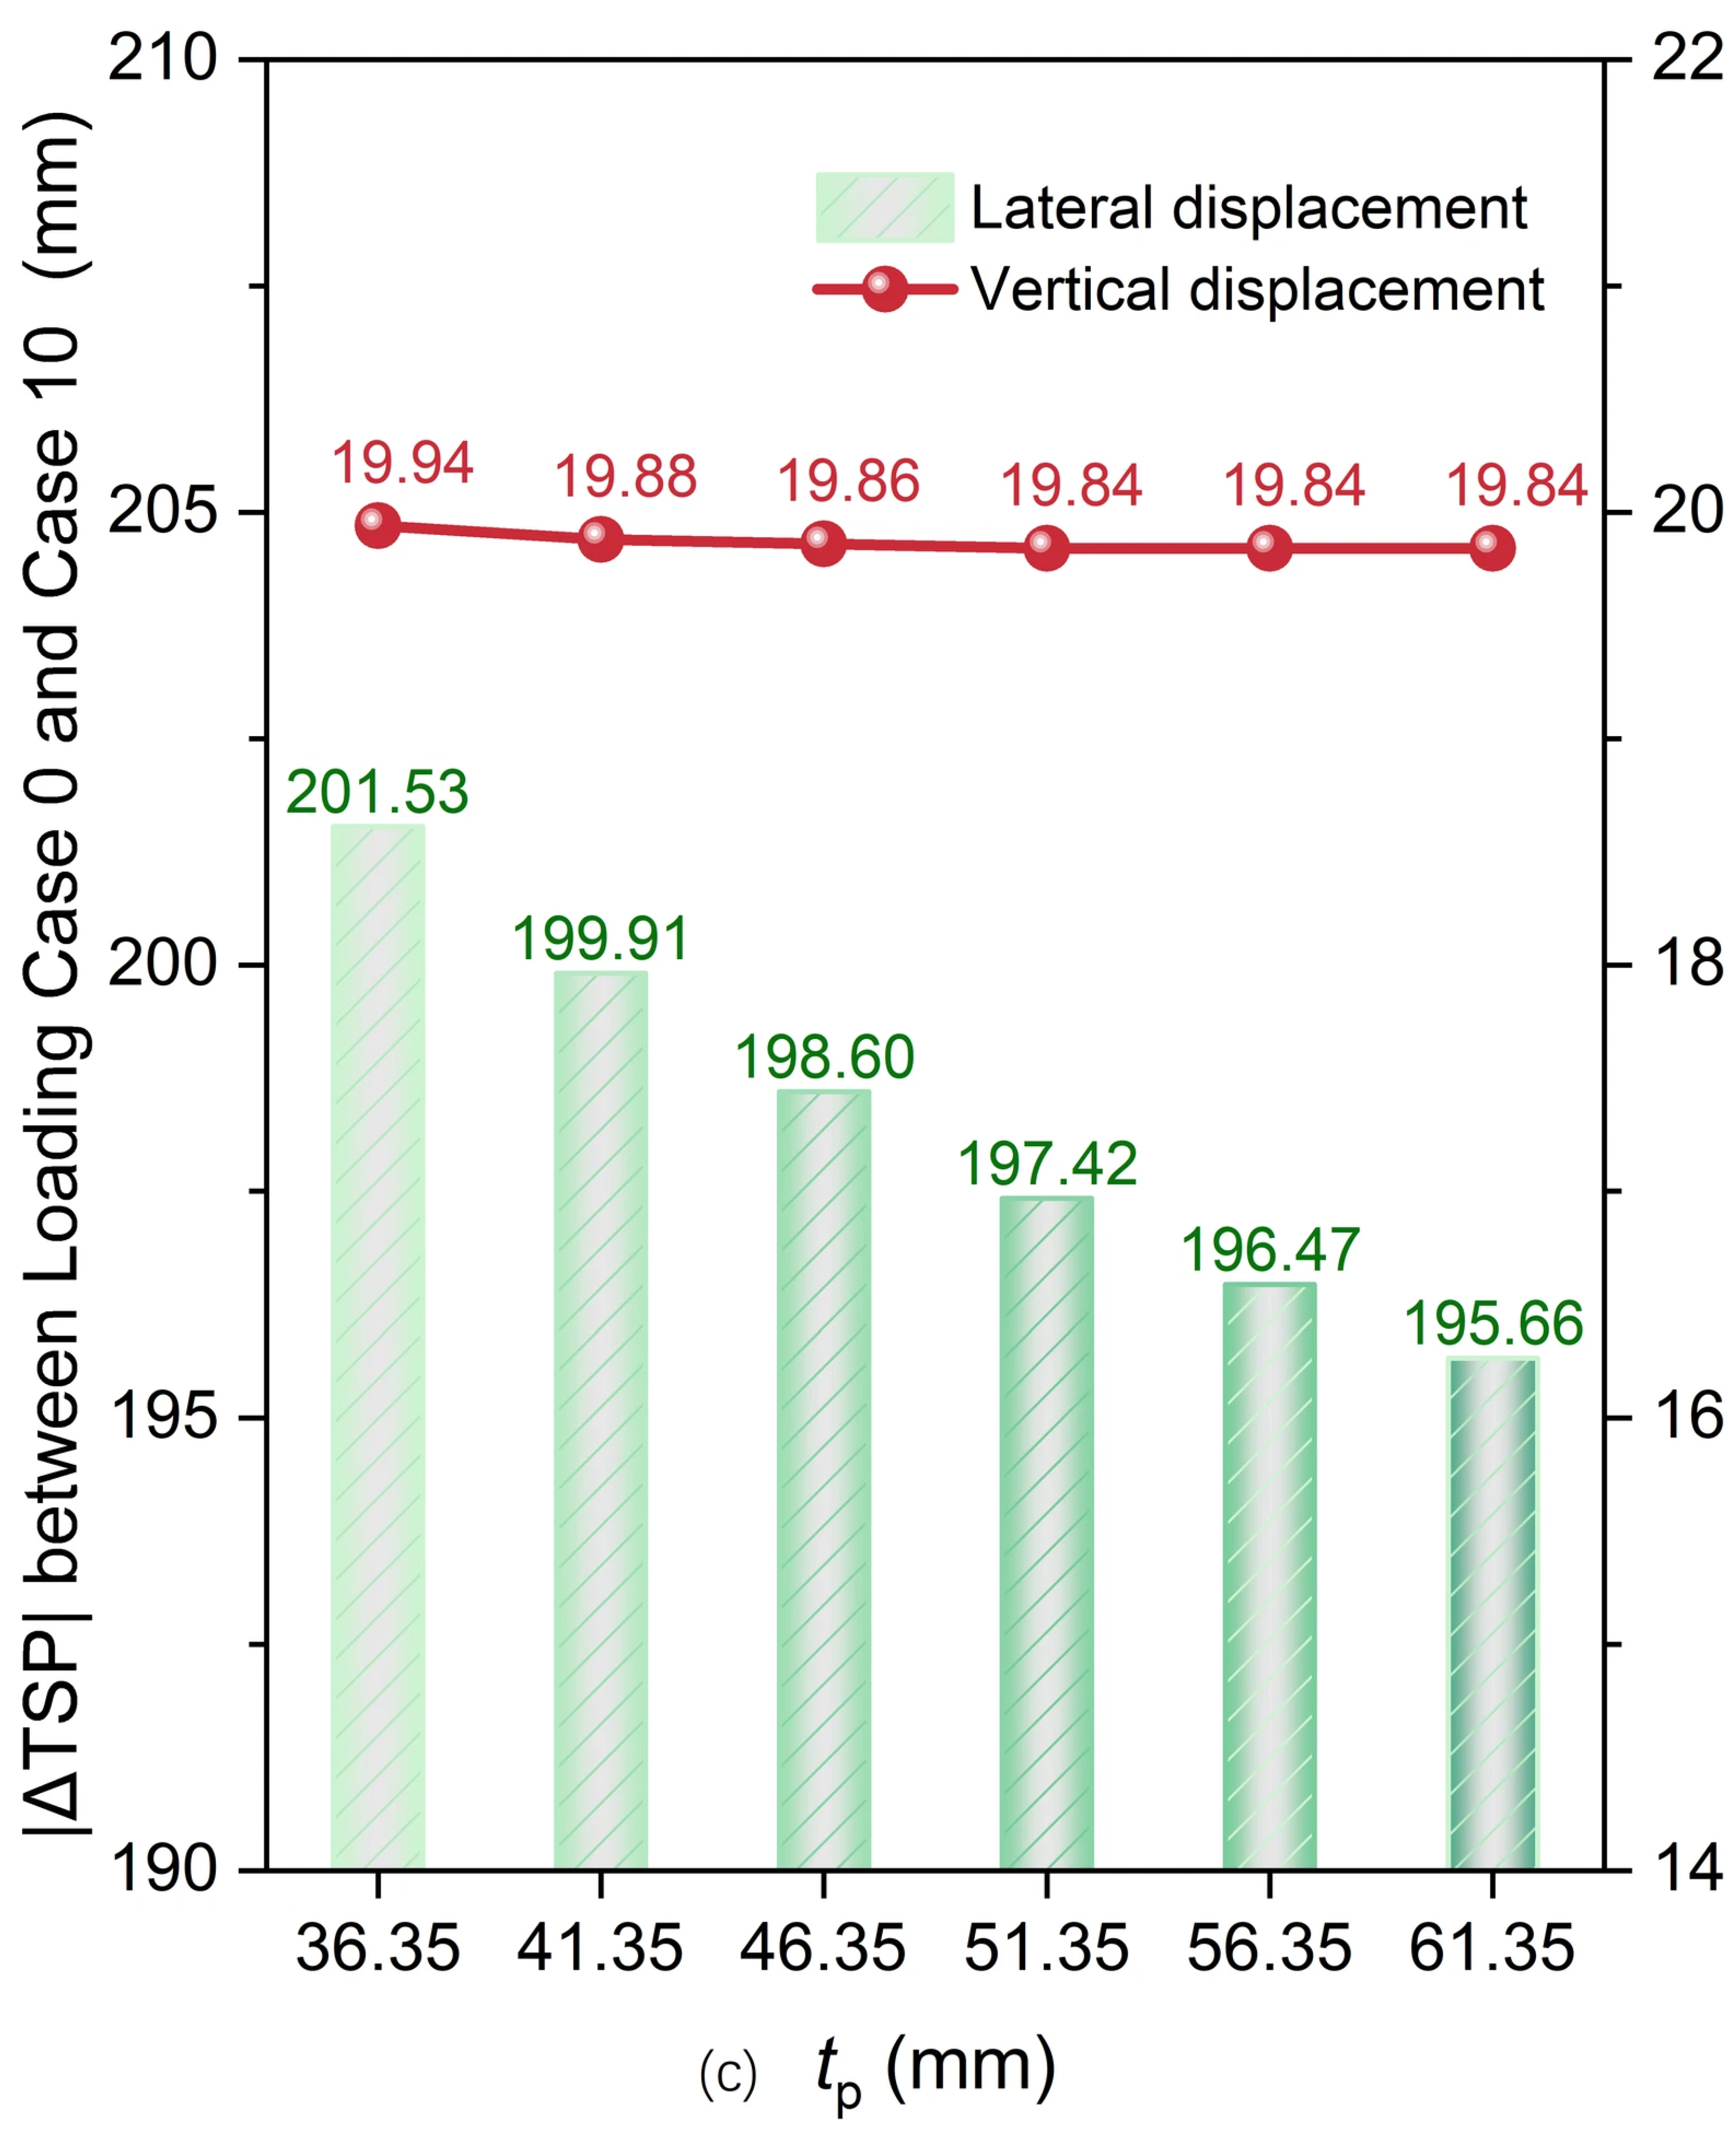
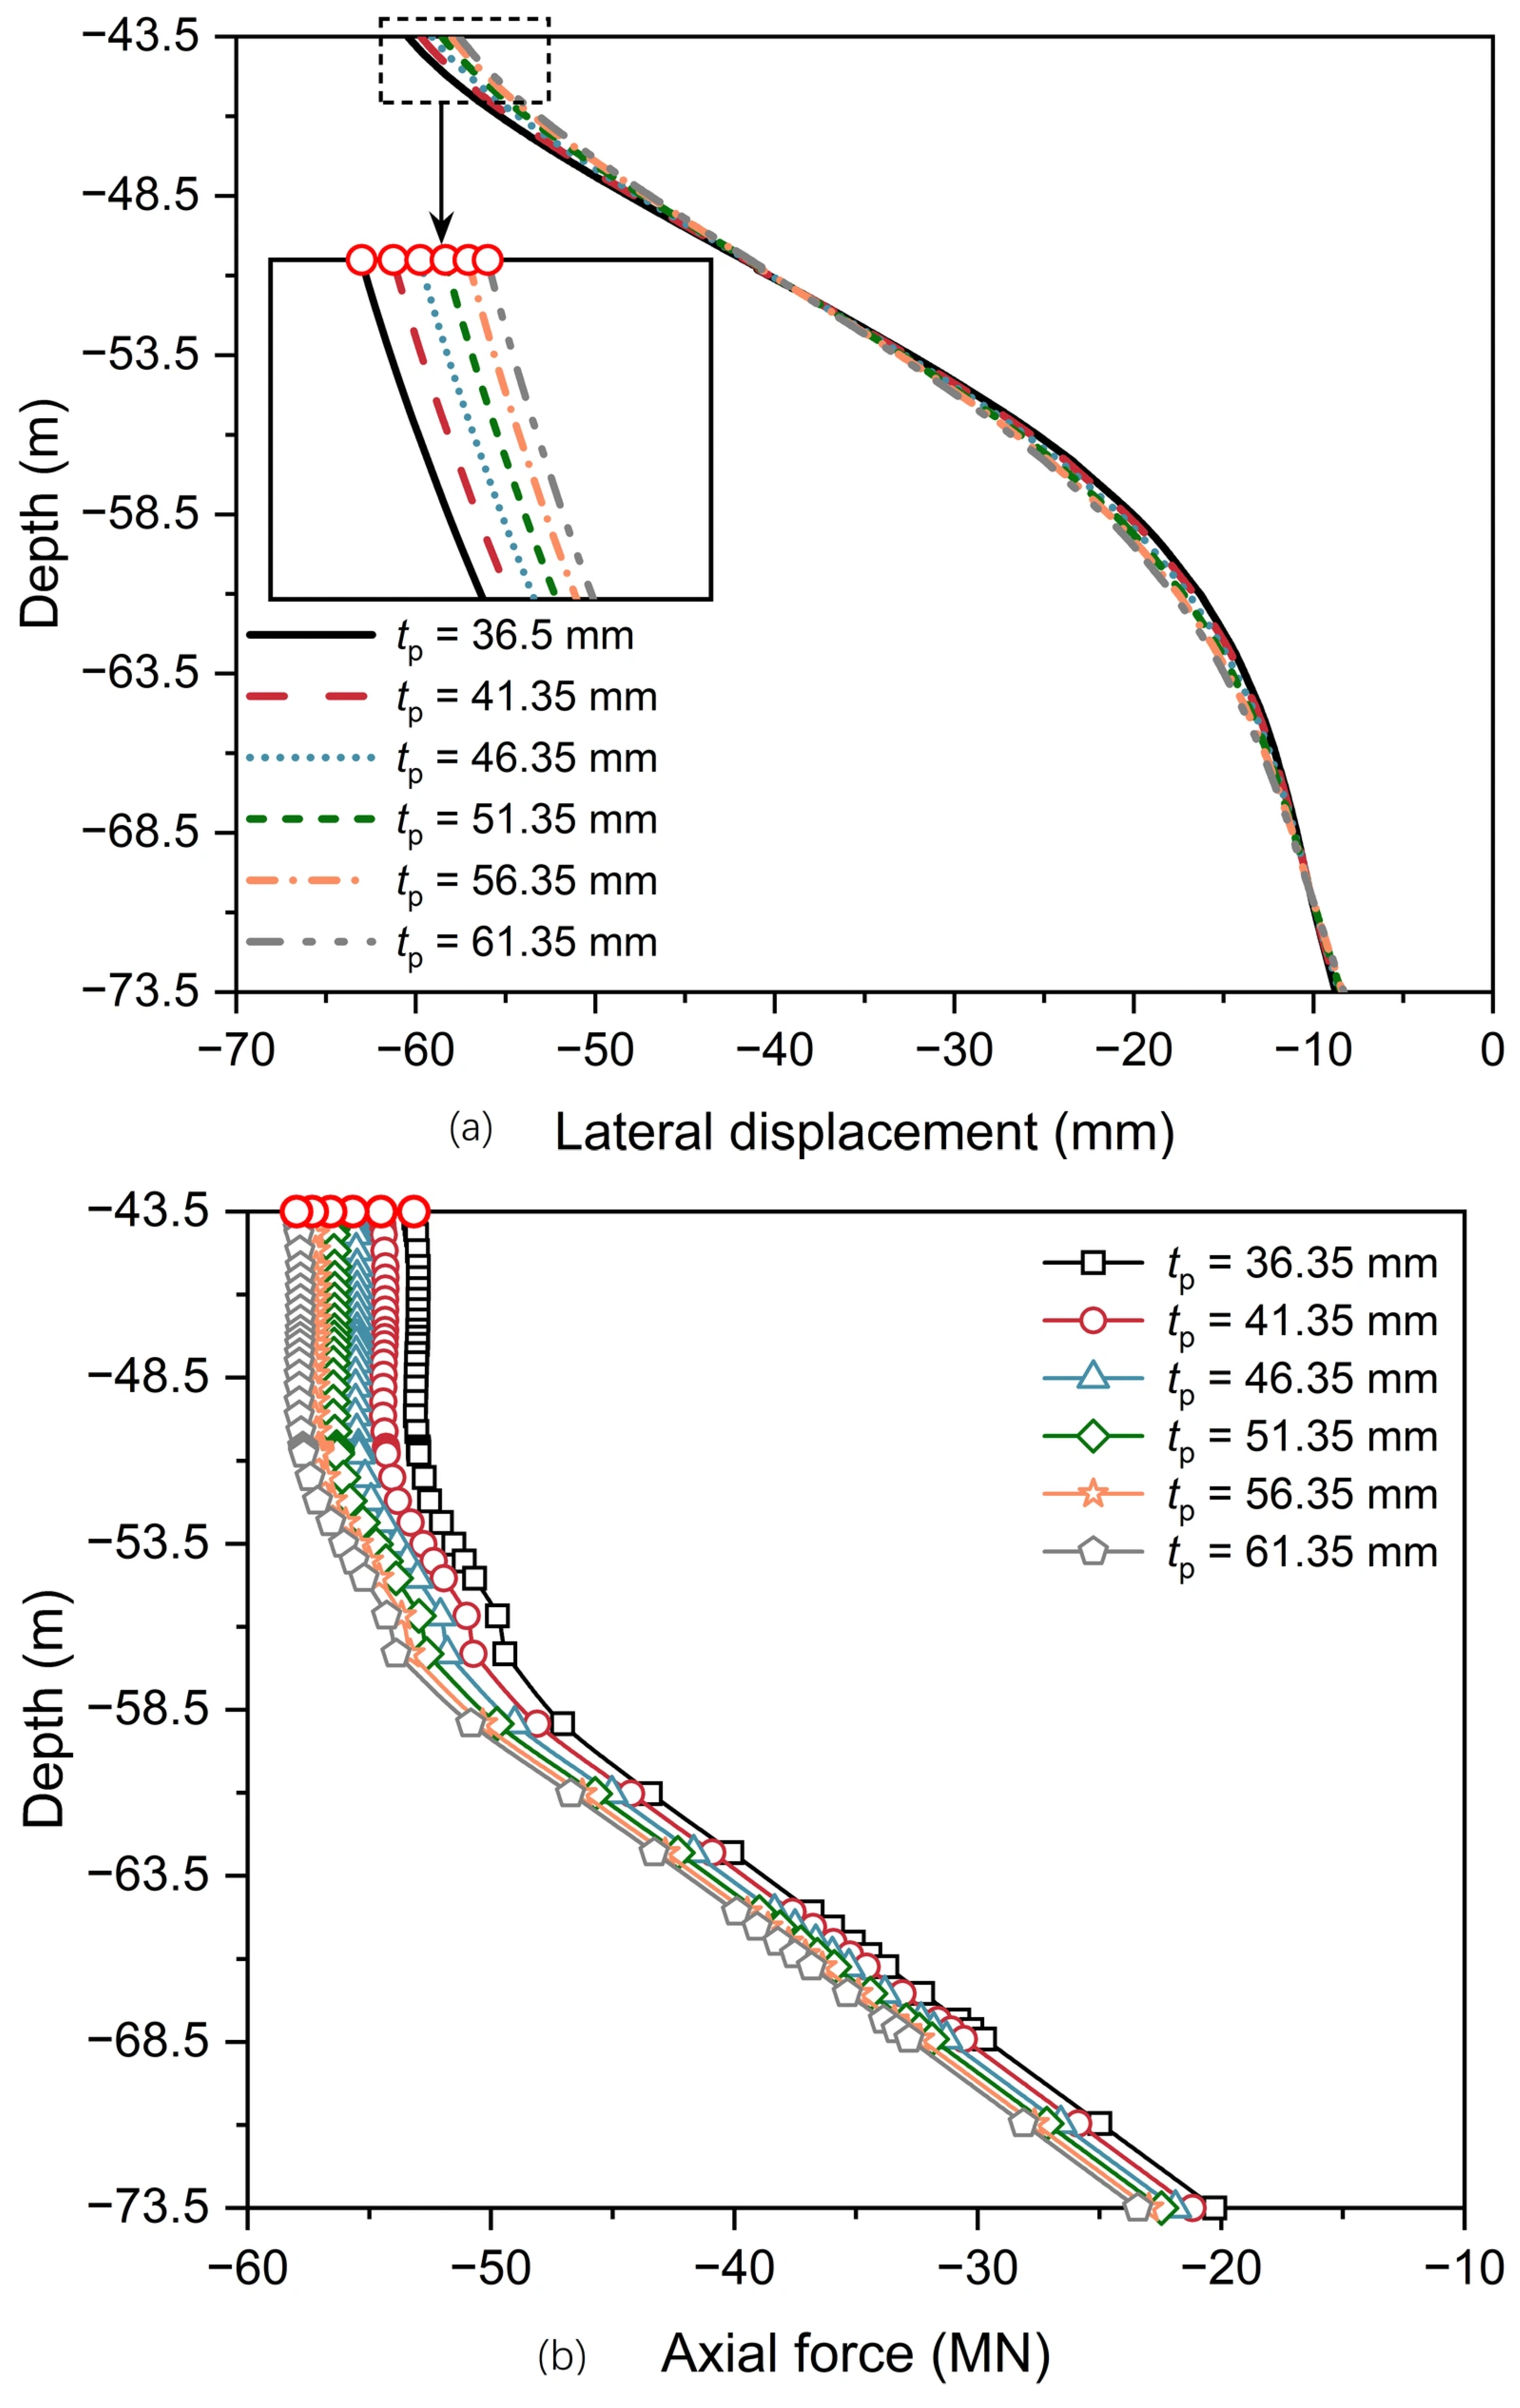
To investigate the effect of pile wall thickness on the responses of the PCA, cases with tp = 36.35, 41.35, 46.35, 51.35, 56.35, and 61.35 mm were considered. Figure 24 shows the TSP displacements for the PCA with varying pile thicknesses. With tp increasing from 36.35 mm to 61.35 mm, the corresponding incremental rates of reduction in |ΔTSP| for lateral displacement are 0.80%, 0.65%, 0.59%, 0.48%, and 0.41%, while those for vertical displacement are 0.30%, 0.10%, 0.10%, 0%, and 0%. This indicates that the pile wall thickness has a negligible influence on the displacement of the PCA.
Figure 24.
Displacements of the TSP for the PCA with varying pile thicknesses: (a) lateral displacement; (b) vertical displacement; and (c) |ΔTSP| from Loading Case 0 to Case 10.
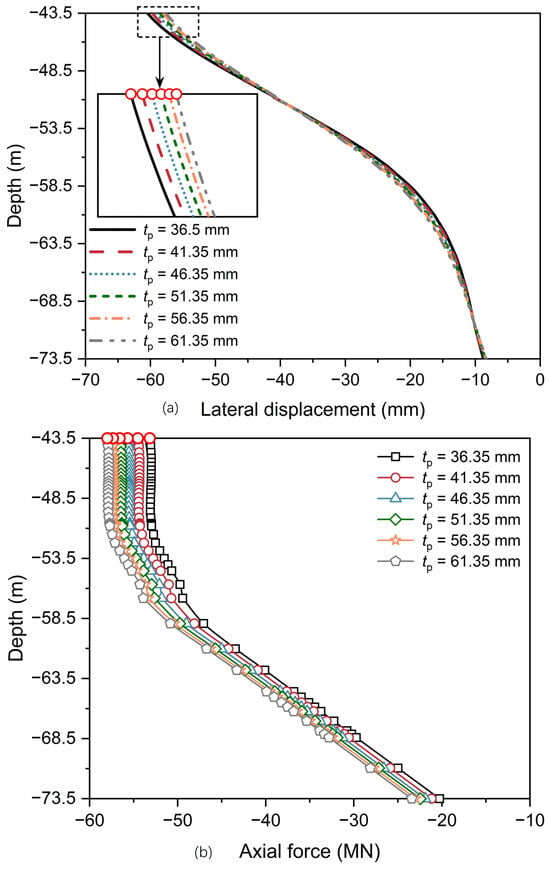
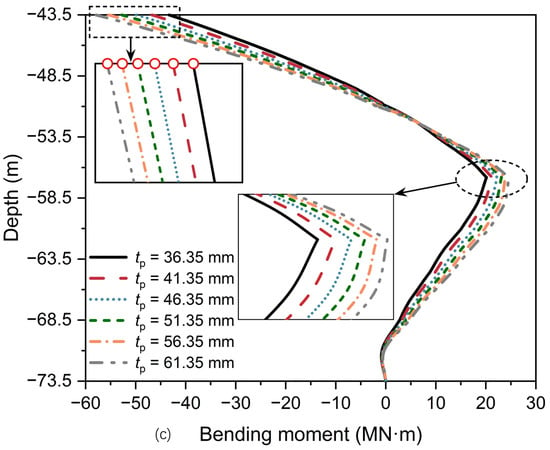
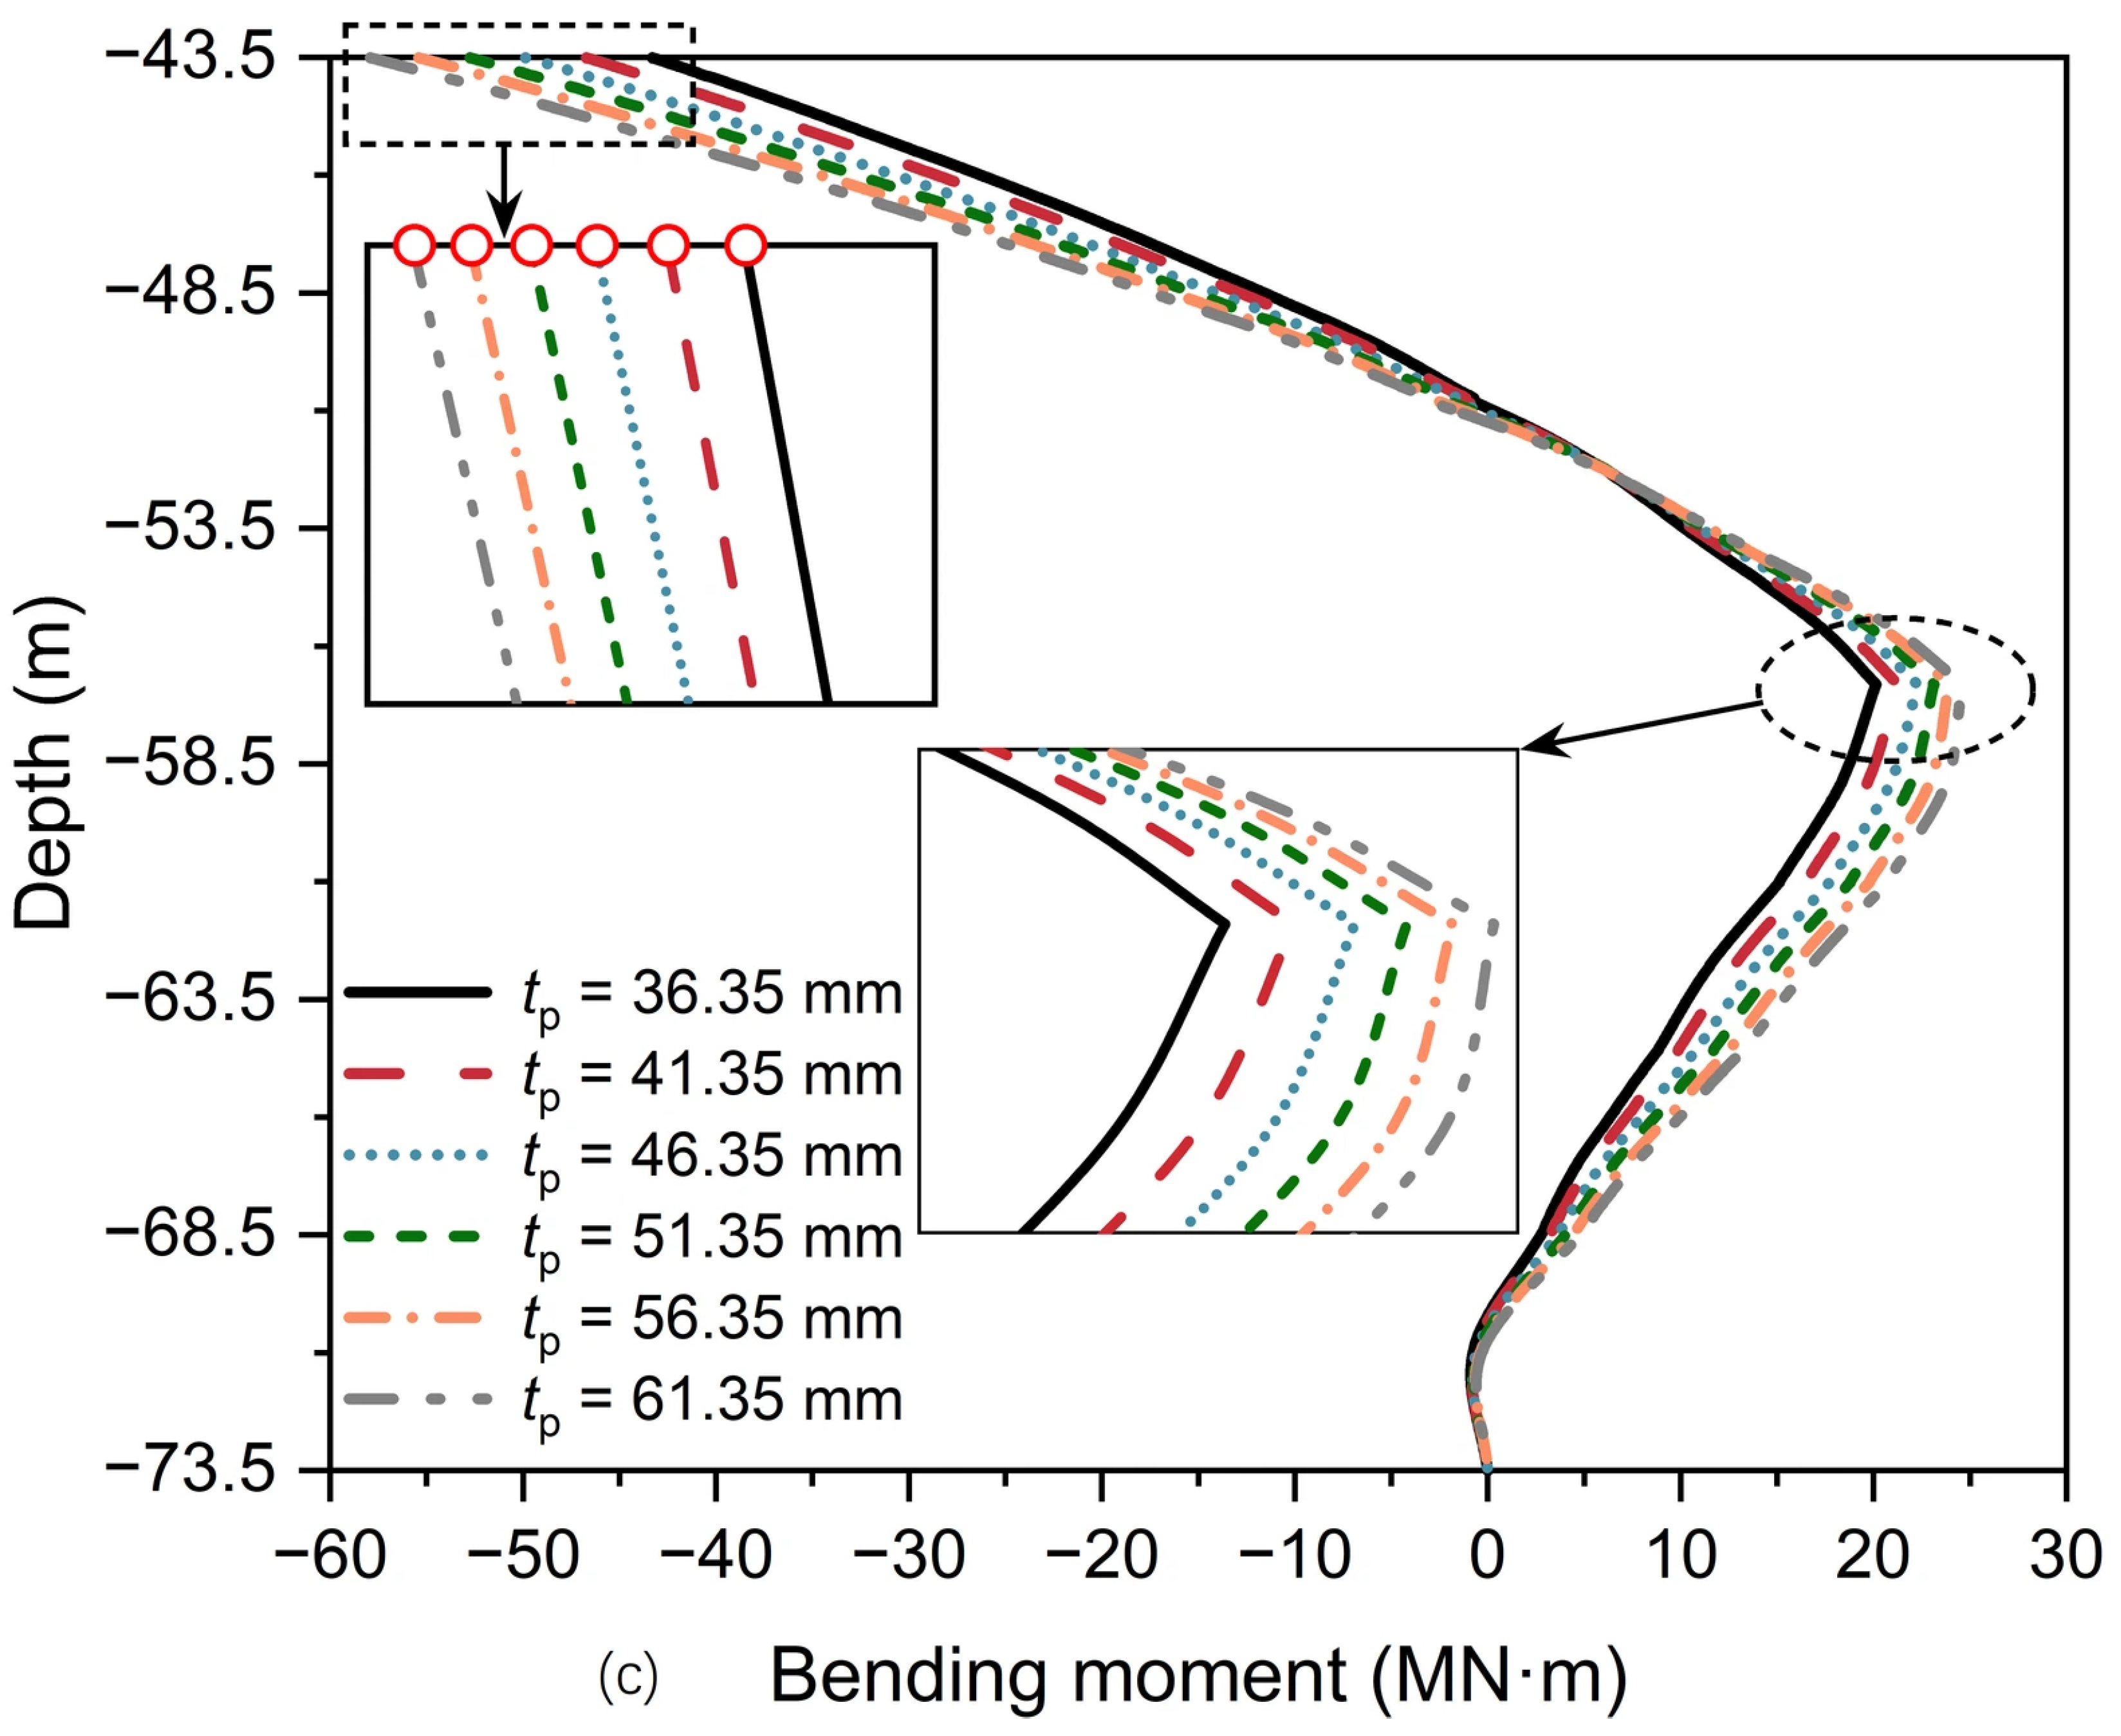
Figure 25 depicts the mechanical response along pile P11 for the PCA with varying pile thicknesses (Loading Case 10). As tp increases from 36.35 mm to 61.35 mm, the maximum lateral displacement at the pile head decreases from 60.43 mm to 57.57 mm (a total decrease of 4.73%) (Figure 25a). Meanwhile, the maximum axial force along the pile increases from 53.18 MN to 57.99 MN (a total increase of 9.05%) (Figure 25b), and the maximum bending moment increases markedly from 43.32 MN·m to 57.93 MN·m (a total increase of 33.73%) (Figure 25c). These results suggest that increasing the pile wall thickness substantially enhances the flexural rigidity of the pile shaft, thereby attracting higher internal forces, whereas its contribution to restraining lateral displacement remains marginal.
Figure 25.
Mechanical responses along pile P11 for the PCA with varying pile thicknesses (Loading Case 10): (a) lateral displacement; (b) axial force; and (c) bending moment.
Furthermore, both the maximum axial force and bending moment of pile P11 occur at the pile head, yielding maximum combined stresses of 331.86, 308.20, 288.50, 271.49, 256.66, and 243.76 MPa for tp = 36.35, 41.35, 46.35, 51.35, 56.35, and 61.35 mm, respectively, representing a total reduction of 26.55%. Assuming a steel yield strength of 490 MPa for the pile, for cases with tp ≥ 36.35 mm, the cross-sectional utilization ratios remain below 1.0 (specifically 0.68 for tp = 36.35 mm). Therefore, the pile wall thicknesses analyzed in this section provide adequate structural safety, and increasing the pile wall thickness effectively reduces the maximum combined stress at the critical section, thereby enhancing its structural safety.
5. Conclusions
In this study, three-dimensional numerical simulations were performed for both the caisson anchorage and the PCA to compare their displacement responses under the main cable tension. Subsequently, the mechanical responses of the steel pipe piles within the PCA were analyzed in detail, focusing on lateral displacements, axial forces, and bending moments. Finally, a parametric study was carried out to quantify the influence of key parameters on the displacements and mechanical responses of the PCA. The main conclusions drawn for the PCA under Loading Case 10 are summarized as follows:
(1) The TSP of the caisson anchorage exhibits lateral and vertical displacements of 42.29 mm and 62.82 mm, whereas the PCA records corresponding values of 63.41 mm and 80.67 mm, respectively. The displacement responses of both the caisson anchorage and the PCA strictly satisfy the code-specified limits (80 mm laterally, 160 mm vertically). Furthermore, the ultimate bearing capacity is 2.3Fmax for the conventional caisson anchorage and 2.1Fmax for the PCA. Coupled with its superior cost-effectiveness, the PCA demonstrates strong potential as a novel foundation type.
(2) The piles within the PCA exhibit pronounced spatial non-uniformity in displacement and internal force distribution under the combined V-H-M loading resulting from the superstructure self-weight and the main cable tension. While pile heads undergo uniform movements, shaft lateral displacements vary nonlinearly with depth. Axial forces in Columns 1–5 decrease rapidly with depth, indicating that shaft resistance is predominantly mobilized along the upper shafts. Conversely, the rotation of the caisson causes the piles in Column 6 to move upward, thereby inducing negative skin friction along their lower shafts. Additionally, pile P11 experiences the peak axial force and bending moment, serving as the critical design pile.
(3) In a homogeneous cobble stratum, increasing Hc significantly reduces both the displacement of the PCA and the mechanical responses along the piles, enhancing the PCA’s stability. Nevertheless, Hc should be optimized to achieve a balance between structural safety and economic efficiency.
(4) Increasing either Dp or Lp contributes to the stability of the PCA, albeit through distinct mechanisms. Increasing Dp increases flexural rigidity, thereby inducing larger axial forces and bending moments while reducing lateral pile displacements. Conversely, increasing Lp effectively mitigates vertical displacements of the PCA by mobilizing additional shaft resistance from deeper strata, which in turn generates a reverse bending moment that restricts the lateral displacement along the pile shaft. In contrast, while tp has a negligible impact on the displacements of the PCA, it effectively reduces peak combined stresses at critical sections to enhance structural safety.
Author Contributions
Methodology, P.G.; Software, X.Z.; Formal analysis, X.Z.; Investigation, F.Y. and P.G.; Data curation, X.Z.; Writing—original draft, X.Z.; Writing—review and editing, X.Z. and P.G.; Visualization, X.Z.; Supervision, F.Y. and X.G.; Funding acquisition, X.Z., F.Y. and P.G. All authors have read and agreed to the published version of the manuscript.
Funding
This research was funded by the National Natural Science Foundation of China, grant numbers 52508421 and 52308344, the Natural Science Foundation of Zhejiang Province, grant number ZCLQN25E0801, the Science Foundation of Zhejiang Sci-Tech University, grant number 24052158-Y, and the Central Government-Guided Local Science and Technology Development Fund Program, grant numbers 2025ZY01085 and 2026ZY01017.
Data Availability Statement
The original contributions presented in this study are included in the article. Further inquiries can be directed to the corresponding author.
Conflicts of Interest
The authors declare no conflicts of interest.
References
- Mohammadi, S.; Hassanalian, M.; Arionfard, H.; Bakhtiyarov, S. Optimal design of hydrokinetic turbine for low-speed water flow in Golden Gate Strait. Renew. Energy 2020, 150, 147–155. [Google Scholar] [CrossRef] [Scilit]
- De Borger, B.; Mulalic, I.; Rouwendal, J. Productivity and wage effects of an exogenous improvement in transport infrastructure: Accessibility and the Great Belt Bridge. Reg. Sci. Urban Econ. 2025, 114, 104133. [Google Scholar] [CrossRef] [Scilit]
- Xu, G.; Chen, X.; Cao, Z.; Dai, J.; Wang, J. Probabilistic models of marine environmental variables and their impact on dynamic responses of a sea-crossing suspension bridge. Ocean Eng. 2024, 308, 118210. [Google Scholar] [CrossRef] [Scilit]
- Bas, S.; Dong, C.Z.; Apaydin, N.M.; Ilki, A.; Catbas, F.N. Hanger replacement influence on seismic response of suspension bridges: Implementation to the Bosphorus Bridge subjected to multi-support excitation. Earthq. Eng. Struct. Dyn. 2020, 49, 1496–1518. [Google Scholar] [CrossRef] [Scilit]
- Liu, X.; Han, Y.; Li, D.; Tu, Y.; Deng, Z.; Yu, C.; Wu, X. Anti-pull mechanisms and weak interlayer parameter sensitivity analysis of tunnel-type anchorages in soft rock with underlying weak interlayers. Eng. Geol. 2019, 253, 123–136. [Google Scholar] [CrossRef] [Scilit]
- Liu, X.; Han, Y.; Yu, C.; Xiong, F.; Zhou, X.; Deng, Z. Reliability assessment on stability of tunnel-type anchorages. Comput. Geotech. 2020, 125, 103661. [Google Scholar] [CrossRef] [Scilit]
- Niu, C.; Liang, C.; Cen, F.; Ouyang, S.; Mao, L.; Li, Y.; Wang, Y. Evaluation of the bearing capacity characteristics of a rock-anchored type anchorage: A model test study of the Xihoumen rail-cum-road bridge. Rock Mech. Rock Eng. 2026, 59, 1001–1021. [Google Scholar] [CrossRef] [Scilit]
- Qin, H.; Yin, X.; Cheng, X.; Gao, Z.; Tang, H.; Zhu, J.; Li, H. In-situ shear test and numerical simulation of concrete-rock interface shear failure mechanism and its implications for tunnel-type anchorages. Case Stud. Constr. Mater. 2026, 25, e06215. [Google Scholar] [CrossRef] [Scilit]
- Yang, G.J.; Zhang, S.T.; Du, Y.F.; Tang, G.W. Reliability analysis of tunnel-type anchorage in suspension bridge based on the second-order response surface method. Geomech. Eng. 2025, 41, 611–623. [Google Scholar]
- Yang, G.J.; Hou, Z.W.; Du, Y.F.; Han, Z.J. Study on damping layer and its damping efficiency of tunnel-type anchorage in suspension bridges under seismic loading. Indian Geotech. J. 2026, 56, 3751–3767. [Google Scholar] [CrossRef] [Scilit]
- Diana, G.; Yamasaki, Y.; Larsen, A.; Rocchi, D.; Giappino, S.; Argentini, T.; Pagani, A.; Villani, M.; Somaschini, C.; Portentoso, M. Construction stages of the long span suspension Izmit Bay Bridge: Wind tunnel test assessment. J. Wind Eng. Ind. Aerodyn. 2013, 123, 300–310. [Google Scholar] [CrossRef] [Scilit]
- Wang, X.; Zhong, X.; Ren, W.; Chen, Y.; Sun, Y.; Qiu, Y. A deduction model for combined bearing capacity of a looped cable anchorage-foundation in suspension bridges considering in situ stress. Structures 2026, 87, 111522. [Google Scholar] [CrossRef] [Scilit]
- Wang, Z.; Dai, K.; Gong, W.; Dai, G.; Guo, H.; Song, W. On-site monitoring study during sinking of the North Anchorage large caisson of a Yangtze River Bridge in China. Geotech. Test. J. 2026, 49, e20240118. [Google Scholar] [CrossRef] [Scilit]
- Jiang, B.-N.; Yu, T.; Peng, W.-M.; Zhang, Y.-B.; He, S.-B.; Ma, J.-L. Analysis of mechanism of sand gushing and sudden sinking of ultra-large deep-water open caisson in sand via field and model tests. Appl. Ocean Res. 2023, 130, 103436. [Google Scholar] [CrossRef] [Scilit]
- Furuya, N.; Yamaoka, R.; Paulson, B.C. Construction of Akashi-Kaikyo Bridge west anchorage. J. Constr. Eng. Manag. 1994, 120, 337–356. [Google Scholar] [CrossRef] [Scilit]
- Wu, F.; Feng, C.; Xia, Y. Wufengshan Yangtze River Bridge: A thousand-meter scale suspension bridge in China. Struct. Eng. Int. 2022, 32, 247–251. [Google Scholar] [CrossRef] [Scilit]
- Xiong, W.; Jiang, C.; Wang, T.; Wang, R.G.; Zhou, X.Y. Safety-margin design for gravity-type anchorage of suspension bridges over 2,000 m long based on target reliability. J. Bridge Eng. 2024, 29, 04024003. [Google Scholar] [CrossRef] [Scilit]
- Abualghethe, D.A.; Mu, B.; Dai, G.; Li, Z.; Mohammed, A.A.; Moussa, A.M. Hybrid FEM–machine learning framework for back-analysis of spatially varying soil parameters in super-large caisson foundation. Appl. Ocean Res. 2026, 167, 104954. [Google Scholar] [CrossRef] [Scilit]
- Dong, X.C.; Lu, Z.; Zheng, Q.G.; Jiang, F.; Guo, M.W. An intelligent prediction and active warning framework of giant open caisson sinking via multi-source data fusion: A multi-case study on three ultra-long-span bridge anchor foundations. Ocean Eng. 2026, 358, 125710. [Google Scholar] [CrossRef] [Scilit]
- Li, D.J.; Zeng, X.T.; Shi, C.; Qiu, L.W. Method for calculating the bearing capacities of caisson foundations considering the effects of caisson construction. Mar. Georesour. Geotechnol. 2025, 43, 928–934. [Google Scholar] [CrossRef] [Scilit]
- Mu, B.; Ling, X.; Zheng, W.; Mei, G.; Ni, P. Model test and numerical simulation of open caisson foundation under long-term lateral loading. Ocean Eng. 2024, 312, 119276. [Google Scholar] [CrossRef] [Scilit]
- Wang, C.; Han, H.; Wang, H.; Zhang, X.; Liu, X.; Leng, X.; Qin, W.; Fang, K. Load-bearing behaviors of the composite gravity-type anchorage: Insights from physical model and numerical tests. Eng. Fail. Anal. 2025, 167, 108959. [Google Scholar] [CrossRef] [Scilit]
- Yang, Y.; Qiu, C.; Ni, P.; Dong, H.; Wang, R.; Wang, Z. Model test and numerical simulation on secant pile-diaphragm wall caisson foundation during excavation. Ocean Eng. 2026, 353, 124825. [Google Scholar] [CrossRef] [Scilit]
- Ingham, T.J.; Rodriguez, S.; Nader, M. Nonlinear analysis of the Vincent Thomas Bridge for seismic retrofit. Comput. Struct. 1997, 64, 1221–1238. [Google Scholar] [CrossRef] [Scilit]
- Conte, J.P.; He, X.; Moaveni, B.; Masri, S.F.; Caffrey, J.P.; Wahbeh, M.; Tasbihgoo, F.; Whang, D.H.; Elgamal, A. Dynamic testing of Alfred Zampa Memorial Bridge. J. Struct. Eng. 2008, 134, 1006–1015. [Google Scholar] [CrossRef] [Scilit]
- Cheng, Z.; Cong, S.; Cheng, Z. Recent advances in composite caisson–pile foundation. Mar. Georesour. Geotechnol. 2025, 43, 2460–2473. [Google Scholar] [CrossRef] [Scilit]
- Zhang, C.; Zhang, X.; Huang, M.; Tasng, H. Responses of caisson-piles foundations to long-term cyclic lateral load and scouring. Soil Dyn. Earthq. Eng. 2019, 119, 62–74. [Google Scholar] [CrossRef] [Scilit]
- Misra, J.; Bhandary, N.P. Sub-additive lateral stiffness and embedment-controlled synergy of composite caisson–pile foundations under combined V–H–M loading. Transp. Infrastruct. Geotechnol. 2026, 13, 175. [Google Scholar] [CrossRef] [Scilit]
- Tu, W.; Huang, M.; Gu, X.; Chen, H.P.; Liu, Z. Experimental and analytical investigations on nonlinear dynamic response of caisson-pile foundations under horizontal excitation. Ocean Eng. 2020, 208, 107431. [Google Scholar] [CrossRef] [Scilit]
- Tu, W.; Huang, M.; Gu, X.; Chen, H.P. Nonlinear dynamic behavior of laterally loaded composite caisson-piles foundation under scour conditions. Mar. Georesour. Geotechnol. 2020, 38, 1265–1280. [Google Scholar] [CrossRef] [Scilit]
- Zhang, H.; Liang, F.; Chen, H. Seismic response of offshore composite caisson-piles foundation with different pile configurations and soil conditions in centrifuge tests. Ocean Eng. 2021, 221, 108561. [Google Scholar] [CrossRef] [Scilit]
- Kc, R.; Sharma, K.; Raychowdhury, P.; Acharya, I.P.; Burnwal, M.L.; Misra, J. State-of-the-art review of composite caisson-pile foundation (CCPF). Appl. Ocean Res. 2023, 136, 103571. [Google Scholar] [CrossRef] [Scilit]
- Zhao, X.Q.; Gong, X.N.; Duan, Y.L.; Guo, P.P. Load-bearing performance of caisson-bored pile composite anchorage foundation for long-span suspension bridge: 1-g model tests. Acta Geotech. 2023, 18, 3743–3763. [Google Scholar] [CrossRef] [Scilit]
- Zhao, X.Q.; Gong, X.N.; Guo, P.P. Caisson-bored pile composite anchorage foundation for long-span suspension bridge: Feasibility study and parametric analysis. J. Bridge Eng. 2022, 27, 04022117. [Google Scholar] [CrossRef] [Scilit]
- Zhao, X.Q.; Wang, J.C.; Guo, P.P.; Gong, X.N.; Duan, Y.L. Displacement and force analyses of piles in the pile-caisson composite structure under eccentric inclined loading considering different stratum features. Front. Struct. Civ. Eng. 2023, 17, 1517–1534. [Google Scholar] [CrossRef] [Scilit]
- Zhao, X.Q.; Gong, X.N.; Guo, P.P.; Duan, Y.L. Experimental and numerical studies on the displacement and load-transfer mechanism of pile-caisson composite structure. Mech. Adv. Mater. Struct. 2024, 32, 1102–1116. [Google Scholar] [CrossRef] [Scilit]
- Yan, X.; Zhan, W.; Hu, Z.; Xiao, D.; Yu, Y.; Wang, J. Field study on deformation and stress characteristics of large open caisson during excavation in deep marine soft clay. Adv. Civ. Eng. 2021, 2021, 7656068. [Google Scholar] [CrossRef] [Scilit]
- Hu, G.X. Study on the Effect of Lifting the Stiffened Girders of the Main Bridge on the Mechanical Properties of the Anchor-Approach System of the Oujiang River North Estuary Bridge. Master’s Thesis, Zhejiang Sci-Tech University, Hangzhou, China, 2023. [Google Scholar]
- Chen, P.S. Research on Key Technology of Large Land Caisson in Deep Silt Overburden. Ph.D. Thesis, Chang’an University, Xi’an, China, 2021. [Google Scholar]
- Brinkgreve, R.B.J.; Kumarswamy, S.; Swolfs, W.M. Plaxis 3D 2017 User’s Manual; Plaxis B.V.: Delft, The Netherlands, 2017. [Google Scholar]
- Smulders, C.M. An Improved 3D Embedded Beam Element with Explicit Interaction Surface. Master’s Thesis, Delft University of Technology, Delft, The Netherlands, 2018. [Google Scholar]
- JTG/T D65-05-2015; Specifications for Design of Highway Suspension Bridge. China Communications Press: Beijing, China, 2015.
- American Petroleum Institute (API). Recommended Practice Planning, Designing, and Constructing Fixed Offshore Platforms—Working Stress Design; API Recommended Practice 2A-WSD; API: Washington, DC, USA, 2014. [Google Scholar]

Disclaimer/Publisher’s Note: The statements, opinions and data contained in all publications are solely those of the individual author(s) and contributor(s) and not of MDPI and/or the editor(s). MDPI and/or the editor(s) disclaim responsibility for any injury to people or property resulting from any ideas, methods, instructions or products referred to in the content. |
© 2026 by the authors. Licensee MDPI, Basel, Switzerland. This article is an open access article distributed under the terms and conditions of the Creative Commons Attribution (CC BY) license.