


Highlights
- ALARM reproduced seasonal actual evapotranspiration (ETa) in arid orchards.
- Errors of estimate ranged from 0.72 to 0.73 mm d−1.
- Canopy-related parameters strongly influenced ETa estimates.
- Sensible heat flux estimates showed weaker agreement with eddy covariance measurements.
- ALARM shows potential for assessment of crop water use in arid environments.
Abstract
Accurate estimates of actual evapotranspiration (ETa) are essential for irrigation management in arid environments but remains challenging in heterogeneous perennial tree systems. This study evaluated the Analytical Land–Atmosphere Radiometer Model (ALARM) for estimating ETa by comparing model estimates with measurements from an eddy covariance (EC) flux tower in the Palmyra Oasis, Syria, during two growing seasons. A sensitivity analysis was first conducted to identify the most influential model parameters, followed by calibration using 2005 MODIS observations and meteorological data as inputs. The calibrated parameter set was then applied without further adjustment to the 2004 EC dataset. Satellite-derived radiation and modelled sensible heat flux were also evaluated against EC measurements to assess the reliability of key model inputs and components. ALARM reproduced the seasonal dynamics of ETa across the study area, with RMSE from 0.72 to 0.73 mm d−1, NRMSE from 27.11% to 28.16%, and PBIAS from 2.24% to 12.40%. The model overestimated ETa during the early growing season and slightly underestimated it during the peak season, consistent with seasonal changes in available energy and surface thermal conditions. Overall, the results demonstrate the potential of ALARM for assessment of crop water use in arid perennial tree systems, while highlighting limitations associated with short-term variability.
1. Introduction
Agriculture is the largest consumer of freshwater resources worldwide, accounting for approximately 70% of global freshwater withdrawals. This proportion is even higher in many Middle Eastern countries, where arid and semi-arid climatic conditions intensify pressure on water resources. In Syria, irrigation accounts for nearly 87% of the country’s water withdrawals [1,2]. Over recent decades, intensive groundwater abstraction, prolonged droughts, climate change, the impacts of the civil war, and inefficient irrigation practices have increased pressure on the country’s already scarce water resources. Groundwater levels have declined, and numerous natural springs have dried up, threatening the long-term sustainability of irrigated agriculture. Under these conditions, improving irrigation efficiency through the accurate estimation of crop water requirements is an important component of sustainable water resources management [3,4,5]. Because actual crop water consumption is largely determined by evapotranspiration, reliable estimates of actual evapotranspiration (ETa) are essential for improving irrigation management and water-use efficiency, particularly in water-limited environments such as Syria.
Actual evapotranspiration is a major component of the hydrological cycle, governing exchanges of water and energy between the land surface and the atmosphere and playing a central role in irrigation water management. Direct methods for measuring evapotranspiration, including lysimeters, the Bowen ratio energy balance, soil water balance approaches, and eddy Covariance, can provide reliable estimates at the field-scale [6,7]. However, these techniques can be expensive to install and maintain, require specialized instrumentation and expertise, and generally represent a limited measurement footprint around the monitoring site. Consequently, they may not adequately capture the spatial variability of evapotranspiration across heterogeneous agricultural landscapes, limiting their applicability for regional-scale water resources assessment [8,9,10].
Satellite remote sensing has emerged as an effective solution for estimating spatially distributed ETa, providing repeated observations over large areas at relatively low operational cost. Many remote sensing approaches estimate ETa using surface energy balance models that integrate satellite observations with meteorological data. Widely used examples include the Surface Energy Balance Algorithm for Land (SEBAL) [11,12,13], the Mapping Evapotranspiration at High Resolution with Internalized Calibration (METRIC) [14,15], the Modified Surface Energy Balance Algorithm for Land (M-SEBAL) [16], and the Analytical Land–Atmosphere Radiometer Model (ALARM) [17,18].
ALARM is a physically based model that estimates sensible and latent heat fluxes from radiometric surface temperature, vegetation characteristics, and meteorological data. Unlike image-based energy balance models such as SEBAL and METRIC, which require internal calibration using extreme “hot” and “cold” pixels, ALARM relies on relatively few input variables and can be implemented using satellite-derived products and routinely available meteorological data. This makes it attractive for operational evapotranspiration monitoring over large areas. Previous applications have primarily focused on annual agricultural crops in the United States and the Middle East [19,20,21,22], while Darouich et al. [23] extended its applications to perennial tree orchards in southern Portugal. The present study further evaluates ALARM in perennial orchards in the Palmyra Oasis, Syria, under different environmental and management conditions, using field observations to assess model performance and the accuracy of satellite-derived input variables.
Previous investigations in Palmyra have examined evapotranspiration, surface energy fluxes, and agricultural water use [24]. However, based on the literature reviewed for this study, no remote-sensing-based energy balance model has been reported for estimating ETa in the region. This research gap, combined with the availability of field measurements, makes the Palmyra Oasis a particularly suitable site for evaluating ALARM. An eddy covariance flux tower operated at the site during the 2001–2009 growing seasons, providing measurements of evapotranspiration and surface energy fluxes that can serve as an independent reference for assessing satellite-derived ETa estimates and model performance. These data also provide a valuable benchmark of agricultural water use before the Syrian civil war. Orchard cultivation and irrigation have long been important to local livelihoods, and the oasis is slowly returning to its pre-war condition. In this context, the historical observations provide a relevant basis for evaluating evapotranspiration in perennial orchards under the arid conditions of Palmyra and informing irrigation management.
Accordingly, the objectives of this study are to: (i) estimate ETa for perennial tree plantations in the Palmyra Oasis using satellite data and the ALARM; (ii) evaluate the applicability of ALARM for estimating ETa under arid environmental conditions; and (iii) validate the satellite-derived ETa estimates against eddy Covariance measurements while assessing the accuracy of the satellite-derived model input variables. By addressing these objectives, this study aims to provide evidence on the applicability of a relatively simple remote-sensing-based approach for quantifying crop water consumption in heterogeneous canopies under arid conditions and, ultimately, to support improved agricultural water management in a region that has experienced severe disruption as a result of the Syrian civil war over the past decade.
2. Materials and Methods
2.1. Study Area
The study was conducted in the Palmyra Oasis (34°31′–34°33′ N and 38°15′–38°20′ E), located near the city of Palmyra in central Syria within the Syrian Desert, at an elevation of approximately 375 m above sea level (a.s.l.). Hydrographically, the oasis belongs to the Tudmor Basin, which covers approximately 4860 km2. The region comprises three main units: the oasis, the hydrological discharge area of Sebkhat Al Mouh, and the surrounding steppe. Except for the irrigated area land and the partially inundated Sebkhat Al Mouh, natural vegetation is sparse and highly ephemeral. Consequently, for most of the year, the landscape is dominated by exposed sandy and stony desert surfaces [24].
The study area has a hot desert climate (BWh) according to the Köppen–Geiger climate classification [25], characterized by very hot, dry summers, mild winters, low annual precipitation, high solar radiation, and high atmospheric evaporative demand. Mean annual air temperature is 19.6 °C, mean annual precipitation is 123 mm, of which 75% falls between November and March, and annual reference evapotranspiration (ETo), computed using the FAO56 Penman-Monteith equation [26,27], is approximately 1760 mm. Long-term monthly climatic conditions (1990–2006), including the 2004 and 2005 study periods, are presented in Figure 1. Under these climatic conditions, agricultural production depends almost entirely on irrigation.
Figure 1.
Monthly averaged values of reference evapotranspiration (EToo), and minimum (Tmin) and maximum (Tmax) temperatures over a 17-year period (1990–2006), including the 2004 and 2005 seasons.
The Palmyra Oasis covers approximately 1700 ha, making it one of the largest irrigated agricultural systems in the Syrian Desert. Historically, it has supported human settlement and agricultural development in the region for centuries and remains the main source of water supply and agricultural production for the local population. The oasis comprises two distinct agricultural zones: the old oasis, covering approximately 500 ha, and the more recently developed new oasis. The old oasis consists of small, fragmented fields with considerable spatial heterogeneity resulting from traditional land-use practices, whereas the new oasis is characterized by large, more regularly shaped fields that reflect more modern agricultural development. Perennial tree crops dominated the agricultural system during the study period (2004–2005), with olive (Olea europaea L.) representing approximately 58.8% of crop coverage, followed by pomegranate (Punica granatum L.) (18.8%) and date palm (Phoenix dactylifera L.) (16.5%). The remaining 5.9% consisted of other fruit tree species [24]. Limited water availability prevents the cultivation of annual field crops such as wheat and barley [28]. Consequently, perennial orchards constitute still today the dominant irrigated crops and were selected as the target land cover for this study.
Groundwater is the sole source of irrigation water throughout the oasis. Irrigation practices differ between the two agricultural zones: the old oasis is supplied with relatively high-quality water from the confined Cretaceous aquifer, whereas irrigation in the newer agricultural areas relies primarily on privately operated wells tapping the shallow aquifer. Increasing groundwater abstraction, deteriorating groundwater quality, limited precipitation, and recurrent drought have progressively intensified pressure on the available water resources, highlighting the need for improved irrigation management and accurate estimation of crop water use. The soil is predominantly sandy loam, underlain by sandy clay loam. Soil salinity generally increases toward the southern and southeastern parts of the oasis owing to the proximity of Sebkhat Al-Mouh and the long-term use of saline groundwater for irrigation in some areas [24].
2.2. Eddy Covariance Measurements
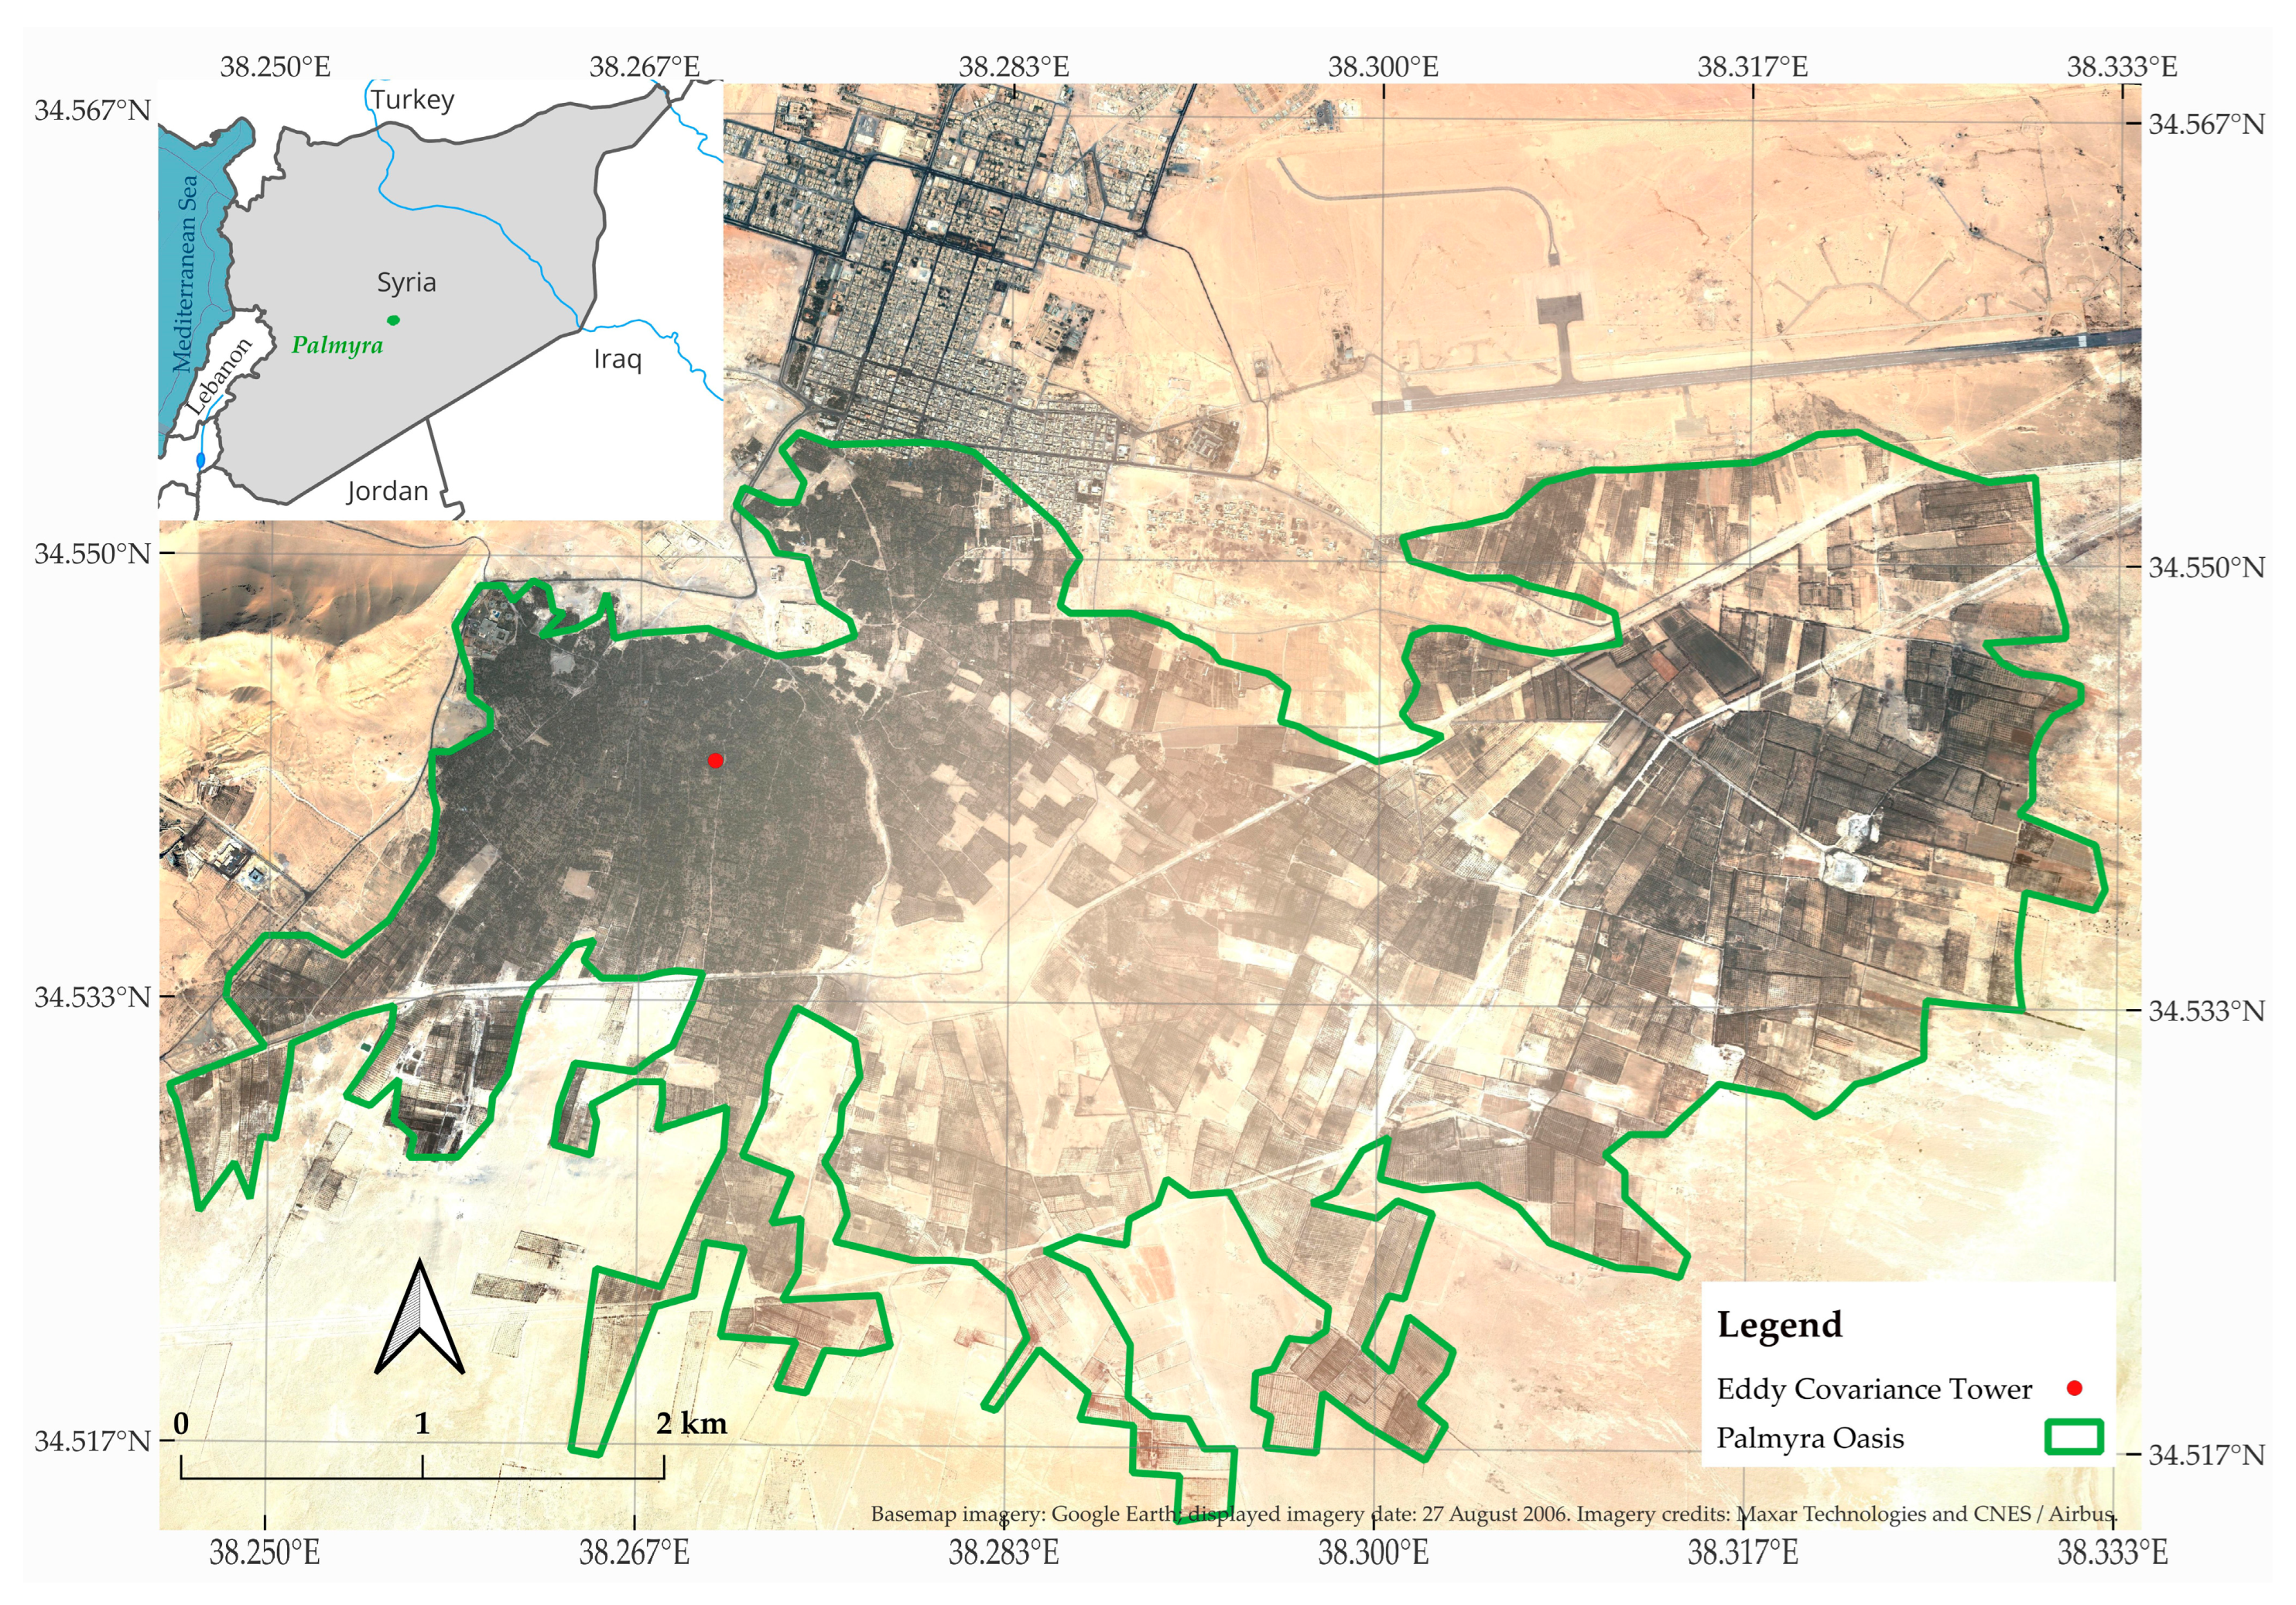
Actual evapotranspiration (ETa) was determined using the eddy Covariance (EC) technique, which measures turbulent exchanges of energy, water vapor, and momentum between the land surface and the atmosphere [29]. The EC flux tower was established in 2001 within the old Palmyra Oasis as part of the IRRmaid project, a collaborative initiative between the Arab Center for the Studies of Arid Zones and Dry Lands (ACSAD) and the French Research Institute for Sustainable Development (IRD) [24]. In this study, the datasets collected in 2004 and 2005 were used to assess the performance of the ALARM. The station was installed in a representative 0.4-ha orchard (34°32′34″ N, 38°16′12″ E; 375 m a.s.l.) within the old oasis (Figure 2). Although the surrounding fetch extended approximately 1 km in all directions, the EC fluxes were considered representative of an area within a 400–500 m radius of the tower, based on vegetation type [24]. The orchard had a tree density of approximately 170 trees ha−1, and an average tree height of 9 m, while nearly 50% of the ground surface remained permanently unshaded and consisted of bare soil.
The EC system included a three-dimensional sonic anemometer (CSAT3, Campbell Scientific, Logan, UT, USA) and a krypton hygrometer (KH20, Campbell Scientific, Logan, UT, USA), both mounted 14 m above the ground, approximately 5 m above the mean canopy height (≈9 m). The sonic anemometer measured the three orthogonal wind velocity components and sonic temperature, whereas the krypton hygrometer measured high-frequency fluctuations in atmospheric water vapor concentration. These synchronized measurements were used to calculate sensible heat (H) and latent heat (LE) fluxes from the covariance between fluctuations in vertical wind velocity and the corresponding scalar quantities. High-frequency data were sampled continuously at 20 Hz and recorded using a CR23X data logger (Campbell Scientific, Logan, UT, USA). Turbulent fluxes were computed over 15-min averaging intervals after applying coordinate rotation to align the wind vectors with the mean streamline. Latent heat flux was subsequently converted to ETa using the latent heat of vaporization.
Brunel et al. [24] did not report details of stationarity filtering, turbulence screening, spike removal, krypton hygrometer corrections, gap-filling procedures, daily aggregation rules, or the proportion of missing data. However, they assessed energy-balance closure by comparing the measured turbulent fluxes with the available energy. Closure was lower during the cold season, with an average slope of 0.72 from October to February, and higher during the warm season, with an average slope of 0.88 from May to August. These values indicate that the measured sensible and latent heat fluxes accounted for 72–88% of the available energy, calculated as net radiation minus ground heat flux. These results indicate better energy-balance closure during the warm season, which is particularly relevant for analyzing vegetation water use. They further reflect a combination of unresolved energy storage, landscape-scale transport processes, surface heterogeneity and measurement uncertainties. No additional energy-balance closure correction was applied in this study; instead, the EC-derived ETa values were used as reported by Brunel et al. [24]. Consequently, the EC-derived (ETa) should be interpreted as an observational reference with inherent uncertainty rather than as an error-free measurement.
In addition to the EC instrumentation, the tower was equipped with an NR-LITE net radiometer (Kipp & Zonen, Delft, The Netherlands) to measure net radiation (Rn), a pyranometer (Campbell Scientific, Logan, UT, USA) to measure incoming shortwave solar radiation (Rs), and two HFP01 soil heat flux plates (Hukseflux, Delft, The Netherlands) installed at a depth of 3 cm. One plate was located beneath the tree canopy and the other in an adjacent bare-soil area. Since canopy coverage reached approximately 50% in the study site, the soil heat flux used in the surface energy balance was calculated as the average of the two measurements. These data were used as the baseline simulation for the uncertainty and error propagation analyses of ALARM-derived ETa estimates presented in Section 3.3.2. Further details of the EC instrumentation and data processing are provided by Brunel et al. [24].
Figure 2.
Location of Palmyra Oasis and eddy Covariance (EC) Tower.
2.3. ALARM Description
2.3.1. Energy Balance Equation
A comprehensive description of the ALARM was recently provided by Darouich et al. [23]; therefore, only its main features are summarized here. In ALARM, ETa is estimated based on surface energy balance equation [30]:
where Rn is the net incoming radiation (W m−2), G is the soil heat flux (W m−2), H is the sensible heat flux (W m−2), and LE is the latent (evaporative) heat flux (W m−2). For the energy balance to close, any portion of the available energy (Rn – G) that does not contribute to LE must be accounted for by H, which is generally computed as follows:
where Ts (K) is the surface temperature, Ta (K) is the air temperature at a height Za (m), k is von Kármán’s constant, u* (m s−1) is the friction velocity representing the intensity of turbulent momentum transfer near the surface, derived from the wind speed (u) logarithmic profile following Su [31], ρ (kg m−3) is the density of the air, cp (J kg−1 K−1) is the specific heat at constant pressure, Z0h (m) is the scalar roughness length for sensible heat (m), d0 (m) is the displacement height, L (m) is the Monin–Obukhov length, and Ψ is a stability correction, which is a function of (Za − d0)/L. Assuming neutral atmospheric conditions, Ψ is considered to be negligible [30]. However, in ALARM, H is computed following an alternative approach, which converts radiometric surface temperature (Ts) into a physically meaningful equivalent isothermal surface temperature, referred to as the aerodynamic surface temperature (Ti).
Rn = H + G + LE
2.3.2. Aerodynamic Surface Temperature
ALARM uses the aerodynamic surface temperature (Ti) to estimate H at a specified roughness length based on Monin–Obukhov similarity theory for the surface sublayer [30,32]. The conversion of Ts to Ti accounts for the effects of vegetation temperature profile, leaf area index, canopy height, fractional vegetation cover, leaf angle distribution, and sensor zenith view angle [17,18,33].
The aerodynamic temperature (Ti) is obtained from Ts, as follows:
where Tfg (K) and Tfh (K) denote the foliage temperatures at the bottom and top of the canopy, respectively. The weighting coefficient ω is computed as [18,19,23,30,34]:
where fsoil = exp[-g′ LAI/μr], μr is the cosine of the radiometer view zenith angle (-), and g′ accounts for leaf angle distribution (-).
The coefficient W is defined as:
with
where a is the eddy diffusivity decay parameter (-), Re is the Reynolds number for leaf boundary-layer transport (-), Lf is a characteristic leaf dimension (m), ν is the kinematic viscosity of air (1.6 × 10⁻⁵ m2 s−1), Pr is the Prandtl number (0.712), representing the ratio of momentum diffusivity to thermal diffusivity, CL is an empirical coefficient (-) that depends on leaf shape, density, and orientation, and m and n (-) are empirical parameters associated with canopy structural properties and turbulence intensity, respectively.
Re = (u*Lf)/v
Because ALARM uses a single radiometric temperature measurement, the canopy temperatures Tfg and Tfh cannot be measured independently and must be parameterized. Following Suleiman and Crago [18], the model assumes that the foliage temperature at the top of the canopy is equal to the air temperature (Tfh = Ta). The foliage temperature at the bottom of the canopy is then calculated as:
Figure 3 illustrates the conceptual temperature profiles assumed by the ALARM.
Figure 3.
Schematic representation of the vertical profiles of air and canopy temperature within the surface sublayer and canopy sublayer assumed by the ALARM (adapted from Suleiman and Crago, [17]). Ta and Ts denote air and land surface temperature, respectively; Ta(ξ) and Tf(ξ) represent air and foliage temperature within the canopy sub-layer at height (ξ), respectively; Tfg and Tfh are the foliage temperatures at the bottom and top of the canopy, respectively; Z is the height above the ground; h is the canopy height; Z0h thermal roughness length; and IRT denotes the satellite’s infrared thermometer.
2.3.3. Dimensionless Temperature
Suleiman and Crago [33] developed a dimensionless temperature formulation that does not require the identification of wet and dry pixels or the use of potential evapotranspiration, as required by some other surface energy balance models, such as SEBAL [11,12] and SEBI [35]. The dimensionless temperature difference (ΔT) can be defined as:
where Ti is the aerodynamic surface temperature, Ta is the air temperature, and Tmax is the surface temperature that would occur if all the available energy (Rn - G) was converted to sensible heat flux (H) and no evapotranspiration occurred (LE ≈ 0).
The relationship between H and ΔT is approximately linear and passes through the origin, assuming that the denominator in Equation (2) varies only slightly as Ts changes from Ti to Tmax. Under this assumption, H can be expressed as:
while LE can be expressed as:
Thus, ΔT represents the fraction of available energy partitioned into sensible heat, while (1 - ΔT) represents the fraction partitioned into latent heat.
H ≈ (Rn −G) ΔT
LE = (Rn −G) (1 − ΔT)
2.3.4. Evaporative Fraction
To extend the instantaneous energy partitioning estimated at the time of satellite observation to the daily timescale, ALARM uses the concept of evaporative fraction (EF), following Suleiman and Crago [33]. EF represents the fraction of the available surface energy partitioned into latent heat flux and is defined as:
Suleiman and Crago [33] showed that EF remains relatively stable during the central daytime period, despite some variation during the early morning and late afternoon. Therefore, an instantaneous EF derived around midday can be used to characterize daytime energy partitioning and applied to the daily available energy to estimate daily actual evapotranspiration. Accordingly, daily ETa is calculated as:
where (Rn−G)daily is the daily available energy. The resulting daily latent heat energy is subsequently converted to an equivalent water depth corresponding to the ETa.
A schematic representation of the framework for estimating ETa from satellite data using the ALARM is presented in Figure 4. To summarize, the integrated ALARM and dimensionless temperature algorithms rely on three major assumptions. First, within the ALARM, the foliage is assumed to have an exponential vertical temperature profile. This assumption is generally considered valid during the satellite overpass in the middle of the day, when exponential vertical temperature profiles within vegetation can be more pronounced. Second, the relationship between H and ∆T is assumed to be linear and to pass through the origin. This assumption is unlikely to introduce substantial errors into ET estimation because the denominator in Equation (2) varies only slightly as Ts changes from Ti to Tmax. Third, the evaporative fraction is assumed to remain constant (Equation (14)). Although this assumption introduces some uncertainty into ET estimates, its effect is expected to be relatively small under most semi-arid climatic conditions [20].
Figure 4.
Conceptual framework of estimating daily actual evapotranspiration (ETa) using MODIS data and the ALARM model.
2.4. Model Implementation
The ALARM was implemented for the MODIS pixel (500 × 500 m) covering the area around the EC flux tower, which provided continuous measurements for model evaluation. Vegetation structural parameters required by ALARM were also derived from field measurements conducted around the EC tower. Twenty representative olive, pomegranate, and date palm trees were randomly surveyed during the mid-season to characterize the vegetation. Tree height was measured using a Haga altimeter, yielding a mean canopy height of approximately 9 m, while fractional vegetation cover (fc) was estimated from tree spacing and canopy dimensions and averaged approximately 50%, consistent with Brunel et al. [24]. These measurements were used to derive the aerodynamic and canopy parameters required by the model.
Satellite data were accessed through Google Earth Engine using MODIS Collection 6.1 products. Three MODIS products were used: MOD11A1 version 6.1, which includes data on daily land surface temperature (Ts) and surface emissivity (εs) at 1-km resolution [36]; MCD15A3H version 6.1, corresponding to 4-day composite leaf area index/fPAR at 500-m resolution [37]; and MCD43A3 version 6.1, corresponding to daily black-sky and white-sky albedo at 500-m resolution [38]. Although MCD43A3 is distributed as a daily product, each albedo estimate is generated from a 16-day observation window centred on the nominal product date.
MODIS values were extracted at predefined geographic coordinates corresponding to the study pixel (Table 1). MOD11A1 was sampled at its nominal 1000-m spatial resolution, whereas MCD15A3H and MCD43A3 were sampled at 500 m. No explicit reprojection or resampling to a common grid was performed prior to extraction. Instead, each product was sampled at the predefined point location using its native projection and nominal spatial resolution in Google Earth Engine.
Table 1.
Characteristics of MODIS Collection 6.1 products.
MOD11A1 daytime Ts values from the LST_Day_1km band were converted using the product scale factor of 0.02. LAI values from MCD15A3H were multiplied by the scale factor 0.1. Black-sky and white-sky shortwave albedo values from MCD43A3 were multiplied by the scale factor 0.001. Surface emissivity was extracted from the MOD11A1 Emis_31 and Emis_32 bands and converted using the MODIS emissivity scaling. The daytime view zenith angle was extracted from the Day_view_angle band, which has a scale factor of 1 and is stored as an encoded offset value. The physical view angle was therefore calculated by subtracting 65° from the encoded value, and the absolute value of the resulting angle was retained for analysis.
Quality-control screening was applied before export. For MOD11A1, observations were first screened to remove values outside the valid encoded ranges for daytime Ts, emissivity, and view zenith angle. The QC_Day band was then decoded using the MOD11A1 bit fields. Bits 0–1 were used for the mandatory QA flag, bits 2–3 for the data-quality flag, bits 4–5 for the emissivity-error flag, and bits 6–7 for the Ts -error flag. Strict quality screening was applied by retaining only observations with mandatory QA equal to 0, data quality equal to 0, emissivity error less than or equal to 1, and Ts error equal to 0. No additional atmospheric screening was applied using cloud-state, cloud-shadow, aerosol, cirrus, internal-cloud, or adjacent-cloud flags, because these flags were not used in the MOD11A1 extraction workflow. For MCD15A3H, LAI values outside the valid encoded range of 0–100 were masked, and the FparLai_QC band was used to retain only observations satisfying the selected LAI quality criteria. For MCD43A3, black-sky and white-sky shortwave albedo values were screened using their valid encoded ranges and the shortwave BRDF/albedo mandatory quality flag. Records lacking valid values after quality-control screening were excluded from the exported tables.
Temporal matching was based on the nominal MODIS product date. MOD11A1 Ts observations were treated as daily values. MCD43A3 albedo observations were matched to the same nominal calendar date, while noting that each value represents retrievals from a 16-day moving observation window. MCD15A3H LAI observations were treated as 4-day composite values. Missing LAI observations were linearly interpolated in time only when bounded by valid quality-controlled LAI retrievals. No interpolation was applied to MOD11A1 Ts, εs, view angle, or MCD43A3 albedo. After quality-control screening and temporal matching, records with missing required variables were removed from the final analysis table. The 2004 extraction covered DOY 1–322, whereas the 2005 extraction covered DOY 48–283. These date ranges define the available MODIS acquisitions used in the analysis.
Satellite-derived solar radiation was used in ALARM instead of ground-based measurements to evaluate its suitability as an alternative data source for model implementation in regions where reliable ground-based measurements are sparse or unavailable. Hourly and daily incoming solar radiation (Rs) for the Palmyra Oasis during the 2004 and 2005 growing seasons were obtained from the Solar Radiation Data (SoDa) database [39], which provides satellite-derived solar radiation products based on Meteosat geostationary satellite observations (EUMETSAT, Germany). SoDa estimates surface solar radiation using the Heliosat-2 algorithm, which is based on the statistical relationship between cloud cover and surface solar irradiance [40,41,42]. Hourly and daily solar radiation are derived by estimating cloud transmission from Meteosat observations using monthly reference maps of clear-sky and overcast surface reflectance (albedo), from which the cloud index and clear-sky index are subsequently calculated [41]. The Meteosat imagery used by the SoDa service has a temporal resolution of 15 min that enables the generation of hourly and daily solar radiation estimates, and a spatial resolution of approximately 3 km for the visible and infrared channels employed in solar radiation retrieval. Values were screened for data gaps and implausible values. The bias assessment of SoDa Rs is presented in Section 3.2.1. Daily meteorological observations collected during the study period provided the remaining model inputs: air temperature (Ta) and wind speed (u2), measured at a height of 2 m at the EC tower location using mercury-in-glass thermometers and a sonic anemometer, respectively.
2.5. Model Calibration and Validation
The ALARM contains several empirical and vegetation-related parameters that require parameterization. These parameters describe canopy architecture, aerodynamic properties, and turbulent transport processes, and include the transfer coefficient for foliage elements (CL), the characteristic leaf dimension (Lf), the leaf angle distribution parameter (g′), the canopy attenuation coefficient (b), the eddy diffusivity decay parameter (a), the zero-plane displacement height (d0), the momentum roughness length (z0), and the empirical coefficients m and n, which represent canopy structural characteristics and turbulence intensity, respectively [20].
A one-at-a-time sensitivity analysis was first performed to quantify the influence of each individual model parameter on seasonal ETa. Each parameter was varied independently by ±15%, ±30%, and ±50% relative to its default value, while all remaining parameters were held constant. The analysis was conducted using meteorological observations collected during the 2005 growing season together with radiation and vegetation information data extracted from the MODIS pixel covering the study area.
Model calibration was performed separately of the sensitivity analysis. The most adjustable parameters were optimized using a trial-and-error procedure. These parameters were adjusted individually within physically realistic ranges until the agreement between simulated and EC measured ETa was maximized. Calibration was carried out using the 2005 data, which was randomly selected from the available data. The resulting parameter values were subsequently applied, without further adjustment, to the 2004 data for model validation.
Model performance was evaluated using the coefficient of determination (R2), the root mean square error (RMSE), the normalized RMSE (NRMSE), the percent bias (PBIAS), and the Nash–Sutcliffe efficiency coefficient (NSE), which were defined as follows [43,44,45]:
where Oi and Pi are respectively the observed and model predicted values at time i, and are the respective mean values, and that n is the number of observations. In addition, the satellite-derived input variables (Rs, Rn, and H) were evaluated individually against EC measurements to quantify their accuracy and assess their contribution to the overall performance of the ALARM. Their performance was assessed using also a linear regression through the origin, for which the regression slope (b0) was used as an indicator of agreement between satellite-derived and EC measurements:
b0 values close to 1 indicate that the predicted values are statistically close to the observed ones; R2 values close to 1 indicate that the model explains well the variance of observations. RMSE and NRMSE values close to zero indicate small errors of estimate and good model predictions. Positive or negative PBIAS values refer to the occurrence of under- or over- estimation bias, respectively. NSE values close to 1 indicate that the mean square error is much smaller than the observed data variance, hence that model predictions are good; contrarily, when NSE is very close to 0 or negative this means that there is no gain in using the model, i.e., the mean is as good or better predictor than the model.
3. Results and Discussion
3.1. Sensitivity Analysis
Table 2 presents the results of the one-at-a-time sensitivity analysis, showing the effect of individual ALARM parameters on cumulative seasonal ETa. The 2005 dataset was selected for this analysis. Under the default parametrization, the model simulated a cumulative seasonal ETa of 575 mm, compared with 510 mm derived from the EC measurements over the same period, corresponding to an overestimation of approximately 12.7%. The perturbation analysis showed that the magnitude of the response varied substantially among parameters and depended on the direction and magnitude of the imposed changes. These results characterize the sensitivity of the model to individual parameter variations under the conditions investigated but do not account for potential interactions between parameters.
Table 2.
Sensitivity analysis of model parameters on seasonal actual evapotranspiration (ETa), expressed as percentage variation relative to the default model settings (0% variation).
Among the evaluated parameters, the transfer coefficient for foliage elements (CL), the eddy diffusivity decay parameter (a), and the canopy structural parameter (m) produced the largest changes in cumulative seasonal ETa. A 50% decrease in CL reduced aerodynamic resistance and increased cumulative seasonal ETa to 636 mm (+10.7%), whereas a 50% increase reduced ETa to 546 mm (−5.0%). Variations in a resulted in changes ranging from −8.8% to 7.6%, corresponding to seasonal ETa values of 524 and 618 mm under −50% and +50% perturbations, respectively. Similarly, variations in m resulted in changes ranging from −7.9% to 11%, corresponding to seasonal ETa values of 530 and 611 mm under −50% and +50% perturbations, respectively. The characteristic leaf dimension (Lf) and the canopy attenuation coefficient (b) generally had smaller effects. A 50% decrease in Lf reduced seasonal ETa to 562 mm (−2.3%), whereas a 50% increase raised it to 583 mm (+1.4%). Variations in b produced changes ranging from +5.7% (607 mm) to -1.7% (565 mm) under −50% and +50% perturbations, respectively. The zero-plane displacement height (d0), leaf angle distribution parameter (g′), and turbulence intensity parameter (n) had comparatively minor effects on seasonal ETa, with changes generally remaining within approximately ±5% even under ±50% perturbations. Overall, these results indicate that CL, a, and m were the most influential parameters for seasonal ETa in the selected pixel under the perturbations tested, whereas the remaining parameters produced comparatively smaller responses.
Figure 5 illustrates the effects of parameter perturbations on the minimum and maximum daily ETa values during the mid-season, relative to the default simulation. Consistent with the seasonal results, CL, a, and m produced the largest deviations in daily ETa, particularly under ±50% variations. The effects were generally more pronounced for the minimum daily ETa value, suggesting that the changes in seasonal ETa were primarily associated with variations in the amplitude of daily ETa fluctuations. The effects of g′ and b were generally smaller, while those of Lf, d0, and n were comparatively limited. For all parameters, the largest absolute differences occurred during the mid-season, when evapotranspiration and atmospheric evaporative demand were highest, whereas smaller differences were observed during the initial and late stages of the growing season. Overall, the one-at-the-time sensitivity analysis indicates that simulated daily and seasonal ETa was more responsive to changes in CL, a, and m than to changes in the other examined. However, because parameters were perturbed individually, these results do not quantify parameter interactions or establish a global ranking of parameter importance. The findings should therefore be interpreted as a comparative assessment of individual parameter sensitivity under the environmental conditions of the Palmyra Oasis, rather than as a comprehensive evaluation of parameter uncertainty or model robustness. Nevertheless, these results provide a useful indication of which parameters should be prioritized during model calibration, with particular attention to CL, a, and m, given their comparatively strong influence on simulated ETa under the conditions investigated.
Figure 5.
Effects of parameter perturbations (±15%, ±30%, and ±50%) on maximum (a) and minimum (b) daily actual evapotranspiration values relative to the default simulation.
Because the study plot comprised a mixture of trees with different heights, including olive trees (6 m), pomegranate trees (2–2.5 m), and date palms (12 m), an additional analysis was conducted to assess the influence of canopy-height uncertainty on ALARM estimates of ETa. The calibrated model parameters were kept unchanged, while canopy height was varied from 6 to 12 m. The average canopy height of 9 m, determined from field measurements, was used as the reference scenario. Simulated cumulative seasonal ETa decreased gradually from 597 mm (+3.8%) at a canopy height of 6 m to 575 mm at the reference height of 9 m and 556 mm (−3.3%) at 12 m. Despite this reduction, the relatively small changes indicate that ALARM is insensitive to realistic variations in canopy height within the range observed in the study plot.
3.2. Assessment of the Reliability of Satellite-Derived Inputs
To assess the reliability of the remotely sensed and model-derived energy-balance components used in the ALARM framework, incoming solar radiation (Rs), net radiation (Rn), and sensible heat flux (H) were evaluated with independent measurements from the EC tower. For the hourly analysis, the evaluation time was aligned with the MODIS satellite overpass time (approximately 11:00 local time) to ensure consistency between remotely sensed and EC observations. Rs was evaluated using a single SoDa-derived value representative of the study area, whereas Rn and H were assessed for the selected MODIS pixel.
3.2.1. Incoming Solar Radiation (Rs)
Figure 6 compares SoDa-derived and EC-measured Rs at the MODIS overpass time and on a daily average scale, while Figure 7 presents corresponding scatterplots of the paired data. The EC Rs represents direct measurements obtained from the pyranometer at the EC tower, whereas the SoDa Rs is derived from Meteosat observations using the Heliosat-2 retrieval approach [40,41,42]. Consequently, uncertainties in cloud detection, atmospheric transmission, and satellite retrievals may contribute to the noted differences between SoDa estimates and ground measurements [41,46].
Figure 6.
Comparison of EC-measured and SoDa-derived incoming solar radiation (Rs) during the simulation period at the hourly satellite overpass time (11:00 local time) and daily average scale.
Figure 7.
Scatterplots comparing EC-measured and SoDa-derived incoming solar radiation Rs at the hourly satellite overpass time (11:00 local time) and on a daily average basis, before (a,c) and after (b,d) bias correction.
At the MODIS overpass time (Figure 7a), SoDa and EC Rs showed relatively good agreement (R2 = 0.81; RMSE = 102.5 W m−2), with a modest positive PBIAS of 7.34%, indicating a slight underestimation by SoDa. The regression slope (b0) of 1.09 was relatively close to unity, although greater discrepancies were observed at lower radiation values. The SoDa estimates also reproduced the seasonal pattern observed by the EC pyranometer. At the daily scale, (Figure 7c) the temporal correspondence improved (R2 = 0.96; RMSE = 40.4 W m−2), indicating that aggregation reduced short-term discrepancies. However, b0 increased to 1.16 and PBIAS became increasingly positive (13.13%), indicating a greater systematic underestimation of daily Rs. This suggests that temporal aggregation reduced random deviations but did not eliminate persistent differences between the satellite-derived and ground-measured radiation. Such differences may arise from variations in cloud cover and atmospheric transmissivity, as well as the contrasting spatial representativeness of the two datasets [41,47,48].
Overall, the SoDa product reproduced the temporal variability of Rs well, particularly at the daily scale, but showed a systematic tendency to underestimate Rs relative to the EC measurements. Although the systematic bias was corrected, as shown in Figure 6 and Figure 7b,d, this correction did not improve the estimation of ETa, as discussed in Section 3.3.2. The results therefore support the use of SoDa-derived Rs within the ALARM framework while highlighting the potential influence of spatial and temporal representativeness on the radiation estimates.
3.2.2. Net Radiation (Rn)
At the MODIS overpass time, the comparison between MODIS-derived and EC-measured Rn showed moderate temporal agreement (Figure 8). The R2 value was 0.73 (Figure 9), while RMSE values was 39.68 W m−2. Positive PBIAS values (3.98%) indicated a small underestimation of Rn by MODIS relative to the EC measurements. This tendency was also reflected in the b0 value (1.04). The temporal profile further showed that the MODIS-derived estimates generally reproduced the seasonal evolution of Rn, although they tended to remain below the EC measurements, particularly during periods of relatively high net radiation.
Figure 8.
Comparison of MODIS-derived and EC-measured net radiation (Rn) at MODIS overpass time (approximately 11:00) and daily scale.
Figure 9.
Scatterplots comparing MODIS-derived and EC-measured net radiation (Rn) at the hourly satellite overpass time (11:00 local time) and on a daily average basis, before (a,c) and after (b,d) bias correction.
At the daily timescale, the temporal correspondence between MODIS-derived and EC-measured Rn improved substantially compared with that observed at the MODIS overpass time (Figure 8). The R2 value increased to 0.90, indicating a strong correspondence in the day-to-day variability of Rn. This higher R2 indicated that the daily scaling procedure reproduced the temporal variability of Rn more closely than the instantaneous estimates. However, the improvement in temporal correspondence should be distinguished from accuracy in terms of magnitude as the systematic bias increased at the daily scale. The regression slope b0 increased to 1.09, while PBIAS increased to 9.57%, confirming that the MODIS-derived Rn remained systematically lower than the EC measurements and that the relative underestimation was more pronounced at the daily scale.
Overall, the results demonstrate that daily aggregation substantially improved the correspondence between MODIS-derived and EC-measured Rn, with R2 increasing from 0.73 at the MODIS overpass time to 0.90 at the daily scale. This result is broadly consistent with previous approaches in which instantaneous observations were used to infer the diurnal variation in surface radiation and estimate daily net radiation [49,50]. However, the simultaneous increase in PBIAS and regression slopes greater than unity indicates that the improvement in temporal correspondence was not accompanied by an improvement in the magnitude of the estimates. Instead, the MODIS-derived Rn remained systematically lower than the EC measurements, with the relative underestimation becoming more pronounced at the daily scale. This underestimation may be partly explained by the underestimation of incoming solar radiation in the SoDa products, which propagates into the estimation of net shortwave radiation and, consequently, Rn. In addition, uncertainties in surface albedo, land surface and air temperatures, and emissivity can propagate into the estimation of Rn. Differences in spatial representativeness between the MODIS pixel and the EC footprint may also contribute to the observed discrepancies [49,50]. In Section 3.3.2, the impacts of error propagation and Rn bias-correction on ETa estimates are discussed.
3.2.3. Sensible Heat Flux (H)
Sensible heat flux (H) was evaluated as a diagnostic assessment of the ALARM aerodynamic-temperature formulation, which provides an important basis estimating the dimensionless temperature (∆T) used in ETa estimation (Equation (11)). In ALARM, Ts is converted to Ti, which is subsequently used to estimate H under the prevailing surface and atmospheric conditions [19,20]. Under the assumption that the relevant heat-transfer denominator varies only slightly as the surface temperature changes from Ti to Tmax, ΔT represents the fraction of available energy partitioned into sensible heat, while (1 − ΔT) represents the fraction partitioned into latent heat [19]. This relationship provides a physical link between the aerodynamic-temperature formulation and energy partitioning in ALARM, while distinguishing the independently calculated H values evaluated here (Equation (2)) from the dimensionless temperature used in ETa estimation (Equation (12)).
The H values evaluated in this section were calculated independently using the main sensible heat flux equation (Equation (2)), replacing the surface temperature with the aerodynamic temperature, Ti, computed by ALARM, and applying the same calibrated parameters used for ETa estimation (Section 3.3.1). Thus, comparison of ALARM-derived H with independent EC measurements provides an assessment of the ability of the aerodynamic-temperature formulation to represent sensible heat exchange. This evaluation also helps identify the potential influence of uncertainties in remotely sensed surface temperature and other meteorological and surface parameters on the estimation of H.
As shown in Figure 10, the correspondence between ALARM-derived and EC-measured H was substantially weaker than that obtained for Rn. The R2 value was 0.22, indicating weak correspondence in the temporal variability of H. RMSE reached 112.61 W m−2, while PBIAS and b0 were −9.28 and 0.84, indicating a general tendency for ALARM estimates to underestimate H relative to the EC measurements. The temporal profile in Figure 10 shows that ALARM captured some of the broader seasonal behavior of H, but substantial discrepancies remained, particularly during periods of greater variability.
Figure 10.
Seasonal variation and statistical comparison of ALARM-derived and eddy Covariance (EC)-measured sensible heat flux (H) at the MODIS overpass time.
The relatively weak correspondence observed in the present study may partly reflect the sensitivity of the ALARM-derived H to uncertainties in radiometric surface temperature and other model inputs. In the ALARM formulation, uncertainties in the radiometric surface temperature propagate through its conversion to aerodynamic temperature and subsequently affect the estimated sensible heat flux. This sensitivity is particularly important because, as demonstrated by Suleiman and Crago. [18], relatively small errors in aerodynamic temperature can result in substantial errors in H; under typical conditions, an error of 1 K in aerodynamic temperature was associated with an error of approximately 54 W m−2 in H [51]. Therefore, additional error propagation tests were conducted to assess the effects of uncertainties in Ts and Ti on ETa estimates (Section 3.3.2). More generally, difficulties in estimating H from remotely sensed surface temperature have been attributed to uncertainties in surface–atmosphere transfer processes and aerodynamic resistance [31,52]. These studies provide a physical basis for interpreting the discrepancies observed here, although they did not specifically evaluate the ALARM formulation used in the present study.
The relatively low R2 values obtained in the present study also contrast with the stronger correspondence reported in previous evaluations of ALARM. Suleiman et al. [18] reported R2 greater than 0.5 for ALARM-derived H in their evaluation, and Suleiman and Crago [53] subsequently reported R2 values between 0.85 and 0.93 for the additional sites when comparing ALARM estimates with measured H. In one of the sites, ALARM was evaluated over a relatively dense and short grass canopy, with an LAI of approximately 4.0 m2 m−2 and canopy height of about 0.6 m, using observations collected over a broad daytime period rather than at a single observation time. In contrast, the present study involves the substantially taller and more heterogeneous vegetation structure of the Palmyra Oasis and evaluates ALARM-derived H only at approximately 11:00 local time to coincide with the MODIS overpass. This restricted temporal sampling limits the range of atmospheric and surface conditions represented in the comparison and may therefore reduce the apparent temporal correspondence between estimates and observations. Consequently, the lower R2 values should be interpreted as an assessment of ALARM performance under the specific conditions represented by the MODIS overpass rather than as a comprehensive evaluation of its daytime performance.
Differences in land-surface characteristics may provide an additional explanation for the contrasting performance. Rahman and Zhang [54] reported substantial differences in the performance of MODIS-derived sensible heat flux among alpine grassland, cropland, and mixed forest, with larger discrepancies over mixed forest partly associated with vegetation heterogeneity and complex aerodynamic and thermodynamic conditions. This is particularly relevant to the Palmyra Oasis, where tall date palms, shorter olive trees, and exposed soil occur within the study area, resulting in substantial variation in canopy structure and height. Such heterogeneity may increase spatial variability in the thermal and aerodynamic conditions represented within the MODIS pixels and may contribute to the weaker correspondence between ALARM-derived and EC-measured H.
Finally, differences in spatial representativeness may further contribute to the observed discrepancies. Zheng et al. [55] showed that H measurements obtained using different observational approaches can differ because they represent different spatial scales and sampling characteristics. In the present study, each MODIS pixel represents an area of approximately 500 × 500 m, whereas the EC system integrates turbulent fluxes over a dynamically varying footprint whose extent and location depend on atmospheric and surface conditions. Consequently, the MODIS pixel and the EC footprint may not represent identical surface conditions, particularly in the heterogeneous Palmyra Oasis. This spatial mismatch may introduce additional scaling and representativeness errors. Together with the restricted 11:00 sampling and uncertainties in surface temperature and aerodynamic parameters, these factors provide plausible explanation for the relatively weak temporal correspondence observed between ALARM-derived and EC-measured H.
3.3. Assessment of Actual Evapotranspiration Estimates
3.3.1. Model Performance
Table 3 presents the calibrated values of the four adjustable ALARM parameters obtained using the trial-and-error calibration procedure. Following the sensitivity analysis, calibration focused on the most sensitive parameters (CL, m, and a) and on Lf, which showed moderate sensitivity. The sensitivity analysis indicated that ALARM estimates varied relatively little in response to moderate changes in parameter values. Consequently, during model calibration, except for CL, only moderate adjustments relative to the default parameters were required to reduce the discrepancies between ALARM-estimated and EC-measured ETa. This behavior is consistent with previous evaluations of ALARM, which showed that generalized parameter values can provide sensible heat flux estimates comparable to those obtained through site-specific calibration [18,56,57], and with recent results reported for orchards [23]. These findings support the use of generalized parameter values in ALARM while also indicating that limited site-specific calibration should be used to improve model performance.
Table 3.
Calibrated model parameters.
Figure 11 compares daily ETa simulated by ALARM with EC measurements for the 2005 calibration and 2004 validation seasons, while Table 4 presents the corresponding goodness-of-fit indicators. Overall, ALARM reproduced the main seasonal dynamics of ETa in both years. Both simulated and measured time series showed a gradual increase in evapotranspiration from the beginning of the growing season, maximum values during mid-season, and a subsequent decline toward the end of the season. The statistical evaluation further confirms the relatively consistent model performance in both seasons. R2 value ranged from 0.73 to 0.78, indicating that the model explained most of the observed temporal variability in ETa. RMSE and NRSME values varied were similarly in both years (0.72–0.73 mm d−1; 27.11–28.16%). NSE values were also similar in both years (0.33–0.34), indicating positive, although relatively weak, predictive skill relative to using the mean observed ETa as a reference. PBIAS ranged from 2.24% to 12.40%, indicating relatively small systematic differences between simulated and EC-measured ETa. Nevertheless, these values, particularly NRMSE values, find comparison with those reported in the literature for orchard systems using similar one source energy balance models (Table 5).
Figure 11.
Comparison between ALARM-simulated and eddy Covariance-measured daily actual evapotranspiration (ETa) during the 2005 calibration and 2004 validation seasons.
Table 4.
Statistical performance of the ALARM in estimating daily actual evapotranspiration (ETa) during the 2005 calibration and 2004 validation seasons.
Table 5.
Summary of daily-scale statistical performance indicators reported in the literature for different single-source energy balance models applied to orchards.
3.3.2. Error Propagation and Sensitivity Tests
Despite the good representation of the seasonal pattern, the magnitude of ETa showed a systematic seasonal bias. During the early growing season (approximately DOY 50–150), ALARM generally overestimated ETa, whereas during the peak growing season (approximately DOY 170–240), it tended to underestimate ETa. Agreement generally improved during the late season. These changes in bias coincided with seasonal changes in Rn-G, H, Ts-Ta, and ∆T, suggesting that the discrepancies were associated with changes in the radiative and thermal conditions underlying the temperature-based estimation of ETa. To investigate the potential sources of these discrepancies, Table 6 summarizes a series of error-propagation and sensitivity tests designed to assess the influence of different sources of uncertainty on ALARM-estimated ETa. The default simulation used only local measurements of Ts and Rn obtained at the EC tower as inputs to ALARM.
Table 6.
Error propagation and sensitivity tests on ALARM error estimates of daily actual evapotranspiration (ETa).
During the early season, the higher ALARM estimates occurred when surface thermal conditions showed greater temporal variability. ALARM also underestimated H during this period. However, this H bias cannot be considered a direct cause of the ETa overestimation because ALARM does not calculate ETa as the residual of Rn-G-H. Instead, ETa is derived using the dimensionless-temperature approach (Equation (11)), which incorporates Ts, Ti, Ta, Tmax, ∆T, and evaporative fraction (EF). The mean ∆T was approximately 0.37 during the early period, increasing to 0.42 later in the season (Figure 12). According to Suleiman and Al-Bakri [20], values around 0.35–0.40 are generally associated with potential ET conditions, whereas substantially lower values may indicate sensible heat advection. The lower early-season ∆T, together with the observed changes in Ts-Ta, therefore, indicates a different thermal regime that may have affected the temperature-based estimation of ETa. The underestimation of Rn identified in the previous section may also have contributed to uncertainty in the estimates, although the early-season ETa overestimation indicates that radiative bias alone cannot explain the observed discrepancy. This is further supported by the results obtained using bias-corrected SoDa-derived Rs data from 2005 (Figure 6), which led to an overestimation of Rn and ETa and increased the estimation error (Table 6), with an RMSE of 0.79 mm d−1 and an NRMSE of 30.74%. Applying bias correction directly to Rn (Figure 8), rather than correcting Rs first and propagating the correction through the energy balance calculations, improved the results (Table 6). Nevertheless, the error in the ETa estimates remained similar to that obtained using the original, uncorrected Rn values (RMSE = 0.73 mm d−1; NRMSE = 28.16%).
Figure 12.
Temporal variation in (a) temperature Ts, Ti, Ta and Tmax (b) surface–air temperature difference (Ts − Ta), (c) dimensionless temperature difference (ΔT), and (d) evaporative fraction (EF). Values within squares correspond to the means of the indicated periods.
During the peak growing season, ALARM tended to underestimate ETa despite higher evaporative demand and available energy. Mean ∆T increased to approximately 0.42, indicating a shift in the thermal conditions governing the temperature-based partitioning of energy. The concurrent seasonal changes in available energy (Rn -G) and Ts-Ta are consistent with a change in the surface and atmospheric conditions under which the model estimated evaporative fraction. These changes may have contributed to the lower ETa estimates during the peak period.
The different behavior of H and daily ETa further supports this interpretation. H was evaluated at the MODIS overpass time, whereas ETa represents daily accumulated evapotranspiration; consequently, a bias in H at a single time does not necessarily translate into a corresponding daily ETa bias. The two variables are also estimated using different formulations within ALARM. The similar seasonal variability of H and ETa, together with the changes in Ts-Ta, indicates that they respond to common changes in surface thermal conditions, but their different bias directions demonstrate that H alone cannot be used to explain the seasonal ETa discrepancies.
Table 6 further shows that relatively small errors of ±1 and ±2 K in surface temperature (Ts), as derived from MODIS, can substantially affect ETa estimates, increasing the RMSE by up to 15.1%. Errors in Ti also have a significant impact on ETa estimates. Soil heat flux (G), on the other hand, was not independently validated against EC measurements because ALARM estimates G using a simplified empirical relationship based on fractional ground cover at the time of the MODIS overpass, following an approach similar to that used in SEBS [54]. The model assumes that, at the daily scale, G makes a negligible contribution to the surface energy balance. Although this assumption appears reasonable for the orchard system studied, Table 6 shows a slight improvement in ETa estimates when G is accounted for in the daily energy balance, with the RMSE decreasing to 0.70 mm d−1.
Spatial and temporal scaling may provide an additional source of uncertainty, as also observed by Darouich et al. [23] in orchards of southern Portugal. At 500-m resolution, MODIS pixels integrate heterogeneous combinations of vegetation and soil surfaces, which are particularly relevant in the Palmyra Oasis given differences in canopy structure, crop type, plant height, and soil exposure. The EC footprint is also spatially variable and does not necessarily coincide with an individual MODIS pixel. This mismatch can contribute to differences between remotely sensed and EC-derived fluxes and may be particularly important during periods of rapid changes in canopy development and surface conditions. It may also help explain why ALARM reproduced the seasonal signal more effectively than short-term day-to-day variability.
Overall, the component-wise evaluation indicates that the ETa discrepancies cannot be attributed to a single model input or energy-balance component. The results suggest that seasonal changes in available energy and surface thermal conditions, reflected in Rn-G, Ts-Ta, and ∆T, contributed to the change from early-season overestimation to peak-season underestimation. Nevertheless, the model captured the overall seasonal behavior of ETa reasonably well but had more limited ability to reproduce its full magnitude and short-term variability.
4. Conclusions
This study evaluated the performance of the Analytical Land–Atmosphere Radiometer Model (ALARM) for estimating actual evapotranspiration (ETa) in the arid environment of the Palmyra Oasis, Syria, using eddy covariance (EC) measurements for calibration and validation. ALARM reproduced the main seasonal dynamics of ETa, with daily RMSE values of 0.73 and 0.72 mm d−1 for the calibration and validation seasons, respectively. However, the relatively low NSE values and the seasonal variation in estimation bias indicate limitations in reproducing the full magnitude and short-term variability of ETa.
Evaluation of the individual model components and additional error-propagation tests provided insight into the uncertainties affecting ETa estimates. SoDa-derived incoming solar radiation (Rs) showed reasonable agreement with EC measurements, supporting its use where ground-based or remotely sensed radiation data are unavailable or limited. MODIS-derived net radiation (Rn) reproduced the observed temporal variability but consistently underestimated its magnitude. Agreement for instantaneous sensible heat flux (H) was weaker, highlighting uncertainty in the representation of sensible heat exchange and the aerodynamic-temperature formulation. Nevertheless, the weaker correspondence for instantaneous H did not translate directly into equivalent errors in daily ETa. The two variables represent different temporal scales and aspects of model performance, and their agreement should therefore be interpreted separately. Correcting biases in the input data did not improve ETa estimates, suggesting that input biases alone cannot explain the observed discrepancies and that limitations in the model formulation may also contribute.
From a water-management perspective, the findings are relevant to arid agricultural regions of Syria, where irrigation is essential, water resources are constrained, and field observations of crop water consumption are scarce. ALARM offers a potential means of exploiting satellite observations to estimate ETa under such conditions. However, its moderate estimation accuracy and the uncertainties identified in the model components indicate that further evaluation is needed before operational application. Future work should investigate the transferability of the approach across different crops, surface conditions, and climatic settings, while improving the assessment of the aerodynamic-temperature formulation and its contribution to ETa uncertainty. Such efforts would help establish the suitability of ALARM for supporting agricultural water-consumption monitoring in data-scarce arid environments.
Author Contributions
Conceptualization, B.D., I.J. and H.D.; methodology, B.D.; software, B.D., A.R.O. and H.D.; validation, B.D. and H.D.; investigation, B.D. and Y.I.; writing—original draft preparation, B.D., T.B.R. and H.D.; writing—review and editing, I.J., A.R.O., T.B.R. and H.D. All authors have read and agreed to the published version of the manuscript.
Funding
This work was funded by national funds through the FCT, Fundação para a Ciência e a Tecnologia, I.P., under projects UIDB/50009/2025, UIDP/50009/2025 and LA/P/0083/2020 of LARSyS.
Data Availability Statement
The raw flux and meteorological data used in this study were originally reported by Brunner et al. [2,4] and no new field data were collected. Because these original data were obtained from a previously published source, they are not redistributed here. MODIS-derived variables generated for the present analysis, as well as the scripts used for MODIS data extraction and processing, are available from the corresponding author upon reasonable request.
Acknowledgments
During the preparation of this manuscript/study, the author(s) used GPT-5.6 Luna for the purposes of correcting English grammar. The authors have reviewed and edited the output and take full responsibility for the content of this publication.
Conflicts of Interest
The authors declare no conflicts of interest.
References
- Aw-Hassan, A.; Rida, F.; Telleria, R.; Bruggemann, A. The impact of food and agricultural policies on groundwater use in Syria. J. Hydrol. 2014, 513, 204–215. [Google Scholar] [CrossRef] [Scilit]
- AQUASTAT-FAO’s Global Information System on Water and Agriculture. Available online: https://www.fao.org/aquastat/en/ (accessed on 16 October 2026).
- Jnad, I.; Brunel, J.P.; Droubi, A. Comparing eddy covariance and soil water balance methods for evapotranspiration measurement in Palmyra Oasis in Syria. Arab Gulf J. Sci. Res. 2006, 24, 131–137. [Google Scholar]
- Oweis, T.Y.; Farahani, H.J.; Hachum, A.Y. Evapotranspiration and water use of full and deficit irrigated cotton in the Mediterranean environment in northern Syria. Agric. Water Manag. 2011, 98, 1239–1248. [Google Scholar] [CrossRef] [Scilit]
- Darouich, H.; Gonçalves, J.M.; Muga, A.; Pereira, L.S. Water saving vs. farm economics in cotton surface irrigation: An application of multicriteria analysis. Agric. Water Manag. 2012, 115, 223–231. [Google Scholar] [CrossRef] [Scilit]
- Allen, R.G.; Pereira, L.S.; Howell, T.A.; Jensen, M.E. Evapotranspiration information reporting: I. Factors governing measurement accuracy. Agric. Water Manag. 2011, 98, 899–920. [Google Scholar] [CrossRef] [Scilit]
- Allen, R.G.; Pereira, L.S.; Howell, T.A.; Jensen, M.E. Evapotranspiration information reporting: II. Recommended documentation. Agric. Water Manag. 2011, 98, 921–929. [Google Scholar] [CrossRef] [Scilit]
- Barcza, Z.; Kern, A.; Haszpra, L.; Kljun, N. Spatial representativeness of tall tower eddy covariance measurements using remote sensing and footprint analysis. Agric. For. Meteorol. 2009, 149, 795–807. [Google Scholar] [CrossRef] [Scilit]
- Tran, B.N.; Van Der Kwast, J.; Seyoum, S.; Uijlenhoet, R.; Jewitt, G.; Mul, M. Uncertainty assessment of satellite remote-sensing-based evapotranspiration estimates: A systematic review of methods and gaps. Hydrol. Earth Syst. Sci. 2023, 27, 4505–4528. [Google Scholar] [CrossRef] [Scilit]
- Yi, K.; Senay, G.B.; Fisher, J.B.; Wang, L.; Suvočarev, K.; Chu, H.; Moore, G.W.; Novick, K.A.; Barnes, M.L.; Keenan, T.F.; et al. Challenges and future directions in quantifying terrestrial evapotranspiration. Water Resour. Res. 2024, 60, e2024WR037622. [Google Scholar] [CrossRef] [Scilit]
- Bastiaanssen, W.G.M.; Menenti, M.; Feddes, R.A.; Holtslag, A.A.M. A remote sensing surface energy balance algorithm for land (SEBAL): Part 1 formulation. J. Hydrol. 1998, 212–213, 198–212. [Google Scholar] [CrossRef] [Scilit]
- Bastiaanssen, W.G.M.; Pelgrum, H.; Wang, J.; Ma, Y.; Moreno, J.; Roerink, G.J.; van der Wal, T. The surface energy balance algorithm for land (SEBAL): Part 2 validation. J. Hydrol. 1998, 212–213, 213–229. [Google Scholar]
- Bastiaanssen, W.G.M.; Noordman, E.J.M.; Pelgrum, H.; Davids, G.; Thoreson, B.P.; Allen, R.G. SEBAL model with remotely sensed data to improve water resources management under actual field conditions. J. Irrig. Drain. Eng. 2005, 131, 85–93. [Google Scholar] [CrossRef] [Scilit]
- Allen, R.G.; Tasumi, M.; Trezza, R. Satellite-based energy balance for mapping evapotranspiration with internalized calibration (METRIC)—Model. J. Irrig. Drain. Eng. 2007, 133, 380–394. [Google Scholar] [CrossRef] [Scilit]
- Allen, R.G.; Tasumi, M.; Morse, A.; Trezza, R.; Wright, J.L.; Bastiaanssen, W.; Kramber, W.; Lorite, I.; Robison, C.W. Satellite-based energy balance for mapping evapotranspiration with internalized calibration (METRIC)—Applications. J. Irrig. Drain. Eng. 2007, 133, 395–406. [Google Scholar] [CrossRef] [Scilit]
- Long, D.; Singh, V.P.A. A modified surface energy balance algorithm for land (M-SEBAL) based on a trapezoidal framework. Water Resour. Res. 2012, 48, W02528. [Google Scholar] [CrossRef] [Scilit]
- Suleiman, A.A.; Crago, R.D. Analytical land atmosphere radiometer model. J. Appl. Meteorol. 2002, 41, 177–187. [Google Scholar] [CrossRef] [Scilit]
- Suleiman, A.A.; Crago, R.D. Analytical land atmosphere radiometer model (ALARM) applied to a dense canopy. Agric. For. Meteorol. 2002, 112, 151–159. [Google Scholar] [CrossRef] [Scilit]
- Suleiman, A.; Al-Bakri, J.; Duqqah, M.; Crago, R. Intercomparison of evapotranspiration estimates at the different ecological zones in Jordan. J. Hydrometeorol. 2008, 9, 903–919. [Google Scholar] [CrossRef] [Scilit]
- Suleiman, A.; Al-Bakri, J. Estimating Actual Evapotranspiration using ALARM and the Dimensionless Temperature. In Evapotranspiration; Labedzki, L., Ed.; Intechopen: London, UK, 2011; pp. 1–34. [Google Scholar]
- Owaneh, O.; Suleiman, A. Comparison of the Performance of ALARM and SEBAL in Estimating the Actual Daily ET from Satellite Data. J. Irrig. Drain. Eng. 2019, 144, 9. [Google Scholar] [CrossRef] [Scilit]
- Asadi, M.; Kamran, K.V. Comparison of SEBAL, METRIC, and ALARM algorithms for estimating actual evapotranspiration of wheat crop. Theor. Appl. Climatol. 2022, 149, 327–337. [Google Scholar] [CrossRef] [Scilit]
- Darouich, H.; Derdar, B.; Oliveira, A.R.; Ramos, T.B. Estimating Actual Evapotranspiration in Orchard Systems Using the ALARM Energy Balance Model and MODIS Data. Remote Sens. 2026, 18, 2351. [Google Scholar] [CrossRef] [Scilit]
- Brunel, J.P.; Ihab, J.; Droubi, A.M.; Samaan, S. Energy budget and actual evapotranspiration of an arid oasis ecosystem: Palmyra (Syria). Agric. Water Manag. 2006, 84, 213–220. [Google Scholar] [CrossRef] [Scilit]
- Köppen, W. Das geographische System der Klimate. In Handbuch der Klimatologie; Gebrüder Borntraeger: Berlin, Germany, 1936; Volume 1, 44p. [Google Scholar]
- Allen, R.G.; Pereira, L.S.; Raes, D.; Smith, M. Crop Evapotranspiration—Guidelines for Computing Crop Water Requirements; Irrigation & Drainage Paper 56; Food and Agriculture Organization of the United Nations (FAO): Rome, Italy, 1998. [Google Scholar]
- Pereira, L.S.; Allen, R.G.; Paredes, P.; López-Urrea, R.; Raes, D.; Smith, M.; Kilic, A.; Salman, M. Crop Evapotranspiration—Guidelines for Computing Crop Water Requirements, 2nd ed.; FAO Irrigation & Drainage Paper 56 revised; Food and Agriculture Organization of the United Nations (FAO): Rome, Italy, 2025. [Google Scholar] [CrossRef] [Scilit]
- Samaan, S. Determining the Evaporative Spill of the Palmyra Oasis Using the Energy Balancing Method—An Analytical and Experimental Study. Master’s Thesis, Faculty of Civil Engineering, Al-Baath University and the Arab Center for the Studies of Arid Zones and Dry Lands (ACSAD), Damascus, Syria, 2005. [Google Scholar]
- Baldocchi, D.D. Assessing the eddy covariance technique for evaluating carbon dioxide exchange rates of ecosystems: Past, present and future. Glob. Change Biol. 2003, 9, 479–492. [Google Scholar] [CrossRef] [Scilit]
- Brutsaert, W. Evaporation into the Atmosphere: Theory, History, and Applications; Springer: Dordrecht, The Netherlands, 1982; p. 299. [Google Scholar]
- Su, Z. The Surface Energy Balance System (SEBS) for estimation of turbulent heat fluxes. Hydrol. Earth Syst. Sci. 2002, 6, 85–100. [Google Scholar] [CrossRef] [Scilit]
- Stull, R.B. An Introduction to Boundary Layer Meteorology; Springer: Dordrecht, The Netherlands, 1998; p. 666. [Google Scholar]
- Suleiman, A.A.; Crago, R.D. Hourly and daytime evapotranspiration from grassland using radiometric surface temperatures. Agronomy 2004, 96, 384–390. [Google Scholar] [CrossRef] [Scilit]
- Crago, R.D. Radiometric and equivalent isothermal surface temperatures. Water Resour. Res. 1998, 34, 3017–3023. [Google Scholar] [CrossRef] [Scilit]
- Roerink, G.L.; Su, Z.; Menenti, M. S-SEBI: A simple remote sensing algorithm to estimate the surface energy balance. Phys. Chem. Earth B 2000, 25, 147–157. [Google Scholar] [CrossRef] [Scilit]
- EARTHDATA. Product ID: MODIS/061/MOD11A1. Available online: https://doi.org/10.5067/MODIS/MOD11A1.061 (accessed on 19 October 2026). [CrossRef]
- EARTHDATA. Product ID: MODIS/061/MCD15A3H. Available online: https://doi.org/10.5067/MODIS/MCD15A3H.061 (accessed on 19 October 2026). [CrossRef]
- EARTHDATA. Product ID: MODIS/061/MCD43A3. Available online: https://doi.org/10.5067/MODIS/MCD43A3.061 (accessed on 19 October 2026). [CrossRef]
- Wald, L.; Albuisson, M.; Best, C.; Delamare, C.; Dumortier, D.; Gaboardi, E.; Hammer, A.; Heinnemann, D.; Kift, R.; Kunz, S.; et al. SoDa: A project for the integration and exploitation of networked solar radiation databases. In Environmental Communication in the Information Society; Pillmann, W., Tochtermann, K., Eds.; International Society for Environmental Protection: Vienna, Austria, 2002; pp. 713–720. [Google Scholar]
- Rigollier, C.; Lefèvre, M.; Wald, L. The method Heliosat-2 for deriving shortwave solar radiation from satellite images. Sol. Energy 2004, 77, 159–169. [Google Scholar] [CrossRef] [Scilit]
- Rigollier, C.; Bauer, O.; Wald, L. On the clear sky model of the ESRA–European Solar Radiation Atlas with respect to the Heliosat method. Sol. Energy 2000, 68, 33–48. [Google Scholar] [CrossRef] [Scilit]
- Lefèvre, M.; Diabaté, L.; Wald, L. Using reduced data sets ISCCP-B2 from the Meteosat satellites to assess surface solar irradiance: The HelioClim-1 database. Sol. Energy 2007, 81, 240–253. [Google Scholar] [CrossRef] [Scilit]
- Nash, J.E.; Sutcliffe, J.V. River flow forecasting through conceptual models part I—A discussion of principles. J. Hydrol. 1970, 10, 282–290. [Google Scholar] [CrossRef] [Scilit]
- Moriasi, D.N.; Arnold, J.G.; Van Liew, M.W.; Bingner, R.L.; Harmel, R.D.; Veith, T.L. Model evaluation guidelines for systematic quantification of accuracy in watershed simulations. Trans. ASABE 2007, 50, 885–900. [Google Scholar] [CrossRef] [Scilit]
- Legates, D.; McCabe, G. Evaluating the use of goodness of fit measures in hydrologic and hydroclimatic model validation. Water Resour. Res. 1999, 35, 233–241. [Google Scholar] [CrossRef] [Scilit]
- Ineichen, P. Comparison of eight clear sky broadband models against 16 independent data banks. Sol. Energy 2006, 80, 468–478. [Google Scholar] [CrossRef] [Scilit]
- Hakuba, M.Z.; Folini, D.; Sanchez-Lorenzo, A.; Wild, M. Spatial representativeness of ground-based solar radiation measurements—Extension to the full Meteosat disk. J. Geophys. Res. Atmos. 2014, 119, 11760–11771. [Google Scholar] [CrossRef] [Scilit]
- Ineichen, P.; Perez, R. A new airmass independent formulation for the Linke turbidity coefficient. Sol. Energy 2002, 73, 151–157. [Google Scholar] [CrossRef] [Scilit]
- Bisht, G.; Venturini, V.; Islam, S.; Jiang, L. Estimation of the net radiation using MODIS data for clear sky days. Remote Sens. Environ. 2005, 97, 52–67. [Google Scholar] [CrossRef] [Scilit]
- Bisht, G.; Bras, R.L. Estimation of net radiation from the MODIS data under all sky conditions: Southern Great Plains case study. Remote Sens. Environ. 2010, 114, 1522–1534. [Google Scholar] [CrossRef] [Scilit]
- Hall, F.; Sellers, P.J.; Strebel, D.; Kanemasu, E.; Kelly, R.; Blad, B.; Markham, B.; Wang, J.; Huemmrich, F. Satellite remote sensing of surface energy and mass balance results: Results from FIFE. Remote Sens. Environ. 1991, 35, 187–199. [Google Scholar] [CrossRef] [Scilit]
- Kustas, W.P.; Norman, J.M. Use of remote sensing for evapotranspiration monitoring over land surfaces. Hydrol. Sci. J. 1996, 41, 495–516. [Google Scholar] [CrossRef] [Scilit]
- Suleiman, A.; Crago, R. Analytical Land-Atmosphere Radiometer Model (ALARM) applied to canopies of varied density. In Advances in Remote Sensing Science and Technology, Proceedings of the 30th International Symposium on Remote Sensing of Environment: Information for Risk Management and Sustainable Development, Honolulu, HI, USA, 10–14 November 2003; NOAA: Fort Fisher, NC, USA, 2003; p. 174. [Google Scholar]
- Rahman, M.M.; Zhang, W. Validation of satellite-derived sensible heat flux for TERRA/MODIS images over three different landscapes using large aperture scintillometer and eddy covariance measurements. IEEE J. Sel. Top. Appl. Earth Obs. Remote Sens. 2019, 12, 3327–3337. [Google Scholar] [CrossRef] [Scilit]
- Zheng, C.; Liu, S.; Song, L.; Xu, Z.; Guo, J.; Ma, Y.; Ju, Q.; Wang, J. Comparison of sensible and latent heat fluxes from optical-microwave scintillometers and eddy covariance systems with respect to surface energy balance closure. Agric. For. Meteorol. 2023, 331, 109345. [Google Scholar] [CrossRef] [Scilit]
- Zibognon, M.; Crago, R.; Suleiman, A. Conversion of radiometric to aerodynamic surface temperature with an anisothermal canopy model. Water Resour. Res. 2002, 38, 3-1–3-6. [Google Scholar] [CrossRef] [Scilit]
- Crago, R.D.; Suleiman, A. Heat flux parameterization for sparse and dense grasslands with the Analytical Land-Atmosphere Radiometer Model (ALARM). Bound.-Layer Meteorol. 2005, 114, 557–572. [Google Scholar] [CrossRef] [Scilit]
- Xue, J.; Fulton, A.; Kisekka, I. Evaluating the role of remote sensing-based energy balance models in improving site-specific irrigation management for young walnut orchards. Agric. Water Manag. 2021, 256, 107132. [Google Scholar] [CrossRef] [Scilit]
- Cigarra-Guíñez, L.E.; Lagos, O.; Steduto, P.; Krogh, S.A.; Shapiro, K.; Souto, C.; Lillo-Saavedra, M.; Balbontín, C.; Zaccaria, D. Enhancing evapotranspiration estimates in orchards with the Surface Energy Balance for Partially Vegetated surfaces (SEB-PV) model through combined use of gridded soil moisture and temporal upscaling methods. Sci. Total Environ. 2025, 1002, 180569. [Google Scholar] [CrossRef] [Scilit]
- Põças, I.; Paço, T.A.; Cunha, M.; Andrade, J.A.; Silvestre, J.; Sousa, A.; Santos, F.L.; Pereira, L.S.; Allen, R.G. Satellite-based evapotranspiration of a super-intensive olive orchard: Application of METRIC algorithms. Biosyst. Eng. 2014, 128, 69–81. [Google Scholar] [CrossRef] [Scilit]
- Galleguillos, M.; Jacob, F.; Prévot, L.; Lagacherie, P.; Liang, S. Mapping daily evapotranspiration over a Mediterranean vineyard watershed. IEEE Geosci. Remote Sens. Lett. 2010, 8, 168–172. [Google Scholar] [CrossRef] [Scilit]
- Xue, J.; Bali, K.M.; Light, S.; Hessels, T.; Kisekka, I. Evaluation of remote sensing-based evapotranspiration models against surface renewal in almonds, tomatoes and maize. Agric. Water Manag. 2020, 238, 106228. [Google Scholar] [CrossRef] [Scilit]
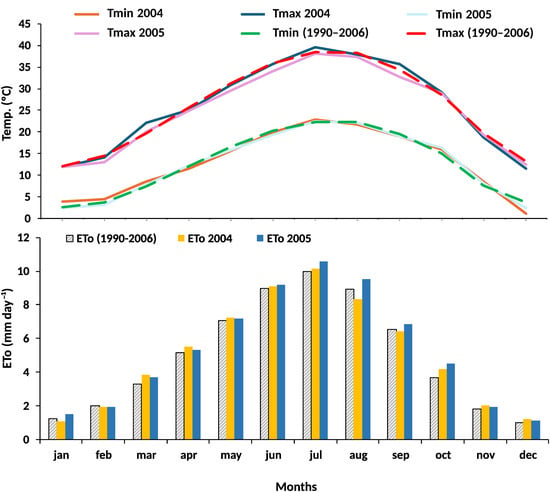
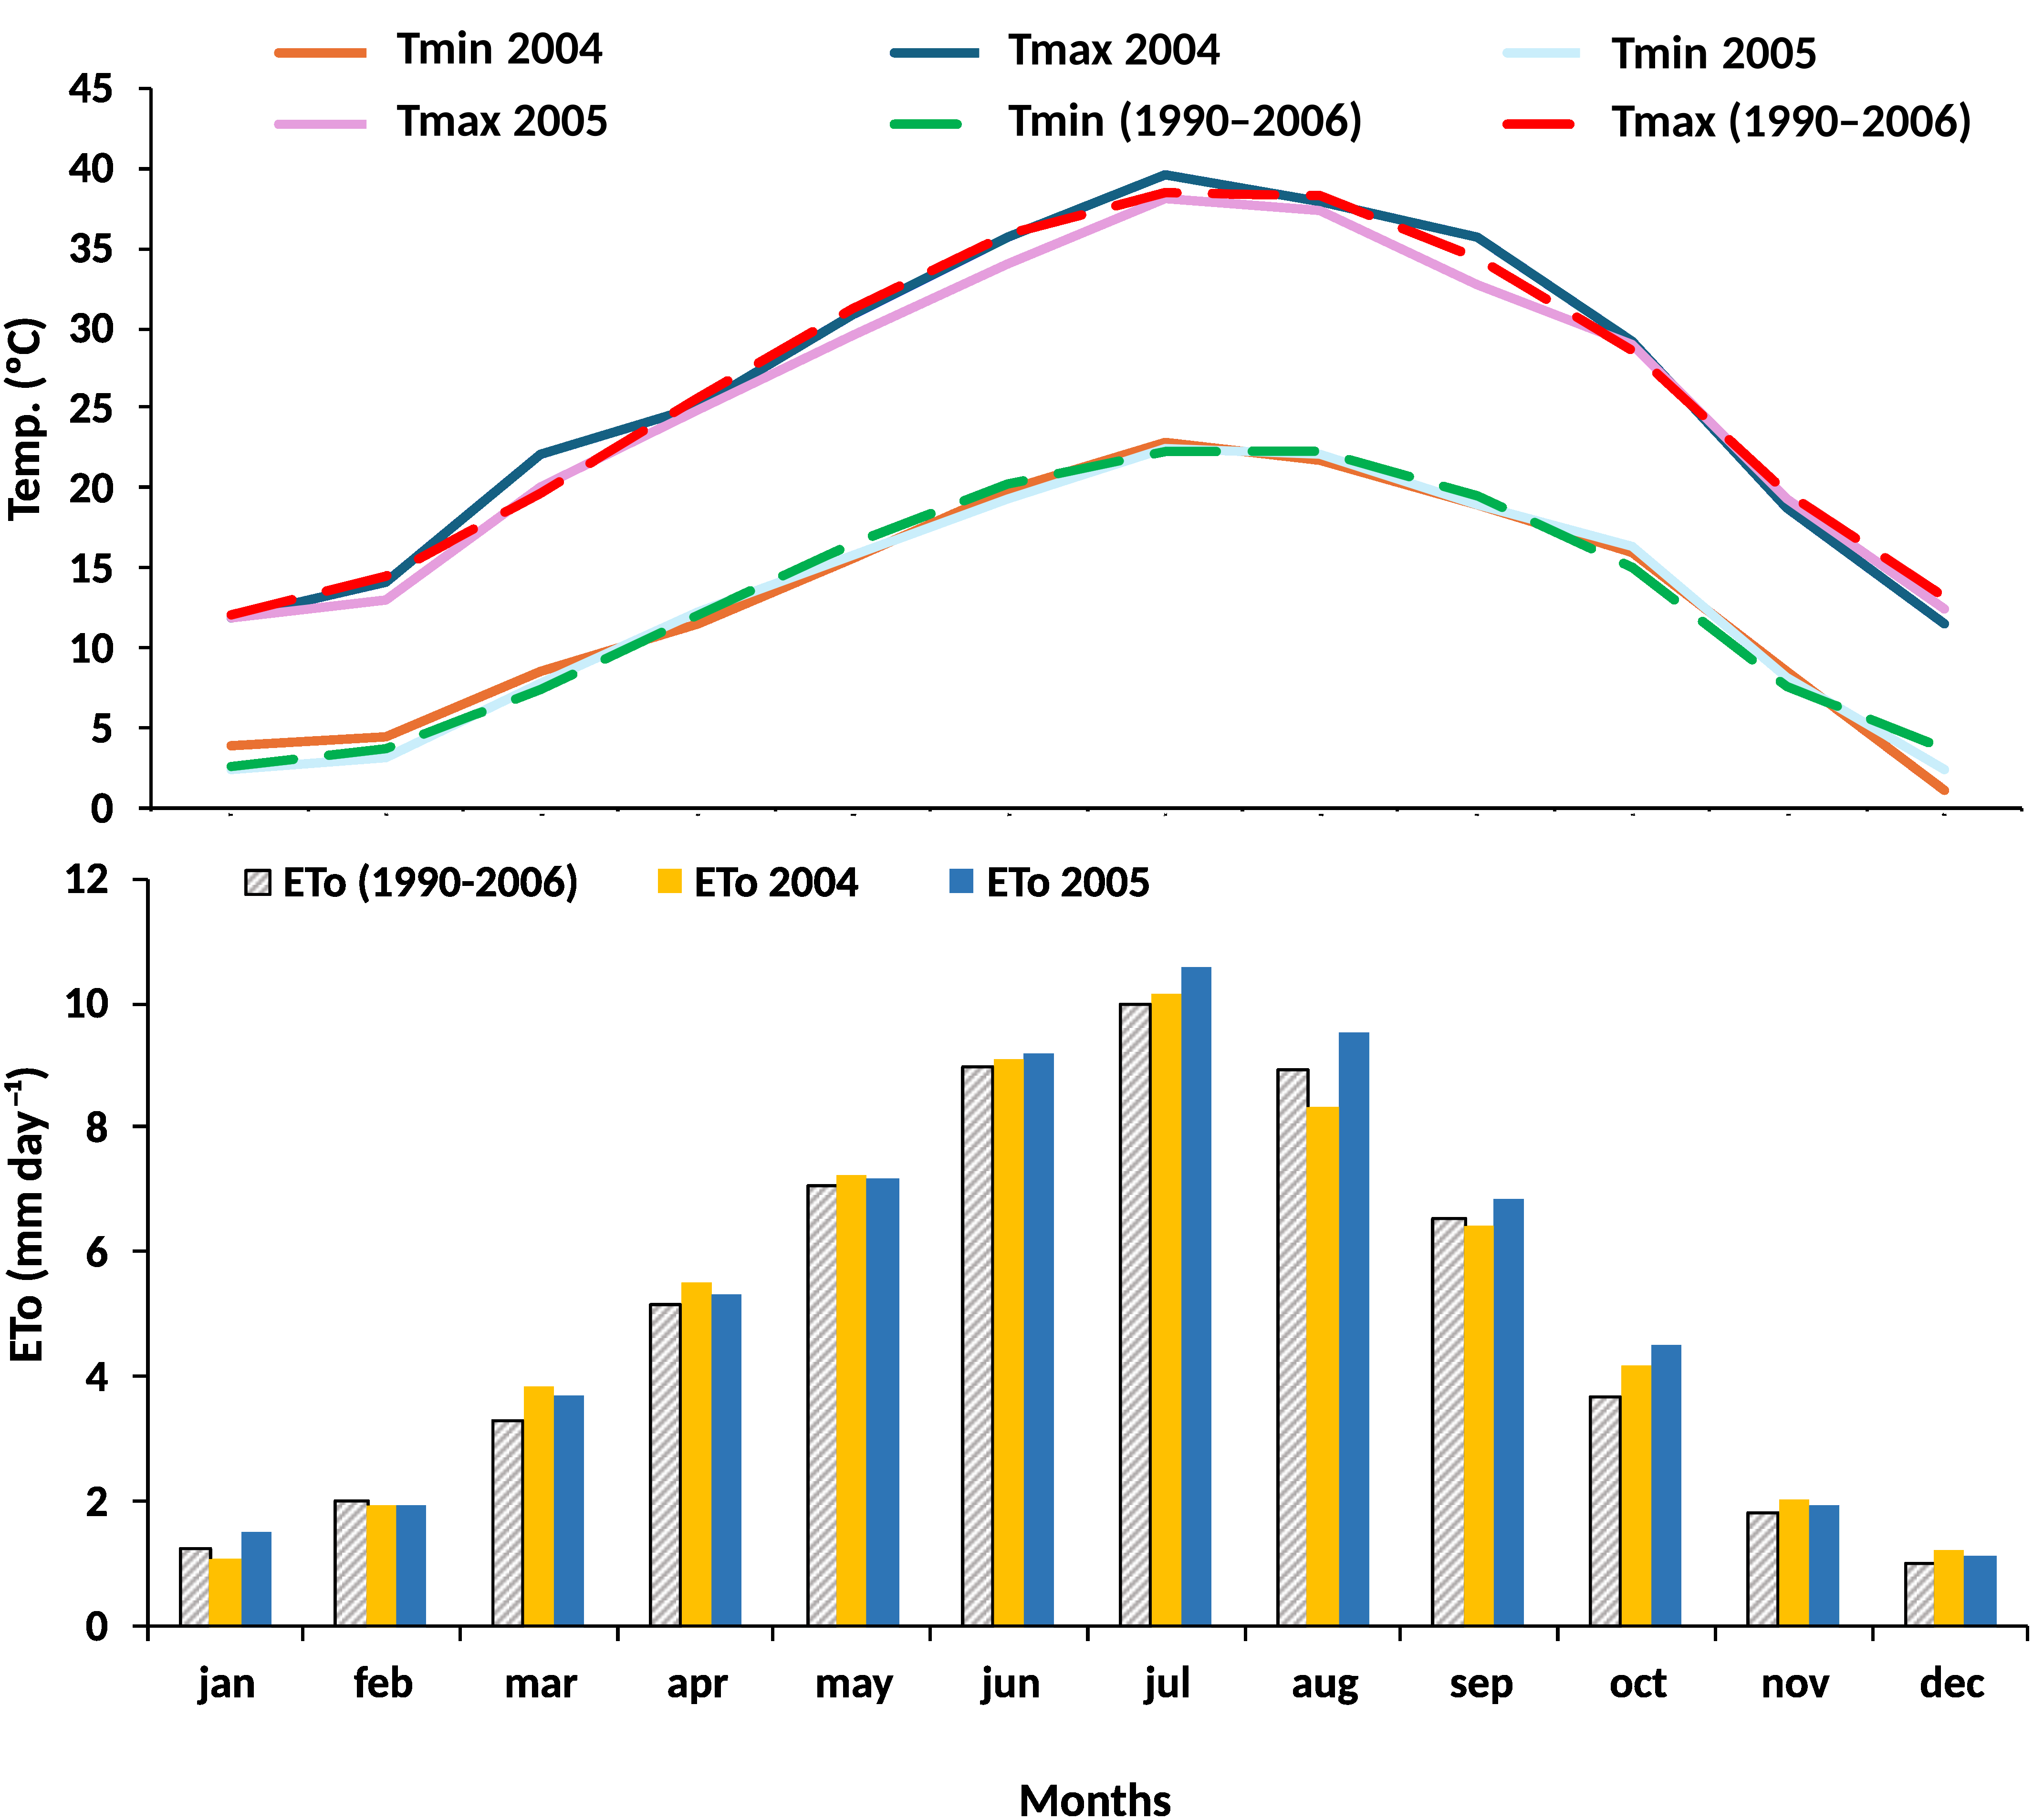
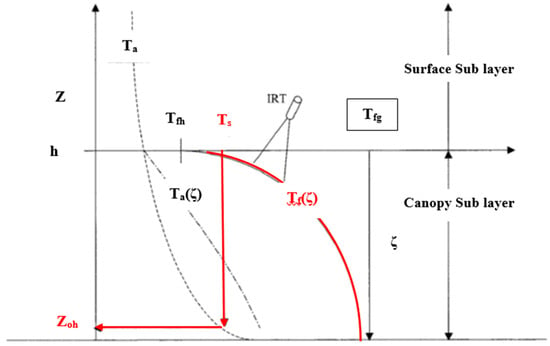
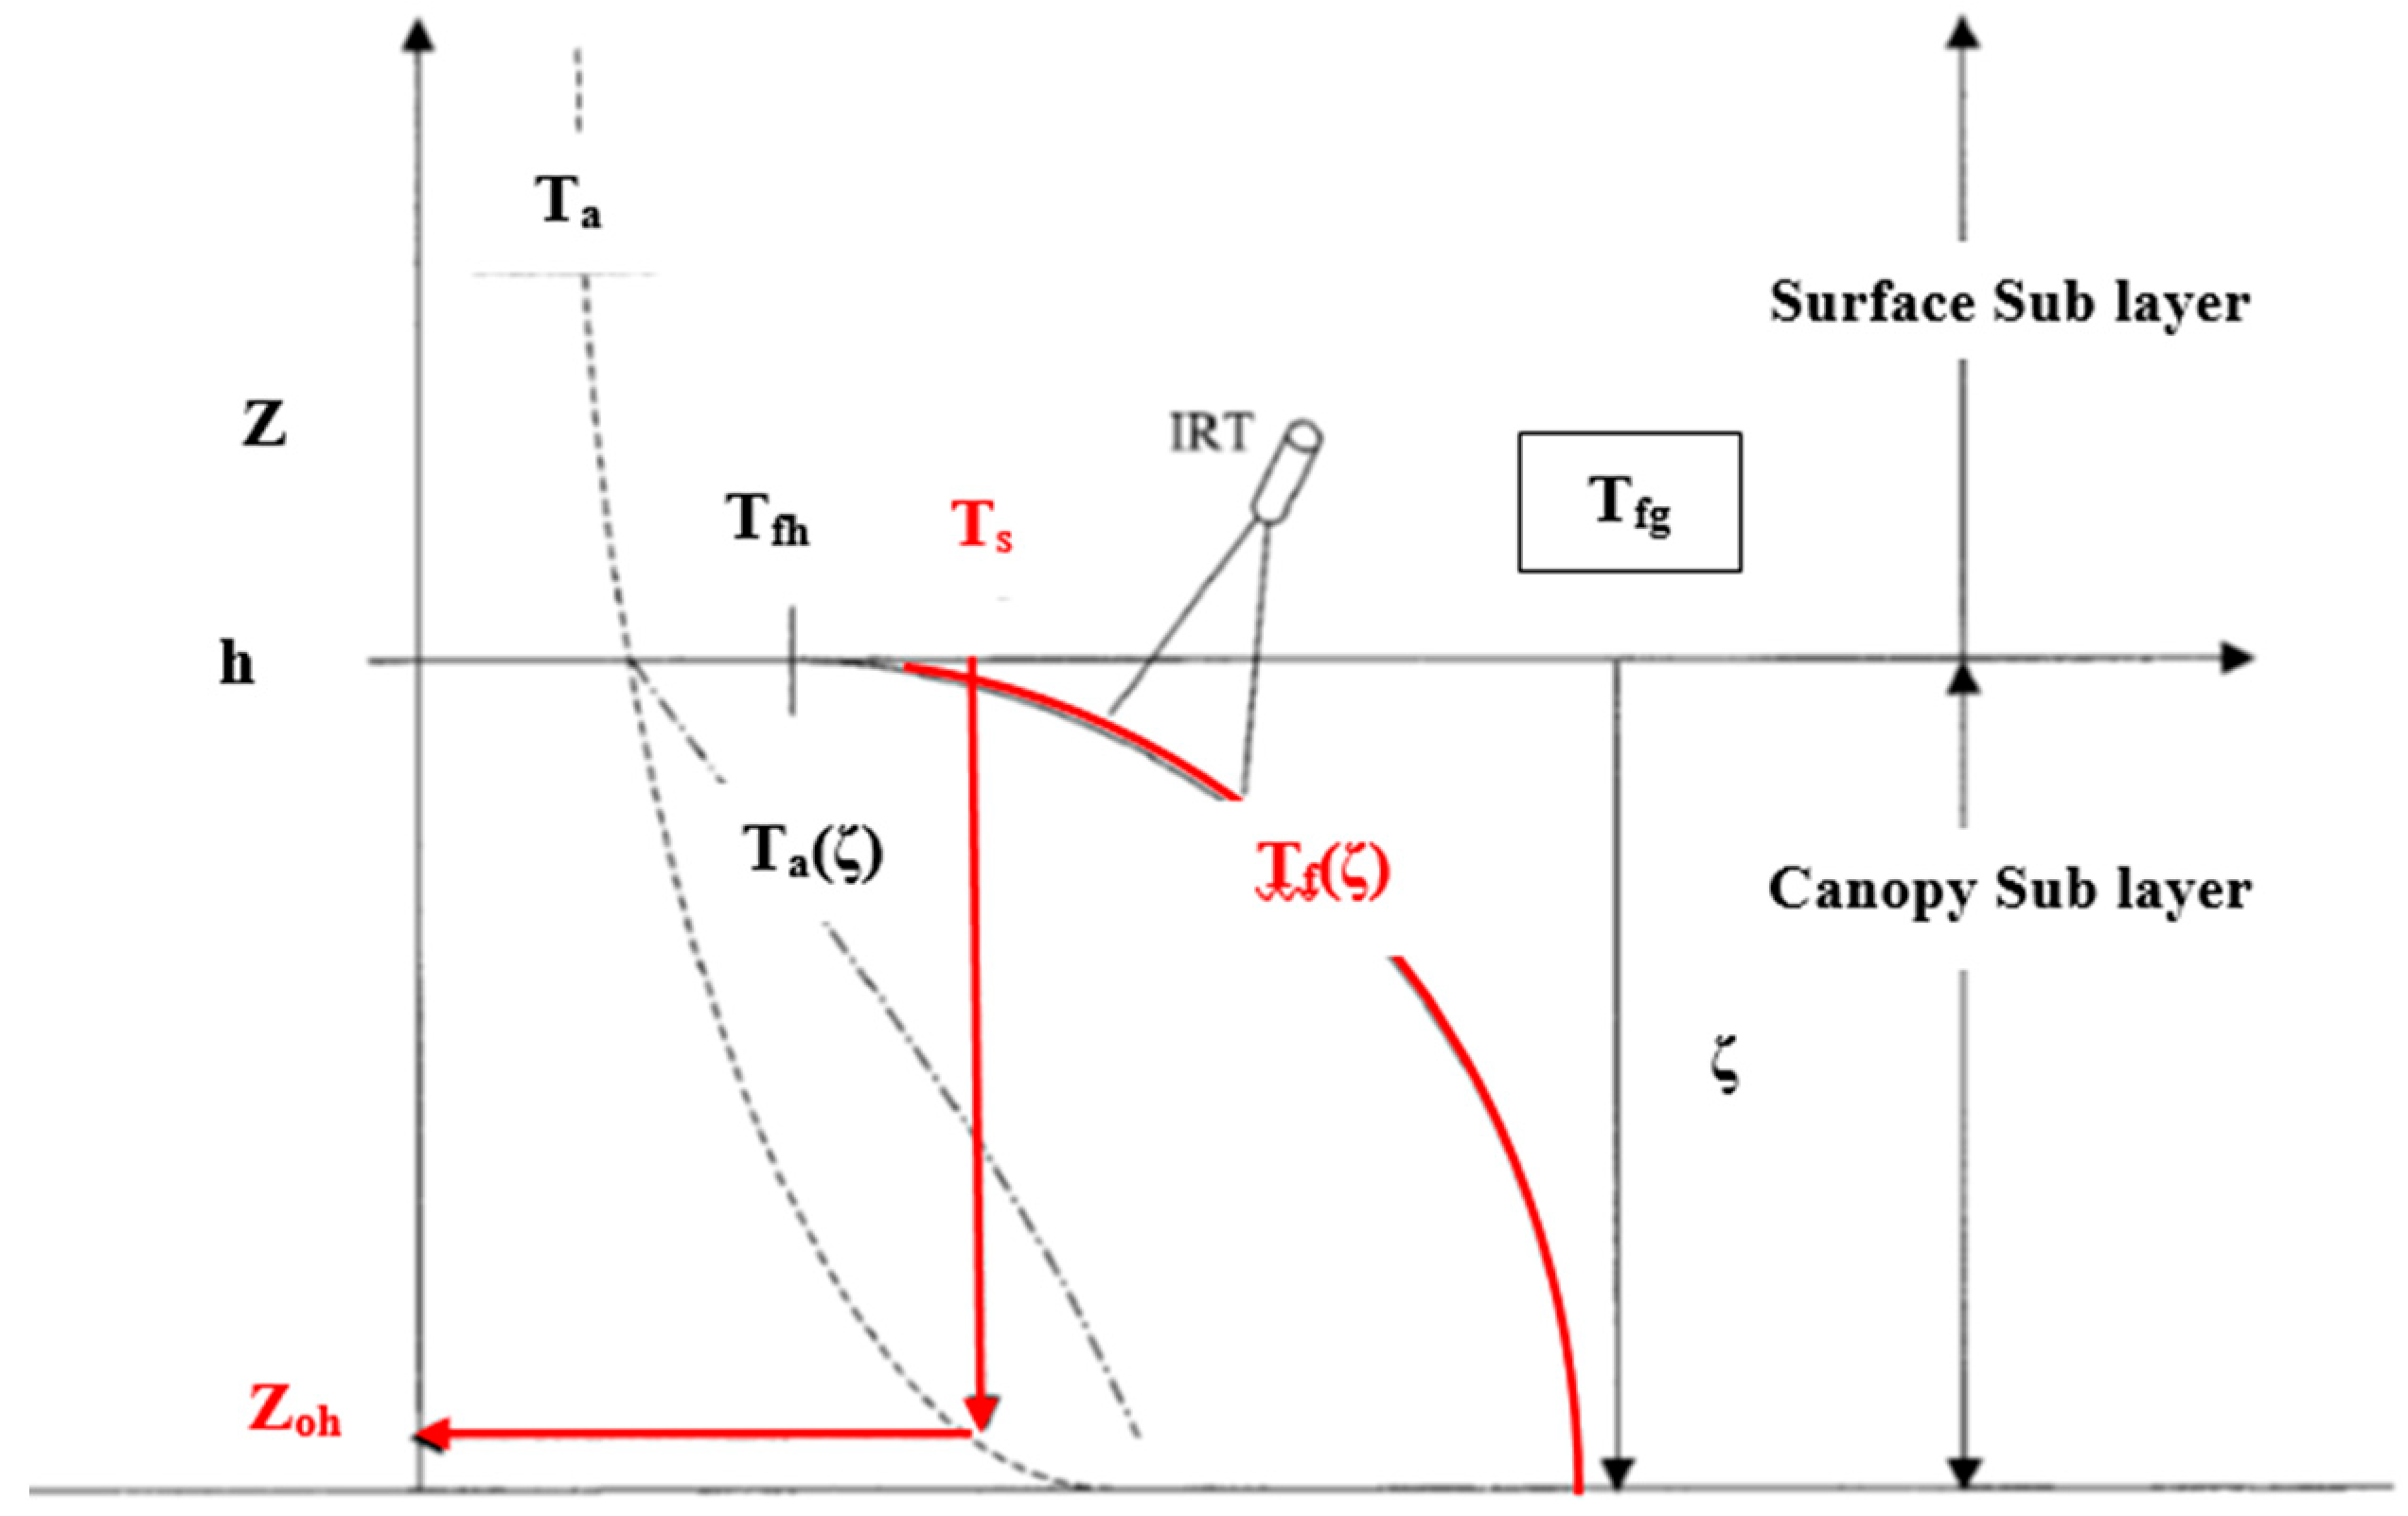
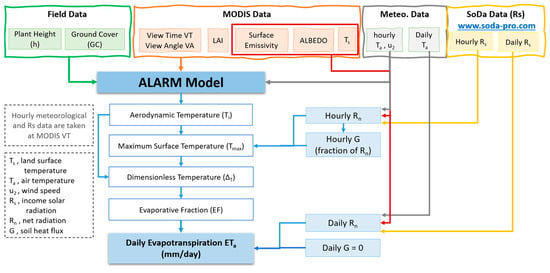
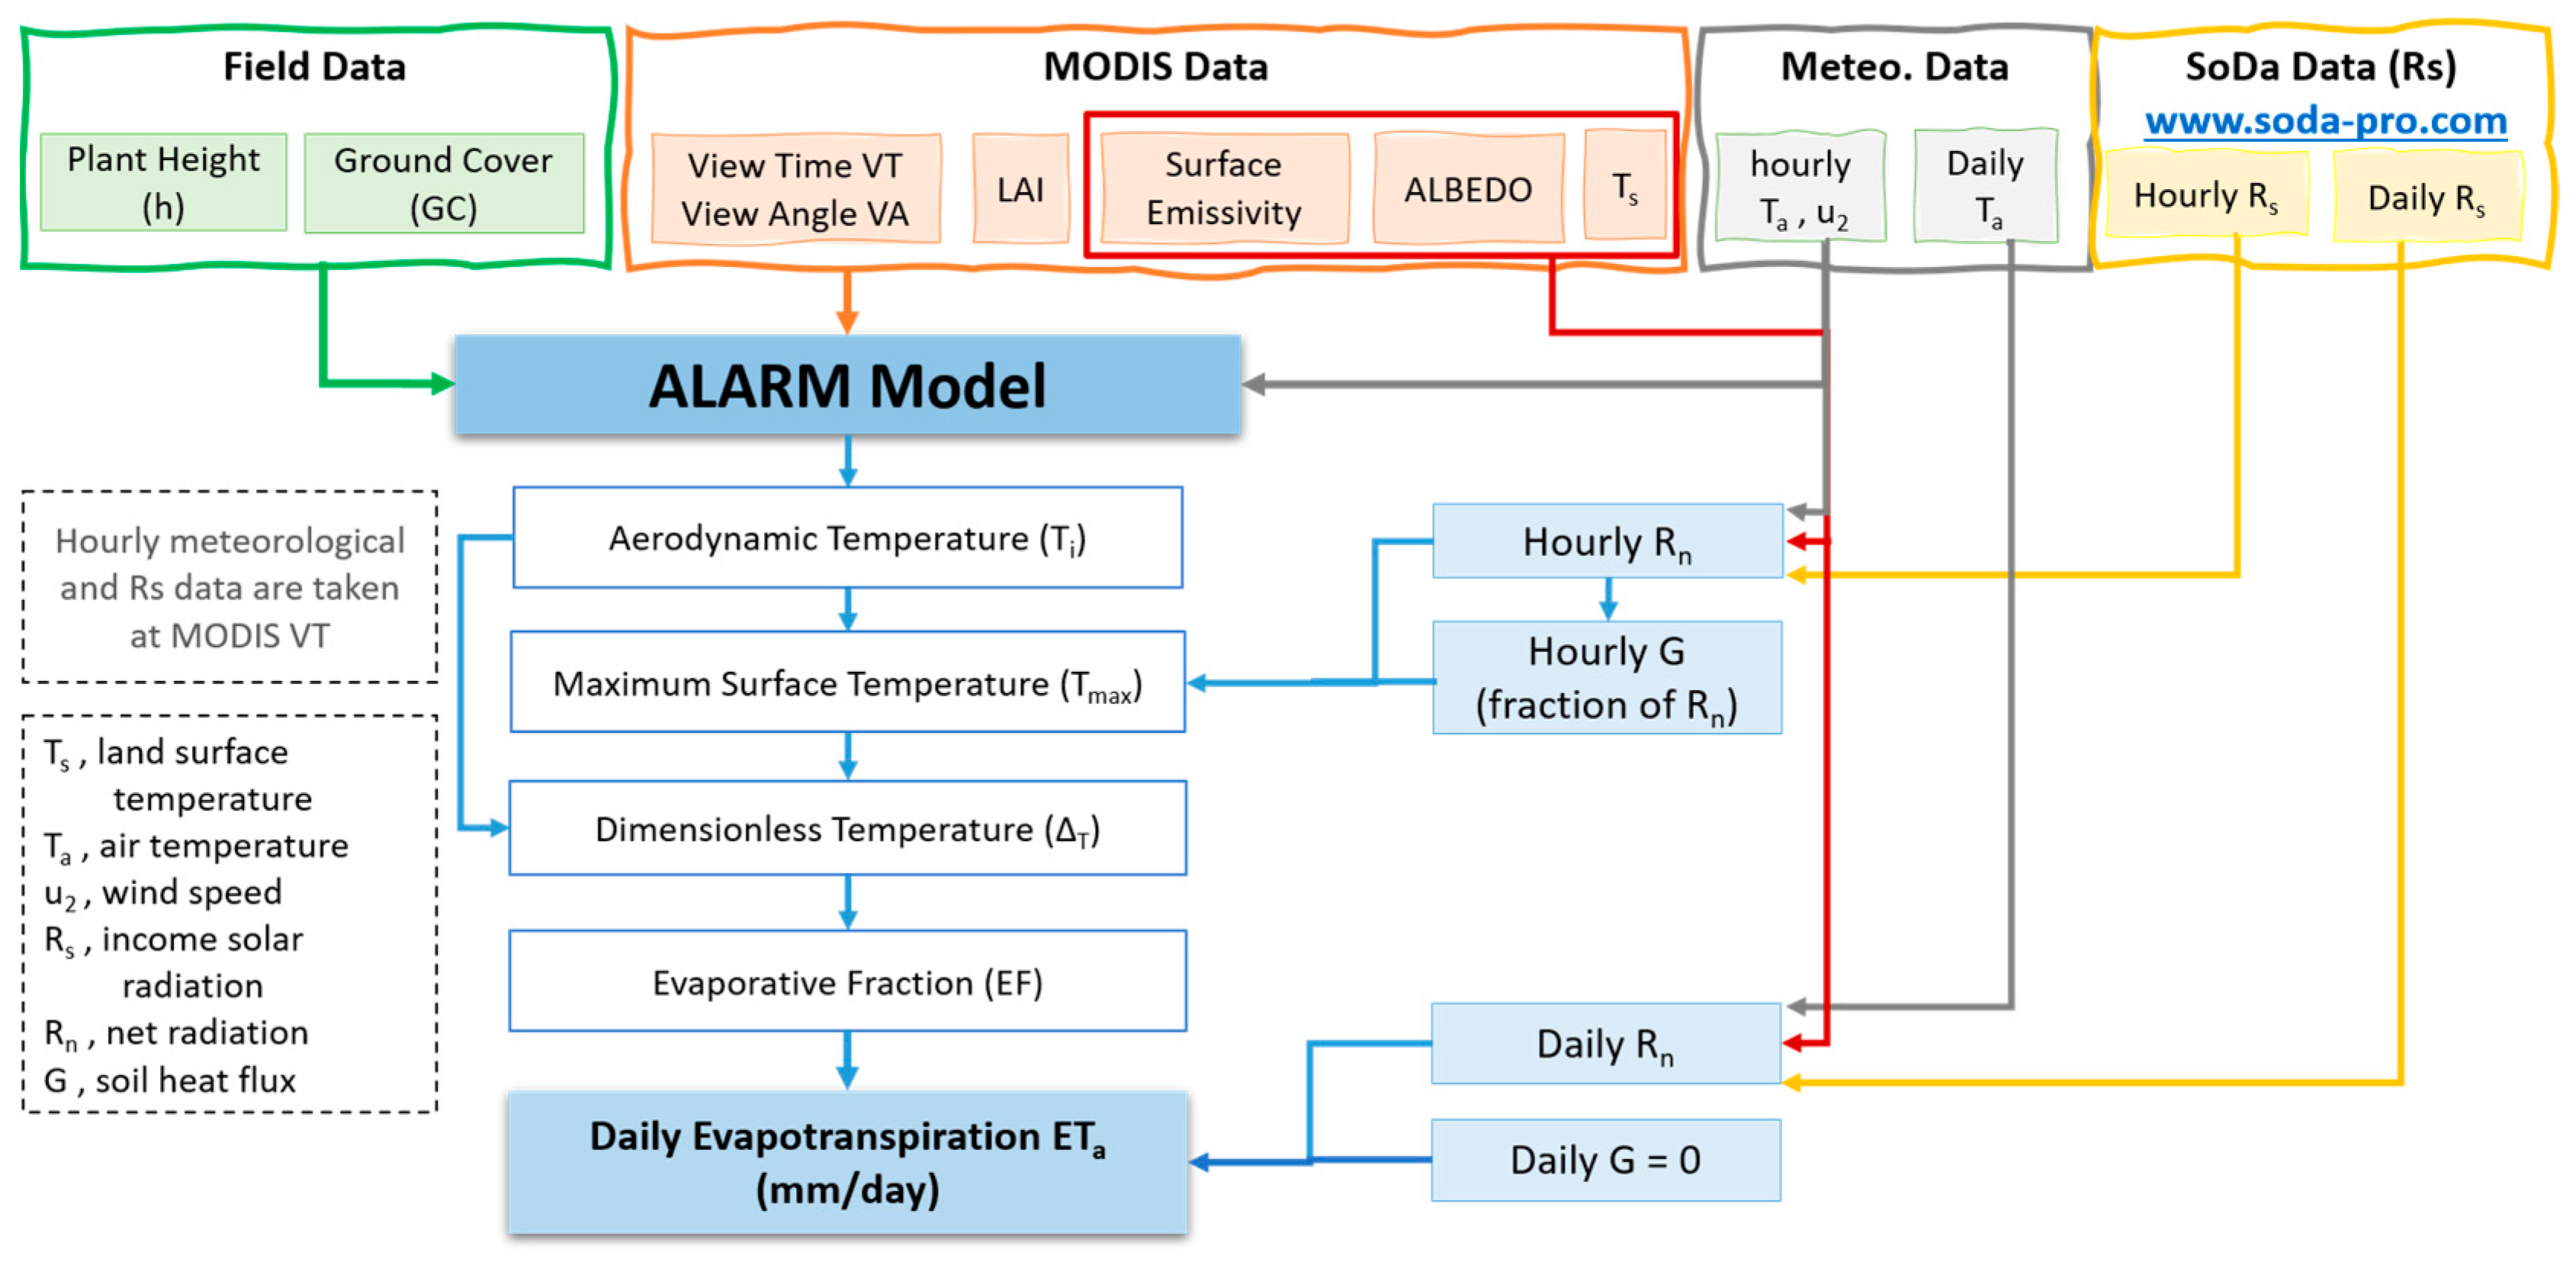
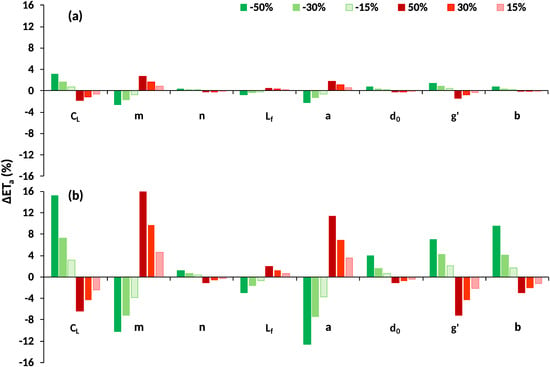
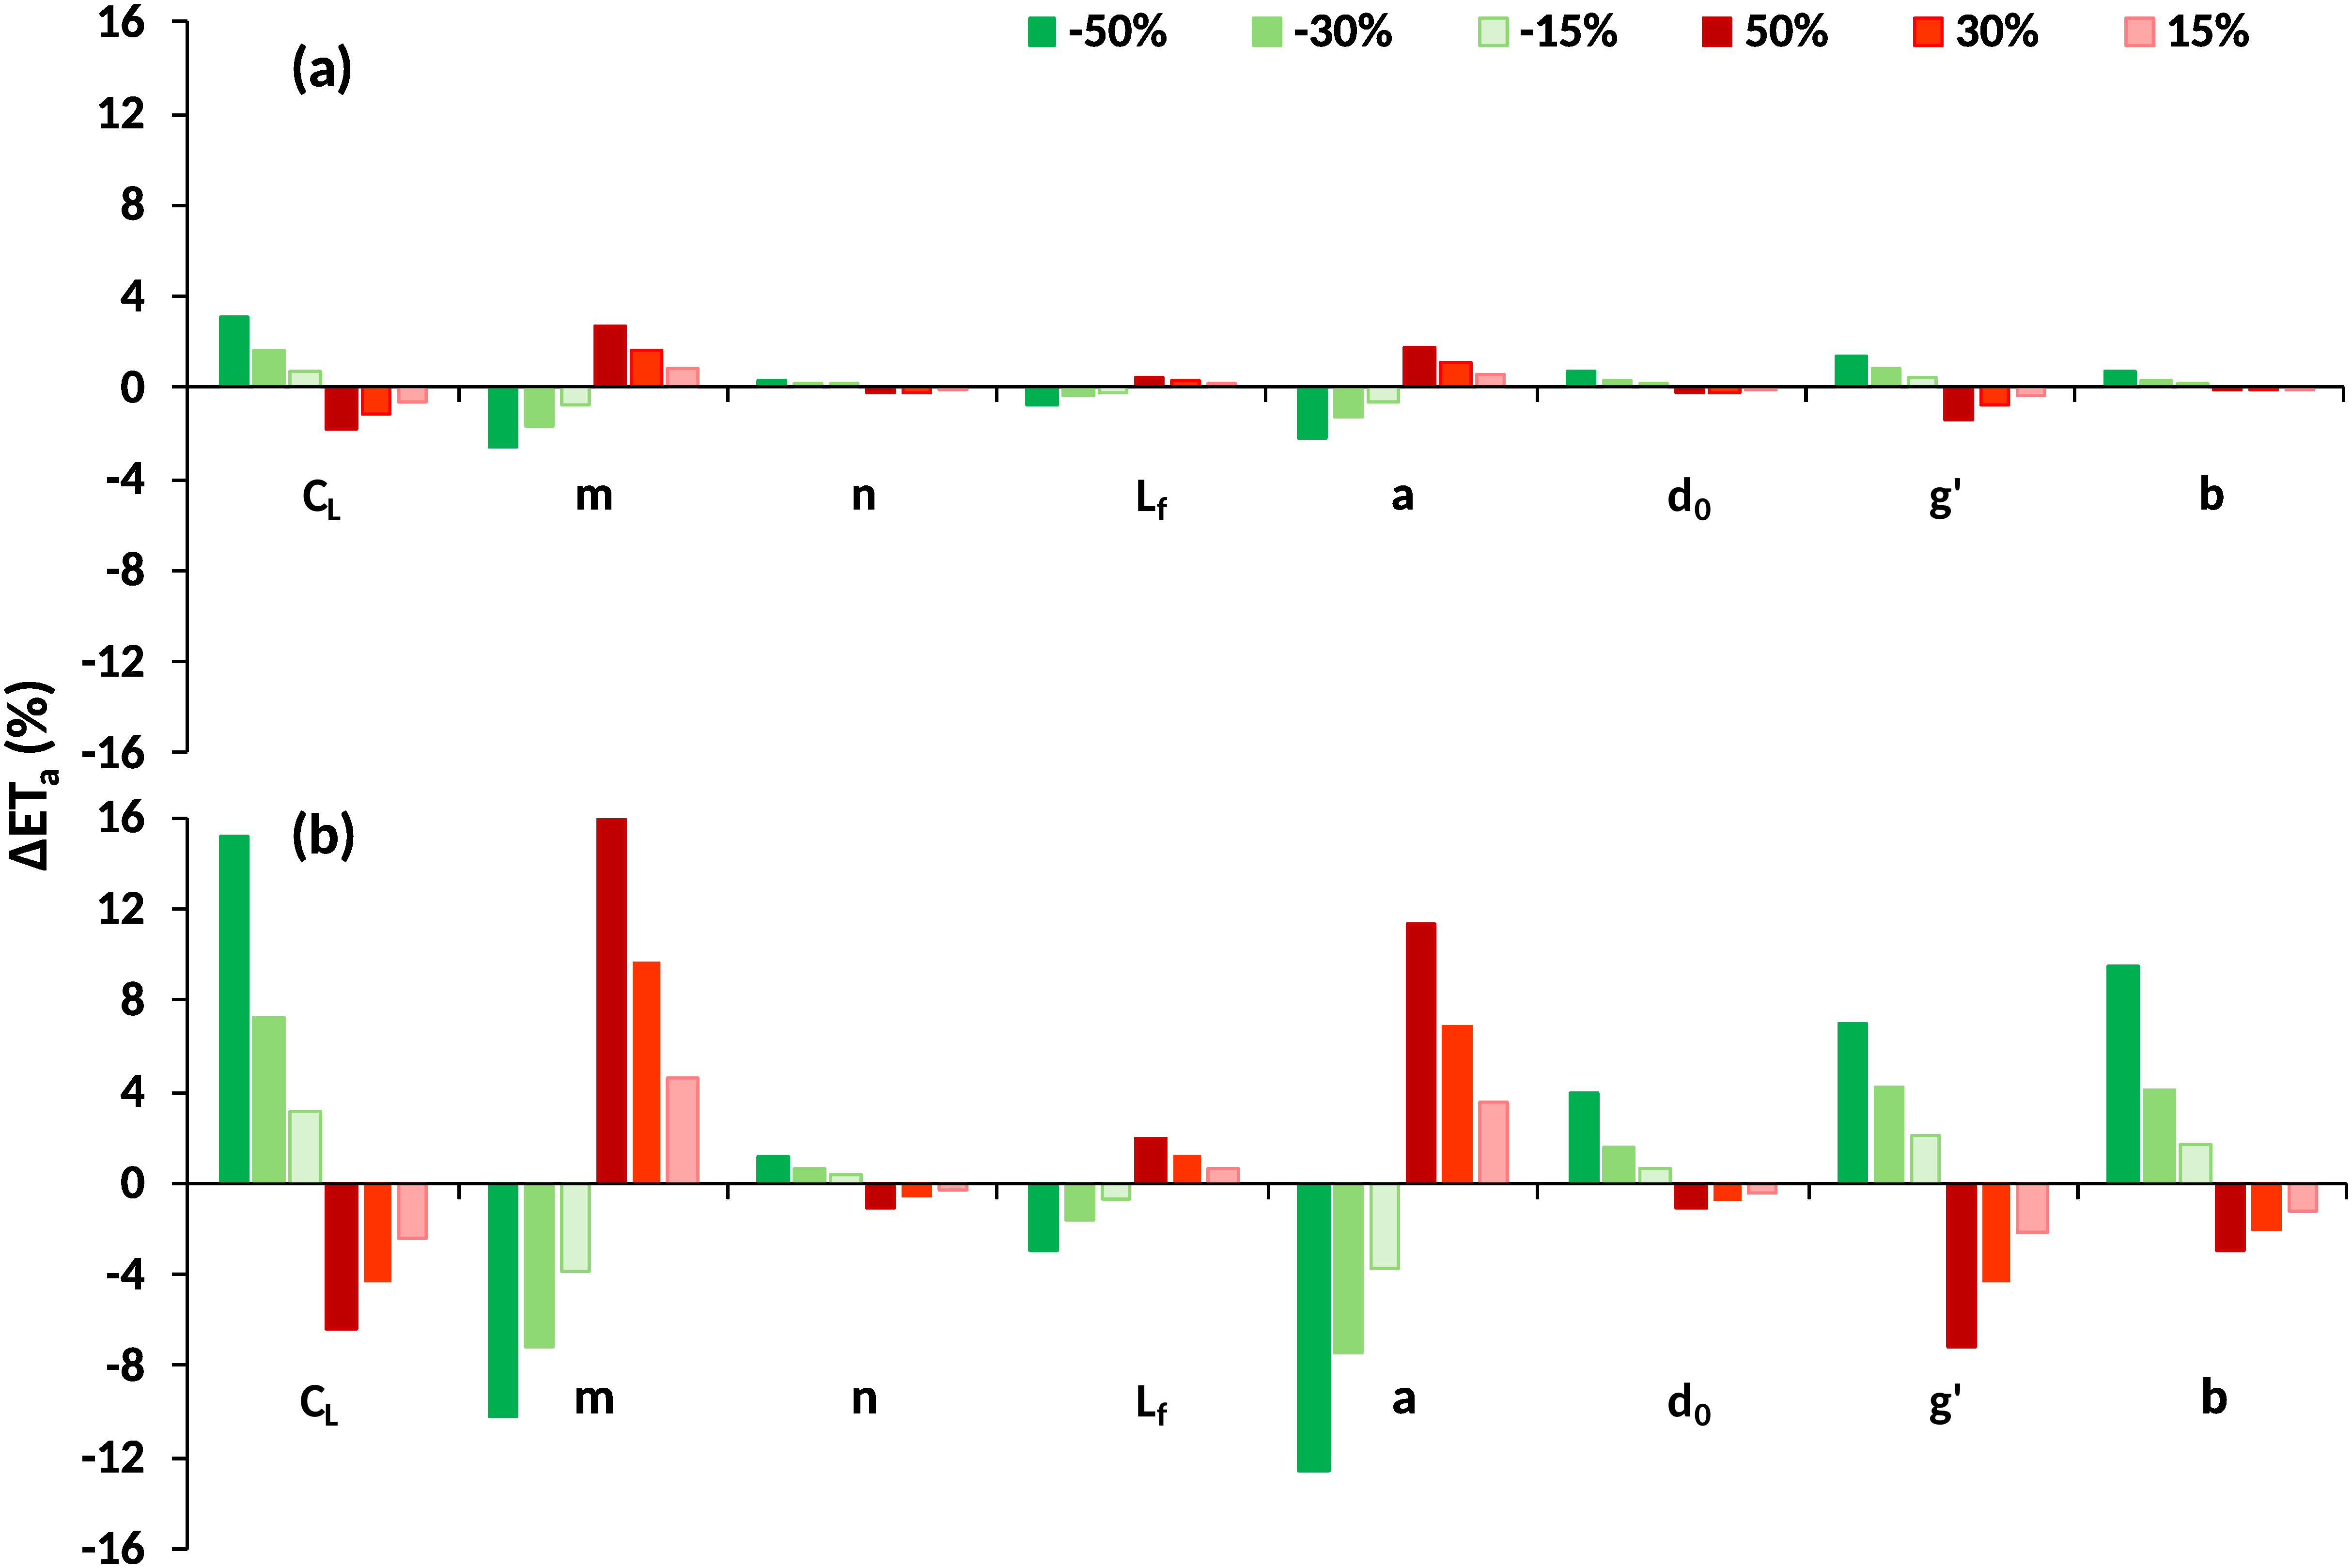
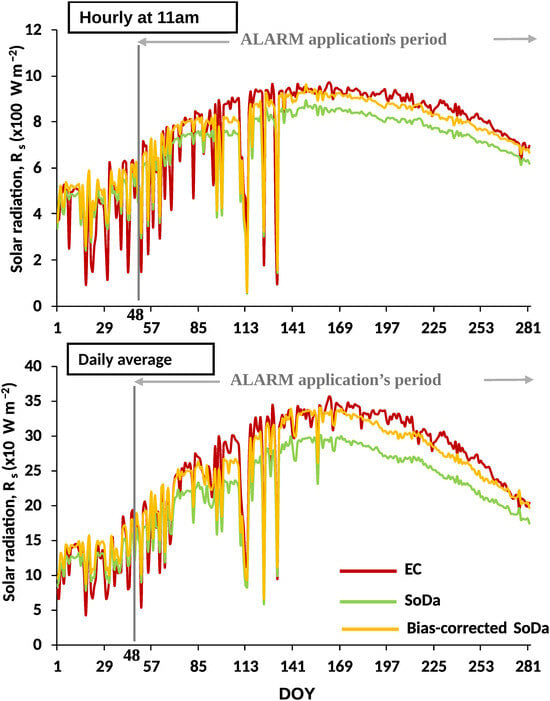
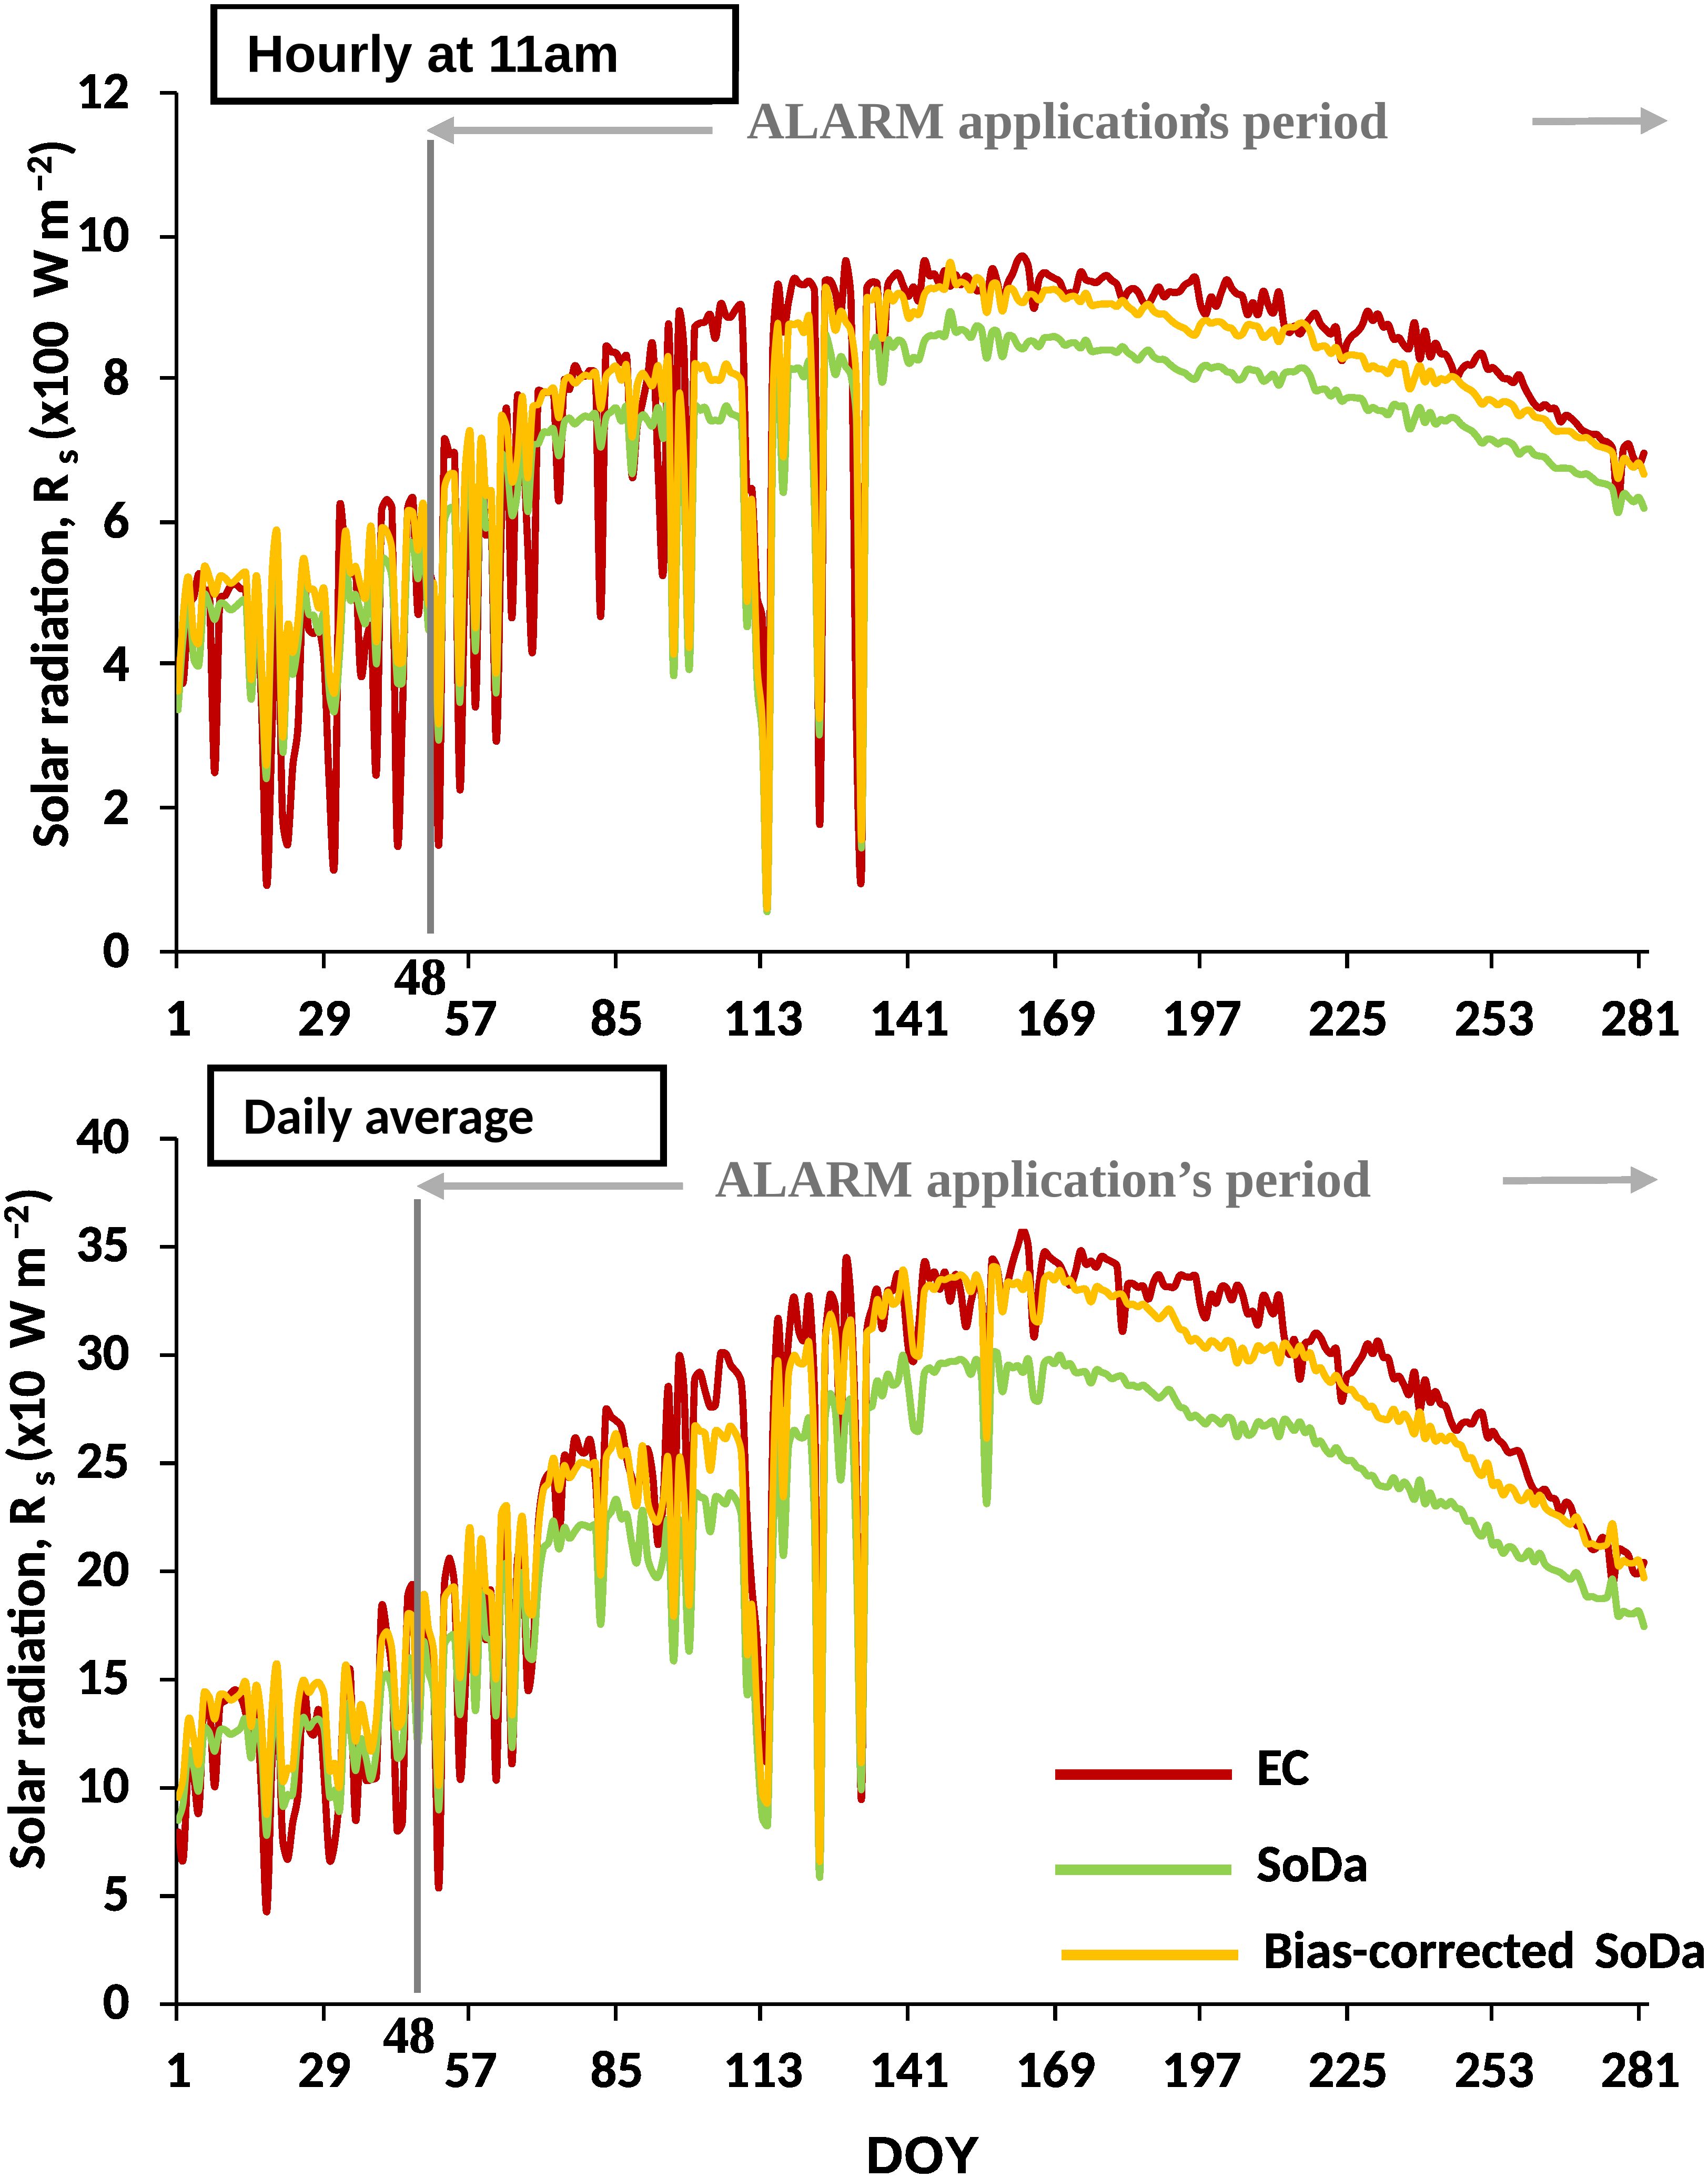
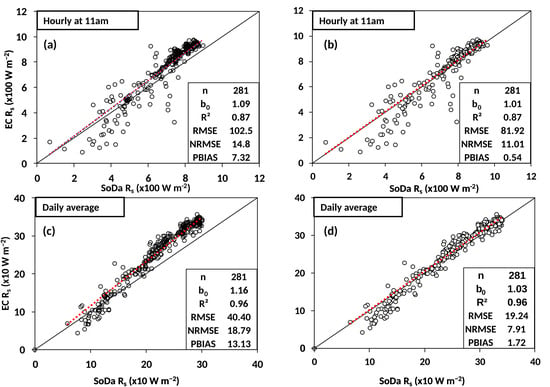
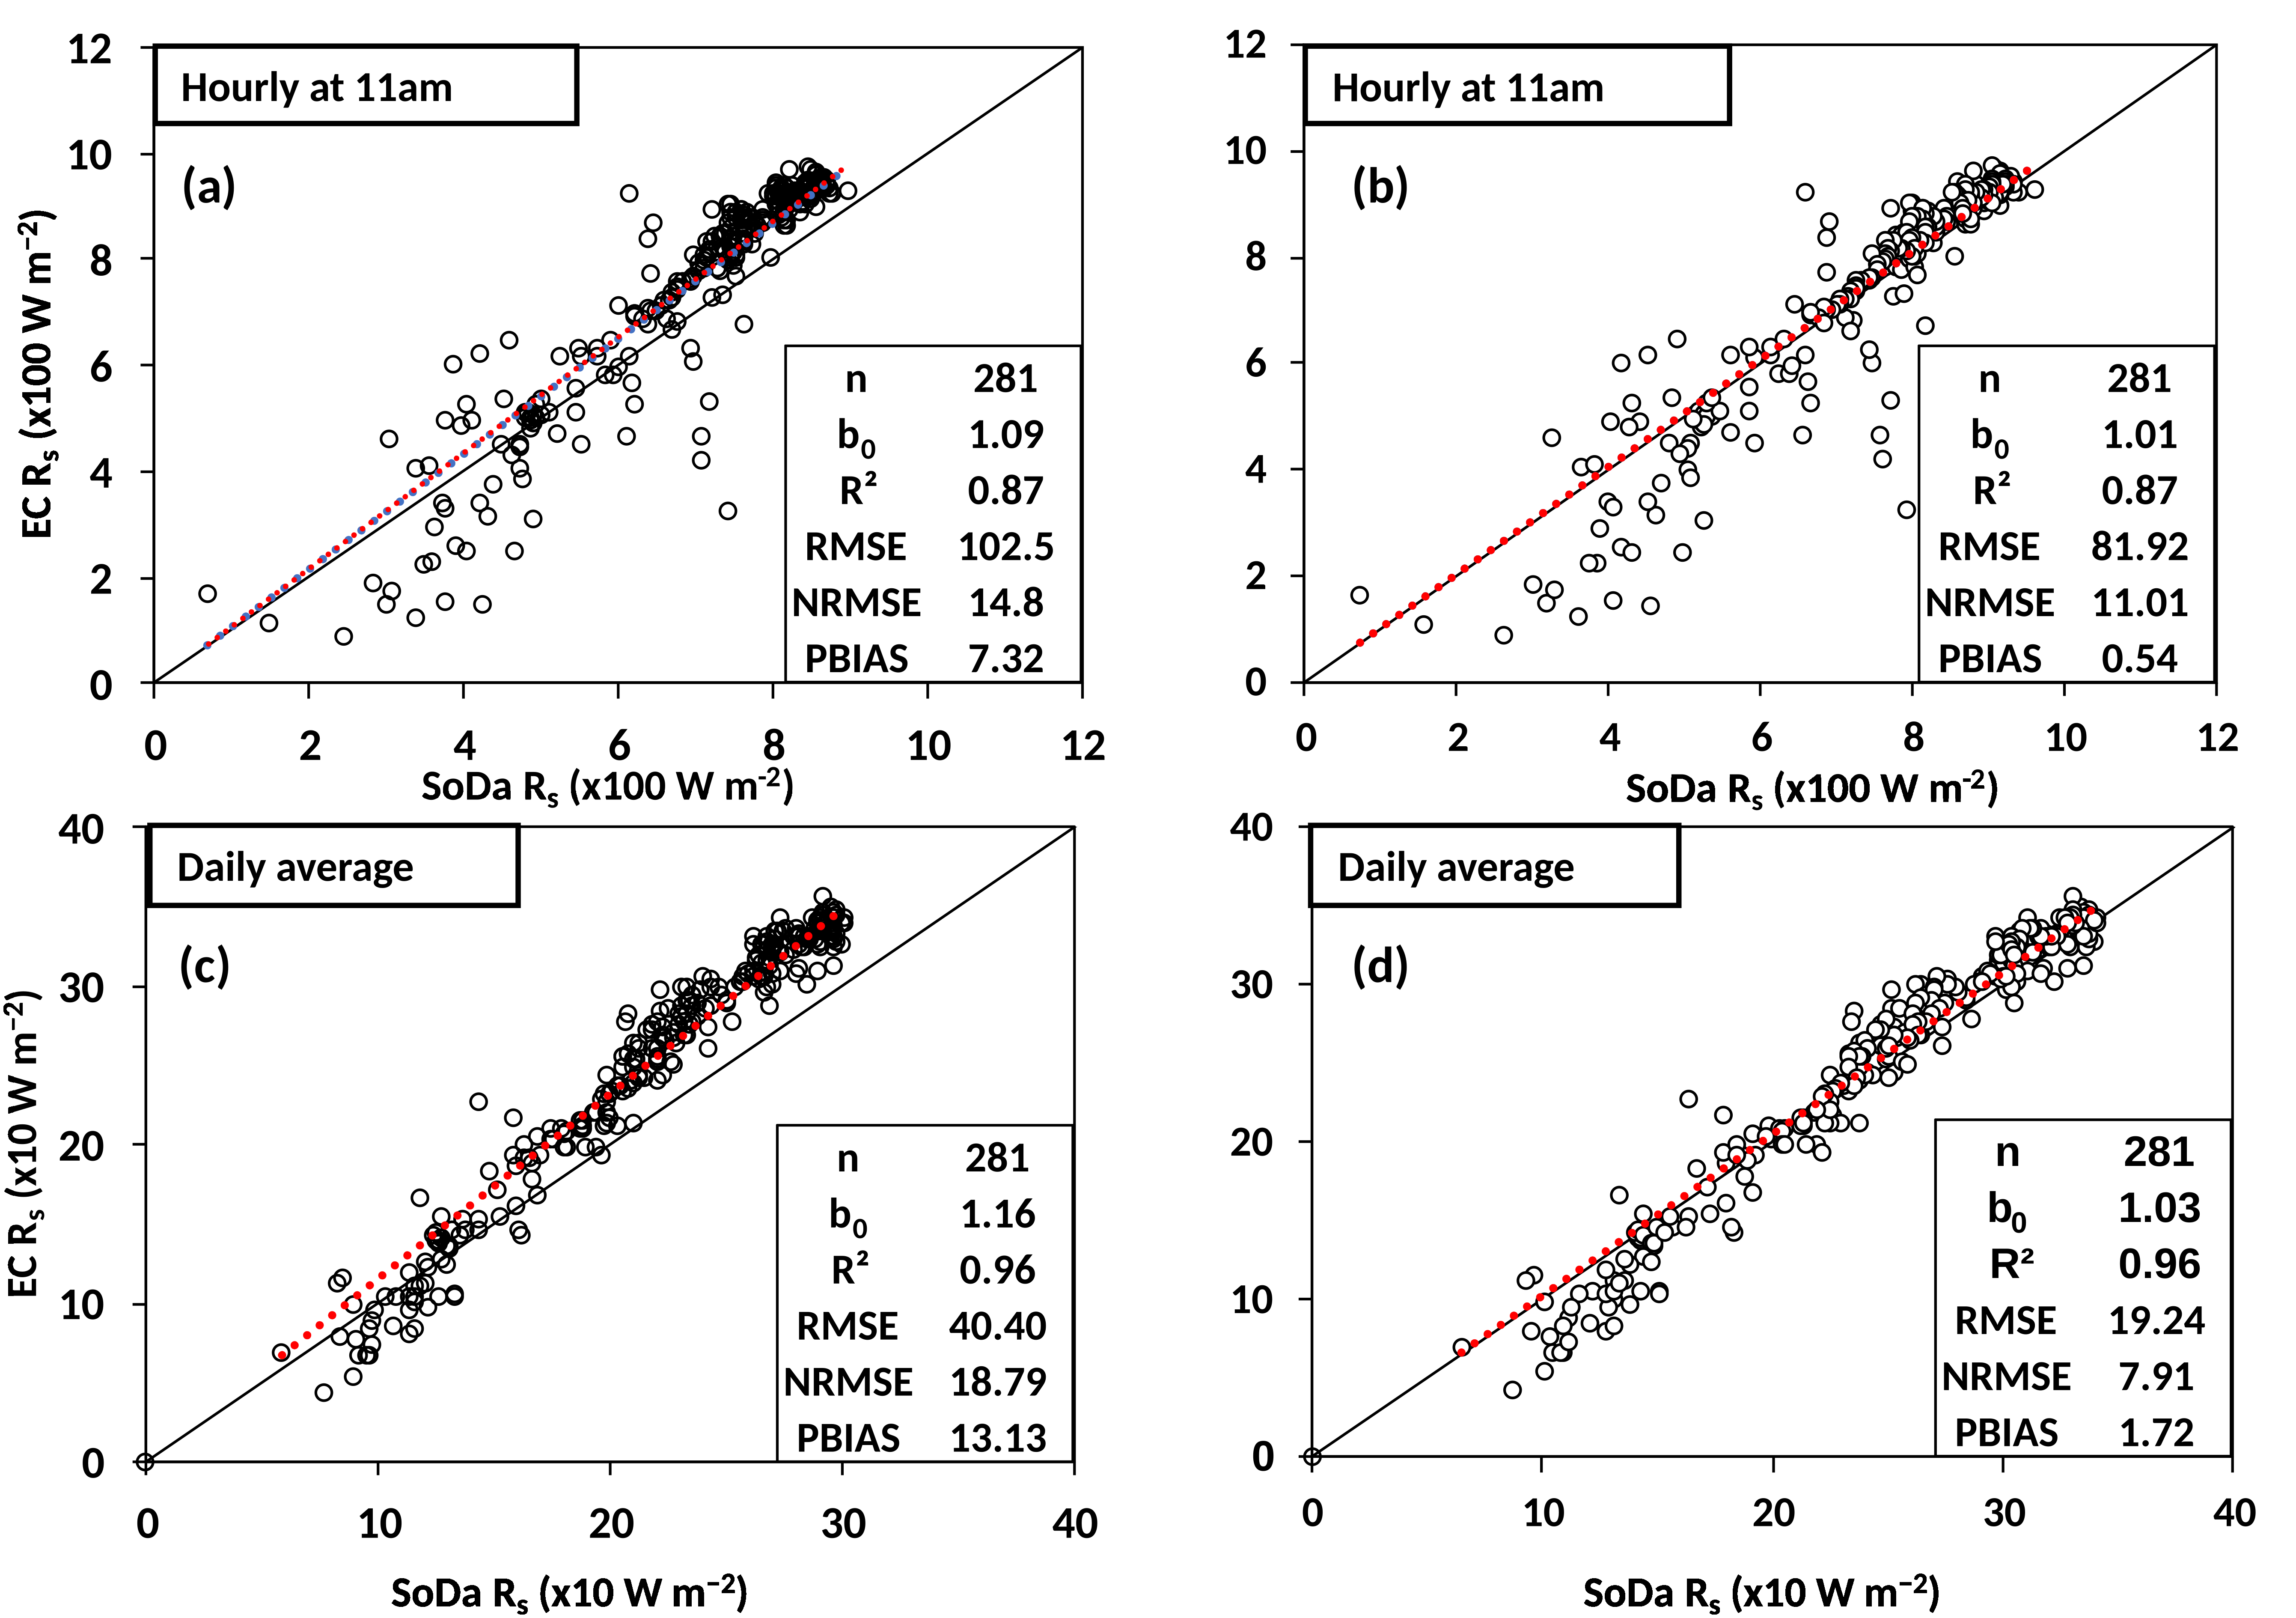
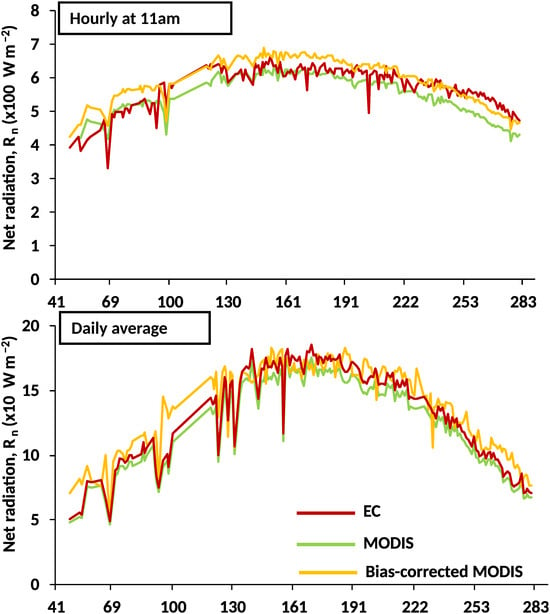
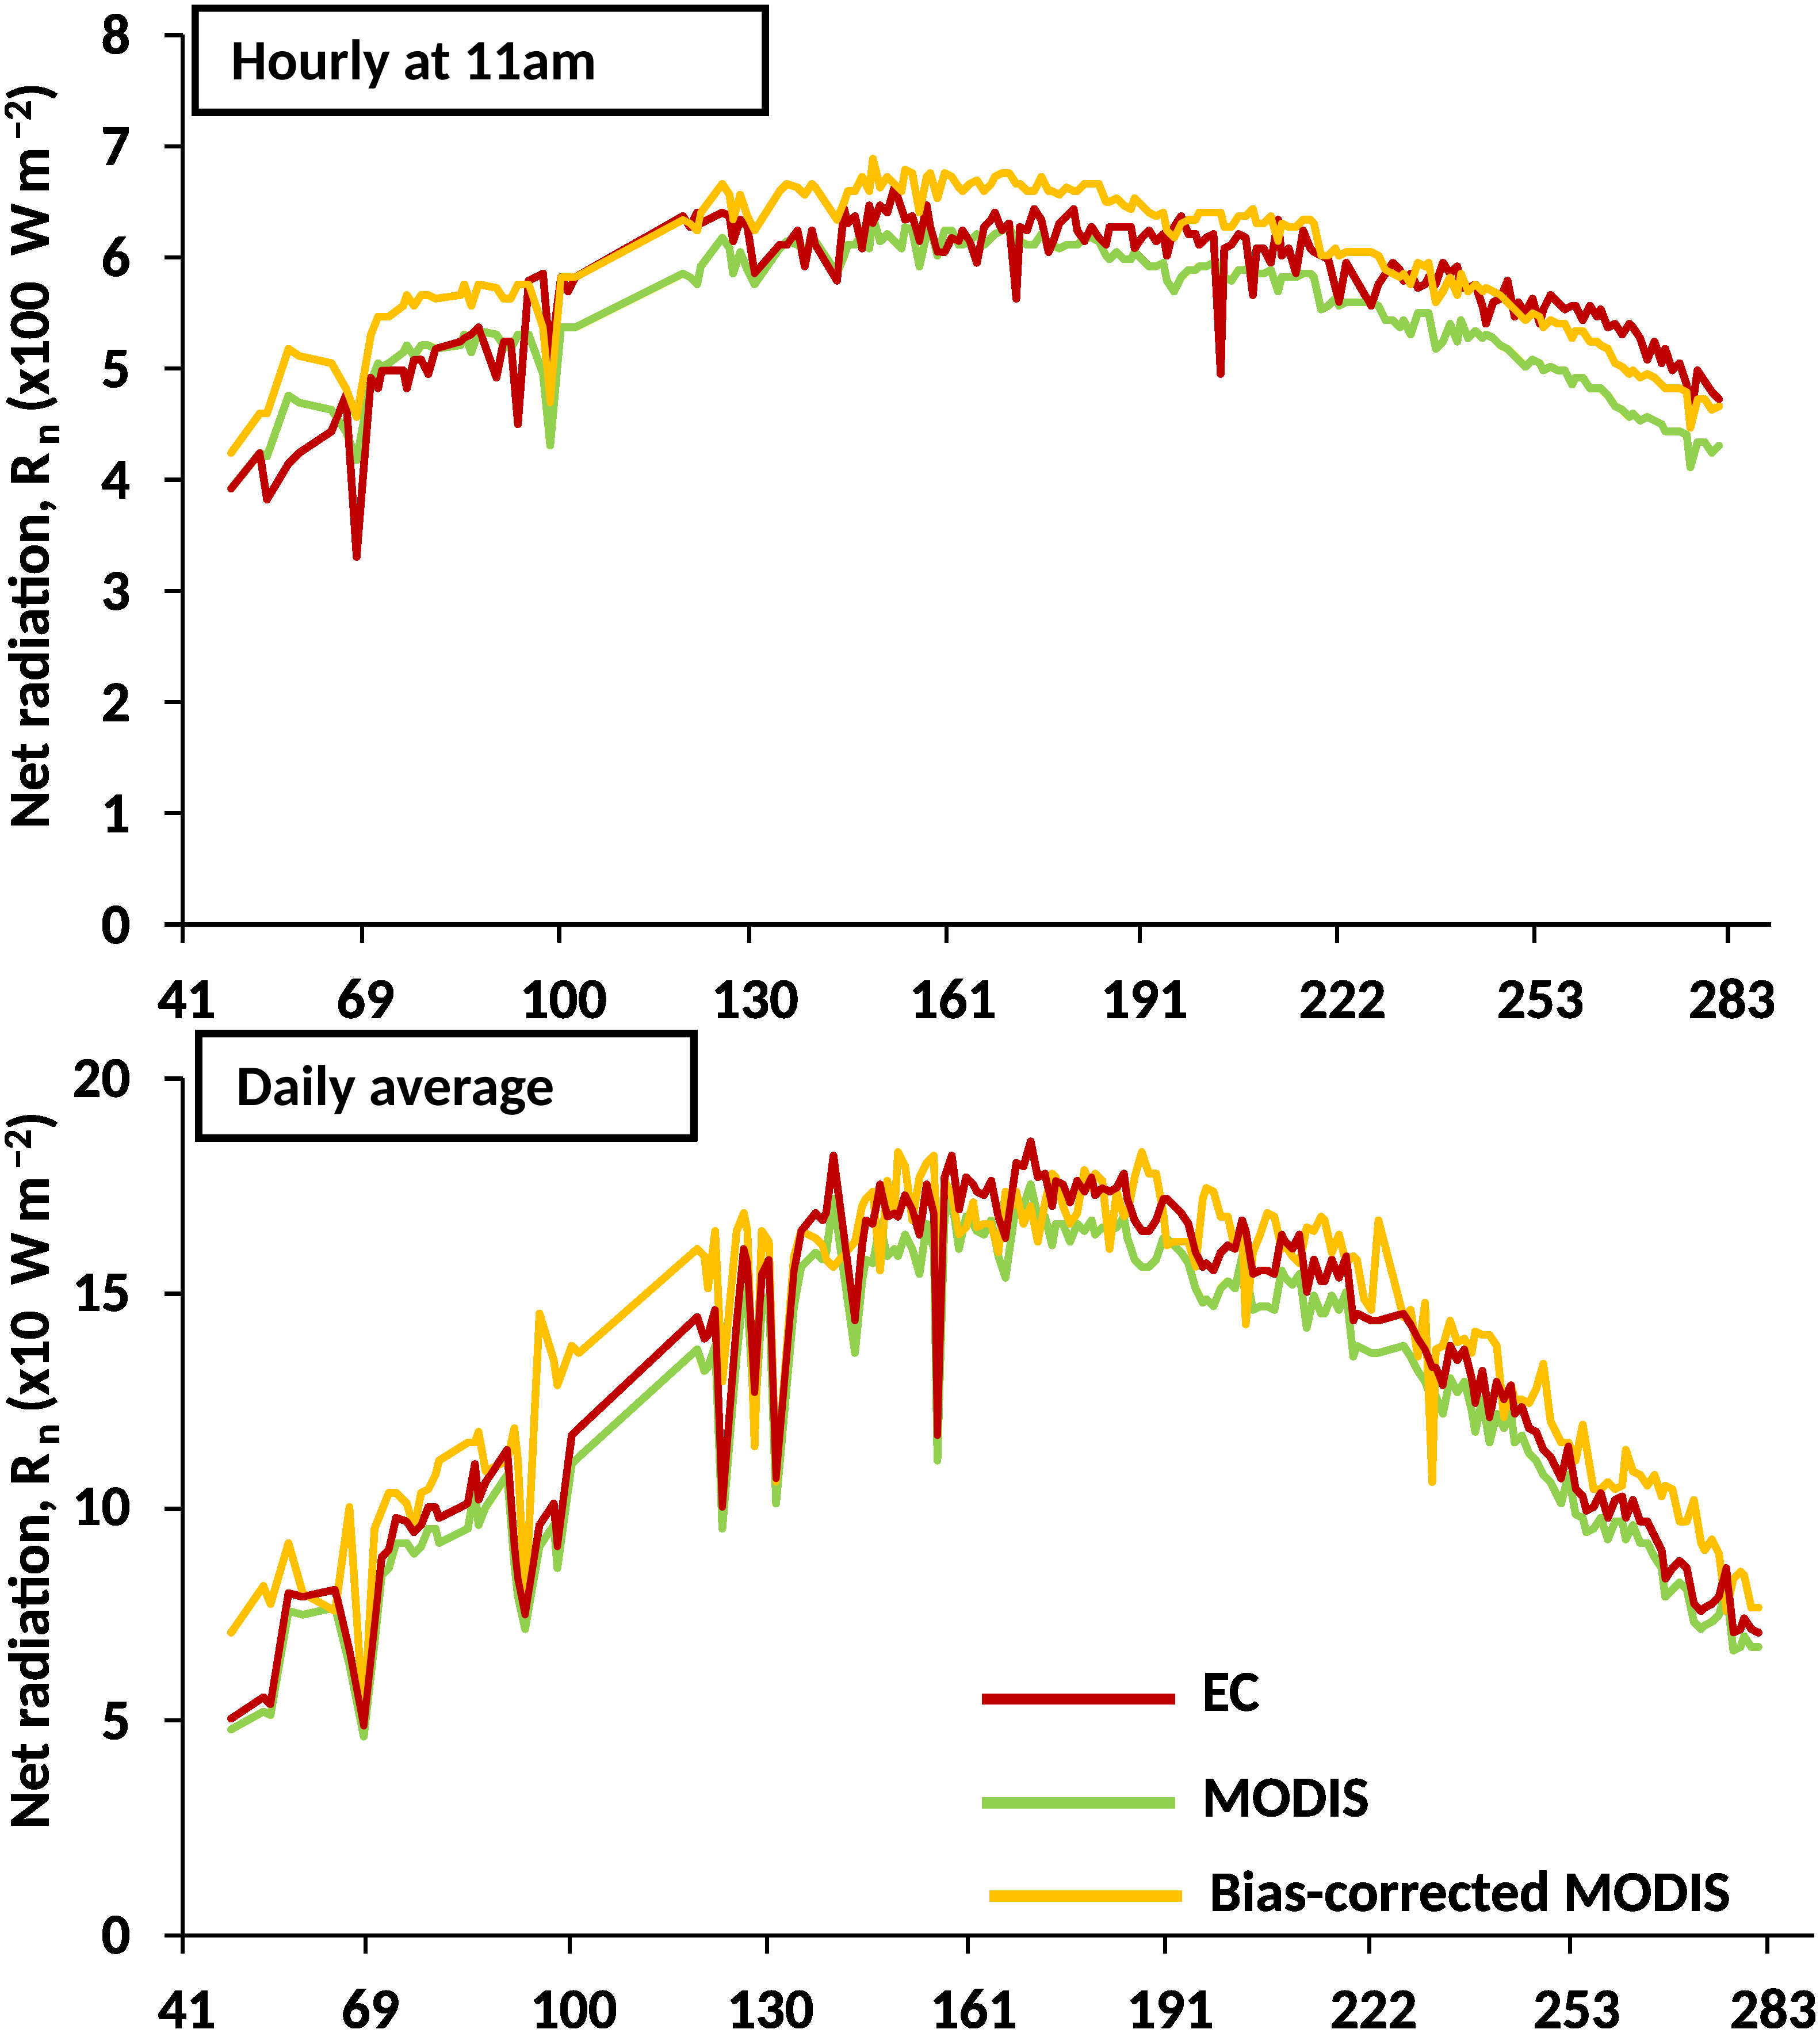
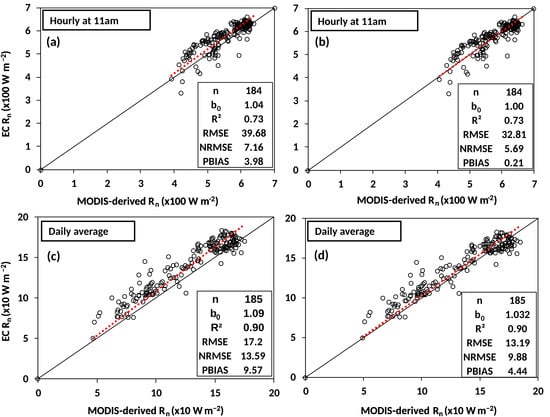
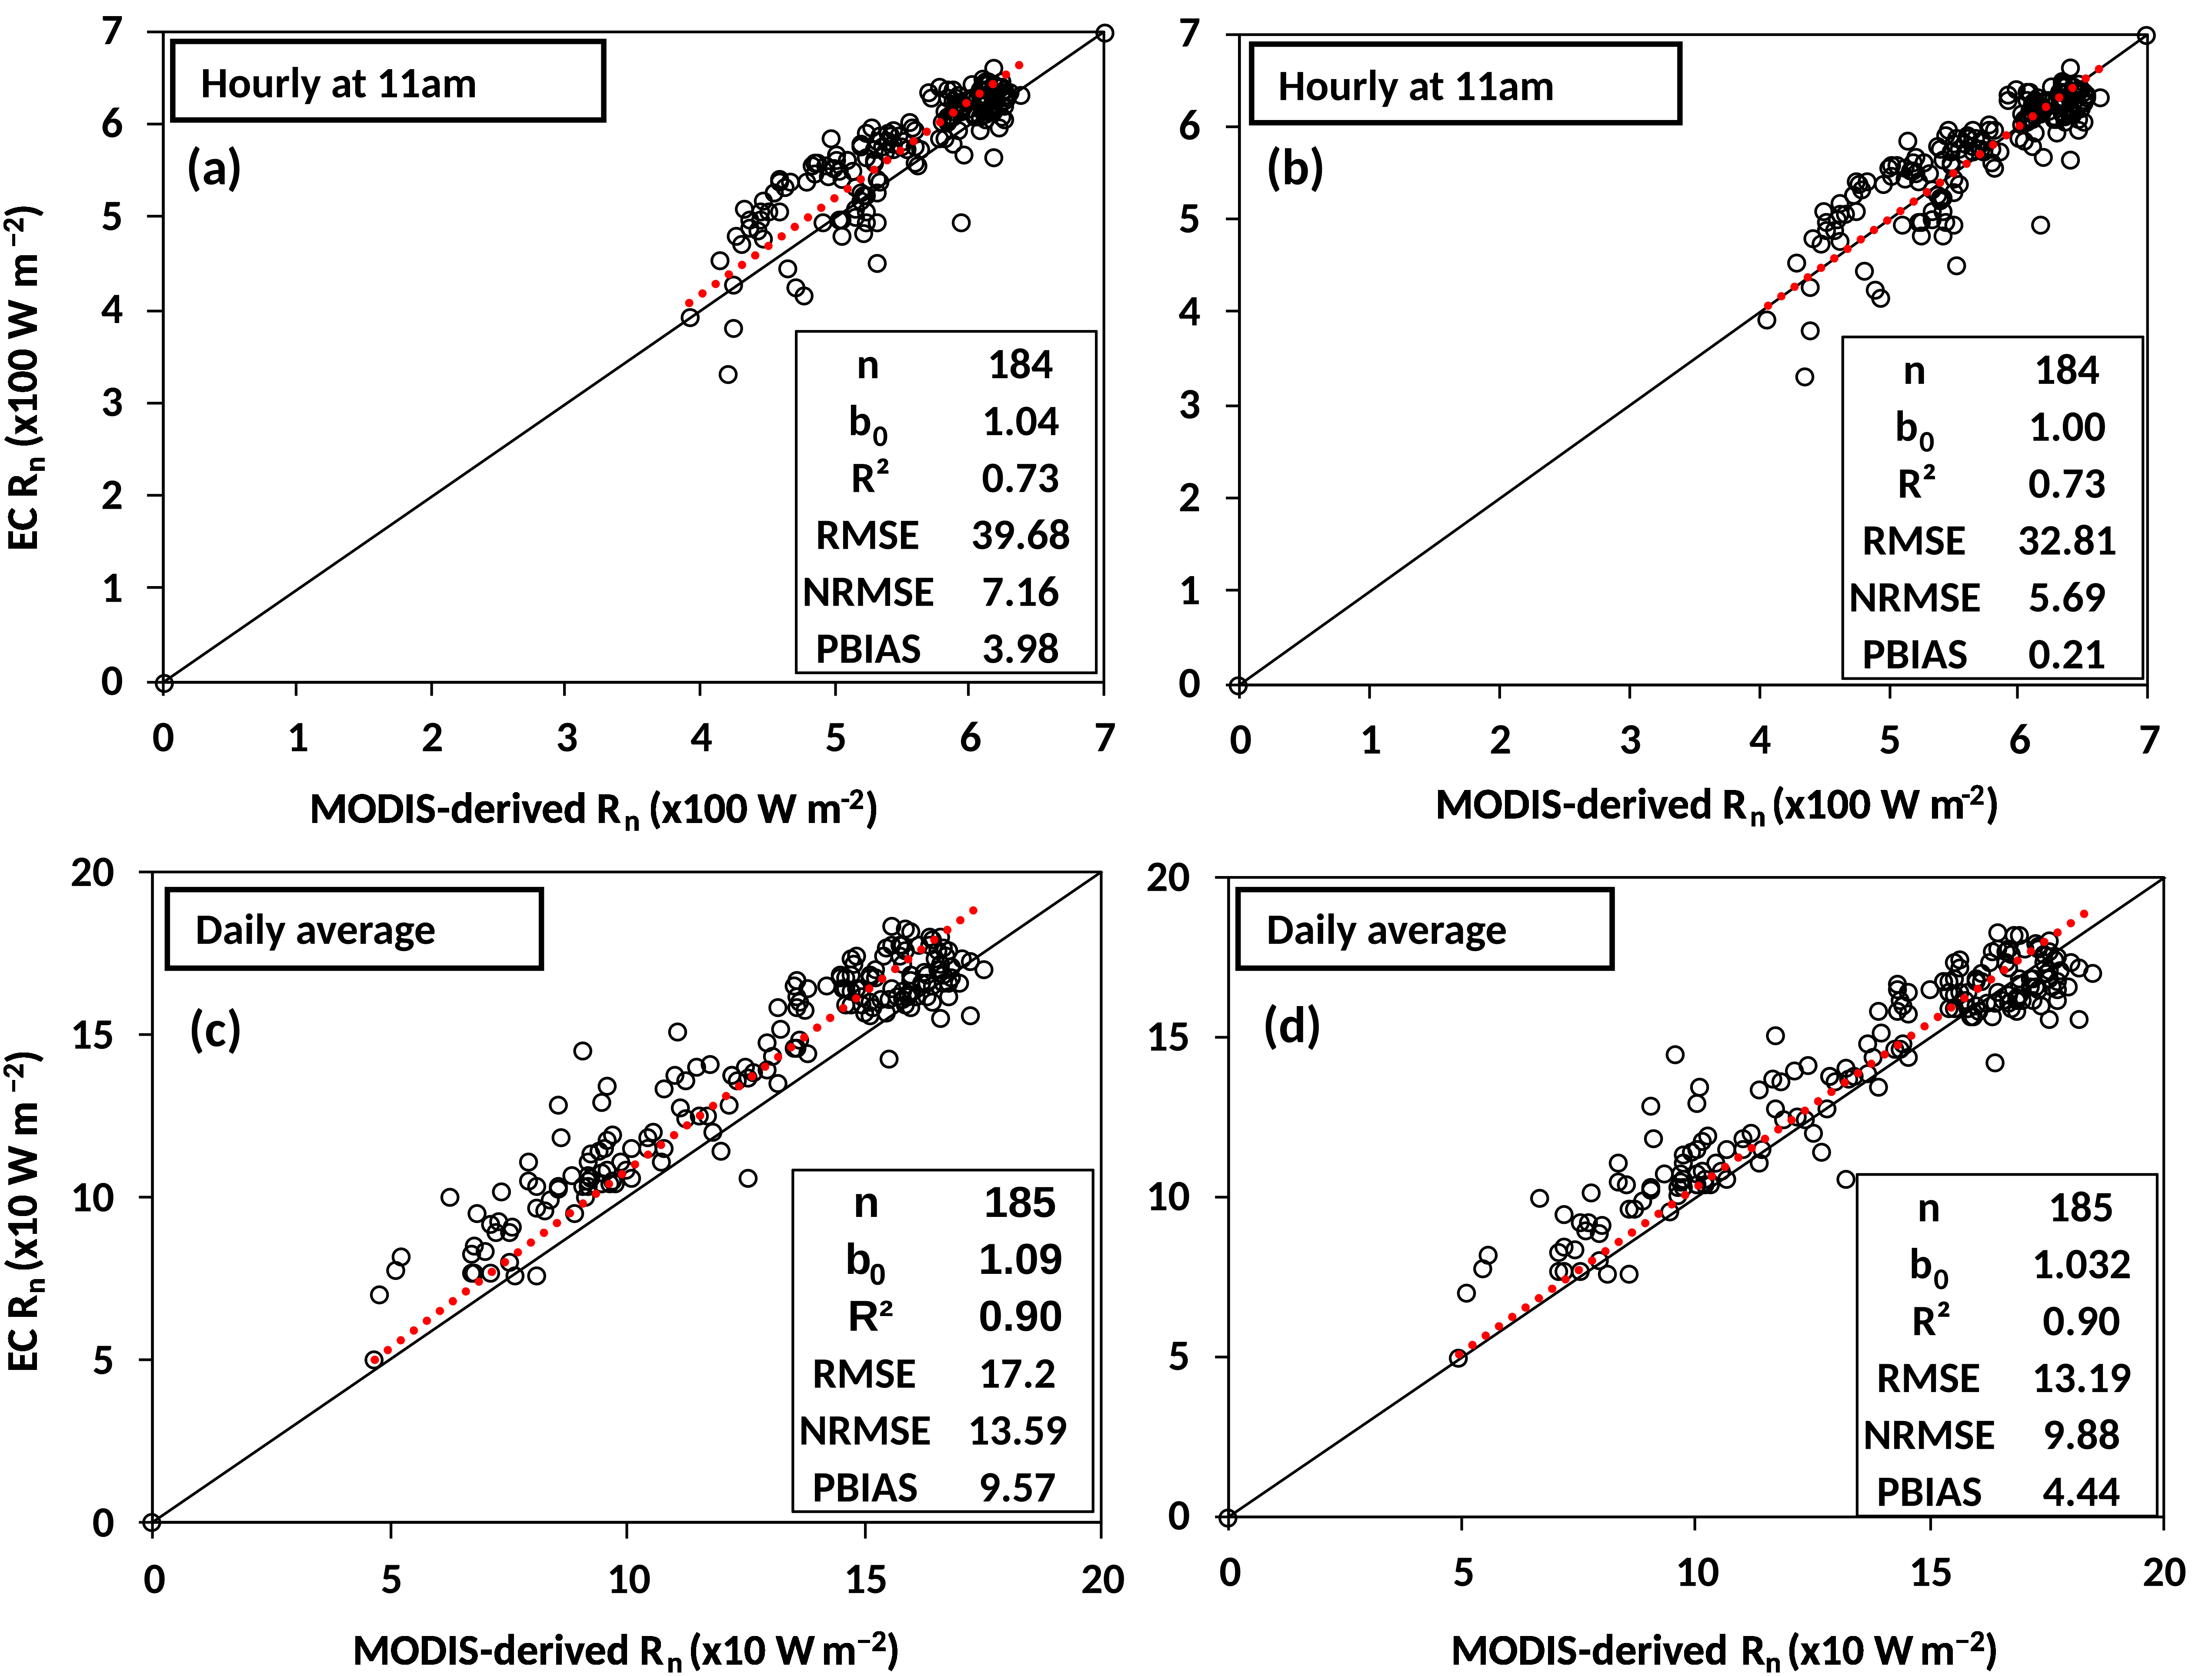
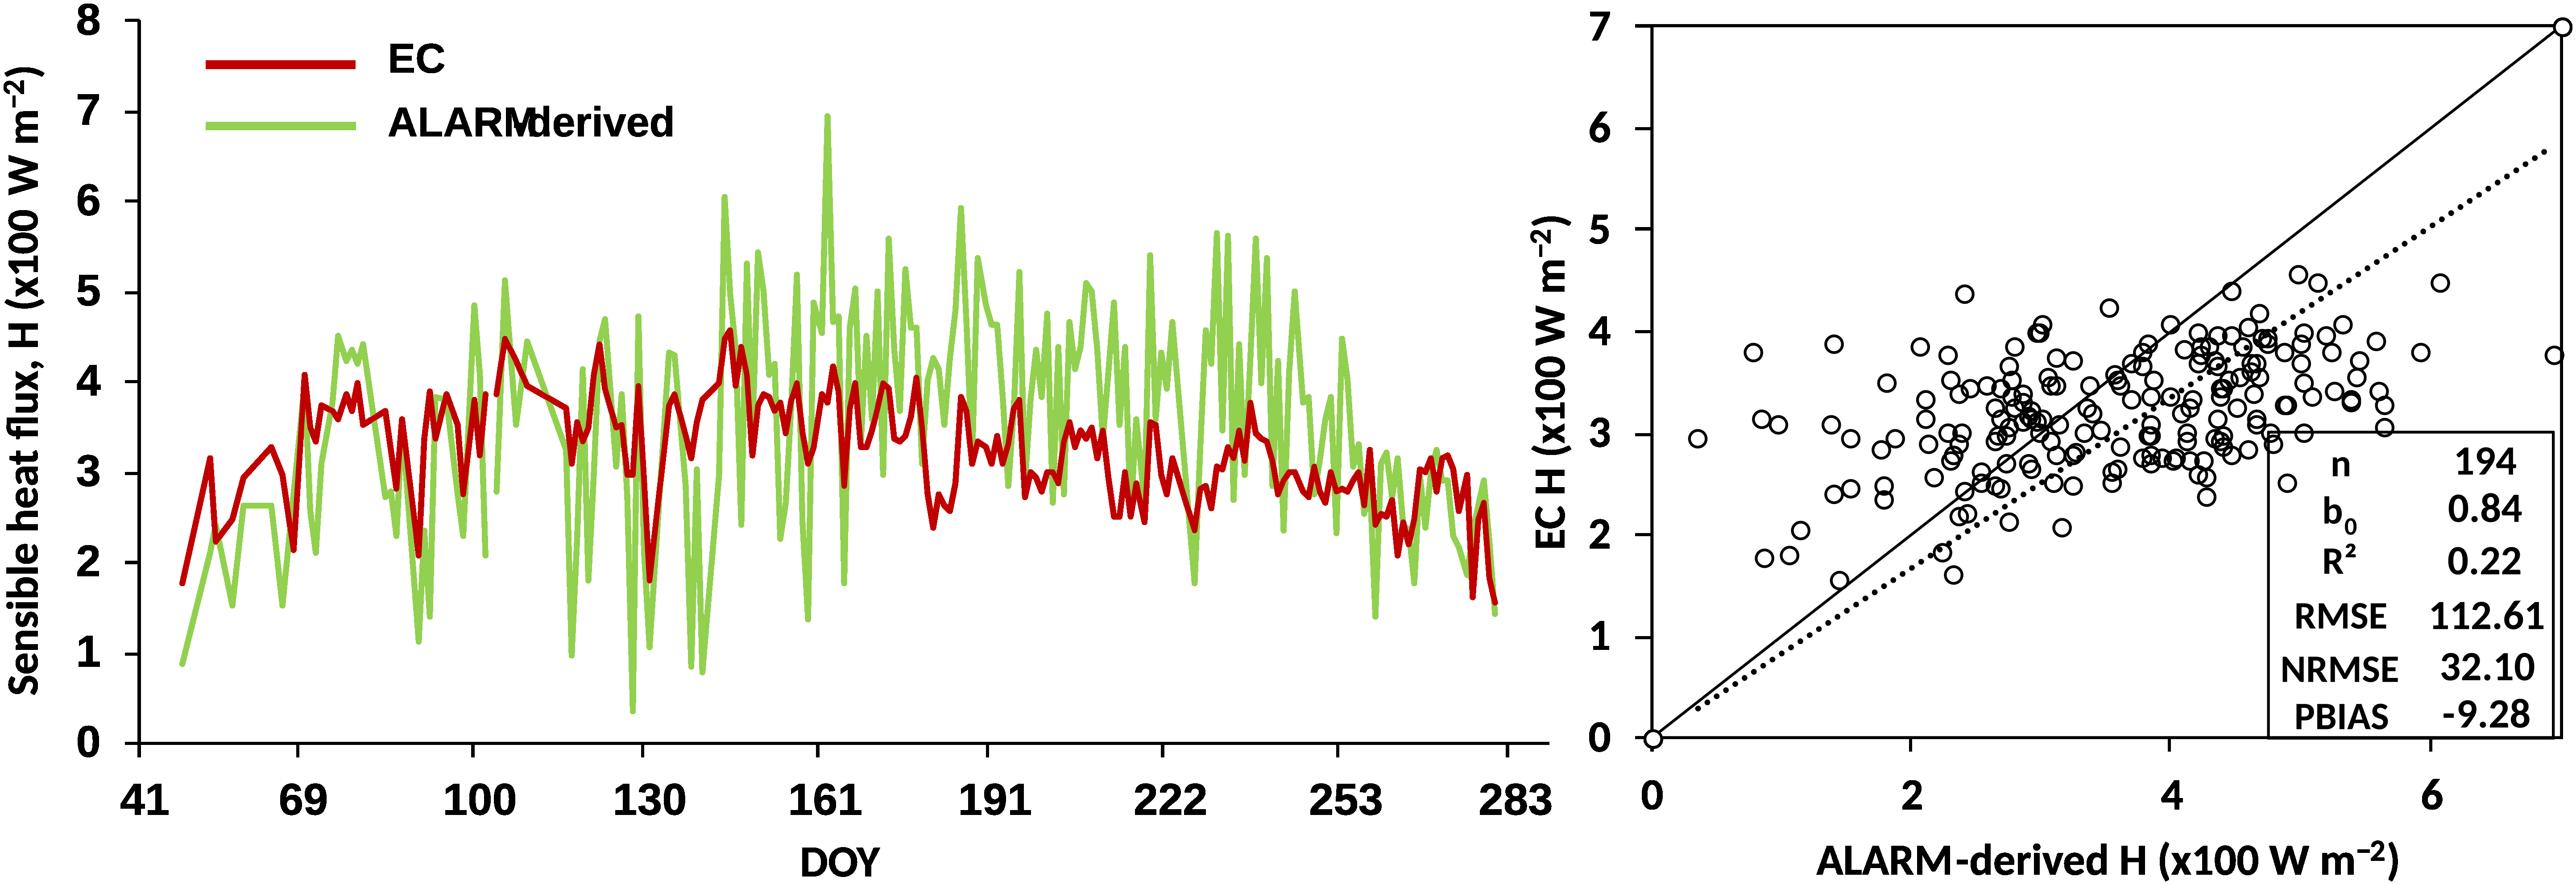
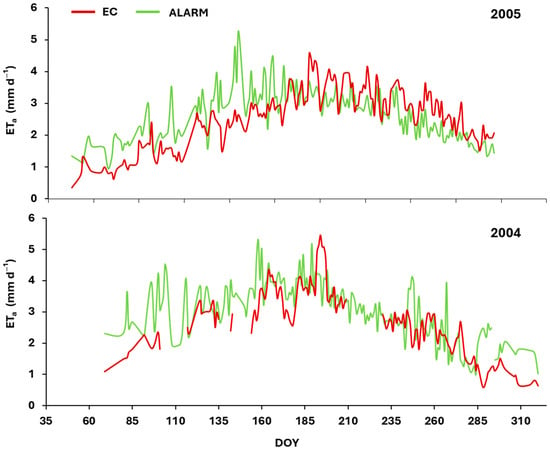
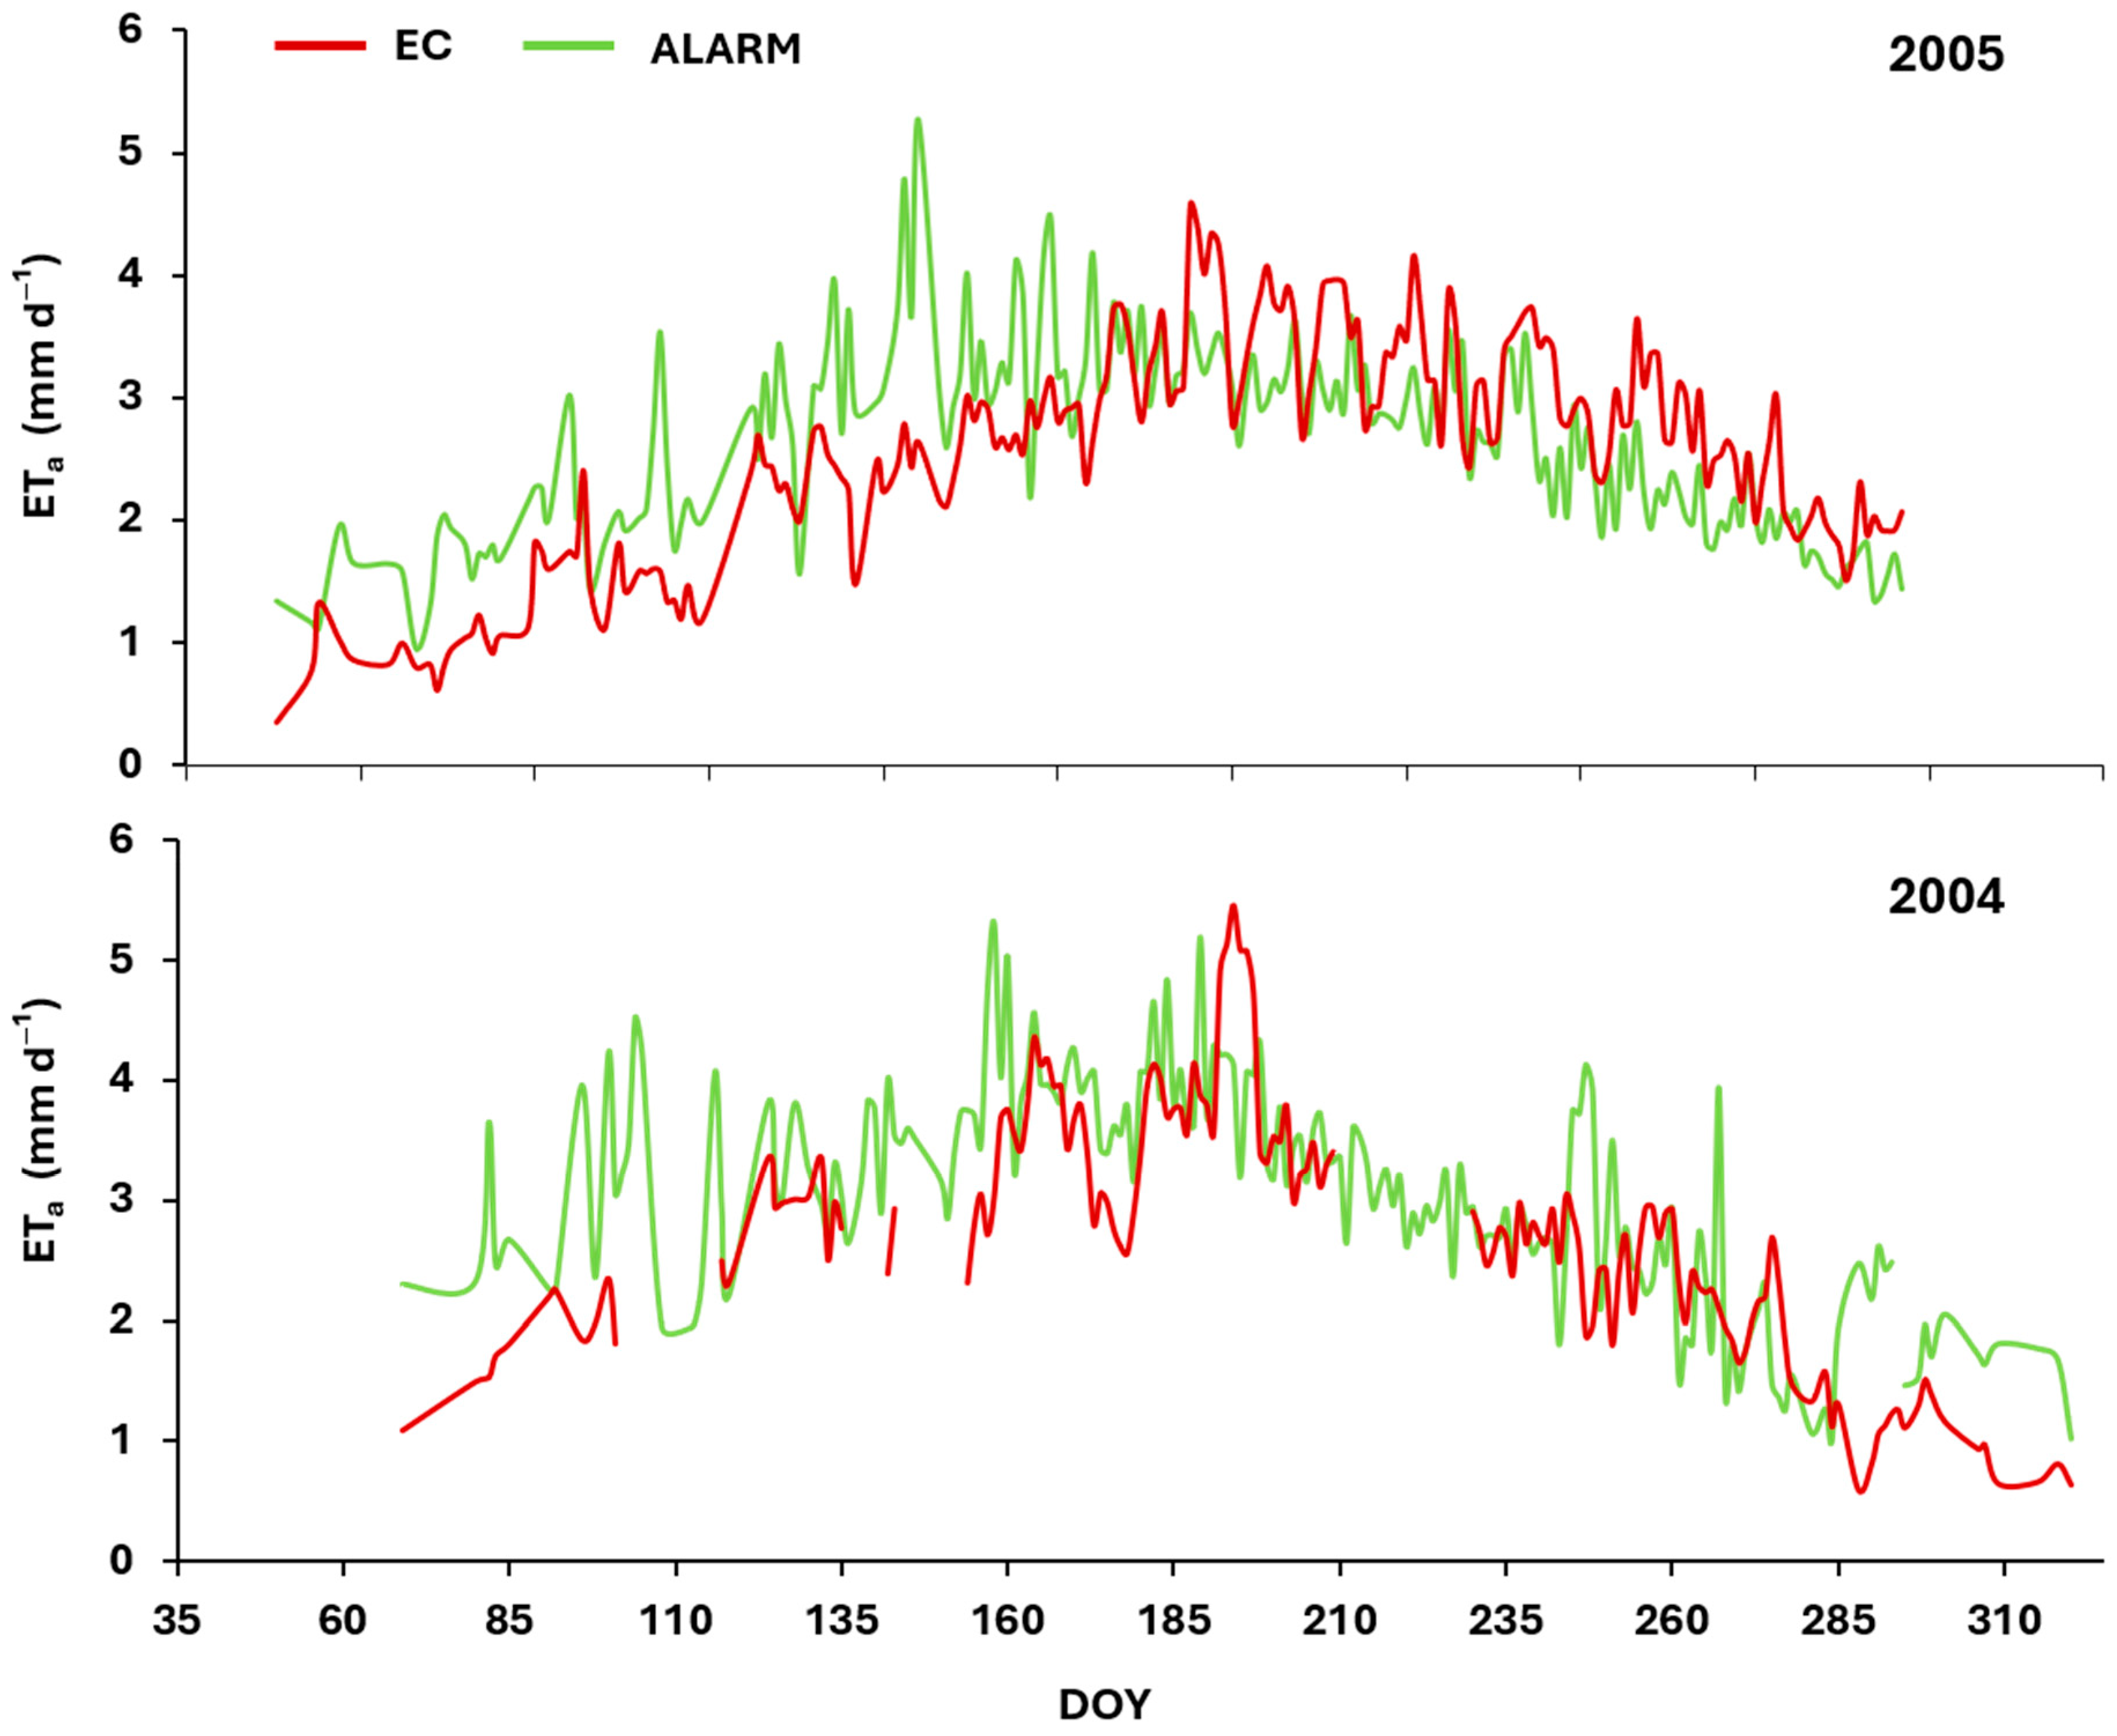
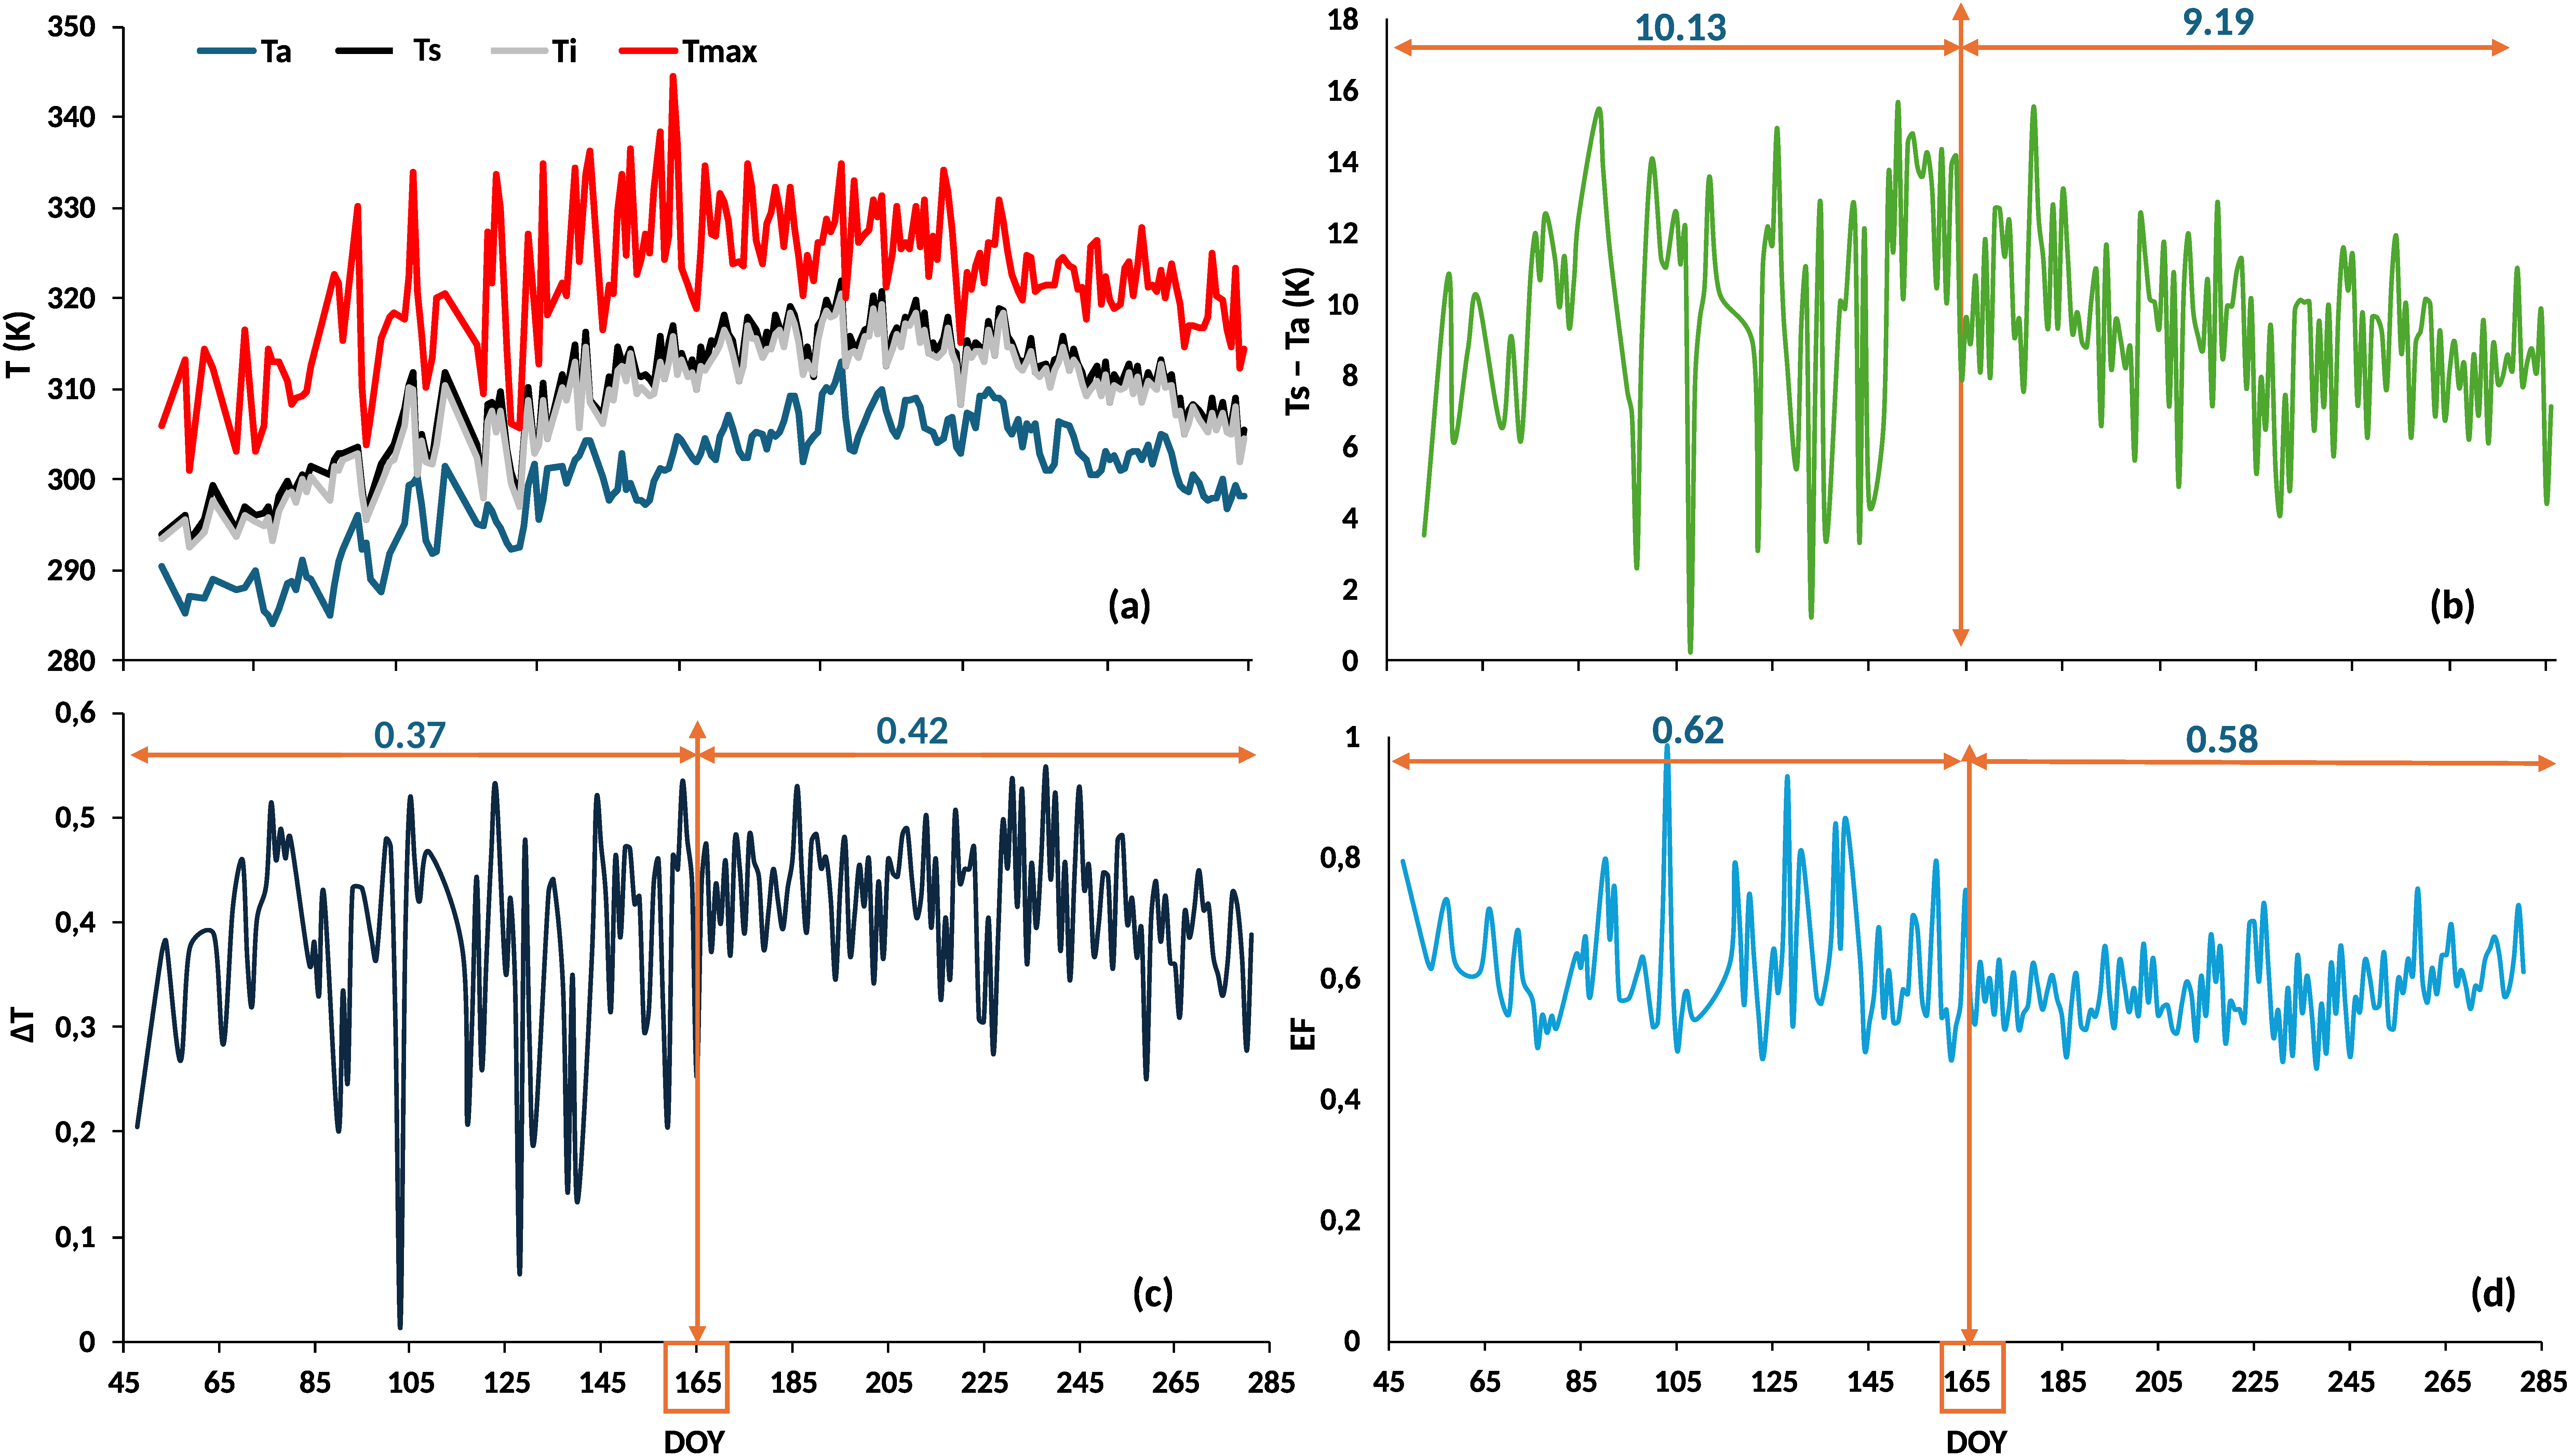

Disclaimer/Publisher’s Note: The statements, opinions and data contained in all publications are solely those of the individual author(s) and contributor(s) and not of MDPI and/or the editor(s). MDPI and/or the editor(s) disclaim responsibility for any injury to people or property resulting from any ideas, methods, instructions or products referred to in the content. |
© 2026 by the authors. Licensee MDPI, Basel, Switzerland. This article is an open access article distributed under the terms and conditions of the Creative Commons Attribution (CC BY) license.