


Abstract
Cascading hazards in high-mountain environments can evolve rapidly from slope failure to destructive downstream flooding, challenging conventional early-warning systems. The 26 August 2026 Langtang Lirung rock–ice avalanche and subsequent flood cascade along the Bhote Koshi–Trishuli corridor were examined through a retrospective synthesis of seismic, terrain, hydrological and documentary evidence. Event chronology reconstruction and reach-based analysis yielded apparent celerities of 47.3, 20.9 and 6.0 m s−1 across successive reaches of 22, 44 and 130 km. Propagation over the approximately 196 km corridor occurred within 6 h 43 min of the catalogued seismic marker. Deterministic sensitivity analysis preserved the downstream decline in celerity under the specified timing and distance perturbations, although uncertainty in event initiation, flow formation and observational timing limits hydraulic interpretation. The warning-chain assessment identified insufficient evidence to verify end-to-end operational capability. A two-stage framework is proposed, which combines evidence-based hazard screening, operational readiness, scenario development and direct emergency escalation.
1. Introduction
High-mountain floods can arise from glacial water storage, slope instability, or interactions among multiple processes. Global estimates indicate substantial downstream exposure to glacial lake outburst floods [1], but lake inventories capture only one class of potential source. Effective warning therefore depends on recognising alternative initiation mechanisms and the pathways through which hazards propagate downstream.
The 2021 Chamoli rock–ice avalanche and the 2012 Seti River disaster illustrate how high-mountain mass movements can transform into destructive downstream flows [2,3]. Both events highlight the roles of entrainment, water availability, sediment mobilisation and channel confinement in cascade development. Their relevance to Langtang Lirung lies in these process interactions rather than in direct analogy: differences in source conditions, water contribution, observational coverage and exposure limit the transferability of event-specific precursors or mechanisms.
Recent research and international guidance increasingly treat cascading mountain hazards as interconnected processes requiring coordinated assessment and response [4,5,6,7]. An important challenge is translating incomplete and uneven evidence into operational warning decisions. Evidence provenance, propagation uncertainty and warning-system capability are therefore considered together here to examine how physical hazard evolution relates to the time and information available for protective action.
The 26 August 2026 Langtang Lirung event provides a recent case for examining these relationships along the Bhote Koshi–Trishuli–Narayani corridor in the Nepal Himalaya. Event chronology, reach-based apparent celerity and warning-system evidence are reconstructed from available seismic, terrain, hydrological and documentary records. The July 2025 supraglacial lake outbursts near the China–Nepal border provide relevant transboundary context [8] but represent a distinct hazard process. No specific climatic or cryospheric mechanism is assigned to the 2026 event without supporting site-level evidence.
The analysis focuses on four interrelated aspects: the chronology of the cascade, the consistency and sensitivity of downstream propagation estimates, the processes supported by the available hazard evidence, and the implications for multi-hazard early warning. Documentary and observational records are evaluated alongside deterministic sensitivity tests to distinguish reported observations, derived estimates and unresolved interpretations.
2. Materials and Methods
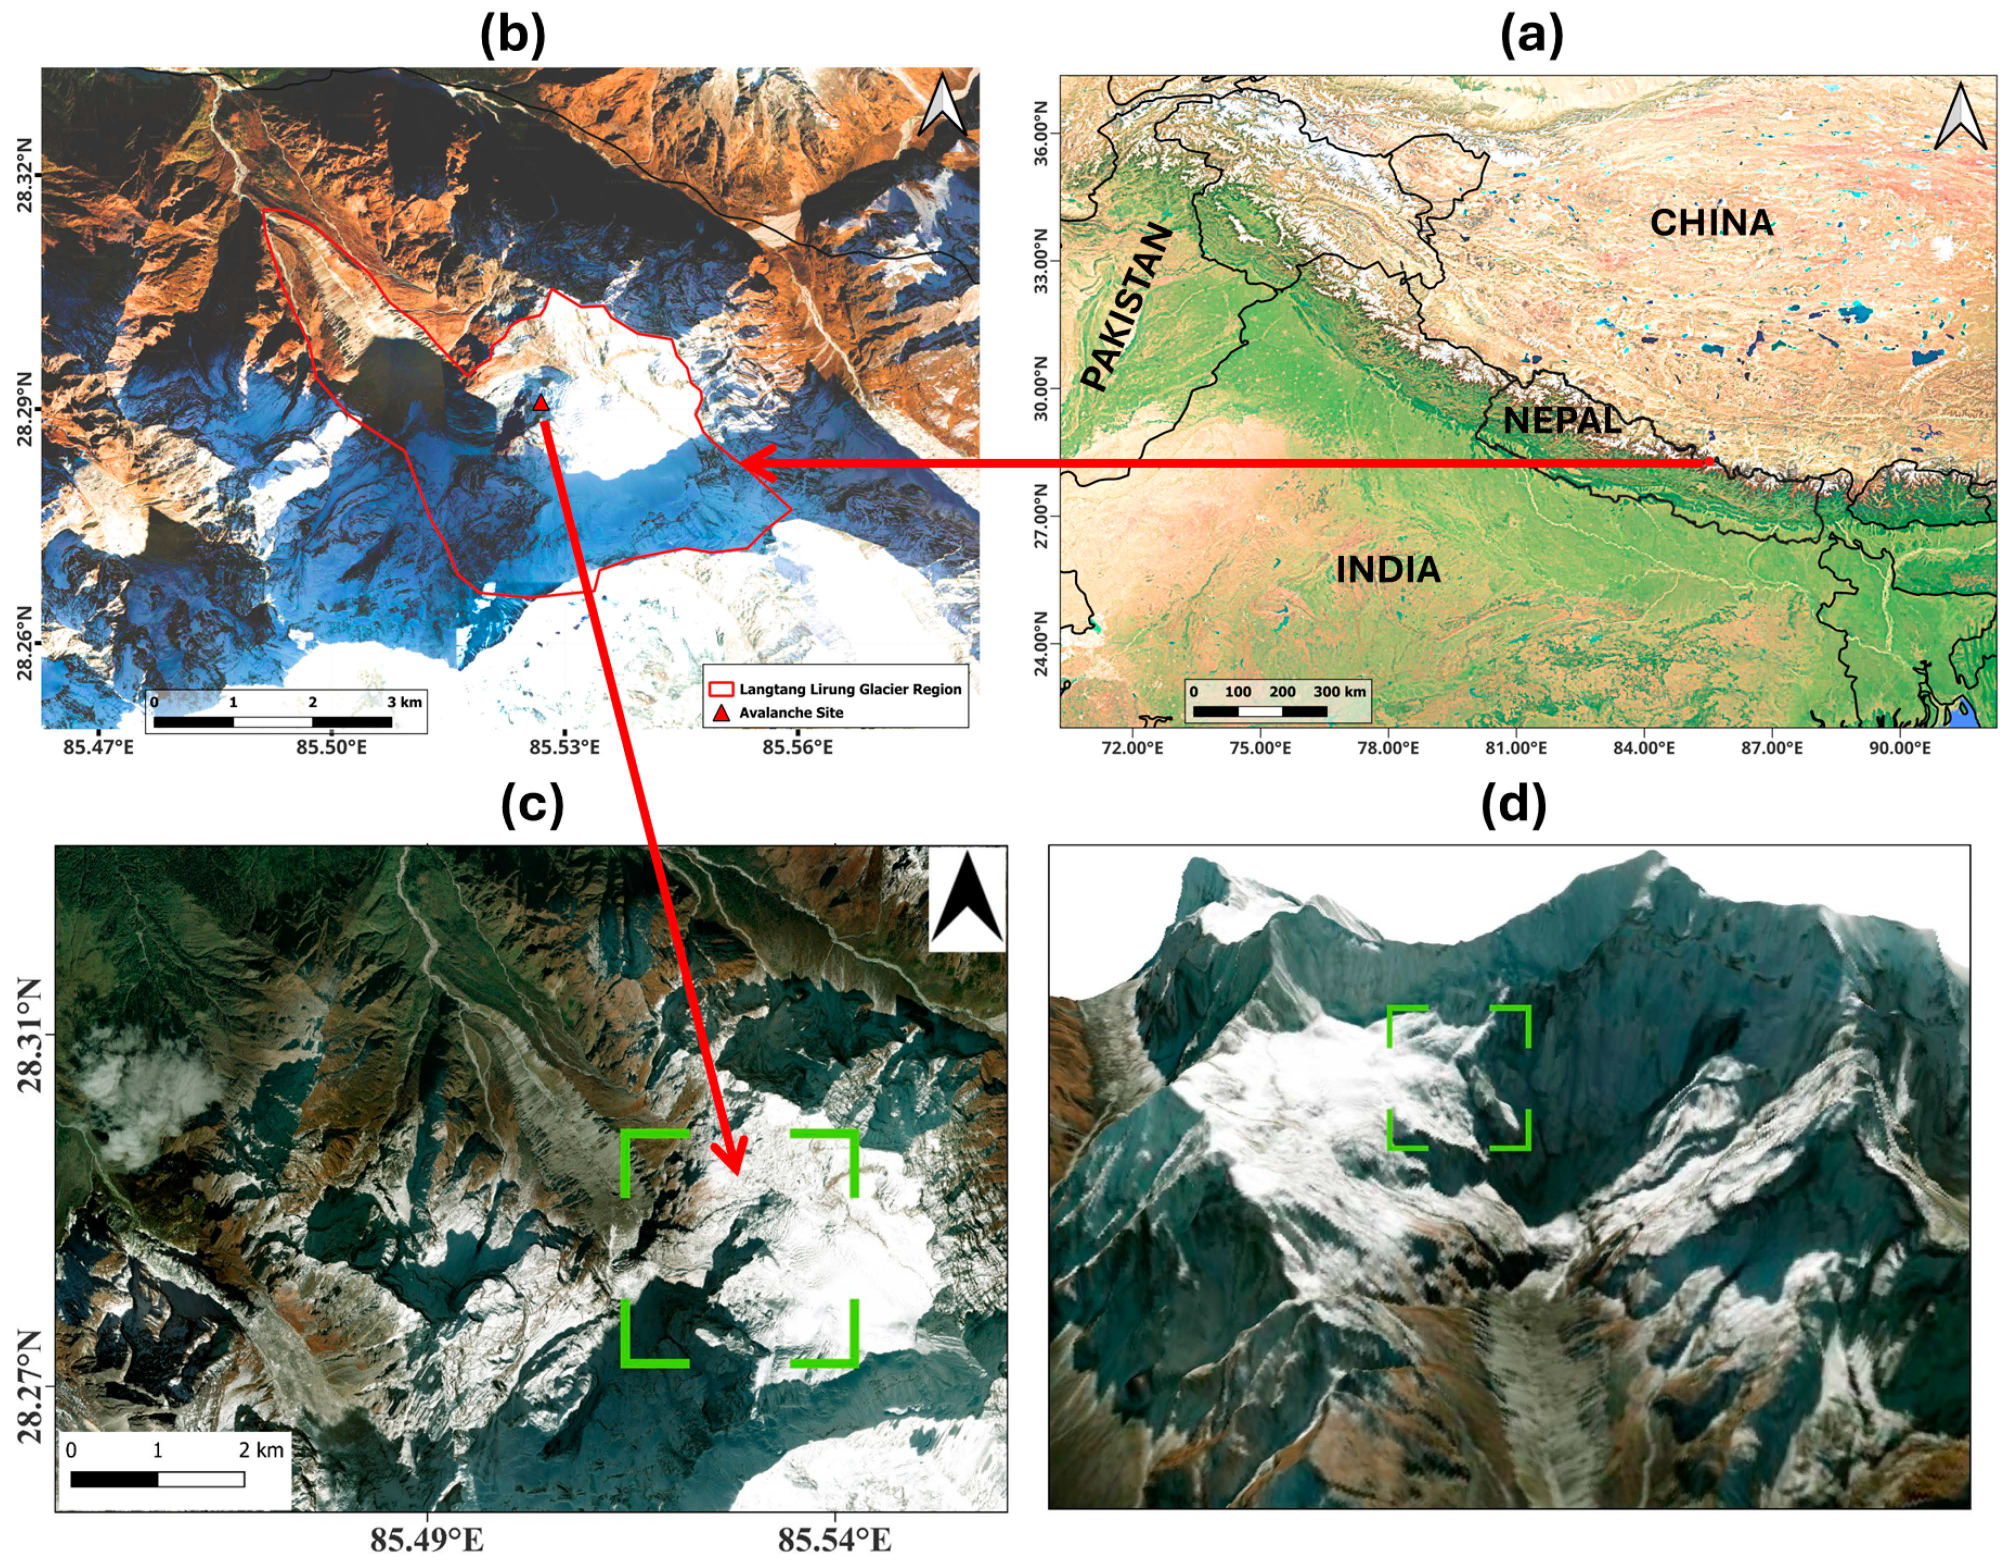
The reported source area is situated on the northern flank of Langtang Lirung in Rasuwa District, Nepal. The terrain analysis encompassed a rectangular domain extending from 85.4900° to 85.5308° E and 28.2767° to 28.3127° N (Figure 1), covering approximately 15.99 km2. This analytical domain is distinct from the reported area of surface disturbance (approximately 10 km2) and the estimated terminal detachment area (approximately 0.56 km2). These spatial measures represent different components of the event and are therefore treated separately in the analysis.
Figure 1.
Geographic location and topographic setting of the Langtang Lirung study area: (a) study area location within Nepal and its regional context; (b) Langtang Lirung Glacier and the identified avalanche source area; (c) regional geomorphic setting highlighting the reported avalanche initiation zone (green zone); and (d) three-dimensional view of the northern slope of Langtang Lirung. Source: Authors.
The event reconstruction draws on documentary records, terrain information, the reviewed USGS seismic catalogue entry [9], and event and response information reported in the Rapid Damage and Needs Assessment (RDNA) [10]. The USGS catalogue identifies the magnitude 5.2 seismic signal as a landslide event, providing the principal temporal reference for reconstruction of the event chronology. Hydrological information from the RDNA was interpreted alongside the available event records; however, the underlying hydrograph and original station datasets were unavailable for independent verification. Reported observations and independently derived quantities are identified separately throughout the analysis.
Remote-sensing sources were assessed in relation to the specific variable examined, acquisition date, spatial resolution, cloud conditions, viewing geometry, accessibility and reproducibility. Optical imagery from Landsat, Sentinel-2, PlanetScope and Gaofen-1 provides complementary information for characterising surface conditions and geomorphic change, whereas Sentinel-1 radar observations offer cloud-independent coverage. Interpretation of radar observations in steep, snow- and ice-covered mountain terrain nevertheless requires consideration of geometric distortion, including layover and shadow, as well as speckle and reduced coherence over dynamically changing surfaces [11]. The remote-sensing evidence available for this study was therefore used primarily to support spatial and contextual interpretation rather than independent quantitative reconstruction of surface displacement. Satellite imagery processing and visualisation were undertaken using Google Earth Engine, while final cartographic products were prepared in QGIS.
2.1. Event Reconstruction and Analytical Framework
The analytical framework comprises event chronology, evidence-provenance assessment, terrain characterisation, propagation analysis, deterministic sensitivity testing, hazard classification and evaluation of early-warning capacity (Figure 2). Documentary and observational records established the temporal sequence and provenance of individual observations. Reported arrival times, channel distances and elevation differences provided the inputs for the reach-based calculations. Sensitivity tests quantified the influence of timing, distance and terrain assumptions on the derived estimates. The reconstructed cascade subsequently informed the early-warning assessment.
The event chronology was reconstructed from the reviewed USGS landslide record [9] and the available documentary observations of downstream arrivals. The USGS seismic signal at 02:52:10 UTC (08:37:10 Nepal time) was adopted as the temporal reference for the analysis. Subsequent reported arrivals occurred at Rasuwagadhi at 08:44:55, Betrawati at approximately 09:20 and Devghat at approximately 15:20 (Table 1). Because these observations originate from sources with different levels of temporal precision and independent verification, each time marker was assigned an evidence-provenance category reflecting the quality of the underlying record rather than statistical confidence.
Table 1.
Chronology and provenance of observations used in the event reconstruction.
The propagation corridor was divided into three successive reaches of approximately 22, 44 and 130 km on the basis of the available event reconstruction. Reach-averaged apparent celerity between consecutive observation points was calculated as Equation (1):
where cij is the apparent celerity between locations i and j, dij is the corresponding reach distance, and ti and tj are the respective observation times. The calculated quantity represents the average rate of downstream propagation between observation points and is distinguished from local flow velocity or a hydraulically calibrated routing parameter.
The sensitivity of the celerity estimates to uncertainty in event timing and reach distance was examined using deterministic perturbation analysis. Timing perturbations of ±30 s for the seismic reference, ±60 s for Rasuwagadhi, and ±5 min for both Betrawati and Devghat were applied to reflect the differing temporal precision of the source records. A ±5% perturbation in reach distance was additionally evaluated.
The principal assumptions and sensitivity parameters applied to the event reconstruction are summarised in Table 2. The analysis distinguishes uncertainty associated with event chronology and spatial measurements from uncertainty arising from unavailable primary observations. This distinction is important because deterministic perturbation of reported values evaluates the sensitivity of derived quantities but does not provide empirical estimates of measurement error.
Table 2.
Principal assumptions and sensitivity parameters used in the analysis.
Propagation time defines the maximum physical interval potentially available for downstream warning and protective action; however, it does not represent effective warning lead time. Operationally usable lead time was therefore conceptualised as Equation (2)
where tarrival − tdetection represents the interval between effective event detection and downstream arrival, while Ldecision, Ldelivery, and Lmobilisation represent the time required for interpretation and decision-making, warning dissemination, and protective action, respectively. As these operational latencies were not systematically recorded for the event, the reconstructed propagation times are interpreted as upper bounds on potential response time rather than realised warning lead times.
Lusable = (tarrival − tdetection) − (Ldecision + Ldelivery + Lmobilisation)
2.2. Terrain, Mapping and Hydrological Analysis
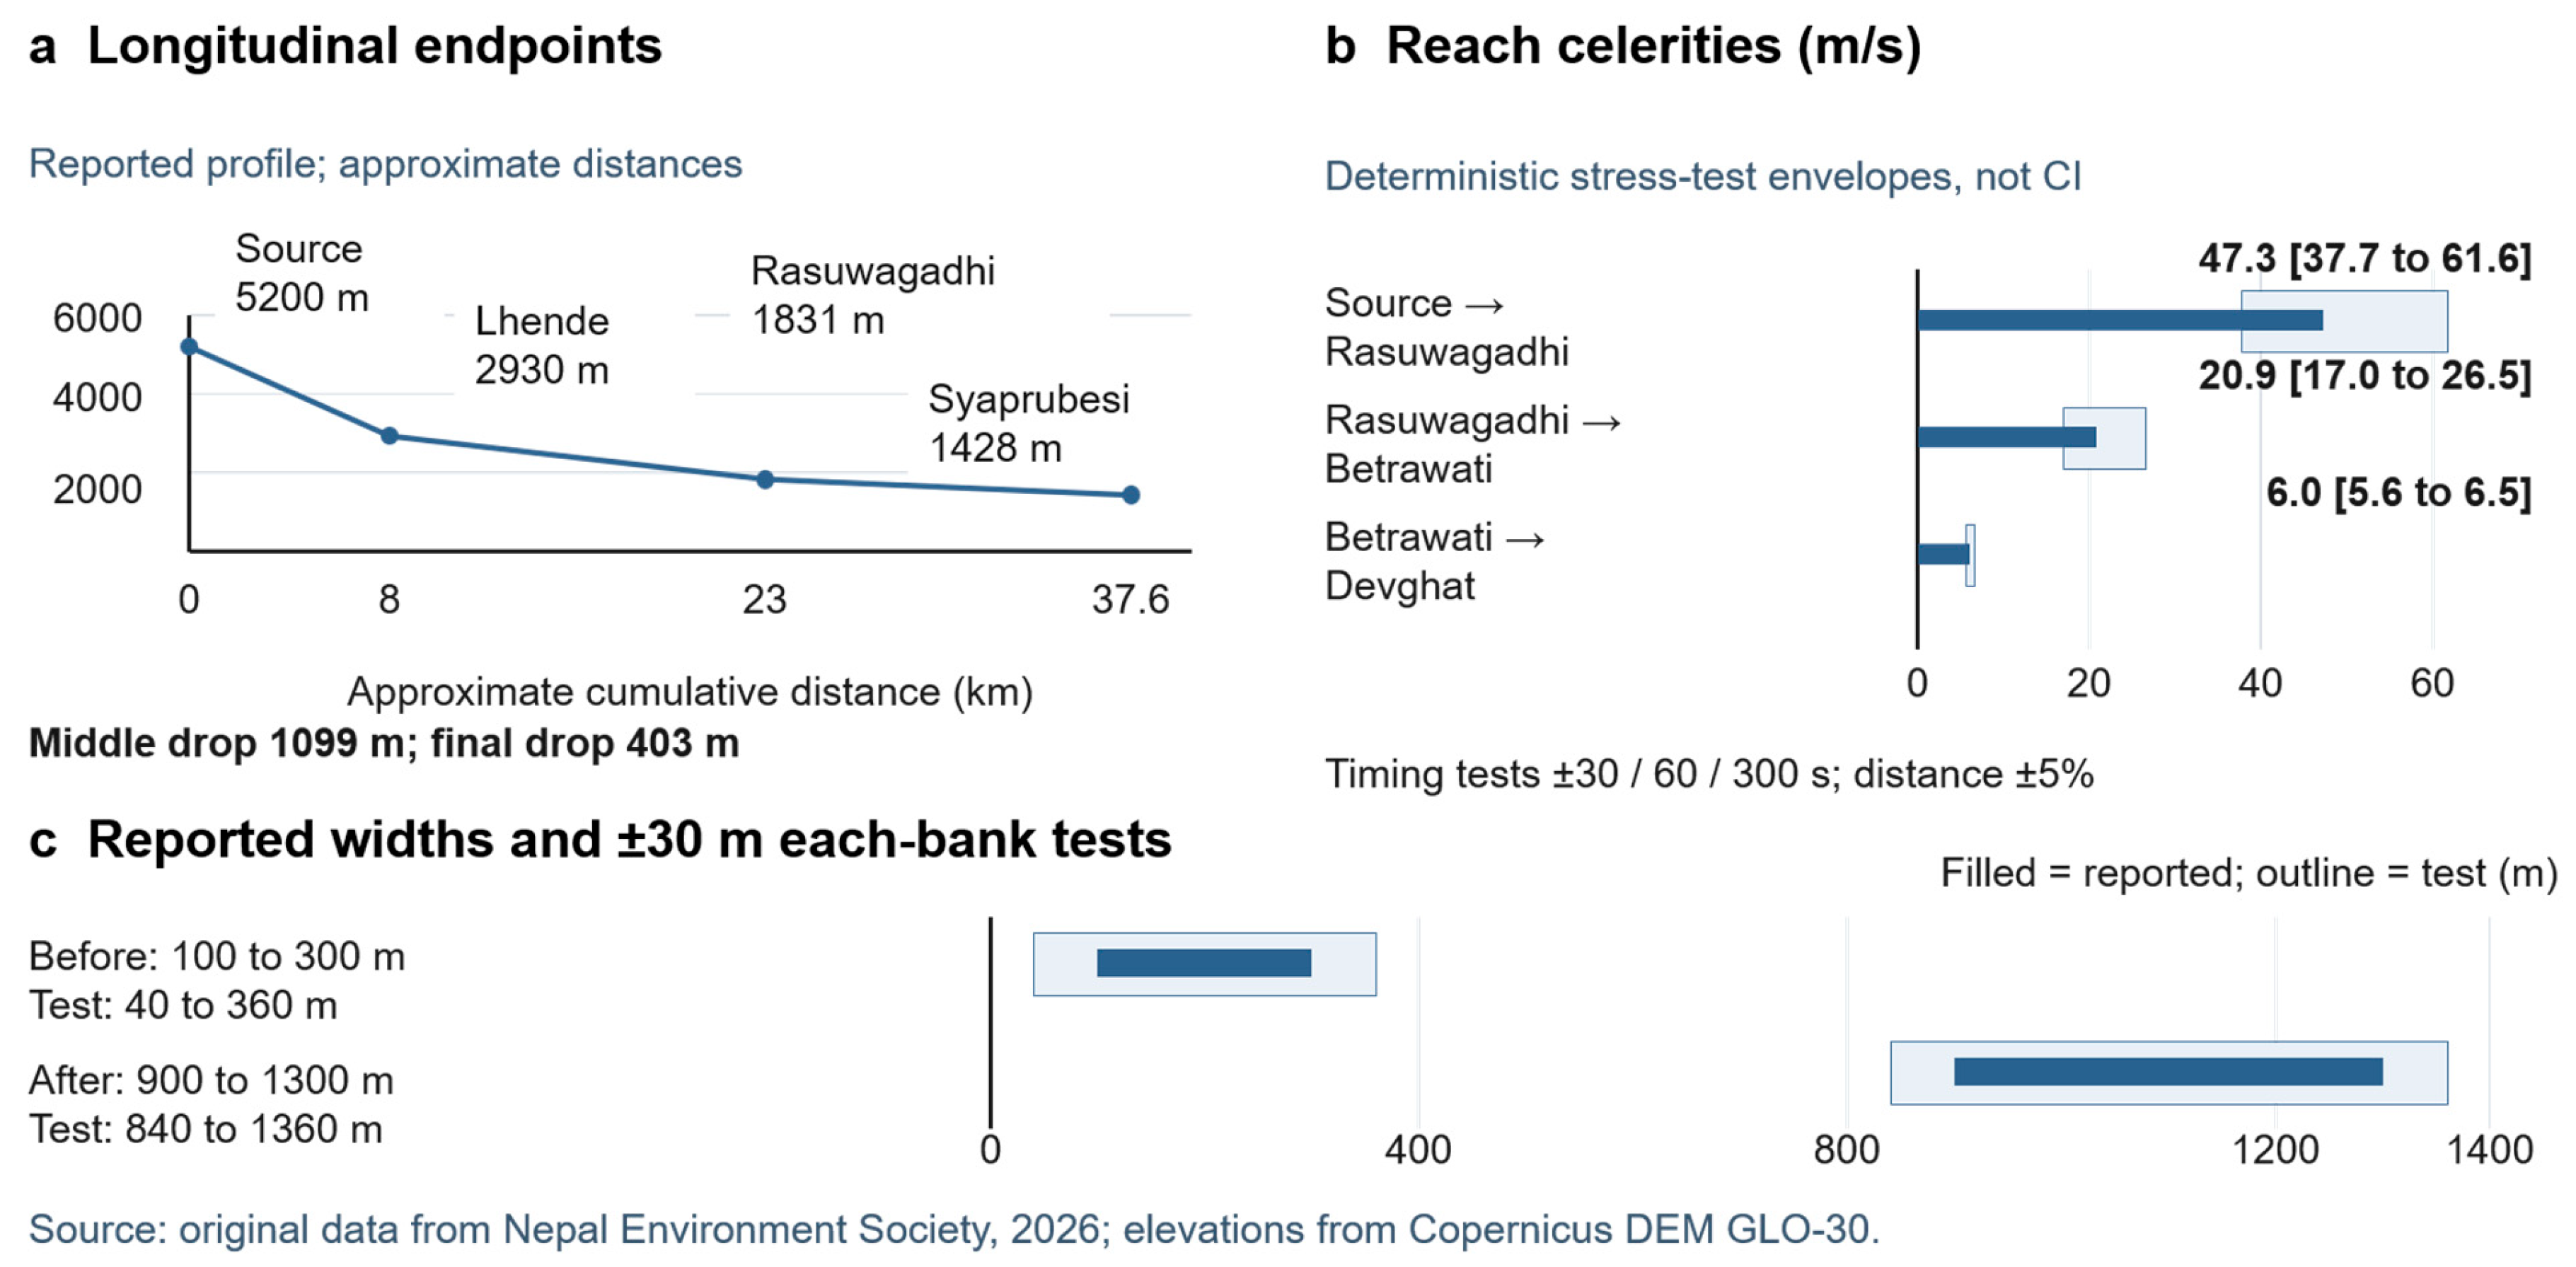
The terrain profile was characterised using reported elevations of approximately 5200, 2930, 1831 and 1428 m at the source area, Lhende, Rasuwagadhi and Syaprubesi, respectively. Corresponding profile-segment lengths were approximately 8, 15 and 14.6 km. Mean longitudinal gradient for each segment was calculated as Equation (3):
where zu and zd denote upstream and downstream elevations and d is the corresponding segment length. These terrain-profile segments were analysed independently of the 22, 44 and 130 km reaches used for propagation analysis because the two sets of distances represent different spatial units.
Terrain characteristics were further informed by slope statistics derived from Copernicus DEM GLO-30 using a Horn-based terrain method [12]. Within the 15.99 km2 analytical domain, the available terrain information reported a mean slope of 38.4°, a median of 37.7° and a maximum of 79.5°. HydroSHEDS information provided supplementary drainage context but was not used to reconstruct the complete 196 km propagation corridor.
Sensitivity of the longitudinal gradients to elevation uncertainty was examined by applying ±10 m perturbations to opposing segment endpoints, equivalent to a maximum ±20 m perturbation in elevation difference. This analysis evaluates the sensitivity of reach-scale gradients to endpoint elevation variation and does not represent a spatially distributed DEM-error model.
Geomorphic change was examined using reported pre-event corridor widths of 100–300 m and post-event widths of 900–1300 m. Positional sensitivity was assessed using a ±30 m perturbation at each channel margin, equivalent to ±60 m in total width. Because the reported ranges do not represent spatially matched cross-sections, they were evaluated as indicators of the magnitude of corridor modification rather than used to calculate a single widening ratio. Similarly, the estimated detachment area of approximately 0.56 km2 was retained as an approximate spatial measure because a georeferenced source polygon was unavailable.
Reported hydrological quantities included a peak discharge of 5850 m3 s−1, total flood volume of 57.4 million m3 and excess volume of 19.96 million m3 in the RDNA documentation [10]. Independent reconstruction of these quantities would require the underlying hydrograph, rating relationship, integration period and baseflow definition. Consequently, these reported values were treated as contextual hydrological information rather than independently derived quantitative results. The corresponding volume relationships are Equations (4) and (5)
and
where Q(t) denotes discharge and Qbase(t) represents the corresponding baseflow over the integration interval t0 to t1.
2.3. Regional Hydroclimatic Context
Regional climatic conditions were characterised using published observations from the adjacent Langtang Khola catchment. Long-term observations for 1957–2002 indicate annual precipitation of approximately 814 mm, of which 77% occurred between June and September [13]. These observations provide regional hydroclimatic context but were not interpreted as direct meteorological forcing for the northern slope of Langtang Lirung or for the 26 August 2026 event.
A consistent catchment-scale estimate of potential evapotranspiration was not available for the same spatial and temporal domain and was therefore not introduced into the quantitative analysis. Likewise, no event-specific rainfall–evapotranspiration analysis or climate-attribution analysis was undertaken. Regional climatic information provided environmental context for the study area; propagation dynamics were reconstructed independently from the event chronology and spatial observations.
2.4. Hazard Classification and Early-Warning Assessment
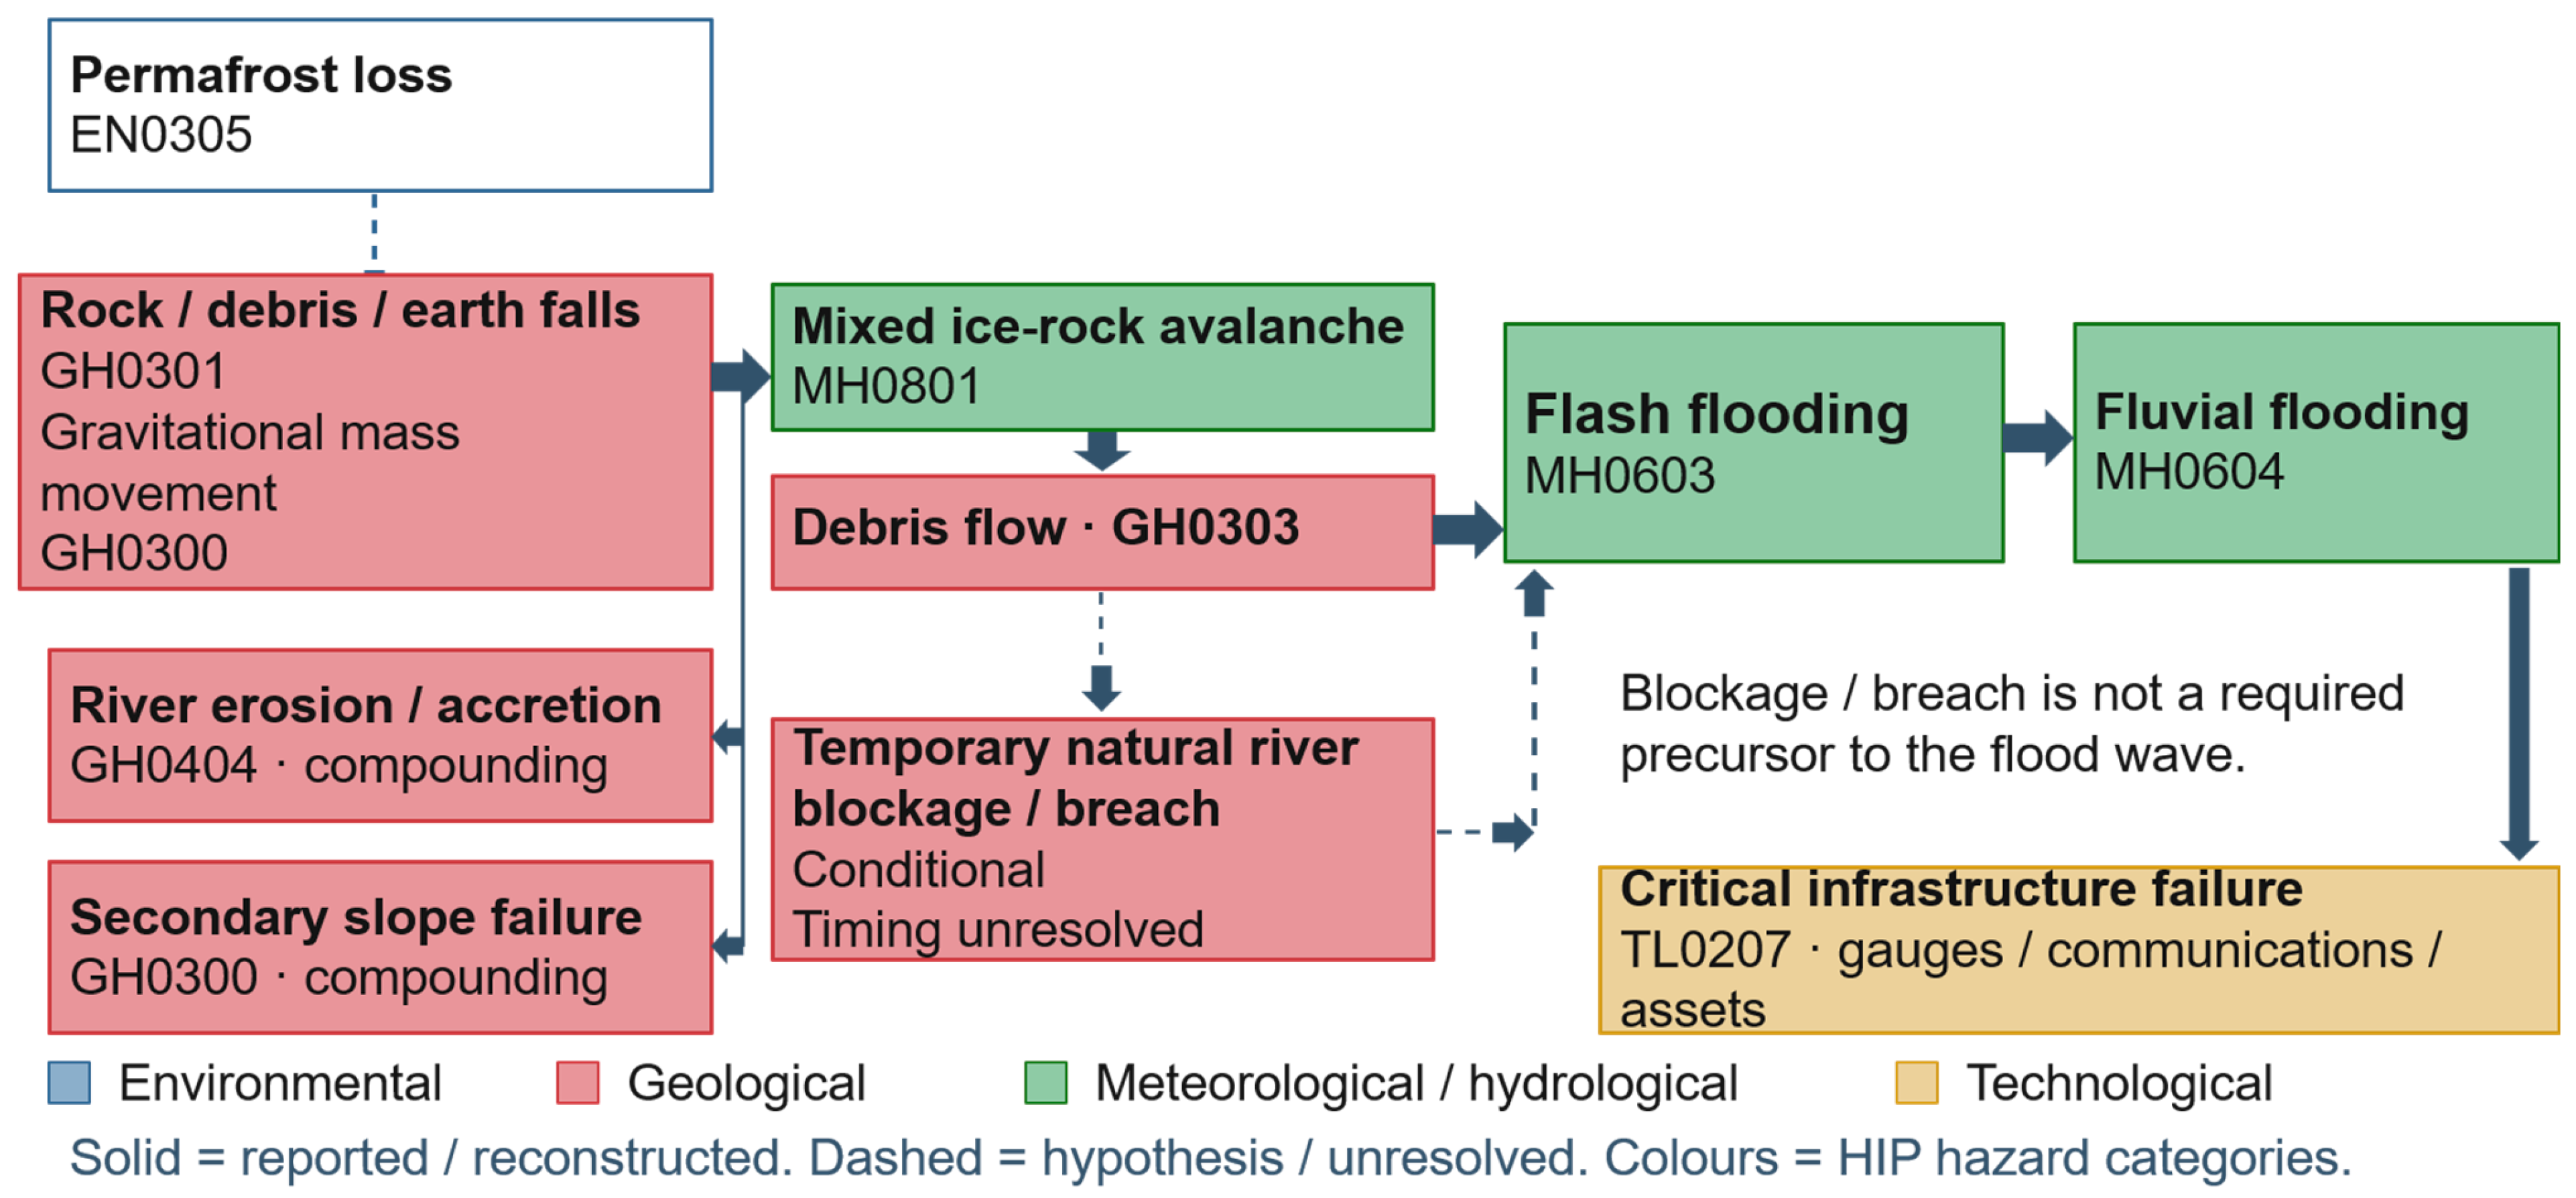
The hazard cascade was classified using the 2025 United Nations Office for Disaster Risk Reduction and International Science Council Hazard Information Profiles [14]. Hazard classes were assigned according to the strength of event-specific evidence, with conditional and unresolved processes identified separately. Relevant categories included rock, debris and earthfall (GH0301), the broader gravitational mass-movement category (GH0300), avalanche (MH0801), debris flow (GH0303), flash flood (MH0603), fluvial flood (MH0604), and river erosion and accretion (GH0404). Anthropogenic dam failure (TL0205) was excluded from the classification of natural channel blockage, while disruption to monitoring and telecommunications infrastructure was considered within the critical-infrastructure category (TL0207). Permafrost loss (EN0305) was retained as a potential environmental preconditioning process but was not assigned as an observed event mechanism in the absence of site-specific measurements (Figure 3).
Early-warning capacity was assessed using a 10-element framework adapted from the Total Warning System approach [15]. The assessment covered institutional arrangements, the Earth observation, data collection and sharing, hazard detection, decision support, warning products, impact forecasting, dissemination, risk communication, and community connection and response. Each element was evaluated against the available event-specific documentary evidence using four evidence states: functioning (F), partial (P), absent (A) and not verified (NV).
Figure 2.
Analytical framework for reconstruction of the Langtang Lirung cascade and assessment of its implications for multi-hazard early warning [12,14,15].
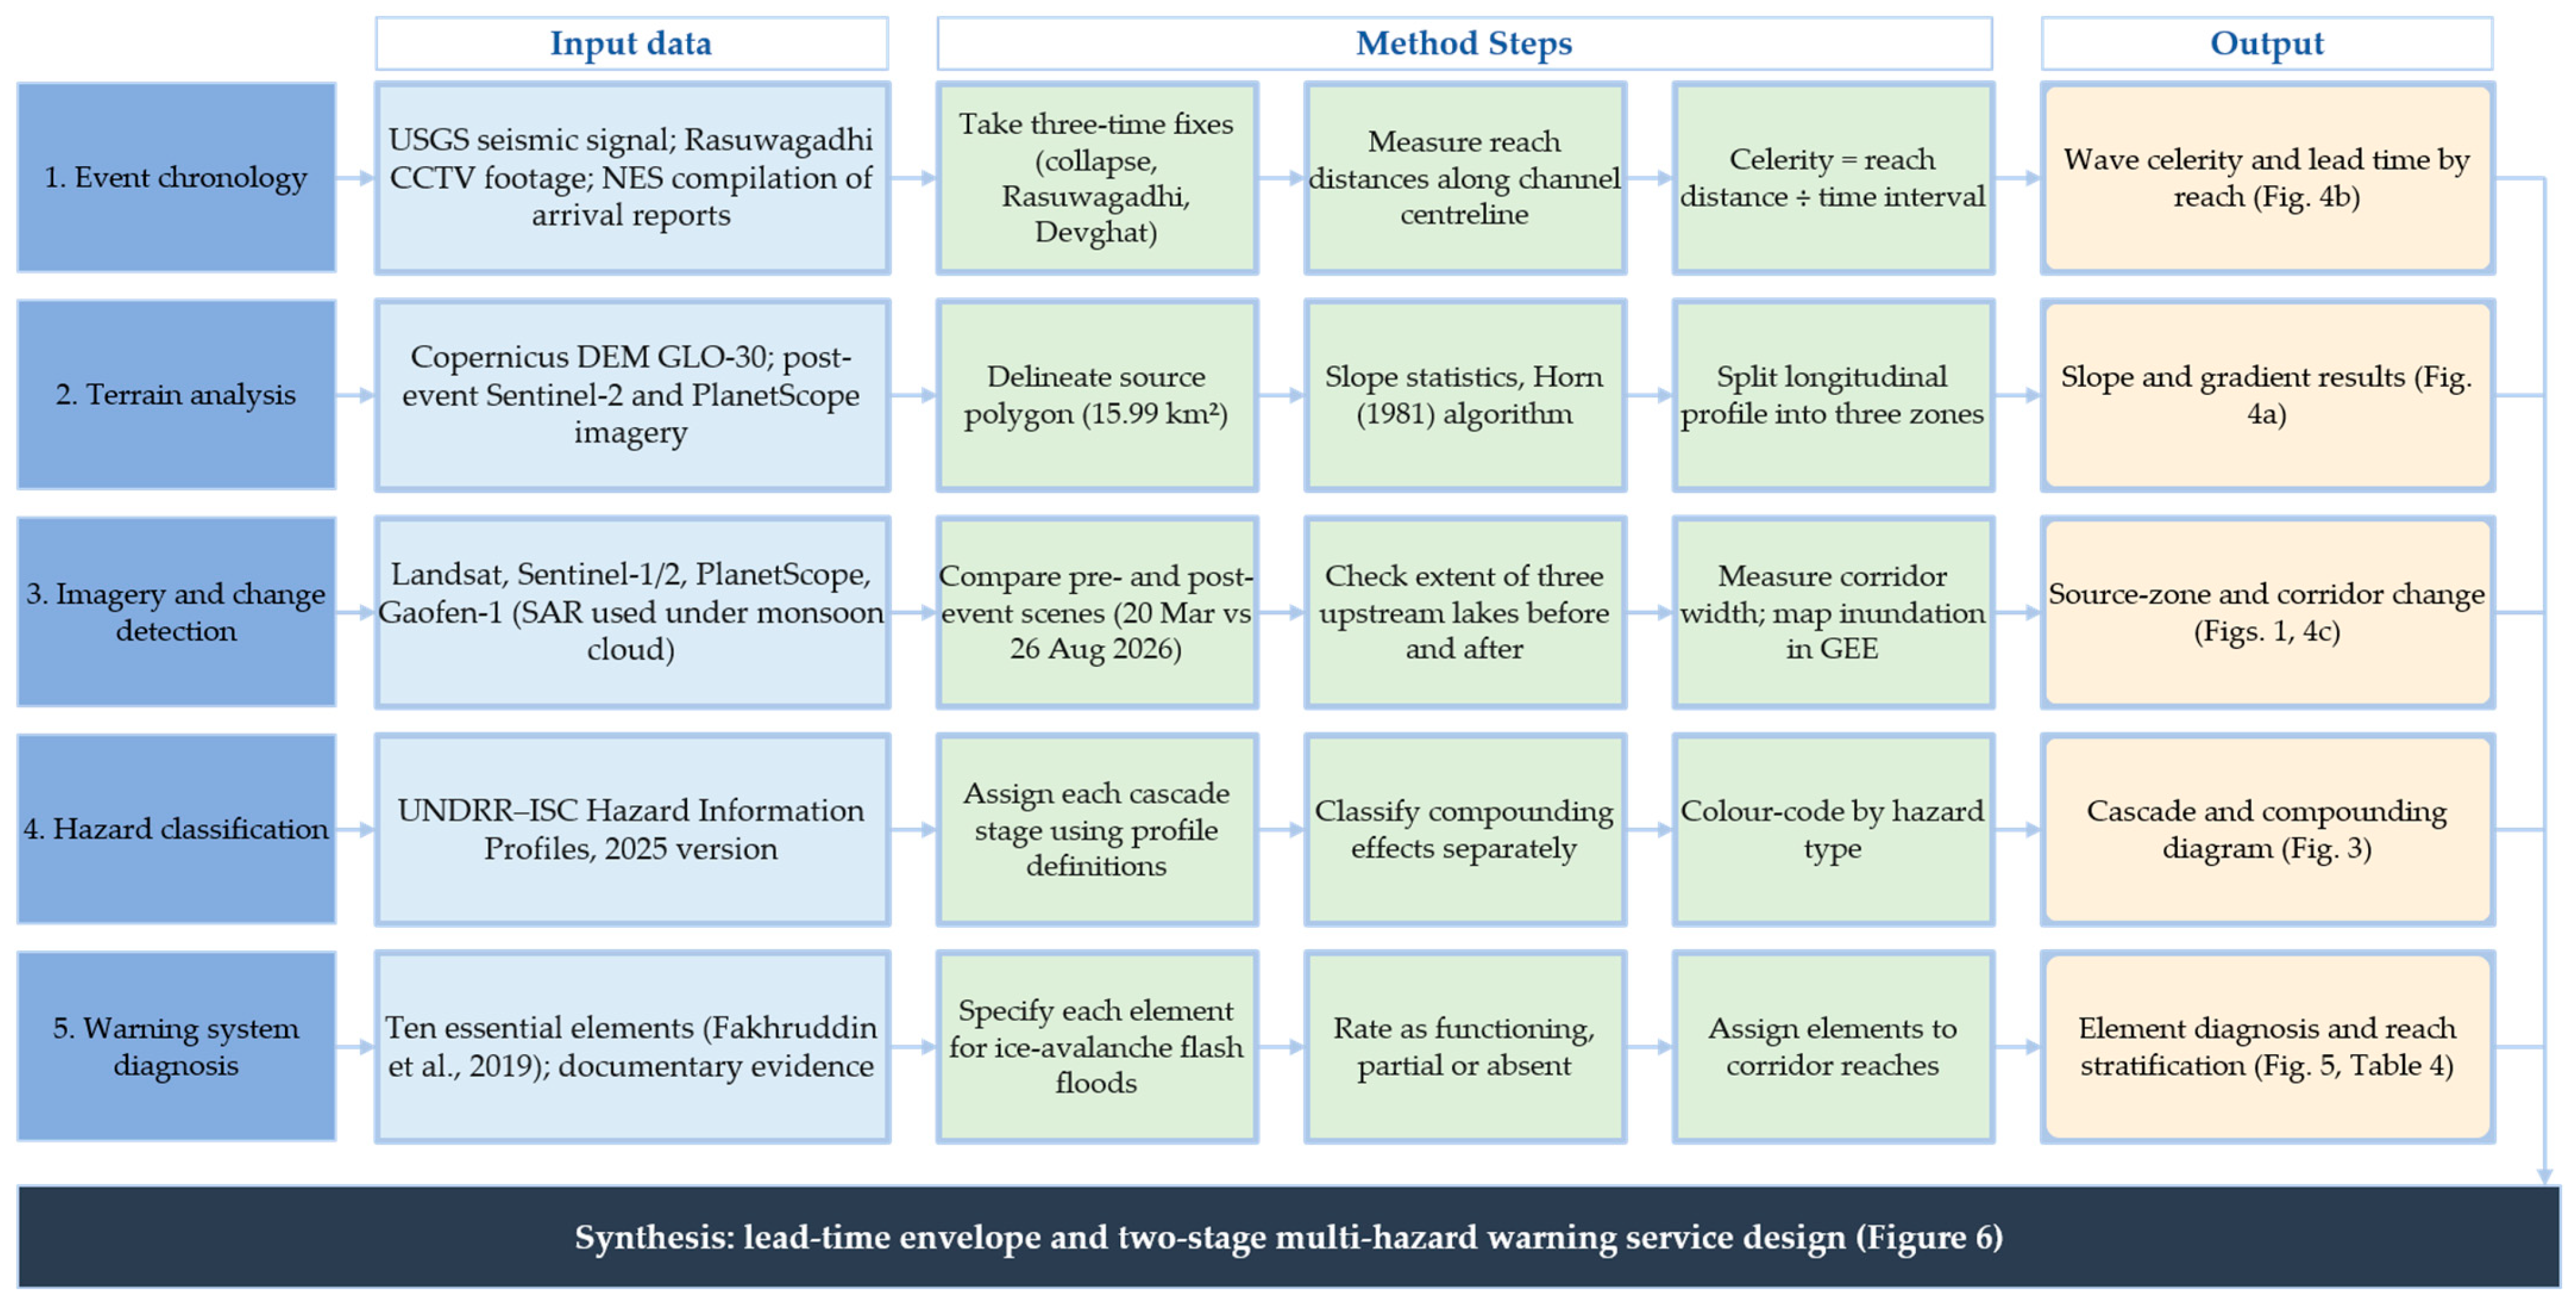
Figure 3.
Hazard Information Profile classification of the Langtang Lirung cascade (Source: Authors).
3. Results
3.1. Propagation Dynamics and Sensitivity Analysis
Reconstruction of the event chronology yielded successive propagation intervals of 465, 2105 and 21,600 s across the upper, middle and lower reaches, respectively. For corresponding reach lengths of 22, 44 and 130 km, the estimated apparent celerities were 47.3, 20.9 and 6.0 m s−1 (Table 3; Figure 4), indicating a pronounced downstream decline. The cumulative interval between the seismic reference marker and the reported arrival at Devghat was approximately 6 h 43 min across the 196 km corridor. Marker-to-arrival intervals were approximately 7.8 min at Rasuwagadhi, 42.8 min at Betrawati and 402.8 min at Devghat.
Table 3.
Reach characteristics, apparent celerities and propagation intervals reconstructed from the event chronology.
Figure 4.
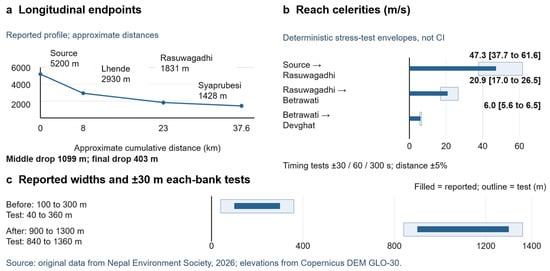
Reconstructed propagation dynamics and deterministic sensitivity analysis: (a) terrain-profile elevations and mean gradients; (b) reach-averaged apparent celerities and sensitivity ranges; and (c) reported pre- and post-event corridor-width ranges (Source: Original data from Nepal Environment Society, 2026; elevations from Copernicus DEM GLO-30).
Deterministic sensitivity analysis produced celerity ranges of 39.6–58.7, 17.8–25.2 and 5.86–6.19 m s−1 when timing perturbations alone were considered. Incorporating a ±5% perturbation in reach distance broadened the corresponding ranges to 37.7–61.6, 17.0–26.5 and 5.6–6.5 m s−1. None of the tested perturbations altered the rank order of the reach estimates. These ranges quantify sensitivity to the prescribed variations in timing and distance and are not interpreted as probabilistic confidence intervals.
Terrain analysis showed a similarly pronounced downstream reduction in average gradient. Elevation differences across the three profile segments were 2270, 1099 and 403 m, corresponding to mean gradients of 28.37%, 7.32% and 2.76%, respectively. Under the ±10 m endpoint perturbation, the corresponding gradient ranges were 28.125–28.62%, 7.19–7.46% and 2.62–2.89%. These results characterise the mean gradients of the analysed terrain segments rather than local hydraulic conditions along the entire propagation corridor.
Reported corridor-width ranges increased from 100 to 300 m before the event to 900–1300 m following the event. Applying the ±30 m per-bank positional perturbation yielded respective ranges of 40–360 m and 840–1360 m. The separation between the pre- and post-event ranges persisted under the specified perturbation, indicating substantial geomorphic modification within the constraints of the available spatial evidence.
3.2. Cascade Characteristics and Climatic Context
The available evidence supports an initiating rock–ice mass movement followed by rapid downstream flooding. The subsequent flow may have involved interactions among river-water entrainment, channel blockage and breach, and water stored within or beneath the glacier, although the available observations do not permit their relative contributions to be quantified. The event is therefore interpreted as a mass-movement–flood cascade, with the sequence of intermediate hydrological processes treated as conditional.
The reported river-stage decline between 05:00 and 08:00 occurred before the 08:37:10 seismic reference marker. This chronology places the decline before the detected mass movement and does not support its interpretation as a precursor generated by blockage from that event. The stage change is consequently retained as an earlier hydrological observation rather than incorporated into the reconstructed cascade sequence.
3.3. Early-Warning System Assessment
The 10-element assessment identified substantial variation in the documented evidence across the warning chain (Table 4). Seven elements were classified as not verified (NV): institutional arrangements, data collection and sharing, hazard detection, decision support, warning products, impact forecasting, and risk communication. These classifications indicate insufficient event-specific evidence to establish operational performance rather than confirmed absence of the corresponding capabilities.
Table 4.
Evidence-based assessment of the 10 elements of the early-warning system during the 26 August 2026 event.
Earth observation, dissemination, and community connection and response were classified as provisionally partial (P). Available documentation indicates component-level activity, including satellite observations used for post-event reconstruction, reported SMS dissemination, and reported community evacuation or protective action. The evidence, however, was insufficient to establish their integration within a complete end-to-end warning chain. Overall, the assessment identifies gaps in the evidence required to verify warning-system performance, rather than demonstrating an absence of institutional capability. No element could be verified as fully functioning (F), and none met the evidentiary criterion for classification as absent (A).
4. Discussion and Proposed Warning Framework
The Langtang Lirung event illustrates the challenges of operational warning decision-making during rapidly evolving mountain-hazard cascades. Propagation rates varied markedly along the Bhote Koshi–Trishuli corridor (Table 3; Figure 4), and the warning-system assessment identified significant limitations in the evidence available to verify end-to-end operational performance (Table 4). These findings indicate that effective warning depends on the interaction between physical propagation, observational capability, decision processes, communication latency and preparedness. The resulting framework therefore links hazard evolution with the institutional and operational functions required to convert detection into timely protective action.
4.1. Comparison with Previous Cascades and Warning Approaches
The Langtang Lirung cascade exhibits characteristics documented in other high-mountain disasters, particularly the transition from mass movement to rapid downstream flooding observed at Shugar and Fischer [2,3]. These events demonstrate the importance of entrainment, water storage, channel confinement and downstream process transformation in cascade development. Differences in source conditions, hydrological processes and observational coverage, however, preclude direct transfer of event-specific mechanisms between sites.
Existing glacier and permafrost hazard guidance and end-to-end early-warning frameworks emphasise scenario development, exposure assessment and coordinated warning functions [5,6]. Recent studies extend these principles through compound hydrological modelling [16], uncertainty-aware susceptibility assessment [17] and structured warning decisions [18]. The present study contributes a corridor-scale integration of evidence provenance, propagation sensitivity and warning-system verification. This formulation links cascade evolution to the evidence and operational functions required for warning, while distinguishing documented from unverified capability (Table 5).
Table 5.
Comparison of the Langtang Lirung analysis with documented mountain-hazard cascades, guidance and related modelling approaches.
4.2. Stage 1: Evidence-Based Screening and Operational Readiness
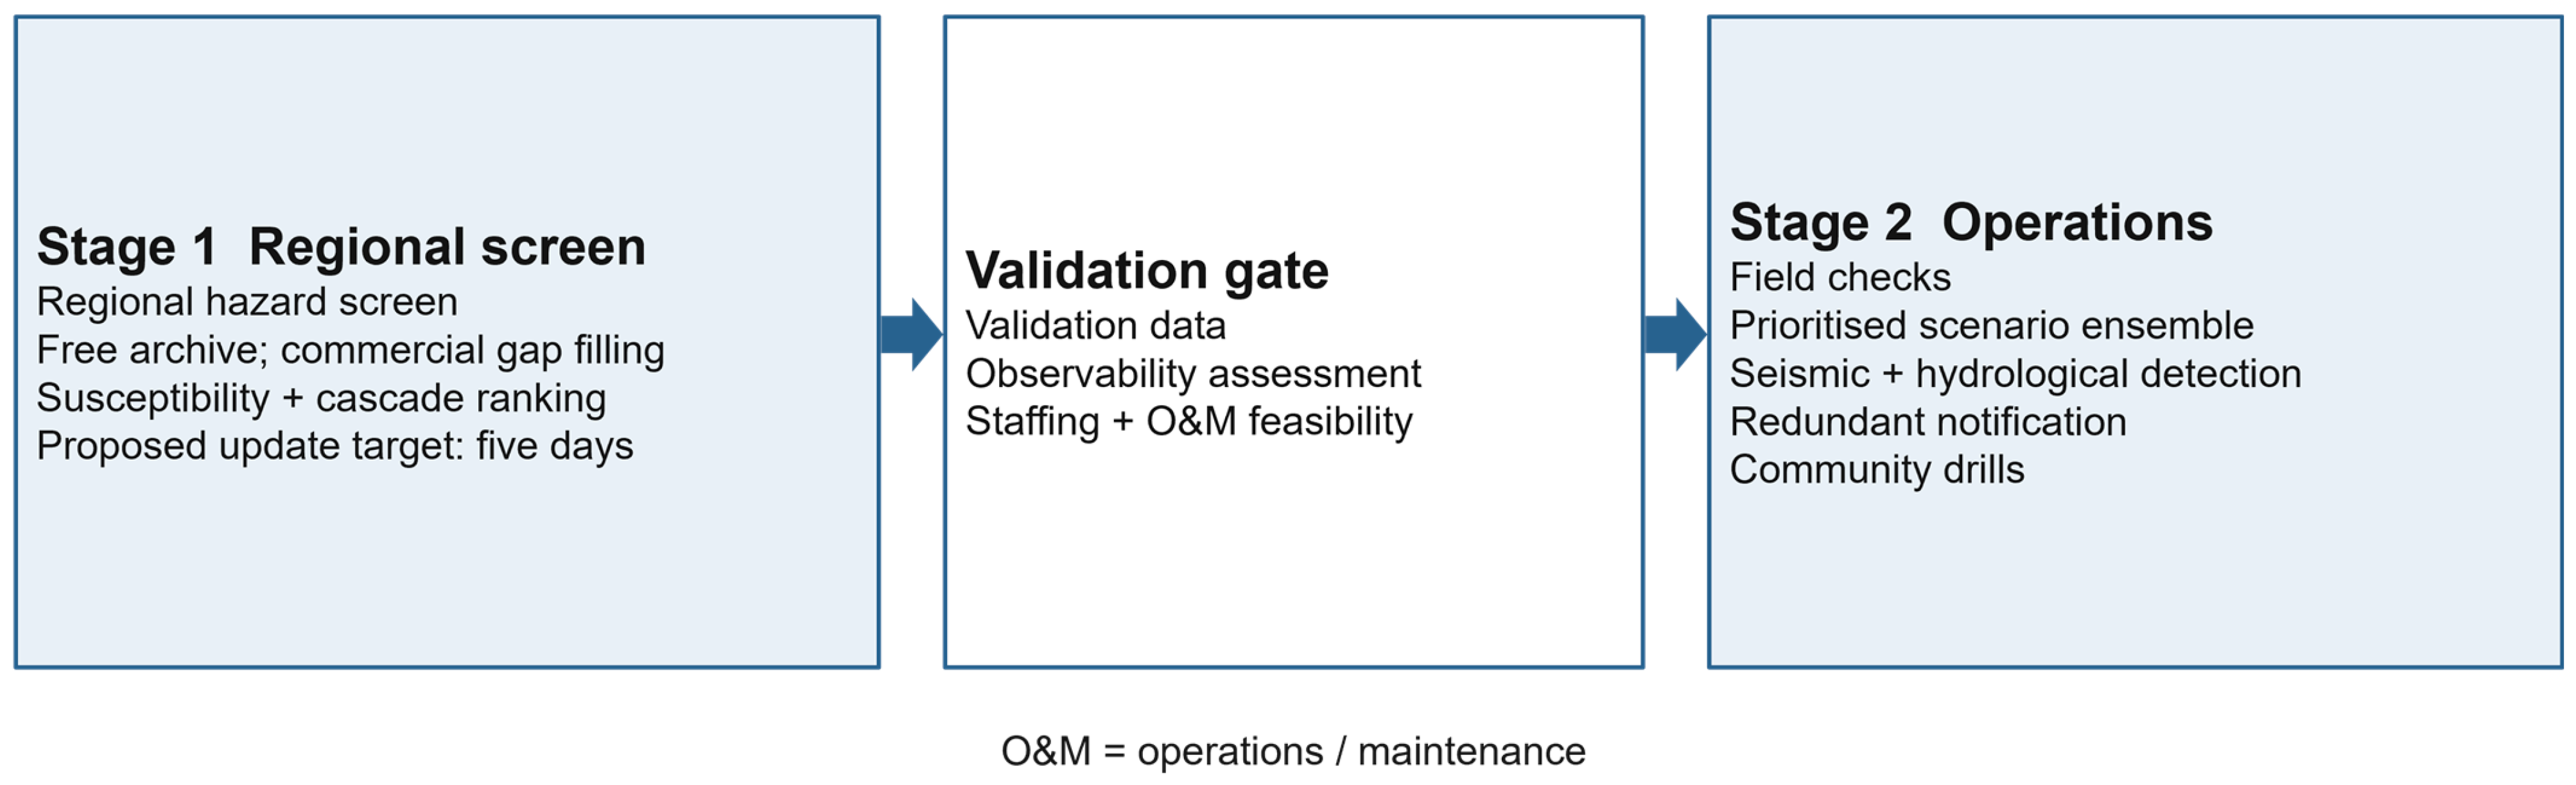
Stage 1 establishes an evidence-based representation of potential source areas, exposure and monitoring capability, accompanied by parallel development of operational readiness (Figure 5). Source screening integrates topography, lithology, structural conditions, snow and ice characteristics, hydrological setting and observable deformation according to data availability and relevance. Explicit documentation of data provenance, temporal resolution and uncertainty provides the basis for differentiating robust observations from provisional interpretations.
Figure 5.
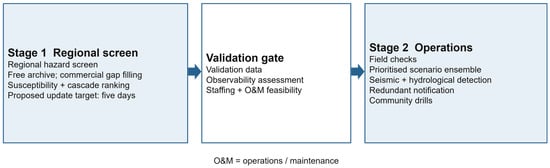
Proposed two-stage framework for multi-hazard early warning. Stage 1 integrates evidence-based source screening, exposure assessment and operational readiness; Stage 2 develops and validates cascade scenarios to support warning decisions, with direct escalation under credible emergency conditions.
Remote sensing contributes to the identification and monitoring of spatially distributed source areas that are difficult to observe continuously from the ground. Its operational utility is conditioned by acquisition frequency, spatial resolution, viewing geometry and performance over steep snow- and ice-covered terrain. Integration with seismic, hydrological and ground-based observations therefore provides a stronger basis for hazard detection than reliance on any single observational source.
Operational readiness develops concurrently with hazard screening. Redundant communication, protected monitoring infrastructure, predefined institutional responsibilities, accessible evacuation routes and community preparedness remain essential under uncertain precursor conditions. This requirement is especially important in the upper corridor, where the reconstructed propagation interval provides limited time for detection, interpretation, warning dissemination and protective action.
4.3. Stage 2: Scenario Development and Validation
Stage 2 develops bounded scenarios for plausible combinations of mass release, entrainment, channel blockage, breach and downstream routing (Figure 5). Glacial-water contributions and rainfall-related processes can be incorporated where supported by physical evidence. Alternative trajectories are retained where the available observations do not support a single cascade sequence.
Operational application requires independent evaluation of individual components. Precursor monitoring depends on demonstrable signal detectability before failure; source-ranking methods require discrimination between unstable and stable conditions; downstream scenario models require appropriate terrain, channel and hydrological observations for calibration and validation. Evaluation of false alarms, missed events and degraded observational conditions is therefore integral to establishing operational reliability.
4.4. Institutional and Financial Constraints
End-to-end warning performance depends on institutional capacity as well as technical capability. Operational implementation requires defined responsibilities for geospatial analysis, hydrological interpretation, warning decisions, communication and system maintenance. Service continuity also requires duty arrangements, staff competency, technical redundancy, data management, processing capacity, backup power and recovery procedures.
The transboundary setting of the Bhote Koshi headwaters introduces additional requirements for institutional coordination. Effective warning depends on timely exchange of relevant observations between the Xizang Autonomous Region of China and Nepal, supported by compatible time standards, data-quality information, notification protocols and defined institutional responsibilities. Pre-agreed technical communication arrangements are particularly important where rapid propagation constrains the time available for sequential administrative processes.
Financial sustainability is similarly integral to operational continuity. Recurrent expenditure includes monitoring, telecommunications, data access, maintenance, calibration, staffing, exercises and replacement of damaged equipment. Investment appraisal therefore requires consideration of lifecycle costs, service reliability and institutional capacity alongside initial capital expenditure. These requirements are particularly important in high-mountain environments where extreme events can simultaneously disrupt monitoring infrastructure and increase demand for warning services.
4.5. Emergency Bypass and Degraded-Mode Response
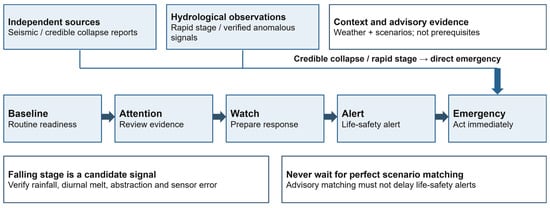
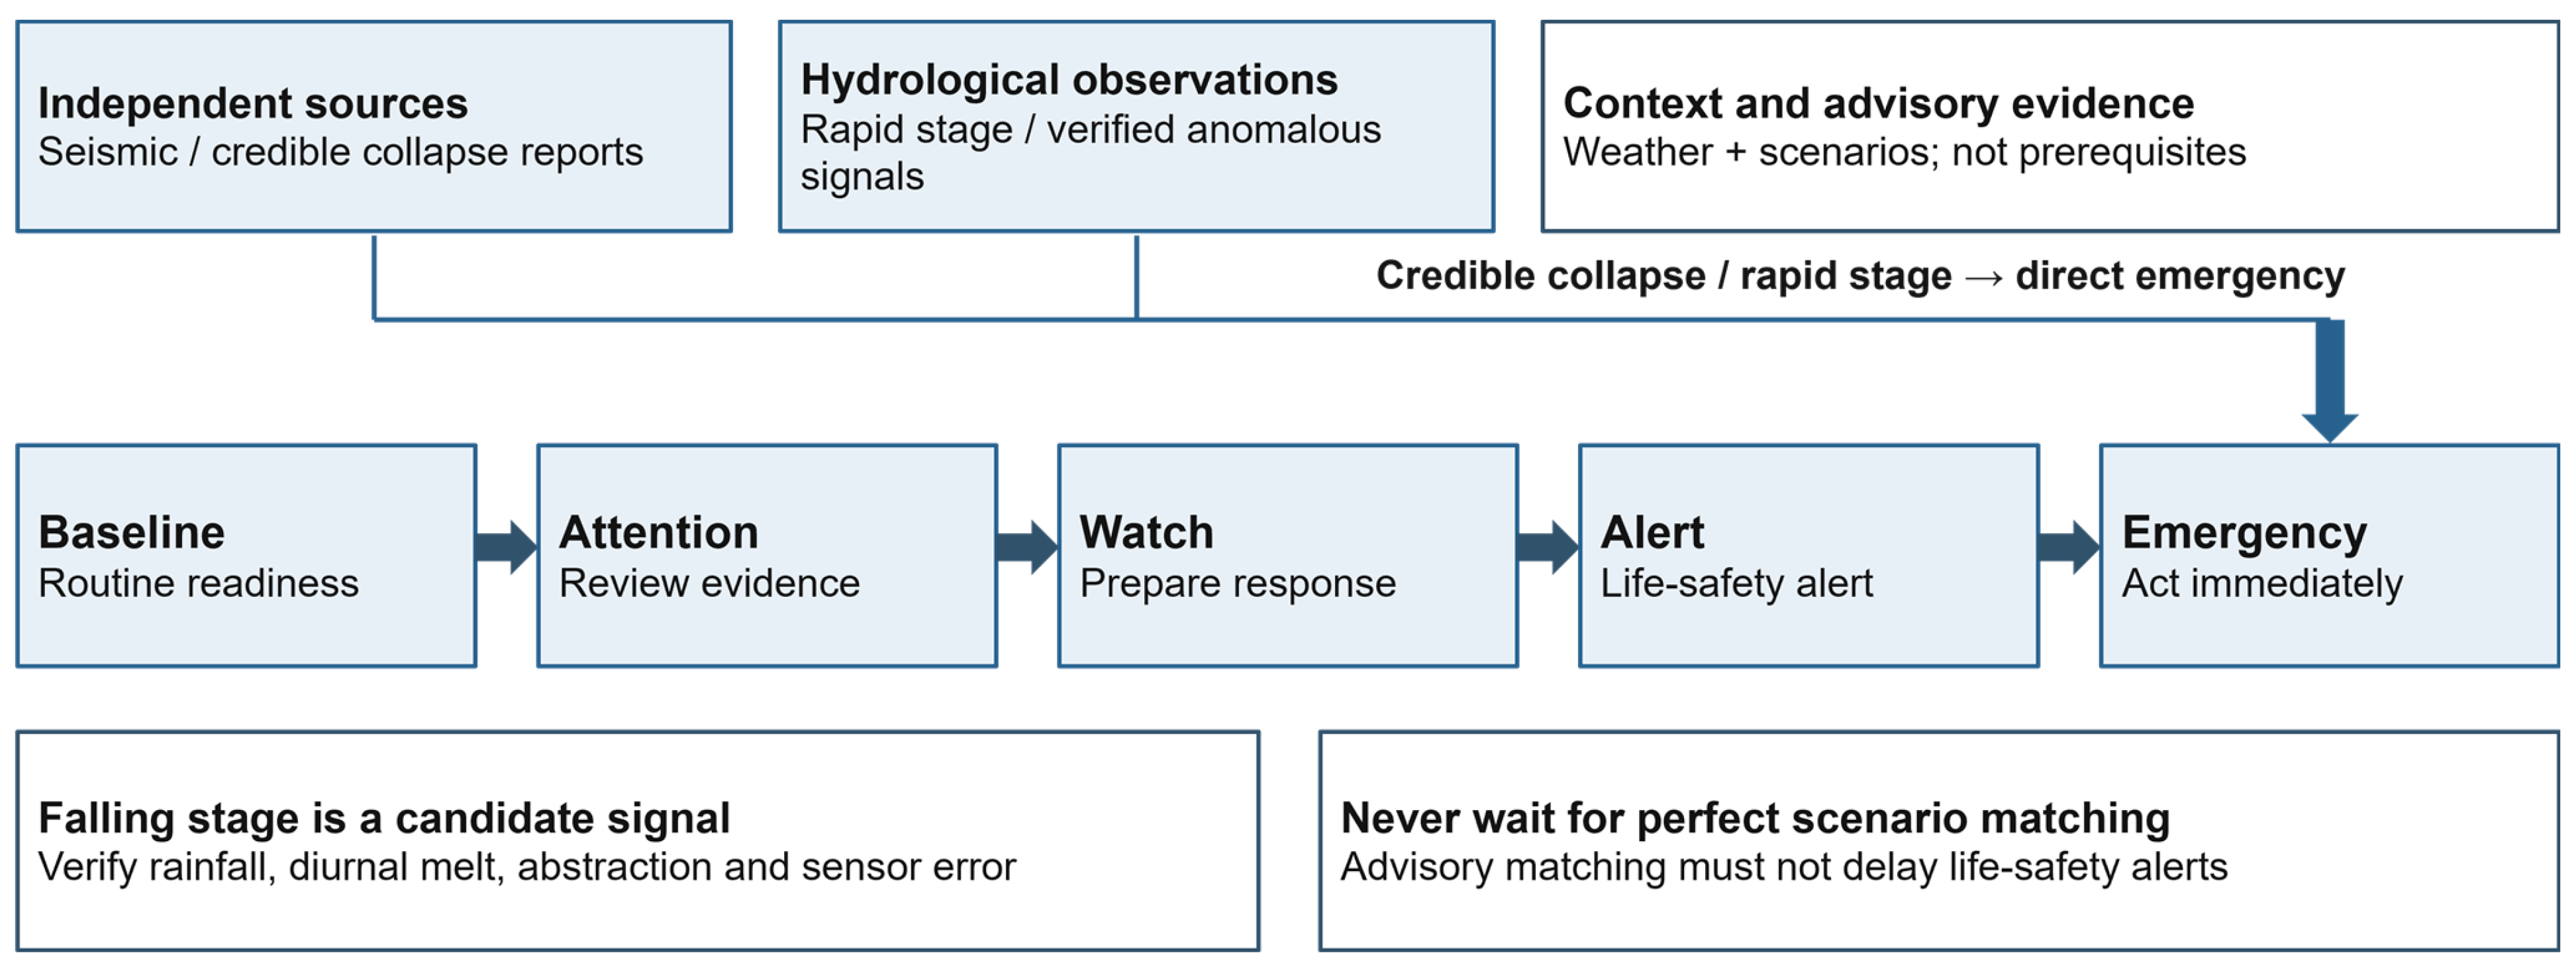
The proposed operational framework comprises Baseline, Attention, Watch, Alert and Emergency states (Figure 6). These states represent increasing levels of preparedness and response, without requiring sequential progression. Evidence of major slope failure or rapid hazardous hydrological change can trigger direct escalation to Emergency, including under incomplete monitoring or telecommunications disruption.
Figure 6.
Proposed early-warning states incorporating direct emergency escalation and degraded-mode operation.
Direct escalation recognises a central characteristic of cascading mountain hazards: uncertainty concerning the precise initiating mechanism does not preclude a sufficiently strong basis for protective action. Seismic observations, water-level monitoring, remote sensing and other information streams provide complementary evidence. Operational decision-making therefore depends on the collective strength and consistency of available observations, with contingency procedures accommodating failure or loss of individual monitoring components.
Degraded-mode operation requires predefined decision authority, redundant communication channels, actionable warning products, accessible evacuation routes and established community response procedures. The short propagation intervals reconstructed for the upper corridor place particular importance on preparedness and locally executable action because centralised interpretation and dissemination may consume a substantial proportion of the available response window.
5. Limitations
This study is constrained by the retrospective and predominantly secondary nature of the available evidence. Uncertainty in event chronology, approximate reach distances, clock synchronisation, source geometry and hydrological observations limits reconstruction of the initiating process and downstream flow dynamics. The deterministic sensitivity analyses quantify the influence of specified variations in timing, distance and elevation but do not constitute probabilistic uncertainty estimates. Similarly, the absence of georeferenced source boundaries, continuous hydrographs and site-specific meteorological and cryospheric observations precludes detailed hydraulic reconstruction, source-water partitioning and event-level climate attribution.
The early-warning assessment is likewise evidence-dependent and should be interpreted as an evaluation of documented capability rather than institutional performance. Incomplete operational records constrain verification of detection, decision, dissemination and response functions. Consequently, the findings support corridor-specific interpretation of hazard propagation and warning requirements, but their transfer to other high-mountain catchments requires independent evaluation of terrain, hydrology, exposure, monitoring capacity and operational latency.
6. Conclusions
The 26 August 2026 Langtang Lirung event demonstrates the rapid transition of a high-mountain rock–ice mass movement into a downstream flood cascade. Reconstruction of the event indicates a pronounced decline in apparent propagation celerity along the Bhote Koshi–Trishuli corridor, resulting in markedly different temporal constraints on warning and protective action between upstream and downstream reaches. The initiating process is consistent with a rock–ice avalanche, although the relative contributions of glacial water, channel blockage and breach, and cryospheric preconditioning remain unresolved.
The analysis demonstrates that propagation time alone is insufficient to characterise operational warning capacity. Effective early warning depends on the integration of hazard detection, interpretation, decision-making, dissemination and protective response within the available propagation window. The proposed two-stage framework links evidence provenance and cascade reconstruction with operational readiness, scenario development and direct emergency escalation. This framework provides an analytically transparent basis for evaluating multi-hazard early-warning requirements under incomplete observational evidence and rapidly evolving hazard conditions.
Author Contributions
Conceptualisation, B.S.F., D.P.; methodology, B.S.F., K.A.; formal analysis, K.A., L.T., R.B.; investigation, D.P., B.S.F.; data curation, L.T., R.B.; writing—original draft preparation, B.S.F., K.A., D.P.; writing—review and editing, all authors; visualisation, K.A., B.S.F.; supervision, B.S.F. All authors have read and agreed to the published version of the manuscript.
Funding
This research received no external funding.
Data Availability Statement
The data supporting this study were derived from publicly available sources and documentary records cited in the manuscript. Derived data supporting the findings are presented within the article. Some underlying operational and hydrological records used in the source documentation were not available to the authors for independent verification. Data is available upon request.
Acknowledgments
The submitted manuscript acknowledged colleagues at the Department of Hydrology and Meteorology, Nepal, and the Nepal Environment Society for station and chronology information.
Conflicts of Interest
The authors declare no conflicts of interest.
References
- Taylor, C.; Robinson, T.R.; Dunning, S.; Carr, J.R.; Westoby, M. Glacial lake outburst floods threaten millions globally. Nat. Commun. 2023, 14, 487. [Google Scholar] [CrossRef] [Scilit]
- Shugar, D.H.; Jacquemart, M.; Shean, D.; Bhushan, S.; Upadhyay, K.; Sattar, A.; Schwanghart, W.; McBride, S.; Van Wyk de Vries, M.; Mergili, M.; et al. A massive rock and ice avalanche caused the 2021 disaster at Chamoli, Indian Himalaya. Science 2021, 373, 300–306. [Google Scholar] [CrossRef] [Scilit]
- Fischer, M.; Lehnigk, K.; Lützow, N.; Brettin, J.; Veh, G.; Larsen, I.J.; Korup, O.; Walz, A. Himalayan hazard cascades—modern and medieval outburst floods in Pokhara, Nepal. Earth Surf. Processes Landf. 2023, 48, 1135–1151. [Google Scholar] [CrossRef] [Scilit]
- Fan, X.; Bhuyan, K.; Wang, X.; Cook, K.L.; Ozturk, U.; Loew, S.; Gyamtsho, P.; Jansen, J.D.; Xu, Q. Rethinking policy on high mountain cascading hazards. Nat. Geosci. 2025, 18, 1066–1067. [Google Scholar] [CrossRef] [Scilit]
- GAPHAZ. Assessment of Glacier and Permafrost Hazards in Mountain Regions: Technical Guidance Document; Standing Group on Glacier and Permafrost Hazards in High Mountains; International Association of Cryospheric Sciences and International Permafrost Association: Zurich, Switzerland, 2017; Available online: https://gaphaz.org/wp-content/uploads/2025/09/Assessment_of_Glacier_and_Permafrost_Hazards_Mountain_Regions.pdf (accessed on 9 October 2026).
- World Meteorological Organization. Early Warnings for All: Executive Action Plan 2023–2027; WMO: Geneva, Switzerland, 2022; Available online: https://www.preventionweb.net/publication/early-warnings-all-executive-action-plan-2023-2027 (accessed on 9 October 2026).
- Eslamian, S.; Eslamian, F.A. (Eds.) Flood Handbook: Impacts and Management; CRC Press: Boca Raton, FL, USA, 2022; Volume 3. [Google Scholar] [CrossRef] [Scilit]
- Zhang, T.-G.; Wang, W.-C.; Khadka, N.; Kougkoulos, I.; Cook, S.J.; Watson, C.S.; Gao, Y.; Li, S.-H.; Yang, X.; Wang, Z.-Y.; et al. Transboundary outburst floods from giant supraglacial lakes over the Himalayan China–Nepal border. Adv. Clim. Change Res. 2026, 18, 267–282. [Google Scholar] [CrossRef] [Scilit]
- United States Geological Survey. M 5.2 Landslide: 2026-08-26 02:52:10 UTC; Reviewed Event us7000tbwb. Available online: https://earthquake.usgs.gov/earthquakes/eventpage/us7000tbwb/executive (accessed on 9 October 2026).
- National Disaster Risk Reduction and Management Authority. Rapid Damage and Needs Assessment (RDNA): Rasuwa-Bhotekoshi Flood 2026; Ministry of Home Affairs, Government of Nepal: Kathmandu, Nepal, 2026; Available online: https://nset.org.np/wp-content/uploads/2026/09/4.pdf (accessed on 9 October 2026).
- Xu, Q.; Zhao, B.; Dai, K.; Dong, X.; Li, W.; Zhu, X.; Yang, Y.; Xiao, X.; Wang, X.; Huang, J.; et al. Remote sensing for landslide investigations: A progress report from China. Eng. Geol. 2023, 321, 107156. [Google Scholar] [CrossRef] [Scilit]
- Horn, B.K.P. Hill shading and the reflectance map. Proc. IEEE 1981, 69, 14–47. [Google Scholar] [CrossRef] [Scilit]
- Immerzeel, W.W.; van Beek, L.P.H.; Konz, M.; Shrestha, A.B.; Bierkens, M.F.P. Hydrological response to climate change in a glacierized catchment in the Himalayas. Clim. Chang. 2012, 110, 721–736. [Google Scholar] [CrossRef] [Scilit]
- United Nations Office for Disaster Risk Reduction; International Science Council. Hazard Information Profiles: 2025 Version; UNDRR and ISC, 2025. Available online: https://www.undrr.org/publication/documents-and-publications/hazard-information-profiles-hips-2025-version (accessed on 9 October 2026).
- Fakhruddin, B.S.H.M.; Schick, L. Benefits of economic assessment of cyclone early warning systems: A case study on Cyclone Evan in Samoa. Prog. Disaster Sci. 2019, 2, 100034. [Google Scholar] [CrossRef] [Scilit]
- Gaikwad, D.; Iawphniaw, D.; Jadoun, V.S.; Tiwari, R.K.; Pradhan, B. Coupled hydrological–hydrodynamic modelling of GLOFs triggered by extreme precipitation in the Western Himalayas. J. Hydrol. Reg. Stud. 2026, 66, 103738. [Google Scholar] [CrossRef] [Scilit]
- Chen, C.; Dong, B.; Lin, J.; Shen, Z.; Fang, L.; Weng, Y.; Wang, K. Bayesian deep learning framework for updating landslide susceptibility assessment based on epistemic uncertainty with InSAR augmented samples. J. Rock Mech. Geotech. Eng. 2026, 18, 4216–4232. [Google Scholar] [CrossRef] [Scilit]
- Park, J.Y.; Lee, S.R.; Lee, D.H.; Kim, Y.T.; Lee, J.S. A regional-scale landslide early warning methodology applying statistical and physically based approaches in sequence. Eng. Geol. 2019, 260, 105193. [Google Scholar] [CrossRef] [Scilit]

Disclaimer/Publisher’s Note: The statements, opinions and data contained in all publications are solely those of the individual author(s) and contributor(s) and not of MDPI and/or the editor(s). MDPI and/or the editor(s) disclaim responsibility for any injury to people or property resulting from any ideas, methods, instructions or products referred to in the content. |
© 2026 by the authors. Licensee MDPI, Basel, Switzerland. This article is an open access article distributed under the terms and conditions of the Creative Commons Attribution (CC BY) license.