


Abstract
In pipeline-replenished fish lifts, the replenishment flow enters the collection system at a high velocity and must first be dissipated in a stilling basin, but a conventional deep basin requires a large excavation volume and a high construction cost; whether an adjustable-resistance boundary at the basin top can replace part of the basin depth still requires systematic quantitative assessment. Here, a permeable cover plate at the basin top is compared quantitatively with two conventional measures, a deeper basin and internal baffles, under identical inflow, using a unified set of fish-related indices. A three-dimensional computational fluid dynamics (CFD) model, validated against a 1:5.33 physical model of the Fengman Hydropower Station fish lift, was used to examine three energy-dissipation configurations: stilling-basin depth (2–5 m), cover-plate permeability (72–50%), and baffle height (1–4 m). Performance was assessed by the coefficient of variation of velocity (CV) at the control section upstream of the fish grid (X = 14 m) and by the streamwise turbulent kinetic energy (TKE) in the fish bucket and residence pool. The results show that increasing the basin depth from 2 to 5 m reduced CV from 0.31 to 0.23. Reducing the cover-plate permeability from 72% to 50% reduced CV to 0.12 and the streamwise TKE by about 87%, confining the high-velocity and high-turbulence regions to the stilling basin, whereas baffle height acted non-monotonically with an optimum at 2 m (CV = 0.20). Overall, a 3 m deep basin with a 50% permeability cover plate gave the most uniform approach flow and the lowest turbulence (maximum TKE about 0.003 m2/s2), providing more favourable conditions in the collection zone for fish to hold position and migrate upstream, while requiring 2 m less excavation than the reference scheme; an adjustable-resistance boundary can thus replace part of the basin depth without sacrificing hydraulic performance, offering a new design route for high-head fish lifts with constrained abutment excavation.
1. Introduction
River fragmentation by dams is one of the most widespread pressures on freshwater ecosystems worldwide [1,2,3]. Dams and hydropower reservoirs interrupt the longitudinal connectivity of rivers, destroy migratory habitats, and threaten the persistence of diadromous and potamodromous fish populations [4,5,6]; more than 90,000 reservoirs have already been recorded in China alone [7]. Mitigating the barrier effect of dams has therefore become one of the central issues in river ecological restoration and in the environmental management of hydropower projects. Fish-passage facilities—fishways, fish locks, fish lifts, and fish-transport systems—are the main engineering measures used to re-establish upstream migration routes [8,9]. Where the head exceeds about 25 m, fish lifts have advantages over fishways because the fishway length and hydraulic control required become difficult to realise [10,11,12]; fish lifts have been applied at numerous high-dam projects worldwide [8,10,11] and are increasingly used in Chinese hydropower projects [9,10]. The passage effectiveness of a fish lift depends on the hydraulic conditions in its fish collection system. A fish collection system generally consists of the fish entrance, the stilling basin, the fish bucket, and the residence pool: fish are attracted by the attraction flow at the entrance, gather in the fish bucket, and are temporarily retained in the residence pool before being lifted over the dam. Studies have shown that fish actively avoid high-velocity and highly turbulent regions and prefer low-velocity resting zones, whereas excessive turbulence increases the energetic cost of swimming and delays or even blocks upstream migration [13,14,15,16,17]. The collection system should therefore maintain low, uniform velocities and weak turbulence in the holding zone while establishing a detectable attraction flow at the fish entrance [10,18]. In a pipeline-replenished fish lift, the replenishment flow enters the collection system at high velocity and must first pass through a stilling basin to dissipate the inflow energy; the energy-dissipation configuration is thus one of the key factors governing the hydraulic conditions in the collection system.
Although computational fluid dynamics (CFD) has become a common tool for the hydraulic design and evaluation of fish-passage facilities, existing studies focus mainly on fishways—vertical-slot, combined, steep-pass, and novel H-type and multi-slot fishways [17,19,20,21,22,23,24]—and generally verify the simulated velocity and turbulence fields against physical models [20,21,24]. By comparison, CFD studies devoted specifically to the collection systems of fish lifts are scarce and mostly address the optimisation of flow conditions at the fish entrance, so that no systematic quantitative understanding of the energy-dissipation configuration itself has been established [25]. In terms of methodology, most existing work examines a single factor—for example, the effect of stilling-basin length on velocity decay [26] or the hydraulic effect of geometric parameters such as baffles and orifices in fishways [17,20,21,23]—and rarely compares several energy-dissipation measures for the same engineering object under the same inflow conditions using a unified set of fish-related indices. Flow uniformity (commonly characterised by the coefficient of variation, CV) and turbulence intensity (commonly characterised by the turbulent kinetic energy, TKE) are frequently used to assess whether fish can hold position and migrate upstream stably [14,16,18,27], but systematic studies that use both indices together for the selection of an energy-dissipation configuration remain insufficient. In addition to the velocity magnitude and the turbulent kinetic energy, the vortical structure of the flow influences fish passage: vortex shedding and eddy scales comparable to the body length of the fish can destabilise station holding and increase the energetic cost of swimming [18,27]. These properties are therefore increasingly considered in the hydraulic design of fish-passage facilities. From an engineering point of view, pool-type energy dissipation is well established in hydraulic engineering, and its effects on velocity decay and downstream flow uniformity have been studied numerically and reviewed systematically [26,28]; however, a deep stilling basin for a large fish lift requires extensive excavation in the dam abutment or powerhouse complex, which entails considerable construction cost and time. Retrofits such as cover plates on the basin top and internal baffles can improve the flow pattern without deepening the basin and therefore have the potential to reduce the excavation volume, but quantitative evidence is still lacking, and it remains difficult to judge whether they can meet the hydraulic requirements for fish while reducing the excavation volume.
The objective of this study is therefore to determine whether the depth of a stilling basin can be replaced by an adjustable-resistance boundary at the basin top and how such a permeable cover plate compares with two classical measures, a deeper basin and internal baffles, when all three are evaluated with the same fish-related hydraulic indices. Three questions are addressed: (i) how basin depth, cover-plate permeability and baffle height control the uniformity of the approach flow at the control section upstream of the fish grid and the turbulent kinetic energy in the collection zone; (ii) whether a cover plate can deliver equal or better hydraulic conditions with a shallower basin, that is, with a smaller excavation volume; and (iii) which configuration offers the best compromise between hydraulic performance and excavation. The answers are intended to provide transferable design guidance for pipeline-replenished fish lifts at high-head dams.
2. Materials and Methods
2.1. Study Object and Computational Domain
Fengman Hydropower Station is located on the Second Songhua River in Jilin City, Jilin Province, China, and is one of the backbone cascades of the Songhua River. The rehabilitation project, in which a new dam was built 120 m downstream of the original one, includes a fish lift combined with a fishway at the dam site so as to restore the longitudinal connectivity of the river. The main target species are the anadromous Japanese lamprey (Lethenteron camtschaticum) and short-distance reproductive migrants such as grass carp (Ctenopharyngodon idella), black carp (Mylopharyngodon piceus), silver carp (Hypophthalmichthys molitrix), bighead carp (Hypophthalmichthys nobilis) and bream (Parabramis pekinensis); the passage season is May to August, which coincides with the spawning period of the main target species. Because the collection system of this lift is supplied by pipelines, it represents a class of high-head projects in which the inflow energy must be dissipated before the flow can be used for fish attraction and retention.
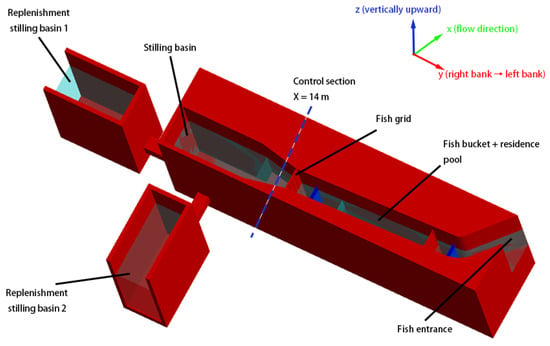
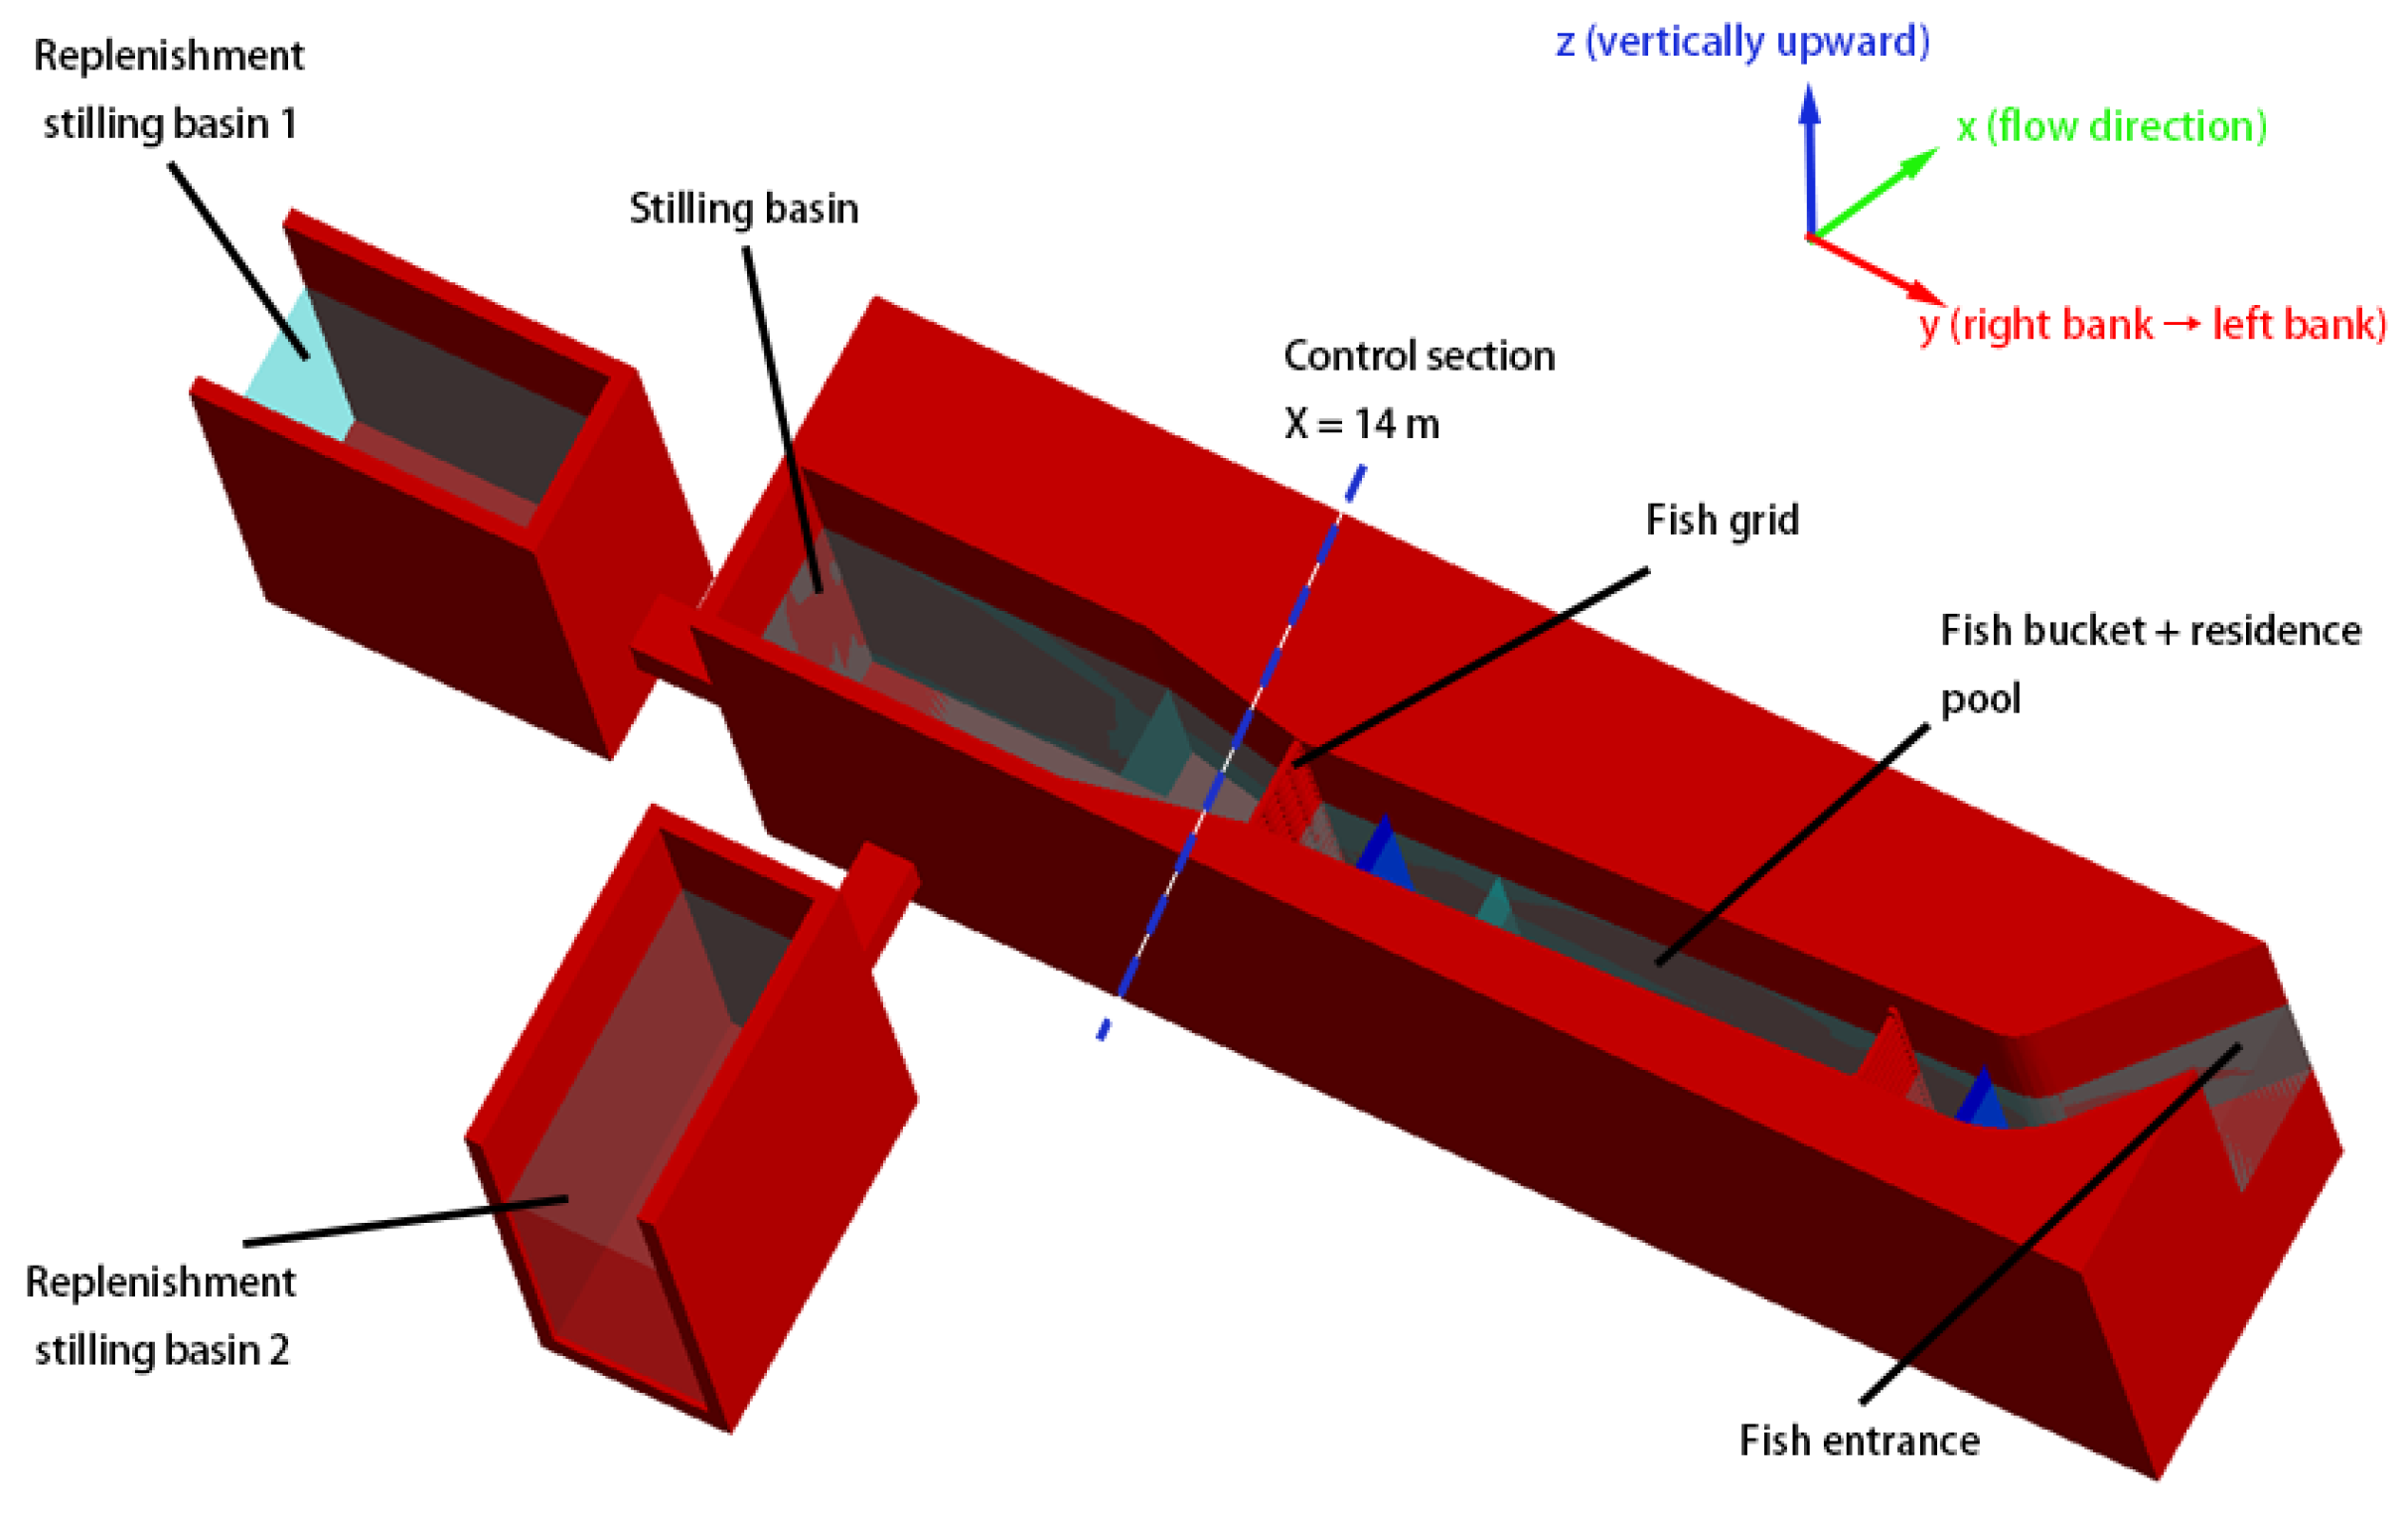
This study takes this collection system as its object. A three-dimensional numerical model was established with FLOW-3D version 11.2 (Flow Science, Inc., Santa Fe, NM, USA), and the computational domain reproduced the main body of the fish lift together with the two replenishment stilling basins (Figure 1). The collection system consists of the fish entrance, the stilling basin, the fish bucket, and the residence pool; the replenishment water is injected at high velocity through pressure pipes on both sides of the stilling basin and is treated as an upstream boundary condition in the numerical model, and a one-line gate controls the flow entering the fish bucket. The computational domain and the positions of the key structures are shown in Figure 1; the system components, coordinates, and variable references described below all refer to this domain.
Figure 1.
Three-dimensional computational domain of the fish-lift collection system (stilling basin, two replenishment stilling basins, fish grid, fish bucket and residence pool, fish entrance, control section X = 14 m, and the x, y, and z coordinate directions).
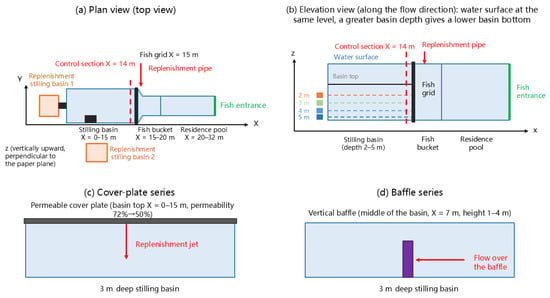
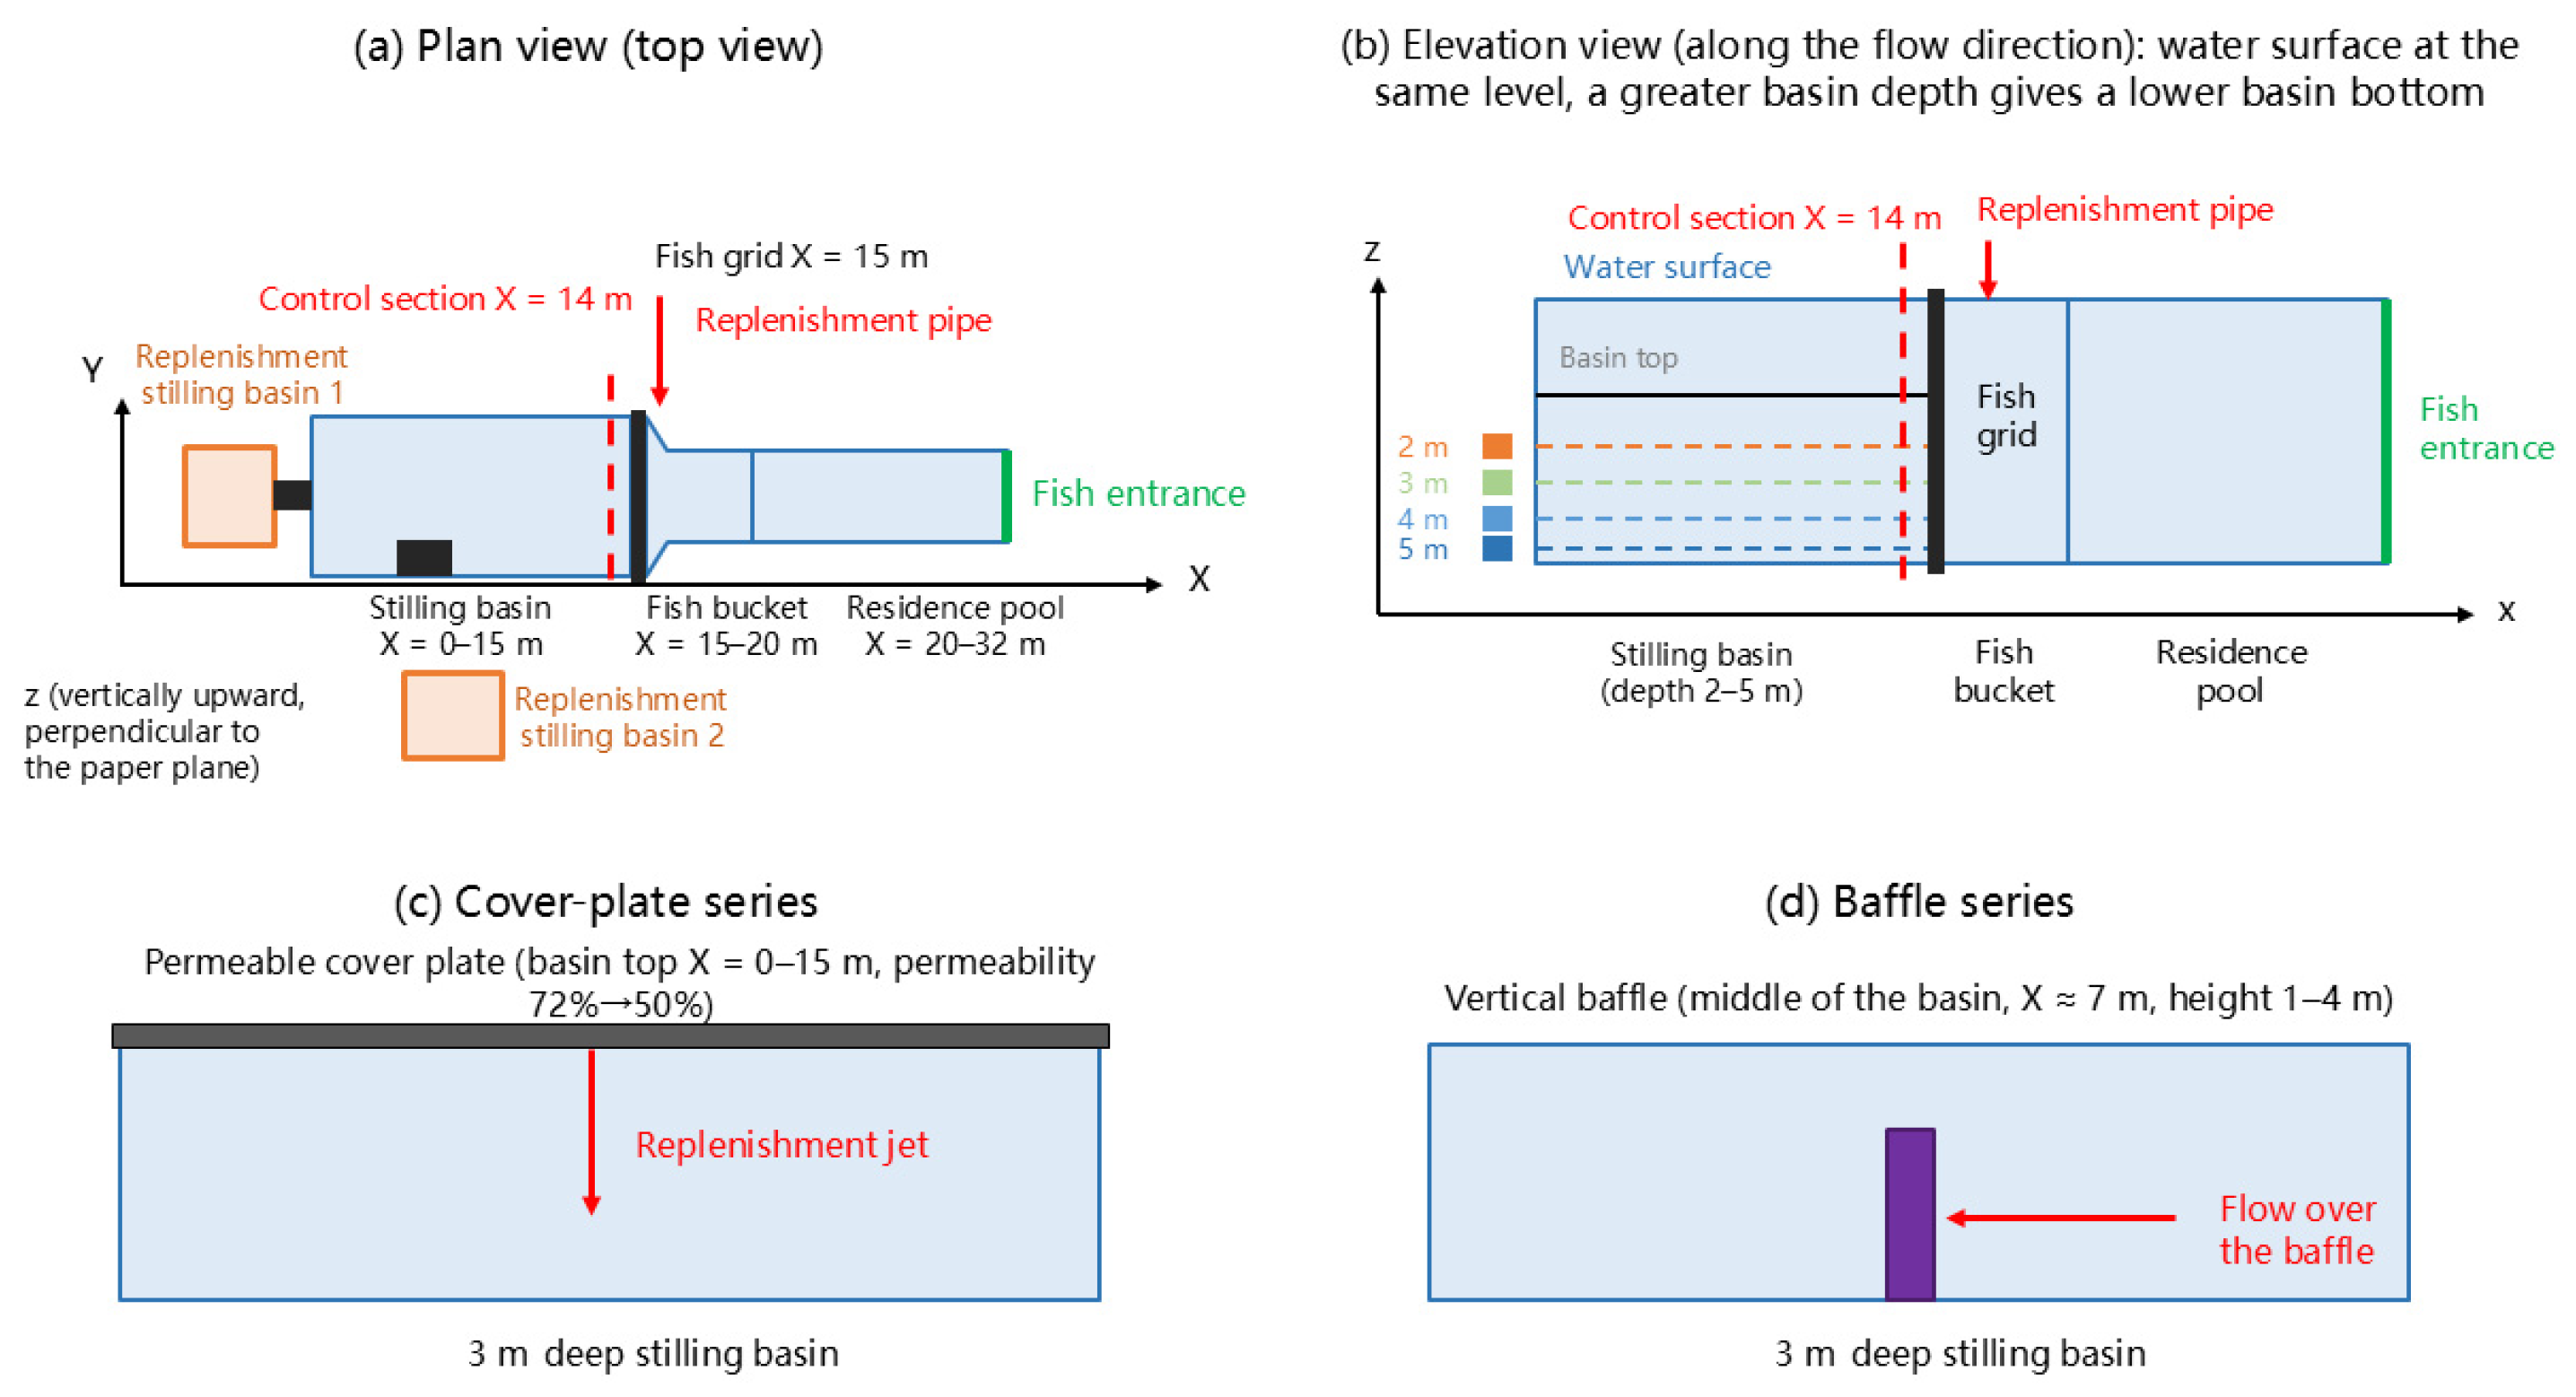
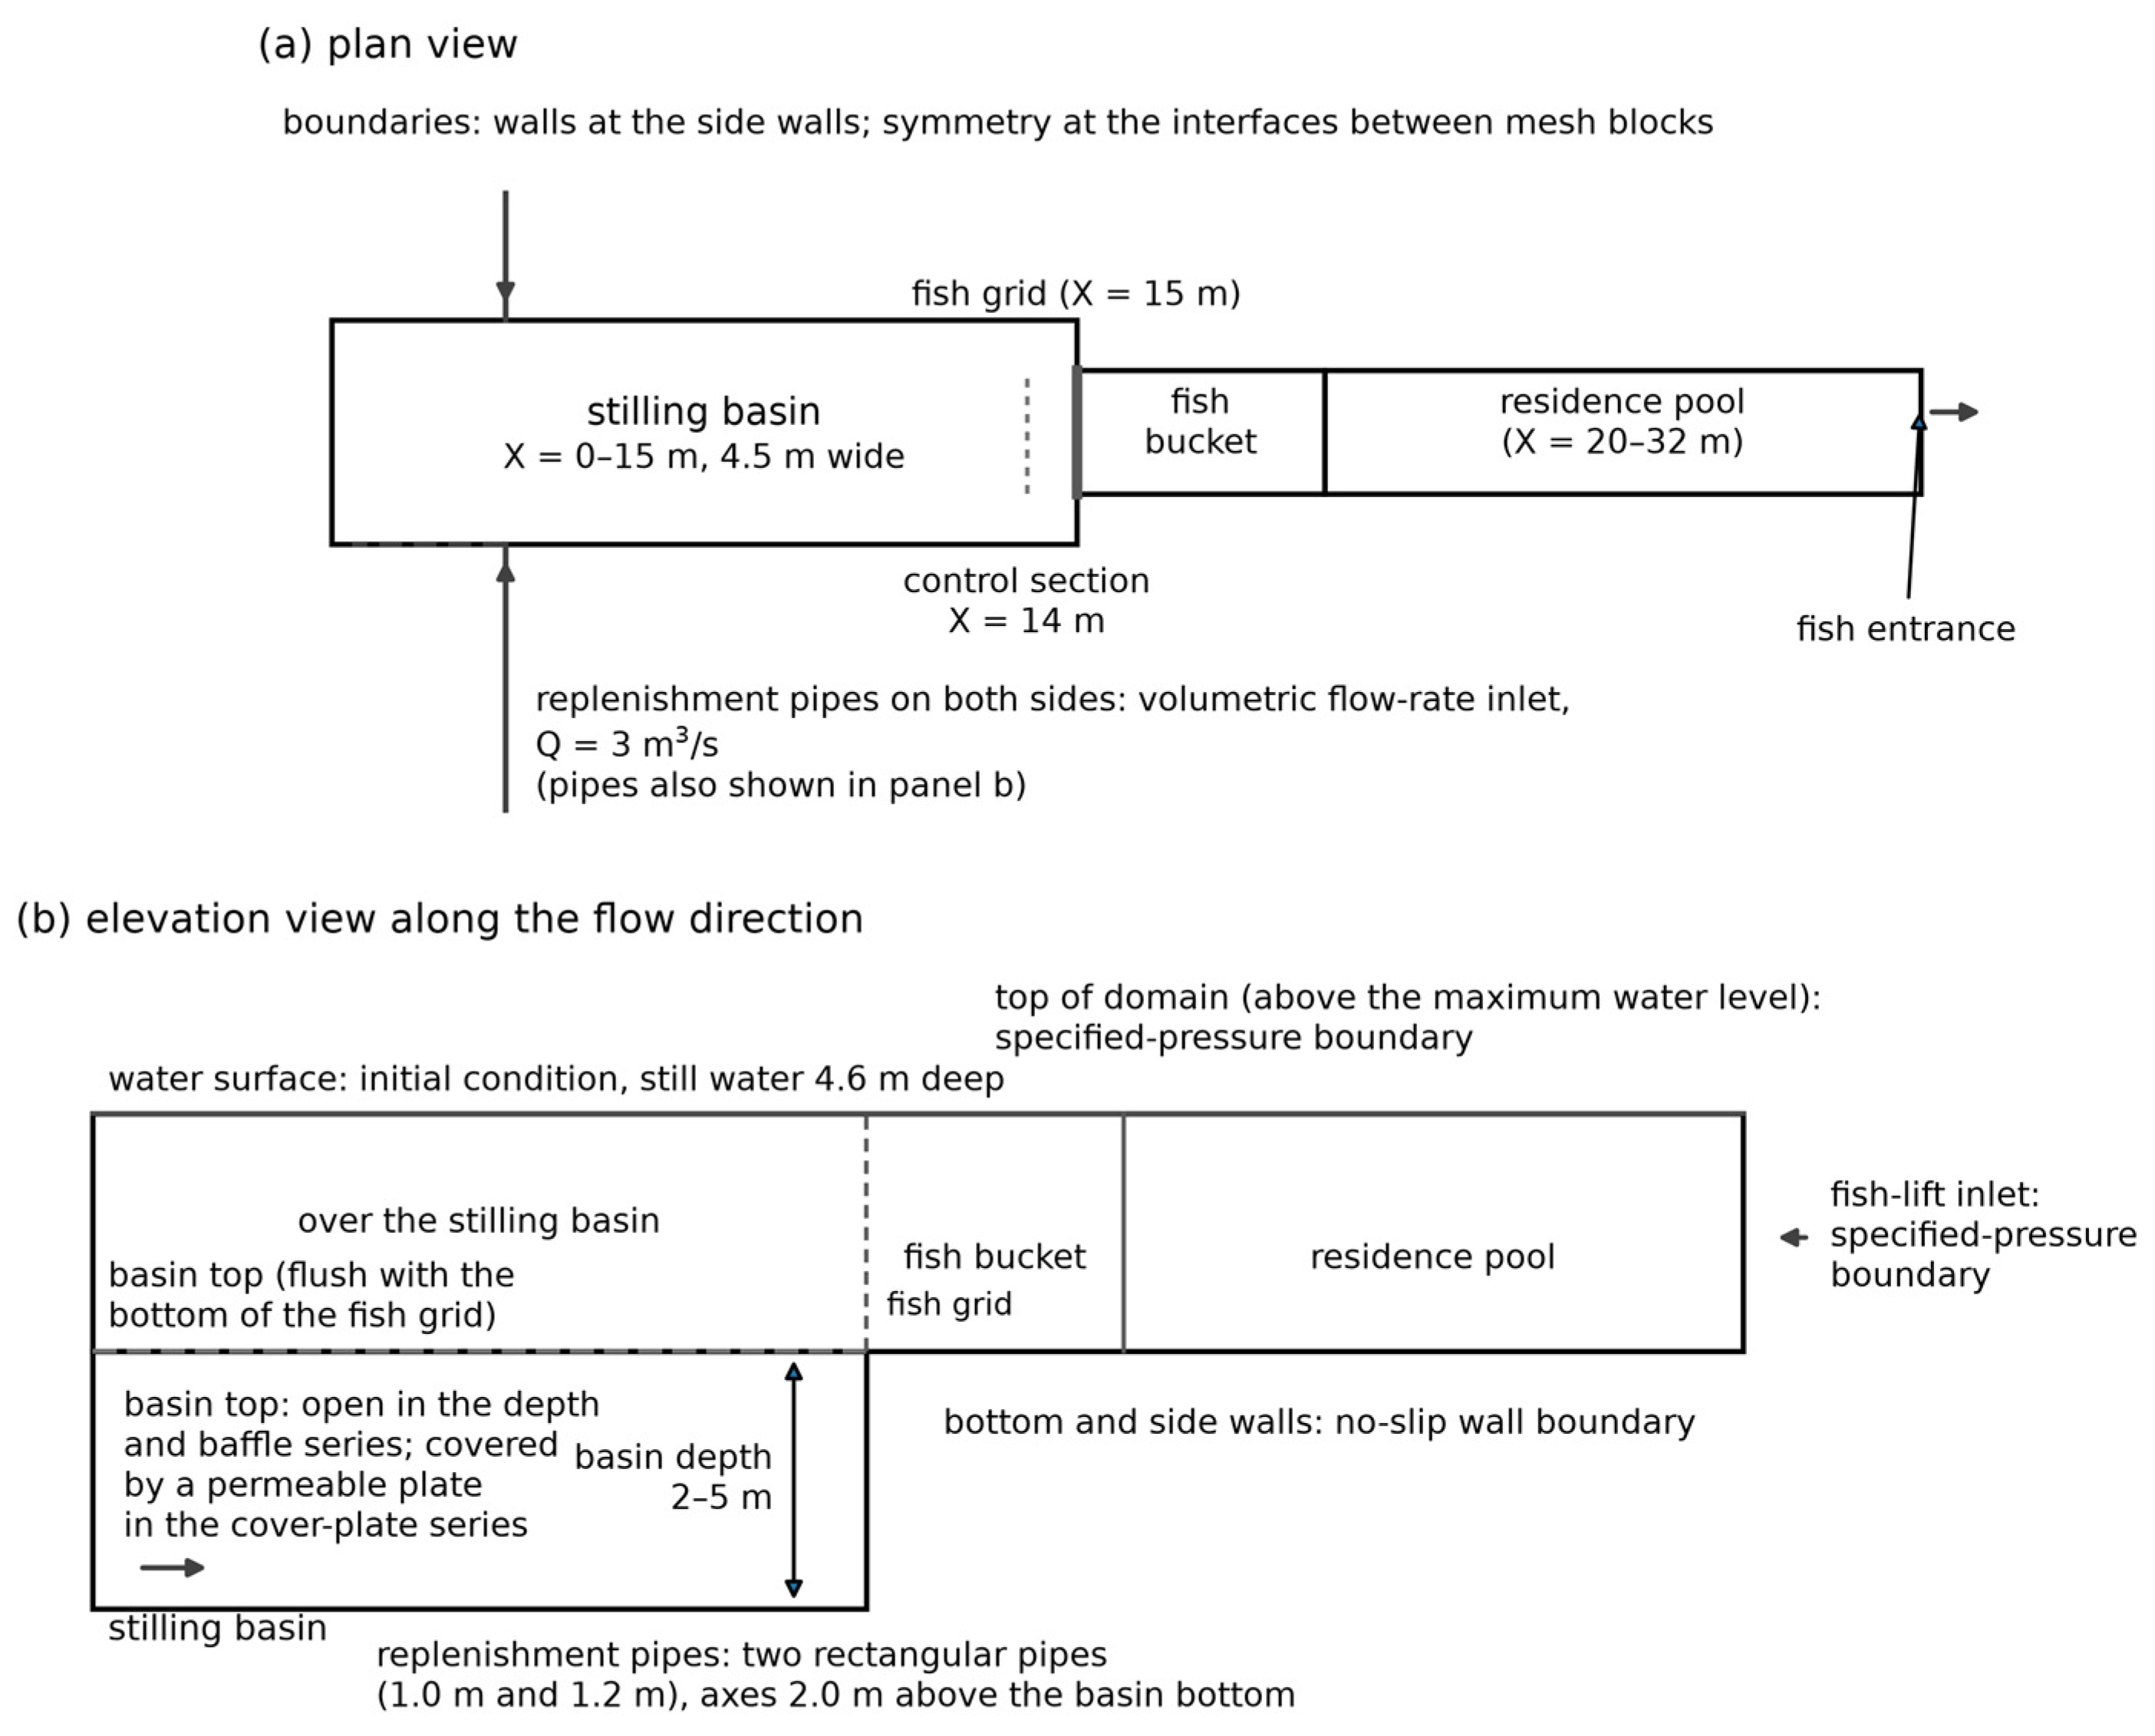
The computational domain uses a Cartesian coordinate system (Figure 1 and Figure 2a,b): the origin is taken at the centre of the most upstream section of the stilling basin at an elevation of 0 m, the x axis follows the flow direction from upstream to downstream, the y axis follows the width of the fish lift from the right bank to the left bank, and the z axis points vertically upwards, with gravity acting in the negative z direction. Along the x axis, the stilling basin occupies X = 0–15 m, the fish bucket X = 15–20 m, and the residence pool X = 20–32 m, with the fish entrance at the downstream end of the residence pool; the fish grid is installed between the stilling basin and the fish bucket at X = 15 m, and the control section X = 14 m lies 1 m upstream of the fish grid. Vertically, the top of the stilling basin (basin top) is flush with the bottom of the fish grid, and the space below the basin top is the flow space of the stilling basin. The stilling basin is 4.5 m wide in the y direction, and its depth, measured downwards from the basin top, is 2, 3, 4 or 5 m depending on the configuration examined; the fish bucket and the residence pool are 2.5 m wide. The replenishment water is supplied through two rectangular pressure pipes with cross-sectional dimensions of 1.0 m and 1.2 m, with the pipe axes lying 2.0 m above the basin bottom.
Figure 2.
Schematic of the fish-lift collection system: (a) plan view (stilling basin X = 0–15 m, fish bucket X = 15–20 m, residence pool X = 20–32 m, fish entrance, fish grid X = 15 m, two replenishment stilling basins, and control section X = 14 m); (b) elevation view along the flow direction (the basin top is flush with the bottom of the fish grid, and the basin depth is measured downwards from the basin top, 2–5 m); (c) cover-plate series (the plate covers the basin top from X = 0 to 15 m, and only the permeability is varied, 72%→50%); (d) baffle series (the baffle is located at the middle of the basin, X ≈ 7 m, and its height, measured from the basin bottom, is 1–4 m). All dimensions are given in metres and pipe diameters in millimetres.
Three energy-dissipation configurations are compared; their locations, varied parameters, and reference conditions are as follows (Figure 2c,d): (i) basin-depth series—the basin-top elevation is kept unchanged and the basin depth, measured downwards from the basin top, is set to 2, 3, 4, and 5 m, so that a greater depth corresponds to a lower basin bottom; (ii) cover-plate series—a permeable cover plate is laid over the full basin top from X = 0 to 15 m of the 3 m deep basin, its position and thickness are kept constant, and only its permeability (open-area ratio) is varied as 72%, 66%, 60%, and 50%; (iii) baffle series—a vertical baffle is installed from the basin bottom at the middle of the 3 m deep basin (X ≈ 7 m) and only its height is varied as 1, 2, 3, and 4 m (at 3 m it is equal to the height of the basin step). The reference case has a stilling-basin depth of 5 m, a fish-grid permeability of 0.56, and a one-line-gate permeability of 0.61.
The hydraulic design criteria adopted for the collection system are listed in Table 1 [25]. In addition to the control values listed in Table 1, the attraction velocity at the fish entrance of 0.7–1.41 m/s was determined from the critical swimming speed to the burst swimming speed of the target species (mainly cyprinids such as grass carp, black carp, silver carp, bighead carp, and bream, together with lampreys such as the Japanese lamprey, with a passage season from May to August) [10,25]; the velocity limits downstream of the fish grid and in the residence pool (Table 1) are engineering control values set to reconcile the low velocities required in the holding zone with the detectability of the attraction flow, and they are consistent with the requirement of the Chinese Design Code for Fish Lift of Hydropower Projects (NB/T 10863—2021) [29] that the velocity at any location shall not exceed the burst swimming speed of the weakest swimmer among the target species. The swimming capability values of the target species from which these limits were derived are listed in Table 2.
Table 1.
Hydraulic design criteria for the collection system (velocity control values of the Fengman project design [25]).
Table 2.
Swimming capability of the target species used to derive the velocity criteria.
The Chinese Design Code for Fish Lift of Hydropower Projects (NB/T 10863-2021) [29] specifies performance requirements rather than fixed geometric dimensions for the structures considered here: the layout of the collection system shall be determined by hydraulic calculation and physical-model tests (clause 3.0.5); the velocity at any location shall not exceed the burst swimming speed of the weakest target species and shall lie between the detectable velocity and the onset of anaerobic swimming (clause 4.2.4); the flow shall be continuous, steady and free of eddies (clause 4.2.5); a replenishment device shall be provided when the velocities do not meet the collection requirements (clause 4.3.9); and where a replenishment flow is introduced, it shall be passed through energy-dissipation and flow-direction adjustment devices so that it merges smoothly with the collection channel (clause 8.2.2). Accordingly, the stilling-basin depth, the cover-plate permeability and the baffle height examined here are design variables that were compared so as to satisfy these performance requirements, and each variant was verified against the physical model and the validated numerical model rather than against a prescribed geometric limit. The velocity criteria of clause 4.2.4 are met by all twelve cases, and in particular by the recommended configuration.
2.2. Governing Equations and Turbulence Model
The model uses the VOF (volume-of-fluid) method to track the free surface and the FAVOR (fractional area/volume obstacle representation) technique to treat complex geometric boundaries and, on this basis, solves the incompressible Navier–Stokes (N-S) equations, with turbulence treated by Reynolds averaging. The continuity and momentum equations in the Cartesian coordinate system are
where u, v, and w are the velocity components in the three directions; Ax, Ay, and Az are the fractional areas open to flow in the three directions; VF is the fractional volume open to flow; p is the pressure; Gx, Gy, and Gz are the gravitational acceleration components; fx, fy, and fz are the viscous acceleration components; bx, by, and bz are the flow losses caused by porous media or perforated baffles; uw, vw, and ww are the velocity source terms related to the fluid velocity; us, vs, and ws are the fluid velocities at the surface of the relative mass source related to moving objects; δ is the source-type coefficient; RSOR is the mass source term; and ρ is the fluid density. The present model contains no internal mass source or moving object, i.e., RSOR = 0 and δ = 0, so the mass-source term in the momentum equations above is zero.
Turbulence is closed with the renormalisation-group (RNG) k–ε model. Compared with the standard k–ε model, the coefficients of the RNG model are derived from this theory rather than from empirical calibration, and it is therefore well suited to low-intensity turbulence and strong shear flow, which are typical of the flow inside and downstream of the stilling basin. Because the flow involves a submerged jet impinging on the basin bottom, passage through the cover-plate apertures and flow over the baffle, the turbulence closure must respond reliably to high strain rates and streamline curvature; the RNG formulation satisfies this requirement, and it has been widely applied to stilling basins, submerged jets, hydraulic jumps and flows through perforated baffles [26,28]. The turbulent viscosity is calculated from the turbulent kinetic energy kT and its dissipation rate εT:
where CNU is an empirical constant. In the numerical computation, the minimum value of ε is limited in order to avoid a physically meaningless turbulent viscosity:
where TLEN is the maximum turbulence length scale, which can be defined by the user or limited automatically by the software.
2.3. Boundary Conditions, Mesh Generation, and Mesh-Independence Verification
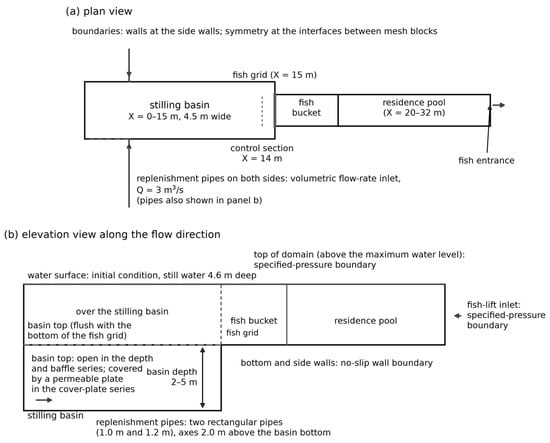
The computational parameters of the model are a replenishment discharge of 3 m3/s and a water depth of 4.6 m. Four types of boundary conditions are applied: a volumetric flow rate boundary at the inlet of the replenishment pipes (3 m3/s), a specified-pressure boundary at the fish-lift inlet, wall boundaries at the bottom and side walls, and symmetry boundaries at the interfaces between mesh blocks; the initial condition is a still water body 4.6 m deep. For the free surface, the VOF method adopted in the model treats the air above it as a void region at constant atmospheric pressure; the surface is free to deform, and surface tension is neglected because the Weber number of the flow is large. The top of the computational domain is placed above the maximum water level. Since the replenishment jets discharge through submerged pipes below the basin top and the free surface remains close to a horizontal plane, the air-entrainment model was not activated. The boundary conditions and the initial condition of the model are summarised in Figure 3.
Figure 3.
Boundary conditions and initial conditions of the numerical model: volumetric flow-rate inlet at the replenishment pipes (3 m3/s), specified-pressure boundary at the fish-lift inlet, no-slip wall boundaries at the bottom and side walls, and symmetry boundaries at the interfaces between mesh blocks; the top of the domain lies above the maximum water level. The initial condition is a still-water body 4.6 m deep. Arrows indicate flow directions and boundary locations; dashed lines indicate the water surface and fish-grid interface, whereas solid lines indicate solid boundaries.
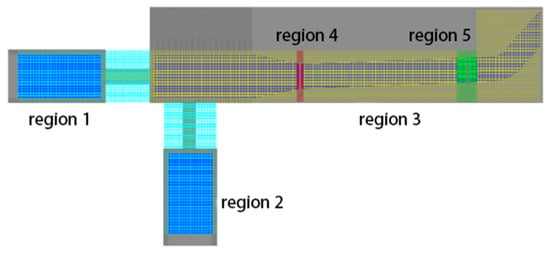
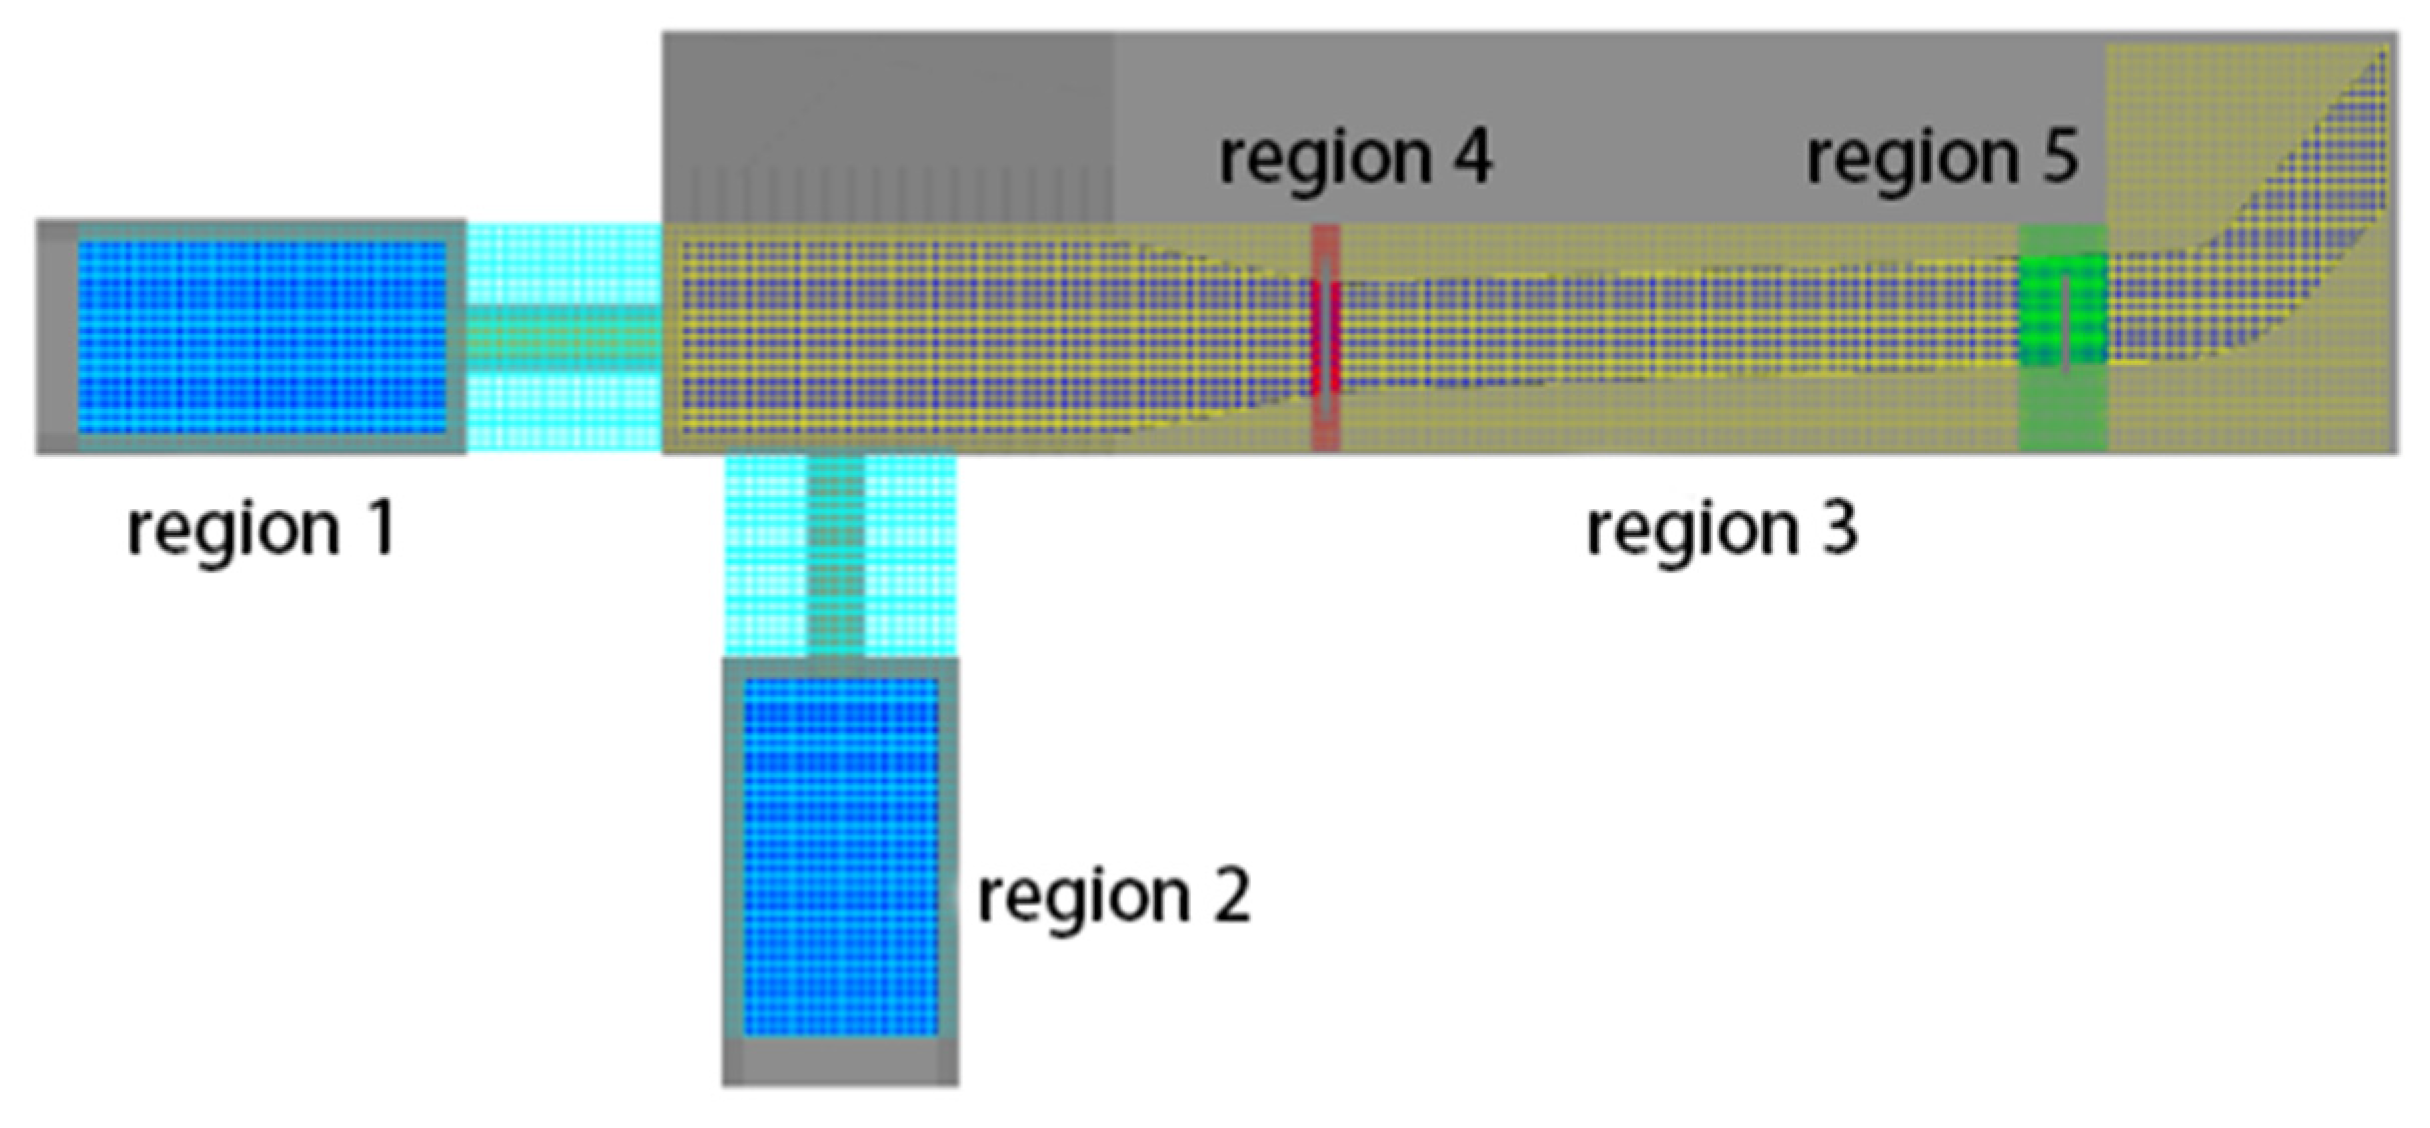
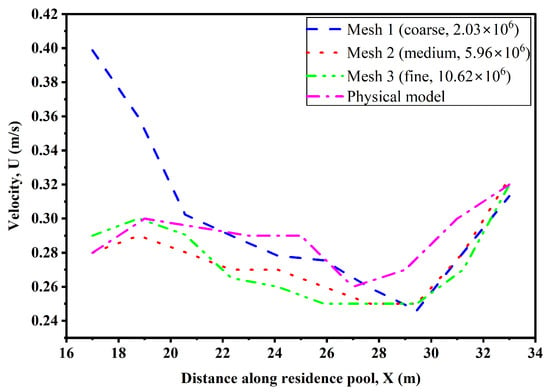
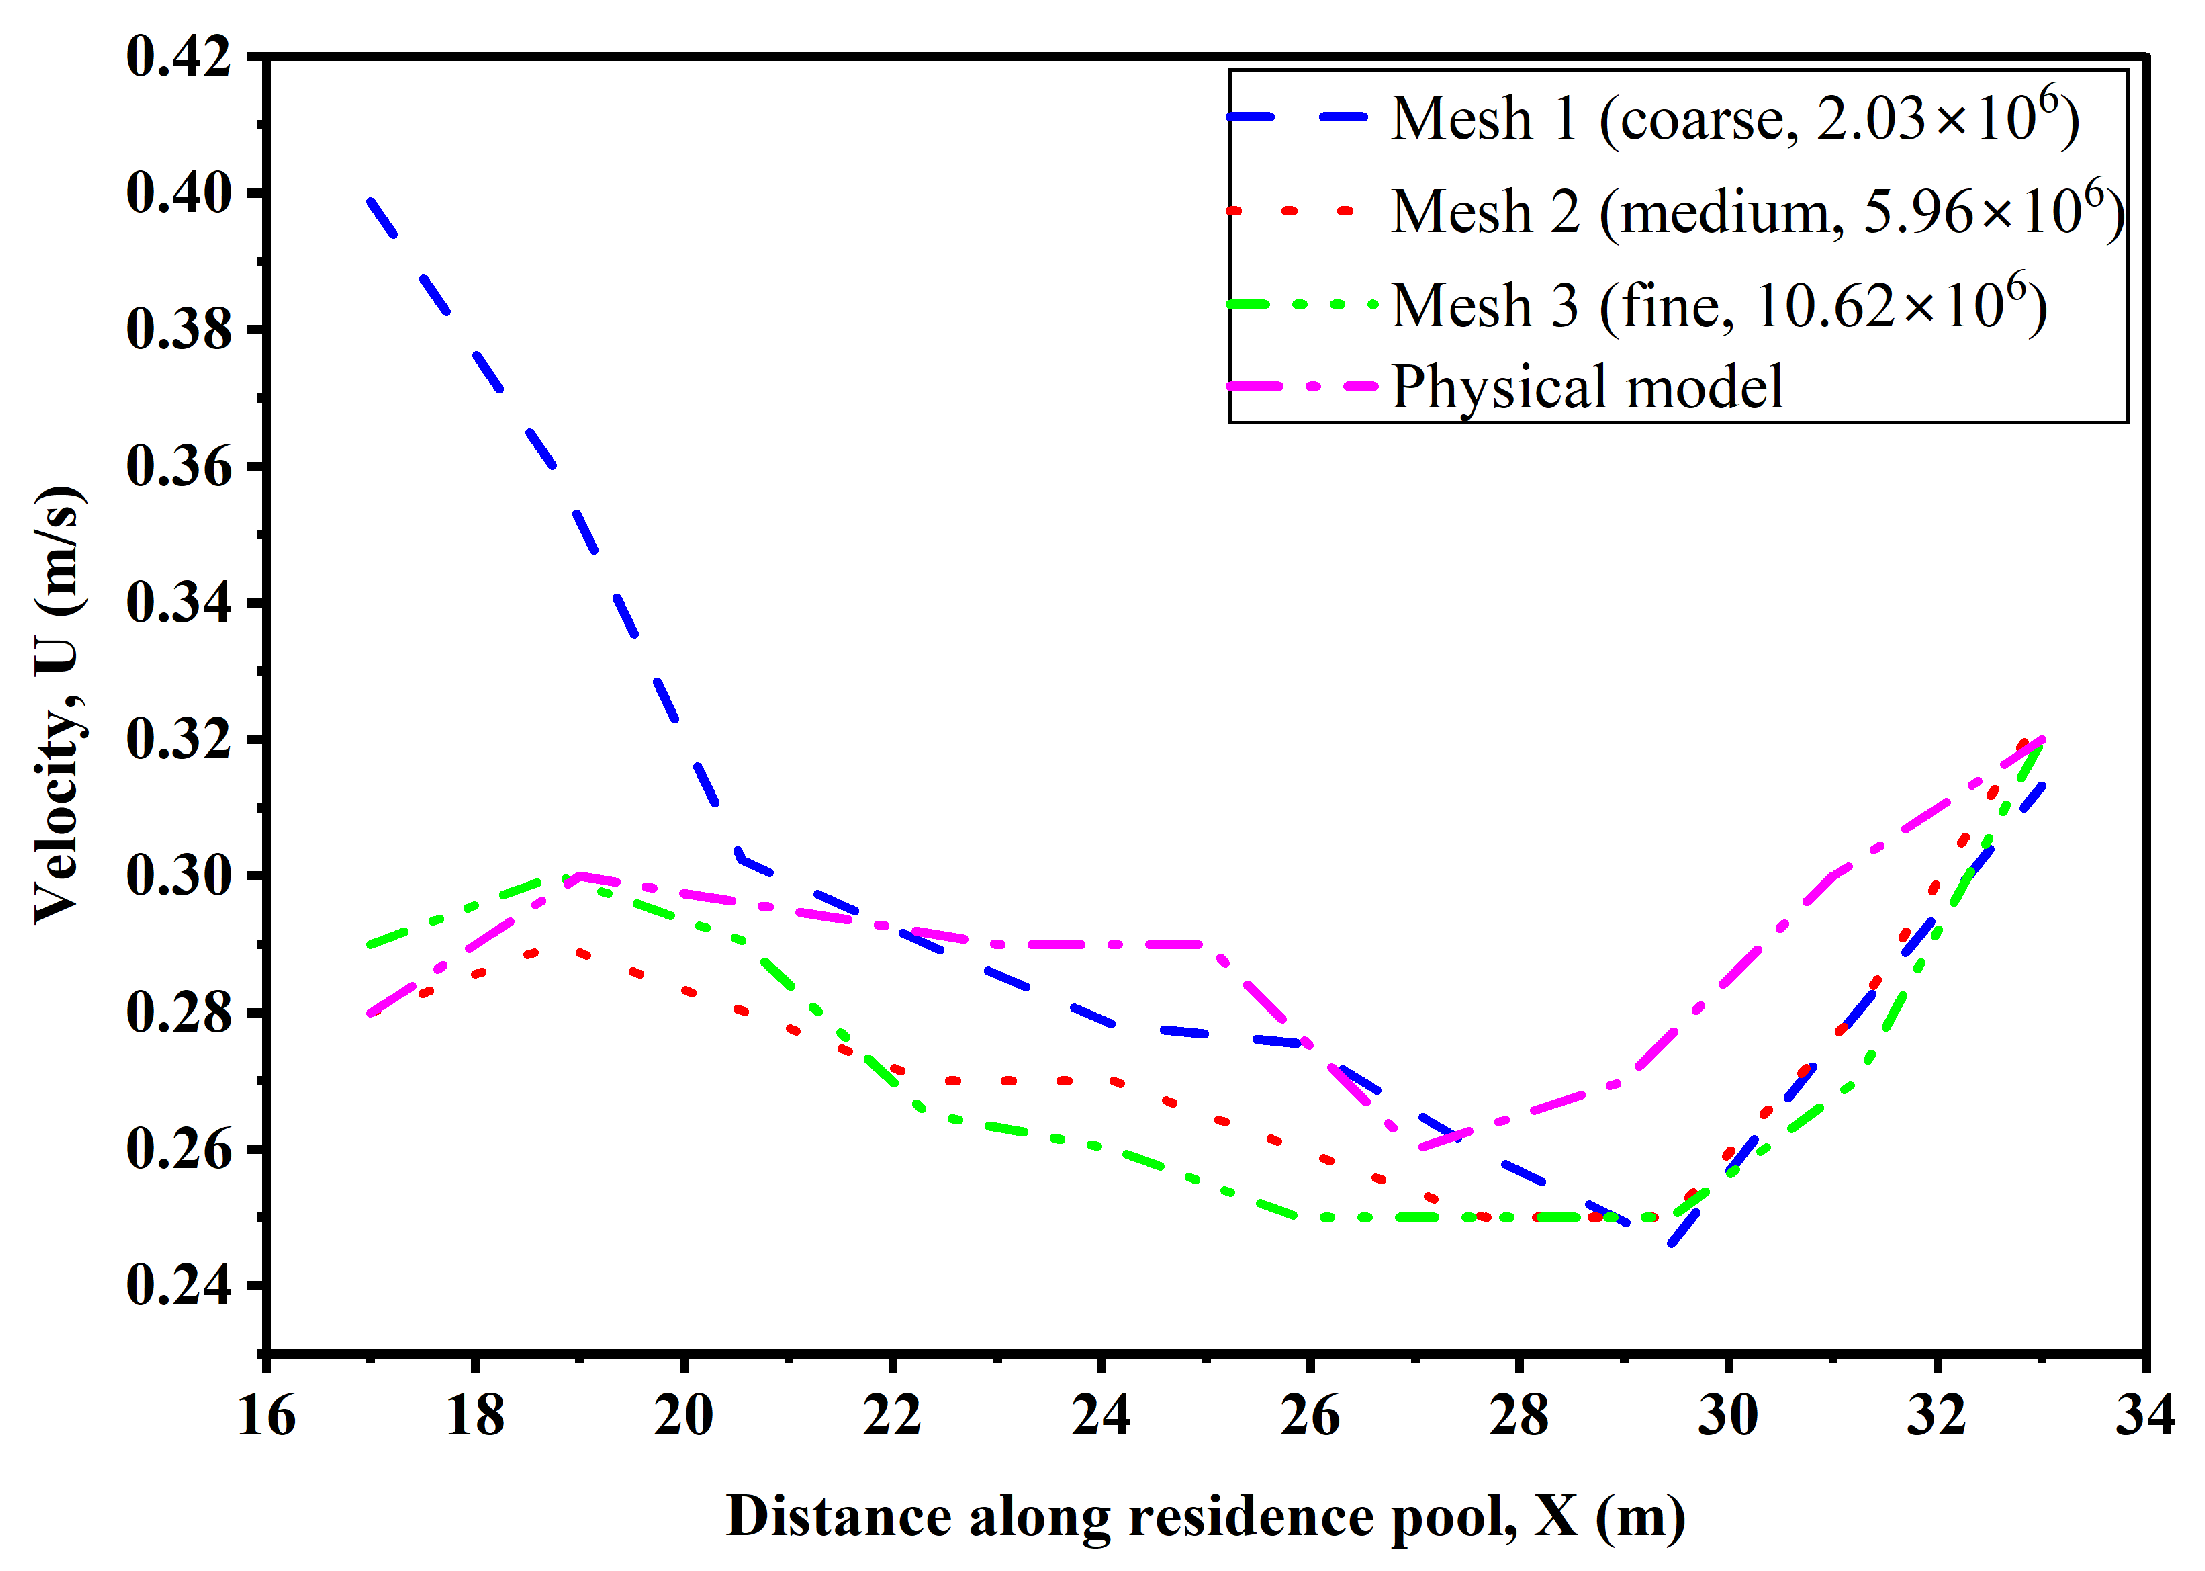
The computational domain is discretised with structured hexahedral cells in the Cartesian coordinate system. Using the nested-mesh capability of the solver, the domain is divided into five blocks with local refinement: two blocks for the replenishment pipes, one for the main body of the fish lift, and two refined blocks around the fish grid and the one-line gate, respectively (Figure 4), so as to increase the resolution in regions with a large velocity gradient while controlling the total number of cells. For mesh-independence verification, three meshes with approximately 2.03 million (coarse), 5.96 million (medium), and 10.62 million (fine) cells were generated. Taking the reference case A1 as an example, the streamwise velocity profiles along the residence pool at the same elevation (a horizontal measurement line) obtained with the three meshes were compared (Figure 5): the coarse mesh deviates appreciably from the medium and fine meshes, especially in the upstream part of the residence pool, whereas the profiles of the medium and fine meshes almost coincide. To justify the choice of the medium mesh quantitatively, the three velocity profiles plotted in Figure 5 were compared at the ten common stations along the residence pool. The root-mean-square difference between the medium and the fine mesh is 0.008 m/s, about 3% of the mean velocity, with a maximum local deviation of 0.010 m/s, whereas the coarse mesh differs from the fine mesh by an RMSE of 0.042 m/s, about 15% of the mean velocity. Considering both accuracy and computational cost, the medium mesh (5.96 million cells) was used for all subsequent computations.
Figure 4.
Nested mesh blocks used in the computational domain: Blocks 1 and 2 are the two replenishment stilling basins (including the replenishment pipes), Block 3 is the main body of the fish lift, and Blocks 4 and 5 are the locally refined blocks around the fish grid and the one-line gate. Different colours are used only to distinguish the five nested mesh blocks.
Figure 5.
Mesh-independence verification: streamwise velocity profiles along the residence pool (at the same elevation) computed with the coarse (2.03 × 10⁶), medium (5.96 × 10⁶), and fine (10.62 × 10⁶) meshes and compared with the physical-model measurements.
2.4. Model Validation
A physical model of the fish lift was built at a geometric scale of 1:5.33 following the Froude similarity criterion, with a total length of about 21 m (excluding the upstream and downstream reservoirs). The residence pool, the fish bucket, and the fish entrance were made of acrylic glass to allow observation of the flow pattern, whereas the stilling basin was made of steel plate because of the greater water depth. Velocity was measured with a Nortek acoustic Doppler velocimeter (ADV; Nortek Group, Rud, Norway). Water level was measured with a point gauge, and discharge was measured with a rectangular weir and an ultrasonic flow meter. At each measurement point, the signal was sampled continuously for at least 3 min at a sampling frequency of 50 Hz, and the record was time averaged. Spikes caused by aliasing and by the interaction of the acoustic beams with the free surface or the bed were removed with a phase-space thresholding despiking algorithm [33], and samples with a signal-to-noise ratio below 15 dB or a correlation below 70% were discarded. The resulting uncertainty is well below the differences between the configurations compared here.
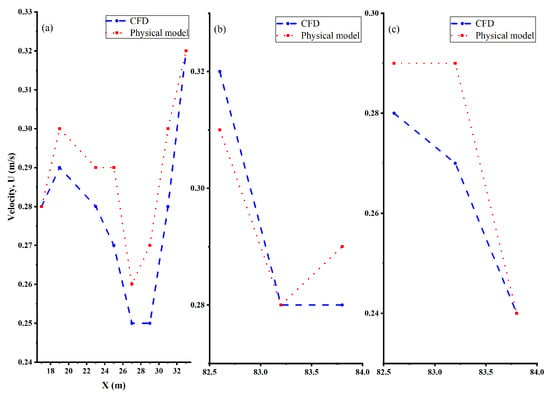
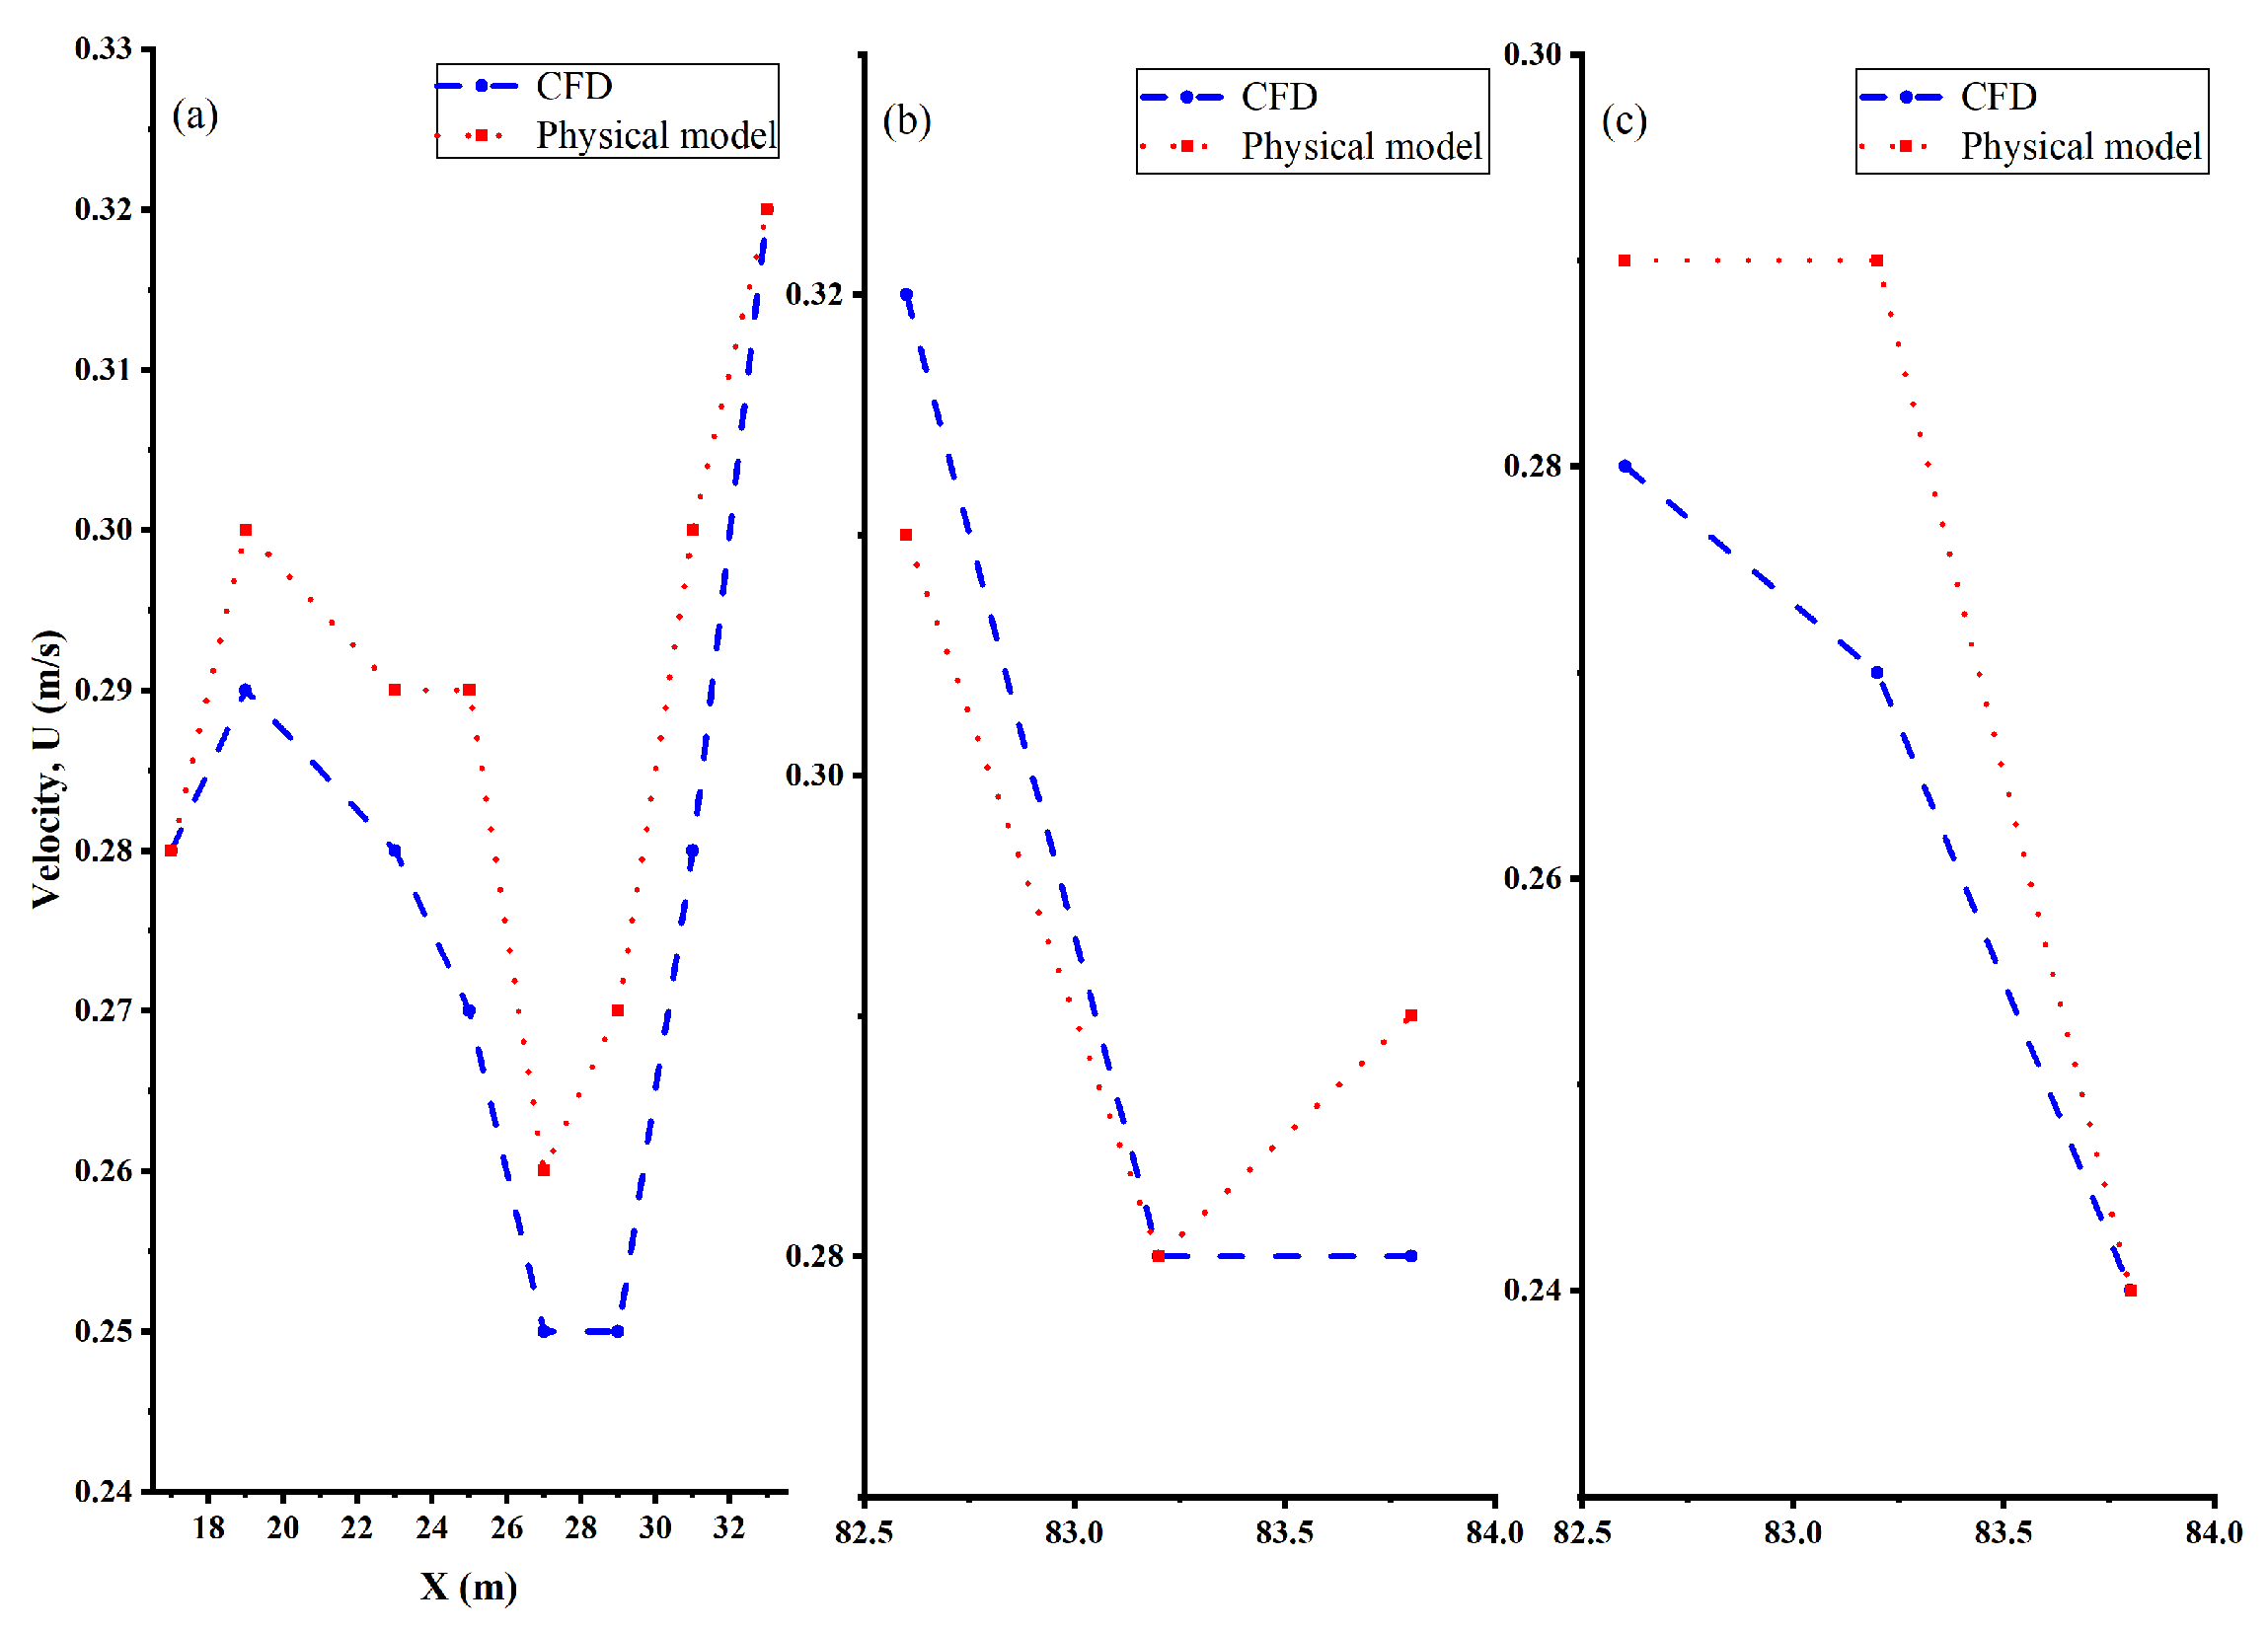
Validation was carried out under the single-unit half-generation condition: the validation case had a stilling-basin depth of 5 m, a water depth of 4.6 m, a one-line-gate opening of 0.4 m, a gate permeability of 0.61, a fish-grid permeability of 0.56, and a replenishment discharge of 3 m3/s, identical in geometry and parameters to those of numerical model A1. In this case, 24 surface velocity measurement points were arranged in the residence pool, comprising eight sections along the main flow direction and transverse measurement points in the fish bucket and the residence pool (Figure 6). The computed and measured velocities agree well in both magnitude and trend along the main flow direction of the residence pool and in the transverse direction of the fish bucket and the residence pool; the root-mean-square error (RMSE) over the 24 measurement points is 0.04 m/s, which is about 14% of the mean measured velocity (0.29 m/s), and the mean computed velocity is about 1.6% lower than the mean measured value. Because the mesh cannot fully resolve the thickness of the fish-grid openings, the resistance of the fish grid in the numerical model is slightly higher than that in the physical model, which may be one reason for the overall underestimation of the computed velocities. The above results show that the numerical model reproduces the velocity distribution of the physical model with satisfactory accuracy and can be used for the subsequent comparison of energy-dissipation configurations.
Figure 6.
Comparison of the numerical and physical-model velocities: (a) along the main flow direction in the residence pool; (b) transverse direction in the fish bucket; (c) transverse direction in the residence pool. The root-mean-square error over the 24 surface measurement points is 0.04 m/s.
2.5. Simulation Cases
Twelve cases in three series were set up (Table 3, Figure 2). In the depth series (A1–A4), all other parameters were fixed and the stilling-basin depth was set to 5, 4, 3, and 2 m, respectively; in the cover-plate series (B1–B4), a permeable cover plate with a permeability of 72%, 66%, 60%, or 50% was installed on top of the 3 m deep stilling basin; and in the baffle series (C1–C4), a vertical baffle with a height of 1, 2, 3, or 4 m was installed at the middle of the 3 m deep stilling basin. The fish-grid permeability was 0.56 for the depth series (the same as in the model-validation case) and 0.61 for the cover-plate and baffle series; physical-model tests showed that a fish-grid permeability in the range 0.56–0.75 has little effect on the velocity downstream of the grid, so this difference can be neglected in the comparison between series. All twelve cases use the same operating condition: single-unit half generation, with a water depth of 4.6 m and a replenishment discharge of 3 m3/s. Of the four design water depths, 4.6 m is the shallowest and gives the most demanding flow conditions in the collection system, so it is chosen as the governing condition. The three deeper depths (4.98 m, 5.64 m and 6.11 m, for one, two and three generating units at full generation) were tested in the physical model.
Table 3.
Simulation cases.
2.6. Performance Metrics
The energy-dissipation effect is usually measured by the energy-dissipation ratio, but in a fish-lift collection system, the replenishment energy is fully dissipated in every scheme, so that the energy-dissipation ratio cannot reflect the hydraulic differences between schemes; the passage effect depends mainly on the uniformity and turbulence intensity of the flow field after energy dissipation [34,35]. Therefore, the coefficient of variation of velocity (CV) and the streamwise turbulent kinetic energy (TKE) are used here to evaluate the performance of the three energy-dissipation configurations.
- (1)
- The coefficient of variation of velocity (CV) on the control section upstream of the fish grid (X = 14 m) is used as one index. This section is located at the downstream end of the stilling basin, immediately upstream of the fish grid; its velocity distribution reflects how uniform the replenishment flow has become by the time it reaches the fish grid, and it is the common control section for the hydraulic performance of the three configurations. Twenty-seven sampling points are arranged on this section (nine elevations × three transverse positions), and CV is defined aswhere σ is the standard deviation and ū the mean of the velocity magnitudes at the sampling points of the section. A smaller CV indicates a more uniform velocity distribution on the section and a stronger reduction in the non-uniformity of the inflow by the stilling basin. There is precedent for using a coefficient-based index to quantify flow uniformity [36]; it should be noted, however, that CV is used here only to compare the relative uniformity of the velocity distribution among cases, and no absolute threshold of uniformity is defined on its basis.
- (2)
- The streamwise turbulent kinetic energy (TKE) extracted along the centreline of the fish bucket and the residence pool (X = 15–32 m) is used as the other index and is denoted by k (m2/s2). TKE reflects the turbulence intensity experienced by fish and is closely related to the energetic cost of swimming and to behavioural responses [14,16,18]. k is calculated with the RNG k–ε model. In the analysis, the mean value of k along the centreline (hereafter the mean TKE) is taken to represent the overall turbulence level of the collection zone, and the maximum TKE along the line is also considered in order to identify any local region of strong turbulence.
3. Results
3.1. Effects of the Three Energy-Dissipation Configurations on Velocity Distribution and Turbulent Kinetic Energy
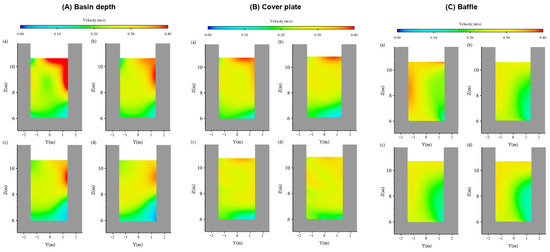
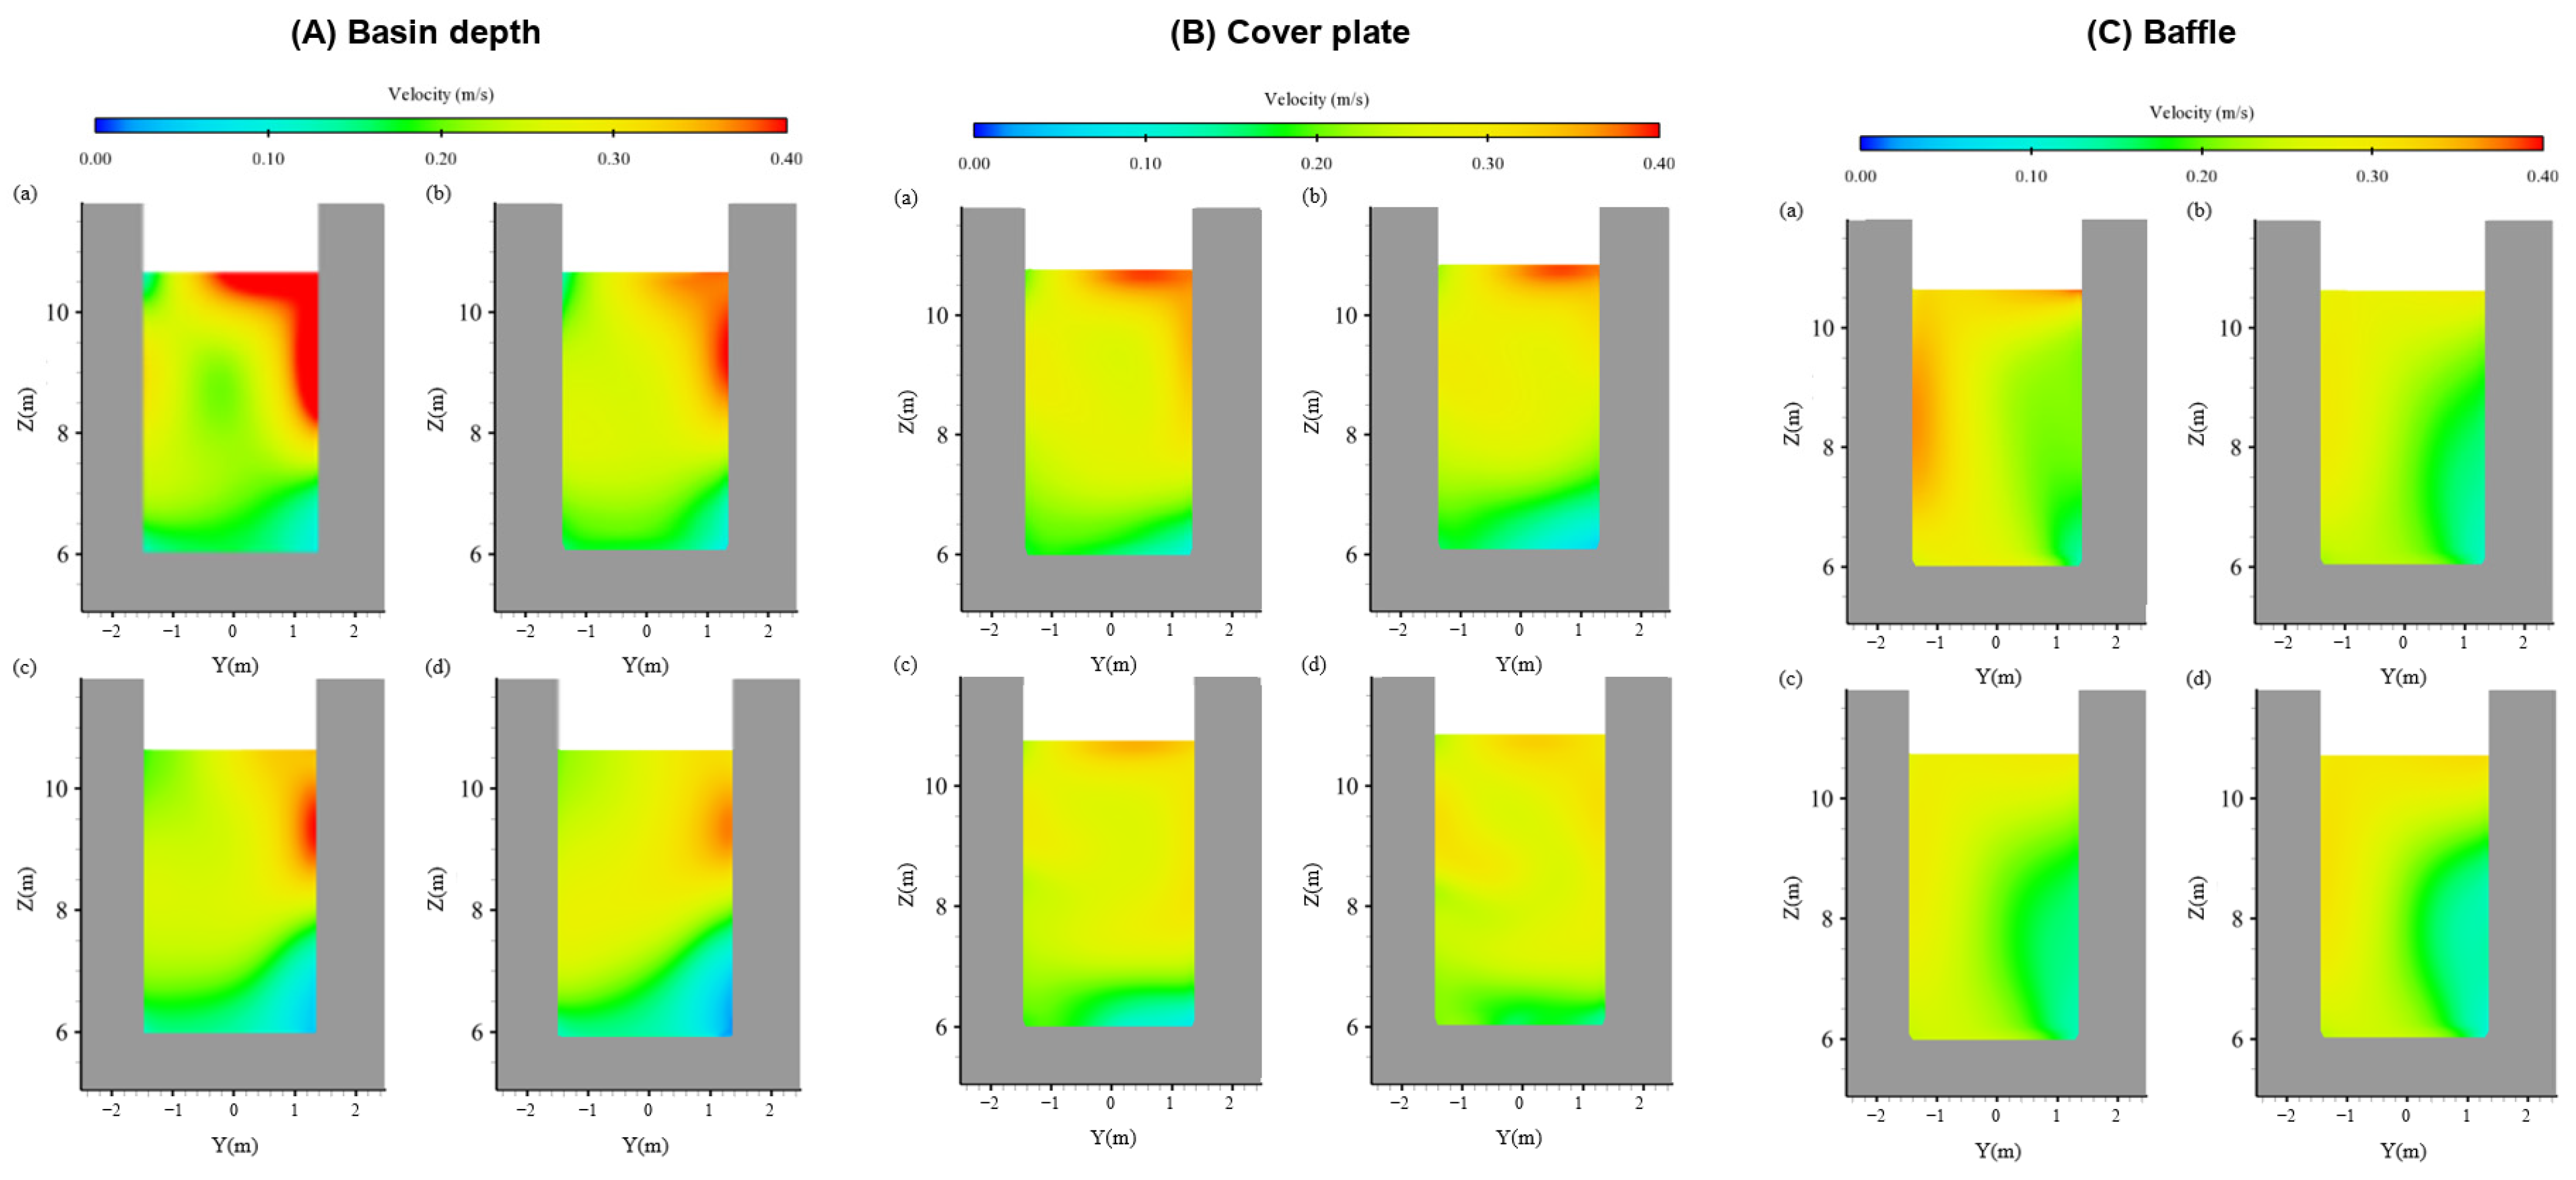
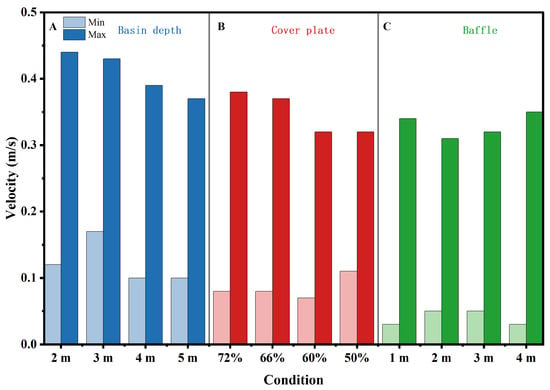
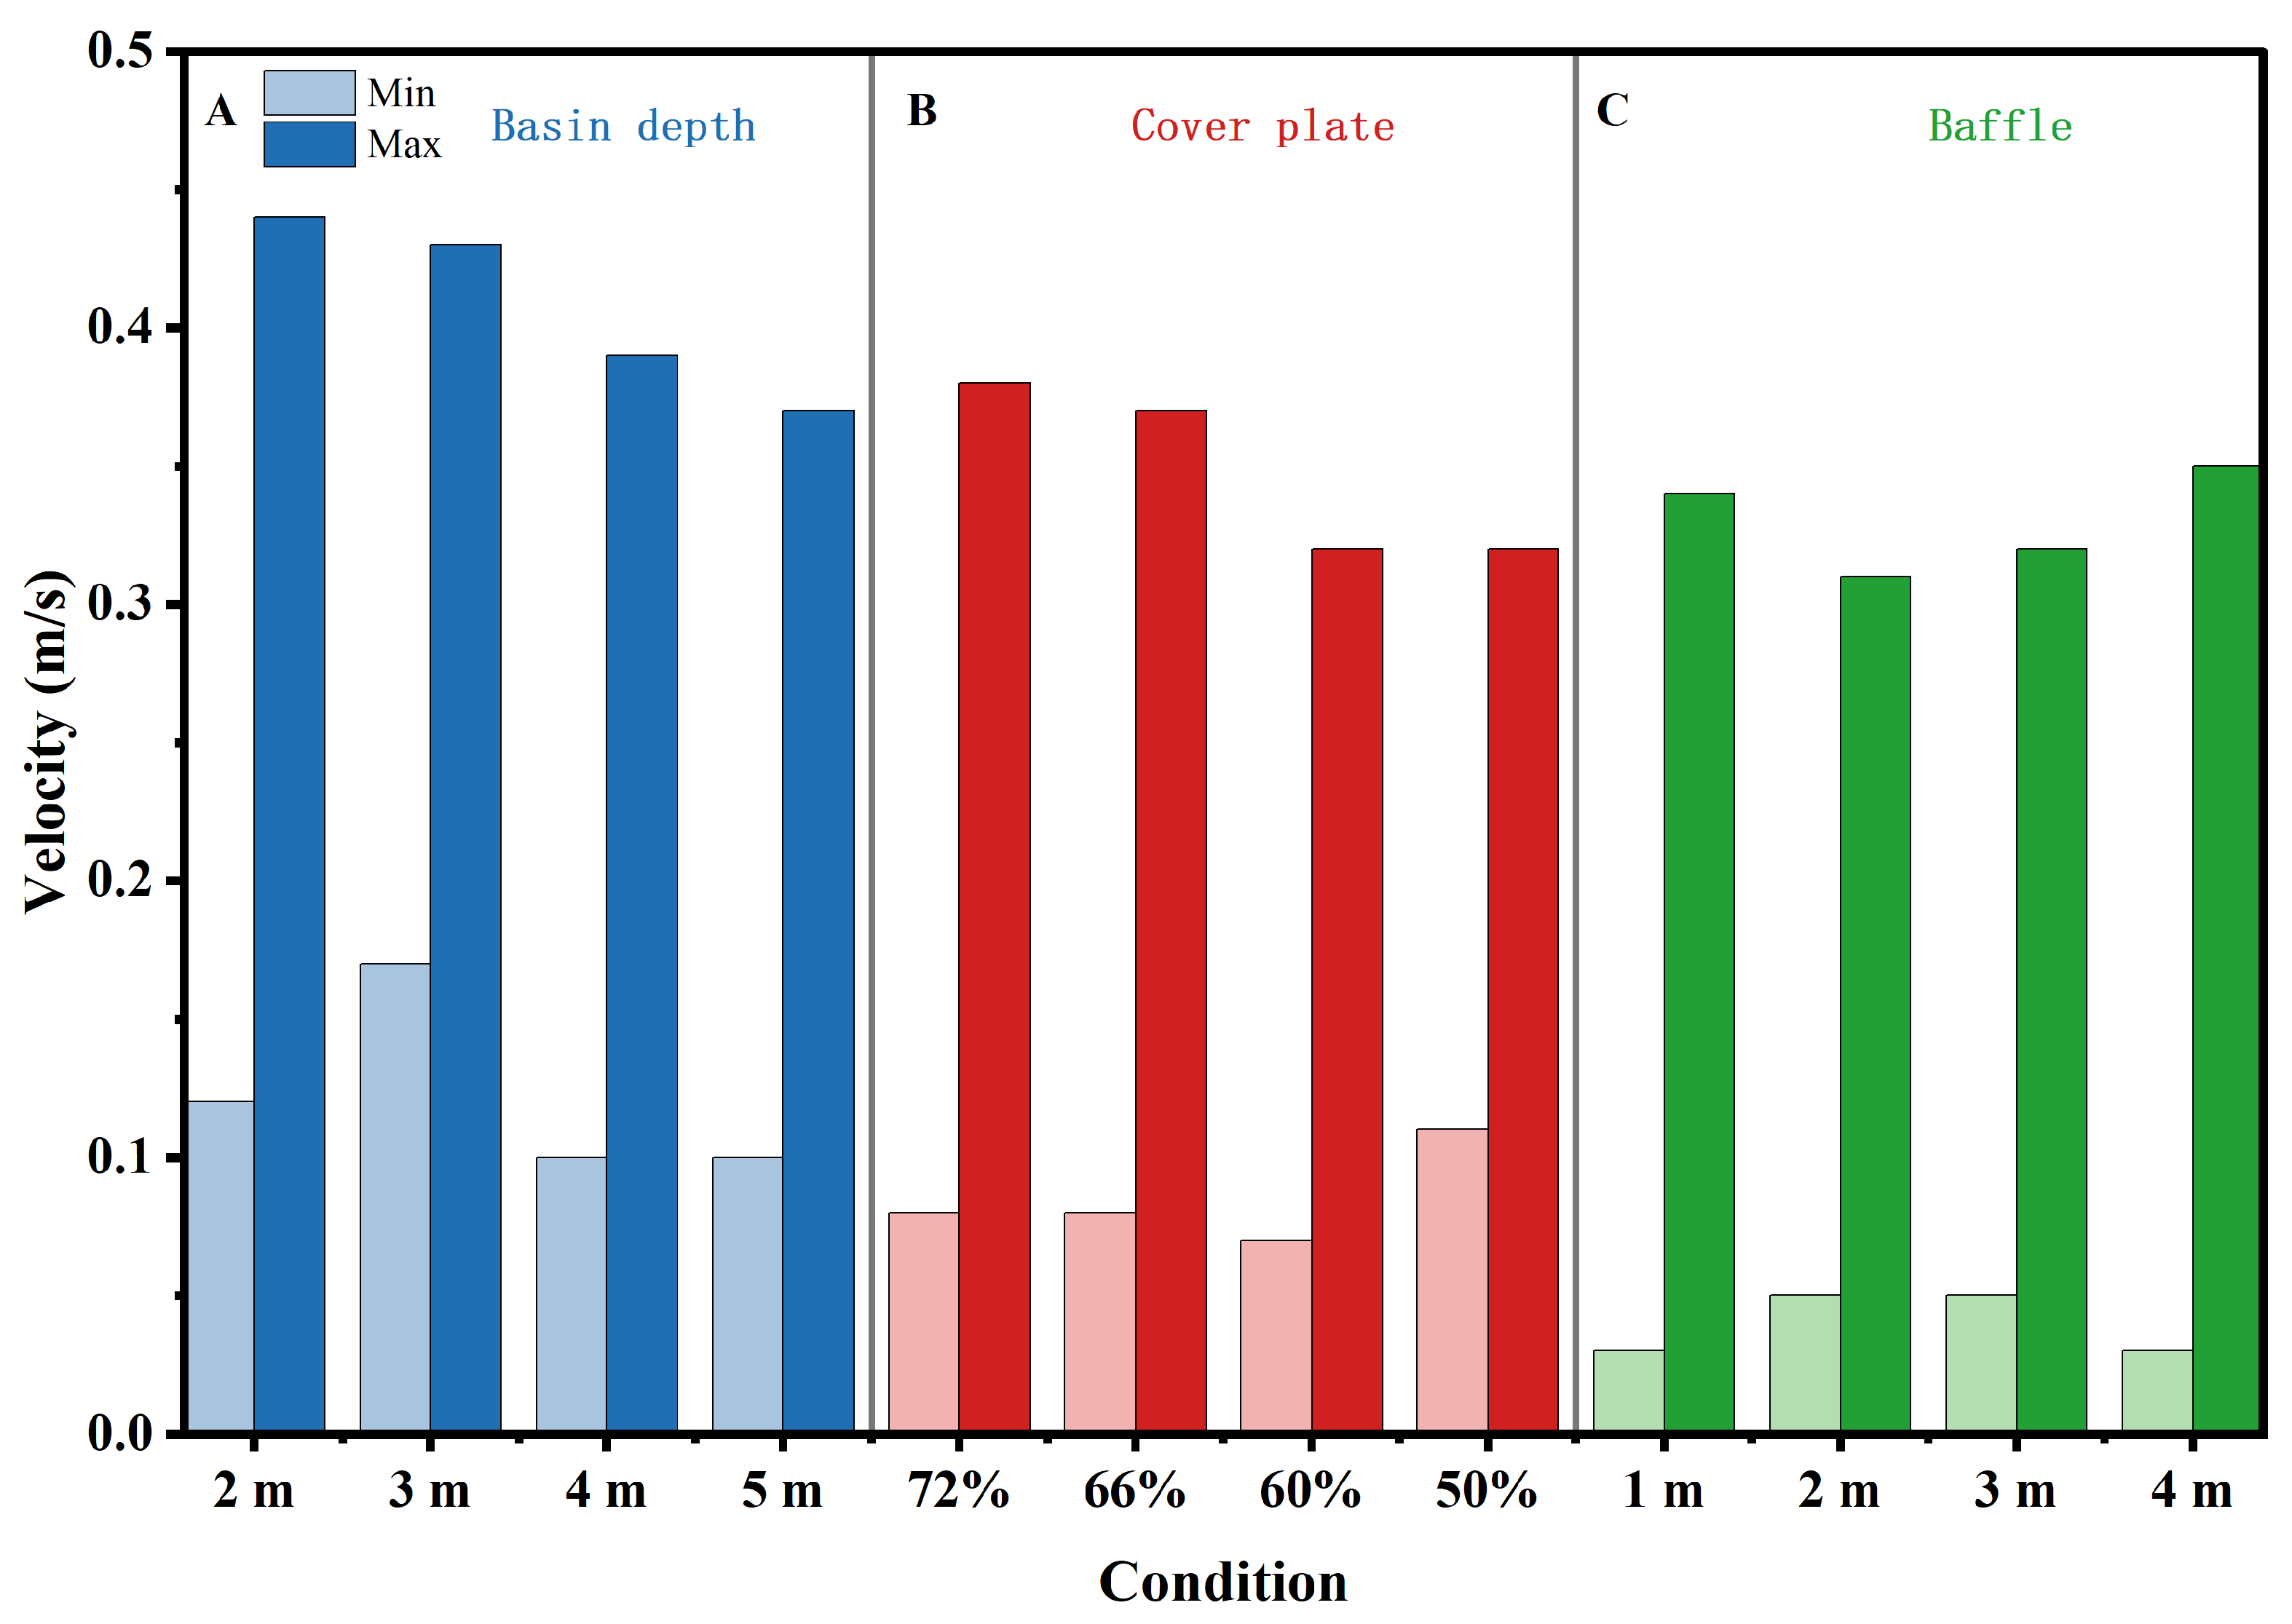
The velocity distributions of the three configurations are compared on the control section upstream of the fish grid (X = 14 m) (Figure 7). In the depth series, the high-velocity region is largest and clearly asymmetric in the transverse direction when the basin is 2 m deep; as the basin depth increases, the high-velocity region gradually contracts, and at 5 m it is the smallest; the velocity range on the section narrows from 0.12–0.44 m/s at 2 m to 0.10–0.37 m/s at 5 m. In the cover-plate series, installing a permeable cover plate on top of the 3 m deep basin markedly reduces the high-velocity region compared with the uncovered case, and the velocity distribution becomes more uniform as the permeability decreases from 72% to 50%. The baffle series behaves non-monotonically: the suppression of the high-velocity region is most evident at 2 m, whereas at 4 m the flow is deflected and a new high-velocity region forms. The minimum and maximum velocities on the X = 14 m section for each case are shown in Figure 8.
Figure 7.
Velocity–magnitude contours on the control section upstream of the fish grid (X = 14 m): (A) basin-depth series, with (a–d) corresponding to depths of 2, 3, 4, and 5 m; (B) cover-plate permeability series, with (a–d) corresponding to permeabilities of 72%, 66%, 60%, and 50%; (C) baffle-height series, with (a–d) corresponding to heights of 1, 2, 3, and 4 m.
Figure 8.
Velocity range (minimum and maximum velocity) on the control section upstream of the fish grid (X = 14 m) for each case. A: basin-depth series; B: cover-plate permeability series; C: baffle-height series. Light and dark shades represent minimum and maximum velocities, respectively; blue, red, and green distinguish the basin-depth, cover-plate, and baffle series.
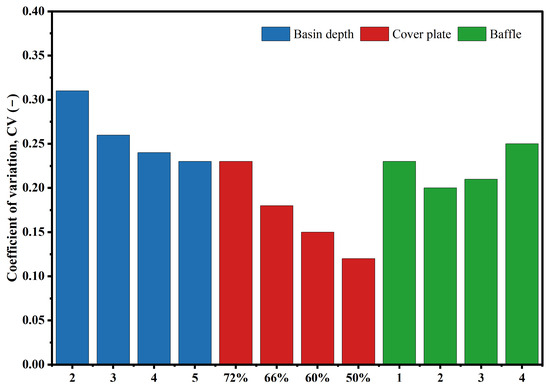
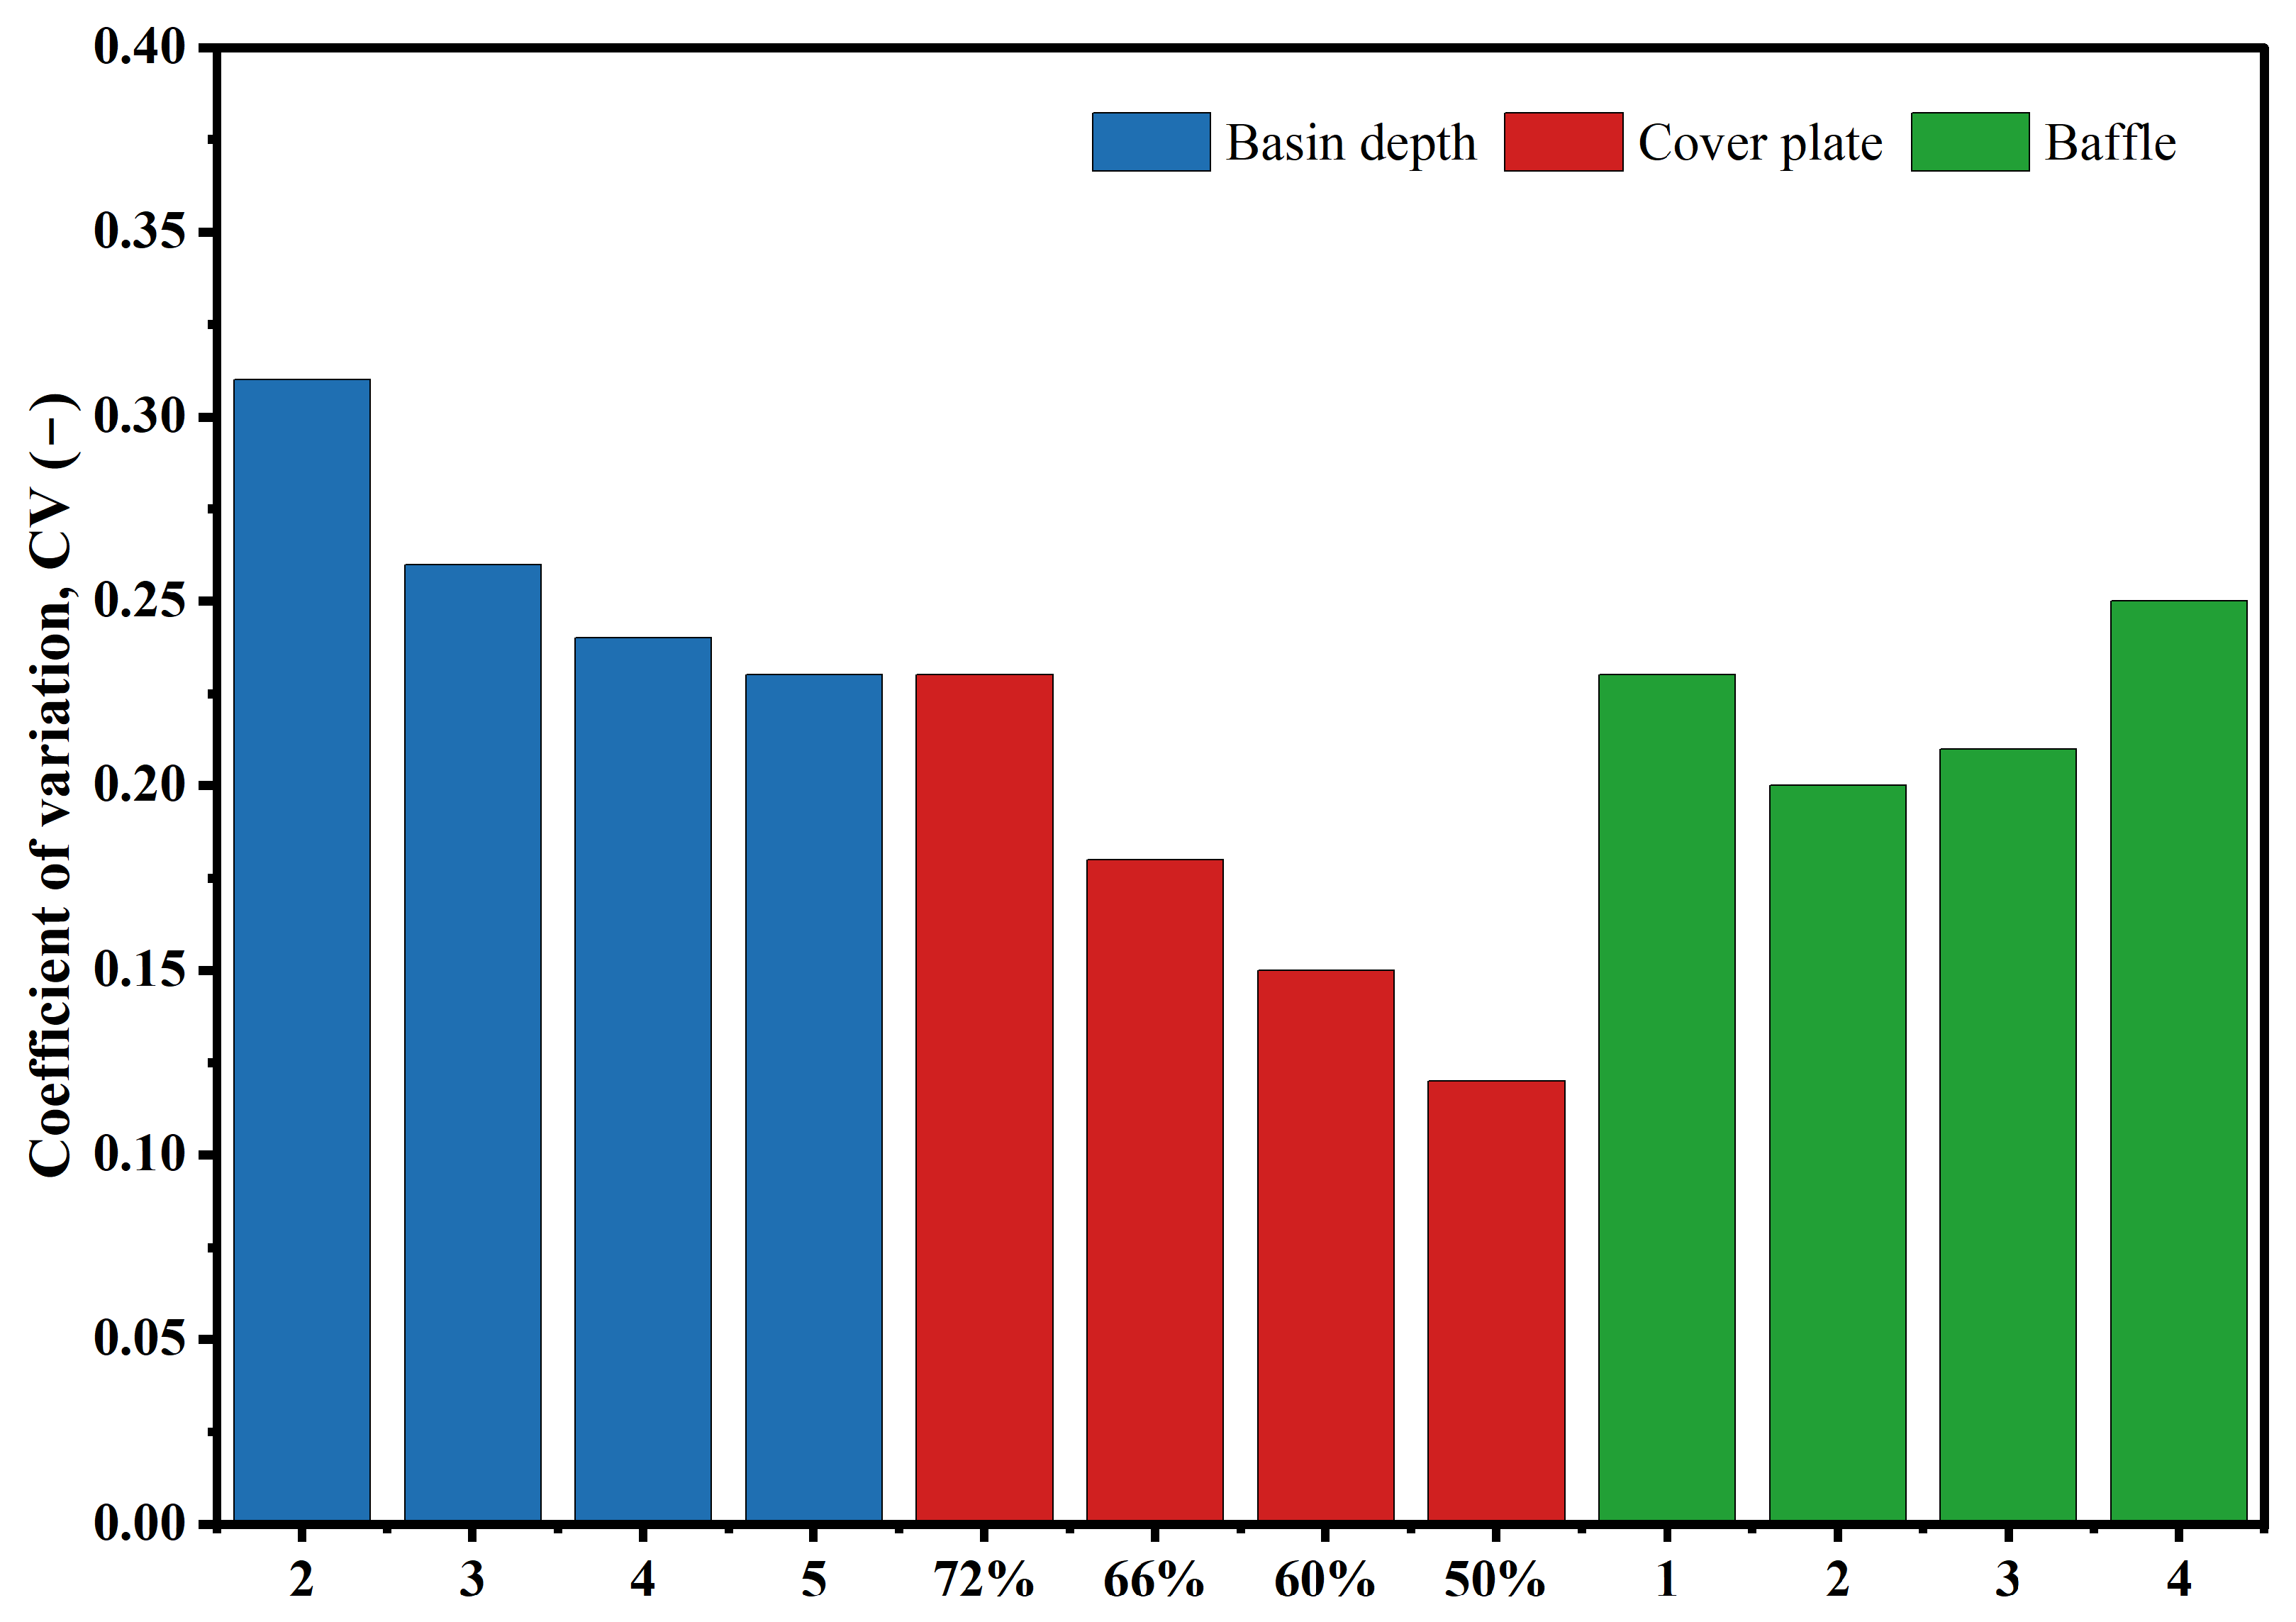
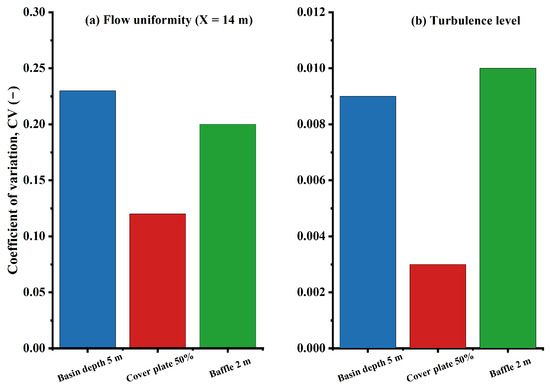
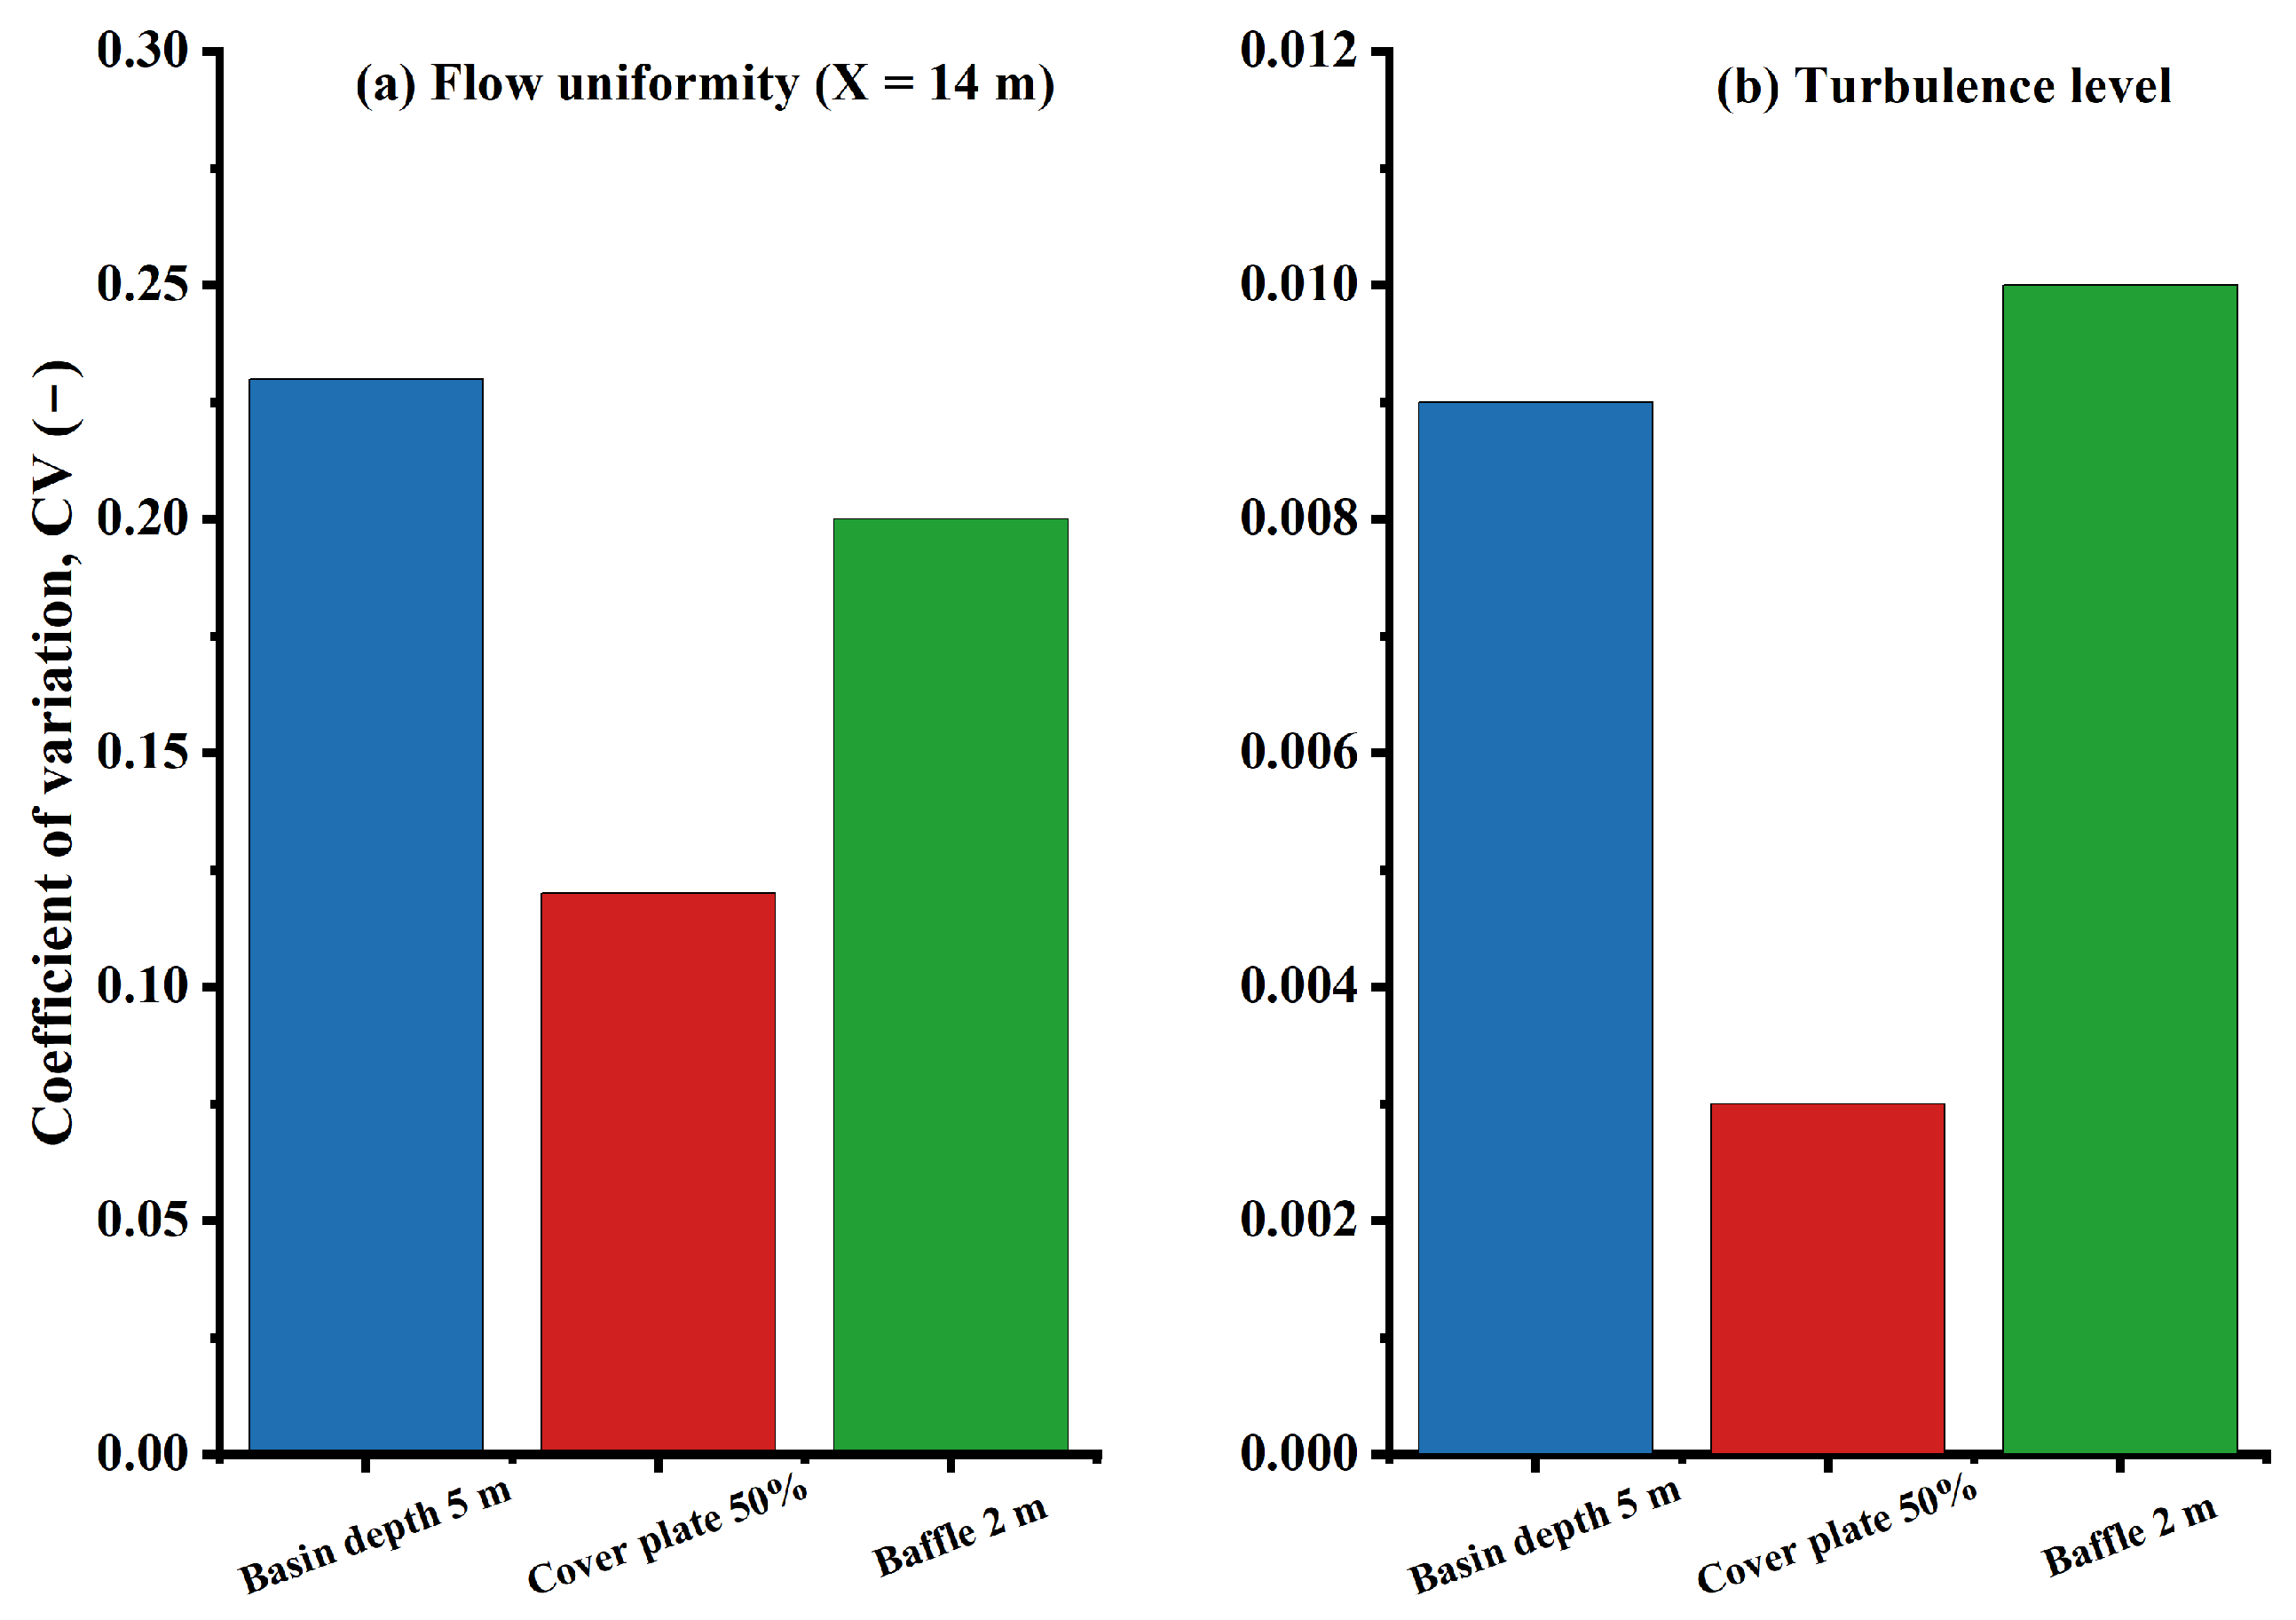
The CV values of the three configurations are compared in Figure 9. For the depth series, CV decreases monotonically from 0.31 (2 m) to 0.23 (5 m); for the cover-plate series it decreases monotonically from 0.23 (72%) to 0.12 (50%), the lowest value of the three configurations; and for the baffle series it first decreases and then increases, with a minimum of 0.20 at 2 m and a rise to 0.25 at 4 m. Among the 12 cases, therefore, the 3 m deep basin fitted with the 50% permeability cover plate gives the most uniform velocity distribution on the X = 14 m section, followed by the 2 m baffle (0.20) and the 5 m deep basin (0.23).
Figure 9.
Coefficient of variation of velocity (CV) on the control section upstream of the fish grid (X = 14 m) for the 12 cases of the three series: basin depth (2, 3, 4, and 5 m), cover-plate permeability (72%, 66%, 60%, and 50%), and baffle height (1, 2, 3, and 4 m).
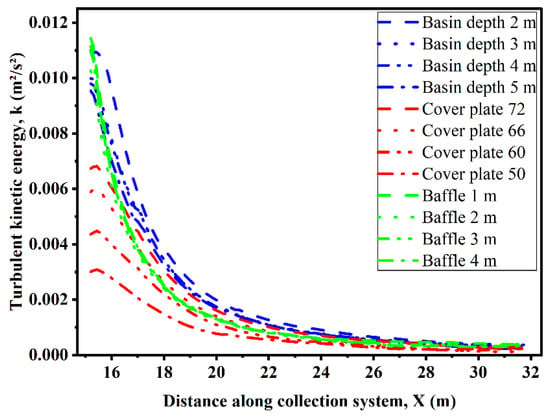
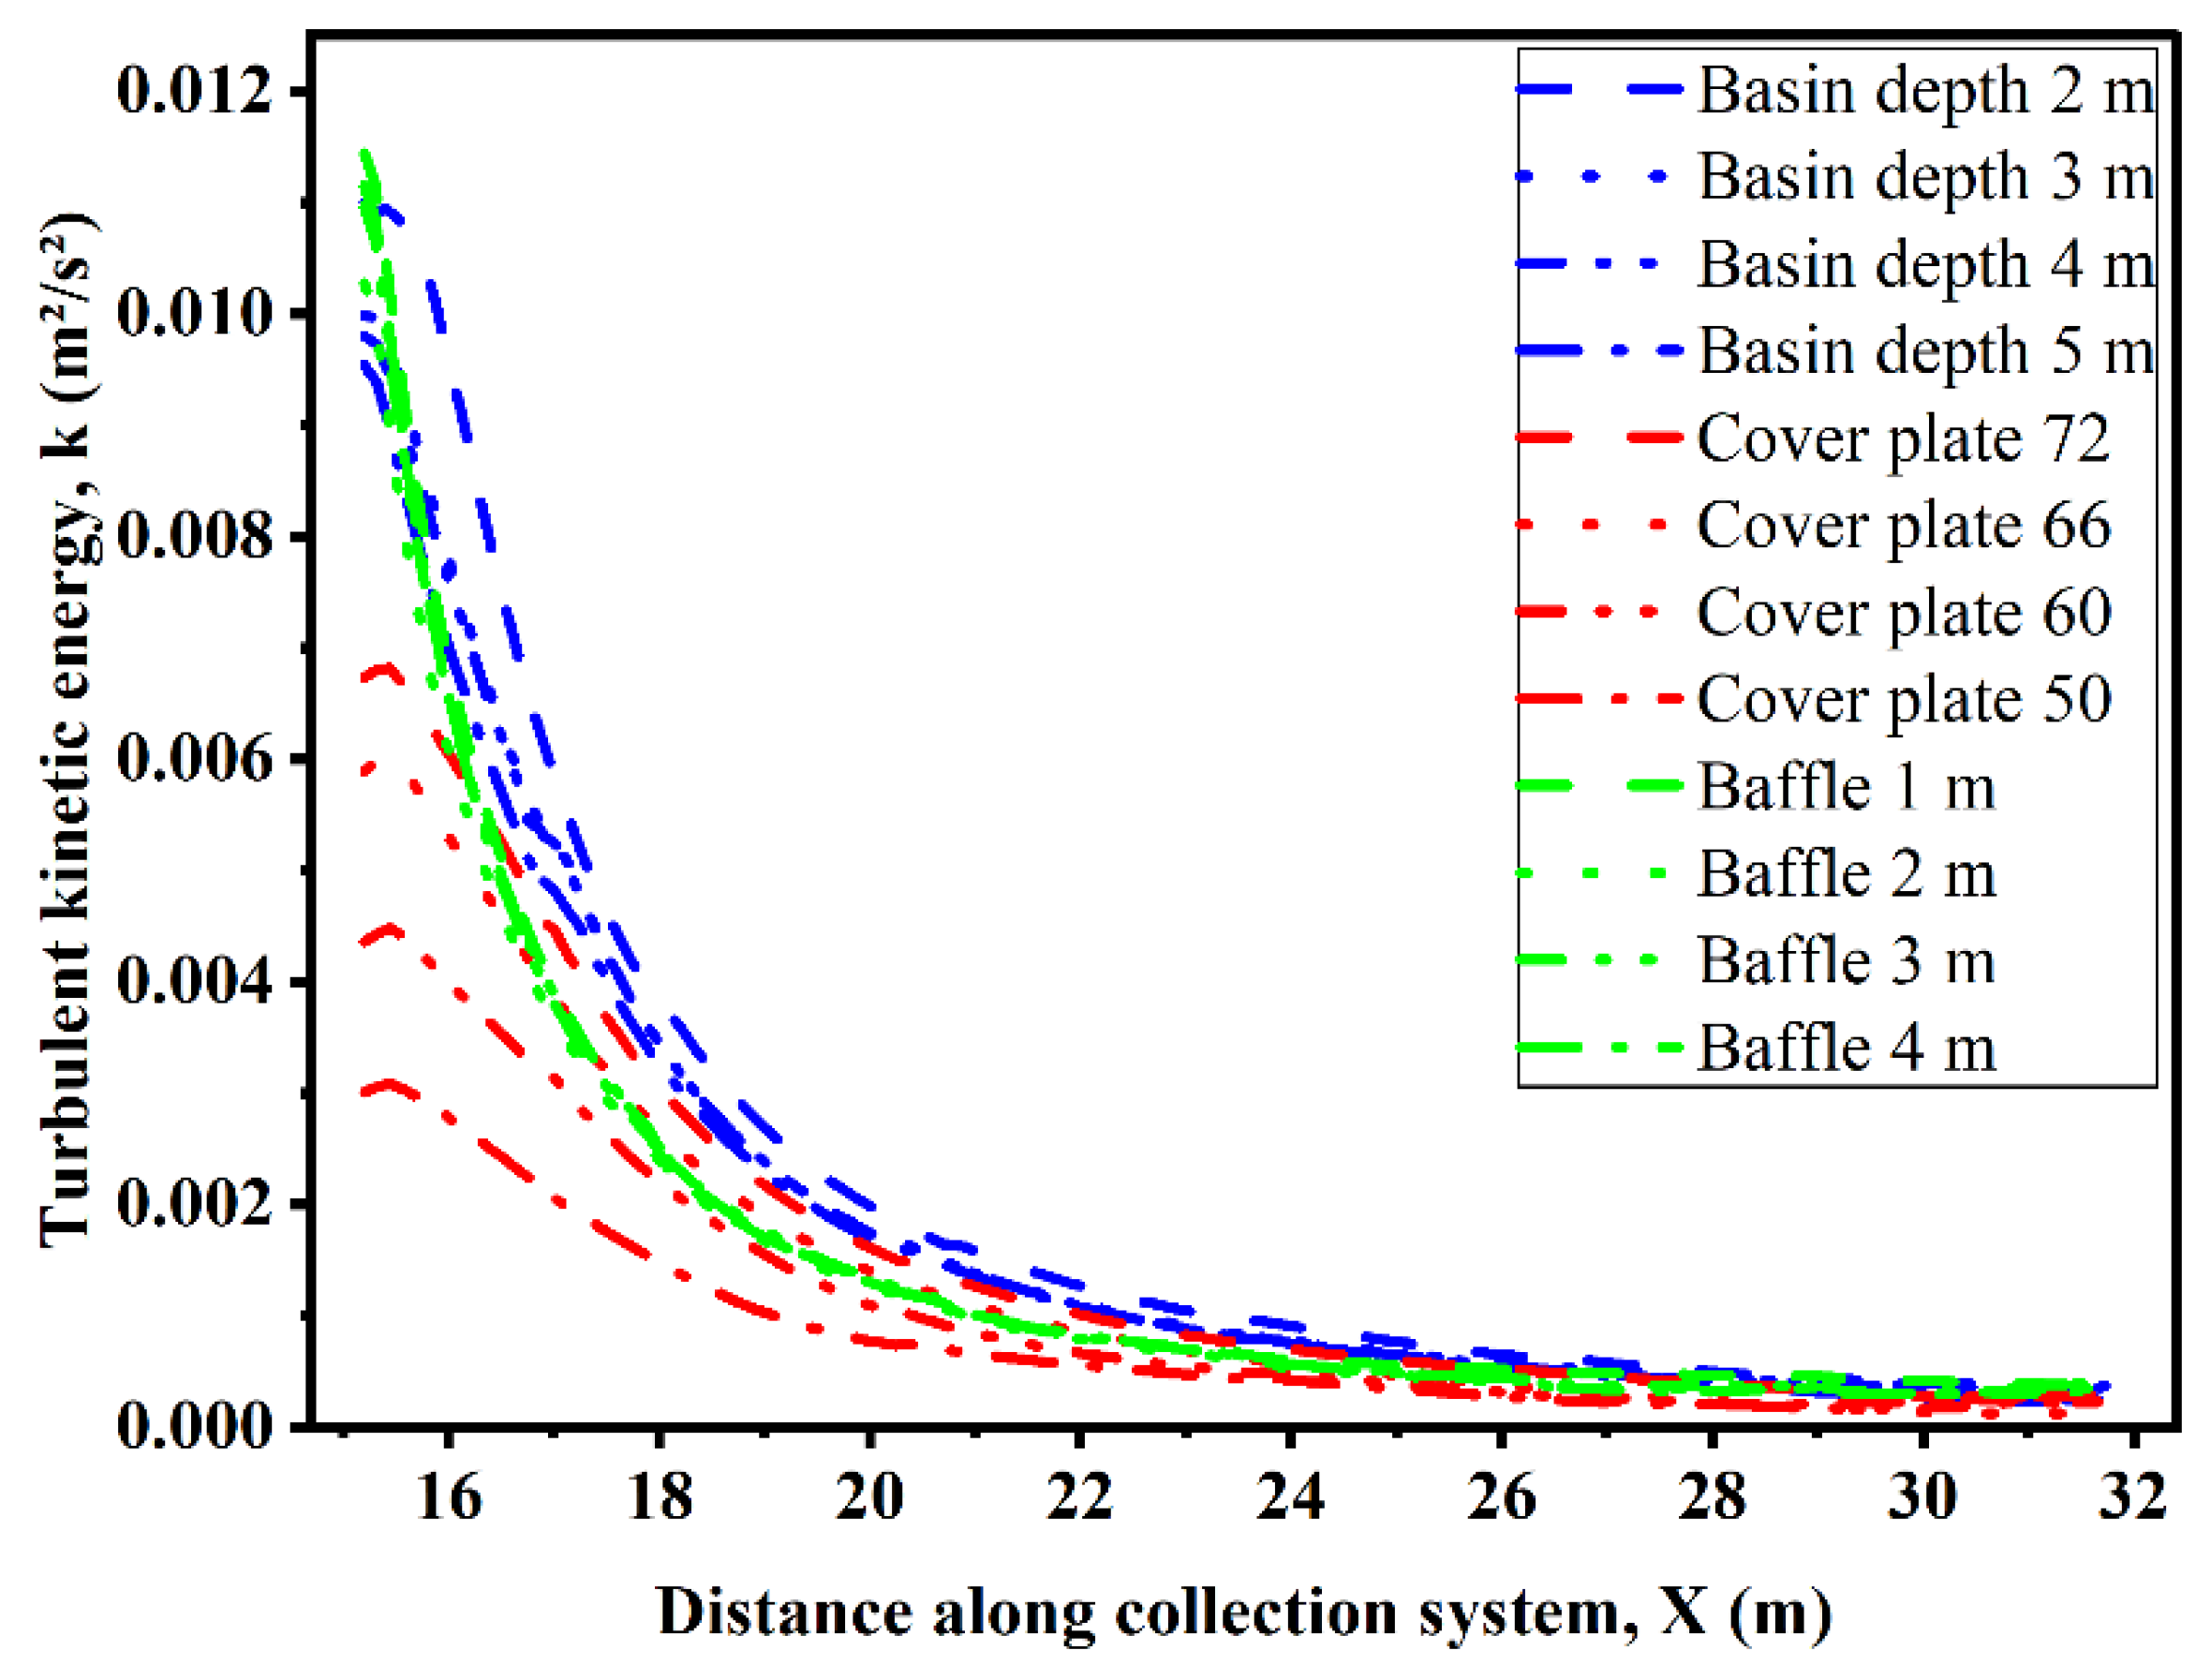
The streamwise turbulent kinetic energy extracted along the centreline of the fish bucket and the residence pool (X = 15–32 m) is shown in Figure 10. For all three configurations, the TKE drops sharply in the fish bucket after the flow passes the fish grid and then levels off at a low, nearly constant value in the residence pool. In the depth series, the mean TKE decreases with increasing basin depth: it differs by about 27% between the 2 m and 5 m cases, and the difference between 3 m and 4 m is very small (about 2%). In the cover-plate series the mean TKE decreases continuously as the permeability decreases, the difference between 72% and 50% being about 87% and the smallest difference between adjacent cases about 17%, and the high-TKE region is confined to the stilling basin. The baffle series has the smallest effect on the mean TKE, the difference between the various heights being only about 6.6%. Overall, the 50% permeability cover plate gives the lowest mean TKE in the collection zone and confines the turbulence generated during energy dissipation to the stilling basin most effectively.
Figure 10.
Streamwise turbulent kinetic energy along the centreline of the fish bucket and the residence pool (X = 15–32 m) for the 12 cases of the three series.
3.2. Comparison of the Three Energy-Dissipation Configurations
Considering both the flow uniformity on the X = 14 m section and the streamwise TKE in the collection zone, the 3 m deep basin fitted with a 50% permeability cover plate performs best (Figure 11): it has the lowest CV (0.12, compared with 0.23 for the 5 m deep basin and 0.20 for the 2 m baffle) and the lowest maximum TKE (about 0.003 m2/s2, compared with about 0.009 and 0.010 m2/s2, respectively), and the velocities in the fish bucket and the residence pool do not exceed the respective control values (0.3–0.4 m/s downstream of the fish grid and 0.3–0.6 m/s in the residence pool) for any of the three schemes. The cover-plate scheme requires a basin depth of only 3 m instead of 5 m, i.e., 2 m less excavation than the 5 m deep reference scheme, while achieving better hydraulic performance. With regard to the flow mechanism, the cover plate suppresses the vertical component of the replenishment jet and reduces the transverse deflection caused by the replenishment pipes; the baffle mainly guides the flow, and a deeper stilling basin mainly reduces the vertical velocity gradient. Considering both hydraulic performance and excavation volume, the 3 m deep basin fitted with a 50% permeability cover plate is recommended as the energy-dissipation scheme for the high-dam fish-lift collection system.
Figure 11.
Comparative summary of the three energy-dissipation configurations (basin depth 5 m, cover plate 50%, baffle 2 m): (a) Coefficient of variation of velocity (CV) on the control section upstream of the fish grid (X = 14 m); (b) maximum turbulent kinetic energy (TKE) in the fish bucket and the residence pool.
3.3. Velocity Distribution on Horizontal Planes
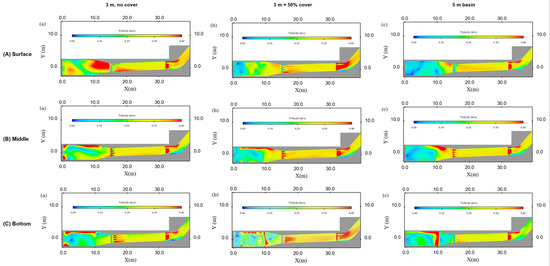
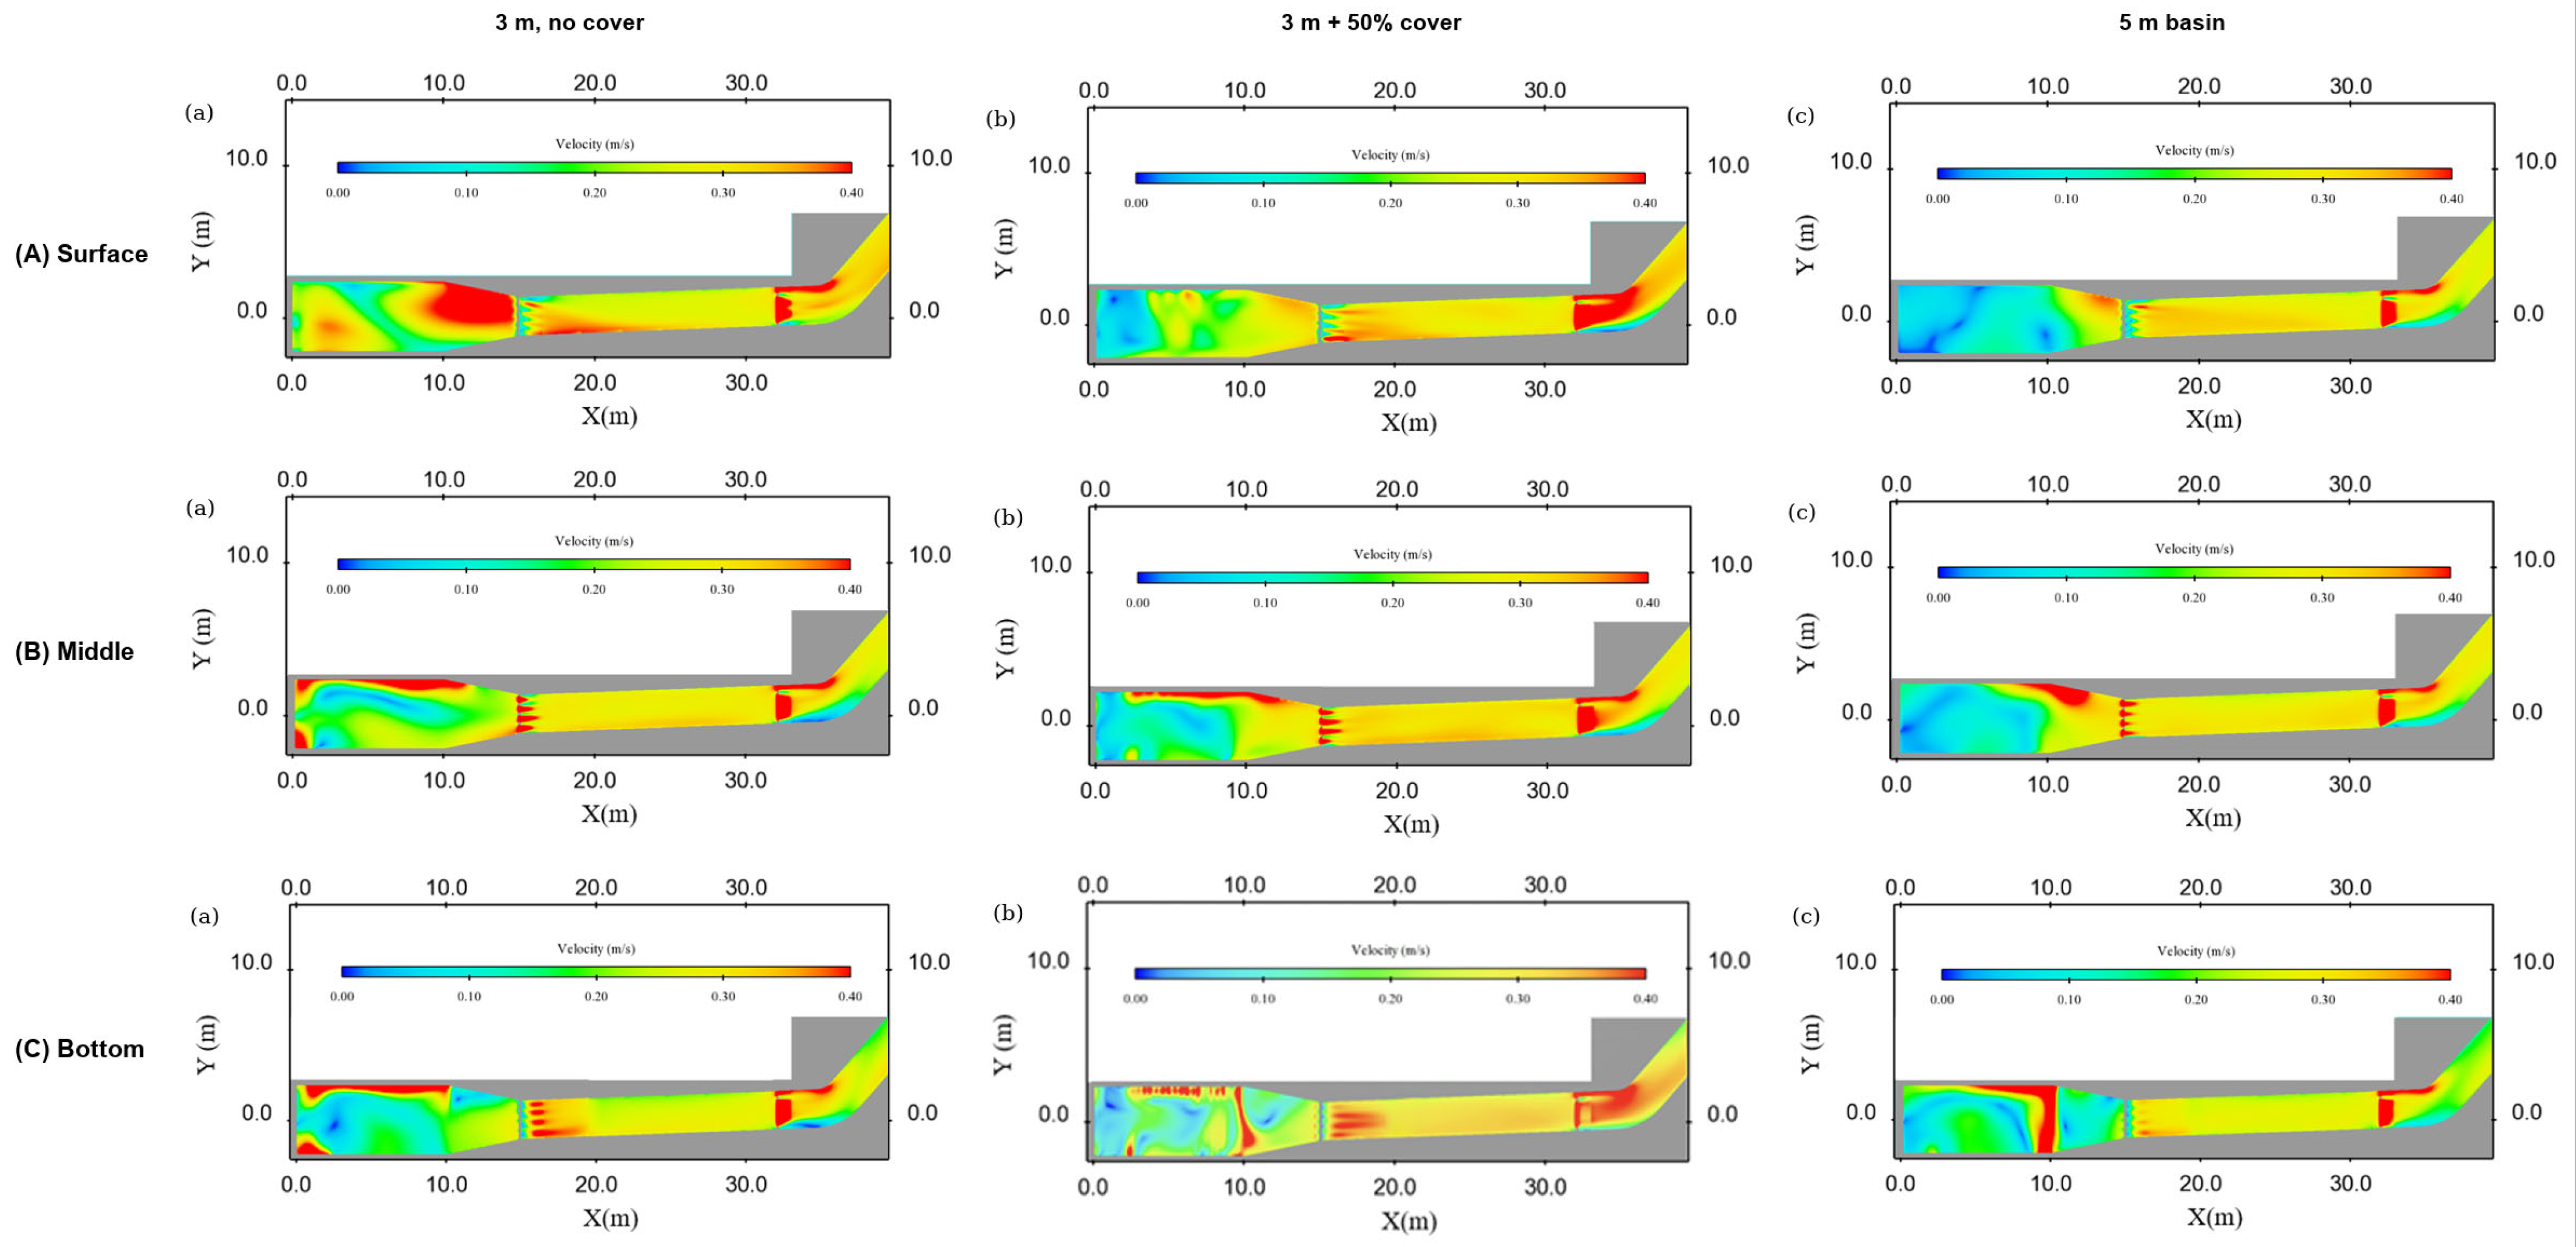
The spatial distribution of velocity was further examined on the surface, middle, and bottom horizontal planes of the recommended scheme and its comparison cases (Figure 12). In the 3 m reference case without a cover plate, there is a pronounced high-velocity region in the stilling basin and in front of the fish grid, and the velocity in the fish bucket and the residence pool differs considerably in the transverse direction; in the 5 m deep basin, the high-velocity region contracts and the velocity distribution in the fish bucket and the residence pool becomes more uniform, but 2 m of additional excavation is required; in the 3 m deep basin fitted with the 50% permeability cover plate, the high-velocity region is confined to the stilling basin, and the velocities on all three horizontal planes of the fish bucket and the residence pool are low and uniformly distributed, forming a continuous low-velocity zone from the fish entrance to the residence pool. The velocities on the horizontal planes of the fish bucket and the residence pool do not exceed the corresponding design limits (0.3–0.4 m/s downstream of the fish grid and 0.3–0.6 m/s in the residence pool) in any of the three cases, and the cover-plate scheme has the largest coverage of suitable velocities and the most complete continuous low-velocity corridor without deepening the basin.
Figure 12.
Velocity distribution on the horizontal planes of the collection system: (A) surface layer; (B) middle layer; (C) bottom layer. Within each layer, (a), (b), and (c) correspond to the 3 m basin without a cover plate, the 3 m basin with a 50% permeability cover plate, and the 5 m deep basin, respectively.
4. Discussion
The hydraulic conditions in the collection zone of the recommended scheme (a 3 m deep stilling basin with a 50% permeability cover plate) agree with the preferred ranges reported for fish: the maximum TKE in the fish bucket and the residence pool (about 0.003 m2/s2) is lower than the preference threshold for Iberian barbel observed by Silva et al. [16] in a pool-type fishway (K < 0.05 m2/s2), and the velocity range on the X = 14 m section (0.11–0.32 m/s) is consistent with the preferred velocity range for cyprinids (0.20–0.40 m/s) reported by Silva et al. [27]. This result is in line with the understanding obtained from studies of stilling-basin geometry, namely that the basin geometry is the controlling factor for velocity decay [26]; however, the present results further show that a permeable cover plate on the basin top improves both flow uniformity and turbulence more effectively than simply deepening the basin and requires a smaller excavation depth.
CV describes the uniformity of the velocity distribution, whereas fish respond to the magnitude of the local velocities [16]. Clause 4.2.4 of the Chinese Design Code for Fish Lift of Hydropower Projects (NB/T 10863—2021) [29] requires that the velocity at any location shall not exceed the burst swimming speed of the weakest target species, that the mean velocity in the collection channel shall exceed the maximum detectable velocity of the target species and remain below the onset of anaerobic swimming, and that velocities should preferably correspond to sustained swimming. A lower CV therefore means that the section upstream of the fish grid contains fewer local peaks that approach or exceed the burst speed of the weaker swimmers and fewer patches below the detectable range, so that more of the section lies within the band in which the target species can hold position and continue upstream.
As far as the energy-dissipation approach is concerned, existing practice for fish-passage facilities falls broadly into two routes. One is to place geometrically abrupt structures in the pool to reduce velocity through jet diffusion and shear dissipation, as in the vertical slots and guide vanes of vertical-slot fishways [20,21], the shape optimisation of H-type and multi-slot fishways [19,23], the turbulence-structure adjustment of combined vertical-slot and bottom-orifice fishways [24], and the pressure-gradient control of steep-pass fishways [22]; such studies mostly evaluate the deceleration effect through the velocity and turbulent kinetic energy distributions in the pool, and the dissipating structures form part of the pool geometry. The other route is basin-type dissipation, in which studies address the control of velocity decay by parameters such as basin length and end-sill height [26], at the cost of a basin whose size increases with the dissipation requirement. In a pipeline-replenished fish lift, the jet energy is concentrated, and a dissipating facility is required to reduce the inflow energy [10,12], while an increase in basin depth directly increases the excavation volume at the dam abutment. Compared with the two routes above, the permeable cover plate used here does not change the basin dimensions but adds an adjustable-resistance boundary at the basin top: the plate restricts the vertical component of the jet and confines the high-TKE region within the stilling basin, so that a 3 m deep basin achieves a more uniform velocity distribution upstream of the fish grid and a lower TKE in the collection zone than the 5 m deep basin. In terms of mechanism, this is consistent with the idea of reshaping the flow field by local resistance in pool baffles and vertical slots [20,21,24]; the difference is that the object of action is transferred from the pool of the fish passage to the stilling basin of the replenishment flow, and no space in the fish passage is occupied.
The magnitude of this boundary resistance is governed by the permeability of the plate: as the permeability decreases, the same replenishment discharge must pass through a smaller open area so that the local velocity and the shear dissipation at the apertures increase and the concentrated jet is converted into a distributed, low-momentum outflow that is retained longer beneath the plate; at the same time, the plate suppresses the vertical component of the jet and the transverse deflection produced by the replenishment pipes. A further reduction in the permeability, however, would raise the head loss across the plate and the backwater beneath it and could eventually reduce the effective replenishment flow entering the collection system. Over the tested range of 72% to 50%, the velocity distribution becomes more uniform and the TKE in the collection zone decreases monotonically as the permeability is reduced, with the best performance at the lowest tested permeability (50%). From the point of view of fish passage requirements, the hydraulic conditions in the different parts of the collection system must simultaneously satisfy two requirements: low velocity and low turbulence in the holding zone and a detectable attraction flow at the fish entrance [10,18]. Turbulence increases the energetic cost of station holding and upstream migration [13], and fish actively avoid high-velocity and highly turbulent regions [14,16,27]; for the target species of this study (mainly cyprinids such as grass carp, black carp, silver carp, bighead carp, and bream, and lampreys such as the Japanese lamprey), cyprinids avoid high-turbulence regions [16,27], and the passage performance of lampreys depends on the turbulence context [37], so that low-turbulence conditions are favourable for the retention of both groups. It should be noted that low turbulence favours stable holding but that the relationship between turbulence intensity and passage efficiency is not simply monotonic. With regard to velocity, the velocity must lie between the perceptible velocity and the burst swimming speed of the target species to form a continuous upstream route [10]: the attraction velocity at the fish entrance is maintained at 0.7–1.41 m/s [25], the velocities in the fish bucket and the residence pool (0.03–0.44 m/s) are below the burst swimming speed, and the velocity decreases continuously from the fish entrance to the holding zone so that improving the holding zone does not weaken the attraction conditions at the entrance.
From an engineering point of view, compared with the 5 m deep reference scheme, the 3 m deep basin with the 50% permeability cover plate reduces the basin depth by 2 m while achieving a lower CV and a lower maximum TKE, which shows that the cover plate does not reduce the hydraulic performance in exchange for less excavation. For a stilling basin at the abutment of a high dam, a 2 m reduction in depth means a corresponding reduction in the excavation volume, cost, and construction time, and less disturbance to the abutment terrain; the cover plate, made of perforated reinforced concrete or steel plate, is structurally simple, has no moving parts, requires little maintenance, and has an adjustable permeability, and is therefore a low-risk, easily implemented, and easily reversible environmentally friendly measure. In addition to the permeable cover plate examined here, wall corrugation is another resistance-based measure established in practice: corrugated circular culverts and corrugated pipes are used as fish-passage structures, in which the corrugation elements dissipate flow energy along the conduit and provide near-wall low-velocity zones that facilitate fish movement. The mechanism is related to that of the permeable cover plate examined here: both dissipate energy through resistance elements at the flow boundary and create low-velocity zones next to it. They differ in the extent over which the resistance is introduced: in a corrugated pipe, it acts continuously along the entire wall and directly shapes the velocity profile and turbulence structure of the conduit flow [38,39], whereas in the present cover plate, it is concentrated in a single layer at the top of the stilling basin in order to dissipate the concentrated inflow jet.
For an existing deep stilling basin, the permeable cover plate can also be installed as a retrofit to improve the flow pattern without changing the basin structure. Overall, the permeable cover plate provides an excavation-saving energy-dissipation scheme for fish-lift collection systems that also meets the hydraulic requirements of fish and can serve as a reference for the design of similar projects. Several limitations should be noted. First, the CFD analysis is based on a single operating condition (single-unit half generation, water depth 4.6 m), and the other three design water depths were covered only by the physical model; extending the numerical comparison to those conditions is left for future work. Second, the turbulence is closed with a Reynolds-averaged Navier–Stokes (RANS) model, which cannot resolve the unsteady vortical structure of the flow, so that the TKE used here as a proxy for turbulence intensity should be interpreted with caution. Third, the fish grid is represented as a porous baffle rather than as explicitly modelled bars, so that the computed velocities are slightly lower than the measured ones; as the same approximation was used in all cases, it does not affect the comparison between configurations. Fourth, the biological efficacy of the recommended scheme has not been tested with fish and remains to be verified by fish-behaviour experiments or monitoring of the actual passage.
5. Conclusions
A three-dimensional CFD model, validated against a 1:5.33 physical model of the fish lift, was used to compare the effects of the stilling-basin depth, the cover-plate permeability and the baffle height on the hydraulic performance of the collection system under identical inflow conditions. The main conclusions are as follows.
- Increasing the stilling-basin depth from 2 to 5 m monotonically improves the velocity uniformity on the section upstream of the fish grid and reduces the streamwise TKE in the fish bucket and the residence pool, improving the conditions for fish to hold position and migrate upstream; however, the difference between 3 and 4 m is small, and the further improvement of the TKE becomes marginal once the depth exceeds 4 m.
- The permeable cover plate at the basin top is the most effective of the three measures: reducing the permeability from 72% to 50% markedly improves the uniformity of the approach flow and reduces the turbulence in the collection zone, confining the high-turbulence region to the stilling basin and providing low-velocity, low-turbulence conditions favourable for fish in the fish bucket and the residence pool. Unlike a deeper basin, the cover plate does not increase the excavation.
- The effect of the baffle height is non-monotonic and requires tuning: among the heights tested, a baffle of about 2 m gives the most uniform approach flow, whereas taller baffles deflect the flow and generate a new high-velocity region; the baffle is also less effective than the cover plate in controlling the turbulence in the collection zone.
- Among the three measures, the 3 m deep basin fitted with a 50% permeability cover plate is recommended: compared with the conventional 5 m deep basin, it gives a more uniform velocity distribution and lower turbulence in the collection zone while requiring 2 m less excavation. For high-head projects where excavation at the dam abutment is constrained, this offers a design route in which an adjustable-resistance boundary at the basin top substitutes for part of the basin depth.
The main limitations of this study are the restriction to a single operating condition, the use of a RANS closure that cannot resolve the unsteady vortical structure of the flow, and the porous-baffle representation of the fish grid. Extending the computations to the other design water depths, resolving the fish-grid bars explicitly, and verifying the recommended configuration with fish-behaviour experiments are the natural next steps.
Author Contributions
Conceptualisation, J.H. and X.W.; methodology, X.S. and G.L.; software, X.S. and J.L.; validation, X.S.; formal analysis, X.S.; investigation, G.L. and J.L.; resources, X.W.; data curation, X.S.; writing—original draft preparation, X.S.; writing—review and editing, J.H. and X.W.; visualisation, X.S.; supervision, X.W.; project administration, X.W.; funding acquisition, X.W. All authors have read and agreed to the published version of the manuscript.
Funding
This research was funded by the China Renewable Energy Engineering Institute through the project “Research on Mechanisms for Promoting Environmental Sustainability and Innovative Practices in the Hydropower Industry” (project number ZX-KJHB-2024000) and by the Science and Technology Program from Water Resources of Zhejiang Province (grant number RC2544).
Data Availability Statement
The data presented in this study are available on request from the corresponding author. The original CFD case files are not publicly available due to the confidentiality requirements of the hydropower project.
Conflicts of Interest
Author Guoping Liu was employed by the Shenzhen Water Planning and Design Institute Co., Ltd. The remaining authors declare that the research was conducted in the absence of any commercial or financial relationships that could be construed as a potential conflict of interest.
References
- Grill, G.; Lehner, B.; Thieme, M.; Geenen, B.; Tickner, D.; Antonelli, F.; Babu, S.; Borrelli, P.; Cheng, L.; Crochetiere, H.; et al. Mapping the world’s free-flowing rivers. Nature 2019, 569, 215–221. [Google Scholar] [CrossRef] [Scilit] [PubMed]
- Zarfl, C.; Berlekamp, J.; He, F.; Jähnig, S.C.; Darwall, W.; Tockner, K. Future large hydropower dams impact global freshwater megafauna. Sci. Rep. 2019, 9, 18531. [Google Scholar] [CrossRef] [Scilit] [PubMed]
- Liermann, C.R.; Nilsson, C.; Robertson, J.; Ng, R.Y. Implications of dam obstruction for global freshwater fish diversity. BioScience 2012, 62, 539–548. [Google Scholar] [CrossRef] [Scilit]
- Winemiller, K.O.; McIntyre, P.B.; Castello, L.; Fluet-Chouinard, E.; Giarrizzo, T.; Nam, S.; Baird, I.G.; Darwall, W.; Lujan, N.K.; Harrison, I.; et al. Balancing hydropower and biodiversity in the Amazon, Congo, and Mekong. Science 2016, 351, 128–129. [Google Scholar] [CrossRef] [Scilit] [PubMed]
- Branco, P.; Segurado, P.; Santos, J.M.; Pinheiro, P.; Ferreira, M.T. Does longitudinal connectivity loss affect the distribution of freshwater fish? Ecol. Eng. 2012, 48, 70–78. [Google Scholar] [CrossRef] [Scilit]
- Sánchez-Pérez, A.; Torralva, M.; Zamora-Marín, J.M.; Bravo-Córdoba, F.J.; Sanz-Ronda, F.J.; Oliva-Paterna, F.J. Multispecies fishways in a Mediterranean river: Contributions as migration corridors and compensatory habitat for fish. Sci. Total Environ. 2022, 830, 154613. [Google Scholar] [CrossRef] [Scilit] [PubMed]
- Song, C.; Fan, C.; Zhu, J.; Wang, J.; Sheng, Y.; Liu, K.; Chen, T.; Zhan, P.; Luo, S.; Yuan, C.; et al. A comprehensive geospatial database of nearly 100 000 reservoirs in China. Earth Syst. Sci. Data 2022, 14, 4017–4034. [Google Scholar] [CrossRef] [Scilit]
- Katopodis, C.; Williams, J.G. The development of fish passage research in a historical context. Ecol. Eng. 2012, 48, 8–18. [Google Scholar] [CrossRef] [Scilit]
- Shi, X.; Kynard, B.; Liu, D.; Qiao, Y.; Chen, Q. Development of fish passage in China. Fisheries 2015, 40, 161–169. [Google Scholar] [CrossRef] [Scilit]
- Cai, L.; Katopodis, C.; Johnson, D.; Zhang, P.; Zhao, P. Case study: Targeting species and applying swimming performance data to fish lift design for the Huangdeng Dam on the upper Mekong River. Ecol. Eng. 2018, 122, 32–38. [Google Scholar] [CrossRef] [Scilit]
- Peirson, W.; Harris, J.; Kingsford, R.; Mao, X.; Felder, S. Piping fish over dams. J. Hydro-Environ. Res. 2021, 39, 71–80. [Google Scholar] [CrossRef] [Scilit]
- Travade, F.; Larinier, M. Fish locks and fish lifts. Bull. Fr. Pêch. Piscic. 2002, 364, 102–118. [Google Scholar] [CrossRef] [Scilit]
- Enders, E.C.; Boisclair, D.; Roy, A.G. The effect of turbulence on the cost of swimming for juvenile Atlantic salmon (Salmo salar). Can. J. Fish. Aquat. Sci. 2003, 60, 1149–1160. [Google Scholar] [CrossRef] [Scilit]
- Ouyang, L.; Li, D.; Cui, S.; Wu, X.; Liu, Y.; Han, X.; Zhou, S.; Xu, G.; Tu, X.; Chen, K.; et al. Fish swimming behavior and strategies under different hydrodynamic conditions in fishways with various vertical slot configurations. Fishes 2025, 10, 415. [Google Scholar] [CrossRef] [Scilit]
- Liao, J.C. A review of fish swimming mechanics and behaviour in altered flows. Philos. Trans. R. Soc. B Biol. Sci. 2007, 362, 1973–1993. [Google Scholar] [CrossRef] [Scilit] [PubMed]
- Silva, A.T.; Santos, J.M.; Ferreira, M.T.; Pinheiro, A.N.; Katopodis, C. Effects of water velocity and turbulence on the behaviour of Iberian barbel (Luciobarbus bocagei, Steindachner 1864) in an experimental pool-type fishway. River Res. Appl. 2011, 27, 360–373. [Google Scholar] [CrossRef] [Scilit]
- Khan, L.A. A three-dimensional computational fluid dynamics (CFD) model analysis of free surface hydrodynamics and fish passage energetics in a vertical-slot fishway. N. Am. J. Fish. Manag. 2006, 26, 255–267. [Google Scholar] [CrossRef] [Scilit]
- Lacey, R.W.J.; Neary, V.S.; Liao, J.C.; Enders, E.C.; Tritico, H.M. The IPOS framework: Linking fish swimming performance in altered flows from laboratory experiments to Rivers. River Res. Appl. 2012, 28, 429–443. [Google Scholar] [CrossRef] [Scilit]
- Zhang, D.; Ren, T.; Liang, D.; Liu, Y. Hydrodynamic optimization of bilateral-symmetric multi-slot fishway using computational fluid dynamics. J. Hydraul. Res. 2025, 63, 188–203. [Google Scholar] [CrossRef] [Scilit]
- Wu, S.; Rajaratnam, N.; Katopodis, C. Structure of flow in vertical slot fishway. J. Hydraul. Eng. 1999, 125, 351–360. [Google Scholar] [CrossRef] [Scilit]
- An, R.; Li, J.; Liang, R.; Tuo, Y. Three-dimensional simulation and experimental study for optimising a vertical slot fishway. J. Hydro-Environ. Res. 2016, 12, 119–129. [Google Scholar] [CrossRef] [Scilit]
- Plymesser, K.; Cahoon, J. Pressure gradients in a steeppass fishway using a computational fluid dynamics model. Ecol. Eng. 2017, 108, 277–283. [Google Scholar] [CrossRef] [Scilit]
- Zhang, D.; Liu, C.; Shi, X.; Liu, Y.; Qu, Y. A novel H-shape fishway with excellent hydraulic characteristics. J. Hydrol. Hydromech. 2023, 71, 64–79. [Google Scholar] [CrossRef] [Scilit]
- Shen, C.; Chen, Y.; Shi, X.; Wang, M.; He, S. Turbulent structural analysis of the combined fishway with vertical seam and bottom hole. River Res. Appl. 2024, 40, 425–435. [Google Scholar] [CrossRef] [Scilit]
- Liu, Z.; Zheng, F.; Wang, X. Optimization measures of flow conditions at the fish entrance of the fish lift in the Fengman Hydropower Station rehabilitation project. Water Resour. Hydropower Eng. 2017, 48, 106–112. (In Chinese) [Google Scholar]
- Riyanto, D.P.; Hakim, F.F.; Arisanto, P. The influence of stilling basin length on velocity changes using computational fluid dynamics analysis. IOP Conf. Ser. Earth Environ. Sci. 2024, 1303, 012023. [Google Scholar] [CrossRef] [Scilit]
- Silva, A.T.; Katopodis, C.; Santos, J.M.; Ferreira, M.T.; Pinheiro, A.N. Cyprinid swimming behaviour in response to turbulent flow. Ecol. Eng. 2012, 44, 314–328. [Google Scholar] [CrossRef] [Scilit]
- Almawla, A.S.; Lateef, A.M.; Kamel, A.H. Water flow simulation with computational fluid dynamics (CFD): A review study. Int. Rev. Civ. Eng. 2022, 13, 40–52. [Google Scholar] [CrossRef] [Scilit]
- NB/T 10863-2021; Design Code for Fish Lift of Hydropower Projects. National Energy Administration of China: Beijing, China, 2021.
- Cao, C.; Fan, Z.; Wang, Y.; Liu, X.; Shi, H.; Yang, Y. Effects of continuous exposure to total dissolved gas supersaturation on swimming ability and recovery in grass carp (Ctenopharyngodon idella). Ecol. Freshw. Fish 2022, 31, 401–409. [Google Scholar] [CrossRef] [Scilit]
- Hoover, J.J.; Zielinski, D.P.; Sorensen, P.W. Swimming performance of adult bighead carp Hypophthalmichthys nobilis (Richardson, 1845) and silver carp H. molitrix (Valenciennes, 1844). J. Appl. Ichthyol. 2017, 33, 54–62. [Google Scholar] [CrossRef] [Scilit]
- Mesa, M.G.; Bayer, J.M.; Seelye, J.G. Swimming performance and physiological responses to exhaustive exercise in radio-tagged and untagged Pacific lampreys. Trans. Am. Fish. Soc. 2003, 132, 483–492. [Google Scholar] [CrossRef] [Scilit]
- Goring, D.G.; Nikora, V.I. Despiking acoustic Doppler velocimeter data. J. Hydraul. Eng. 2002, 128, 117–126. [Google Scholar] [CrossRef] [Scilit]
- Cotel, A.J.; Webb, P.W.; Tritico, H. Do brown trout choose locations with reduced turbulence? Trans. Am. Fish. Soc. 2006, 135, 610–619. [Google Scholar] [CrossRef] [Scilit]
- Tritico, H.M.; Cotel, A.J. The effects of turbulent eddies on the stability and critical swimming speed of creek chub (Semotilus atromaculatus). J. Exp. Biol. 2010, 213, 2284–2293. [Google Scholar] [CrossRef] [Scilit] [PubMed]
- Zhang, Y.; Han, L.; Chen, L.; Wang, C.; Chen, B.; Jiang, A. Study on the 3D hydrodynamic characteristics and velocity uniformity of a gravity flow circular flume. Water 2021, 13, 927. [Google Scholar] [CrossRef] [Scilit]
- Kirk, M.A.; Caudill, C.C.; Syms, J.C.; Tonina, D. Context-dependent responses to turbulence for an anguilliform swimming fish, Pacific lamprey, during passage of an experimental vertical-slot weir. Ecol. Eng. 2017, 106, 296–307. [Google Scholar] [CrossRef] [Scilit]
- Calomino, F.; Tafarojnoruz, A.; De Marchis, M.; Gaudio, R.; Napoli, E. Experimental and Numerical Study on the Flow Field and Friction Factor in a Pressurized Corrugated Pipe. J. Hydraul. Eng. 2015, 141, 04015027. [Google Scholar] [CrossRef] [Scilit]
- Calomino, F.; Alfonsi, G.; Gaudio, R.; D’Ippolito, A.; Lauria, A.; Tafarojnoruz, A. Experimental and Numerical Study of Free-Surface Flows in a Corrugated Pipe. Water 2018, 10, 638. [Google Scholar] [CrossRef] [Scilit]

Disclaimer/Publisher’s Note: The statements, opinions and data contained in all publications are solely those of the individual author(s) and contributor(s) and not of MDPI and/or the editor(s). MDPI and/or the editor(s) disclaim responsibility for any injury to people or property resulting from any ideas, methods, instructions or products referred to in the content. |
© 2026 by the authors. Licensee MDPI, Basel, Switzerland. This article is an open access article distributed under the terms and conditions of the Creative Commons Attribution (CC BY) license.