


Abstract
Piano key weirs (PKWs) provide high discharge efficiency within a limited footprint, but the influence of inlet- and outlet-key shapes on their energy dissipation has received limited attention. This study investigates the effects of curved inlet- and outlet-key geometries on PKW energy dissipation using 102 free-flow experimental runs. Nine configurations are tested: a linear reference (M1) and C-shaped, inverted C-shaped, S-shaped, and inverted S-shaped modifications applied separately to the inlet and outlet keys. A FLOW-3D HYDRO model is validated against the measurements, reproducing the total head with R2 = 0.997 and RMSE = 0.0013 m and the relative energy loss within ±15% (MAPE = 6.70%), and is then used to evaluate a combined configuration (M10) with C-shaped inlet and outlet keys. Experimental results show that the relative energy loss decreases with increasing total head ratio, from approximately 71–74% at low heads to 46–52% at higher heads. At HT/P = 0.18, the C-shaped inlet (M4) and outlet (M5) increase the relative energy loss by 12.80% and 8.27%, respectively, relative to M1. Compared with the numerically simulated M1, M10 is predicted to increase the relative energy loss by 5.86%, 9.64%, and 14.61% at HT/P = 0.08, 0.12, and 0.18, respectively. A logarithmic relationship fitted to 11 numerical runs is provided for estimating the relative energy loss of M10 within HT/P = 0.075–0.266. The results show that PKW energy dissipation depends strongly on curvature shape, orientation, and key location.
1. Introduction
Hydraulic structures such as dams and spillways play a crucial role in flood control and water resources management. However, the high kinetic energy of released flows may cause severe downstream erosion and structural instability without adequate energy dissipation. Therefore, improving energy dissipation while maintaining high discharge capacity has become an important consideration in spillway design. To address these challenges, nonlinear weirs such as labyrinth weirs have been widely adopted because their folded crest provides a longer overflow length for a given channel width [1], with their discharge capacity depending strongly on geometric and hydraulic parameters [2]. As an advanced development of this concept, the piano key weir (PKW) was introduced as an innovative spillway configuration capable of significantly enhancing discharge efficiency while requiring a shorter base length than conventional labyrinth weirs. The folded crest geometry of PKWs generates complex three-dimensional flow patterns that strongly influence hydraulic behavior, discharge capacity, and downstream energy dissipation [3,4,5]. Numerous experimental and numerical studies have been conducted to examine the hydraulic behavior and energy dissipation of PKWs under various geometric and hydraulic conditions. Consequently, understanding the mechanisms governing energy dissipation in PKWs has become an important topic in hydraulic engineering research.
Several experimental studies examined the energy dissipation behavior of PKWs under different hydraulic conditions. Al-Shukur and Al-Khafaji [6] showed that the geometric configuration of a Type-B PKW significantly influenced energy dissipation, where increasing the B/P ratio enhanced the energy dissipation and affected the hydraulic jump formation distance. Experimental investigations by Eslinger and Crookston [7] and Singh and Kumar [8] further demonstrated that dissipation efficiency was generally higher under low-head conditions and decreased as discharge increased.
Geometric parameters play a crucial role in controlling the hydraulic performance and energy dissipation of PKWs. Among these parameters, the inlet-to-outlet key width ratio (Wi/Wo) is widely recognized as a key factor governing the admission area and internal flow contraction between inlet and outlet keys. Previous studies reported that the optimal range of Wi/Wo generally lies between about 1.25 and 1.6 depending on the weir geometry and flow conditions [1,4,5]. Several investigations also identified a ratio close to Wi/Wo ≈ 1.25 as providing favorable hydraulic performance [3,9,10].
In addition to width ratios, several studies examined the influence of geometric modifications on energy dissipation. Behroozi and Vaghefi [11] reported that modified zigzag crest geometries enhanced dissipation efficiency under low relative heads, with semi-circular zigzag crests producing the highest dissipation among the tested configurations. Similarly, Shen and Oertel [12] showed that crest geometry significantly influences PKW hydraulic behavior, where flat crests enhance energy dissipation while rounded crests improve discharge capacity. Singh and Kumar [13] further demonstrated that dissipation efficiency increased with the number of key cycles but decreased with increasing magnification and width ratios, confirming the strong influence of geometric configuration on the dissipation process. Iqbal and Ghani [14] also reported that energy dissipation decreased with increasing inlet-to-outlet key slope and width ratios in trapezoidal PKWs, while higher dissipation occurred under low-head conditions. Comparative studies further highlighted the influence of planform geometry, where Rdhaiwi et al. [15] reported lower energy loss in Type-B trapezoidal PKWs compared with Type-C configurations, whereas Sohrabzadeh Anzani et al. [16] showed that rectangular PKWs generally produced higher energy dissipation under various flow conditions, while triangular PKWs exhibited the lowest dissipation efficiency. Mirkhorli et al. [17] numerically compared PKWs with rectangular labyrinth weirs and reported that PKWs generally provided higher energy dissipation, while geometric parameters such as width ratio and stepped ramps inside the outlet key further enhanced the dissipation efficiency. For labyrinth weirs, Ghaderi et al. [18] combined experiments with FLOW-3D simulations and attributed most of the energy dissipation to nappe collision and the circulating flow behind the nappes, with the dissipation decreasing as the sidewall angle and weir height increase. Such geometric variations also influence the internal flow structure and downstream flow regime.
Several studies examined the flow characteristics governing energy dissipation in PKWs. Shen and Oertel [19] investigated the downstream flow regime of Type-A trapezoidal PKWs under free outflow conditions and reported highly turbulent downstream flow, while comparable residual energy was observed even for small-scale models with limited cycle numbers. Li et al. [20] further analyzed the dissipation mechanism using combined physical experiments and numerical simulations and reported that dissipation efficiency ranged between about 40% and 70%, where internal jet collision, flow mixing, and aeration within the outlet key contributed significantly to energy loss. Besser and Oertel [21] also showed that increasing tailwater depth weakened the three-dimensional flow regime and consequently reduced energy dissipation due to the decrease in effective drop height. Therefore, several studies explored downstream modifications to further enhance energy dissipation.
Several studies examined the influence of downstream modifications on the dissipation performance of PKWs. Naghibzadeh et al. [22] investigated PKWs equipped with stepped and baffled downstream barriers and reported that baffles significantly enhanced energy dissipation compared with stepped configurations and cases without barriers. Similar observations were reported by Farhadi et al. [23] and Abdi Chooplou et al. [24], where trapezoidal, arced, and rectangular PKWs equipped with downstream baffles showed improved dissipation performance with larger baffles and higher weir heights. Fathi et al. [25] investigated the influence of rigid vegetation downstream of a Type-B trapezoidal PKW and reported that increasing vegetation density enhanced energy loss, while higher weir heights further increased the dissipation rate.
Several numerical studies examined the hydraulic behavior and energy dissipation mechanisms of PKWs. Naghibzadeh et al. [22] applied FLOW-3D simulations to analyze energy dissipation and reported good agreement between numerical predictions and experimental observations. Behroozi and Vaghefi [11] combined FLOW-3D simulations with laboratory experiments to investigate flow patterns and hydraulic performance under modified crest geometries. Selim et al. [26] used FLOW-3D simulations to compare PKWs with trapezoidal labyrinth weirs and reported that increasing weir height enhanced dissipation, while larger sidewall angles in trapezoidal labyrinth weirs produced higher dissipation rates than PKWs. Eltarabily et al. [27] validated FLOW-3D simulations with experimental data and showed that different PKW types exhibited distinct hydraulic behavior, where Type-B provided higher discharge capacity at low heads, Type-A performed better at higher heads, and Type-C produced the highest dissipation rates.
Several studies developed predictive models to estimate energy dissipation in PKWs. Singh and Kumar [28,29] applied gene expression programming to predict residual energy and relative energy loss downstream of Type-A and Type-B PKWs using several non-dimensional parameters, and reported high prediction accuracy compared with existing empirical approaches.
Despite extensive research on PKWs, energy dissipation has received less attention than discharge characteristics. Previous studies have examined the effects of several geometric and hydraulic parameters on energy dissipation, including width ratio, crest shape, and downstream modifications; however, these investigations generally retained conventional linear inlet- and outlet-key geometries.
In a recent study, Shaheen et al. [30] investigated the same family of curved inlet- and outlet-key configurations in terms of discharge coefficient and crest-wise discharge distribution. Their results showed that the effect of curvature on discharge performance depends strongly on its shape, orientation, and location. In particular, the inverted C-shaped inlet improved discharge efficiency, whereas the C-shaped inlet reduced the discharge coefficient. However, that study did not quantify upstream-to-downstream energy dissipation. Thus, whether configurations that reduce discharge efficiency can simultaneously enhance energy dissipation, and whether combined inlet–outlet modification can further enhance energy dissipation, remain unresolved.
Accordingly, the main objective of this study is to investigate the effects of inlet- and outlet-key geometries on the energy dissipation of PKWs under different flow conditions, focusing on upstream-to-downstream energy loss rather than the discharge capacity examined in [30]. Experimental measurements from nine PKW configurations, including one reference model and eight configurations with individually modified inlet or outlet geometries, are analyzed. For this purpose, the FLOW-3D HYDRO model of [30] is re-developed with an extended computational domain that includes the energy measurement sections and is re-validated against the experimental measurements. Based on the experimental screening, the most effective inlet and outlet modifications are subsequently combined into a new configuration, which is evaluated numerically to investigate whether simultaneous modification of both key regions provides further improvement in energy dissipation.
2. Experimental Work
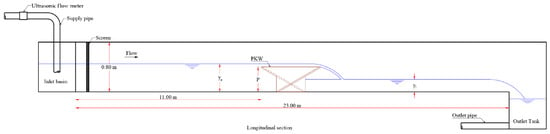
The experiments were carried out at the Hydraulics Research Institute, Delta Barrage, Egypt, in a horizontal, rectangular recirculating flume 23.0 m long, 0.75 m wide, and 0.80 m deep. Figure 1 shows the flume layout and the position of the PKW model.
Figure 1.
Longitudinal layout of the laboratory flume and position of the piano key weir (PKW) model (not to scale). The blue line indicates the water-surface profile. Adapted from [30].
Flow is supplied through a closed-loop system and regulated using a control valve. The total discharge Q is measured using an ultrasonic flow meter (Flexim, Berlin, Germany), with a manufacturer-specified velocity-measurement accuracy of ±0.01 m/s, while water-surface elevations are measured using a point gauge. Further details of the experimental facility and instrumentation are reported in Shaheen et al. [30].
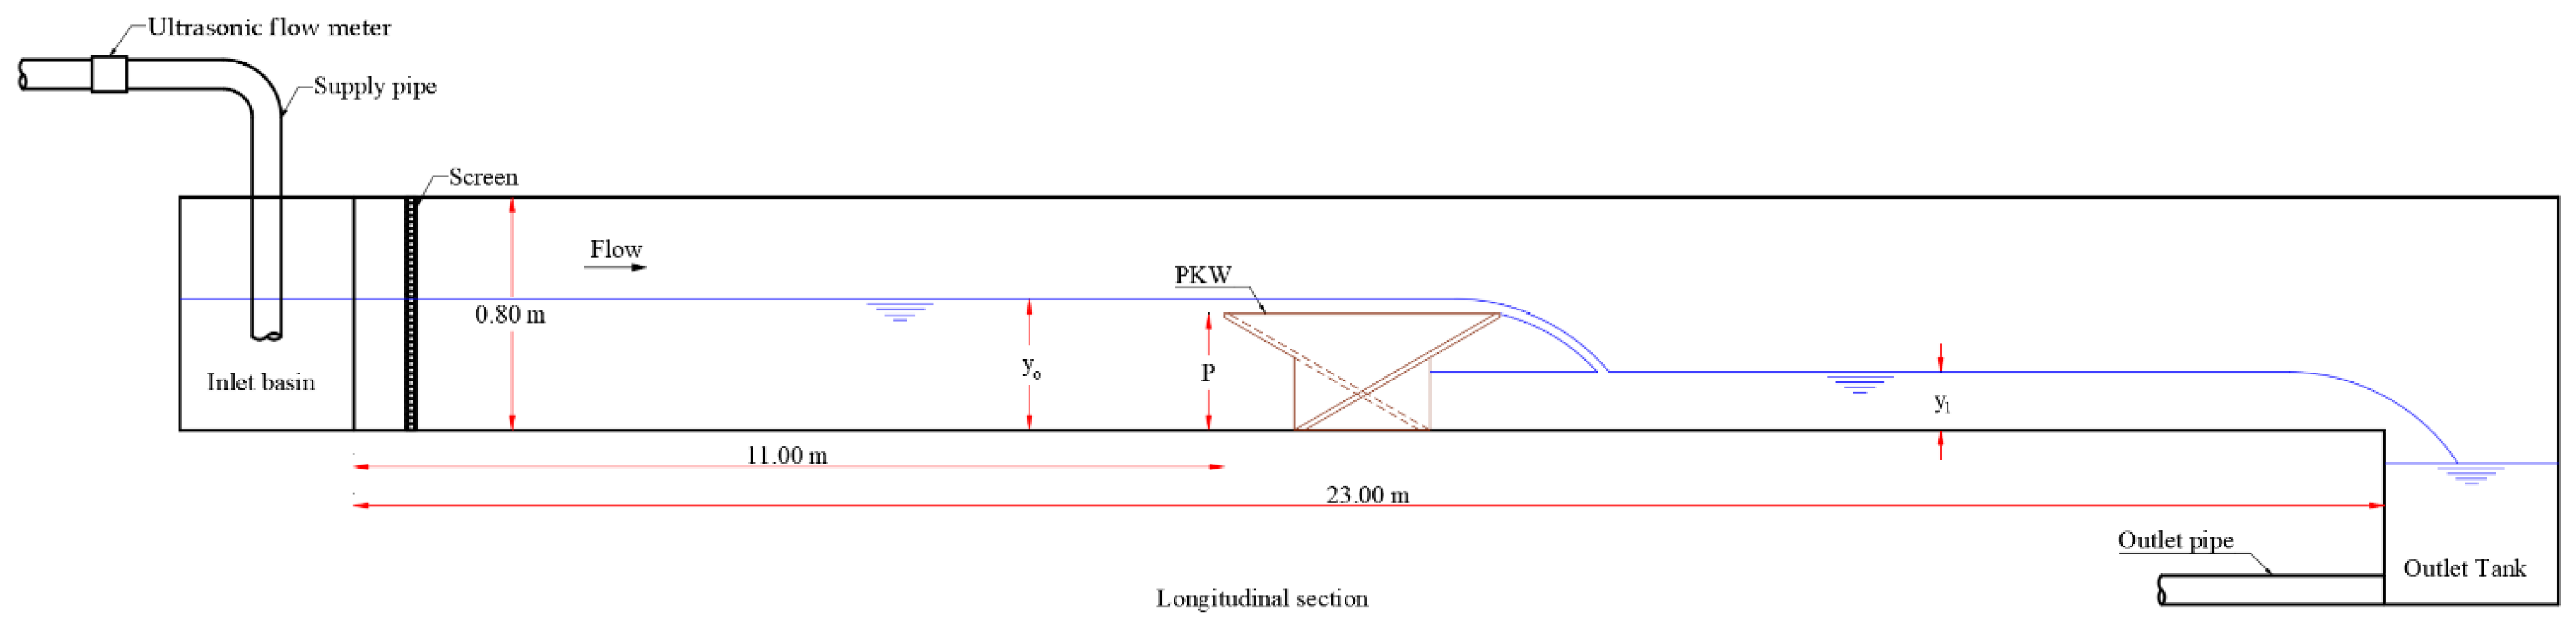
The present energy-dissipation analysis employs the same nine PKW configurations previously investigated by Shaheen et al. [30] for discharge coefficient and crest-wise discharge distribution. These configurations comprise one conventional reference model and eight curved inlet- or outlet-key modifications. As previously reported in that study, the models are fabricated from 18 mm thick wooden panels, sealed against leakage, and placed 11.0 m from the flume inlet. Each model comprises three full keys and two half-keys and shares the same overall geometric characteristics, so that the effect of inlet- and outlet-key geometry on energy dissipation can be examined independently. All models share the dimensions shown in Figure 2: weir length B = 0.952 m, base length Bb = 0.47 m, inlet and outlet overhangs Bi = Bo = 0.241 m, total width W = 0.75 m, inlet and outlet key widths Wi = 0.189 m and Wo = 0.15 m (Wi/Wo = 1.25), wall thickness Ts = 0.018 m, weir height P = 0.40 m, crest length L = 4.485 m, and key inclination α = 30°.
Figure 2.
Geometric parameters of the PKW.
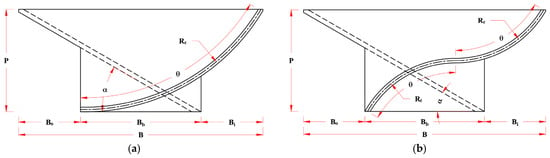
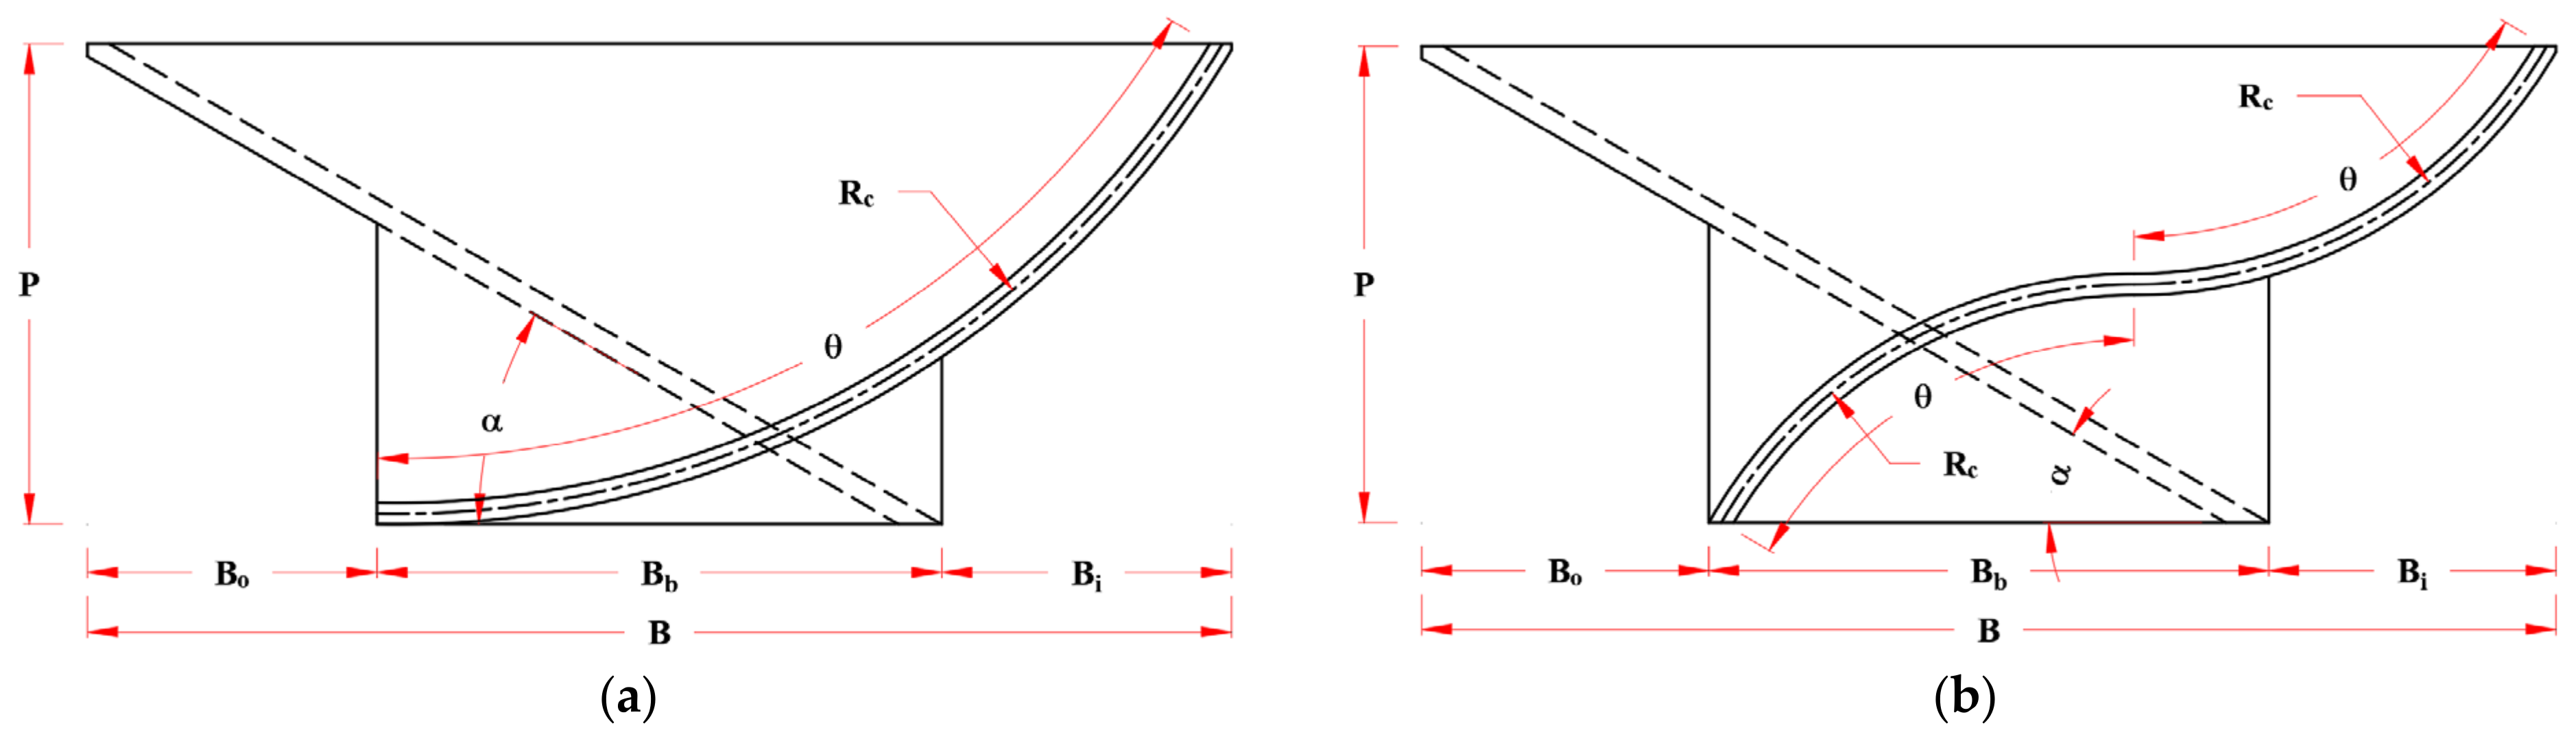
Table 1 summarizes the geometry of the nine configurations (M1–M9), and Figure 3 illustrates the curvature parameters (Rc, θ, and α) for two representative profiles.
Table 1.
Geometric characteristics of the M1–M9 PKW configurations used in the present energy-dissipation analysis.
Figure 3.
Curvature parameters of two representative key profiles: (a) M2, inverted C-shaped inlet key; (b) M6, inverted S-shaped inlet key. The dashed lines indicate the linear key, and the dash-dotted line indicates the centerline of the curved key. Adapted from [30].
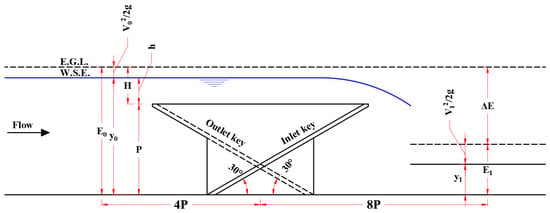
Shaheen et al. [30] reported 125 experimental runs for configurations M1–M9, in which only the upstream head was used to evaluate the discharge coefficient and crest-wise discharge distribution. In 102 of these runs, the downstream flow depth was also measured. The present energy-dissipation analysis is based on these 102 runs, and the downstream measurements and energy-dissipation results are reported here for the first time. The general testing and flow-stabilization procedure follows that described in [30]. For each run, measurements are recorded after stable upstream flow conditions are established. To evaluate energy dissipation, the total specific energies upstream and downstream of the weir are determined at distances of 4P and 8P from the weir centerline, respectively, as illustrated in Figure 4. These locations are selected to obtain measurements outside the rapidly varying flow regions associated with the PKW [7,23]. The upstream distance of 4P is selected because the water-surface profile changes as the flow approaches the weir crest. In contrast, the downstream distance of 8P is selected to allow the flow to recover toward gradually varied conditions with a quasi-constant flow depth.
Figure 4.
Definition of upstream and downstream measurement locations for total specific energy relative to the weir centerline. E.G.L. and W.S.E. denote the energy grade line and the water-surface elevation, respectively. Adapted from [30].
Based on these measurements, the relative energy loss (ΔE/E0) across the PKW is calculated from the upstream and downstream specific energies, E0 and E1, respectively, as:
where y0 and y1 are the upstream and downstream flow depths, respectively; v0 and v1 are the corresponding average flow velocities, obtained from continuity as v = Q/(Wy), where W is the channel width; and g is the gravitational acceleration.
The energy loss defined by Equation (3) represents the total loss between the upstream and downstream measurement sections. It therefore includes the local loss at the PKW, the loss associated with jet interaction, mixing, and flow redistribution downstream of the weir, and the frictional loss along the channel between the two measurement sections. Flow redistribution downstream of the weir is induced by the PKW itself and constitutes part of its dissipation mechanism. For this reason, the downstream section is located at 8P, where the flow has recovered toward gradually varied conditions, consistent with previous PKW energy-dissipation studies [7,8,23]. The frictional loss is estimated for all 102 runs using the Manning equation, applied over the upstream reach (from 4P to the upstream end of the weir) and the downstream reach (from the downstream end of the weir to 8P), with the measured discharges and flow depths. The equivalent Manning coefficient (ne) is determined using the Horton–Einstein method [31] for the concrete bed (n = 0.014) and the glass sidewalls (n = 0.010), yielding ne = 0.0118–0.0132 depending on the flow depth. The estimated frictional loss averaged 1.30% of the total energy loss and did not exceed 2.41% in any run, and can therefore be considered negligible. Moreover, because all configurations are tested in the same flume over the same reaches, the frictional loss is practically identical for all configurations at a given discharge. Therefore, the differences in energy loss between configurations are attributable to the PKW geometry.
The distribution of the 102 experimental runs among the nine configurations and the corresponding ranges of discharge, total head ratio, flow depths, and Froude numbers (Fr = v/√(gy)) at the upstream and downstream measurement sections are summarized in Table 2. The flow is subcritical at both sections in all runs, with Fr0 = 0.047–0.174 and Fr1 = 0.40–0.68.
Table 2.
Distribution of the experimental runs and ranges of the hydraulic parameters for each configuration.
3. Numerical Work
3.1. Numerical Solution and Turbulence Modeling
The flow over the PKW is simulated with FLOW-3D HYDRO (version 1.0.0.13; Flow Science Inc., Santa Fe, NM, USA), a finite-volume solver of the Reynolds-Averaged Navier–Stokes (RANS) equations. Turbulence is represented using the Renormalization Group (RNG) k–ε model, which has been successfully applied in previous numerical studies of PKW and labyrinth-weir free-surface flows and energy dissipation [18,20,26,32,33,34,35]. Energy dissipation over PKWs is governed by strongly three-dimensional flow features, including shear layers, streamline curvature, flow separation, recirculation, and turbulent mixing, all of which are influenced by the investigated key geometries. The RNG k–ε model has been reported to provide reliable accuracy for such phenomena, including jet diffusion over PKWs [20]. Moreover, previous comparisons of turbulence closures have shown that the predicted discharge of PKWs is relatively independent of the choice between the RNG k–ε model and large-eddy simulation (LES) [33], and that the standard k–ε, RNG k–ε, and SST k–ω models yield no remarkable differences for labyrinth weir flow, with the RNG k–ε model among the most accurate [36]. The adequacy of the RNG model for the present application is further supported by the validation in Section 3.4, where the simulated HT and E0 agree with the measurements within ±5%, whereas the main deviation, in the downstream specific energy, is attributed to the downstream boundary condition rather than to turbulence modeling. Nevertheless, a systematic comparison with alternative turbulence models was not performed and is recommended for future work.
The free surface is tracked with the Volume of Fluid (VOF) method [37], using the one-fluid, sharp-interface option of FLOW-3D HYDRO. The continuity and momentum equations are solved for the pressure and velocity fields, and the momentum advection terms are discretized with a second-order monotonicity-preserving scheme. Pressure is solved implicitly with the generalized minimal residual (GMRES) solver, and its convergence is controlled by the dynamic convergence criterion of the software with a multiplier of 1.
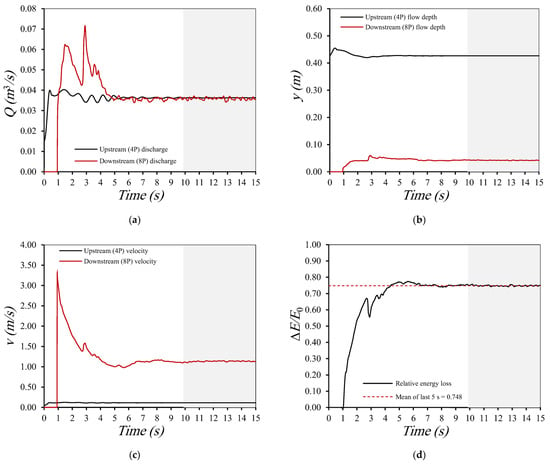
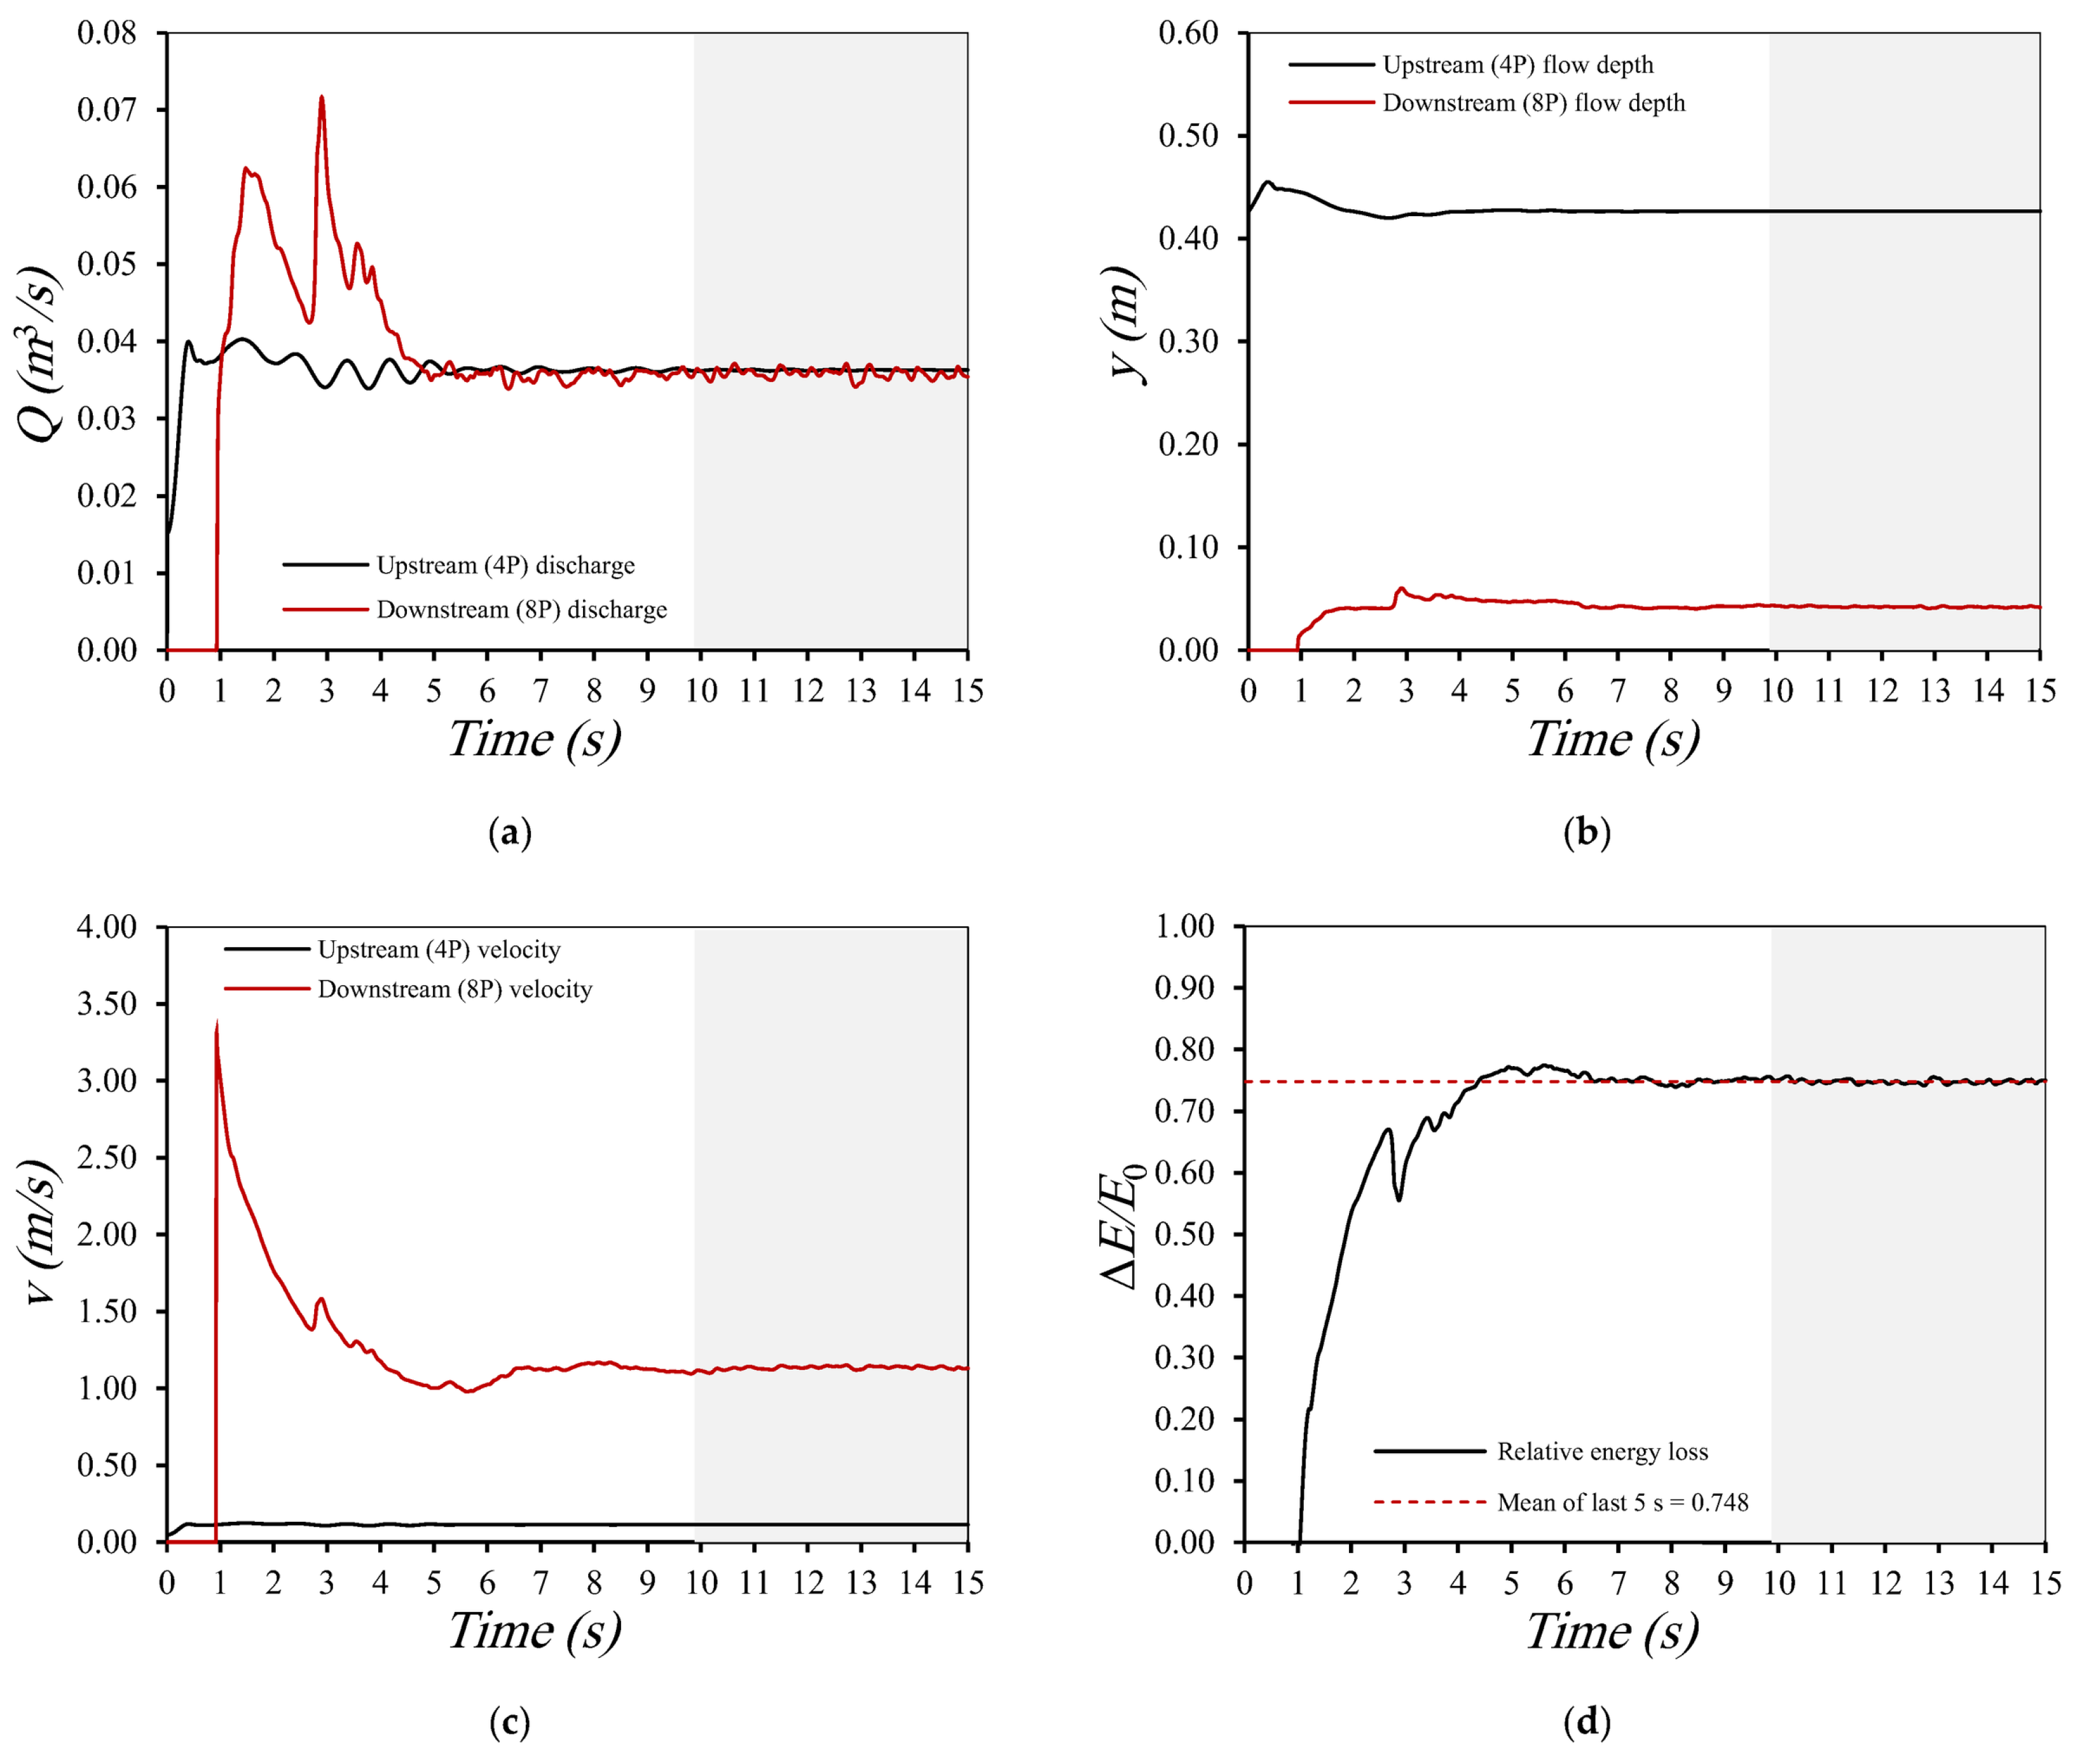
FLOW-3D HYDRO adjusts the time step automatically to satisfy stability and convergence limits. Each run is simulated for 15 s of physical time, and the attainment of a quasi-steady flow condition is verified over the final 5 s (10–15 s) by monitoring the temporal variation of the discharge, flow depth, mean velocity, and relative energy loss at the upstream (4P) and downstream (8P) flux planes. Figure 5 shows these variations for a representative case (M1, Q = 0.0363 m3/s). Relative to their mean values over the final 5 s, the upstream flow depth stabilizes within ±2% after approximately 1.5 s, followed by the upstream discharge and velocity after approximately 5 s and the relative energy loss after approximately 6 s. Over the final 5 s, the upstream quantities show coefficients of variation below 0.2%, and the relative energy loss shows a coefficient of variation of 0.42% and a maximum deviation of 1.20% from its mean value of 0.748. The downstream quantities are subject to stronger fluctuations due to the turbulent flow downstream of the weir; they remain within ±5% of their mean values after approximately 6.5 s, with coefficients of variation of 1.65%, 1.31%, and 0.89% for the discharge, flow depth, and velocity, respectively. The agreement between the upstream and downstream discharges over this interval is characterized by a MAPE of 1.66% and an RMSE of 0.000746 m3/s. These results indicate that the flow reaches a quasi-steady state well before 10 s and that a total simulation time of 15 s is adequate.
Figure 5.
Temporal variation of (a) the discharge; (b) the flow depth; (c) the mean velocity; (d) the relative energy loss; computed at the upstream (4P) and downstream (8P) flux planes for a representative simulation (M1, Q = 0.0363 m3/s). The shaded area indicates the final 5 s used to verify the quasi-steady flow condition.
3.2. Meshing and Geometry
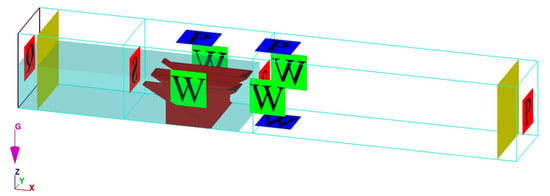
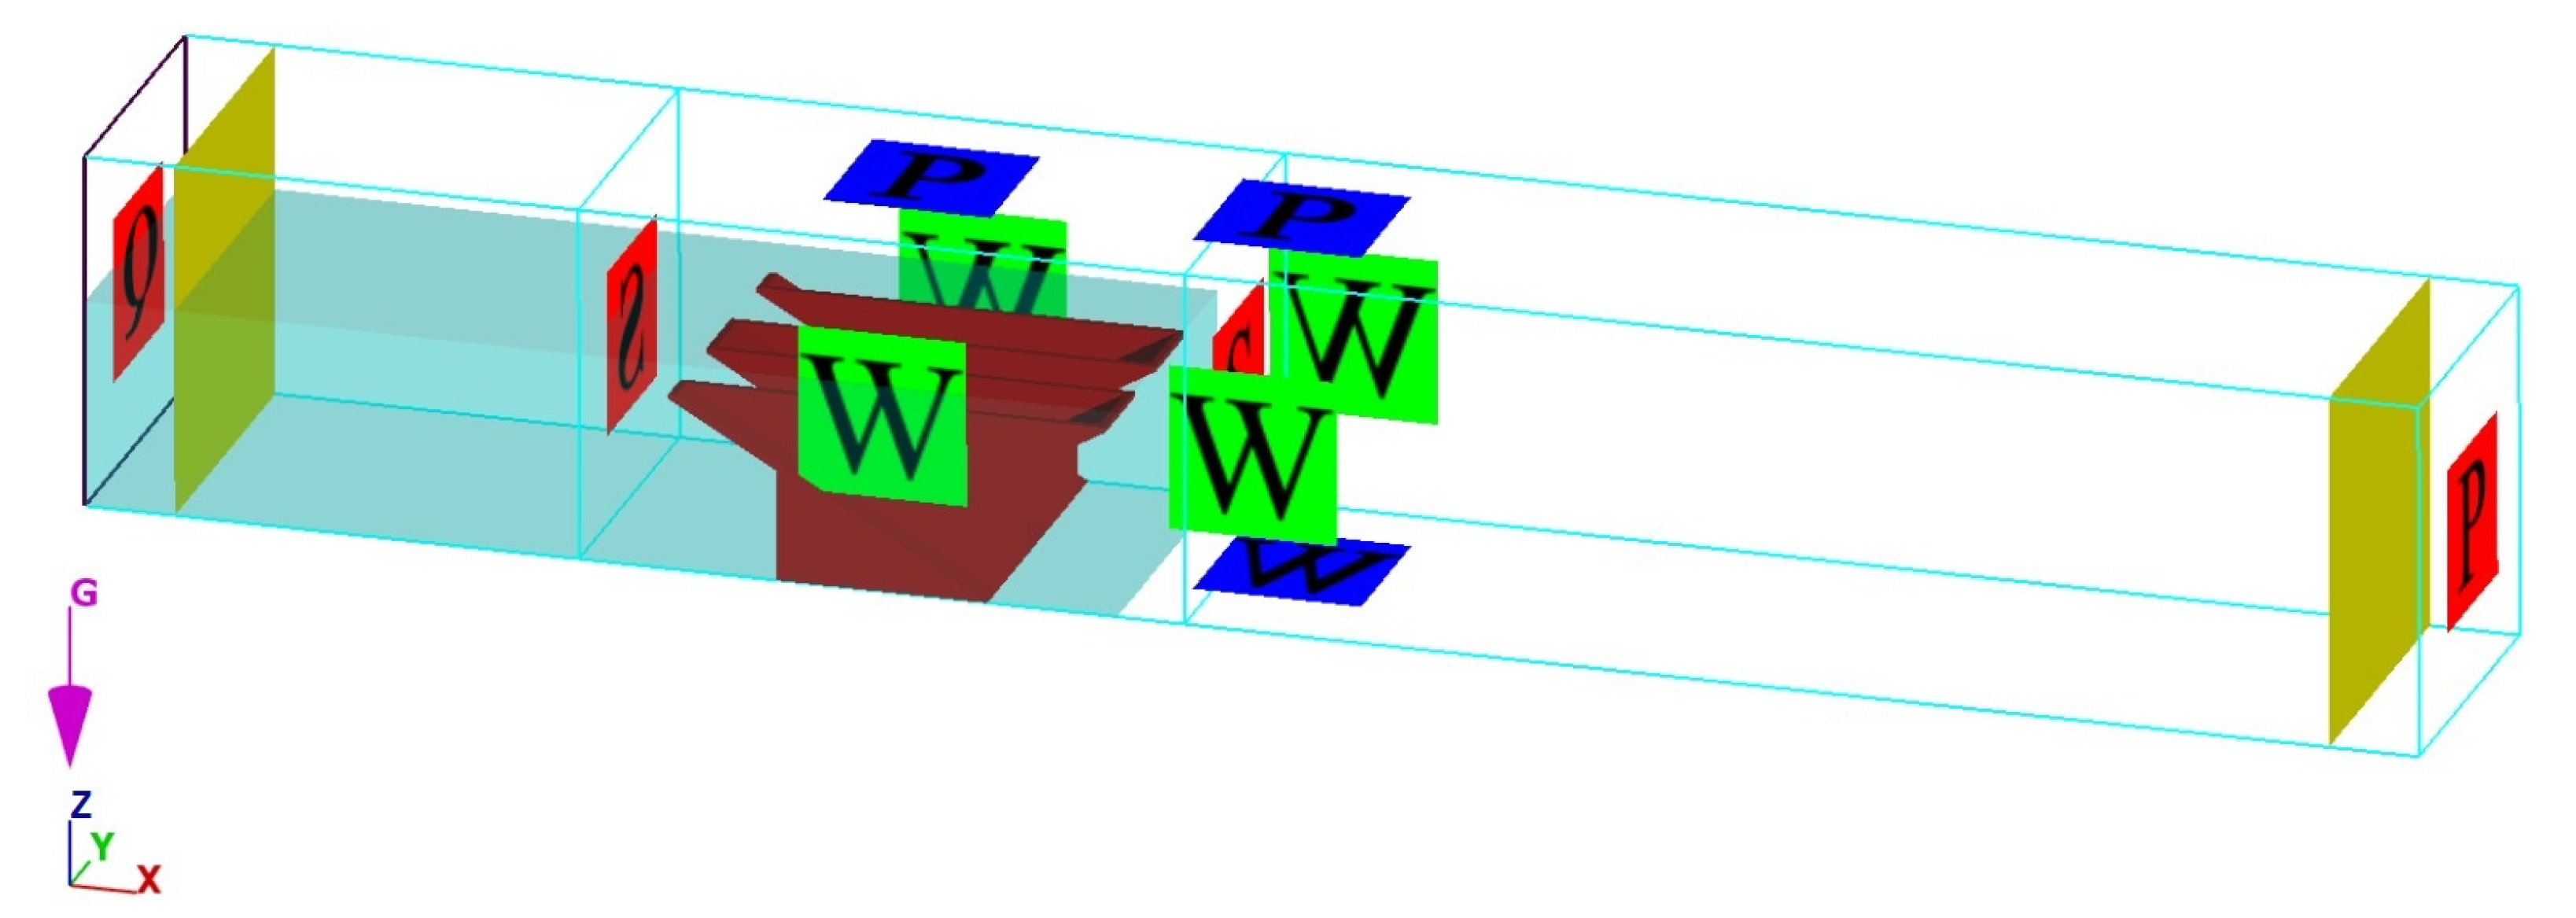
The computational domain is discretized using a structured hexahedral grid consisting of two mesh blocks. The outer block represents the overall computational domain, whereas a nested inner block provides local grid refinement in the vicinity of the PKW and the surrounding rapidly varying flow region, as illustrated in Figure 6. This nested-grid arrangement is consistent with approaches adopted in previous numerical studies [26,38]. The PKW geometry is incorporated into the computational domain as a stereolithography (STL) file.
Figure 6.
Computational mesh arrangement showing the outer and nested refined mesh blocks.
A mesh sensitivity analysis is carried out for the reference configuration (M1) at a discharge of 0.0363 m3/s to determine an appropriate mesh resolution for the numerical simulations. Four mesh configurations are examined, as summarized in Table 3. For each mesh configuration, the numerically predicted total head HT is compared with the corresponding experimental value. The prediction error is quantified using the root mean square error (RMSE) and mean absolute percentage error (MAPE), calculated according to Equations (4) and (5), respectively.
where Xexp and Xnum are the measured and simulated values of X, respectively, and N is the number of data points.
Table 3.
Mesh-sensitivity analysis for the reference configuration (M1) at Q = 0.0363 m3/s.
As presented in Table 3, the prediction error decreases progressively with mesh refinement, indicating improved numerical accuracy. The finest mesh (T4), with cells of 0.72 cm in the nested block and 1.30 cm in the outer block, gives the lowest RMSE and MAPE values. Therefore, this mesh configuration, comprising 3,891,832 computational cells, is adopted for all subsequent simulations to ensure consistent numerical accuracy while minimizing mesh-dependent effects.
3.3. Boundary Conditions
The boundary conditions are defined to reproduce the hydraulic conditions of the physical model. A prescribed volume-flow-rate condition is applied at the upstream boundary to reproduce the experimentally imposed discharge, while an outflow condition is assigned at the downstream boundary so that the flow exits the domain freely, with no downstream water level imposed. This condition is adopted because the flume terminates in a free overfall, and because imposing the measured downstream depth would prescribe, rather than predict, the downstream specific energy; its effect on the simulated downstream depth is discussed in Section 3.4. The upper boundary is maintained at atmospheric pressure, whereas the flume bed and lateral boundaries are treated as wall boundaries. The upstream and downstream boundaries of the nested mesh block are assigned symmetry conditions. Because these faces lie within the containing mesh block, they do not represent physical boundaries; FLOW-3D HYDRO treats them as inter-block boundaries through which the flow variables are exchanged, so they do not affect the computed water depths or energy dissipation.
The domain measures 5.20 × 0.75 × 0.80 m (length × width × height). It extends 1.80 m upstream and 3.40 m downstream of the PKW centerline, corresponding to 4.5P and 8.5P, respectively, for the adopted weir height of P = 0.40 m. Two internal flux planes are located at 4P upstream and 8P downstream of the PKW centerline, corresponding to 1.60 m and 3.20 m, respectively. These locations coincide with the upstream and downstream measurement sections used in the experimental energy-dissipation analysis. This domain is longer than that adopted by Shaheen et al. [30], which extended only 1.0 m (2.5P) beyond the upstream and downstream ends of the weir and therefore did not include these measurement sections. The flux planes are used to monitor the discharge and mean velocity and to assess the attainment of a quasi-steady flow condition. The computational domain, applied boundary conditions, and locations of the upstream and downstream flux planes are illustrated in Figure 7. The applied boundary conditions are summarized in Table 4.
Figure 7.
Computational domain showing the applied boundary conditions and the locations of the upstream and downstream flux planes.
Table 4.
Applied boundary conditions (same as in [30]).
3.4. Validation of the Numerical Solution
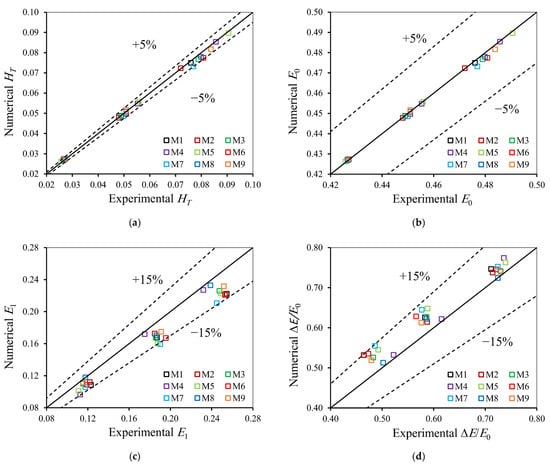
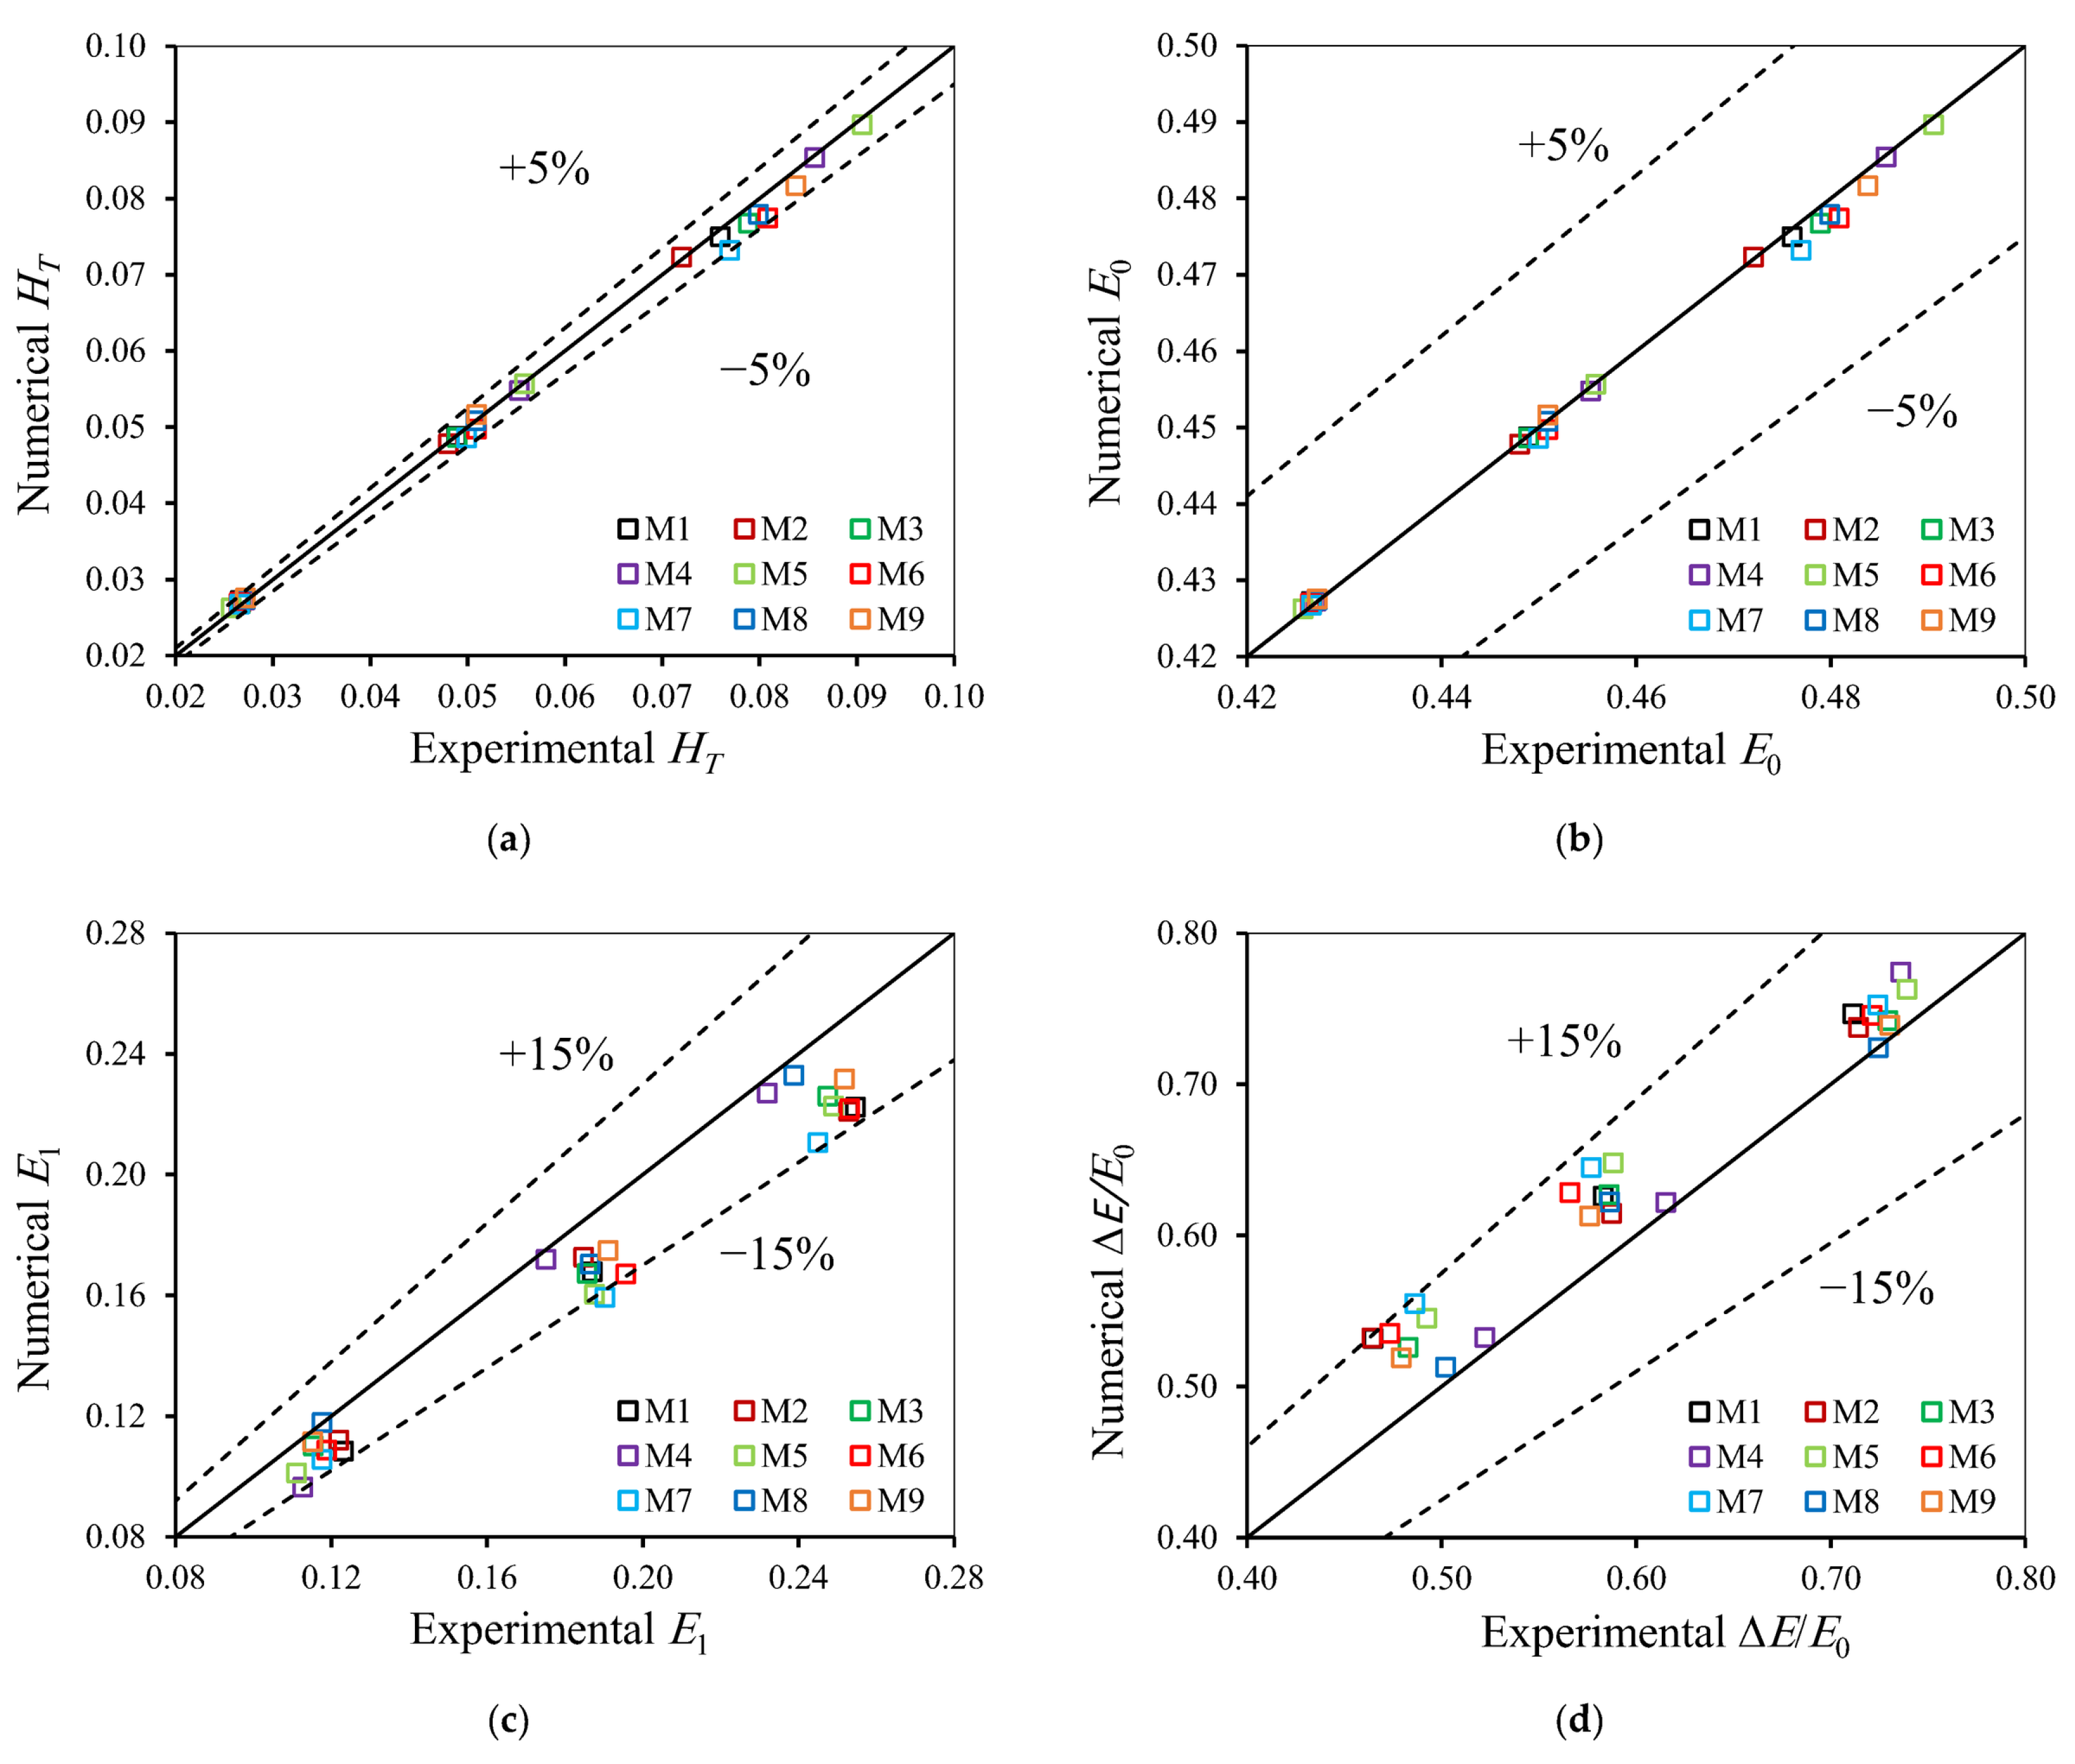
The numerical solution is validated by comparing the simulated results with the corresponding experimental measurements for 27 runs covering configurations M1–M9. These runs comprise three discharges for each configuration: low (Q ≈ 0.031–0.037 m3/s), intermediate (Q ≈ 0.080–0.082 m3/s), and high (Q ≈ 0.121–0.131 m3/s), which produce the three clusters of points in Figure 8. Because energy dissipation is the main focus of this study, the comparison includes not only the total head (HT) but also the upstream specific energy (E0), the downstream specific energy (E1), and the relative energy loss (ΔE/E0), as shown in Figure 8. The model performance is quantified using the RMSE and MAPE, calculated according to Equations (4) and (5), together with the coefficient of determination (R2).
Figure 8.
Comparison between numerical and experimental values for configurations M1–M9: (a) total head (HT); (b) upstream specific energy (E0); (c) downstream specific energy (E1); (d) relative energy loss (ΔE/E0).
As shown in Figure 8a, the simulated HT values are closely distributed around the line of perfect agreement, and all points fall within the ±5% deviation limits. The resulting RMSE, MAPE, and R2 are 0.0013 m, 1.50%, and 0.997, respectively. The upstream specific energy is reproduced with similar accuracy (Figure 8b), with all points within ±5%, an RMSE of 0.0013 m, a MAPE of 0.19%, and an R2 of 0.997. These results confirm that the model accurately reproduces the upstream flow conditions and the head–discharge relationship of the investigated configurations.
In contrast, the downstream specific energy is systematically underestimated (Figure 8c), with an RMSE of 0.0200 m, a MAPE of 9.11%, and an R2 of 0.860. This discrepancy is attributed to the outflow condition at the downstream boundary, which allows the flow to leave the computational domain without imposing the tailwater depth established in the laboratory flume by its downstream reach and end overfall. Consequently, the simulated downstream depths are lower than the measured ones. This is consistent with previous studies showing that the downstream subcritical depth must be imposed to reproduce tailwater conditions in FLOW-3D [39] and that numerical–experimental discrepancies downstream of PKWs increase at higher heads [20].
As a result, the relative energy loss is overestimated by 6.7% on average (Figure 8d), with an RMSE of 0.0424, a MAPE of 6.70%, and an R2 of 0.818. Nevertheless, all values fall within ±15% of the experimental measurements, with a maximum deviation of 14.6%. Because this deviation is systematic and affects all simulated configurations, the performance of M10 is compared in Section 4.3 only with the numerically simulated M1, M4, and M5 configurations under identical numerical settings, so that the effect of the downstream boundary condition is common to all compared cases.
3.5. Numerically Proposed Combined Configuration
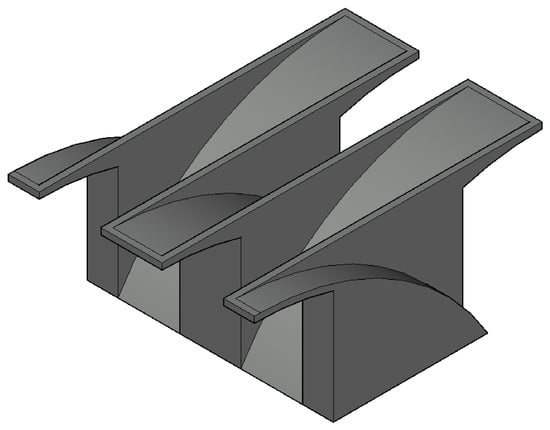
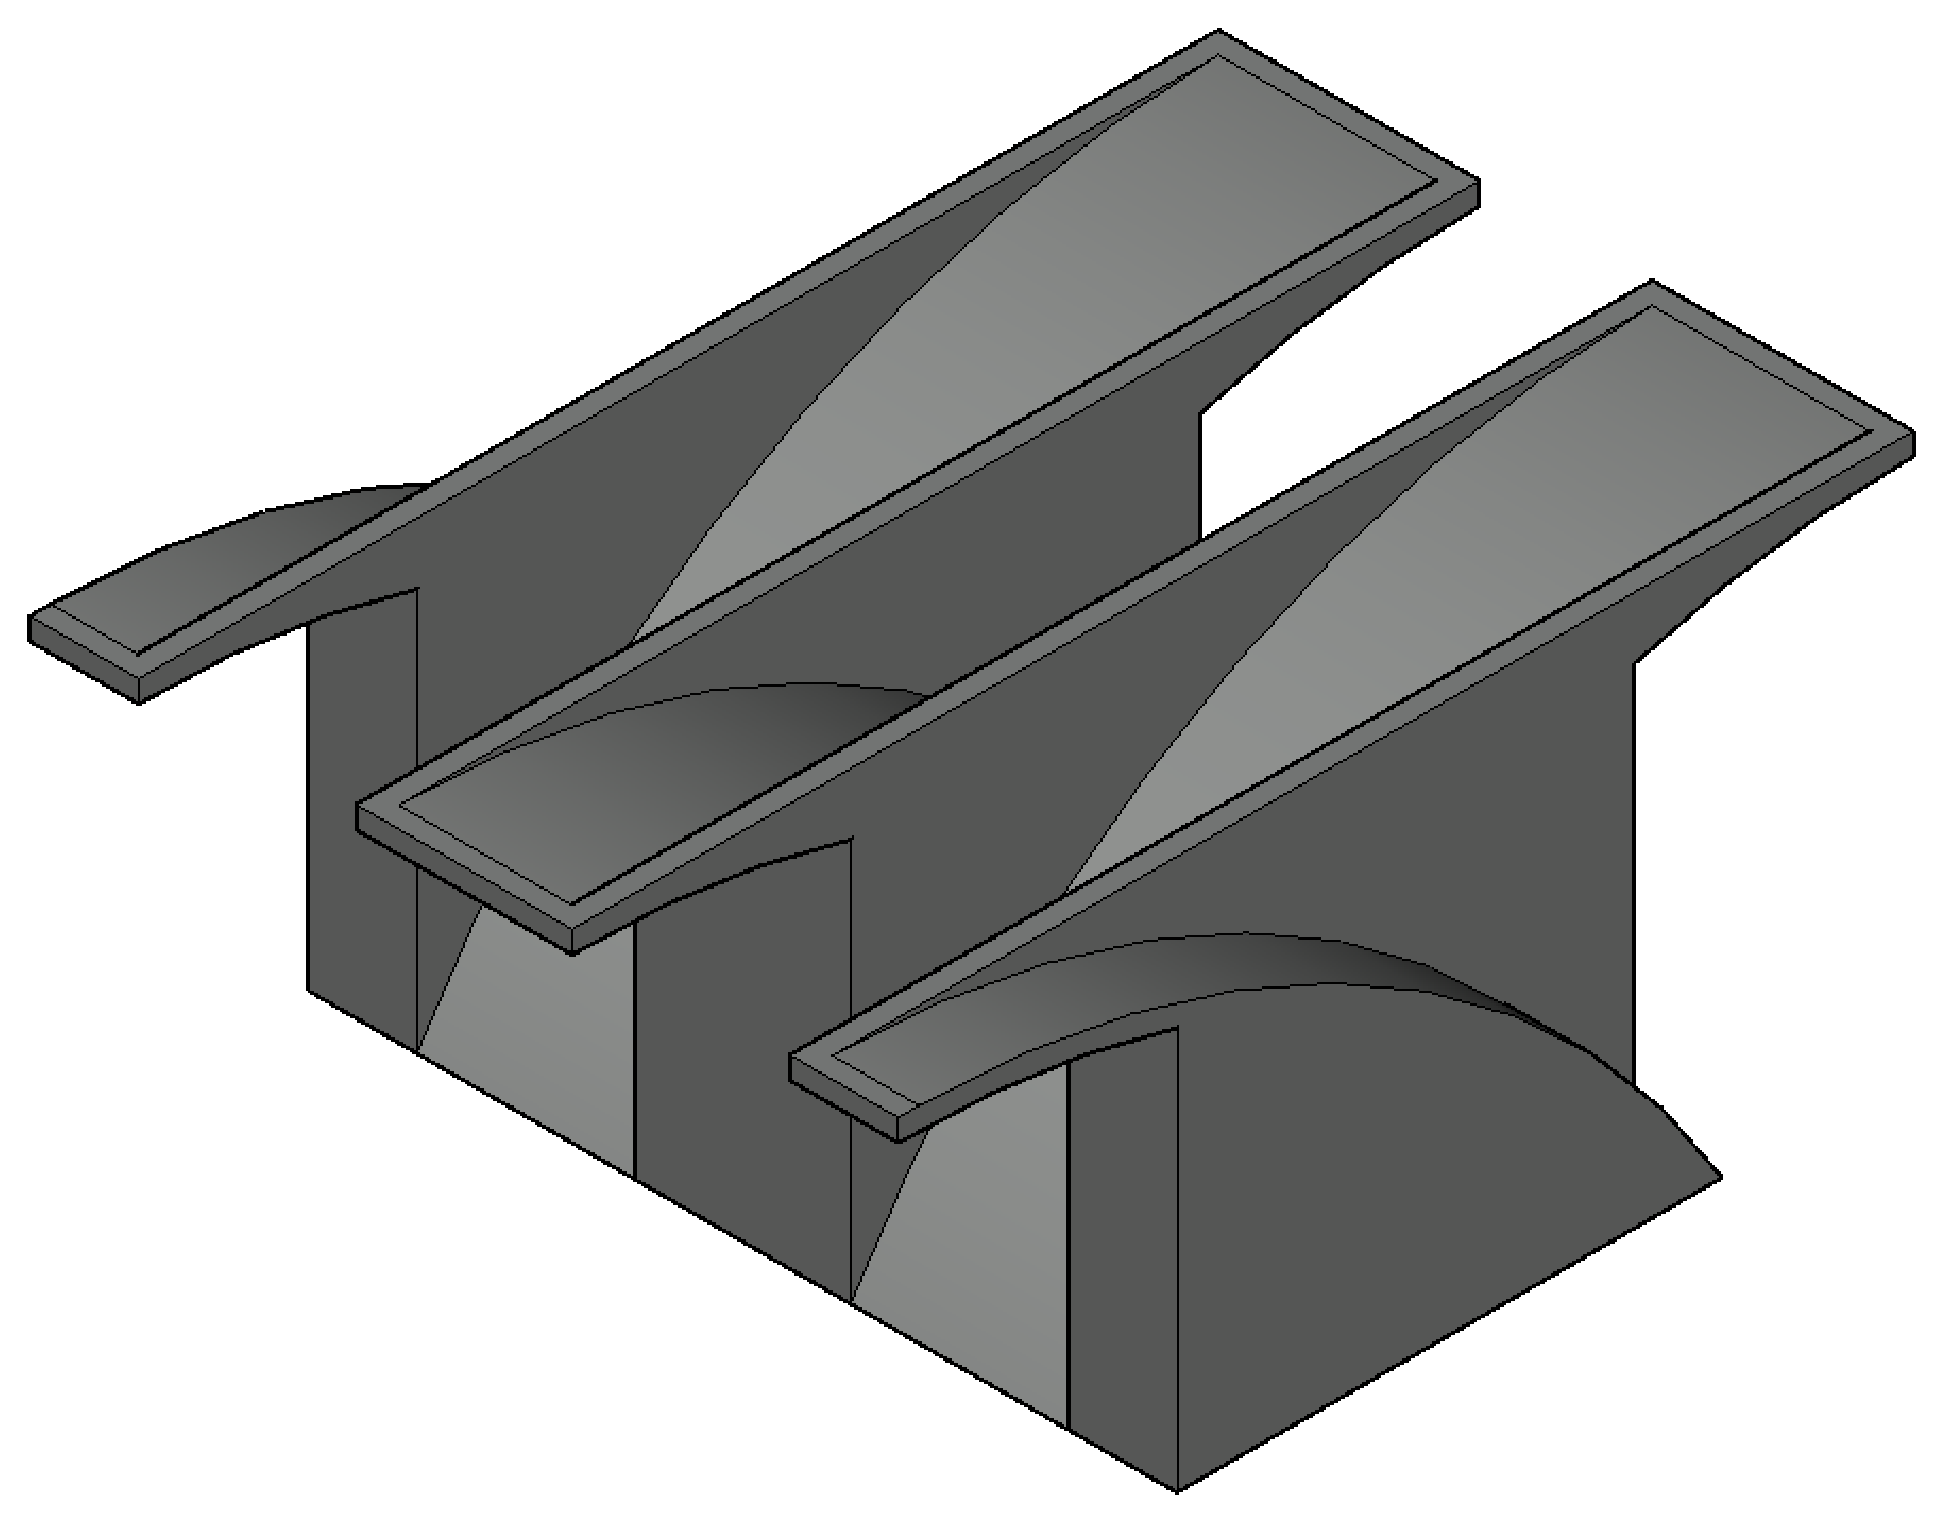
Following validation of the numerical solution, an additional PKW configuration (M10) is introduced to evaluate the combined effect of the most effective inlet- and outlet-key modifications identified from the experimental investigation. M10 combines the C-shaped inlet geometry of M4 with the C-shaped outlet geometry of M5, while all other geometric parameters remain identical to those of the experimentally tested models. Since M10 represents a design extension derived from the experimental findings, its hydraulic performance is evaluated numerically using the validated FLOW-3D model over the investigated range of flow conditions and compared with the numerically simulated M1, M4, and M5 configurations. The application of the validated model to M10 is justified because M10 does not introduce new geometric features. Its C-shaped inlet and C-shaped outlet are identical to those of M4 and M5, respectively, both of which are included in the validation dataset (Section 3.4). In addition, M10 is simulated using the same computational domain, mesh resolution, boundary conditions, and numerical settings, and within the same range of discharges as the validated configurations. Nevertheless, because M10 has not been tested experimentally, its results are presented as numerical predictions. A three-dimensional representation of the proposed M10 configuration is shown in Figure 9.
Figure 9.
Three-dimensional representation of the proposed combined PKW configuration (M10) with C-shaped inlet and outlet keys.
4. Results and Discussion
4.1. Effect of Inlet-Key Geometry on Energy Loss
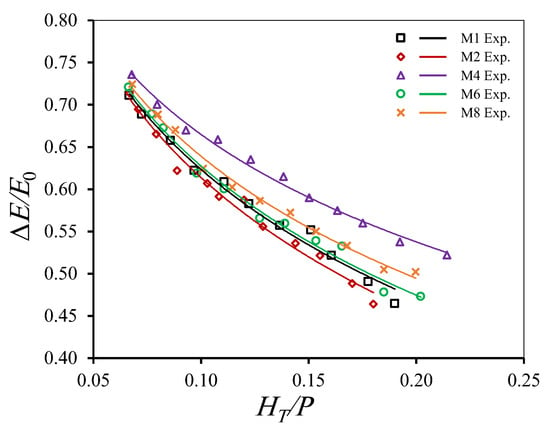
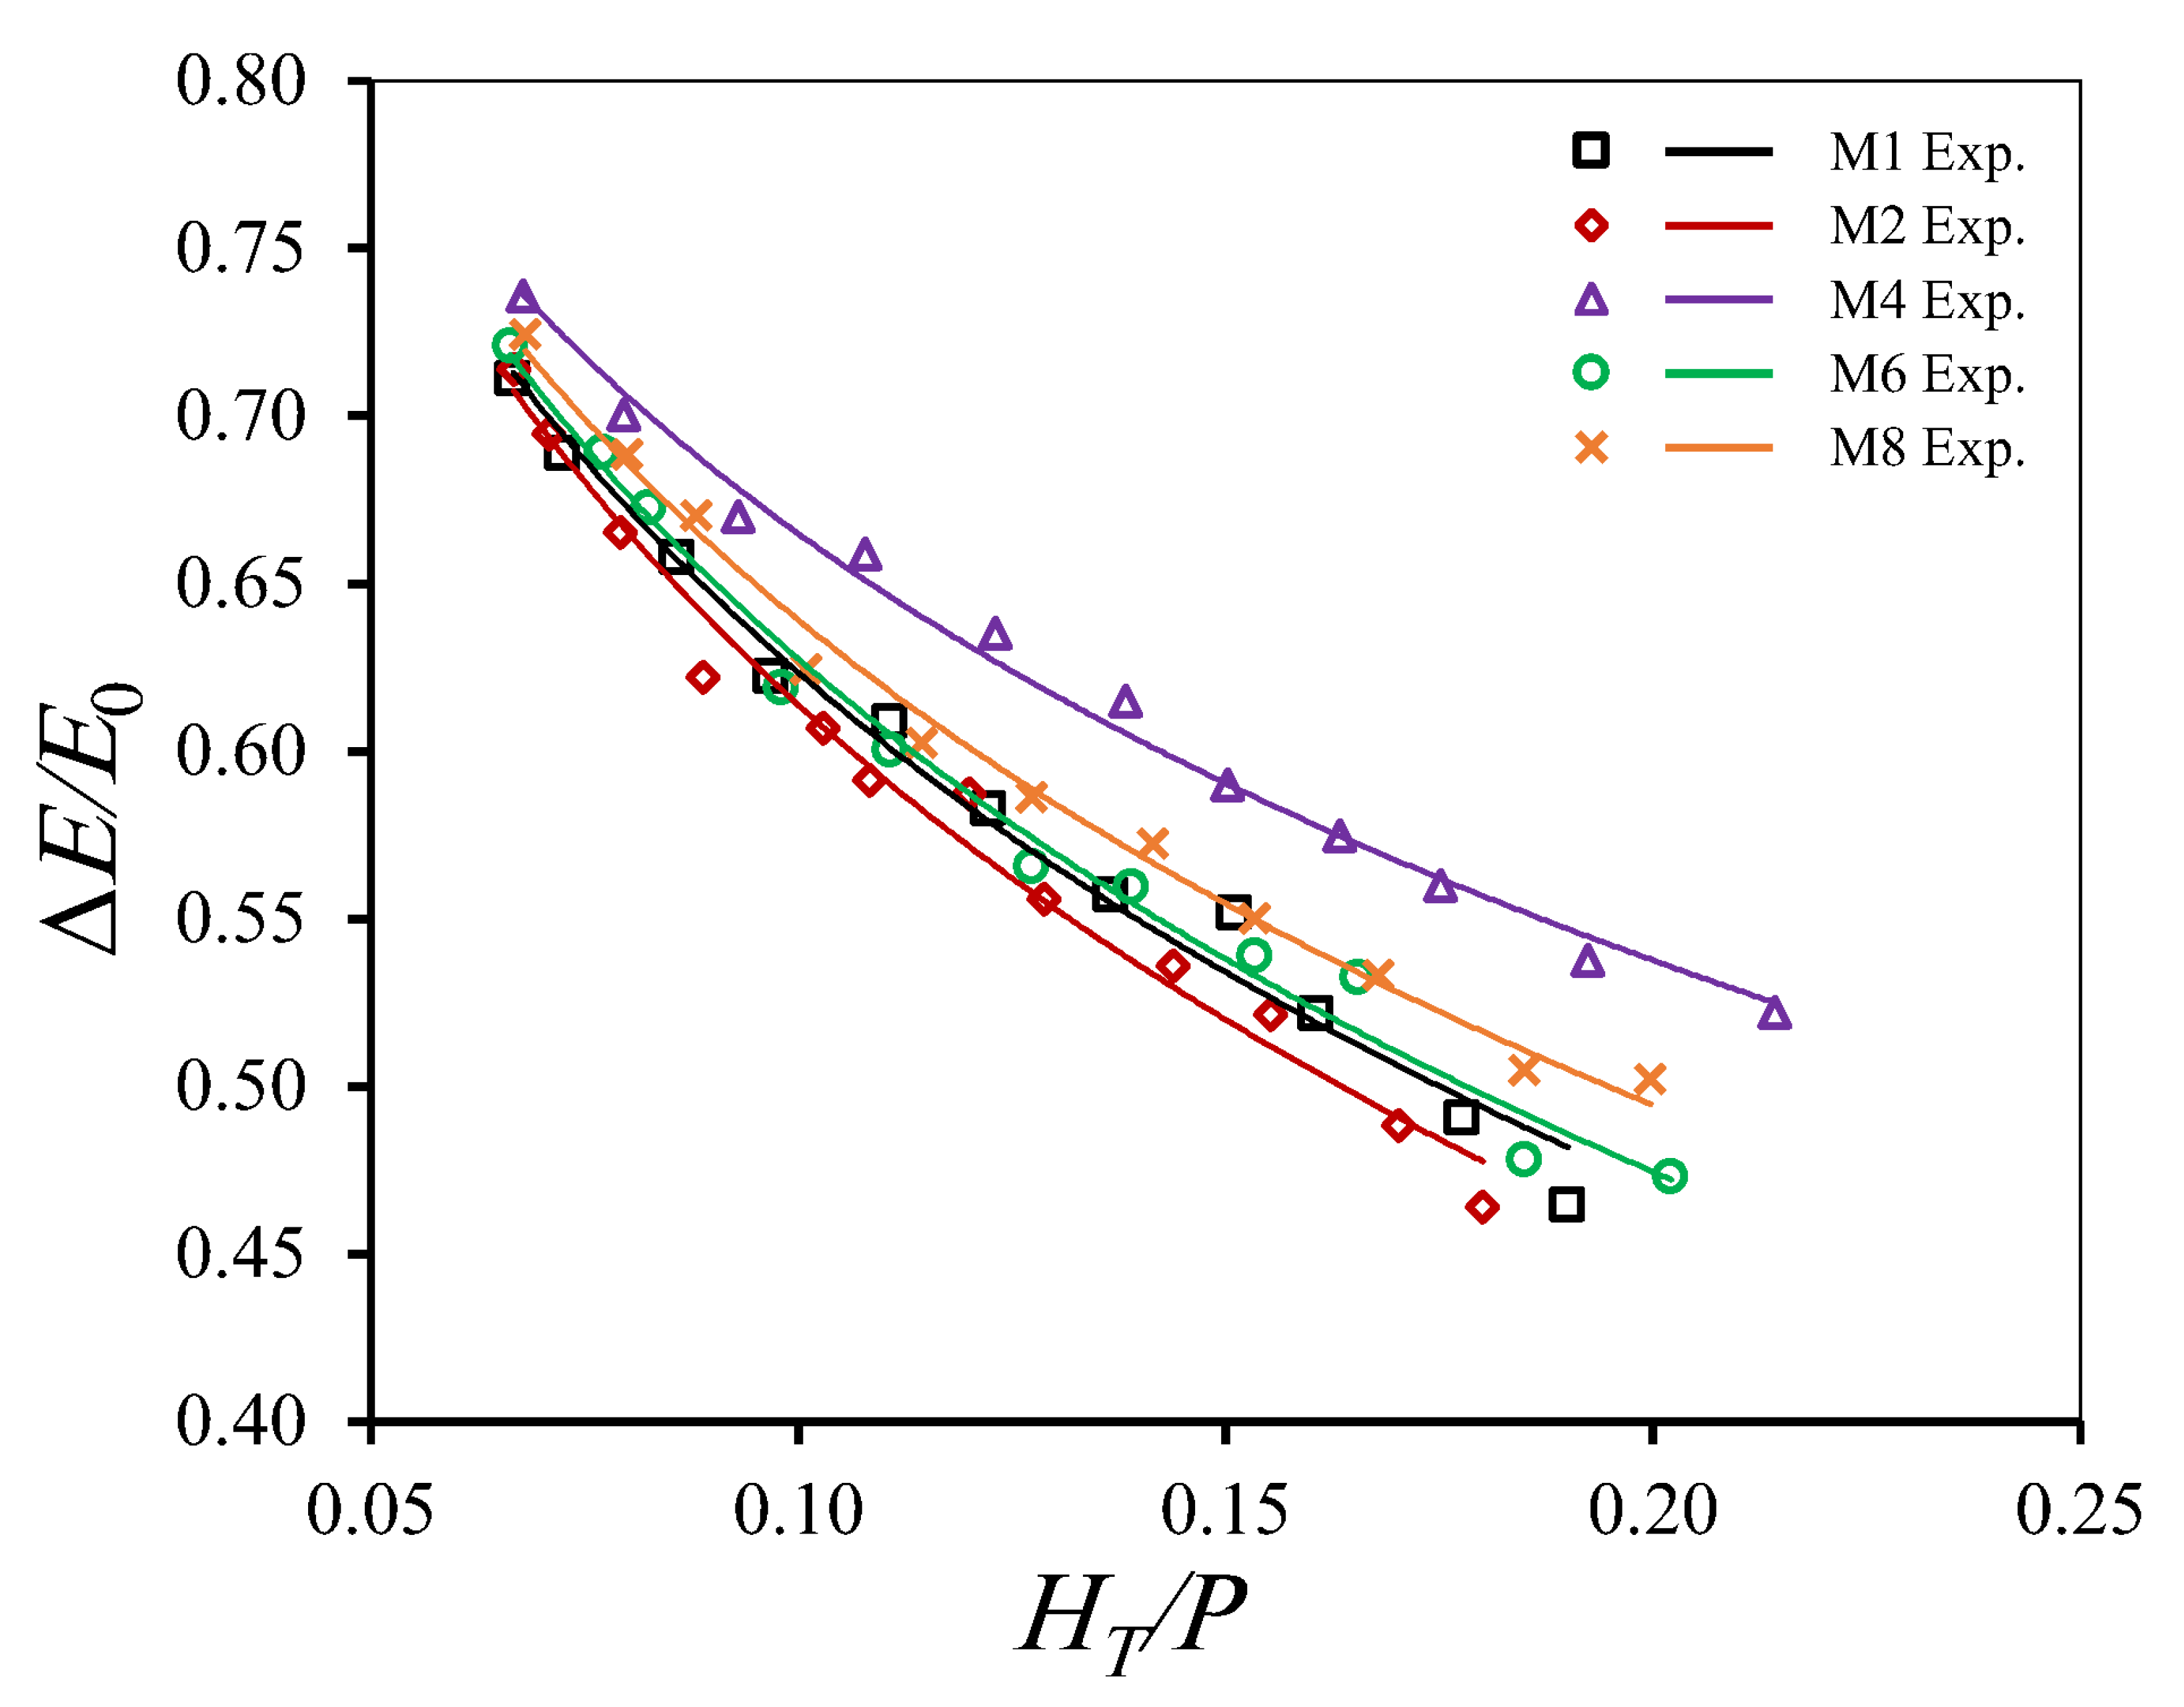
Figure 10 presents the experimental variation of the relative energy loss (ΔE/E0) with the total head ratio (HT/P) for the reference configuration (M1) and the inlet-modified configurations (M2, M4, M6, and M8). Each data point corresponds to one experimental run at a different discharge; the number of runs and the discharge range for each configuration are given in Table 2. For all configurations, the relative energy loss decreases continuously as HT/P increases. At low relative heads, approximately 71–74% of the upstream specific energy is dissipated, whereas the corresponding values decline to approximately 46–52% toward the upper end of the experimental range. This trend indicates that the dissipated energy represents a progressively smaller fraction of the available upstream energy as the flow head increases. Similar behavior is reported in previous experimental studies, which show higher energy dissipation efficiency under low-head conditions and a gradual reduction with increasing relative head or discharge [7,8].
Figure 10.
Relative energy loss (ΔE/E0) versus HT/P for the reference weir (M1) and the inlet-modified weirs (M2, M4, M6, and M8).
Although all configurations exhibit the same overall trend, the magnitude of the relative energy loss varies with the inlet-key geometry. The C-shaped inlet configuration (M4) consistently produces the highest relative energy loss throughout the investigated range. In contrast, the inverted C-shaped inlet (M2) generally produces the lowest values, particularly at moderate and high head ratios. The S-shaped inlet (M8) exhibits intermediate performance and remains slightly above the reference model, whereas the inverted S-shaped inlet (M6) closely follows M1 with only minor differences throughout most of the investigated range.
To enable a direct comparison under identical hydraulic conditions, logarithmic regression equations are fitted to the experimental data of each configuration. The fitted equations are then used to estimate the relative energy loss at identical values of HT/P. The percentage change in relative energy loss of each configuration (Mi) relative to the reference configuration (M1) is calculated as [(ΔE/E0)Mi − (ΔE/E0)M1]/(ΔE/E0)M1 × 100, where both values are obtained from the fitted regressions at the same HT/P. At HT/P = 0.08, the predicted values of ΔE/E0 are 0.6726, 0.6654, 0.7059, 0.6766, and 0.6857 for M1, M2, M4, M6, and M8, respectively. Compared with the reference configuration (M1), the C-shaped inlet (M4) increases the relative energy loss by approximately 4.96%, whereas the S-shaped inlet (M8) and the inverted S-shaped inlet (M6) increase it by approximately 1.96% and 0.60%, respectively. In contrast, the inverted C-shaped inlet (M2) reduces the relative energy loss by approximately 1.07%.
The influence of the inlet-key geometry becomes more pronounced as the relative head increases. At HT/P = 0.12, M4 increases the relative energy loss by 8.28% compared with M1, followed by M8 (3.07%) and M6 (0.67%), whereas M2 reduces it by 2.00%. As HT/P increases to 0.18, the improvement provided by M4 increases to 12.80%, while smaller increases of 4.58% and 0.77% are obtained for M8 and M6, respectively. In contrast, M2 remains 3.27% below the reference configuration, confirming that the hydraulic effect of the inlet-key geometry becomes increasingly significant at higher relative head ratios.
The experimental results demonstrate that inlet-key geometry significantly influences the energy dissipation performance of the PKW, with this influence becoming more evident as the total head ratio increases. The differences among the tested configurations indicate that variations in inlet geometry modify the hydraulic conditions governing flow passage through the keys and consequently affect the energy dissipated during overflow. Previous investigations similarly report that PKW energy dissipation is sensitive to geometric configuration and the associated flow characteristics [8,26]. The superior energy dissipation achieved by the C-shaped inlet (M4) therefore identifies inlet curvature as an additional geometric parameter governing the energy-loss characteristics of PKWs, whereas the inverted C-shaped inlet (M2) produces comparatively lower energy dissipation.
Interestingly, the present energy-dissipation ranking differs from the discharge-performance behavior previously reported for the same configurations. Shaheen et al. [30] found that the inverted C-shaped inlet (M2) enhanced the discharge coefficient, whereas the C-shaped inlet (M4) reduced it. In the present analysis, however, M4 provides the greatest energy-dissipation enhancement, while M2 produces the lowest relative energy loss among the inlet-modified configurations. This contrasting behavior indicates a hydraulic trade-off between discharge efficiency and energy dissipation and demonstrates that a geometry optimized for discharge capacity is not necessarily optimal for energy dissipation.
4.2. Effect of Outlet-Key Geometry on Energy Loss
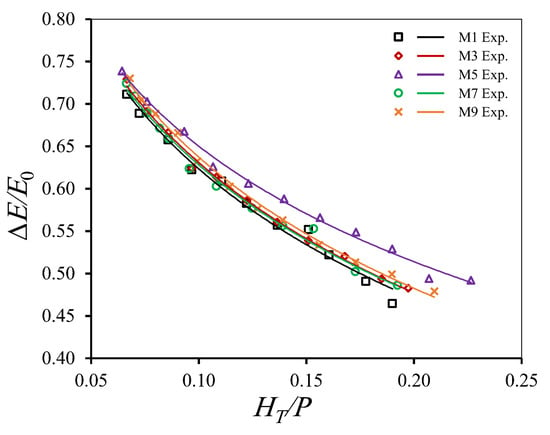
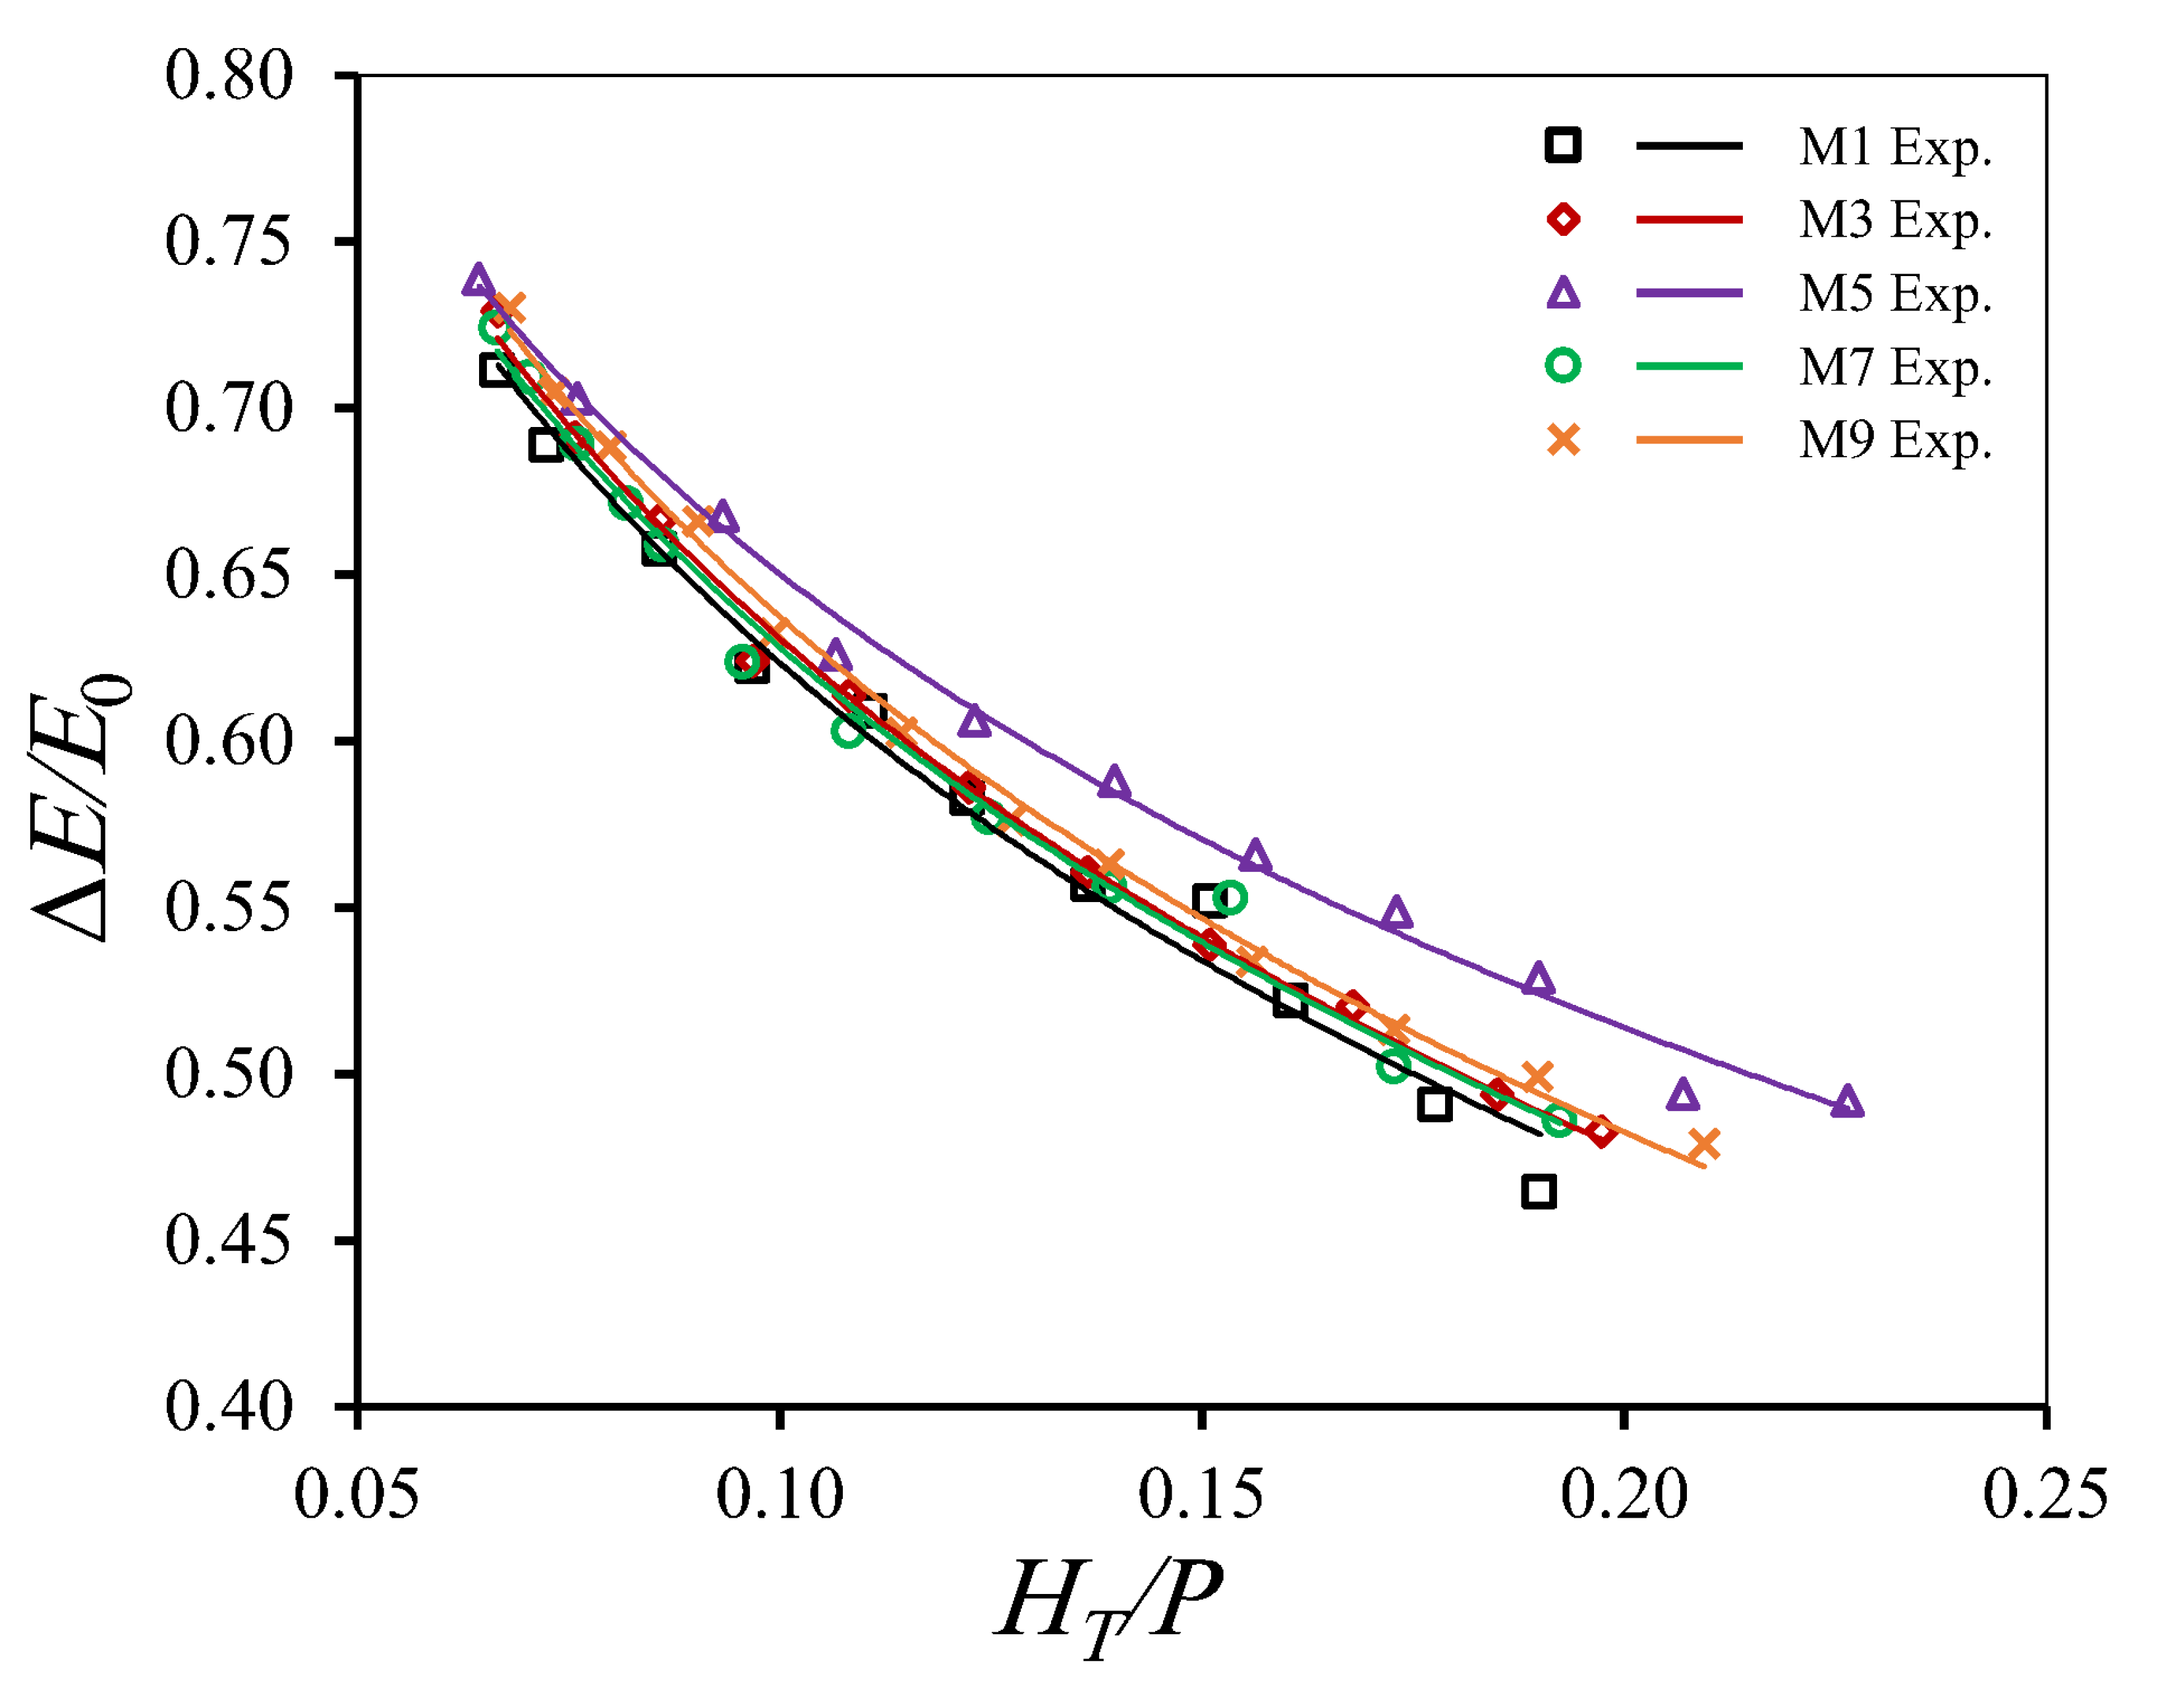
Figure 11 illustrates the experimental variation of the relative energy loss (ΔE/E0) with the total head ratio (HT/P) for the reference configuration (M1) and the outlet-modified configurations (M3, M5, M7, and M9). As in Figure 10, each data point corresponds to one experimental run (Table 2). Similar to the inlet-modified configurations, the relative energy loss decreases continuously as the total head ratio increases for all outlet geometries. The relative energy loss decreases from approximately 72–74% at low head ratios to approximately 48–50% at the highest investigated head ratios, indicating that the proportion of upstream energy dissipated during overflow gradually decreases as the flow head increases.
Figure 11.
Relative energy loss (ΔE/E0) versus HT/P for the reference weir (M1) and the outlet-modified weirs (M3, M5, M7, and M9).
Although all outlet geometries exhibit similar trends, clear differences appear in the magnitude of the energy dissipation. Among the investigated configurations, the C-shaped outlet (M5) consistently produces the highest relative energy loss over the entire range of investigated head ratios. In contrast, the inverted S-shaped outlet (M7) exhibits performance very close to the reference configuration (M1), whereas the S-shaped (M9) and inverted C-shaped (M3) outlet geometries provide moderate improvements in energy dissipation.
To enable quantitative comparisons under identical hydraulic conditions, logarithmic regression equations are fitted to the experimental data for each outlet configuration. The fitted equations are then used to estimate the relative energy loss at selected values of the total head ratio. At HT/P = 0.08, the predicted values of ΔE/E0 are 0.6726, 0.6802, 0.6940, 0.6769, and 0.6872 for M1, M3, M5, M7, and M9, respectively. Relative to the reference configuration, M5 increases the relative energy loss by approximately 3.19%, followed by M9 (2.17%), M3 (1.14%), and M7 (0.64%).
As the total head ratio increases, the influence of the outlet geometry becomes more evident. At HT/P = 0.12, the enhancement in the relative energy loss reaches 5.34% for M5, compared with 2.31%, 1.24%, and 0.87% for M9, M3, and M7, respectively. At HT/P = 0.18, the corresponding improvements further increase to 8.27%, 2.49%, 1.37%, and 1.18%, confirming that the hydraulic effect of the outlet-key geometry becomes increasingly significant at higher head ratios. Unlike the inlet-modified configurations, all outlet modifications provide either neutral or positive effects on the relative energy loss, although the magnitude of improvement varies considerably among the investigated geometries.
The experimental results demonstrate that the outlet-key geometry influences the energy dissipation performance of the PKW, although the magnitude of this effect depends strongly on the adopted configuration. The consistently superior performance of the C-shaped outlet (M5) indicates that modifying the outlet geometry can enhance the energy dissipated during overflow. Previous investigations show that energy dissipation in PKWs is strongly associated with outlet-key jet and nappe interactions, turbulent mixing, and local flow circulation, while increasing head can promote local submergence and modify these interactions [7,19]. The present results extend these observations by demonstrating that outlet-key curvature itself provides an effective geometric control on energy dissipation.
4.3. Combined Effect of Inlet- and Outlet-Key Modifications on Energy Loss
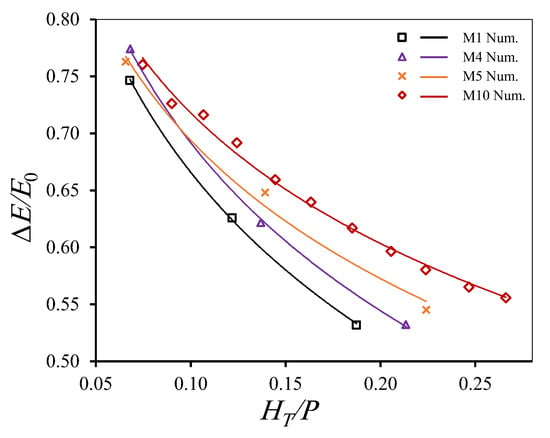
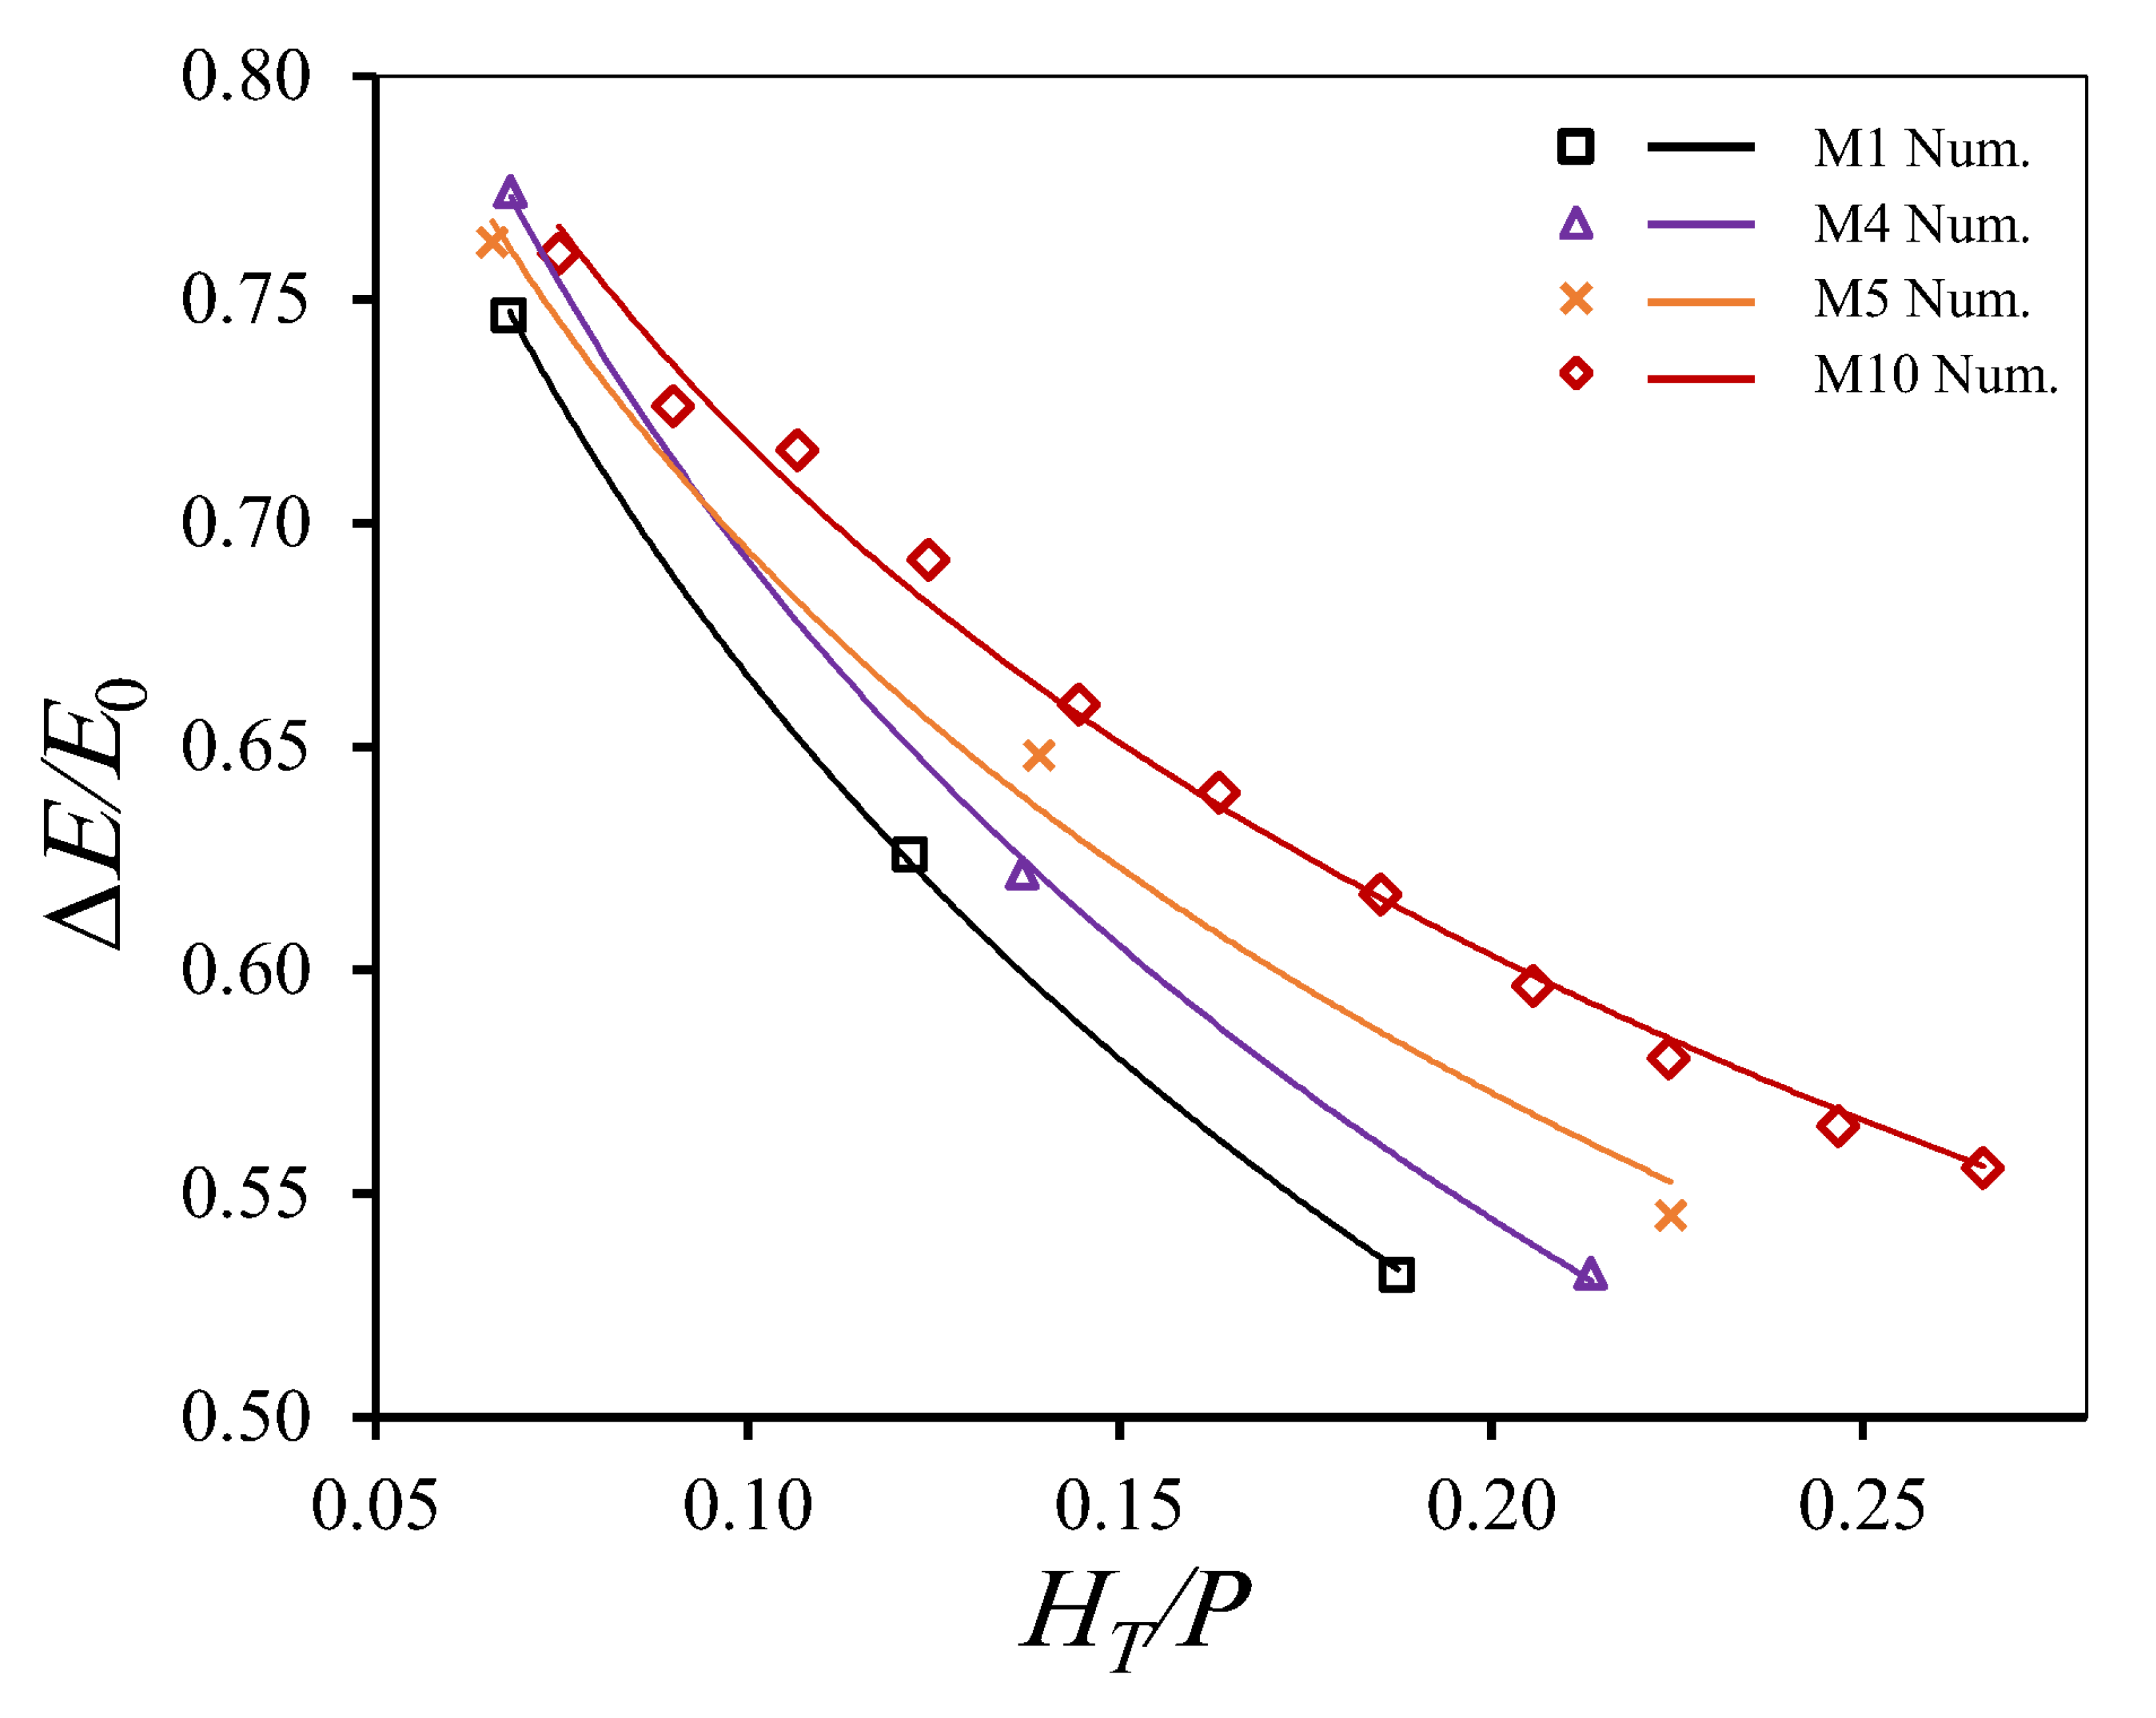
The preceding experimental analyses identify the C-shaped inlet (M4) and C-shaped outlet (M5) as the most effective individual modifications for enhancing relative energy loss. Based on these findings, the two modifications are combined in a new configuration (M10) to examine whether their simultaneous implementation provides additional improvement beyond that achieved by either modification separately. Unlike M1, M4, and M5, which are tested experimentally, M10 is evaluated numerically for 11 discharges (Q = 0.0323–0.1303 m3/s). To ensure a consistent comparison under identical numerical settings, it is compared with the FLOW-3D results of the three validation runs of these configurations rather than with their experimental values, as discussed in Section 3.4. Figure 12 compares the numerical performance of the reference configuration, the two best-performing individual modifications, and the proposed combined configuration.
Figure 12.
Numerical (FLOW-3D) variation of the relative energy loss (ΔE/E0) with the total head ratio (HT/P) for the reference (M1), individually modified (M4 and M5), and combined inlet–outlet modified (M10) configurations.
The numerical predictions show that the combined configuration (M10) consistently produces the highest relative energy loss over the investigated range of HT/P. Based on logarithmic regressions fitted to the numerical results of each configuration, M10 is predicted to increase the relative energy loss compared with M1 by 5.86%, 9.64%, and 14.61% at HT/P = 0.08, 0.12, and 0.18, respectively. Under the same numerical conditions, M4 increases it by 3.65%, 4.07%, and 4.63%, and M5 by 2.81%, 5.54%, and 9.12%, respectively.
The additional benefit of the combined configuration is also evident when M10 is compared directly with the individual modifications. The relative energy loss of M10 exceeds that of M4 by 2.14%, 5.35%, and 9.54%, and that of M5 by 2.97%, 3.89%, and 5.02% at HT/P = 0.08, 0.12, and 0.18, respectively. The increasing advantage of M10 with increasing total head ratio indicates that the combined influence of the C-shaped inlet and outlet becomes progressively more effective under higher-head conditions. This behavior is consistent with previous findings demonstrating the sensitivity of PKW energy dissipation to geometric configuration and the associated flow characteristics [8,26]. The present results extend this understanding by showing that simultaneous modification of inlet- and outlet-key curvature in M10 provides greater energy dissipation than either modification applied individually. This finding, however, is limited to M10, as no other inlet–outlet combinations were examined. It should be noted that the numerical results show a larger improvement for M5 than for M4 at HT/P = 0.12 and 0.18, whereas the experiments show the opposite ranking (Section 4.1 and Section 4.2). This difference is consistent with the underestimation of the downstream energy discussed in Section 3.4, which was larger for M5 than for M4 at these head ratios. Nevertheless, both datasets show that M4 and M5 enhance energy dissipation relative to M1, and the simulations consistently show the highest relative energy loss for M10.
5. Statistical Regression
To provide a practical relationship for estimating the relative energy loss of the proposed M10 configuration, different regression forms (exponential, power, and logarithmic) are examined using the numerical results. The logarithmic form provides the closest agreement and is consistent with the regressions used for the comparison in Figure 12. Accordingly, the relative energy loss for M10 is expressed by Equation (6):
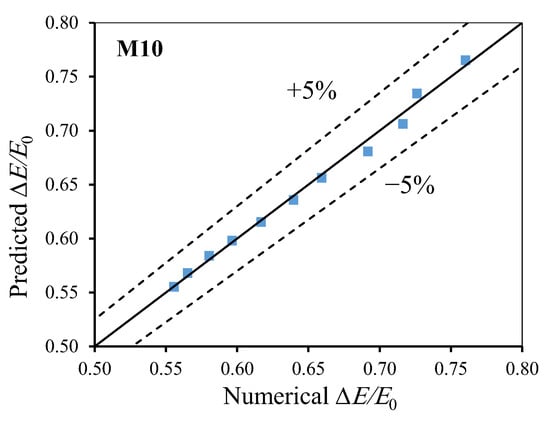
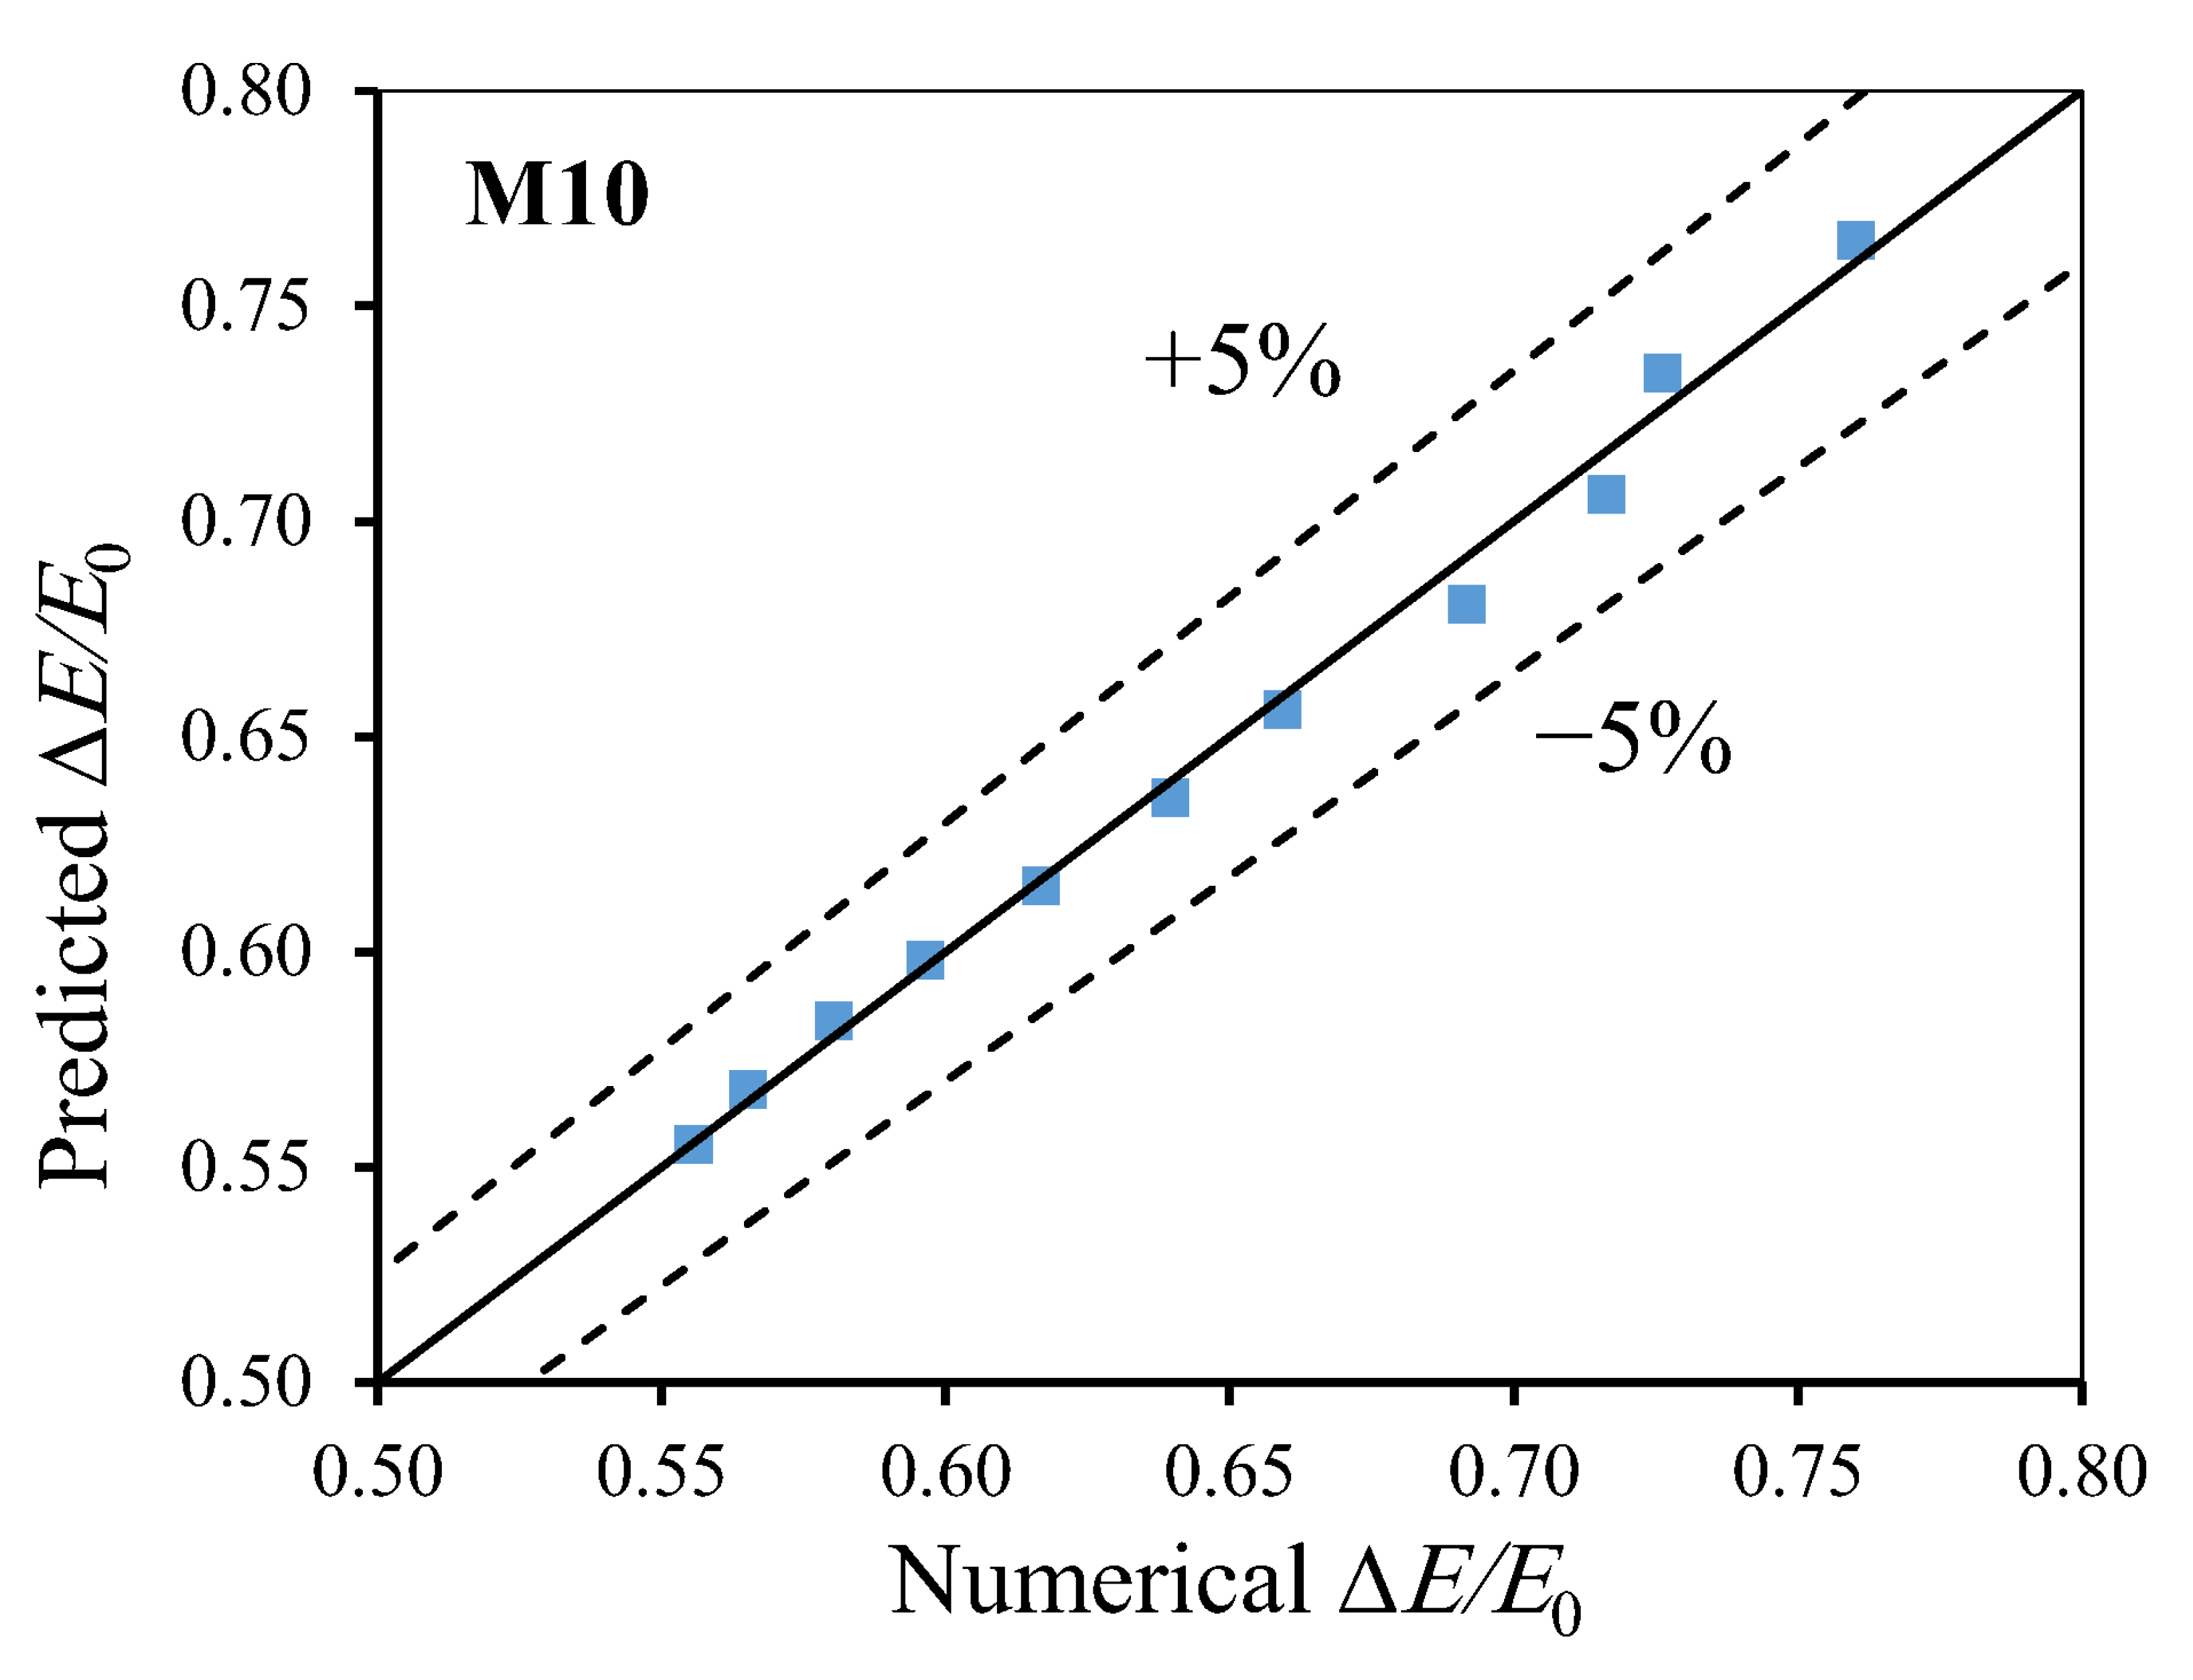
The goodness-of-fit of Equation (6) is assessed by comparing the predicted relative energy-loss values with the corresponding numerical results, as shown in Figure 13. Equation (6) is developed from the 11 numerical runs of M10 covering HT/P = 0.075–0.266, and all predicted values fall within the ±5% deviation limits, with RMSE = 0.0058, MAPE = 0.68%, and R2 = 0.99. Because no independent experimental data are available for M10, the predictive capability of the relationship is assessed by leave-one-out cross-validation, in which each run is predicted using the relationship refitted to the remaining ten runs. This yields RMSE = 0.0072, MAPE = 0.85%, and a maximum deviation of 1.71%, indicating that the relationship is not sensitive to any individual data point. However, this cross-validation is an internal check based on the same numerical dataset and does not replace independent experimental validation, which is recommended for future work. Equation (6) is therefore applicable only to the M10 geometry under free-flow conditions within the investigated range of HT/P = 0.075–0.266.
Figure 13.
Comparison between the predicted and corresponding numerical values of relative energy loss for M10 with ±5% deviation limits.
6. Conclusions
This study investigates the influence of inlet- and outlet-key geometry on the energy dissipation performance of PKWs through a combined experimental and numerical approach. Nine configurations (M1–M9) are experimentally examined under free-flow conditions, while a three-dimensional FLOW-3D HYDRO model is validated against the experimental measurements and subsequently used to evaluate a proposed combined configuration (M10). Based on the obtained results, the following main conclusions are drawn:
- The relative energy loss decreases with increasing total head ratio for all experimentally investigated configurations. At low relative heads, approximately 71–74% of the upstream specific energy is dissipated, whereas this proportion decreases to approximately 46–52% toward the upper end of the investigated range. This confirms that the energy dissipation efficiency of the PKW is greatest under relatively low-head conditions.
- Inlet-key geometry has a pronounced effect on energy dissipation. Among the inlet-modified configurations, the C-shaped inlet (M4) provides the greatest enhancement relative to the reference configuration (M1), increasing the relative energy loss by 4.96%, 8.28%, and 12.80% at HT/P = 0.08, 0.12, and 0.18, respectively. In contrast, the inverted C-shaped inlet (M2) reduces the relative energy loss by 1.07%, 2.00%, and 3.27% at the corresponding head ratios, demonstrating that the hydraulic effect depends not only on introducing curvature but also on its geometric orientation.
- Outlet-key modification also improves the energy dissipation performance, although the magnitude of improvement varies considerably among the investigated geometries. The C-shaped outlet (M5) is the most effective outlet modification, providing increases of 3.19%, 5.34%, and 8.27% relative to M1 at HT/P = 0.08, 0.12, and 0.18, respectively. The remaining outlet modifications provide comparatively smaller improvements, with the inverted S-shaped outlet (M7) producing only marginal changes.
- The FLOW-3D HYDRO model reproduces the measured total head and upstream specific energy with high accuracy, with all points within ±5% and MAPE values of 1.50% and 0.19%, respectively. The downstream specific energy is underestimated (MAPE = 9.11%) because the outflow boundary does not reproduce the tailwater conditions of the laboratory flume. This results in a systematic overestimation of the relative energy loss (MAPE = 6.70%), with all values within ±15% of the measurements. Accordingly, M10 is compared with the numerically simulated configurations under identical conditions.
- The numerically proposed M10, which combines the C-shaped inlet of M4 with the C-shaped outlet of M5, is predicted to increase the relative energy loss over the numerically simulated M1 by 5.86%, 9.64%, and 14.61% at HT/P = 0.08, 0.12, and 0.18, respectively, and to exceed M4 by 2.14%, 5.35%, and 9.54% and M5 by 2.97%, 3.89%, and 5.02% at the same head ratios. For the examined M10 geometry, simultaneous inlet–outlet curvature modification therefore provides greater energy dissipation than modifying either key region individually.
- A logarithmic relationship is developed from 11 numerical runs to represent the relative energy loss of the proposed M10 configuration, with RMSE = 0.0058, MAPE = 0.68%, and R2 = 0.99, while leave-one-out cross-validation yields a MAPE of 0.85%. The relationship applies only to the M10 geometry within HT/P = 0.075–0.266 and requires independent experimental validation.
Overall, the findings identify inlet- and outlet-key curvature as effective geometric parameters for controlling PKW energy dissipation. Among the investigated configurations, the combined C-shaped inlet–outlet geometry (M10) provides the greatest improvement and may be considered a promising alternative when enhanced energy dissipation is a primary hydraulic objective. This result, however, is limited to the single combined configuration examined and is based on numerical predictions only. Experimental verification of M10, together with the assessment of other inlet–outlet combinations over wider geometric and hydraulic ranges, is recommended before extending the proposed configuration and its relationship to general PKW design applications.
Author Contributions
Conceptualization, M.G.E. and M.Z.; methodology, M.G.E.; validation, M.G.E. and S.A.-F.; formal analysis, M.G.E. and M.Z.; investigation, M.G.E. and M.F.S.; resources, S.A.-F., J.S. and M.F.S.; software, S.A.-F. and M.F.S.; data curation, M.F.S.; writing—original draft preparation, M.G.E.; writing—review and editing, M.G.E., S.A.-F., M.Z., J.S. and M.F.S.; visualization, M.G.E.; supervision, M.G.E., S.A.-F. and M.F.S. All authors have read and agreed to the published version of the manuscript.
Funding
This research received no external funding.
Data Availability Statement
The original contributions presented in the study are included in the article. Further inquiries can be directed to the corresponding authors.
Conflicts of Interest
The authors declare no conflicts of interest.
Abbreviations
The following symbols are used in this paper:
| Q | Discharge over the PKW |
| v | Depth-averaged velocity |
| y | Water depth |
| P | Weir height |
| L | Crest centerline length |
| B | Weir length |
| Bb | Weir base length |
| Bi | Inlet key overhang length |
| Bo | Outlet key overhang length |
| W | Total weir width |
| Wi | Inlet key width |
| Wo | Outlet key width |
| Wi/Wo | Key width ratio |
| Ts | Wall thickness |
| Rc | Centerline curvature radius |
| θ | Arc angle |
| α | Inclination angle of the straight key |
| HT | Total upstream head above the PKW crest |
| HT/P | Total head ratio |
| E0 | Upstream specific energy |
| E1 | Downstream specific energy |
| ΔE | Energy loss |
| ΔE/E0 | Relative energy loss |
| Fr | Froude number |
| n | Manning coefficient |
| ne | Equivalent Manning coefficient |
| RMSE | Root mean square error |
| MAPE | Mean absolute percentage error |
| g | Gravitational acceleration |
References
- Anderson, R.M.; Tullis, B.P. Piano key weir hydraulics and labyrinth weir comparison. J. Irrig. Drain. Eng. 2013, 139, 246–253. [Google Scholar] [CrossRef] [Scilit]
- Norouzi, R.; Daneshfaraz, R.; Ghaderi, A. Investigation of discharge coefficient of trapezoidal labyrinth weirs using artificial neural networks and support vector machines. Appl. Water Sci. 2019, 9, 148. [Google Scholar] [CrossRef] [Scilit]
- Machiels, O.; Pirotton, M.; Archambeau, P.; Dewals, B.; Erpicum, S. Experimental parametric study and design of Piano Key Weirs. J. Hydraul. Res. 2014, 52, 326–335. [Google Scholar] [CrossRef] [Scilit]
- Li, G.; Li, S.; Hu, Y. The effect of the inlet/outlet width ratio on the discharge of piano key weirs. J. Hydraul. Res. 2020, 58, 594–604. [Google Scholar] [CrossRef] [Scilit]
- Shen, X.; Oertel, M. Comparative study of nonsymmetrical trapezoidal and rectangular piano key weirs with varying key width ratios. J. Hydraul. Eng. 2021, 147, 04021045. [Google Scholar] [CrossRef] [Scilit]
- Al-Shukur, A.K.; Al-Khafaji, G.H. Experimental study of the hydraulic performance of piano key weir. Int. J. Energy Environ. 2018, 9, 63–70. [Google Scholar]
- Eslinger, K.R.; Crookston, B.M. Energy dissipation of type a piano key weirs. Water 2020, 12, 1253. [Google Scholar] [CrossRef] [Scilit]
- Singh, D.; Kumar, M. Energy dissipation of flow over the type-B piano key weir. Flow Meas. Instrum. 2022, 83, 102109. [Google Scholar] [CrossRef] [Scilit]
- Roushangar, K.; Majedi-Asl, M.; Shahnazi, S. Hydraulic performance of PK weirs based on experimental study and kernel-based modeling. Water Resour. Manag. 2021, 35, 3571–3592. [Google Scholar] [CrossRef] [Scilit]
- Bekheet, A.A.; AboulAtta, N.M.; Saad, N.Y.; El-Molla, D.A. Effect of the shape and type of piano key weirs on the flow efficiency. Ain Shams Eng. J. 2022, 13, 101620. [Google Scholar] [CrossRef] [Scilit]
- Behroozi, A.M.; Vaghefi, M. Experimental and numerical study of the effect of zigzag crests with various geometries on the performance of A-type piano key weirs. Water Resour. Manag. 2022, 36, 4517–4533. [Google Scholar] [CrossRef] [Scilit]
- Shen, X.; Oertel, M. Influence of piano key weir crest shapes on flow characteristics, scale effects, and energy dissipation for in-channel application. J. Hydraul. Eng. 2023, 149, 04023010. [Google Scholar] [CrossRef] [Scilit]
- Singh, D.; Kumar, M. Study of the energy dissipation over the type-A piano key weir. KSCE J. Civ. Eng. 2023, 27, 1568–1584. [Google Scholar] [CrossRef] [Scilit]
- Iqbal, M.; Ghani, U. Effect of Variation in Key Slope Ratios and Key Width Ratios on Energy Dissipation Over a Piano Key Weir. Iran. J. Sci. Technol. Trans. Civ. Eng. 2024, 48, 2725–2739. [Google Scholar] [CrossRef] [Scilit]
- Rdhaiwi, A.Q.; Khoshfetrat, A.; Fathi, A. Experimental Comparison of Flow Energy Loss in Type-B and-C Trapezoidal Piano Key Weirs (PKWS). J. Eng. Sustain. Dev. 2024, 28, 55–64. [Google Scholar] [CrossRef] [Scilit]
- Sohrabzadeh Anzani, H.; Ghodsian, M.; Kantoush, S.A. Energy loss prediction and analysis for rectangular, triangular, and trapezoidal piano key weirs. AQUA—Water Infrastruct. Ecosyst. Soc. 2025, 74, 596–625. [Google Scholar]
- Mirkhorli, P.; Ghaderi, A.; Mohammadnezhad, H.; Mohammadi, M.; Kisi, O. Hydraulic behavior and energy dissipation in Piano key weirs vs. Rectangular labyrinth weirs: A comparative study. Flow Meas. Instrum. 2025, 102, 102830. [Google Scholar] [CrossRef] [Scilit]
- Ghaderi, A.; Daneshfaraz, R.; Dasineh, M.; Di Francesco, S. Energy dissipation and hydraulics of flow over trapezoidal–triangular labyrinth weirs. Water 2020, 12, 1992. [Google Scholar] [CrossRef] [Scilit]
- Shen, X.; Oertel, M. Energy Dissipation and Flow Regime Downstream of Trapezoidal Piano Key Weirs. In Proceedings of the 9th International Symposium on Hydraulic Structures, Roorkee, India, 24–27 October 2022. [Google Scholar]
- Li, Z.; Yang, F.; Han, C.; Fan, Z.; Yu, K.; Han, K.; Wu, J. Investigating the energy dissipation mechanism of piano key weir: An integrated approach using physical and numerical modeling. Water 2024, 16, 2620. [Google Scholar] [CrossRef] [Scilit]
- Besser, L.; Oertel, M. Tailwater influence on downstream flow conditions of piano key weirs. In Proceedings of the 10th International Symposium on Hydraulic Structures (ISHS), Zurich, Switzerland, 17–19 June 2024. [Google Scholar]
- Naghibzadeh, S.M.; Heidarnezhad, M.; Masjedi, A.; Bordbar, A. Experimental and numerical analysis of energy dissipation in piano key weirs with stepped and baffled barriers at downstream slop. Iran. J. Soil Water Res. 2020, 51, 2431–2442. [Google Scholar]
- Farhadi, H.; Moghadam, M.K.; Sabzevari, T.; Noroozpour, S. Study of relative energy dissipation of trapezoidal and arced piano key weirs equipped with baffles. Water Supply 2023, 23, 80–93. [Google Scholar] [CrossRef] [Scilit]
- Abdi Chooplou, C.; Kahrizi, E.; Fathi, A.; Ghodsian, M.; Latifi, M. Baffle-enhanced scour mitigation in rectangular and trapezoidal piano key weirs: An experimental and machine learning Investigation. Water 2024, 16, 2133. [Google Scholar] [CrossRef] [Scilit]
- Fathi, A.; Khoshfetrat, A.; Talebipour, F.; Saadat, M. Influence of rigid vegetation on flow energy dissipation downstream of type B trapezoidal piano key weirs. Innov. Infrastruct. Solut. 2025, 10, 374. [Google Scholar] [CrossRef] [Scilit]
- Selim, T.; Hamed, A.K.; Elkiki, M.; Eltarabily, M.G. Numerical investigation of flow characteristics and energy dissipation over piano key and trapezoidal labyrinth weirs under free-flow conditions. Model. Earth Syst. Environ. 2024, 10, 1253–1272. [Google Scholar] [CrossRef] [Scilit]
- Eltarabily, M.G.; Hamed, A.K.; Elkiki, M.; Selim, T. Hydraulic assessment of different types of piano key weirs. ISH J. Hydraul. Eng. 2025, 31, 8–31. [Google Scholar] [CrossRef] [Scilit]
- Singh, D.; Kumar, M. Computation of energy dissipation across the type-A piano key weir by using gene expression programming technique. Water Supply 2022, 22, 6715–6727. [Google Scholar] [CrossRef] [Scilit]
- Singh, D.; Kumar, M. Gene expression programming for computing energy dissipation over type-B Piano Key Weir. Renew. Energy Focus 2022, 41, 230–235. [Google Scholar] [CrossRef] [Scilit]
- Shaheen, M.F.; Abdel-Fattah, S.; Zeleňáková, M.; Selín, J.; Elbagoury, M.G. Influence of Inlet- and Outlet-Key Configurations on the Discharge Coefficient and Crest Discharge Distribution of Type-A Piano Key Weirs. Water 2026, 18, 2109. [Google Scholar] [CrossRef] [Scilit]
- Chow, V.T. Open-Channel Hydraulics; McGraw-Hill: New York, NY, USA, 1959. [Google Scholar]
- Safarzadeh, A.; Noroozi, B. 3D hydrodynamics of trapezoidal piano key spillways. Int. J. Civ. Eng. 2017, 15, 89–101. [Google Scholar] [CrossRef] [Scilit]
- Crookston, B.M.; Anderson, R.M.; Tullis, B.P. Free-flow discharge estimation method for Piano Key weir geometries. J. Hydro-Environ. Res. 2018, 19, 160–167. [Google Scholar] [CrossRef] [Scilit]
- Chahartaghi, M.K.; Nazari, S.; Shooshtari, M.M. Experimental and numerical simulation of arced trapezoidal piano key weirs. Flow Meas. Instrum. 2019, 68, 101576. [Google Scholar] [CrossRef] [Scilit]
- Ghanbari, R.; Heidarnejad, M. Experimental and numerical analysis of flow hydraulics in triangular and rectangular piano key weirs. Water Sci. 2020, 34, 32–38. [Google Scholar] [CrossRef] [Scilit]
- Carrillo, J.M.; Matos, J.; Lopes, R. Numerical modeling of free and submerged labyrinth weir flow for a large sidewall angle. Environ. Fluid Mech. 2020, 20, 357–374. [Google Scholar] [CrossRef] [Scilit]
- Hirt, C.W.; Nichols, B.D. Volume of fluid (VOF) method for the dynamics of free boundaries. J. Comput. Phys. 1981, 39, 201–225. [Google Scholar] [CrossRef] [Scilit]
- Ghaderi, A.; Daneshfaraz, R.; Abbasi, S.; Abraham, J. Numerical analysis of the hydraulic characteristics of modified labyrinth weirs. Int. J. Energy Water Resour. 2020, 4, 425–436. [Google Scholar] [CrossRef] [Scilit]
- Bayon, A.; Valero, D.; García-Bartual, R.; Vallés-Morán, F.J.; López-Jiménez, P.A. Performance assessment of OpenFOAM and FLOW-3D in the numerical modeling of a low Reynolds number hydraulic jump. Environ. Model. Softw. 2016, 80, 322–335. [Google Scholar] [CrossRef] [Scilit]



Disclaimer/Publisher’s Note: The statements, opinions and data contained in all publications are solely those of the individual author(s) and contributor(s) and not of MDPI and/or the editor(s). MDPI and/or the editor(s) disclaim responsibility for any injury to people or property resulting from any ideas, methods, instructions or products referred to in the content. |
© 2026 by the authors. Licensee MDPI, Basel, Switzerland. This article is an open access article distributed under the terms and conditions of the Creative Commons Attribution (CC BY) license.