


Abstract
The Shitalakshya River, a heavily stressed peri-urban system in Bangladesh, was assessed using high-resolution in situ sensors, phytoplankton analysis, and multiple pollution indicators. Ten stations within the lower Shitalakshya River were sampled during a single pre-monsoon campaign, comprising four upstream, two midstream, and four downstream stations within the surveyed reach. The assessment covered water quality, trophic status, metal contamination, microplastic abundance, and phytoplankton community characteristics. Dissolved oxygen declined from 6.13 to 5.19 mg L−1 downstream, while ammonia (1.33 mg L−1) and chlorophyll-a (6.4 μg L−1) peaked at SR-07. A phosphate-based modified TRIX ranged from 5.25 to 7.48 under a chemical-species mass assumption and 6.18–8.12 under an elemental N/P assumption, with higher downstream values under both conventions. Carlson’s chlorophyll-based scores ranged from 35.21 to 48.81, while estimated-transparency scores were interpreted separately as an optical diagnostic. Dissolved Cd reached 0.804 mg L−1 at SR-05, with elevated metal indices identifying SR-05–SR-06 as a potential contamination hotspot; however, these exceptionally high Cd concentrations require confirmation through replicate sampling and independent analytical verification. Mean microplastic abundance was highest at SR-09 (80 particles L−1). Shannon diversity was lowest at SR-06 (H′ = 1.55) and highest at SR-07 (H′ = 3.35). The phytoplankton quality index (PQI) and clustering suggested three station groups with contrasting chemical and biological profiles. These classifications remain exploratory because the PQI thresholds and station groupings lack independent validation. The combined assessment identifies priorities for targeted follow-up monitoring, but does not establish pollutant-specific biological causation, seasonal persistence, or whole-river ecological condition.
1. Introduction
Urban and peri-urban rivers surrounding Dhaka receive industrial effluents and municipal and domestic wastewater, contributing to deterioration of water quality and multiple forms of contamination [1,2]. The Dhaka metropolitan area is encircled by several rivers—including the Turag, Buriganga, Dhaleswari, Balu, Shitalakshya, and Tongi Khal—that form a network of peripheral waterways receiving various forms of pollution from nearby residential and industrial zones [1,3,4]. In the context of managing water resources, the situation remains critical in developing regions of the world. Bangladesh is a region whose environmental and economic resources are largely dependent on the overall condition of its natural water resources [5,6]. River erosion, soil erosion, loss of soil fertility, and the application of pesticides have also been established as sources of river pollution [7]. River pollution in the urban regions of this developing nation has assumed the character of a critical factor concerning the overall environment, given the large rates of population increase, urbanization, and the overall effects of industrialization [1,2].
Previous studies have identified various issues regarding water quality in the context of Bangladesh’s riverine environments, especially concerning the Dhaka region [2,8]. Pia et al. [9] reviewed the existing literature and found that due to large amounts of industrial, municipal, and agricultural wastes, the Shitalakshya River exhibits pollutant concentrations in water quality characterized by low dissolved oxygen (DO), increased physicochemical values, and elevated heavy metal concentrations. Miah et al. [2] revealed that after five decades of alarmingly fast urbanization near Dhaka, the water quality of the peripheral rivers was badly degraded with “almost zero” levels of DO, very high biochemical oxygen demand, critically high water quality index (WQI) and heavy metal pollution index (HPI) values, and significant land use changes rendering the water unsuitable for ecological health or human consumption, thereby hindering the achievement of Sustainable Development Goal 6. Majed and Islam [1] identified and characterized 41 industrial, municipal, and domestic outfalls along Dhaka City’s peripheral rivers, revealing severe contamination by organic pollutants and heavy metals and highlighting ecological risks from urban pollution sources.
Conventional river-monitoring frameworks often remain parameter-centric, emphasizing threshold exceedances for DO, nutrients, or metals in isolation [10,11]. Although those measurements are indispensable, they do not fully capture how complex pollutant mixtures reorganize aquatic communities or how multiple stressors combine to shift ecosystem functioning. As a result, integrated ecological assessment frameworks that couple hydrochemical, biological, and multivariate indicators are now regarded as a necessary progression in river health science.
The Shitalakshya River forms part of the eastern fluvial boundary of the Dhaka metropolitan industrial corridor and functions simultaneously as a navigation route, wastewater receptor, fisheries habitat, and local water resource. Rapid industrialization along the Narayanganj–Demra belt has intensified direct and indirect pollutant loading from textile processing, dyeing, pharmaceuticals, food processing, engineering workshops, and dense mixed urban settlements. Earlier studies have documented water-quality deterioration, elevated heavy metals, and ecological stress in the Shitalakshya system, but most assessments have been compartmentalized by discipline or pollutant type rather than designed as a single integrated ecosystem diagnosis [12,13,14].
River ecosystem health assessment has become a significant factor for measuring the sustainability of river environments in urban centers. In rapidly urbanizing regions such as Dhaka, comprehensive assessment methods have assumed significant importance in understanding the overall impacts of human activities on the aquatic environment [13,15]. The Shitalakshya River, a distributary of the Brahmaputra, has historically been affected by industrial effluents and waste, with many industries on its banks not practicing proper treatment methods [14]. Against this background, the present study provides an exploratory assessment of spatial variation among ten stations within the lower Shitalakshya River during a single pre-monsoon campaign on 7 April 2025. The assessment combines physicochemical observations, pollution indicators, and biological measurements to describe conditions encountered during that campaign and identify priorities for subsequent investigation. The following six objectives were confined to the sampled reach and sampling date: (i) to quantify spatial variation in physicochemical characteristics using high-resolution in situ conductivity–temperature–depth (CTD) sensor technologies; (ii) to characterize nutrient enrichment using a phosphate-based modified TRIX under explicit nutrient-unit assumptions and separate Carlson chlorophyll and estimated-transparency components; (iii) to determine dissolved-metal concentrations and calculate the Heavy Metal Evaluation Index (HEI), HPI, Nemerow Pollution Index (NPI) and corrected degree of contamination; (iv) to characterize phytoplankton community composition and diversity and derive a phytoplankton quality index (PQI) based on principal component analysis (PCA); (v) to quantify microplastic abundance, morphotypes, size classes, and colors among the ten sampled stations; and (vi) to explore associations and station groupings among selected physicochemical variables, metal-contamination indices and phytoplankton metrics using correlation and hierarchical-clustering analyses.
2. Materials and Methods
2.1. Study Area and Sampling Design
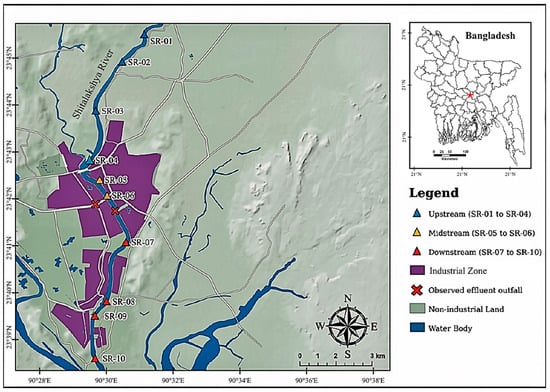
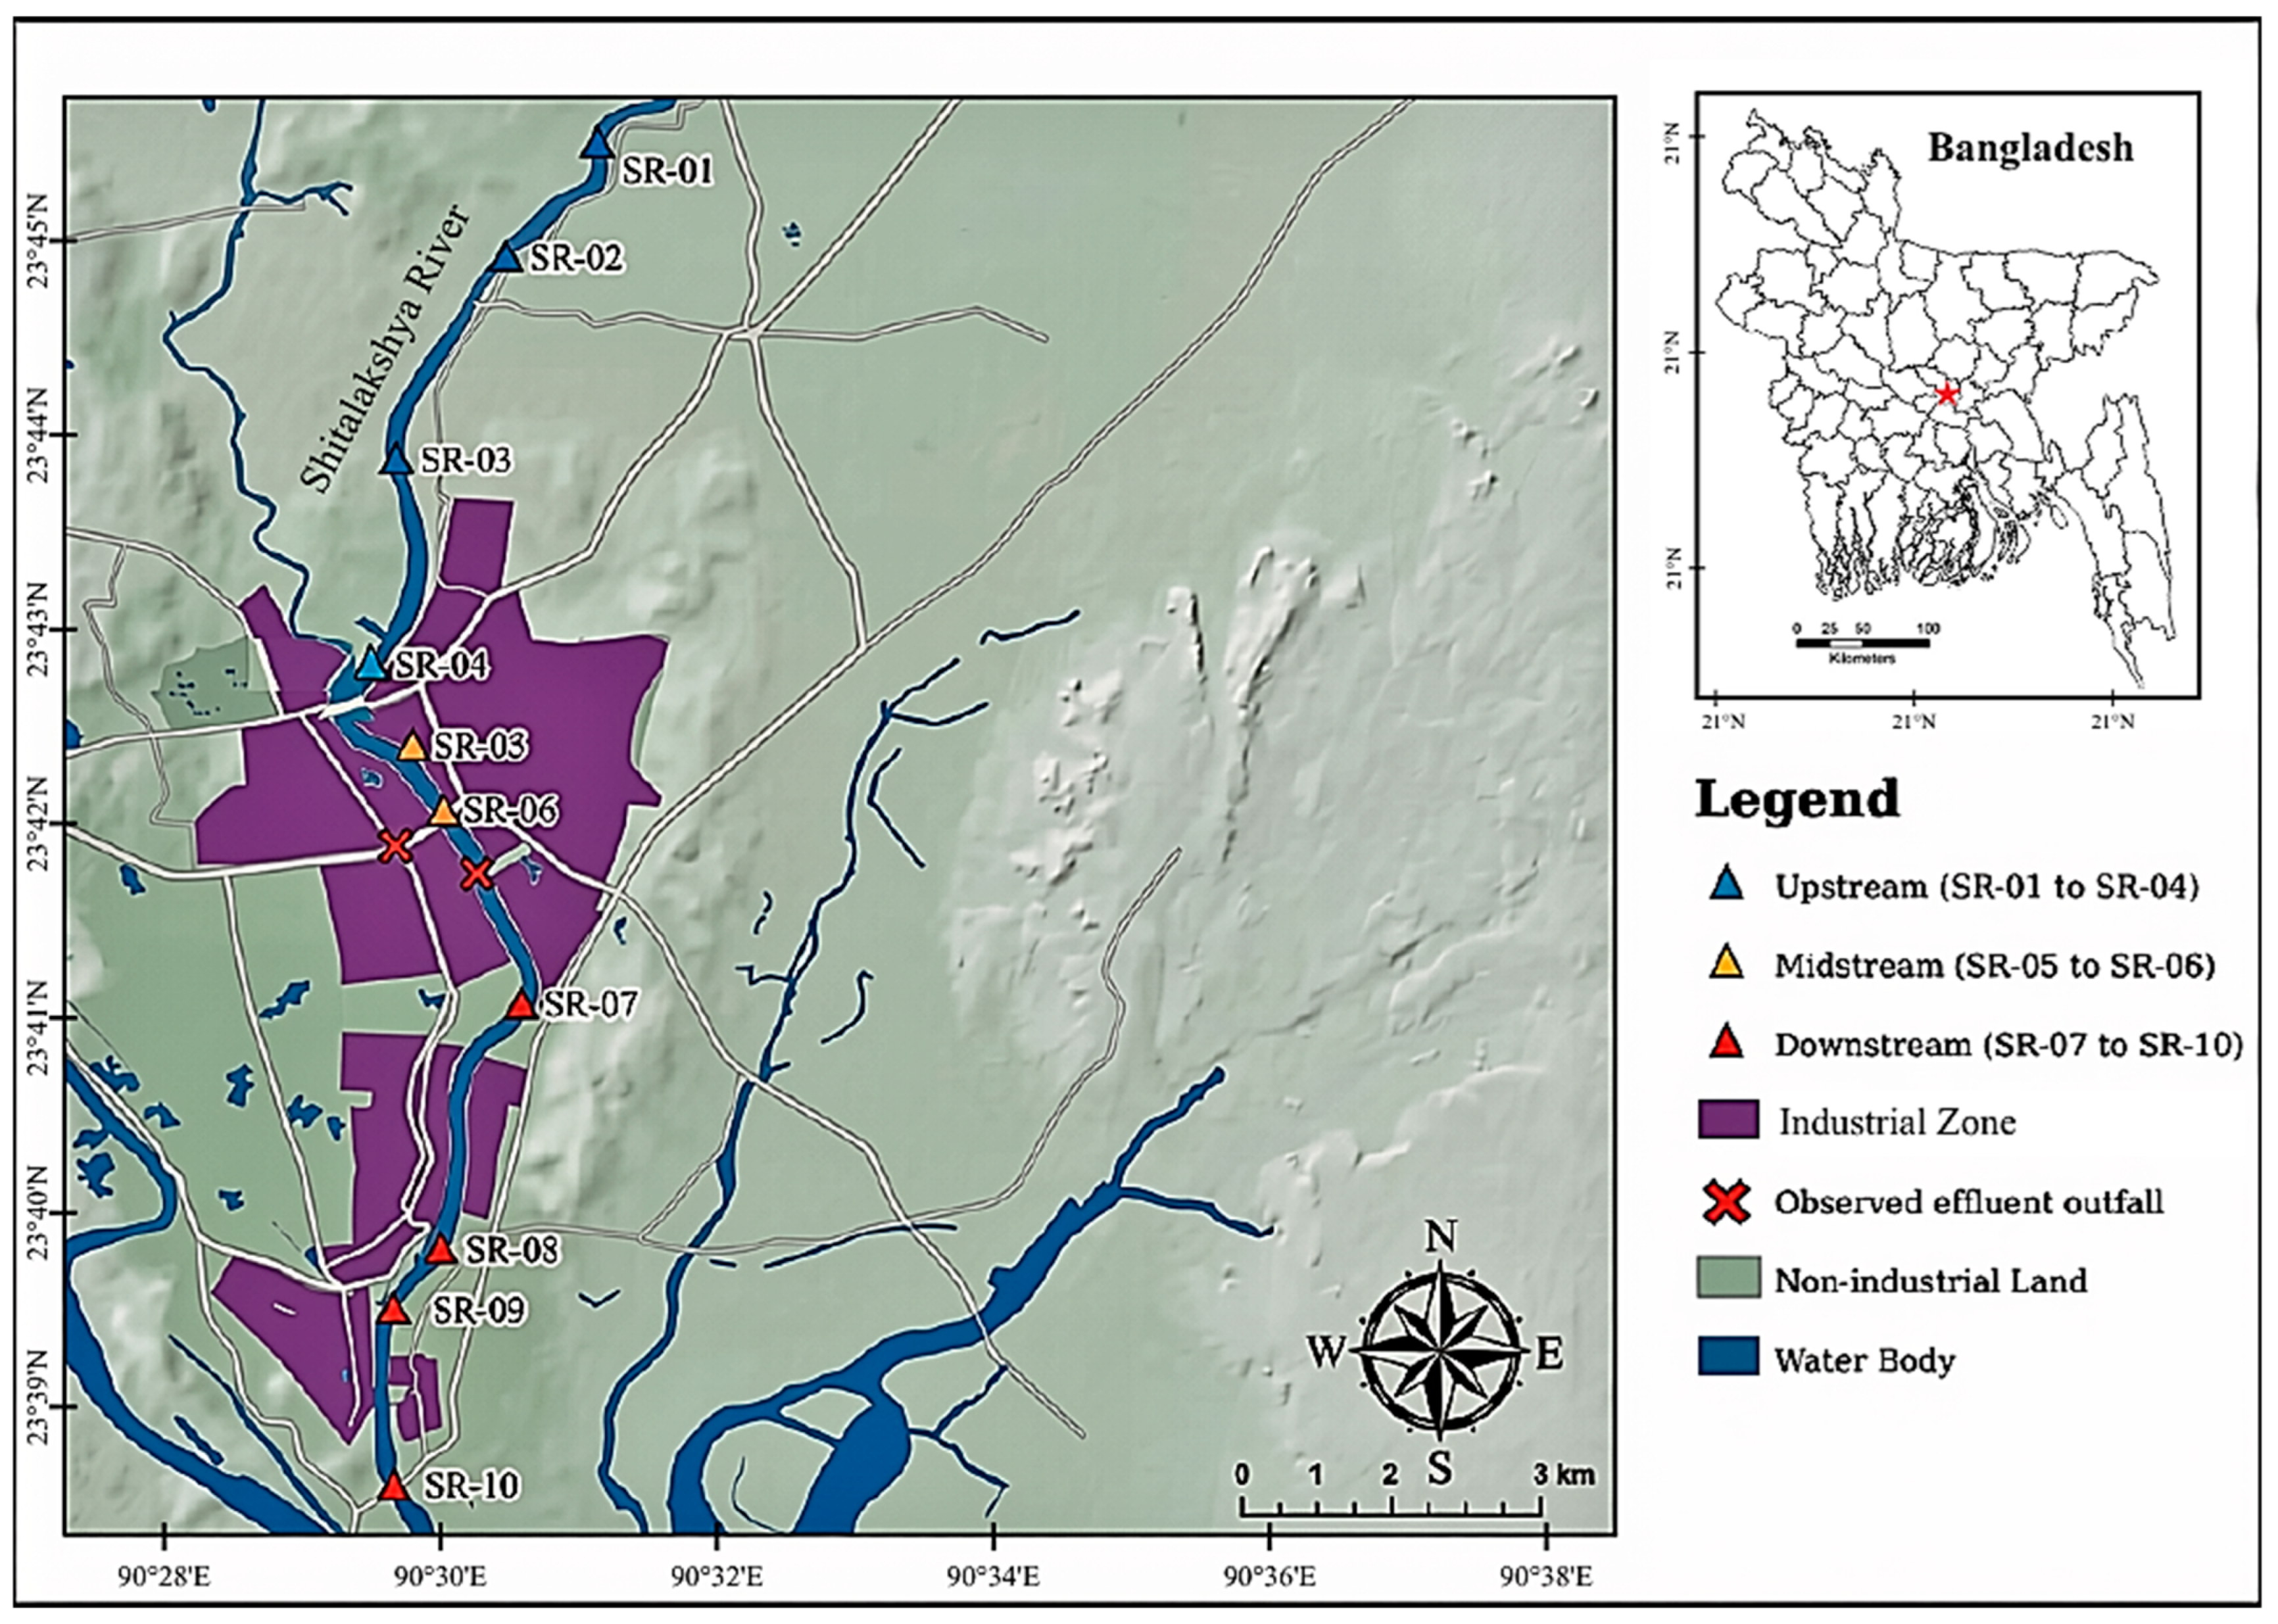
The study surveyed ten stations along a longitudinal transect within the lower Shitalakshya River, Bangladesh (Figure 1). For spatial description within the sampled reach, SR-01–SR-04 were designated as upstream, SR-05–SR-06 as midstream, and SR-07–SR-10 as downstream. Upstream, midstream, and downstream denote relative longitudinal positions within the surveyed reach, not independently delineated hydrological zones, reference conditions, or pollution classes. Industrial activity was observed near both midstream stations and downstream station SR-07. A verified along-channel transect length and interstation distances were unavailable for reporting.
Figure 1.
Location of the ten sampling stations within the surveyed reach of the lower Shitalakshya River, Bangladesh. Station symbols distinguish the upstream (SR-01–SR-04), midstream (SR-05–SR-06), and downstream (SR-07–SR-10) sectors. Crosses indicate effluent outfalls observed during field sampling at SR-05 and SR-06 and do not represent a comprehensive outfall inventory.
Sampling proceeded in upstream-to-downstream order between 10:15 and 16:45 local time on 7 April 2025. Station-specific sampling times are reported alongside the station-level results in Section 3.8. Because station position changed systematically with sampling time, spatial and within-day variation could not be separated. The early-April sampling window was selected to examine pre-monsoon conditions before the expected seasonal increase in freshwater discharge and dilution. This selection reflected the intention to investigate pollutant concentrations and associated biological patterns during that seasonal window; it did not establish that the campaign captured minimum discharge or annual maximum contamination. The survey therefore provides a single-day comparison among stations rather than a characterization of seasonal or annual river conditions.
Industrial activity occurred near the midstream stations and downstream station SR-07; therefore, the sector designations do not represent mutually exclusive land-use categories. Two effluent outfalls observed during field sampling at SR-05 and SR-06 are marked in Figure 1. These symbols identify observed discharge locations rather than additional sampling stations. The observations were not a systematic outfall inventory, and the two mapped locations should not be interpreted as the only outfalls operating along the surveyed reach.
2.2. In Situ Water-Quality Profiling and Fluorometric Measurements
Surface-water physicochemical measurements were obtained at each station using a calibrated HANNA HI98194 multiparameter meter (Hanna Instruments, Inc., Woonsocket, RI, USA). The field suite comprised pH, oxidation–reduction potential (ORP), DO, percent DO saturation, salinity, temperature, total dissolved solids (TDS), electrical conductivity (EC), and turbidity. Measurements were taken at approximately 0.3 m below the surface near mid-channel, and station values were used as the principal observations in the longitudinal river analysis.
Vertical hydrochemical profiles were obtained using an RBRmaestro3 CTD profiler (RBR Ltd., Ottawa, ON, Canada) equipped with channels for temperature, salinity, DO, turbidity, chlorophyll-a fluorescence, and photosynthetically active radiation (PAR). At each station, the profiler was lowered to near the riverbed or a maximum depth of 5 m, whichever was reached first. The shallowest bed encountered during profiling was approximately 3 m below the surface. To provide a common depth range for comparisons among stations, the CTD profiles presented in Section 3.3 were cropped to the upper 3 m. This plotting limit does not indicate a uniform river depth, and the full water column was not necessarily sampled at deeper stations. No independent bathymetric survey was conducted.
Algal biomass was further screened with a bbe AlgaeTorch fluorometer (bbe Moldaenke GmbH, Schwentinental, Germany), which provided station-level estimates of total chlorophyll-a and cyanobacteria-related fluorescence. These values were interpreted as a rapid in situ biomass screening layer that complemented but did not replace microscopic taxonomic counts [16].
2.3. Water Sampling, Nutrient Chemistry, Heavy-Metal Analysis, and Microplastics
Surface-water samples were collected for laboratory nutrient and dissolved-metal analyses. Nutrients included ammonia (NH3), nitrate (NO3−), nitrite (NO2−), phosphate (PO43−), and reactive silica (SiO2). Nutrient concentrations were determined spectrophotometrically following Standard Methods for the Examination of Water and Wastewater [17] and are reported in mg L−1. Dissolved heavy metals were measured in filtered, acid-preserved samples by atomic absorption spectrophotometry. Cd, Cr, Fe and Pb were included in the contamination-index calculations. Cu, Ni and Mn were reported below detection at all ten stations and were excluded from these calculations. Nondetects among the included metals were represented numerically by zero during index reconstruction. This substitution produces lower-bound estimates and does not indicate the absence of those metals. Environment Conservation Rules, 2023 (ECR 2023), and World Health Organization (WHO) guideline values were used as comparison frameworks [18,19].
Analytical quality control included analytical blanks, duplicate samples, certified reference materials (National Institute of Standards and Technology (NIST) reference materials 1640 and 1643e), and matrix-spike recovery tests. Spike recoveries ranged from 85% to 95%, and measured reference-material concentrations were within ±10% of their certified values. Samples from SR-05 and SR-06 were each prepared independently in triplicate and analyzed using the same instrument to assess repeatability of the elevated Cd measurements. The reported concentrations, including Cd concentrations of 0.804 mg L−1 at SR-05 and 0.629 mg L−1 at SR-06, incorporate the fivefold dilution correction. The laboratory-reported detection limit was 0.01 mg L−1 for each analyzed metal (Cd, Cr, Fe, Pb, Cu, Ni and Mn), expressed on the original-water concentration basis after accounting for the fivefold dilution.
Three replicate 1 L surface-water samples were collected at each station for microplastic analysis. Samples were processed using wet-peroxide oxidation followed by density separation and stereomicroscopic inspection [20]. The entire filter from each processed sample was examined. Particle counts were expressed per liter of water analyzed, and the three replicate values were averaged to obtain the station-level mean abundance. Particles were characterized by size, morphotype (film, fragment, foam, filament, fiber, and pellet), and color. Overall color and size-class distributions were expressed as percentages by dividing the retained value for each category by the sum of values across its respective categories. Only the averaged results and category summaries remained available for reanalysis; consequently, replicate standard deviations could not be reconstructed. Because polymer identification by Fourier-transform infrared (FTIR) or Raman spectroscopy was not performed, particle identification was visual and did not establish polymer composition. Field blanks underwent the same wet-peroxide oxidation, density separation, filtration, and microscopic examination as the environmental samples. Reported particle abundances were blank-corrected. Contamination precautions included new, acid-washed glassware, gloves and masks, and restricted laboratory access during processing.
2.4. Phytoplankton Microscopy and Ecological Diversity Metrics
Phytoplankton were enumerated microscopically from preserved surface-water samples and grouped into the principal classes represented in the samples: diatoms, chlorophytes, charophytes, cyanobacteria, dinoflagellates, and an ‘others’ category comprising subordinate genera. Community structure was assessed at the station scale using total abundance, taxonomic richness (S), Shannon–Wiener diversity (H′), Pielou evenness (J′), and Margalef richness (Rma′).
Three 5 mL subsamples were withdrawn from each homogenized station sample and examined microscopically. Reported abundance represents the mean of the replicate counts standardized to 100 mL. Taxonomic richness (S) represents the unique taxa recorded across the three subsamples.
2.5. Index Framework and Multivariate Statistics
The indices used in this assessment, their equations, interpretive criteria, and supporting references are summarized in Table 1.
Table 1.
Principal indices, equations, and interpretive purpose used in this study.
Modified TRIX used total chlorophyll-a, absolute oxygen-saturation departure, the summed nitrogen contribution from ammonia, nitrate and nitrite, and phosphate-derived phosphorus rather than measured TP [23]. Nutrient inputs were expressed as µg N L−1 and µg P L−1 under two conditional reporting conventions because the archived mass basis was unresolved. The ammonia definition was also unverified. Carlson’s chlorophyll and estimated-transparency components were calculated separately without averaging. Archived Secchi values matched SD-est = 2.0777 × Turbidity−0·489; these were treated as estimates with unverified local and instrument applicability. Supplementary Data S1 provides all station-level inputs, conversions, assumptions, and code.
The PCA was implemented in Python 3.12.14 using NumPy 2.3.5. The analysis included ten stations and 15 variables representing physicochemical conditions, metal contamination, and phytoplankton characteristics: pH, ORP, DO, temperature, turbidity, NH3, PO4, SiO2, NO3, HEI, NPI, total phytoplankton abundance, Shannon diversity, Pielou evenness, and Margalef richness. The retained variable set combined available station measurements with calculated metal indices and phytoplankton summaries. The latter were recovered from the rounded manuscript table. Metal nondetects were represented by zero when reconstructing HEI and NPI; this constitutes a lower-bound substitution rather than evidence of absence.
Each variable was centered by subtracting its mean and scaled by its population standard deviation across the ten stations. No logarithmic transformation, missing-value imputation, or outlier deletion was applied to the complete analysis matrix. PCA was calculated by singular-value decomposition of the standardized matrix, without rotation.
Components with eigenvalues greater than 1 were retained using the Kaiser criterion [33]. This criterion retains components explaining more variance than an individual standardized variable. It was used as an exploratory rule rather than evidence of an optimal or independently validated component structure. Four components had eigenvalues of 7.7274, 3.0392, 1.3582, and 1.0653, explaining 87.93% of the total variance.
Component interpretation was based on the magnitudes and signs of the eigenvector coefficients and the corresponding station scores. For reproducibility, each component’s sign was oriented so that its largest absolute coefficient was positive. PQI was calculated as the weighted sum of retained component scores, with weights equal to each retained eigenvalue divided by the sum of the four retained eigenvalues. Component coefficients, scores, and sensitivity results are provided in Supplementary Data S1. Given the small number of stations, the component interpretations and PQI classification thresholds remain provisional. Two-sided Pearson correlation tests were performed for all 105 variable pairs, and p-values were adjusted using the Benjamini–Hochberg procedure [34].
2.6. AI Use Statement
During the preparation of this manuscript, the authors used a Generative AI tool to assist with the development and refinement of the Graphical Abstract. The generated output was critically reviewed, modified, and edited by the authors. The authors take full responsibility for the originality, accuracy, and integrity of all content presented in this publication.
3. Results
3.1. Physicochemical Patterns and Water-Quality Status
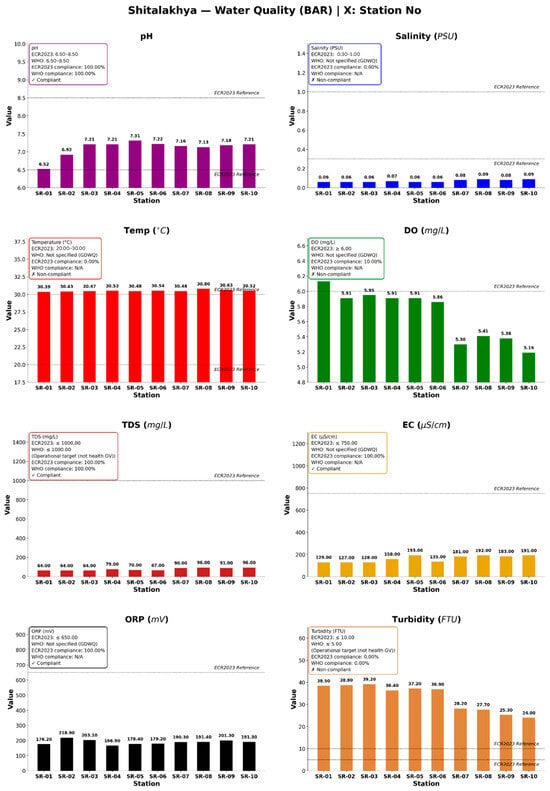
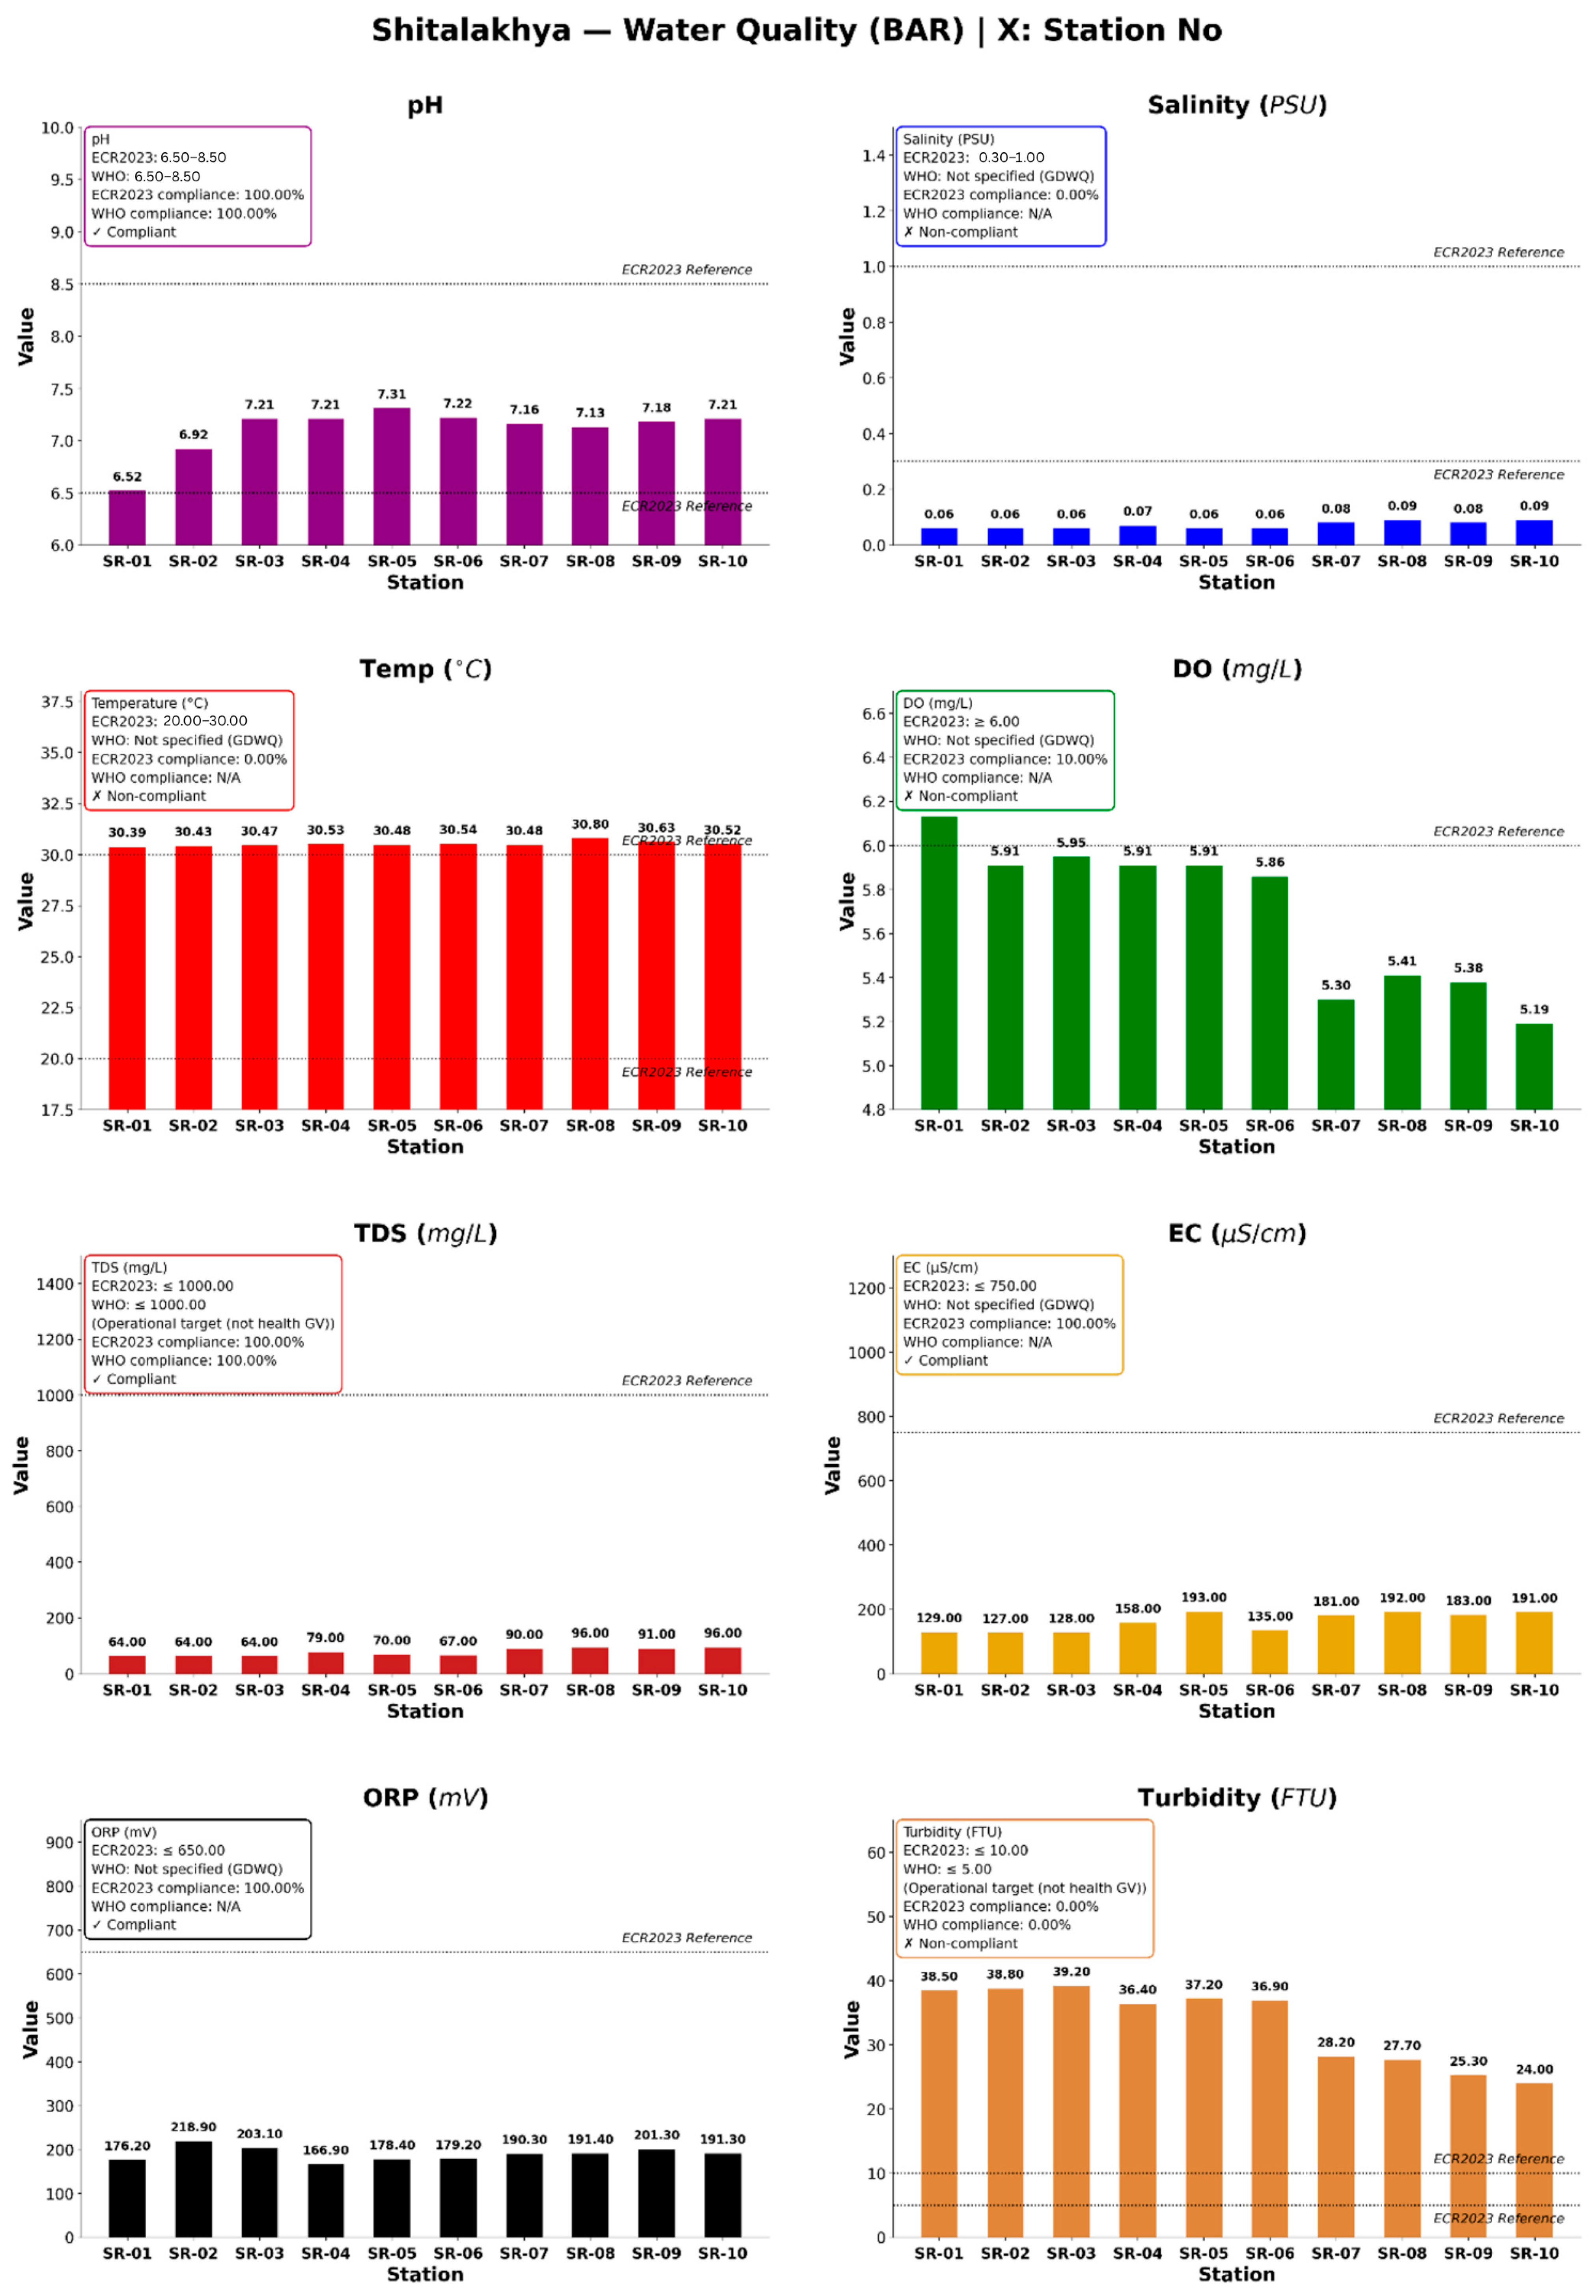
Surface-water physicochemical conditions varied among stations, with lower DO and generally higher EC toward the downstream reach (Figure 2). The water remained circumneutral, with pH ranging from 6.52 at SR-01 to 7.31 at SR-05; all stations fell within the ECR 2023 guideline range of 6.50–8.50. Salinity was consistently very low, varying from 0.06 to 0.09 PSU, confirming predominantly freshwater conditions across the transect. Temperature showed minimal spatial variation, ranging from 30.39 °C at SR-01 to 30.80 °C at SR-08, although all values were slightly above the upper ECR reference of 30 °C. DO exhibited the clearest downstream deterioration, declining from 6.13 mg L−1 at SR-01 to 5.19 mg L−1 at SR-10. Only SR-01 met the 6.0 mg L−1 benchmark, while SR-02–SR-10 remained below this threshold. TDS were comparatively low, increasing from 64 mg L−1 at SR-01–SR-03 to 96 mg L−1 at SR-08 and SR-10, well below the 1000 mg L−1 guideline. EC showed a similar enrichment pattern, ranging from 127 µS cm−1 at SR-02 to 193 µS cm−1 at SR-05, with elevated values also observed at SR-07–SR-10 (181–192 µS cm−1). ORP remained positive throughout, ranging from 166.90 mV at SR-04 to 218.90 mV at SR-02, indicating generally oxidizing conditions. Turbidity was high at all stations, peaking at 39.20 FTU at SR-03 and declining to 24.00 FTU at SR-10; nevertheless, all values exceeded the ECR limit of 10 FTU.
Figure 2.
Station-wise spatial variation in surface physicochemical parameters measured along the Shitalakshya River transect.
3.2. CCME-WQI Calculations
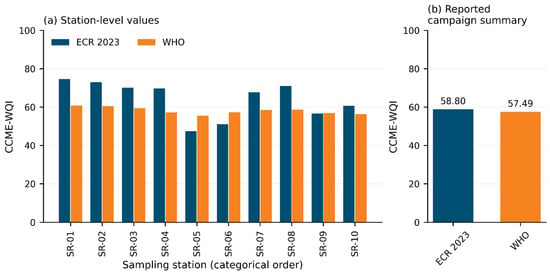
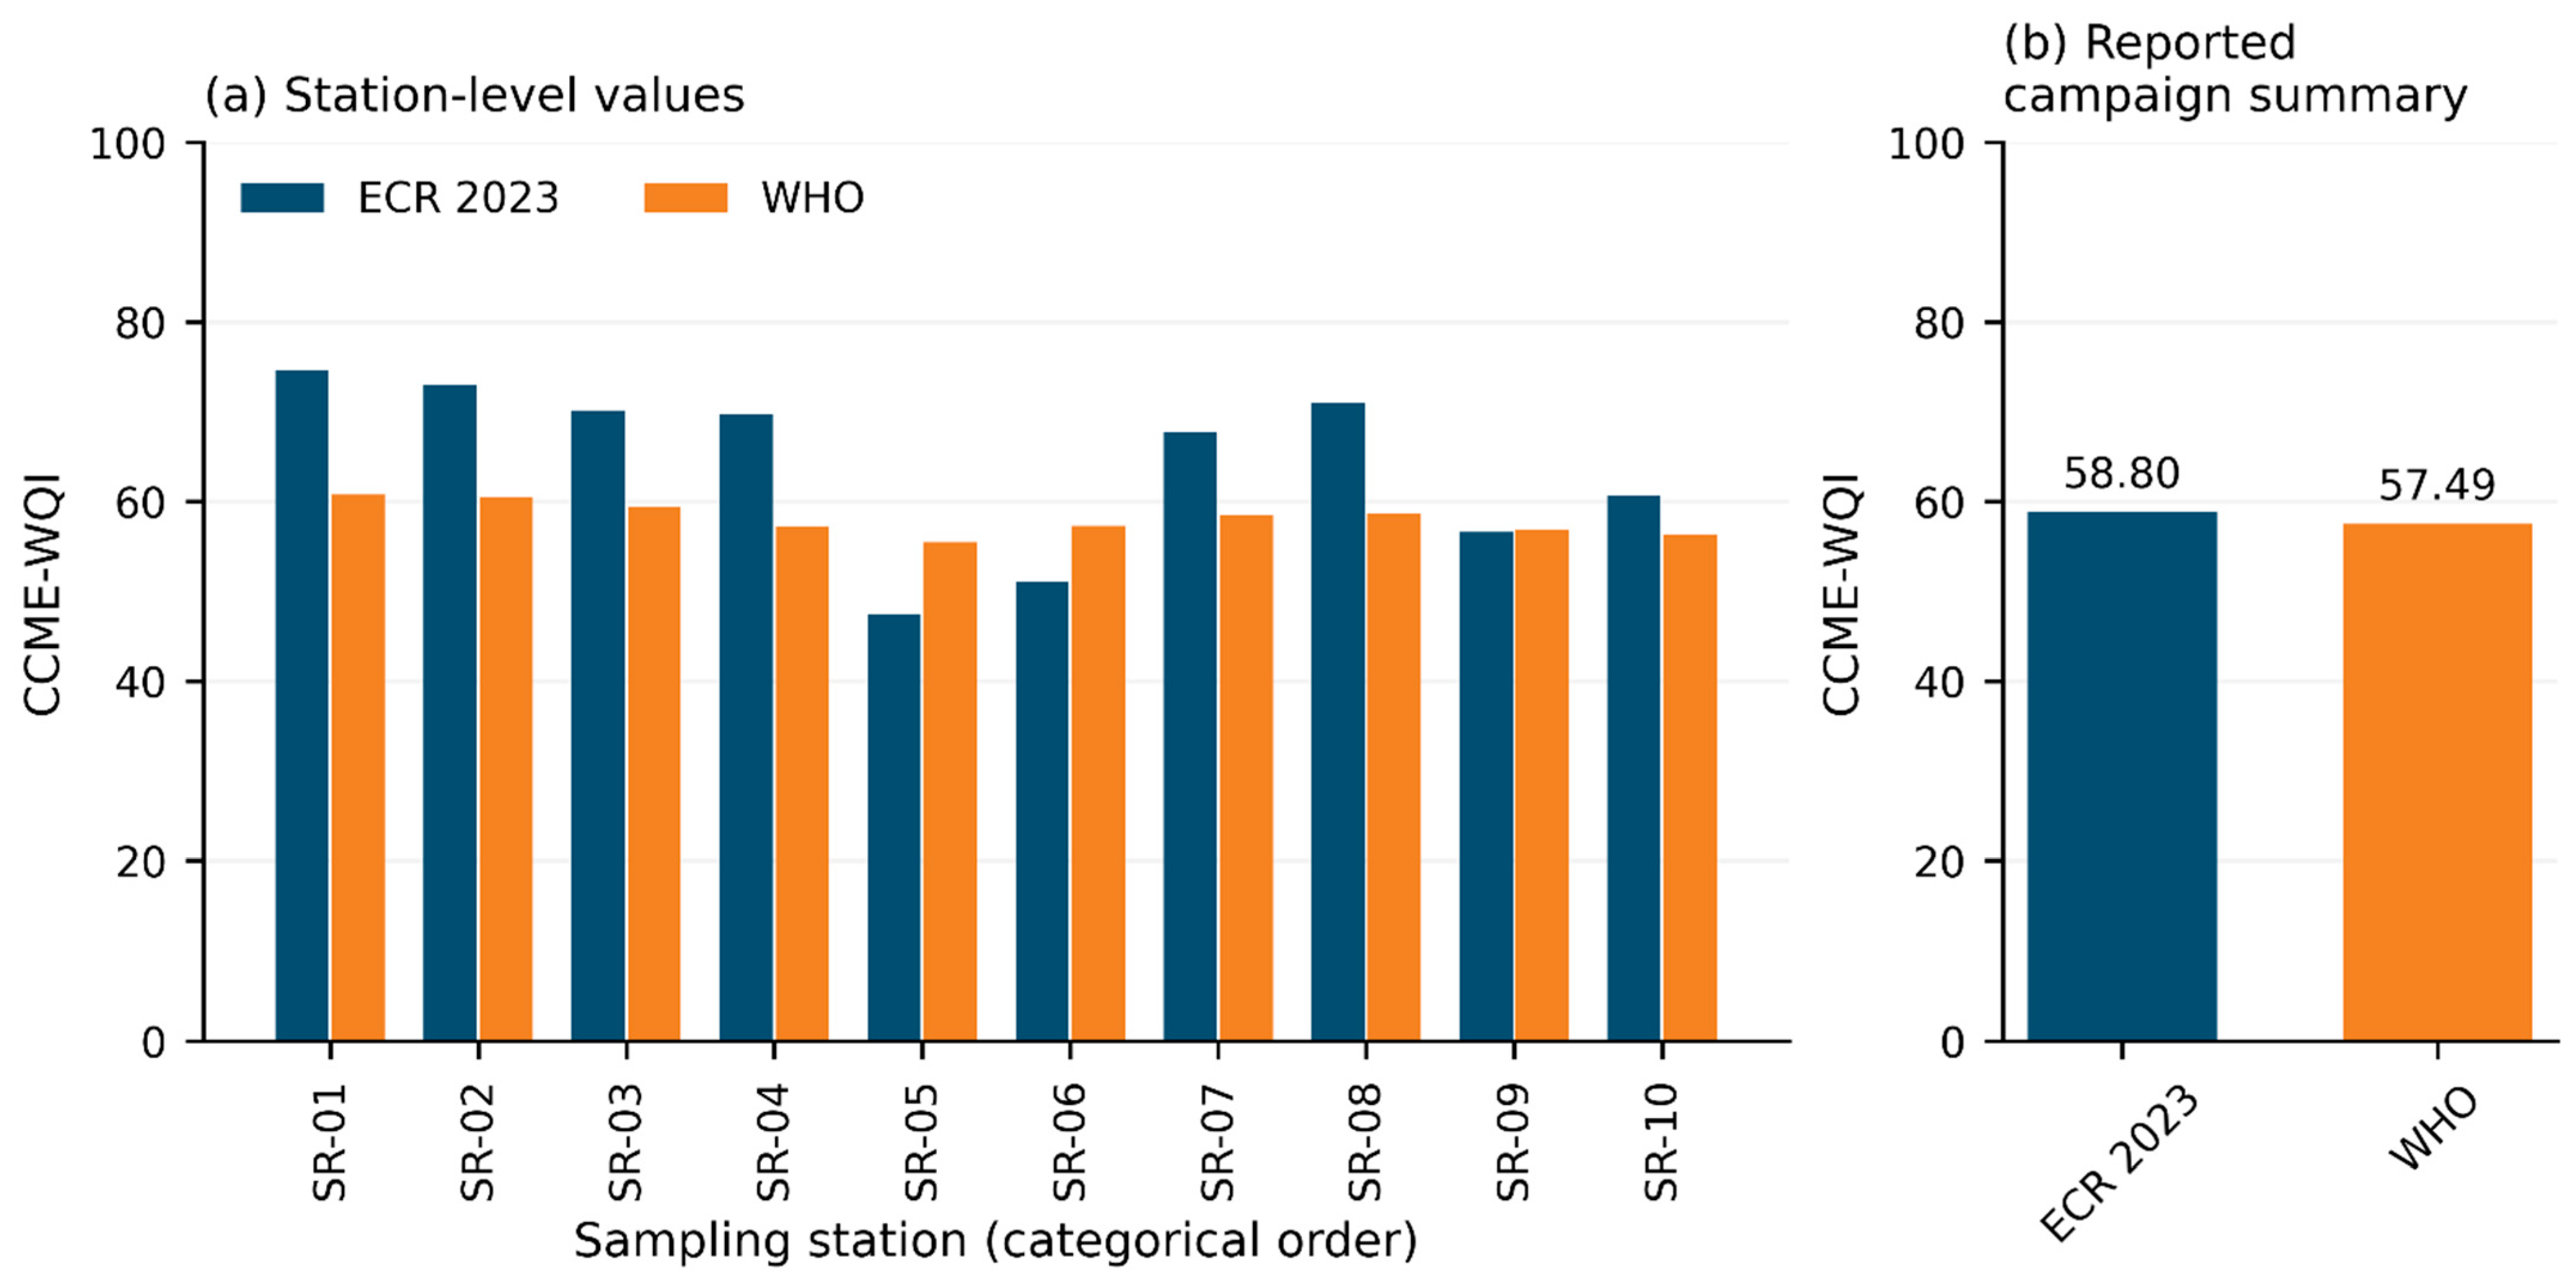
CCME-WQI scores varied among stations and between the two guideline sets (Figure 3). Under ECR 2023 objectives, station-level WQI scores ranged from 47.44 at SR-05 to 74.57 at SR-01, and the overall score was 58.80, placing the river in the marginal class. WHO-based objectives yielded a narrower but consistently marginal range (55.50–60.78; overall 57.49). The lowest ECR-based values occurred at SR-05, SR-06, SR-09, and SR-10, indicating that the industrial corridor and the lower river both contribute meaningfully to system-scale water-quality degradation.
Figure 3.
Station-wise CCME-WQI scores under ECR 2023 and WHO-based objectives. The analysis classified the overall river condition as marginal under both objective sets, although substantial station-to-station variability remained.
3.3. Vertical Hydrochemical Structure from CTD Profiling
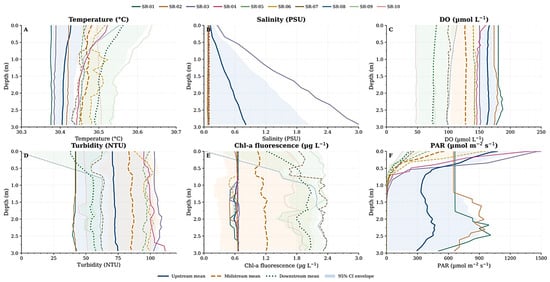
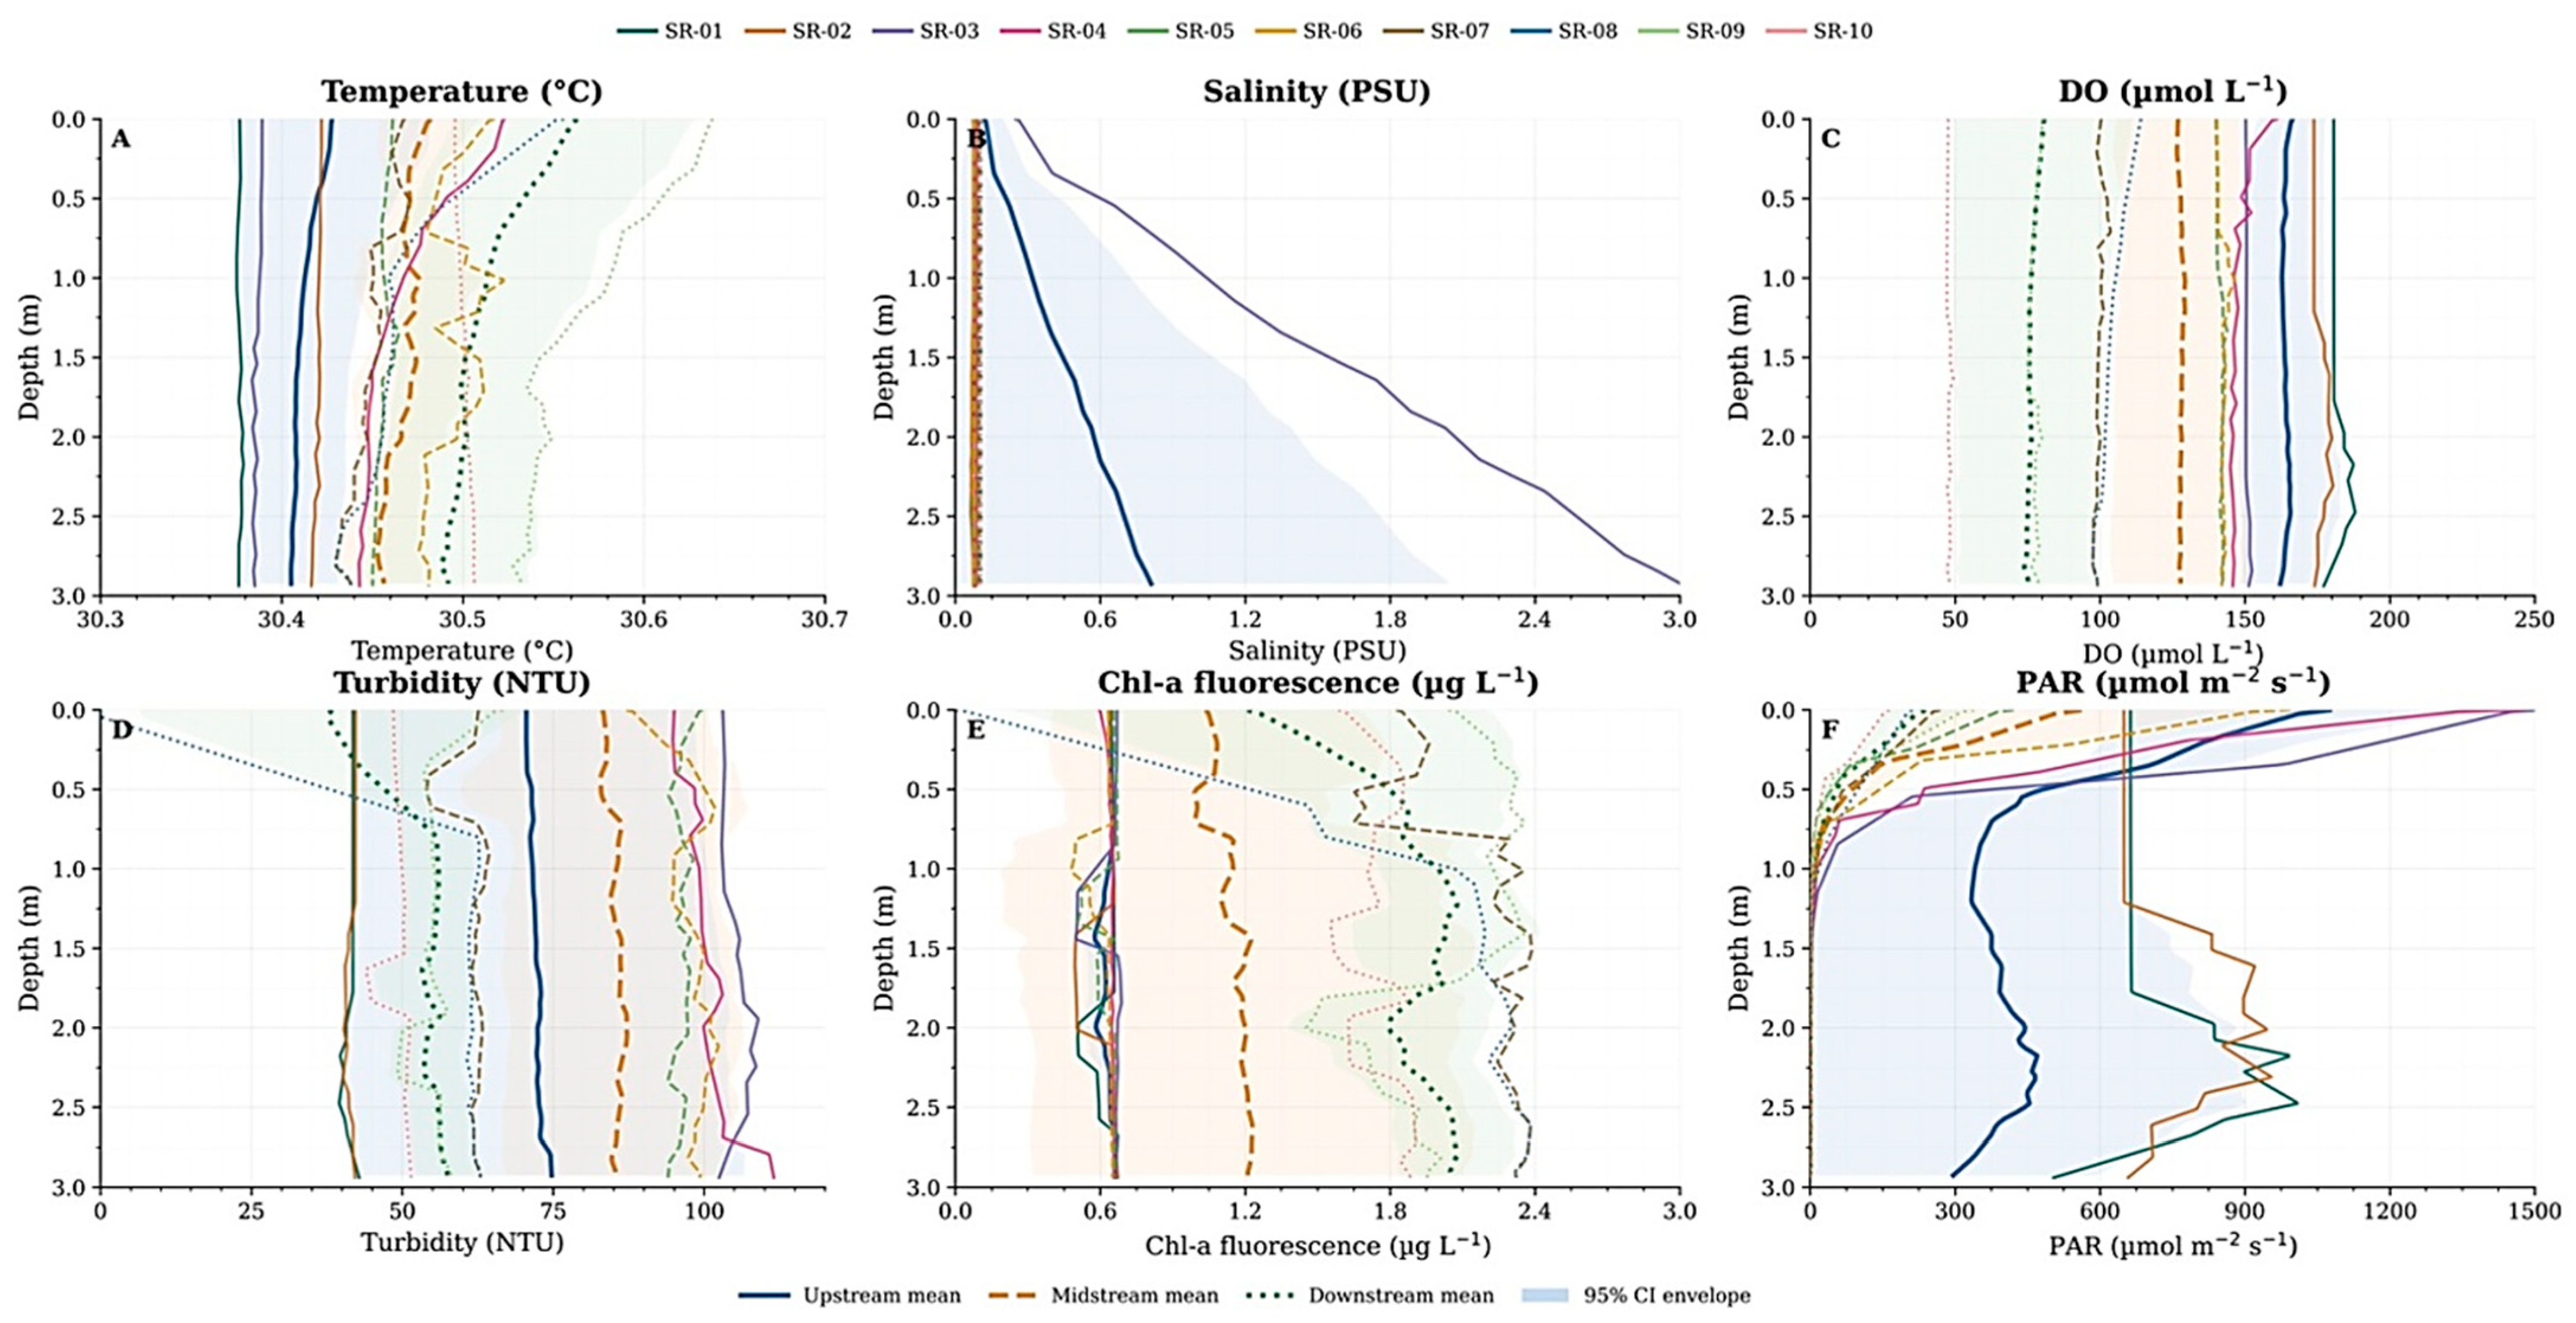
The CTD profiles describe hydrochemical conditions within the upper 3 m of the surveyed stations (Figure 4). Temperature, salinity, DO, and chlorophyll fluorescence exhibited station-specific vertical patterns within this common depth interval. These observations characterize the sampled layer and do not establish the mixing or stratification state of the entire water column at deeper stations. The most diagnostically important CTD feature was a lower-river fluorescence maximum centered on SR-07 and neighboring downstream stations. The profiler images show enhanced chlorophyll fluorescence in the upper-to-mid water column at the bloom hotspot and rapid attenuation of PAR with depth.
Figure 4.
Vertical profiles of hydrochemical parameters at ten sampling stations (SR-01–SR-10): (A) temperature (°C); (B) salinity (PSU); (C) dissolved oxygen (µmol L−1); (D) turbidity (NTU); (E) chlorophyll-a fluorescence (µg L−1); and (F) photosynthetically active radiation (PAR; µmol m−2 s−1). Profiles were cropped to a common upper-water-column interval of 0–3 m for comparison. The 3 m plotting limit corresponds to the shallowest bed encountered during CTD profiling and does not represent the riverbed depth at every station.
3.4. Nutrient Gradients of Shitalakshya River
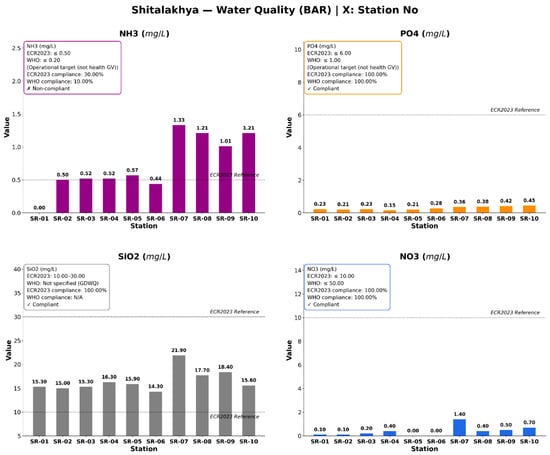
Nutrient concentrations were generally higher in the downstream sector, with ammonia, nitrate, and silica reaching their highest measured concentrations at SR-07 (Figure 5). Ammonia (NH3) increased from 0.00 mg L−1 at SR-01 to 0.50–0.57 mg L−1 at SR-02–SR-05, declined slightly to 0.44 mg L−1 at SR-06, and then rose sharply in the downstream sector, reaching a maximum of 1.33 mg L−1 at SR-07. Concentrations remained high at SR-08 and SR-10 (1.21 mg L−1) and at SR-09 (1.01 mg L−1). Phosphate (PO43−) remained comparatively low but showed a progressive downstream increase. Values ranged from 0.15 mg L−1 at SR-04 to 0.45 mg L−1 at SR-10, with elevated concentrations at SR-07–SR-10 (0.36–0.45 mg L−1). Silica (SiO2) was consistently high throughout the transect, varying from 14.30 mg L−1 at SR-06 to 21.90 mg L−1 at SR-07. Other downstream stations also showed elevated values, including 17.70 mg L−1 at SR-08 and 18.40 mg L−1 at SR-09. Nitrate (NO3−) was generally low upstream and midstream, ranging from 0.00 to 0.40 mg L−1, but increased abruptly to 1.40 mg L−1 at SR-07 before remaining moderately elevated downstream.
Figure 5.
Spatial distribution of nutrient concentrations (NH3, PO43−, SiO2, and NO3−) along the Shitalakshya River transect.
3.5. Cyanobacterial Fluorescence and Total Chlorophyll Concentrations
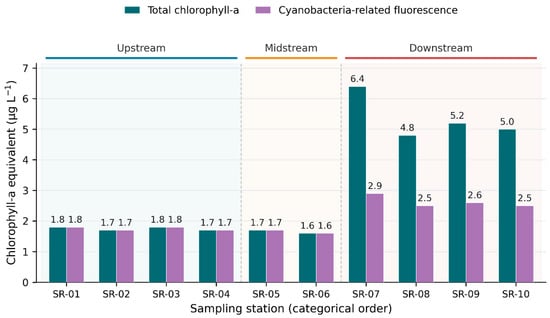
Total chlorophyll-a and cyanobacteria-related fluorescence increased markedly at SR-07 and remained elevated at the subsequent downstream stations relative to SR-01–SR-06 (Figure 6). Total chlorophyll-a remained consistently low from SR-01 to SR-06, varying only between 1.60 and 1.80 µg L−1. The lowest value occurred at SR-06 (1.60 µg L−1), while SR-01 and SR-03 each recorded 1.80 µg L−1. A marked shift occurred at SR-07, where total chlorophyll-a increased abruptly to 6.40 µg L−1, exceeding the ECR 2023 reference value of 5.00 µg L−1. Elevated concentrations persisted downstream, with 4.80 µg L−1 at SR-08, 5.20 µg L−1 at SR-09, and 5.00 µg L−1 at SR-10. Cyanobacteria-related fluorescence showed a similar spatial pattern, increasing from 1.60 to 1.80 µg L−1 at SR-01–SR-06 to 2.90 µg L−1 at SR-07, followed by 2.50 µg L−1 at SR-08, 2.60 µg L−1 at SR-09, and 2.50 µg L−1 at SR-10.
Figure 6.
Station-wise cyanobacterial fluorescence and total chlorophyll-a from the Algae Torch dataset.
3.6. Modified TRIX and Carlson Trophic-State Components of Shitalakshya River
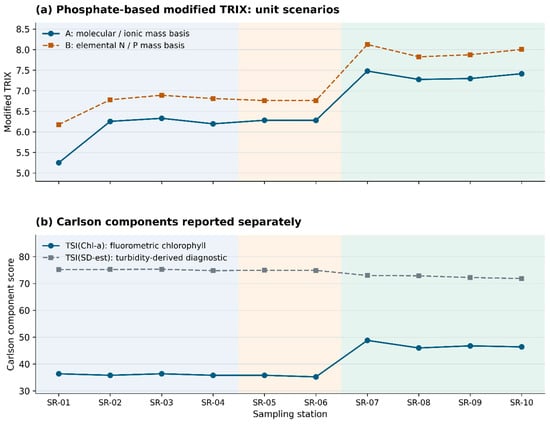
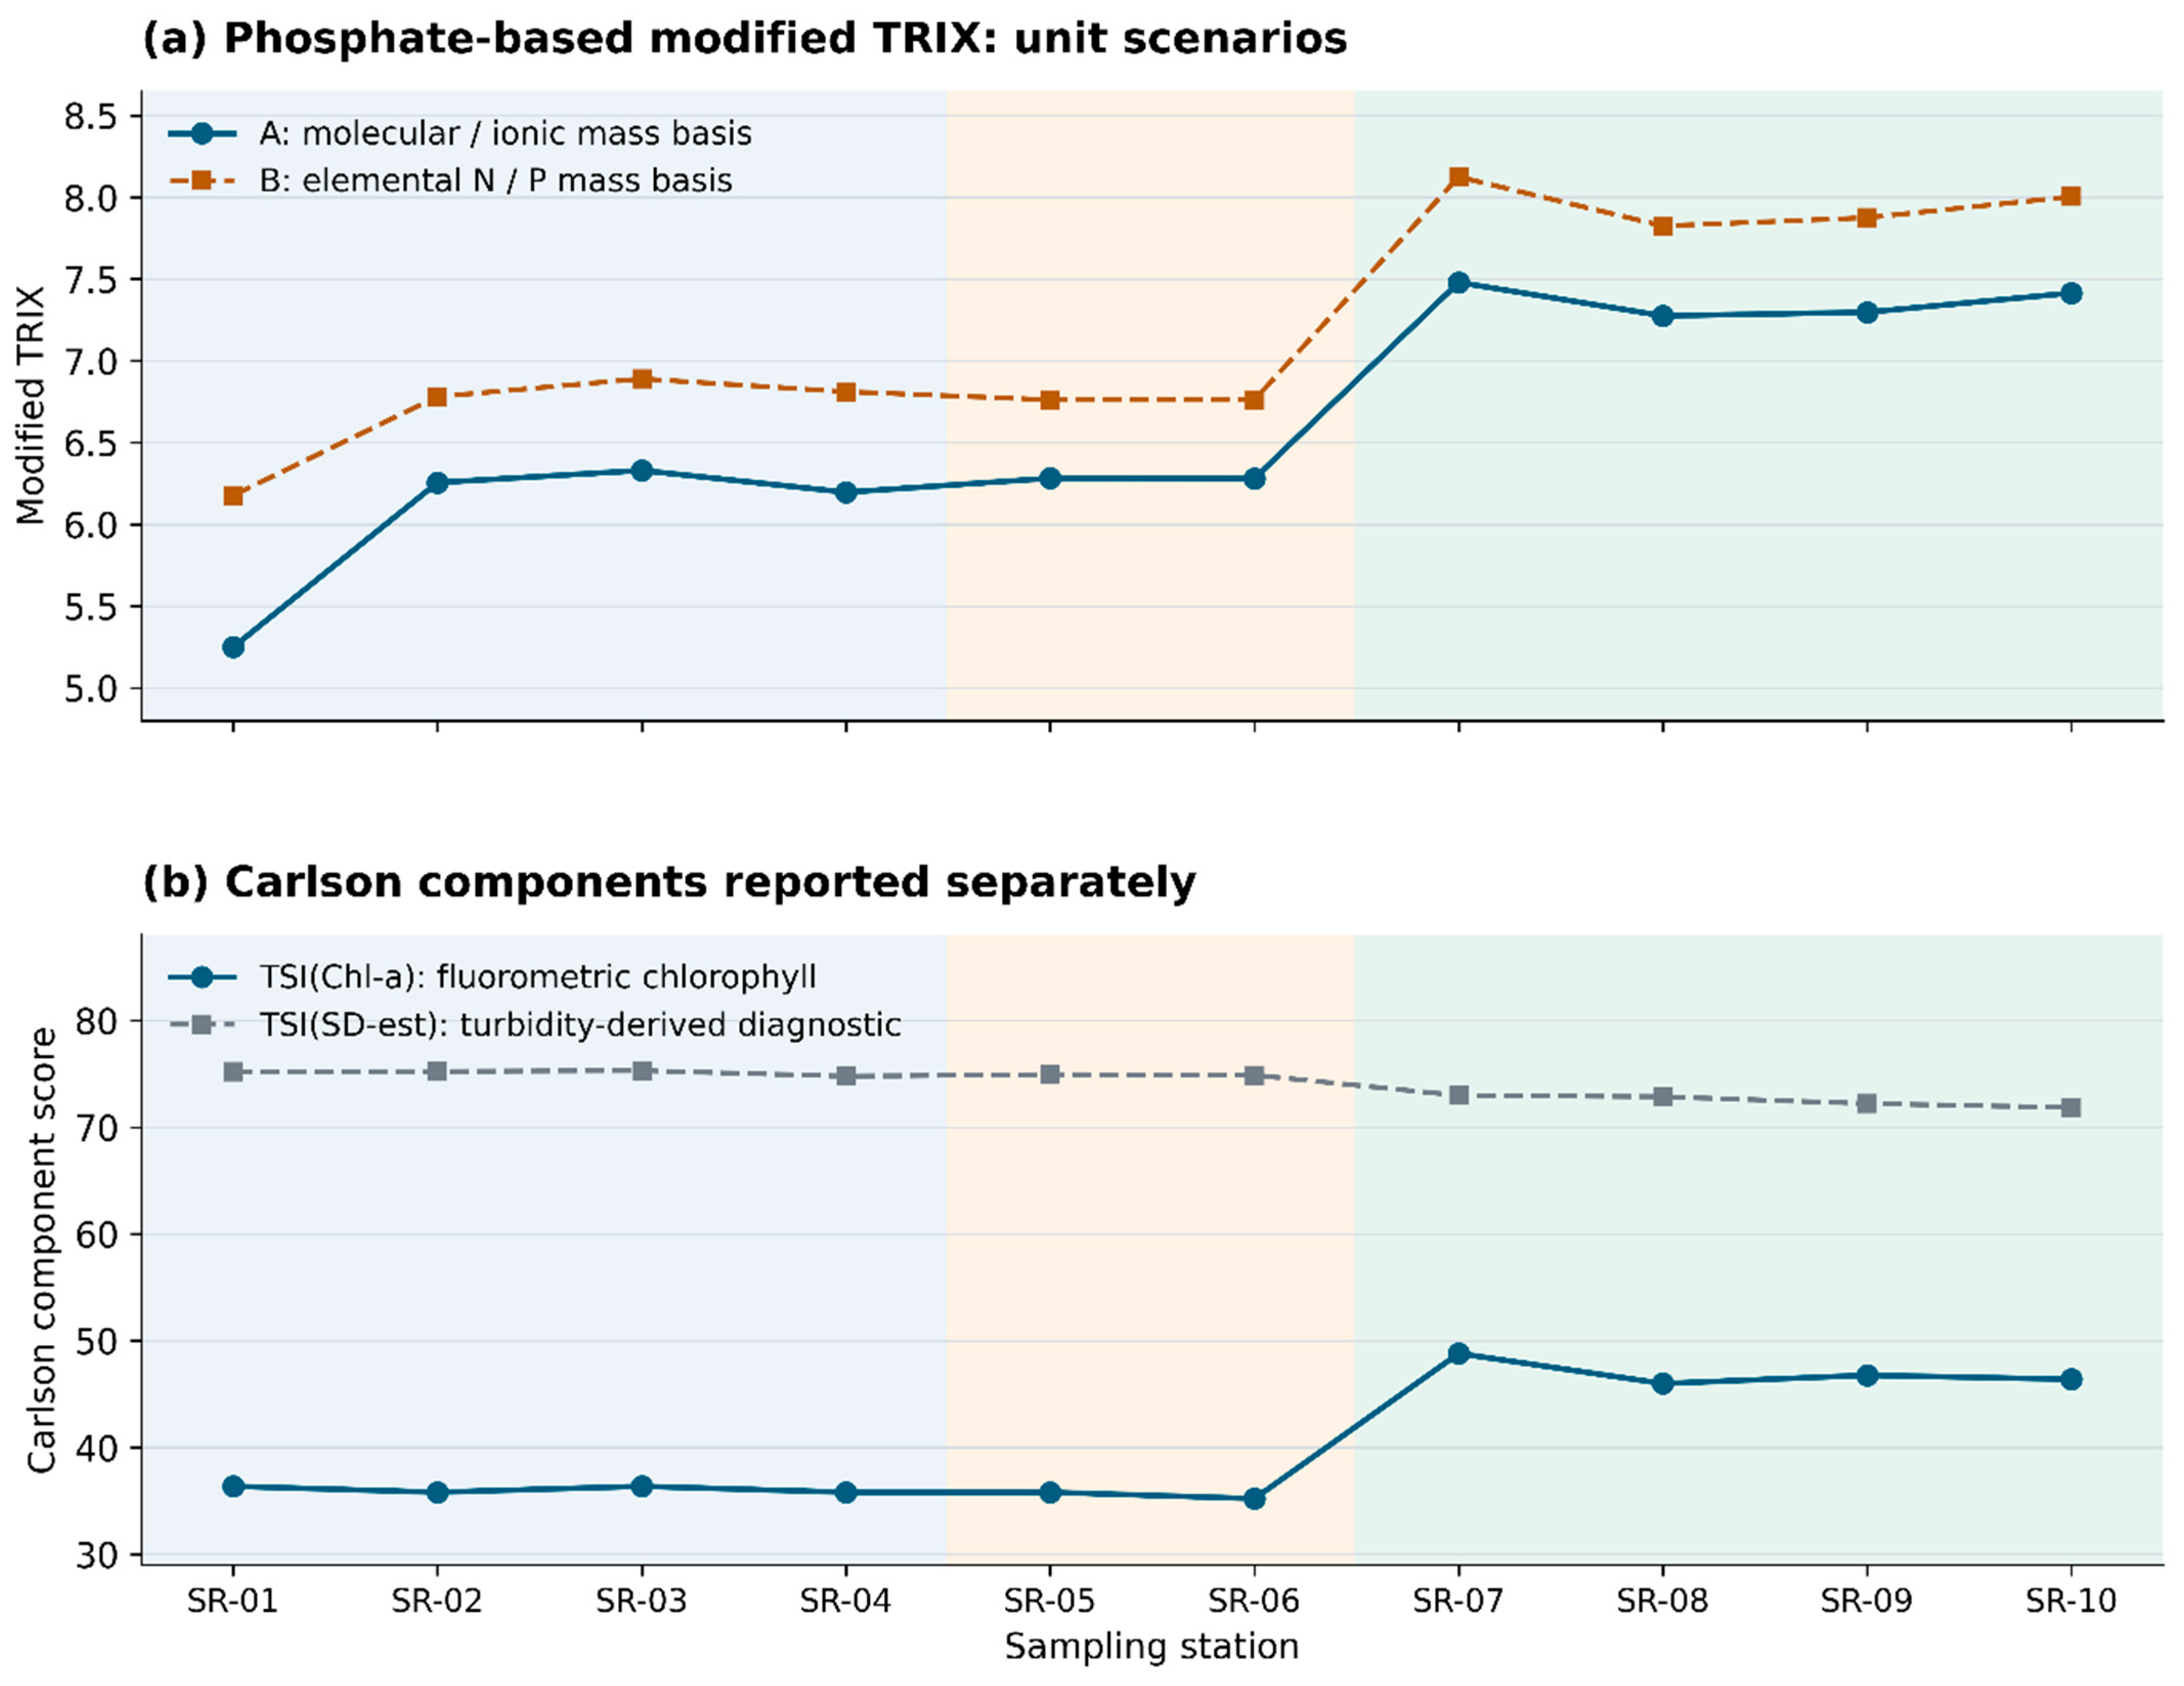
The phosphate-based modified TRIX showed higher values at SR-07–SR-10 under both nutrient-unit conventions (Figure 7a). Under Scenario A, values ranged from 5.25 at SR-01 to 7.48 at SR-07, with a mean of 6.61. Under Scenario B, values ranged from 6.18 at SR-01 to 8.12 at SR-07, with a mean of 7.20. Downstream values were 7.28–7.48 under Scenario A and 7.83–8.12 under Scenario B. Thus, the downstream contrast persisted under these two assumptions, while absolute values depended on the reporting convention.
Figure 7.
Recalculated trophic screening metrics at the ten sampling stations. (a) Phosphate-based modified TRIX under two conditional nutrient-unit conventions: Scenario A assumes chemical-species mass reporting, and Scenario B assumes elemental N/P reporting. Both use the retained ammonia column and an available-phosphate proxy rather than TP. (b) Separate Carlson chlorophyll and estimated-transparency components. Secchi depth was estimated from the archived turbidity relationship; TSI(SDest) is an optical diagnostic. Background shading identifies the upstream, midstream, and downstream sectors.
The chlorophyll-based Carlson component ranged from 35.21 at SR-06 to 48.81 at SR-07, with a mean of 40.33 (Figure 7b). Values were 35.21–36.37 at SR-01–SR-06 and 45.99–48.81 at SR-07–SR-10. Estimated Secchi depths ranged from 0.346 to 0.439 m, producing TSI(SDest) values of 71.86–75.31, with a mean of 74.03. The discrepancy between chlorophyll and estimated-transparency scores was retained as a diagnostic observation. The components were not combined into a TP-based composite score or interpreted as independently validated river trophic classifications.
3.7. Dissolved Heavy Metals and Contamination Indices
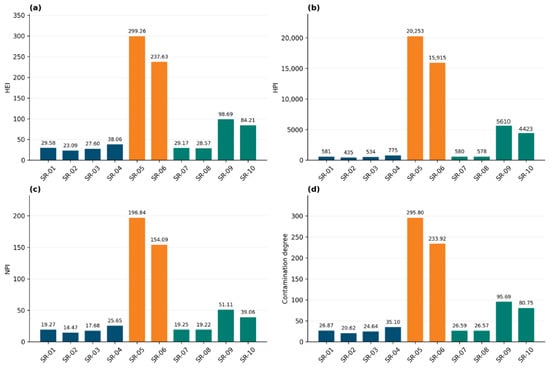
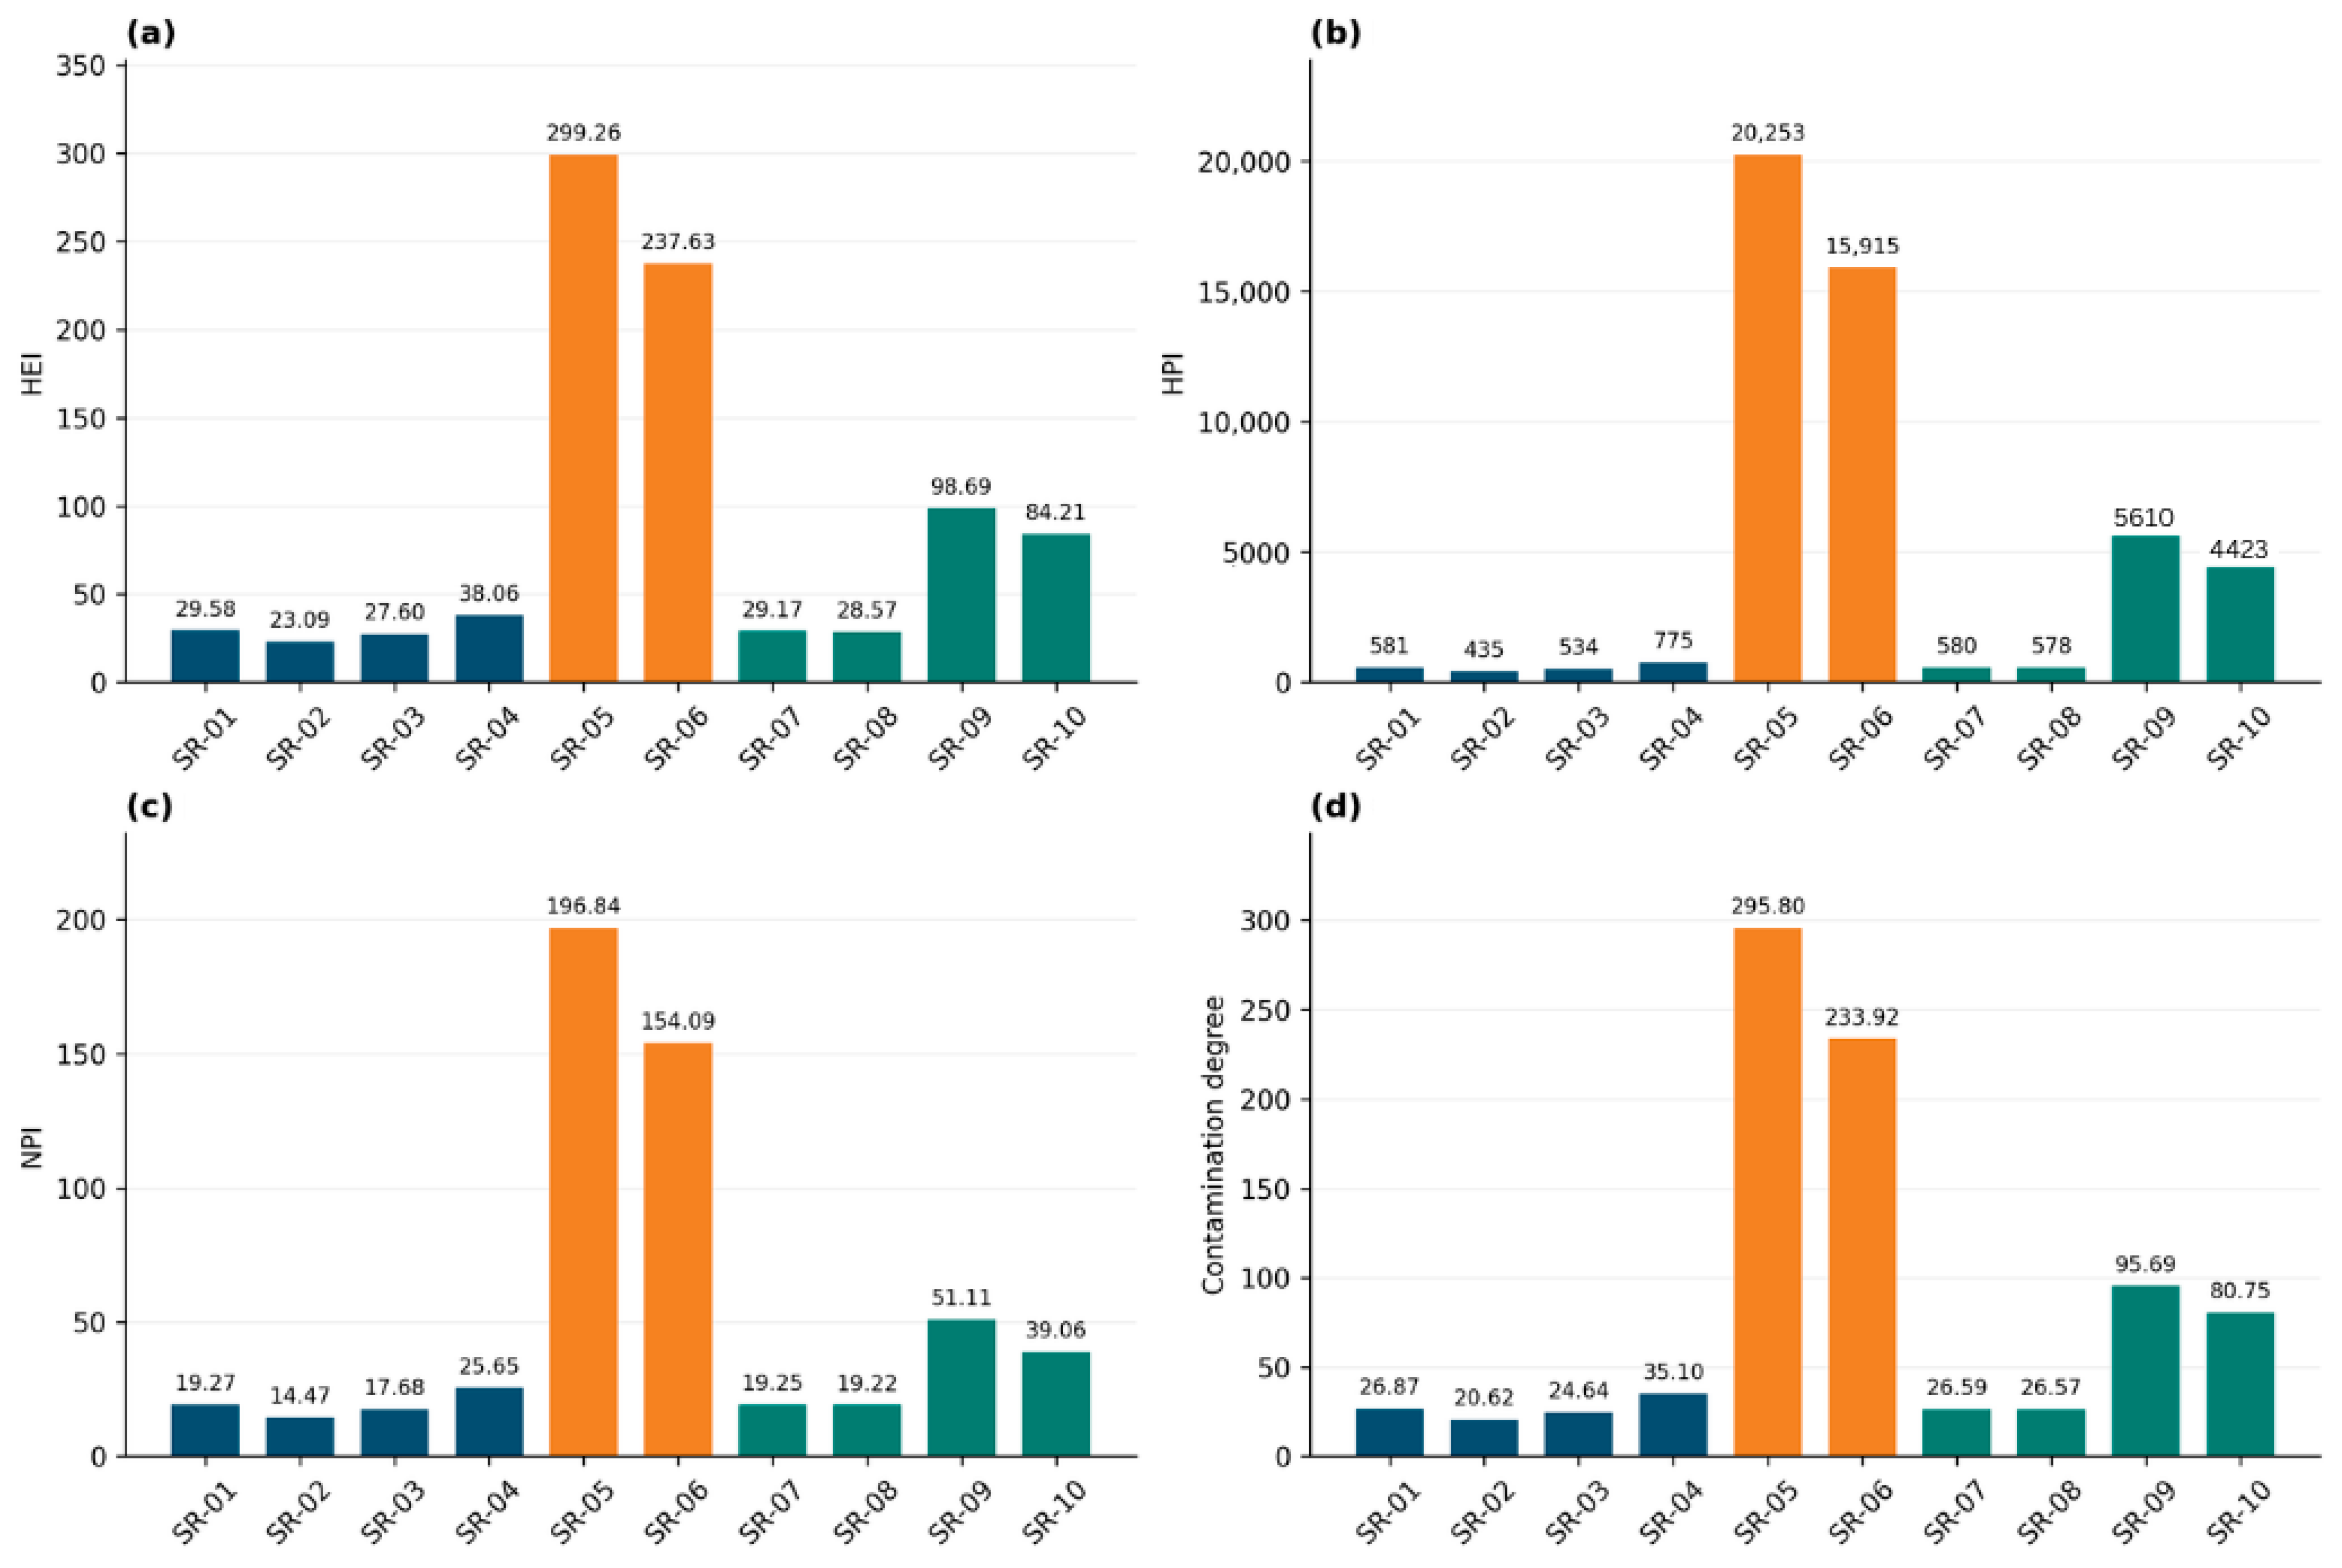
The highest reported heavy-metal contamination and risk indices occurred at the midstream stations SR-05 and SR-06 (Figure 8). Fe was elevated at all stations (2.06–4.43 mg L−1), and Pb was consistently high throughout the river (0.196–0.350 mg L−1). The most acute metal anomaly, however, was Cd: the concentration reached 0.804 mg L−1 at SR-05 and 0.629 mg L−1 at SR-06, far exceeding both Bangladesh and WHO comparison values and dramatically increasing all integrated risk indices in the midstream industrial corridor. The integrated metal indices make the spatial contrast clearer than individual concentrations alone. Using the consistently defined four-metal calculations, HEI ranged from 23.09 to 299.26, HPI from 434.97 to 20,252.63, NPI from 14.47 to 196.84, and corrected contamination degree from 20.62 to 295.80 (Figure 8). Each index reached its maximum at SR-05, followed by SR-06.
Figure 8.
Station-wise heavy-metal contamination and risk indices along the sampled Shitalakshya River reach, including the (a) Heavy Metal Evaluation Index (HEI), (b) Heavy Metal Pollution Index (HPI), (c) Nemerow Pollution Index (NPI), and (d) corrected degree of contamination. All axes use linear scales.
3.8. Phytoplankton Community Structure and the PQI Gradient
Phytoplankton abundance and diversity varied among stations (Table 2). SR-01–SR-03 had Shannon diversity values of 2.25–2.68. Lower abundance occurred at SR-04–SR-06 (4.33–5.00 cells 100 mL−1), spanning the final upstream station and the two midstream stations. Shannon diversity reached its minimum at SR-06 (1.55), while taxonomic richness was lowest at SR-04 and SR-06, with five taxa at each station. SR-07 recorded the highest abundance (25.67 cells 100 mL−1), richness (30 taxa), and Shannon diversity (3.35).
Table 2.
Phytoplankton abundance and diversity metrics by station.
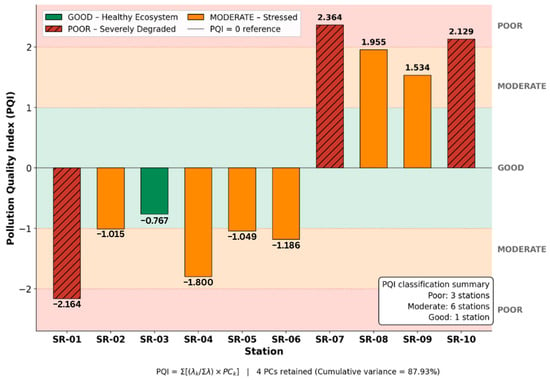
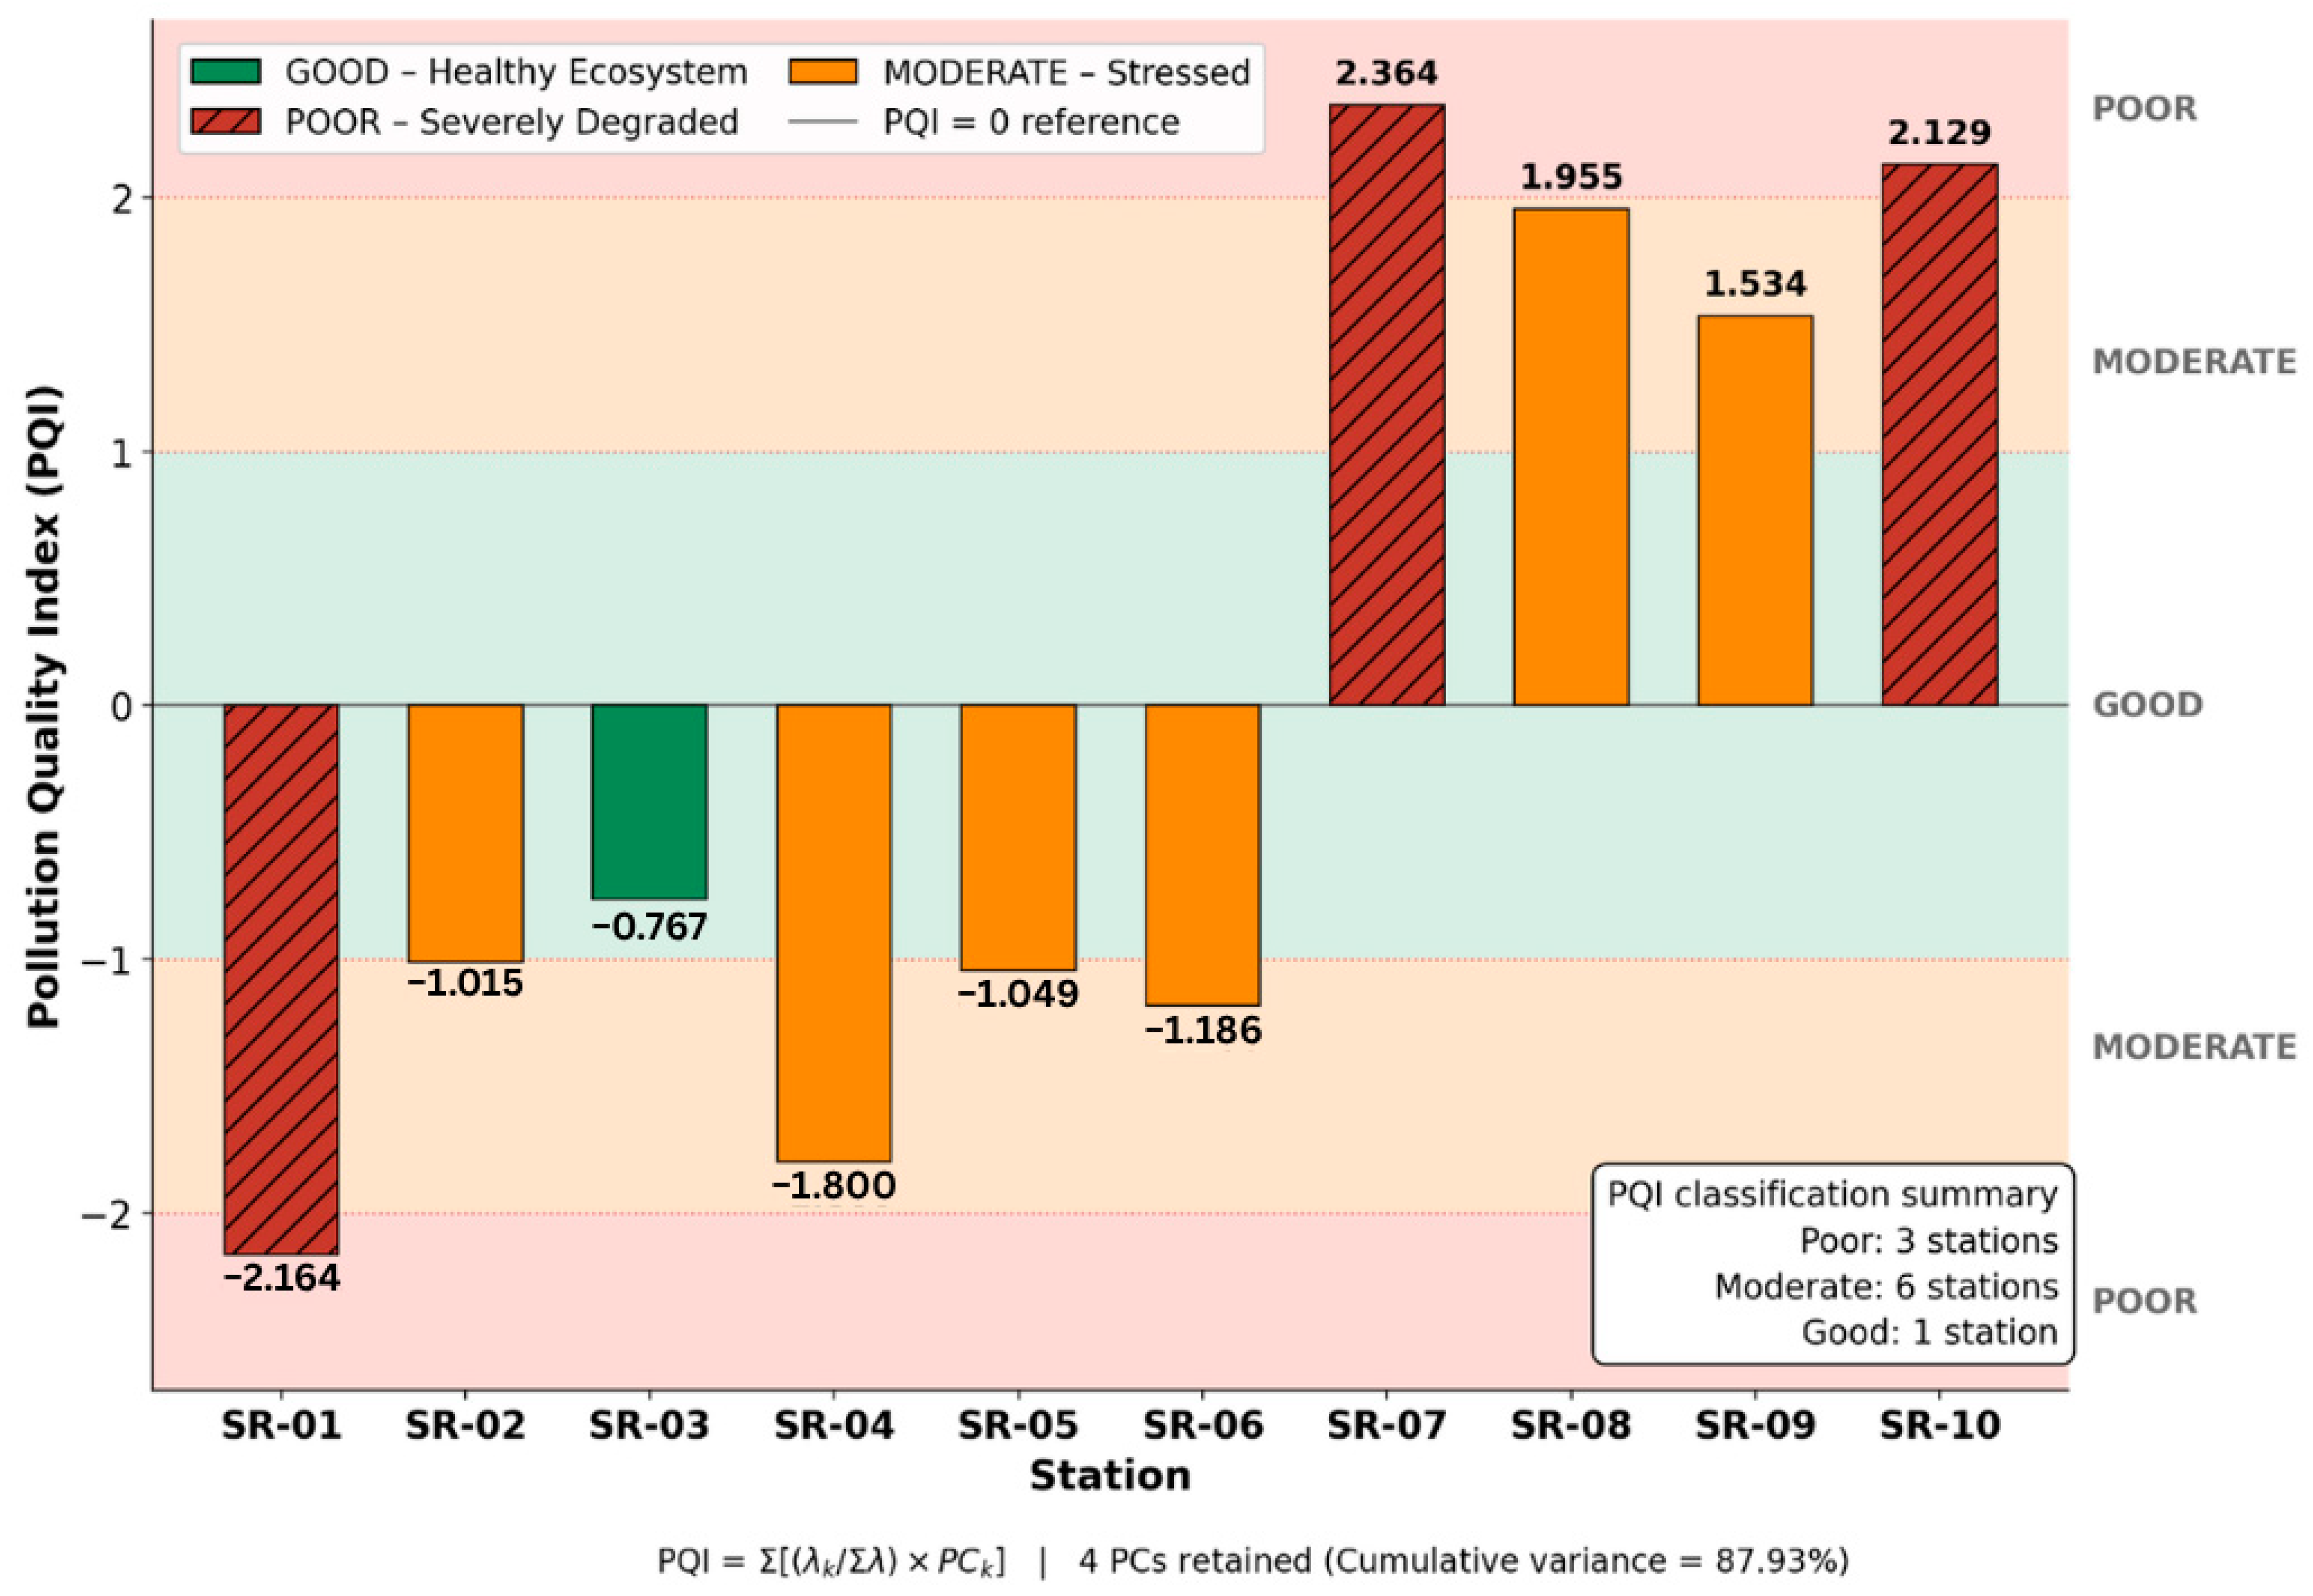
The PCA retained four components explaining 87.93% of the total variance. Station PQI scores ranged from −2.165 at SR-01 to 2.364 at SR-07 (Figure 9). Under the applied thresholds, SR-03 was classified as good, SR-01, SR-07, and SR-10 as poor, and the remaining stations as moderate. Table 3 compares these classifications with CCME-WQI values and cluster assignments. SR-05 and SR-06 had marginal ECR-based CCME-WQI classifications but moderate PQI classifications, whereas SR-01 had a fair ECR-based CCME-WQI classification and a poor PQI classification.
Figure 9.
Station-wise phytoplankton quality index (PQI) scores along the sampled Shitalakshya River reach, with the classification bands applied in this study.
Table 3.
PQI classification, WQI context, and cluster assignment by station.
3.9. Microplastic Abundance, Morphology, and Size Structure
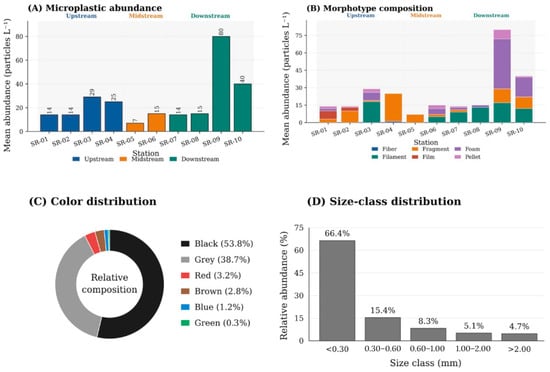
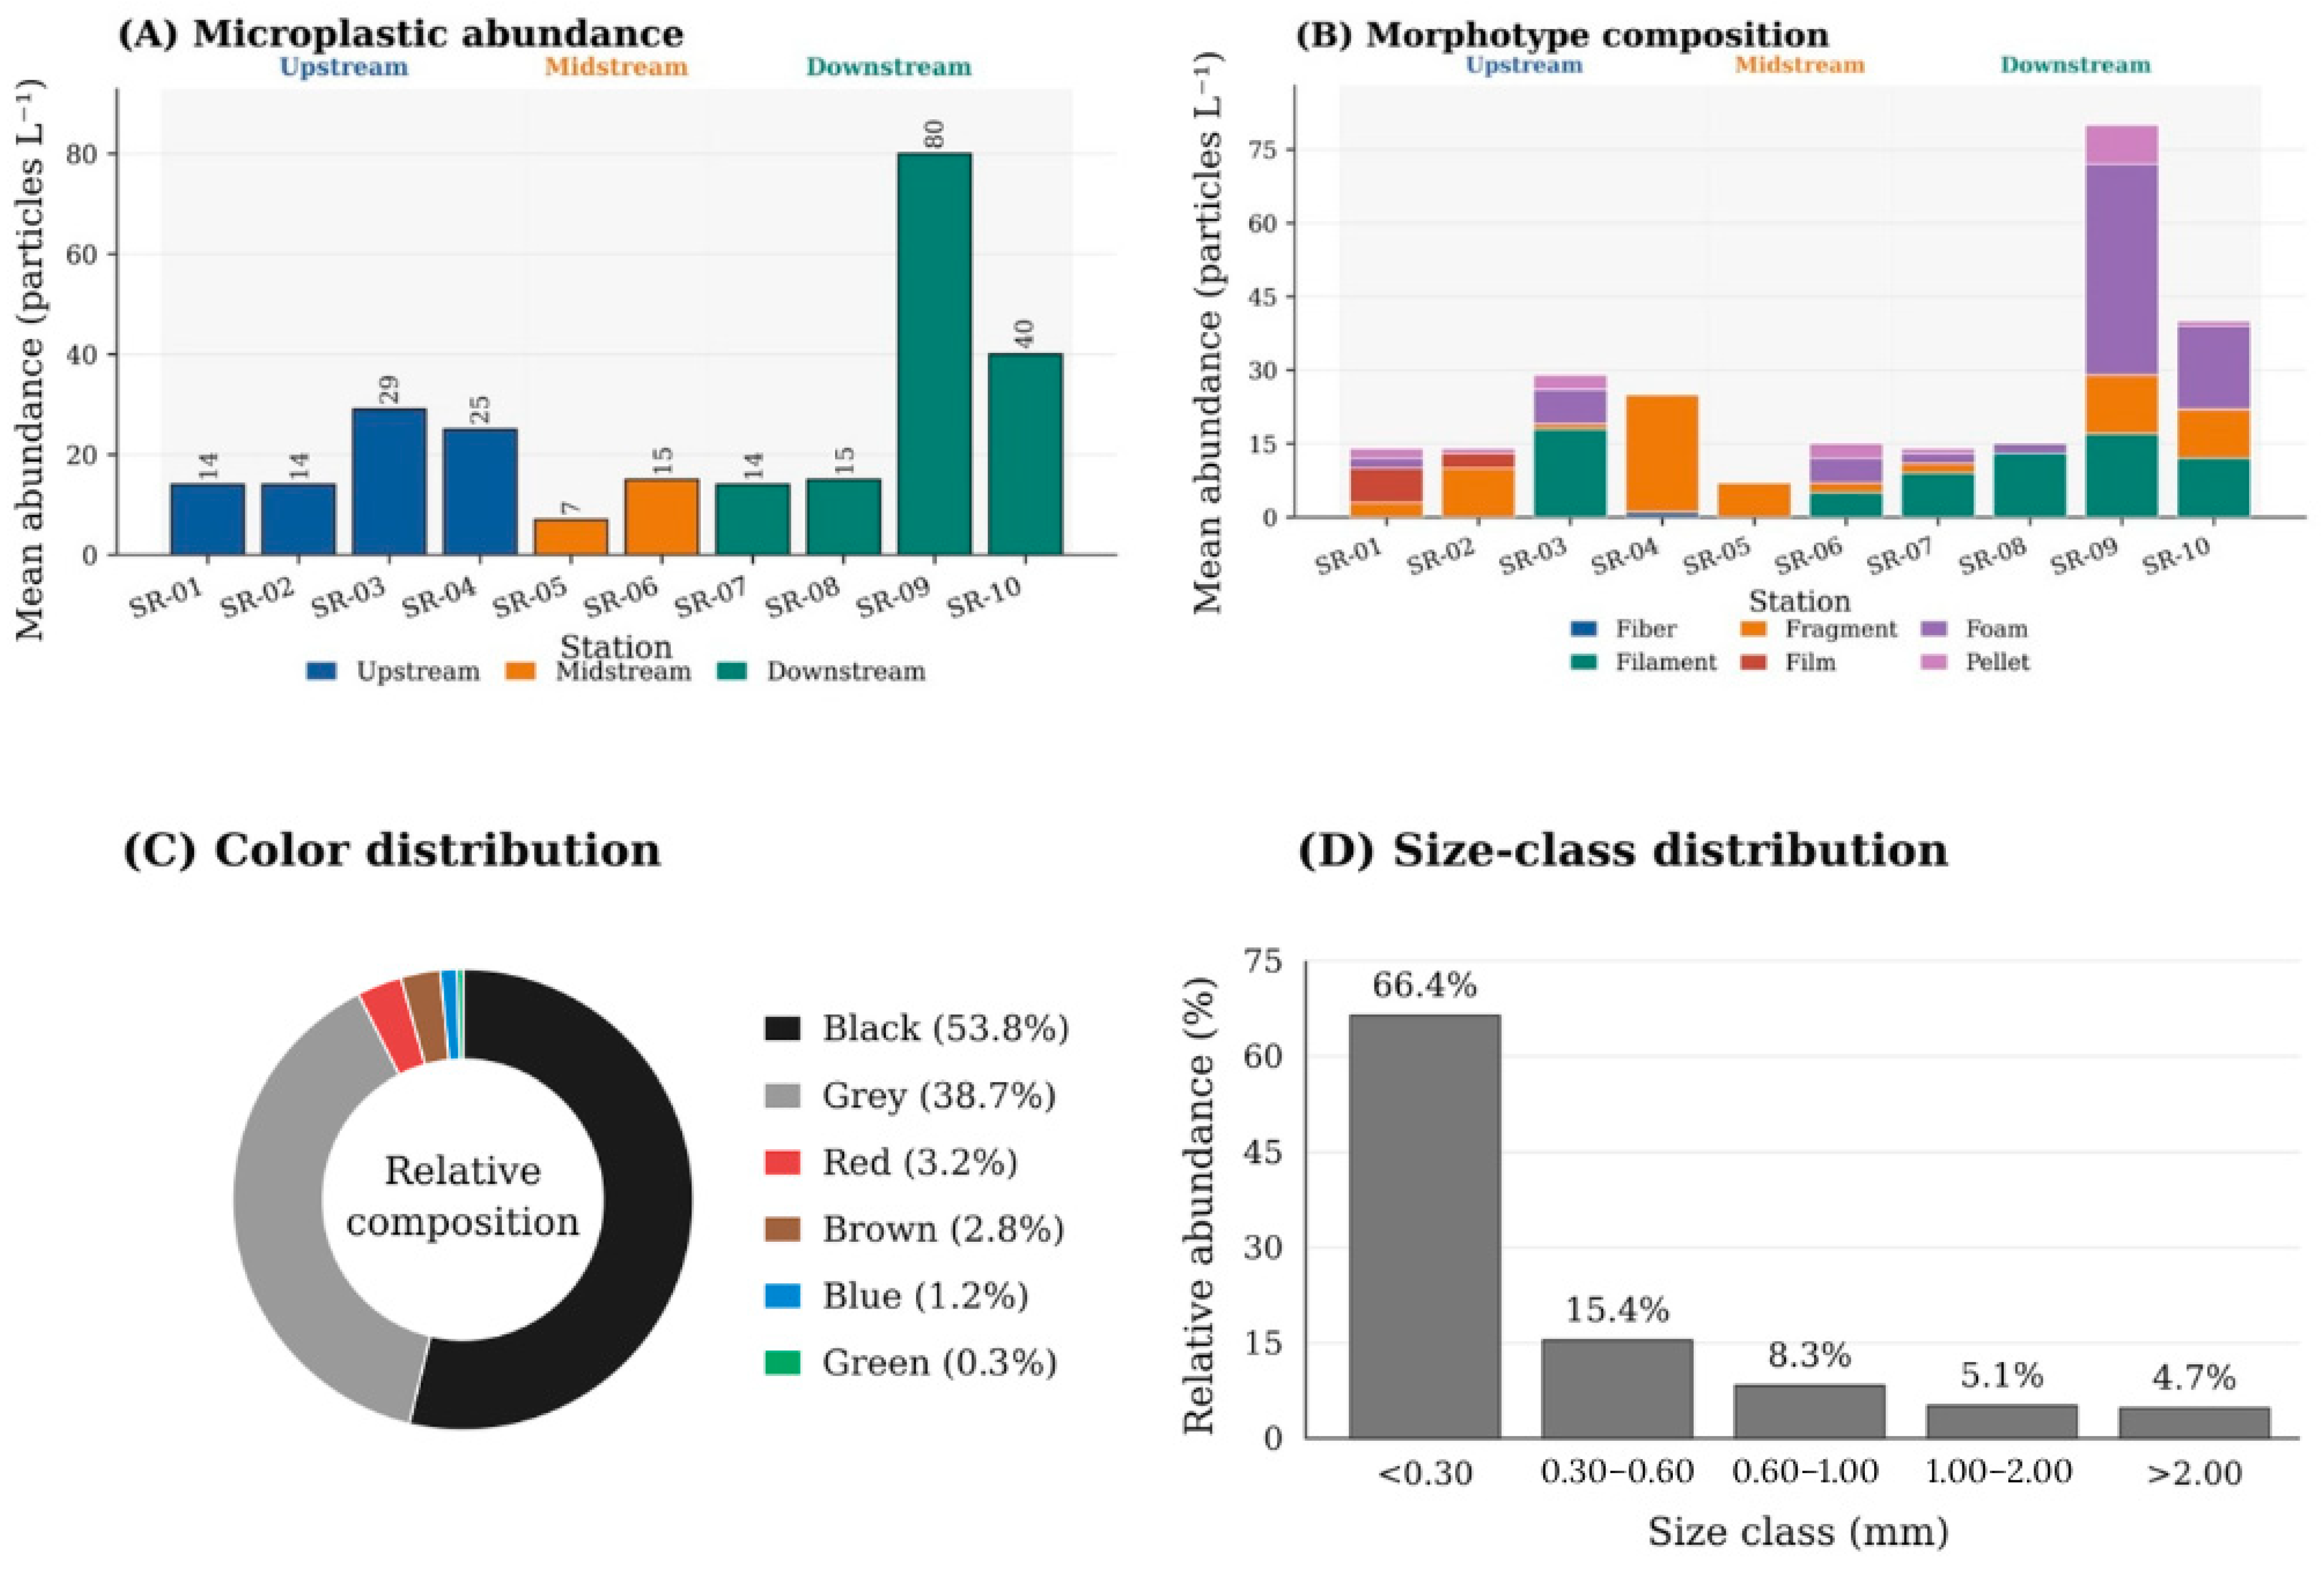
Microplastics were detected at all stations, with mean abundance ranging from 7 particles L−1 at SR-05 to 80 particles L−1 at SR-09 (Figure 10A). The highest mean abundances occurred at downstream stations SR-09 and SR-10, with 80 and 40 particles L−1, respectively. Morphotype composition changed systematically across the transect. Upstream stations contained higher shares of films and fragments, whereas filament-rich assemblages emerged at SR-07 and SR-08 and foam became especially abundant at SR-09 and SR-10. Mean particle size ranged from 0.162 to 1.083 mm, but the highest-abundance station (SR-09) was dominated by relatively small particles (mean 0.337 mm), indicating a secondary-microplastic accumulation hotspot. The relative size-class distribution calculated from the retained category summaries was dominated by particles smaller than 0.30 mm (66.4%), followed by the 0.30–0.60 mm (15.4%), 0.60–1.00 mm (8.3%), 1.00–2.00 mm (5.1%), and >2.00 mm (4.7%) classes (Figure 10D). Gray and black particles dominated the overall color distribution, consistent with mixed urban and industrial debris sources.
Figure 10.
Microplastic abundance and particle characteristics along the sampled Shitalakshya River reach: (A) station-level mean abundance; (B) mean abundance by morphotype; (C) relative color distribution; and (D) relative size-class distribution. Panels (A) and (B) represent means of three replicate 1 L samples per station. Panels (C) and (D) show percentages calculated from the retained category summaries across stations, rather than raw particle totals. Replicate-level variability could not be reconstructed from the available records.
3.10. Correlation Structure for the 15 Variables of the River
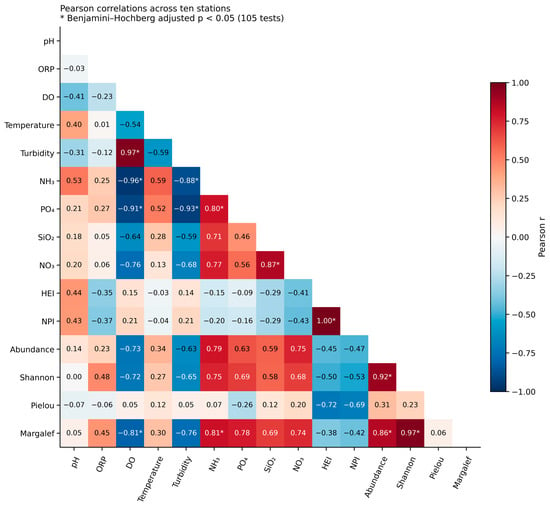
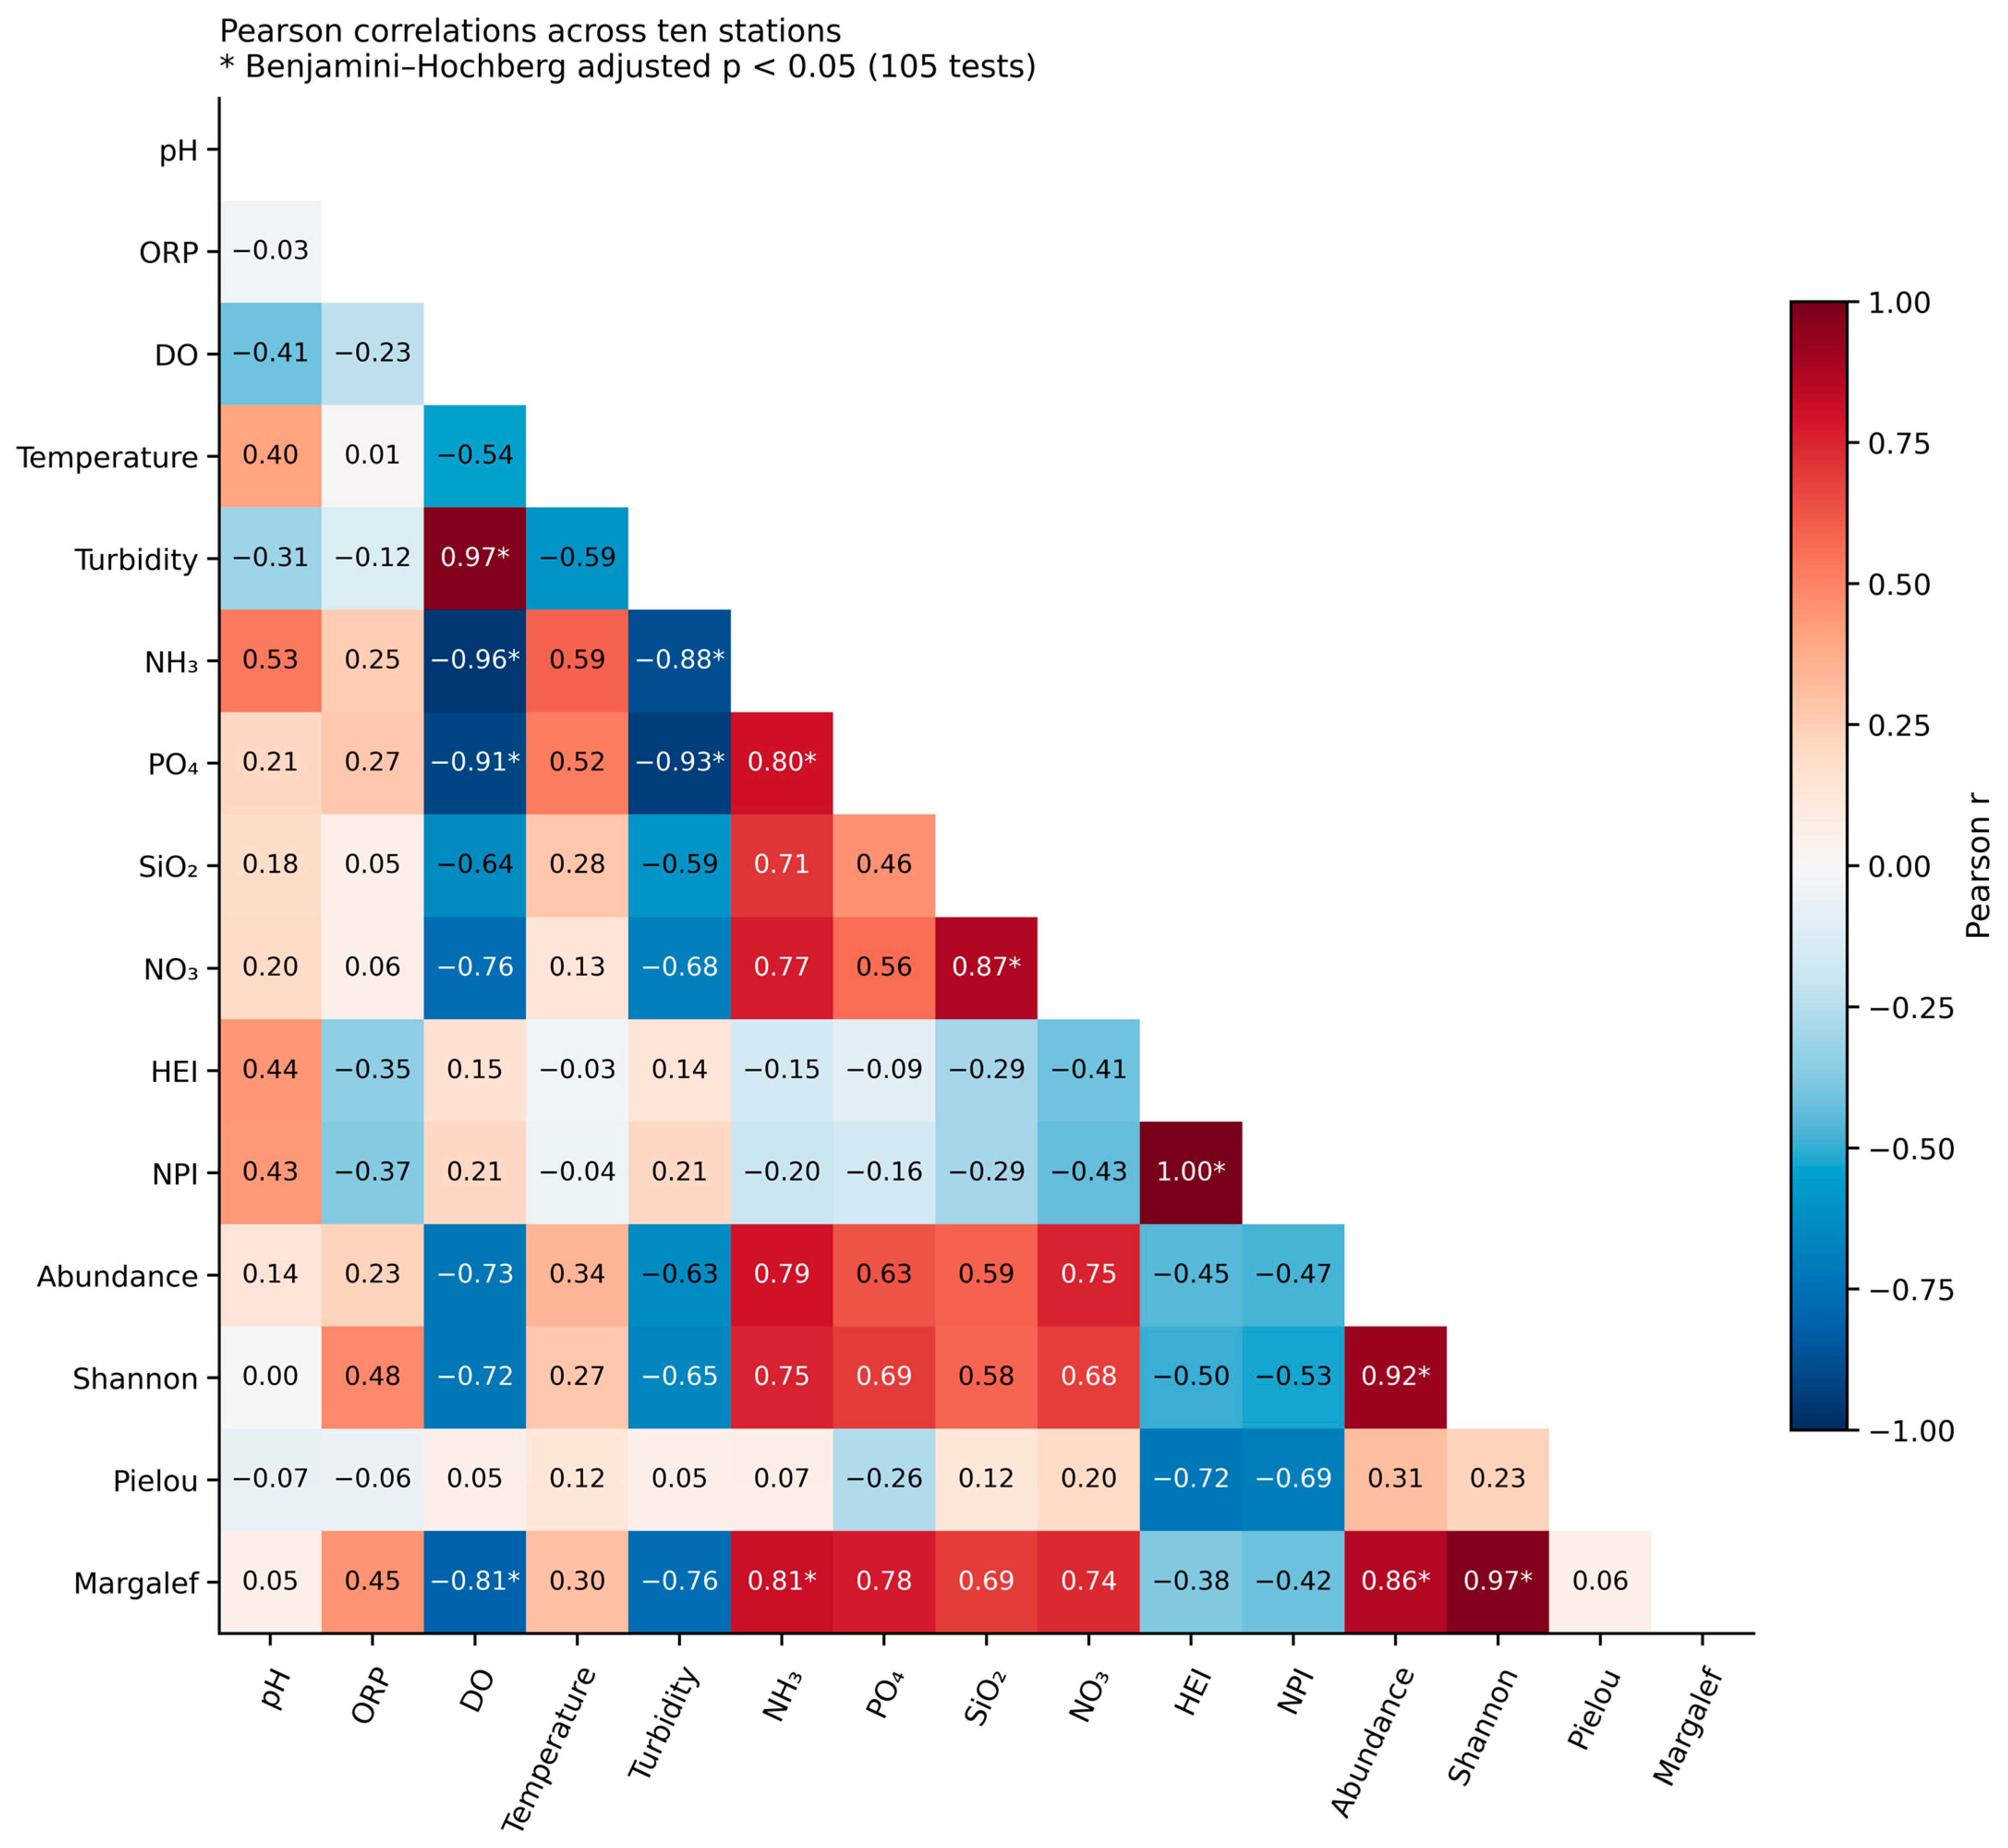
Of the 105 pairwise correlations, 32 had unadjusted p < 0.05 and 13 remained below 0.05 after Benjamini–Hochberg adjustment (Figure 11). DO was positively correlated with turbidity (r = 0.967, adjusted p < 0.001) and negatively correlated with NH3 (r = −0.960, adjusted p < 0.001), PO4 (r = −0.911, adjusted p = 0.0037), and Margalef richness (r = −0.808, adjusted p = 0.0408). NH3 was positively correlated with Margalef richness (r = 0.809, adjusted p = 0.0408). HEI and NPI were closely correlated (r = 0.995, adjusted p < 0.001), consistent with their shared metal inputs. Their negative correlations with phytoplankton abundance and Shannon diversity did not meet the adjusted significance criterion and are treated as descriptive trends. These associations do not establish pollutant-specific biological causation.
Figure 11.
Lower-triangle Pearson correlation heatmap for the 15-variable integrated dataset used in the multivariate assessment.
3.11. Integrated Hierarchical Clustering and Ecological Zonation of the Shitalakshya River
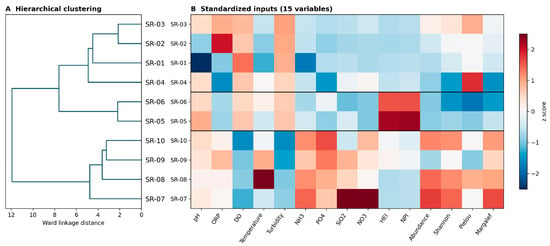
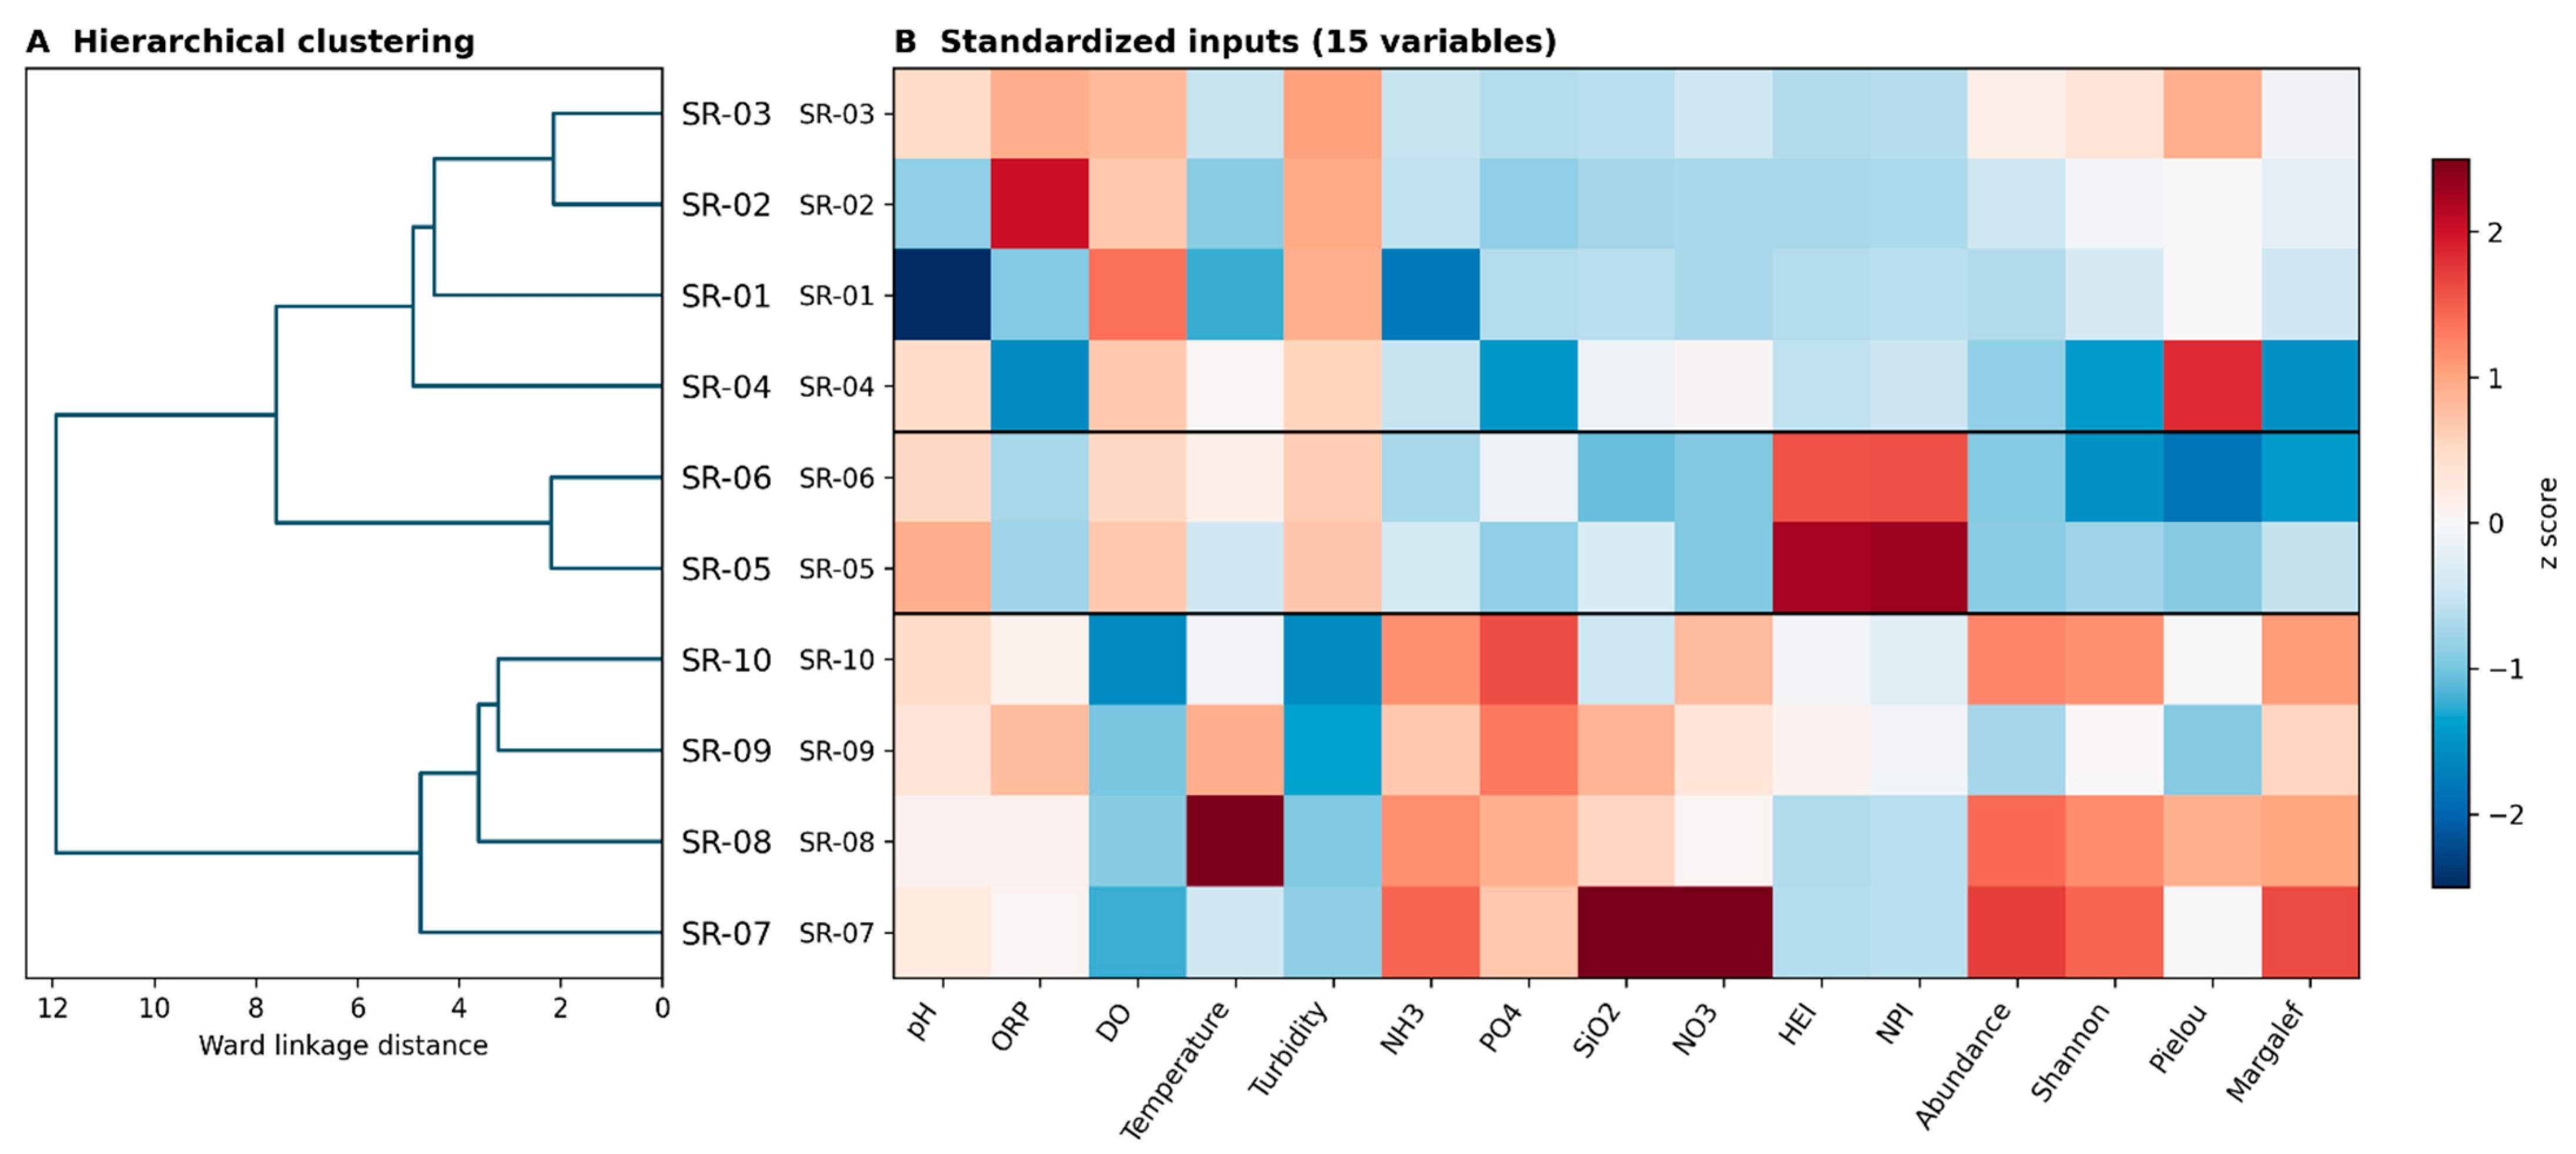
Ward clustering of the 15 standardized inputs separated SR-01–SR-04, SR-05–SR-06, and SR-07–SR-10 into three groups (Figure 12). This partition was unchanged in all 15 single-variable deletion tests and all ten single-station deletion tests, with an adjusted Rand index of 1.00 for the comparable stations. Broader removal of overlapping inputs changed the position of SR-04. Removing both metal indices, or removing NPI together with the three diversity metrics, grouped SR-04 with SR-05–SR-06 (adjusted Rand index = 0.723). Thus, the main partition was insensitive to individual deletions but partly dependent on the broader choice of variables.
Figure 12.
Hierarchical clustering of the ten sampling stations, showing station group assignments and standardized profiles of the variables included in the analysis.
4. Discussion
4.1. Spatial Ecological Zonation of the Shitalakshya River
The assessment combines interpretation of station-level physicochemical measurements, nutrient and trophic indicators, dissolved-metal concentrations and contamination indices, phytoplankton metrics, and microplastic observations. Statistical integration through PCA and hierarchical clustering was restricted to the 15 variables listed in Section 2.5; microplastic measurements and the other assessment indices were considered separately in the overall interpretation. These indicators did not produce identical station rankings, suggesting that a single composite score would provide an incomplete description of the observed conditions. The resulting station groups offer a working basis for targeted investigation, although their persistence beyond the sampling day remains untested.
Previous research identified industrial, municipal, and domestic outfalls across Dhaka’s peripheral rivers [1]. This context makes spatially variable pollutant inputs a plausible explanation for the present patterns. However, the two outfalls observed at SR-05 and SR-06 were not a comprehensive inventory, and their presence does not establish the source or magnitude of particular contaminants. Industrial activity near SR-07 also shows that the upstream, midstream, and downstream designations should not be treated as exclusive land-use categories.
The survey represents a reach-scale assessment within the lower Shitalakshya River rather than a whole-river gradient. The available information does not establish whether the sampled gradient is ecologically short or long, because ecological differentiation depends on environmental contrasts and biological responses as well as geographical extent. Channel width and depth can influence cross-sectional area, flow velocity, mixing, light availability, and habitat conditions. However, river width and along-channel distance were not quantified, and no systematic bathymetric survey was conducted. Their contributions to the observed station differences therefore cannot be separated from pollutant inputs and sampling-time effects. The identified station groups should consequently be interpreted as exploratory patterns within the sampled reach rather than established hydrological or ecological zones.
4.2. Physicochemical Condition and Water-Quality Status
The differences between CCME-WQI and PQI classifications highlight the importance of distinguishing guideline-based water-quality assessment from a multivariate description of ecological variation. CCME-WQI summarizes departures from selected objectives, whereas the PQI combines standardized chemical and biological variables. Differences between their classifications therefore require examination of the underlying measurements and thresholds rather than an assumption that one index confirms the other.
Islam and Huda [12] reported substantially lower DO concentrations in an earlier Shitalakshya River survey than those observed in the present campaign. This contrast cannot establish temporal improvement because the studies differed in sampling locations, timing, and design. It instead illustrates why observations from one campaign should not be generalized to the river’s annual condition. Likewise, comparisons with drinking-water guideline values should be distinguished from conclusions about ecological condition or actual human exposure.
4.3. Eutrophication and Downstream Algal Intensification
The downstream sector showed higher measured nutrient concentrations and chlorophyll-a, with SR-07 recording maxima in ammonia, nitrate, silica, and chlorophyll-a. The phosphate-based modified TRIX also showed higher downstream values under both specified nutrient-unit conventions. This agreement demonstrates consistency under those two assumptions but does not independently validate the nutrient measurements or establish equivalence with TP-based TRIX. The chlorophyll-based Carlson component similarly reflected higher algal biomass downstream. Estimated-transparency scores were substantially higher, but their derivation from an external turbidity relationship prevents attribution of this discrepancy solely to non-algal suspended material. Non-algal attenuation and calibration-transfer error are possible explanations requiring direct optical observations. The components were therefore interpreted separately. Sequential sampling also confounded station position with time of day, so the observed nutrient, chlorophyll, and oxygen patterns do not establish causal relationships. Nutrient enrichment commonly stimulates algal biomass and decomposition, which can reduce oxygen availability and increase bloom risk [34]. Warm, nutrient-rich conditions may also favor cyanobacterial development [35,36].
The CTD profiles recorded enhanced chlorophyll fluorescence near SR-07 and attenuation of PAR within the sampled layer (Figure 4). These observations describe vertical variation over the profiled interval but do not establish full-water-column mixing conditions or demonstrate that differences in channel geometry caused the observed biological patterns.
4.4. Heavy-Metal Contamination in the Industrial Corridor
The most severe contamination occurred at SR-05–SR-06, where Cd reached 0.804 and 0.629 mg L−1, respectively. These concentrations strongly increased HEI, HPI, NPI, and contamination degree. Reduced phytoplankton abundance and diversity co-occurred with elevated metal concentrations at SR-05 and SR-06, although the observational design does not establish a metal-specific biological response. Phytoplankton abundance declined to 4.33–4.67 cells 100 mL−1 in the industrial reach, Shannon diversity fell to 1.55 at SR-06, and taxonomic richness was reduced. Similar relationships between industrial pollution and phytoplankton disturbance have been reported previously in the Shitalakshya River [12,37].
The elevated Cd concentrations at SR-05 and SR-06 were measured during a campaign that included analytical blanks, duplicate samples, certified reference materials, and spike-recovery checks. Samples from these two stations underwent three separate preparations and were analyzed using the same instrument. Accordingly, SR-05–SR-06 is interpreted as a provisional Cd hotspot within the sampled campaign. Independent analytical confirmation and repeated sampling are recommended to assess the accuracy and persistence of this pattern.
4.5. Phytoplankton Response and PQI Performance
The phytoplankton results revealed two contrasting biological responses. In the downstream reach, nutrient enrichment increased phytoplankton abundance and richness despite poor water quality and reduced oxygen. Thus, high productivity did not indicate ecological health. The PCA-based PQI helped separate these contrasting conditions by linking water chemistry, metal stress, and biological response. Negative scores reflected reduced-productivity or toxicity-constrained conditions, while strongly positive scores reflected nutrient-rich but ecologically imbalanced conditions. This approach is consistent with phytoplankton-based multivariate assessment developed for Bangladeshi aquatic systems [32]. Nevertheless, the PQI should be regarded as a study-specific ecological-gradient index until its thresholds are validated using seasonal data and independent biological indicators.
4.6. Microplastic Accumulation and Pollutant Interaction
Microplastics were detected at all stations, with the highest mean abundances occurring downstream at SR-09 (80 particles L−1) and SR-10 (40 particles L−1). The lower river was characterized by greater proportions of filaments and foam, suggesting inputs from textile wastewater, packaging materials, and urban waste. However, these source interpretations remain provisional because polymer identity was not confirmed by FTIR or Raman spectroscopy. The co-occurrence of microplastics, metals, and nutrients is environmentally important because plastic particles may adsorb metals and transport contaminants or microorganisms. Their role as pollutant vectors depends on polymer type, weathering, water chemistry, and biofilm development [38,39]. Future surveys should include procedural blanks, recovery tests, polymer confirmation, and retention of replicate-level counts to support uncertainty estimation.
4.7. Exploratory Multivariate Patterns
Correlation and hierarchical-clustering analyses summarized contrasting chemical and biological profiles within the sampled dataset. The resulting groups comprised SR-01–SR-04, SR-05–SR-06, and SR-07–SR-10. Because the analyses used overlapping measurements from the same ten stations, their agreement does not constitute independent confirmation of pollutant sources, ecological mechanisms, or persistent river zonation.
Nutrients were positively correlated with phytoplankton abundance and diversity but negatively related to DO, indicating nutrient-driven biological intensification. In contrast, heavy-metal indices were negatively associated with abundance and Shannon diversity. However, the correlations were based on only ten stations and several indices were mathematically related; therefore, these relationships should be interpreted as exploratory rather than definitive.
4.8. Heavy-Metal Removal and Management Options
Pollution prevention at industrial sources should be prioritized over remediation after metals enter the river. Chemical precipitation is suitable for concentrated Cd- and Pb-bearing effluents but generates sludge and requires careful pH control [40]. Adsorption using activated carbon, iron oxides, zeolite, chitosan, modified clay, or locally available biochar may provide a practical polishing step. Low-cost materials such as rice-husk biochar, jute-derived carbon, coconut shell, and natural clay should be evaluated using actual industrial wastewater [41].
Ion exchange, electrocoagulation, nanofiltration, and reverse osmosis may achieve higher removal efficiencies, particularly where water reuse or metal recovery is economically justified. However, these methods involve higher costs, fouling risks, or management of concentrated residual waste. Hybrid treatment systems are therefore more appropriate for complex industrial effluents containing metals, salts, dyes, and organic matter [42,43].
Constructed wetlands may be useful as tertiary polishing systems after primary treatment, but they should not receive untreated, highly contaminated effluent. Metal-rich plant biomass and sediments must also be safely removed and managed [44].
4.9. Recommendations and Future Prospects
Correlation and clustering summarize relationships within the sampled dataset; they do not independently confirm pollutant sources or ecological mechanisms. With ten stations and numerous input variables, the stability of the component structure and station groups remains uncertain. Several indices also share underlying measurements, so their close association partly reflects mathematical dependence. Differences among clusters in variables used to construct those clusters cannot serve as independent validation.
The single-day design provides a pre-monsoon spatial snapshot rather than evidence of seasonal persistence or annual maximum contamination. Selecting an early-April window does not remove the influence of antecedent rainfall, changing discharge, or potential tidal variation. These influences could not be separated from spatial differences in the present design. The available station-level dataset and reproducible calculations are provided in Supplementary Data S1; future monitoring should additionally preserve and deposit instrument outputs, replicate-level quality-control records, taxon-level counts, and microplastic replicate counts.
Furthermore, sequential upstream-to-downstream sampling associated station position with time of day, limiting interpretation of differences in temperature, DO, and fluorescence. Repeated campaigns during the summer monsoon, winter dry season, and transitional periods, together with within-day revisits and hydrological observations, are needed to determine the reproducibility of the reported patterns. Future surveys should combine water-quality sampling with along-channel distance measurements, channel-width and riverbed-depth surveys, and concurrent velocity and water-level observations to distinguish hydrological controls from variation in pollutant inputs.
5. Conclusions
This single-campaign assessment documented spatial variation in water chemistry, trophic indicators, phytoplankton metrics, and visually identified microplastics within the sampled lower Shitalakshya River reach. Comparing these measurements with composite indices showed that station classifications depended on the indicators and criteria applied. Their combined use provides a preliminary basis for identifying locations requiring further investigation, while the PQI and clustering offer exploratory summaries rather than independently validated ecological classifications.
The findings support targeted verification of metal contamination, investigation of nutrient and wastewater inputs, and continued monitoring of plastic particles. They do not establish pollutant-specific biological causation, seasonal persistence, or whole-river conditions. Verification of the reported Cd concentrations, seasonal replication, polymer confirmation, and independent validation of the ecological classifications are required before the assessment can support broader ecological or operational early-warning claims.
Supplementary Materials
The following supporting information can be downloaded at: https://www.mdpi.com/article/10.3390/w18202586/s1; Folder 1: PCA_analysis and tests, Folder 2: Trophic_recalculation.
Author Contributions
Conceptualization, S.F.F.S.; methodology, S.M.M.R., S.F.F.S. and M.S.I.; formal analysis, M.A.H. and M.S.I.; investigation, S.M.M.R., F.A.K., K.A.H., N.U.N. and N.A.; data curation, F.A.K., M.A.H. and N.A.; writing—original draft preparation, F.A.K., K.A.H., M.M.H. and M.S.I.; writing—review and editing, S.F.F.S., M.M.H. and M.A.H.; visualization, F.A.K. and M.A.H.; supervision, S.M.M.R. and S.F.F.S.; funding acquisition, K.A.H. All authors have read and agreed to the published version of the manuscript.
Funding
This research was funded by the University Grants Commission (UGC) of Bangladesh through the project “Evaluation of Surface and Groundwater Quality in the Shitalakha and Balu River Basins and Enclosed Adjacent Areas of Dhaka City” (Funding number: PRMTTCBMU-39).
Data Availability Statement
The available station-level measurements, retained phytoplankton summaries, analytical inputs, calculation settings, and code supporting the revised metal indices, PCA/PQI, correlation analysis, and hierarchical clustering are provided in Supplementary Data S1. If more data is needed, contact the corresponding author upon reasonable request.
Acknowledgments
During the preparation of this manuscript/study, the authors used Gemini 3.1 Pro (Nano Banana 2) AI for the purpose of assisting with the development and refinement of the Graphical Abstract. The authors have reviewed and edited the output and take full responsibility for the content of this publication.
Conflicts of Interest
The authors declare no conflicts of interest.
References
- Majed, N.; Islam, M.A.S. Contaminant discharge from outfalls and subsequent aquatic ecological risks in the river systems in Dhaka City: Extent of waste load contribution in pollution. Front. Public Health 2022, 10, 880399. [Google Scholar] [CrossRef] [Scilit] [PubMed]
- Miah, O.; Anik, A.H.; Sorker, R.; Parvin, F.; Shammi, M.; Tareq, S.M. Impacts of rapid urbanization on long-term water quality of the peripheral River of Dhaka, Bangladesh. Water Environ. Res. 2025, 97, e70000. [Google Scholar] [CrossRef] [Scilit] [PubMed]
- Sadiqa, H.; Al-Amin, M.; Sarker, M.M.H. Impact of Urban Wastes on Water Quality of Turag River. Int. J. Multidiscip. Inf. Res. Rev. 2021, 1, 244–251. [Google Scholar] [CrossRef]
- Bahar, M.A. Characterization of Heavy Metal in the Peripheral Rivers Around Dhaka City. Master’s Thesis, Bangladesh University of Engineering and Technology (BUET), Dhaka, Bangladesh, 2012. [Google Scholar]
- Khan, B. Integrated water resource management to secure sound environmental management: Reflections in two major water laws of Bangladesh. Dhaka Univ. Law J. 2025, 35, 167–190. [Google Scholar] [CrossRef] [Scilit]
- Ahmed, A.M.M.M.; Roy, K. Utilization and conservation of water resources in Bangladesh. J. Dev. Sustain. Agric. 2007, 2, 35–44. [Google Scholar] [CrossRef]
- Rahman, A.; Zafor, M.A.; Kar, S. Analysis and comparison of surface water quality parameters in and around Dhaka city. Int. J. Civ. Eng. Technol. 2012, 3, 7–15. [Google Scholar]
- Papry, S.A. Assessment of Water Quality of Selected Rivers in Bangladesh Using FEWS Software. Master’s Thesis, Bangladesh University of Engineering and Technology (BUET), Dhaka, Bangladesh, 2019. [Google Scholar]
- Pia, H.I.; Akhter, M.; Sarker, S.; Hassan, M.; Rayhan, A.B.M.S.; Islam, M.M.; Hassan, M.A. Contamination level (water quality) assessment and agro-ecological risk management of Shitalakshya River of Dhaka, Bangladesh. Hydrol. Curr. Res. 2018, 9, 292. Available online: https://www.researchgate.net/publication/326013966_Contamination_Level_Water_Quality_Assessment_and_Agro-ecological_Risk_Management_of_Shitalakshya_River_of_Dhaka_Bangladesh (accessed on 28 September 2026).
- Karr, J.R.; Chu, E.W. Restoring Life in Running Waters: Better Biological Monitoring; Island Press: Washington, DC, USA, 1998. [Google Scholar]
- Birk, S.; Bonne, W.; Borja, A.; Brucet, S.; Courrat, A.; Poikane, S.; Solimini, A.; Van De Bund, W.; Zampoukas, N.; Hering, D. Three hundred ways to assess Europe’s surface waters: An almost complete overview of biological methods to implement the Water Framework Directive. Ecol. Indic. 2012, 18, 31–41. [Google Scholar] [CrossRef] [Scilit]
- Islam, S.M.D.; Huda, M.E. Water pollution by industrial effluent and phytoplankton diversity of Shitalakhya River, Bangladesh. J. Sci. Res. 2016, 8, 191–198. [Google Scholar] [CrossRef] [Scilit]
- Kabir, M.H.; Tusher, T.R.; Hossain, M.S.; Islam, M.S.; Shammi, R.S.; Kormoker, T.; Proshad, R.; Islam, M. Evaluation of spatio-temporal variations in water quality and suitability of an ecologically critical urban river employing water quality index and multivariate statistical approaches: A study on Shitalakhya River, Bangladesh. Hum. Ecol. Risk Assess. 2021, 27, 1388–1415. [Google Scholar] [CrossRef] [Scilit]
- Roy, B.B.; Afrin, R.; Barman, S.C.; Mia, M.Y. Physicochemical status of Sitalakkhya River, an ecologically critical area (ECA) of Bangladesh. Int. J. Environ. Agric. Biotechnol. 2019, 4, 1–9. [Google Scholar] [CrossRef] [Scilit]
- Suchi, P.D.; Shaikh, M.A.A.; Saha, B.; Moniruzzaman, M.; Hossain, M.K.; Parvin, A.; Parvin, A. Comprehensive index analysis approach for ecological and human health risk assessment of a tributary river in Bangladesh. Heliyon 2024, 10, e32542. [Google Scholar] [CrossRef] [Scilit] [PubMed]
- Beutler, M.; Wiltshire, K.H.; Meyer, B.; Moldaenke, C.; Lüring, C.; Meyerhöfer, M.; Hansen, U.; Dau, H. A fluorometric method for the differentiation of algal populations in vivo and in situ. Photosynth. Res. 2002, 72, 39–53. [Google Scholar] [CrossRef] [Scilit] [PubMed]
- Baird, R.B.; Rice, E.W.; Eaton, A.D. (Eds.) Standard Methods for the Examination of Water and Wastewater, 23rd ed.; American Public Health Association, American Water Works Association, Water Environment Federation: Washington, DC, USA, 2017. [Google Scholar]
- Department of Environment (DoE), Government of Bangladesh. Environmental Conservation Rules, 2023; Ministry of Environment, Forest and Climate Change: Dhaka, Bangladesh, 2023.
- World Health Organization. Guidelines for Drinking-Water Quality: Fourth Edition Incorporating the First and Second Addenda; World Health Organization: Geneva, Switzerland, 2022. [Google Scholar]
- Masura, J.; Baker, J.; Foster, G.; Arthur, C. Laboratory Methods for the Analysis of Microplastics in the Marine Environment: Recommendations for Quantifying Synthetic Particles in Waters and Sediments; NOAA Technical Memorandum NOS-OR&R-48; NOAA: Silver Spring, MD, USA, 2015. [Google Scholar] [CrossRef]
- Sowrav, S.F.F.; Rahman, S.M.M.; Hossain, M.A.; Hafiz, K.B.; Hossain, N.I.M.; Alam, M.N.-E.; Rahman, M.S.; Choudhury, T.R. Multi-Dimensional Approach for an Environmental Health Assessment of a Deltaic Mangrove Ecosystem, Sundarbans. Environ. Adv. 2023, 12, 100377. [Google Scholar] [CrossRef] [Scilit]
- Canadian Council of Ministers of the Environment (CCME). Canadian Water Quality Guidelines for the Protection of Aquatic Life: CCME Water Quality Index 1.0, User’s Manual; CCME: Winnipeg, MB, Canada, 2001. [Google Scholar]
- Vollenweider, R.A.; Giovanardi, F.; Montanari, G.; Rinaldi, A. Characterization of the trophic conditions of marine coastal waters with special reference to the NW Adriatic Sea: Proposal for a trophic scale, turbidity and generalized water quality index. Environmetrics 1998, 9, 329–357. [Google Scholar] [CrossRef]
- Noriega, C.; Araújo, M.; Flores-Montes, M.; Araújo, J. Trophic dynamics (Dissolved Inorganic Nitrogen-DIN and Dissolved Inorganic Phosphorus-DIP) in tropical urban estuarine systems during periods of high and low river discharge rates. An. Acad. Bras. Ciênc. 2019, 91, e20180244. [Google Scholar] [CrossRef] [Scilit] [PubMed]
- Xu, M.; Liu, H.; Beck, R.A.; Reif, M.K.; Emery, E.B.; Young, J.L. Regional Analysis of Lake and Reservoir Water Quality with Multispectral Satellite Remote Sensing Images; ERDC/EL TR-19-19; U.S. Army Engineer Research and Development Center, Environmental Laboratory: Vicksburg, MS, USA, 2019. [CrossRef] [Scilit]
- Ahirvar, B.P.; Das, P.; Srivastava, V.; Kumar, M. Perspectives of heavy metal pollution indices for soil, sediment, and water pollution evaluation: An insight. Total Environ. Res. Themes 2023, 6, 100039. [Google Scholar] [CrossRef] [Scilit]
- Nemerow, N.L. Scientific Stream Pollution Analysis; McGraw-Hill: New York, NY, USA, 1974. [Google Scholar]
- Backman, B.; Bodiš, D.; Lahermo, P.; Rapant, S.; Tarvainen, T. Application of a groundwater contamination index in Finland and Slovakia. Environ. Geol. 1998, 36, 55–64. [Google Scholar] [CrossRef] [Scilit]
- Shannon, C.E.; Weaver, W. The Mathematical Theory of Communication; University of Illinois Press: Urbana, IL, USA, 1964. [Google Scholar]
- Pielou, E.C. The measurement of diversity in different types of biological collections. J. Theor. Biol. 1966, 13, 131–144. [Google Scholar] [CrossRef] [Scilit]
- Margalef, R. Perspectives in Ecological Theory; University of Chicago Press: Chicago, IL, USA, 1968. [Google Scholar]
- Hossain, N.I.; Rahman, S.M.; Hossain, M.A.; Hafiz, K.B.; Sowrav, S.F.F.; Masud-Ul-Alam, M.; Choudhury, T.R. Decoding phytoplankton quality in the waterways of the Sundarbans mangrove forest of Bangladesh. Mar. Pollut. Bull. 2025, 213, 117669. [Google Scholar] [CrossRef] [Scilit] [PubMed]
- Kaiser, H.F. The application of electronic computers to factor analysis. Educ. Psychol. Meas. 1960, 20, 141–151. [Google Scholar] [CrossRef] [Scilit]
- Benjamini, Y.; Hochberg, Y. Controlling the false discovery rate: A practical and powerful approach to multiple testing. J. R. Stat. Soc. Ser. B Methodol. 1995, 57, 289–300. [Google Scholar] [CrossRef] [Scilit]
- Dodds, W.K.; Smith, V.H. Nitrogen, phosphorus, and eutrophication in streams. Inland Waters 2016, 6, 155–164. [Google Scholar] [CrossRef] [Scilit]
- Paerl, H.W.; Huisman, J. Climate change: A catalyst for global expansion of harmful cyanobacterial blooms. Environ. Microbiol. Rep. 2009, 1, 27–37. [Google Scholar] [CrossRef] [Scilit] [PubMed]
- Sultana, S.; Islam, M.S.; Kabir, M.H.; Sarker, R.; Tusher, T.R.; Hoque, M.M.M.; Meghla, N.T. Spatiotemporal discrepancies and risk assessment of toxic heavy metals in surface water of Shitalakhya River around Narayanganj port in Bangladesh. Int. J. Agric. Res. Innov. Technol. 2025, 14, 74–84. [Google Scholar] [CrossRef] [Scilit]
- Brennecke, D.; Duarte, B.; Paiva, F.; Caçador, I.; Canning-Clode, J. Microplastics as vector for heavy metal contamination from the marine environment. Estuar. Coast. Shelf Sci. 2016, 178, 189–195. [Google Scholar] [CrossRef] [Scilit]
- Liu, S.; Shi, J.; Wang, J.; Dai, Y.; Li, H.; Li, J.; Liu, X.; Chen, X.; Wang, Z.; Zhang, P. Interactions between microplastics and heavy metals in aquatic environments: A review. Front. Microbiol. 2021, 12, 652520. [Google Scholar] [CrossRef] [Scilit] [PubMed]
- Barakat, M.A. New trends in removing heavy metals from industrial wastewater. Arab. J. Chem. 2011, 4, 361–377. [Google Scholar] [CrossRef] [Scilit]
- Babel, S.; Kurniawan, T.A. Low-cost adsorbents for heavy metals uptake from contaminated water: A review. J. Hazard. Mater. 2003, 97, 219–243. [Google Scholar] [CrossRef] [Scilit] [PubMed]
- Qasem, N.A.A.; Mohammed, R.H.; Lawal, D.U. Removal of heavy metal ions from wastewater: A comprehensive and critical review. npj Clean Water 2021, 4, 36. [Google Scholar] [CrossRef] [Scilit]
- Razzak, S.A.; Faruque, M.O.; Alsheikh, Z.; Alsheikhmohamad, L.; Alkuroud, D.; Alfayez, A.; Hossain, S.M.Z.; Hossain, M.M. A comprehensive review on conventional and biological-driven heavy metals removal from industrial wastewater. Environ. Adv. 2022, 7, 100168. [Google Scholar] [CrossRef] [Scilit]
- Vymazal, J.; Březinová, T. Accumulation of heavy metals in aboveground biomass of Phragmites australis in horizontal flow constructed wetlands for wastewater treatment: A review. Chem. Eng. J. 2016, 290, 232–242. [Google Scholar] [CrossRef] [Scilit]

Disclaimer/Publisher’s Note: The statements, opinions and data contained in all publications are solely those of the individual author(s) and contributor(s) and not of MDPI and/or the editor(s). MDPI and/or the editor(s) disclaim responsibility for any injury to people or property resulting from any ideas, methods, instructions or products referred to in the content. |
© 2026 by the authors. Licensee MDPI, Basel, Switzerland. This article is an open access article distributed under the terms and conditions of the Creative Commons Attribution (CC BY) license.