


Abstract
The water–energy–food (WEF) nexus is central to regional sustainable development, particularly in resource-based regions (RBRs) facing resource depletion and ecological strain. While existing studies have examined internal WEF linkages and extended the framework to include external dimensions such as ecology and land, the stage-based succession of limiting factors across developmental stages has received limited attention, and resource-based cities in which energy and grain production functions coexist remain underexamined. Taking Daqing, a typical resource-based city in China, as a case study, this paper constructs a comprehensive evaluation index system covering water, energy, food, and regional development subsystems. The CRITIC method is adopted to calculate indicator weights, and the coupling coordination degree model is applied to analyze the evolutionary characteristics of the WEF system’s coordinated development over the period 2005–2023. The obstacle degree model is further employed to identify obstacle factors across different stages. The results indicate that the comprehensive evaluation index experienced three evolutionary stages: rapid growth, structural adjustment, and recovery and improvement. The coupling degree remained at a high level, increasing from 0.915 to 0.999, while the coupling coordination degree rose from 0.508 to 0.789, evolving from borderline coordination to moderate coordination. The dominant obstacle factors exhibit notable succession characteristics, shifting from energy and water constraints to food subsystem pressures, and finally to water supply–demand imbalances. The coordinated development of Daqing’s WEF system is driven by three core forces: the oil and gas industry cycle, water resource regulation policies, and grain planting structure adjustments. These findings provide theoretical references and practical implications for optimizing resource management and advancing sustainable development in RBRs.
1. Introduction
Water, energy, and food are core strategic resources that support human survival and social development [1,2,3]. With continuous global population growth and rapid socioeconomic development, the demand for these resources has steadily increased [4]. Relevant projection data indicate that by 2050, global demand for water resources, energy, and food will increase by 60%, 55%, and 80%, respectively. Resource shortages will become increasingly prominent, and the global resource security situation will become more severe [5,6]. The water–energy–food (WEF) nexus is a complex system in which water, energy, and food are interdependent, mutually constrained, and highly coupled. Water is essential for energy generation and agricultural irrigation; energy is required for water supply, treatment, and food production; and food production relies heavily on both water and energy inputs. In formulating regulatory policies, traditional resource management models predominantly focus on single resources, thereby neglecting the inherent interlinkages among the three resources. Such approaches not only fail to meet the requirements for coordinated development of the WEF system but also tend to trigger a series of secondary problems, including resource misallocation, supply–demand imbalances, and ecological degradation, making it difficult to achieve regional development goals of efficient resource utilization and sustainable management [7].
The 2011 Bonn Conference formally introduced the “nexus” concept for water, energy, and food [8], and the WEF nexus has since become a research hotspot [9,10]. Existing studies can be divided into qualitative and quantitative strands. Qualitative research has focused on constructing theoretical frameworks and reviewing policy systems. Hejnowicz et al. critically appraised the WEF nexus as overly rooted in natural sciences with insufficient social–political engagement [11]. Kellner et al. extended the “Social–Ecological Action Situations” framework to analyze past coevolution and envision future pathways [12]. Ojeda-Matos and Jones-Crank conducted a PRISMA-based systematic review of WEF nexus studies from 2015 to 2024, identifying research gaps in target populations, affordability, and international cooperation [13]. In quantitative research, the coupling coordination degree model is widely used to measure multi-dimensional subsystem development, coupling coordination, and overall evolutionary trajectories [14,15]. Feng et al. examined the coupling coordination of China’s inter-provincial WEF security system using a coupling coordination model with 2004–2021 provincial data, revealing a significant improvement from near imbalance to good coordination [16]. Jing et al. employed a coupling coordination degree model to assess the WEFL nexus in the Yangtze River Economic Belt from 2006 to 2020, revealing that its coordinated development level generally increased, with the lower reaches outperforming the upper and middle reaches [17]. Zhou et al. used a coupling coordination degree model to assess the WEFE system in Dalad Banner and its townships, showing a high coupling degree but a low coordination degree, with significant spatial imbalances in coordinated development [18]. However, existing studies have largely treated obstacle factors as a single ranking over the study period, and the stage-based succession of limiting factors has received limited attention. This limits the ability of regional planning to identify stage-specific weak links in WEF system coordination and to design policies with sufficient relevance and practicality.
The coordinated development of the WEF system occurs within a complex external environment, and external changes are transmitted through the nexus to resource production and consumption, increasing the complexity and uncertainty of system evolution. Recent studies have extended the WEF nexus to incorporate ecosystem, land, and climate dimensions through WEFE and WEFL frameworks [19,20,21]. These extended frameworks have been applied to various resource-based cities: Qu et al. examined the WEFE system in Ordos, finding that the energy sector imposed the greatest influence on coupling development, with industrial water use, coal consumption, and fertilizer application as primary constraints [22]; Wang and Fang analyzed the WEF nexus security in Yulin on the Loess Plateau, showing that water resources constituted the main constraint on system security [23]. However, these studies have focused predominantly on resource-based cities with a single dominant resource (coal or energy), while cities with coexisting energy and grain production functions remain underexamined. Resource-based regions are important carriers of national socioeconomic development and resource supply [24], but long-term intensive and extensive resource exploitation has exacerbated pressures on water, energy, and food supplies and triggered ecological problems such as soil erosion, ecological degradation, and environmental pollution [25]. External pressures such as environmental degradation, population expansion, urbanization, and regional economic policies further disrupt the stable operation of the WEF system [26,27]. Exploring pathways for coordinated WEF system development is therefore critical for addressing the development dilemmas of resource-based regions.
To address these two gaps, this study selects Daqing, a typical petroleum resource-based city and national commodity grain base in China, as the research case. Daqing hosts both energy production and grain production within one administrative region, and its scarce local water resources are strongly shaped by inter-basin water diversion, making it a representative case for studying the evolution of the water–energy–food (WEF) system in resource-based cities. Specifically, this study: (1) constructs an evaluation index system for the coordinated development of the water–energy–food system that incorporates both internal WEF couplings and external socio-economic–environmental linkages, treating the regional development subsystem as part of the WEF system; and (2) integrates CRITIC weighting, the coupling coordination degree model, and the obstacle degree model into a unified analytical workflow, in which CRITIC determines objective weights within each subsystem, the coupling coordination degree model identifies evolutionary stages, and the obstacle degree model identifies the major limiting factors in each stage. This integration allows the study to identify how limiting factors shift across stages. The study provides theoretical references and practical implications for exploring coordinated-development pathways of the WEF system and advancing sustainable development in resource-based regions.
2. Study Area
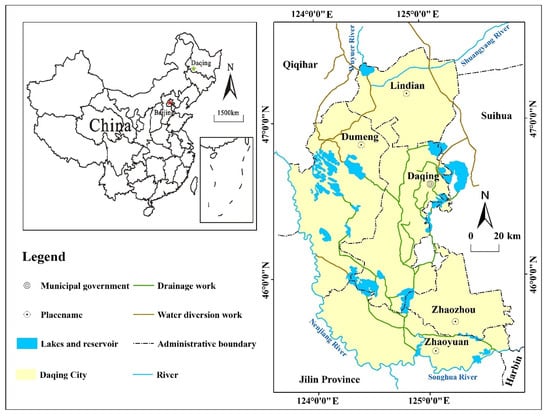
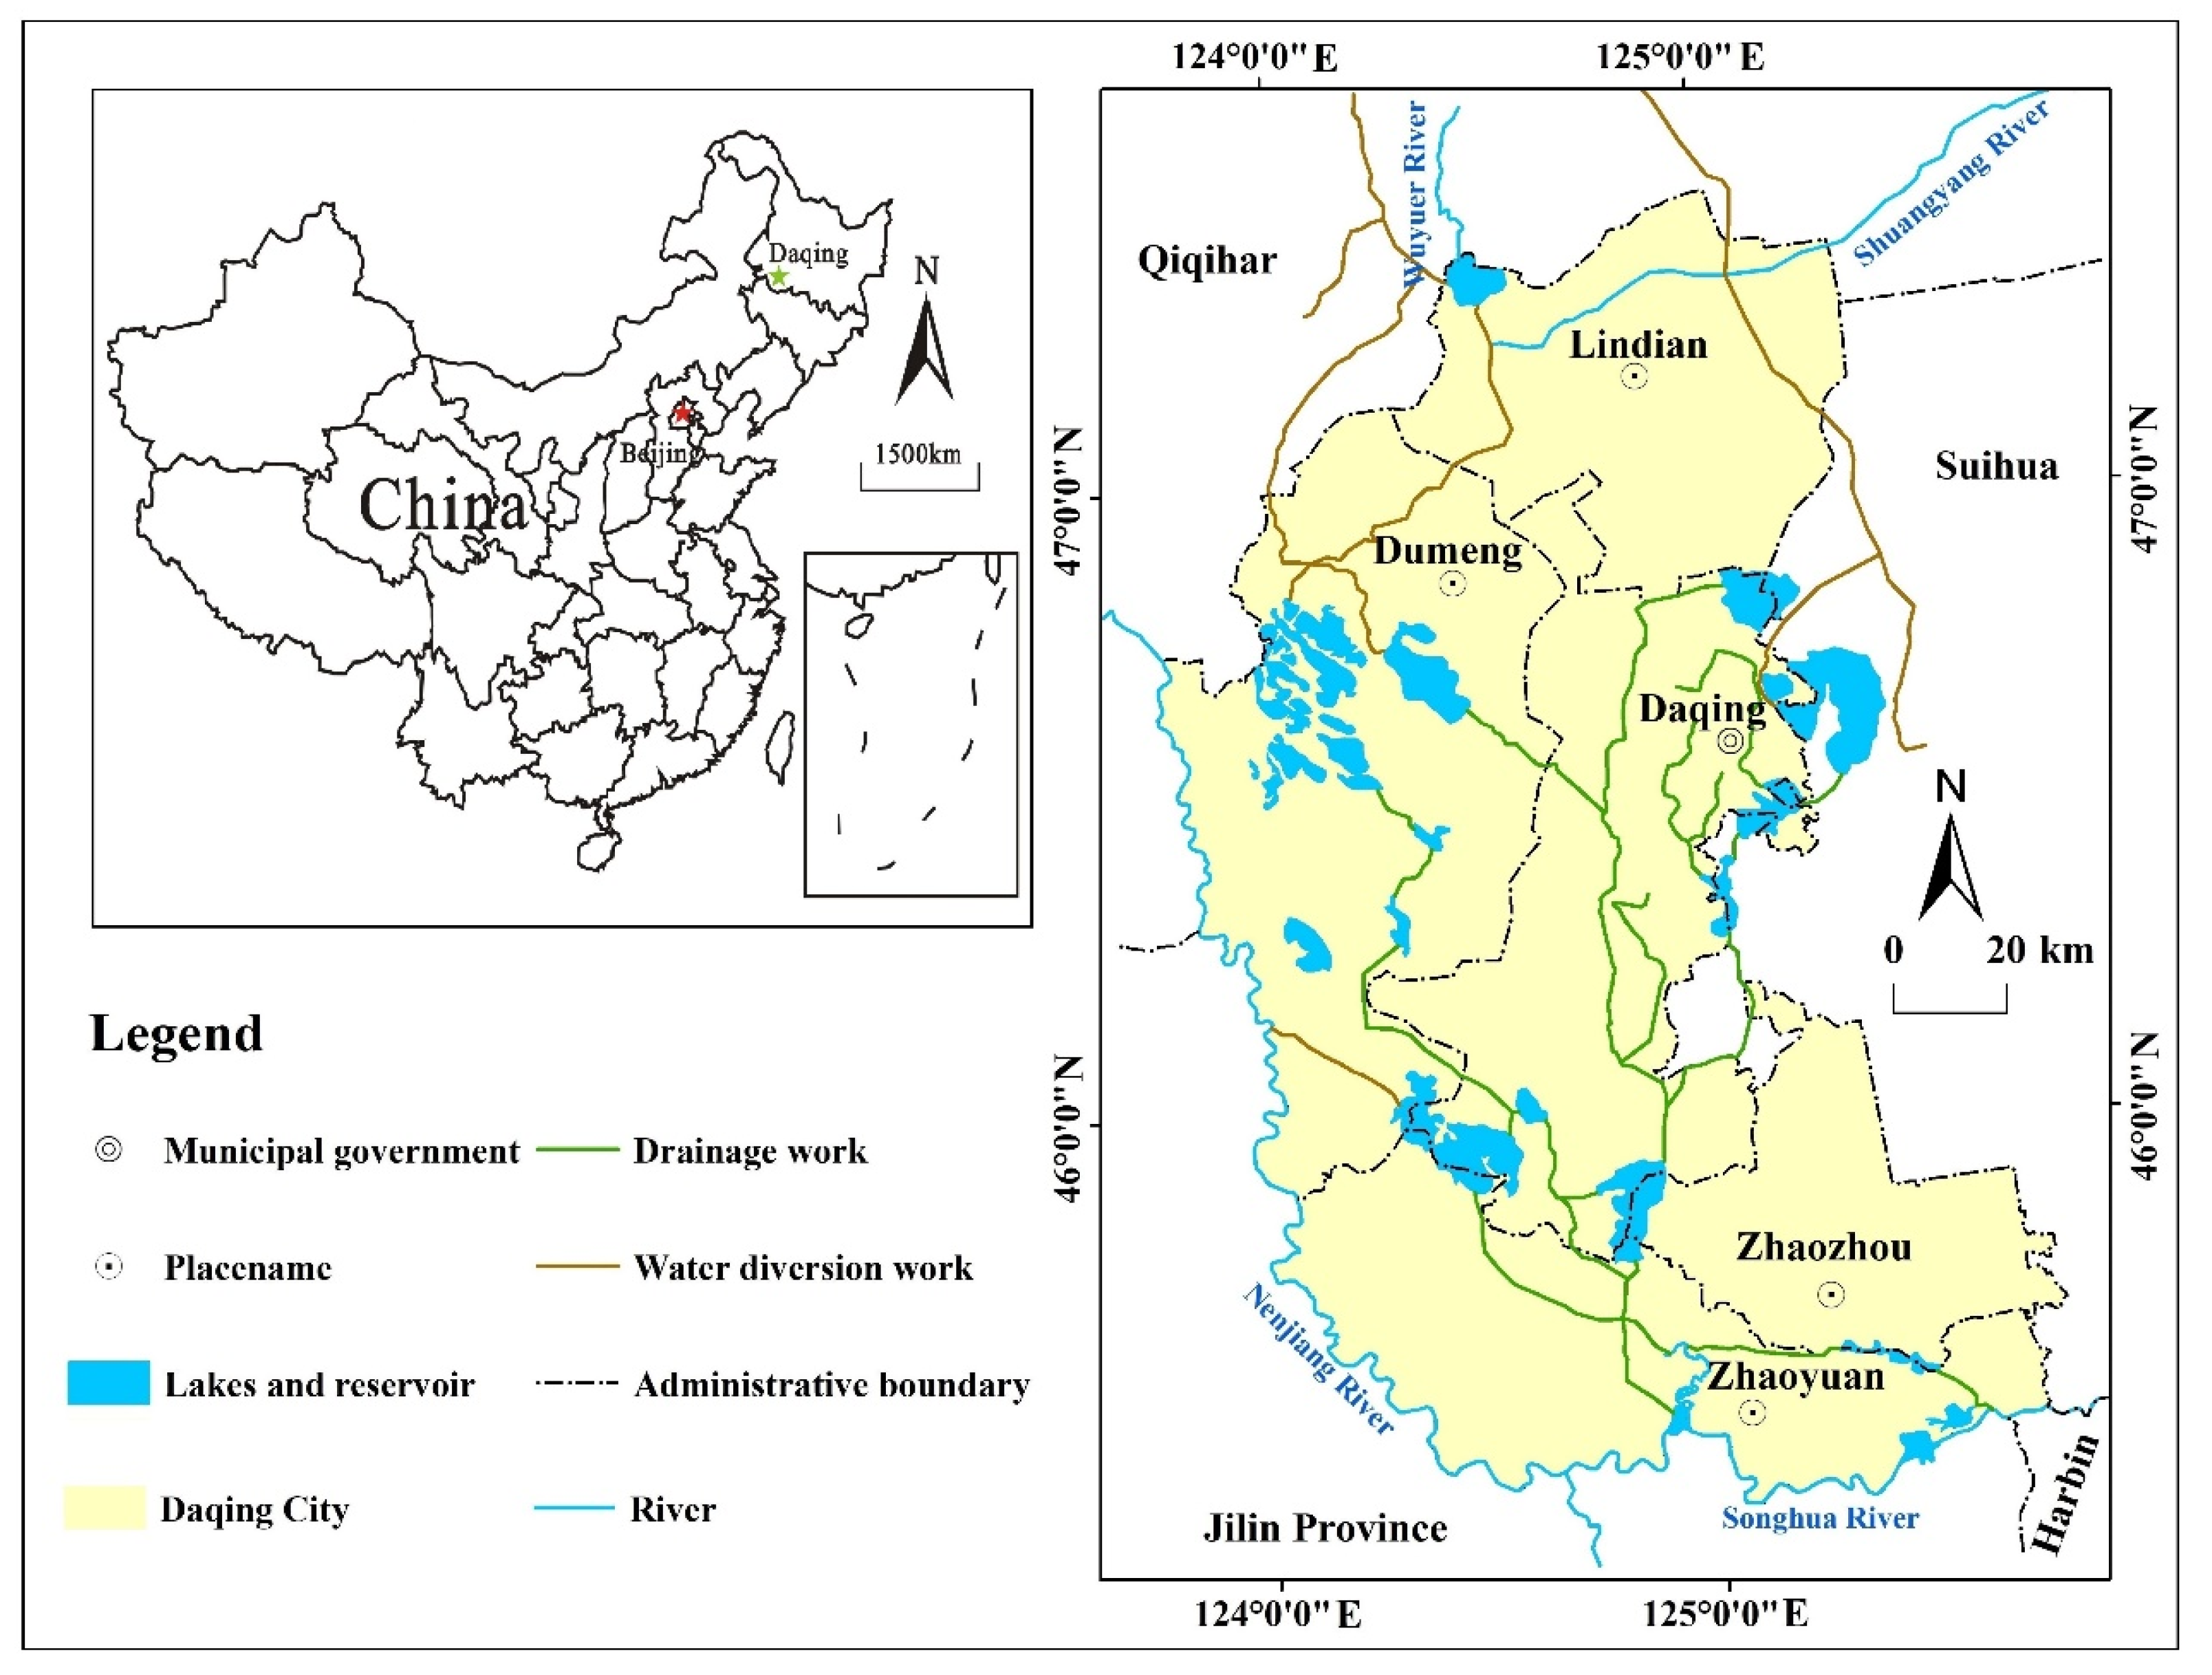
Daqing City lies in southwestern Heilongjiang Province, Northeast China, covering an area of 22 161 km2 (Figure 1). It features a temperate continental monsoon climate, with a mean annual temperature of 4.2 °C, average annual precipitation of 427.5 mm, and mean annual evaporation reaching 1600 mm, leading to severe regional water scarcity. Precipitation mainly occurs from June to September, contributing approximately 70% of annual precipitation.
Figure 1.
Map of Daqing City.
Located within the hydrologically closed basin of the Songnen Plain, Daqing slopes from the northeast toward the southwest. Although the city is bordered by the Nenjiang and Songhua rivers, it lacks perennial natural rivers. Seasonal watercourses such as the Shuangyang River fail to form stable regional drainage networks. Local water resources are extremely scarce: the multi-year average water resource availability totals 19.5 × 10⁸ m3, with a per capita water availability of merely 714 m3. Prior to the operation of the Nenjiang River Diversion Project, regional water supply relied heavily on groundwater. Accelerated oilfield development, grain-base construction, and urban expansion triggered severe groundwater overdraft, and the area of groundwater overdraft zones once peaked at 1151 km2.
Following the operation and expansion of the Nenjiang River Diversion Project, diversion water has gradually replaced groundwater as the primary regional water source. Coupled with optimized water resource management measures, regional groundwater extraction has continuously declined. In 2023, surface water and groundwater accounted for 80% and 20% of the total water supply in Daqing, respectively, demonstrating a notable improvement in the regional water-supply structure. Agricultural irrigation and industrial use accounted for 80% and 10% of total water use, respectively, highlighting Daqing’s dual strategic status as a national commodity grain base and a major energy-production hub.
Daqing hosts the Daqing Oilfield, one of the world’s largest sandstone oilfields. The oilfield covers an oil-bearing area exceeding 6000 km2, with proven oil reserves of 64 × 108 t and natural gas reserves of 548.2 × 10⁸ m3. Since 1959, Daqing has produced more than 25 × 108 t of crude oil, accounting for 36% of China’s onshore crude oil production. In 2023, its crude oil and natural gas production reached 29.71 × 10⁶ t and 53.45 × 10⁸ m3, respectively, strongly underpinning national energy security.
As a national modern agricultural demonstration zone, Daqing possesses high-quality cold-region black-soil resources. Its grain yield per unit area is approximately 15% higher than the national average. In 2023, total regional grain output reached 460.99 × 10⁴ t, with grain crops occupying nearly 99% of the total sown area. The local cropping system is dominated by rice, corn, soybeans, and wheat under a single-cropping system. Crop growing seasons overlap with the regional rainy season, forming a typical agricultural system that combines rain-fed and irrigated farming.
In summary, Daqing City undertakes multiple critical functions within the WEF nexus. As a core pillar of national energy security and an important commodity-grain production base, the city simultaneously faces prominent constraints of severe water scarcity and heavy reliance on external water diversion. Therefore, quantitatively evaluating the coordinated development level of Daqing’s WEF system and accurately diagnosing bottlenecks in regional resource exploitation and utilization are of great strategic significance for promoting sustainable regional development.
3. Methodology
3.1. Research Workflow
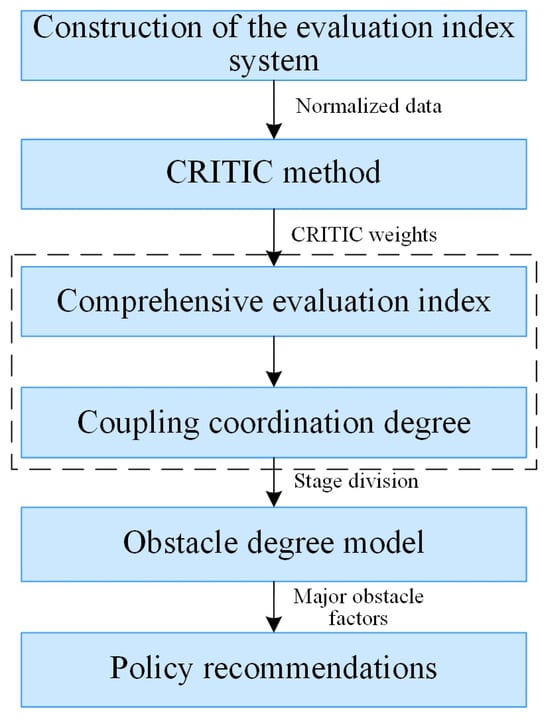
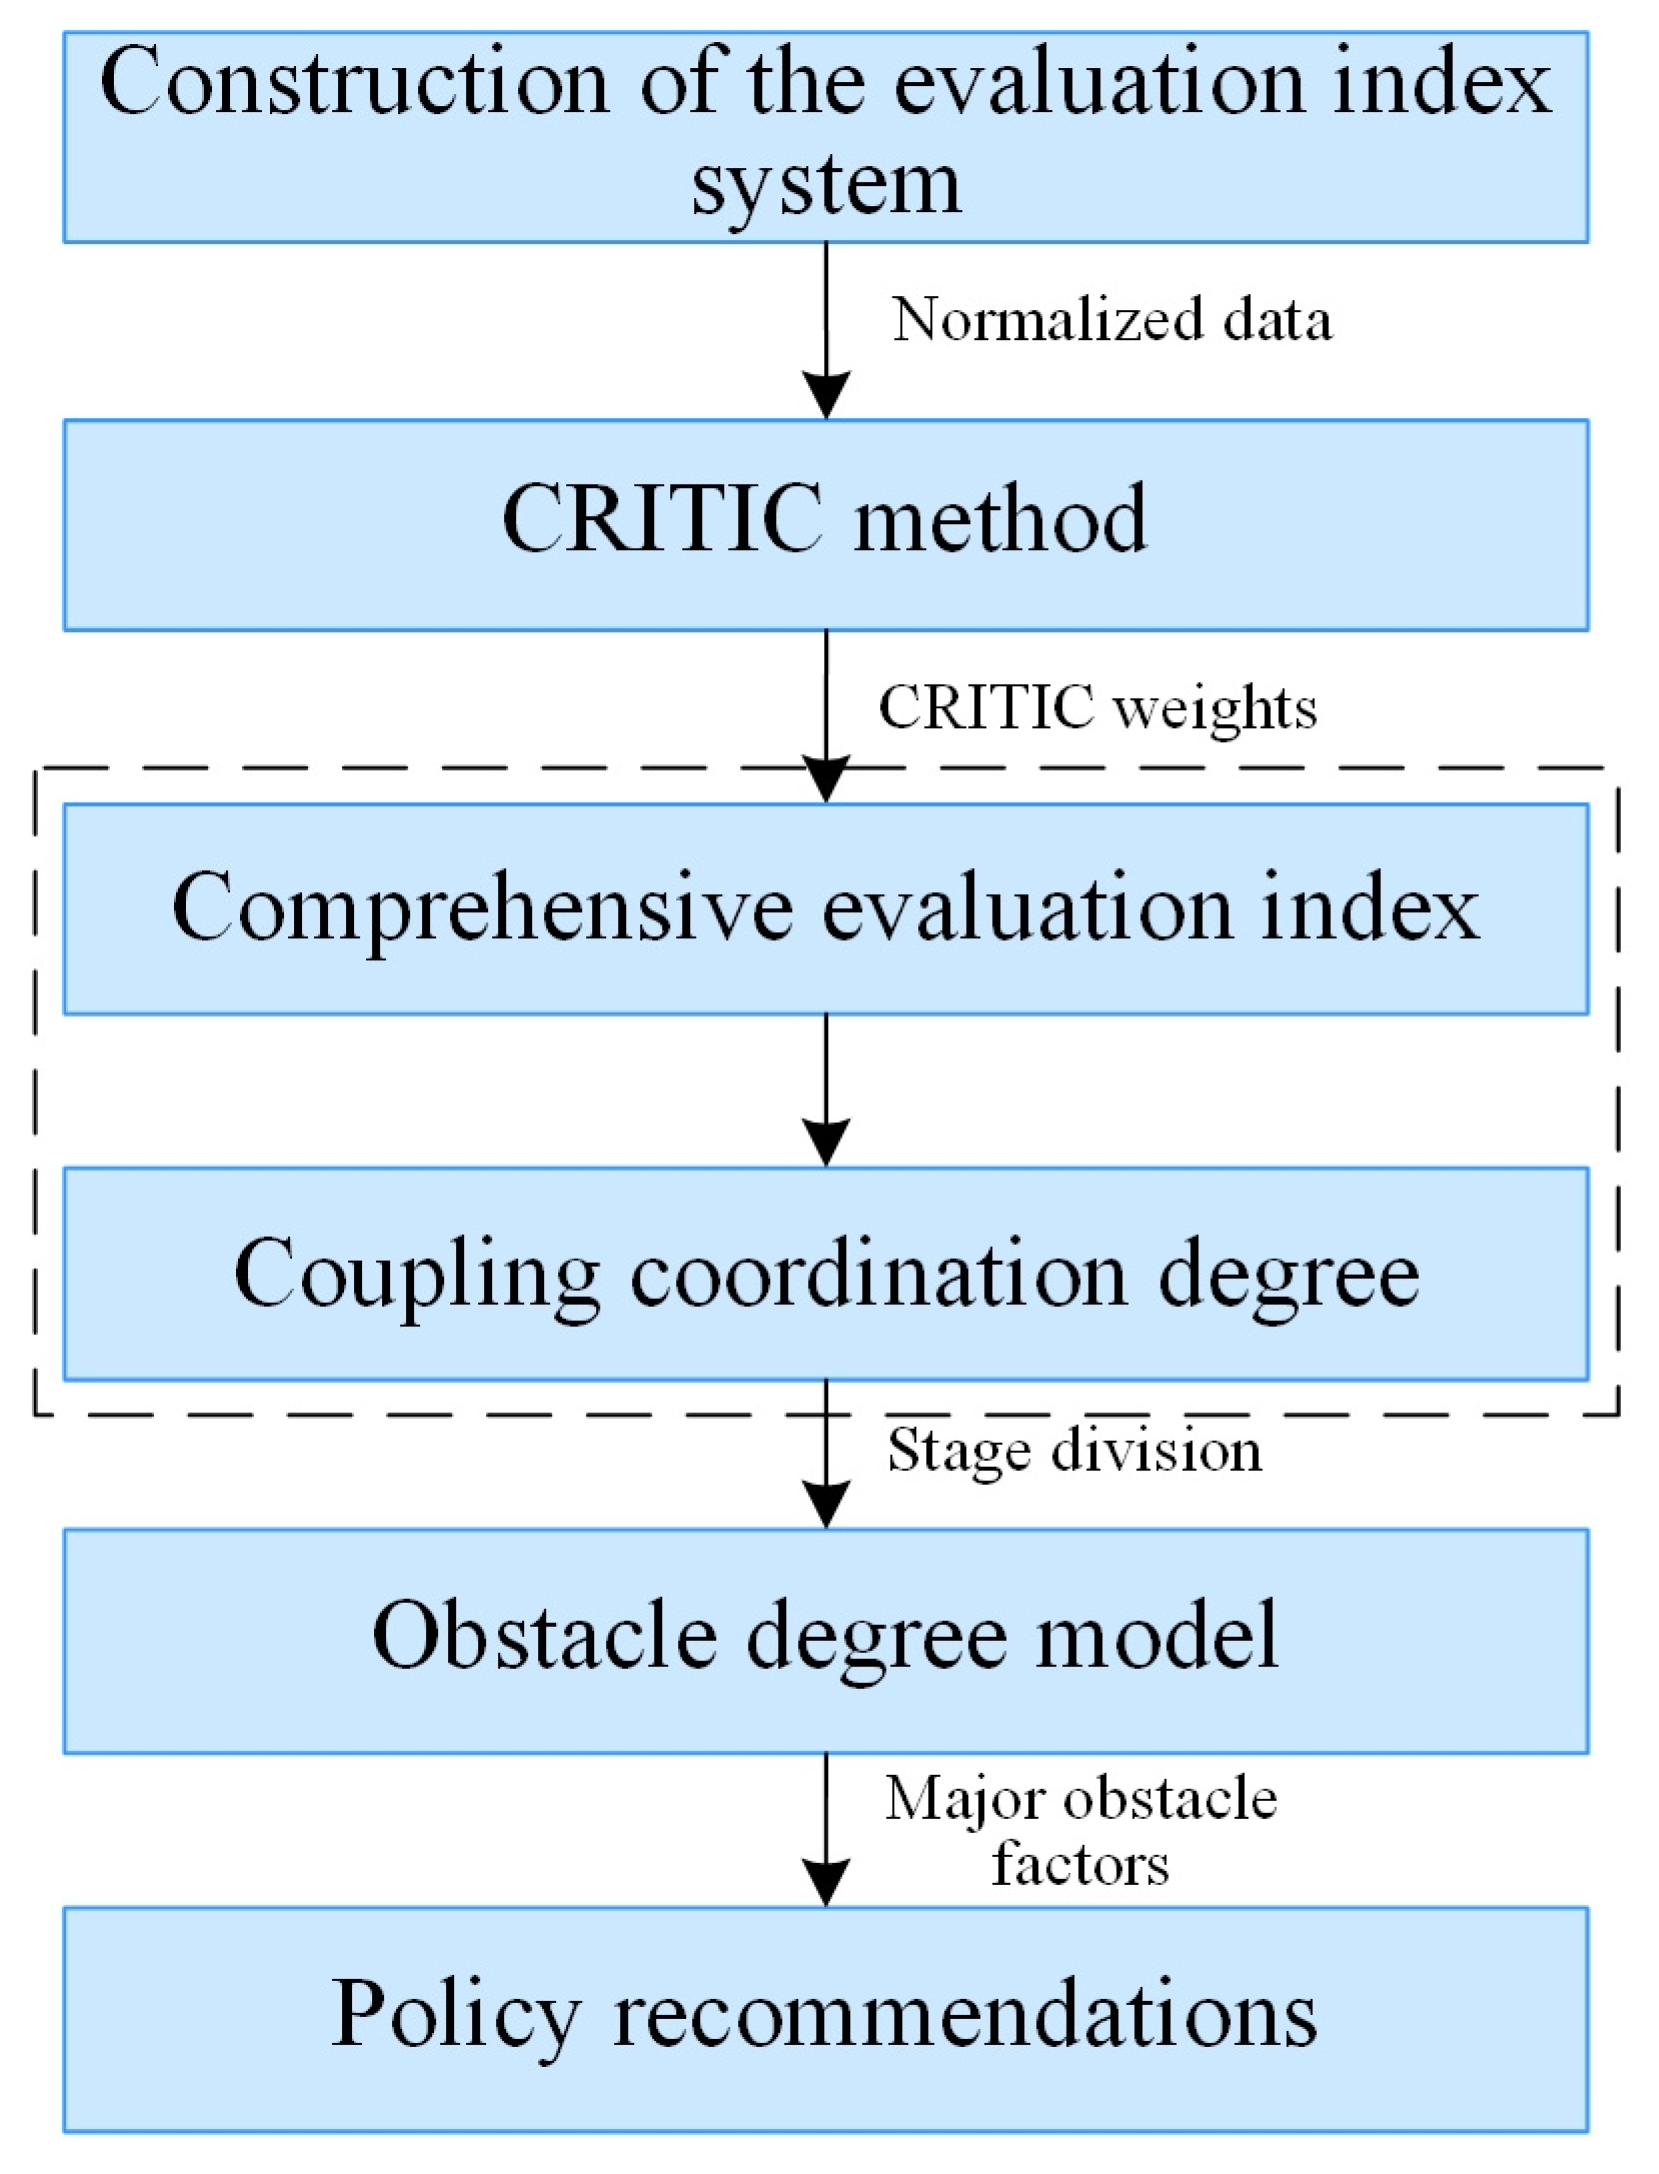
The analytical workflow proceeds in five steps (Figure 2): (1) constructing the evaluation index system; (2) applying CRITIC to the normalized data to determine objective weights; (3) calculating the comprehensive evaluation index and coupling coordination degree; (4) applying the obstacle degree model to identify stage-specific limiting factors; and (5) proposing policy recommendations based on the identified obstacle factors. The CRITIC weights feed into both the comprehensive evaluation index and the obstacle degree model, while the stage division derived from the comprehensive evaluation index provides the temporal framework for the obstacle analysis.
Figure 2.
Integrated analytical workflow.
3.2. Construction of an Evaluation Index System
Establishing a scientific and rational evaluation index system serves as the foundation for assessing the coordinated development level of the WEF system. Based on the WEF nexus framework and previous studies [28,29,30,31,32], this study selected 36 indicators to construct the evaluation index system for the coordinated development of the WEF system, as shown in Table 1. These indicators were selected through a three-step procedure: (1) establishing an initial indicator pool by reviewing WEF nexus literature, with particular attention to resource-based regions; (2) screening indicators based on their relevance to the WEF nexus, data availability and continuity for Daqing during 2005–2023, and consistency with Daqing’s resource-based characteristics; and (3) reviewing and finalizing the indicator set through discussions with local authorities, including the Daqing Water Affairs Bureau, Energy Bureau, Agriculture and Rural Affairs Bureau, and Statistics Bureau.
Table 1.
The evaluation index system for the coordinated development of the water–energy–food system.
The WEF system evaluation index system comprises four subsystems: water, energy, food, and regional development. These four subsystems are mutually constraining and mutually supporting, and are therefore treated as equally important components of the WEF system. The water subsystem includes three dimensions: water availability, water consumption, and water-use efficiency, which reflect resource endowment and supply capacity, consumption intensity and supply–demand balance, and the economic–technical performance of water use, respectively. The energy subsystem covers three dimensions: energy production, energy consumption, and energy efficiency. These correspond to energy resource endowment and supply capacity, residential energy use and supply–demand balance, and the economic output and conversion efficiency of energy, respectively. The food subsystem involves three aspects: food production, food trade, and food consumption. These represent grain production conditions and output levels, food supply capacity, terminal consumption levels, and regional food self-sufficiency. The regional development subsystem contains three key domains: economic structure, social development, and environmental governance. These reflect economic scale and industrial transformation, population size and living standards, and environmental governance capacity, respectively. Evaluation indicators are divided into positive (+) and negative (−) types. Positive indicators are those for which higher values favor the coordinated development of the WEF system, whereas negative indicators are those for which lower values favor coordinated development.
Daqing has no perennial natural rivers, resulting in limited local water availability. Historically, groundwater was overexploited to support oilfield development and urbanization. Although the recent completion of the Nenjiang River Diversion Project has reduced groundwater abstraction and facilitated partial water-level recovery in the depression cone, continued protection remains essential. Accordingly, the groundwater exploitation rate is designated as a negative indicator, for which lower values are considered favorable for system coordination. In contrast, as one of China’s premier production hubs for both energy and grain, Daqing generates large outflows of these two resources, which directly reflect its resource endowment and supply capacity. Higher outflows underscore the city’s strategic role in safeguarding national energy and food security, while also demonstrating its strengths in resource exploitation. Consequently, energy and grain outflows are treated as positive indicators, with larger values signaling a more favorable state of coordinated development within the WEF system. In addition, the food subsystem includes water requirement per unit area of grain production and fertilizer application intensity to capture the water and agrochemical pressures associated with rice expansion. The regional development subsystem includes GDP, the proportion of the tertiary sector in GDP, total population, and environmental governance indicators to reflect the transformation pressures of a resource-based city.
3.3. Data Source and Processing
3.3.1. Data Source
The data used for the WEF system’s coordinated development evaluation index system were sourced from official statistical yearbooks, government bulletins, and planning documents, supplemented by discussions with local authorities and field investigations in typical irrigation districts and petrochemical enterprises.
For the water subsystem, data were obtained from the Water Resources Bulletin of Daqing City, the Water Quota Standards of Heilongjiang Province, the Water Resources Bulletin of Heilongjiang Province, the 14th Five-Year Development Plan for Water Conservancy, and the Daqing Water Affairs Bureau.
For the energy subsystem, data were obtained from the Daqing Yearbook, the Statistical Yearbook of Daqing City, the Sustainable Development Plan of Daqing Oilfield, the Strategic Action Plan for Energy Development of China, and the Daqing Energy Bureau.
For the food subsystem, data were obtained from the Daqing Yearbook, the Statistical Yearbook of Daqing City, the Development Plan for Modern Agriculture in Daqing, and the Daqing Agriculture Bureau and Daqing Grain and Material Reserve Bureau.
For the regional development subsystem, data were obtained from the Daqing Yearbook, the Statistical Yearbook of Daqing City, the Environmental Statistics Yearbook of Daqing City, the Economic and Social Development Plan of Daqing City, the Statistical Yearbook of Heilongjiang Province, the China Statistical Yearbook, and the Daqing Ecology and Environment Bureau and Daqing Statistics Bureau.
3.3.2. Data Standardization
Due to differences in dimensions, magnitude, and types among different indicators, raw data require standardization to ensure comparability. In this study, min–max normalization was employed to render raw data dimensionless. The normalized values are relative to the study period rather than absolute. For indicators for which larger values favor the coordinated development of the WEF system, the positive indicator formula (Equation (1)) was applied for standardization. Conversely, the negative indicator formula (Equation (2)) was adopted for standardization. The standardized values of the 36 evaluation indicators are listed in Table A1 in the Appendix A.
where is the standardized value of indicator j in year i. is the actual value of indicator j in year i. and are, respectively, the maximum and minimum values of indicator j in year i.
3.3.3. Indicator Weights
The determination of indicator weights is crucial to the reliability of coordinated development evaluations for the WEF nexus. To objectively assess indicator importance while capturing the system’s inherent interdependencies, this study adopted the CRITIC method. This approach accounts for both intra-indicator contrast intensity and inter-indicator conflict [33]. By incorporating correlation coefficients, it effectively reduces information redundancy among indicators within each subsystem, avoiding weight inflation due to redundancy. The specific steps were as follows:
(1) Calculate the standard deviation of evaluation indicator j.
where m is the number of statistical years. is the mean value of evaluation indicator j.
(2) Calculate the Pearson correlation coefficient between evaluation indicators.
(3) Calculate the conflict index Rj of evaluation indicator j.
The conflict term in Equation (5) downweights highly correlated indicators, thereby reducing information redundancy.
(4) Calculate the information content Cj of evaluation indicator j.
where σj is the standard deviation of indicator j.
(5) Calculate the weight of evaluation indicator j.
where n is the number of evaluation indicators.
The CRITIC method is applied to the min–max normalized values described in Section 3.3.2, with positive indicators normalized using Equation (1), negative indicators using Equation (2), and the minimum and maximum values taken from 2005–2023. It is applied separately within each of the four subsystems so that the standard deviation and conflict index are calculated over the nine indicators of each subsystem, and the weights are normalized within the subsystem using Equation (7). The correlation matrices of the four subsystems are provided in Table A2, Table A3, Table A4 and Table A5.
3.4. Comprehensive Evaluation Index Model
The comprehensive evaluation index was used to measure the development level of each subsystem within the WEF system. A higher index value indicates a more advanced level of development, whereas a lower value reflects a relative development lag. The specific calculation formula was as follows:
where f(x), g(y), h(z), and I(u) represent the comprehensive evaluation indices of the water, energy, food, and regional development subsystems, respectively. ai, bj, ck, and dl are the weights of the respective indicators., , , and are the standardized data of the respective indicators, and n is the number of indicators selected for each subsystem. T is the comprehensive evaluation index of the WEF system. α, β, γ, and δ are weights representing the relative importance of each subsystem. The weighting in this study operates at two levels. The CRITIC method determines the weights of individual indicators within each subsystem, which are objective and data-driven. The subsystem weights (α, β, γ, δ) are set equal at 0.25, reflecting the assumption that the four subsystems are equally important for WEF system coordination. This equal-weighting treatment is commonly adopted in WEF nexus studies using the coupling coordination degree model [34].
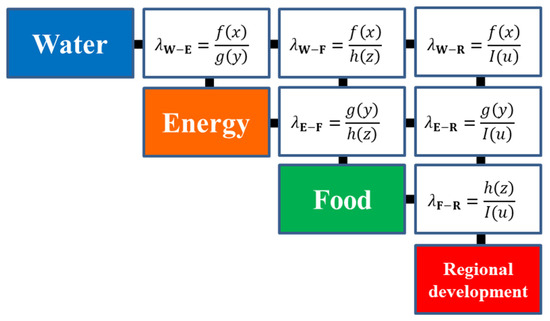
3.5. Comparison Coefficients Between Subsystems
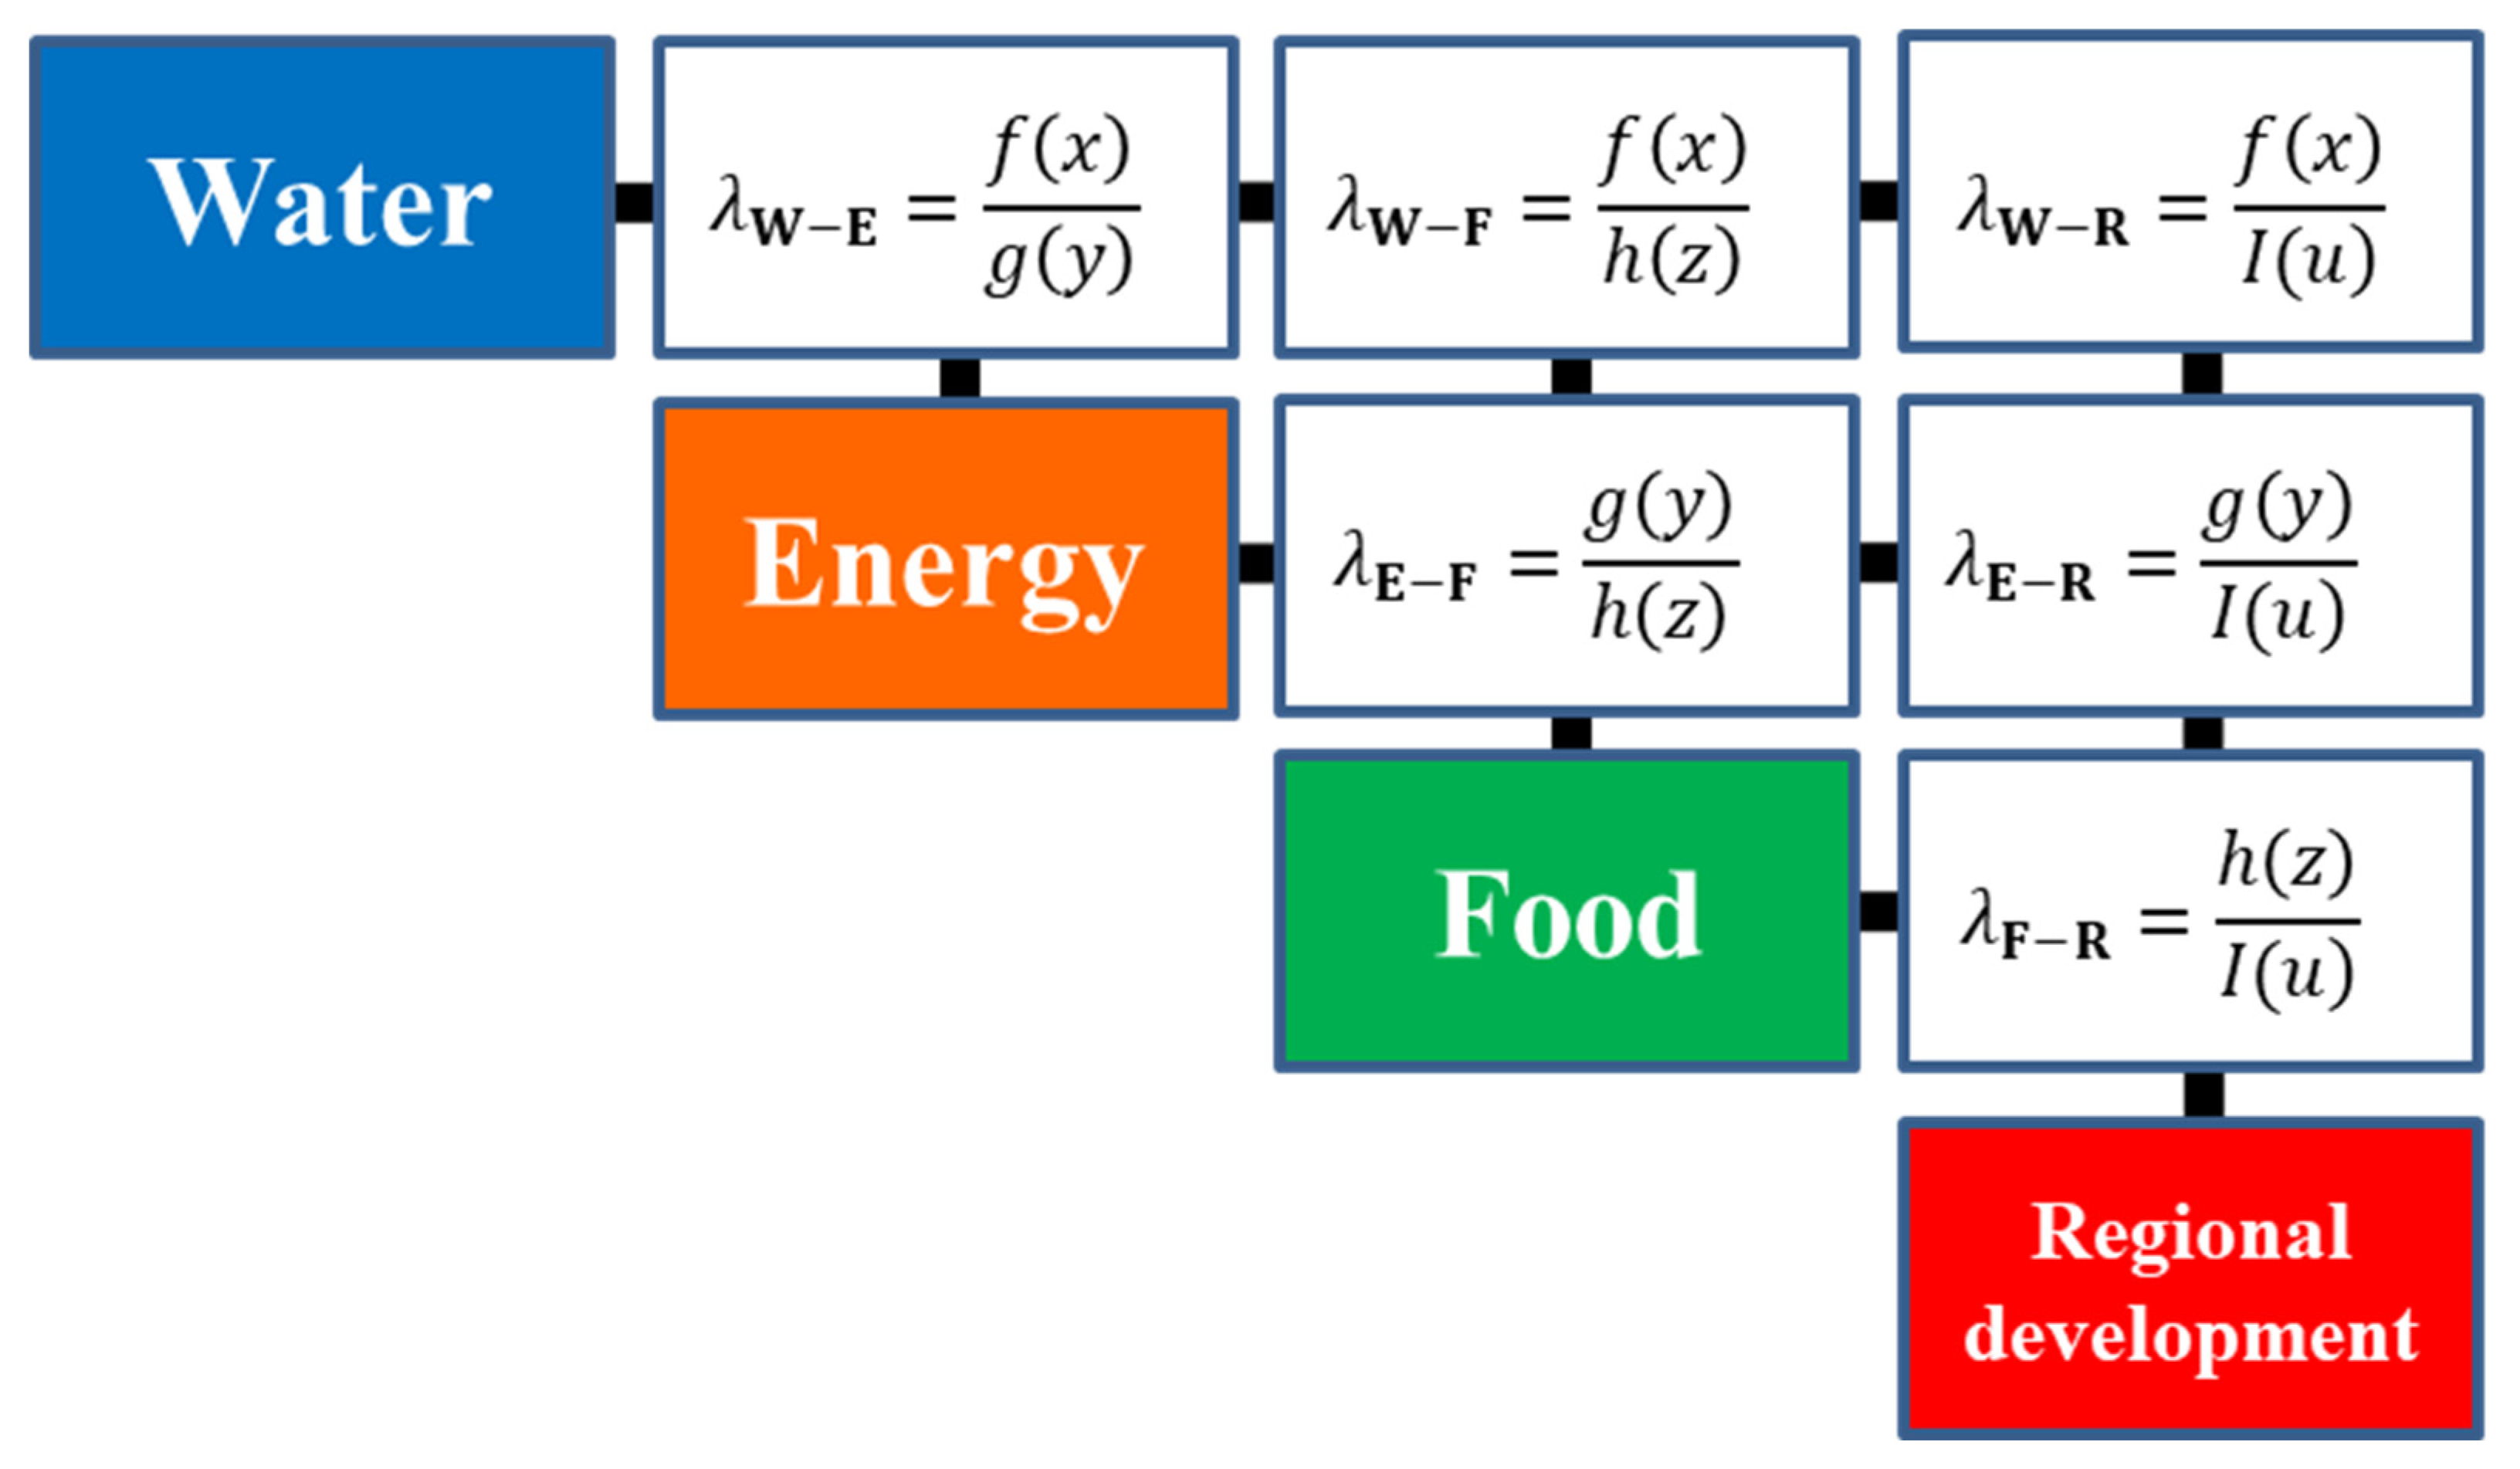
To further analyze the coupling coordination relationships among the water, energy, food, and regional development subsystems, pairwise comparisons of their comprehensive evaluation indices were performed [35]. The calculated coupling coordination comparison coefficients (λ) for different subsystem pairs are presented in Figure 3.
Figure 3.
Coupling coordination comparison coefficients for the WEF system.
3.6. Coupling Coordination Degree Model and Type Classification
The coupling degree quantifies the intensity of the interactive relationships among subsystems of the WEF nexus. The WEF nexus consists of four interconnected subsystems: water, energy, food, and regional development. Based on previous studies [36,37] and combined with the research context of this study, this study constructed the coupling degree model as follows:
In the model, C represents the degree of coupling of the WEF nexus. C ranges from 0 to 1. A higher value of C indicates that the four subsystem indices are closer in magnitude, reflecting a more balanced state among the subsystems, whereas a lower value indicates greater disparity among them. Based on findings from previous literature and the observed development patterns of WEF nexus coupling in the study area, the coupling degree was classified into four levels (Figure 4) [38].
Figure 4.
Classification of coupling degree.
The degree of coupling coordination reflects the overall operational and coordinated development status of the WEF nexus. The coupling degree is a dispersion statistic measuring the balance among subsystem development levels, and it has limited discriminative power in this study. Therefore, the substantive analysis of WEF system coordination relies on the coupling coordination degree rather than on the coupling degree. The coupling coordination degree model was constructed as follows:
where D is the degree of coupling coordination, ranging from 0 to 1. According to previous studies, the coupling coordination types of the WEF nexus were classified into three categories and ten subcategories (Table 2) [39,40]. It should be noted that under the equal-weight setting (α = β = γ = δ = 0.25), C and T cancel out in Equation (14), and D is mathematically equivalent to the square root of the geometric mean of the four subsystem indices.
Table 2.
Classification of coupling coordination degree.
3.7. Obstacle Degree Model
To further identify factors constraining coordinated development within the WEF system of RBRs and to facilitate a systematic diagnosis, this study incorporated the obstacle degree model following the comprehensive evaluation. This model quantitatively assesses the constraining impact of each indicator on development objectives by delineating both the contribution and constraining impacts of individual indicators, thereby revealing specific constraining factors and their relative magnitudes. From the perspective of the WEF nexus, this method has proven especially effective for pinpointing critical constraints across water, energy, food, and regional development subsystems, thus offering a quantitative foundation for the design of targeted regulatory measures. The computational steps were detailed below:
(1) Calculate the factor contribution degree Fj of each indicator.
where Fj denotes the weight of indicator j relative to the overall system objective. represents the weight of the subsystem to which indicator j belongs. In this study, the water, energy, food, and regional development subsystems are assumed to be equally important. Accordingly, is set to 0.25.
(2) Calculate the deviation degree Iij of each indicator.
where Iij denotes the gap between the actual value of indicator j in year i and its optimal target value.
(3) Calculate the obstacle degree Oij of each indicator.
where Oij denotes the degree to which the indicator j affects the coordinated development of the WEF system, with a larger value indicating a stronger constraining effect on system coordination.
4. Results and Discussion
4.1. Comprehensive Evaluation Index Analysis
The weights of each indicator were determined through the CRITIC method, as shown in Table 1. The conflict term in Equation (5) downweights highly correlated indicators, which is the CRITIC method’s intended mechanism for reducing information redundancy. For example, W7 and W8 showed a relatively high correlation (|r| = 0.847) and received relatively low weights (0.0860 and 0.0729), confirming that the method reduced redundancy in the weighting results.
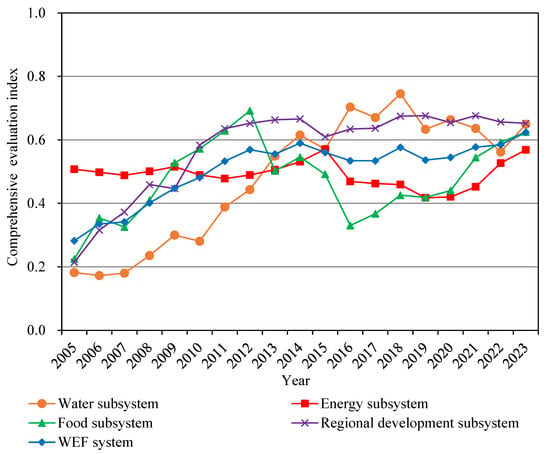
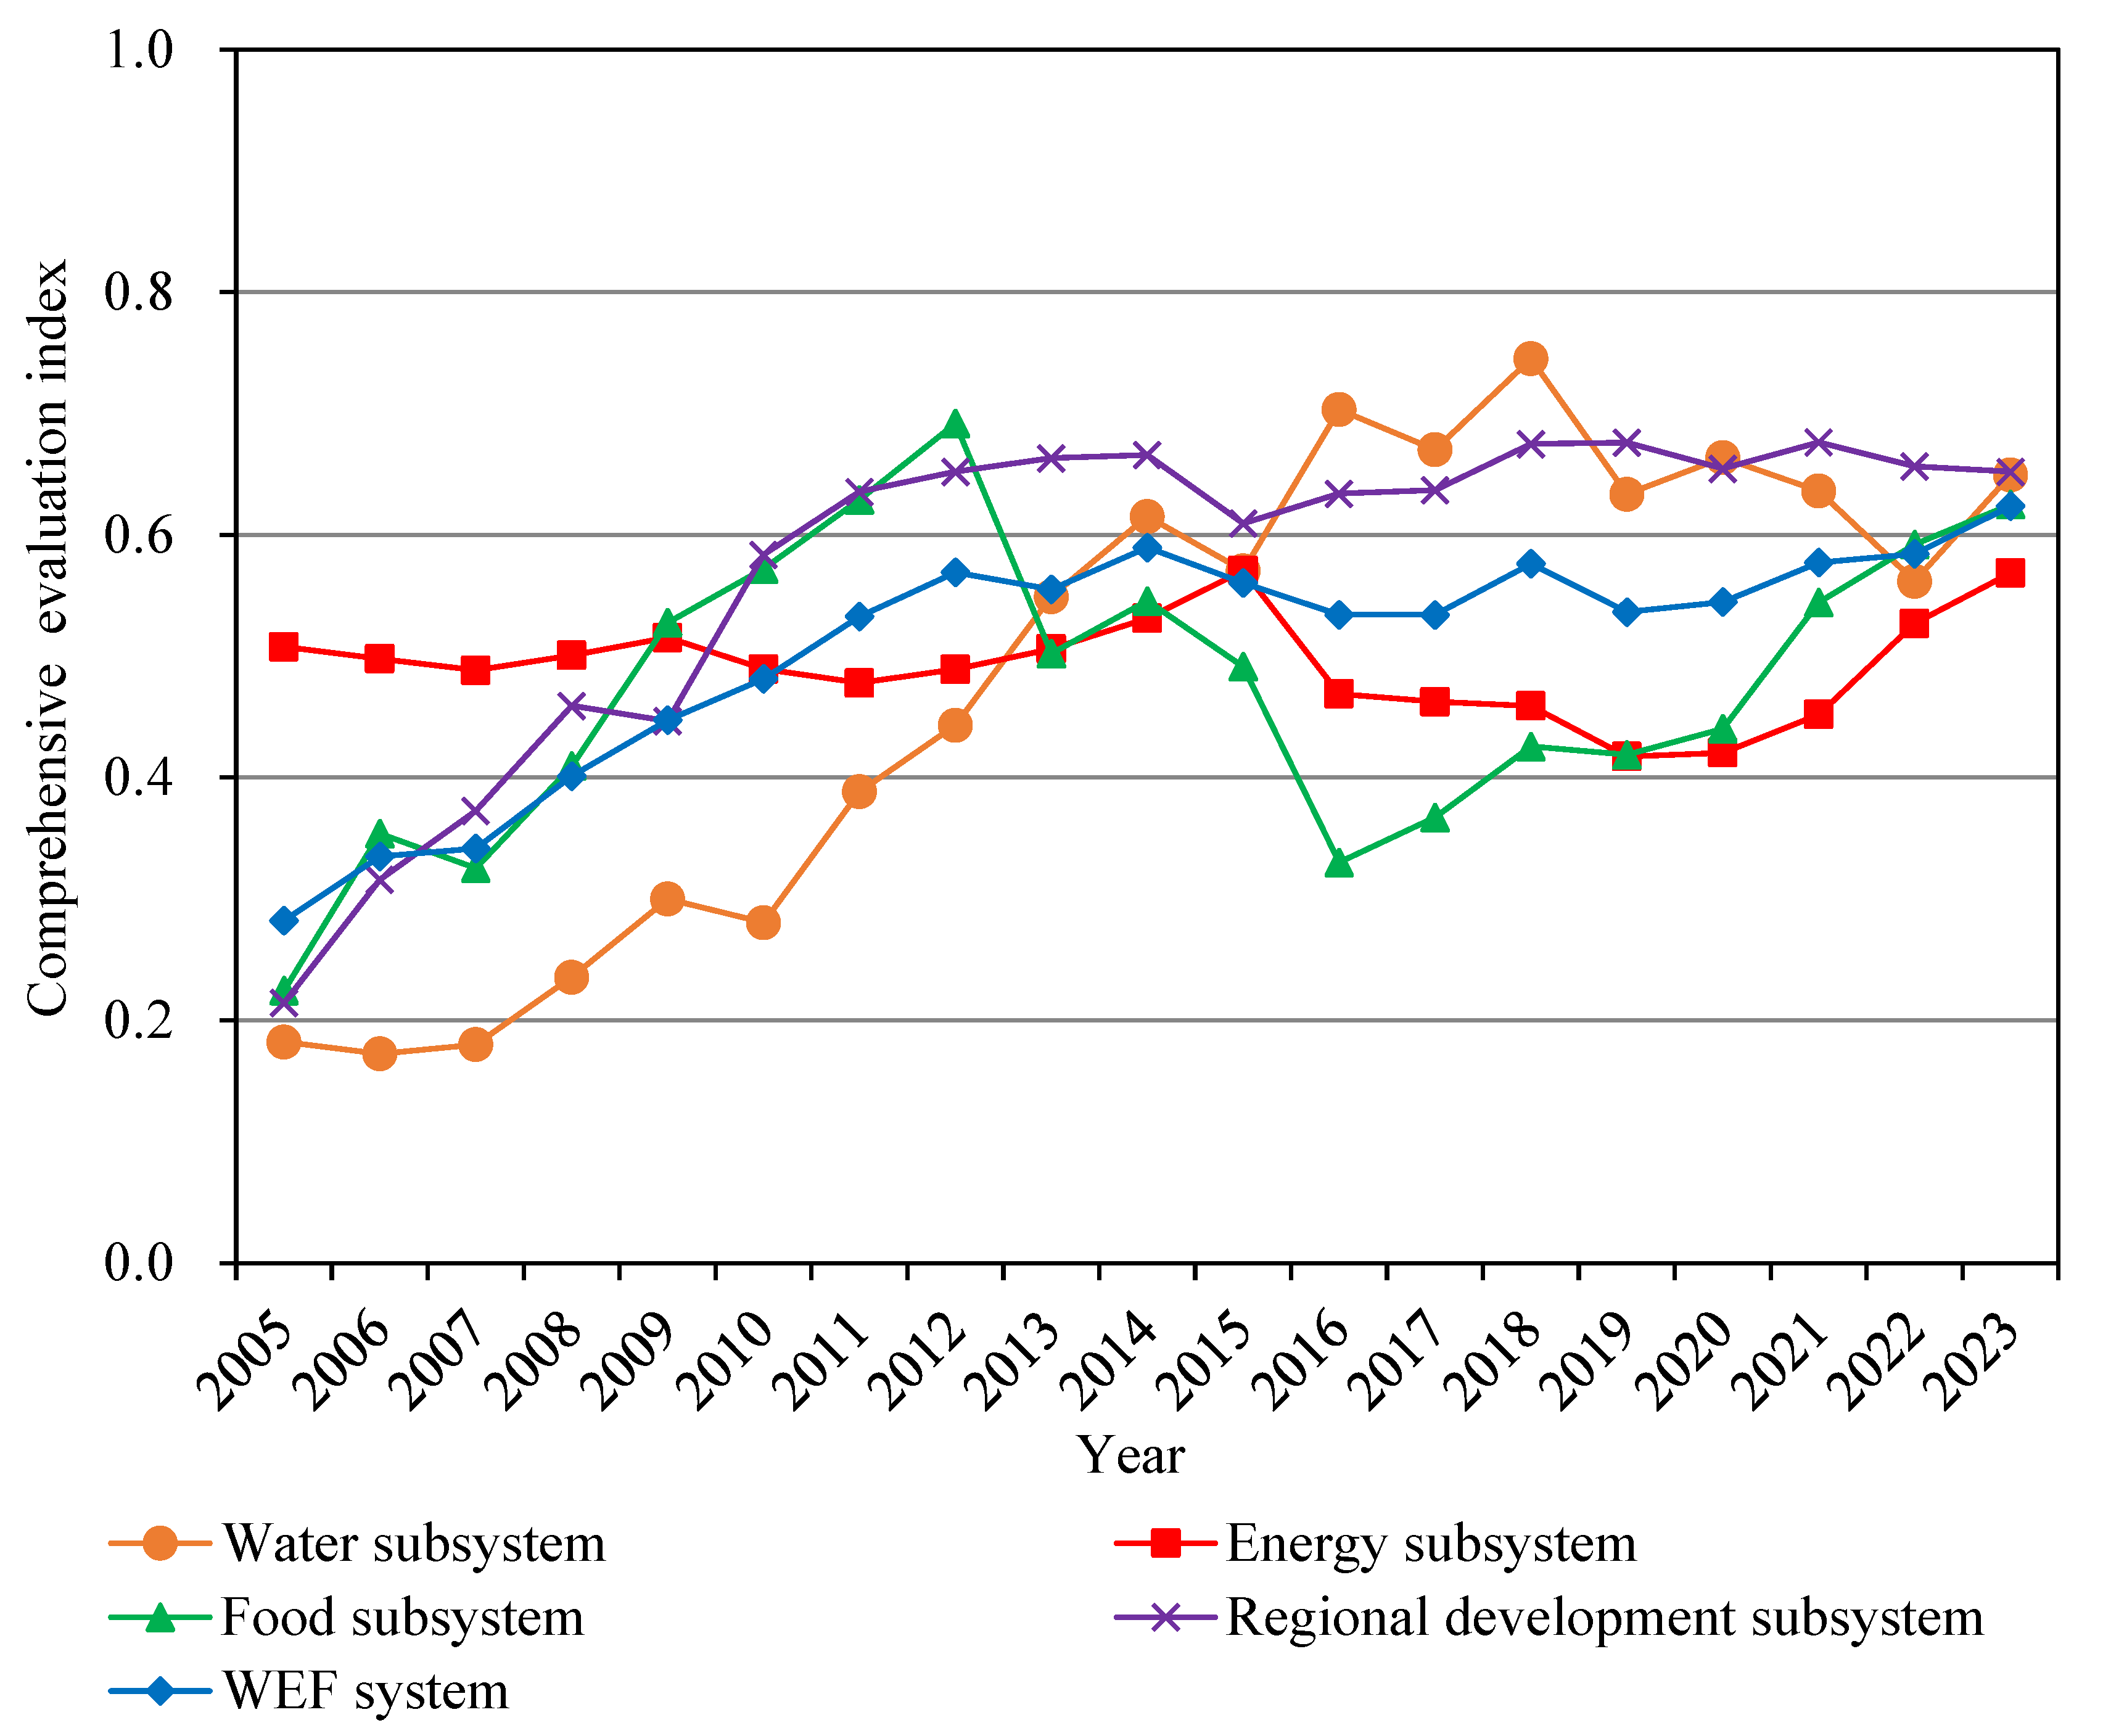
Driven by the synergistic effects of the four subsystems, the comprehensive evaluation index of Daqing’s WEF system generally showed a fluctuating upward trend from 2005 to 2023 (Figure 5), increasing from 0.282 to 0.624 with an average annual growth rate of approximately 4.50%. Segmented regression on the index series identified two statistically significant breakpoints at 2012 and 2018 (p < 0.01 and p < 0.05, respectively), dividing the development process into three stages. From 2005 to 2012, the WEF system underwent rapid growth, with an average annual growth rate of 10.54%. The period 2013–2018 represented a structural-adjustment phase, during which the index fluctuated between 0.534 and 0.590, with an average annual growth rate of 0.79%. From 2019 to 2023, the WEF system entered a phase of recovery and improvement, as the index rose from 0.536 to 0.624, with an average annual growth rate of 3.87%.
Figure 5.
Comprehensive evaluation index of the WEF System.
The comprehensive evaluation index of the water subsystem exhibited an overall “rise–decline–rise” fluctuating trend over 2005–2023. Breakpoint regression on the water subsystem index identified statistically significant breakpoints at 2013 and 2019 (p < 0.05), corresponding to the completion of the Nenjiang River Diversion Project expansion and the implementation of the strictest water resources management system, respectively. From 2005 to 2018, the water subsystem achieved sustained growth owing to upgrades to the Nenjiang River Diversion Project, which effectively mitigated the inherent deficiency in local water resource endowments. Coupled with water-saving and efficiency-improvement efforts across multiple sectors, water-resource supply–demand compatibility kept improving, and the index increased from 0.182 to 0.745. The 2019–2022 period corresponded to a phase of policy-driven regulation and adjustment. Under the rigid constraints of the “strictest water-resources management system” and groundwater-abstraction-reduction policies, total water supply and the water supply–demand ratio declined, and the comprehensive evaluation index dropped to 0.562. In 2023, the index rebounded to 0.649. This was mainly attributable to precipitation of 152.5 mm in 2022, which raised per capita water resources by 258.4 m3. In addition, with continued advances in water-saving and efficiency-enhancement measures, the synergy between natural water replenishment and improved water-use efficiency drove the index upward.
From 2005 to 2023, the comprehensive evaluation index of the energy subsystem followed a “W-shaped” fluctuating trajectory. Breakpoint regression on the energy subsystem index identified statistically significant breakpoints at 2015 and 2019 (p < 0.05), corresponding to the international oil price crash and the subsequent recovery of new energy development. During 2005–2011, the index experienced fluctuating decline, falling from 0.508 to 0.478. In this period, Daqing’s energy structure remained dominated by fossil fuels; the crude oil industry entered a phase of gradual output decline, while new energy industry development lagged behind. The 2012–2015 period saw a short-term upward surge, supported by gradual improvements in energy processing-conversion efficiency and a steadily growing share of new energy production. As a result, the index climbed to 0.571. From 2016 to 2019, the comprehensive development level of the energy subsystem sustained a decline. Driven by continuous cuts in crude oil output, both the energy self-sufficiency rate and energy outflows decreased. Rising living standards increased per capita residential energy consumption, and higher agricultural mechanization increased diesel consumption per unit area. Consequently, the index fell to its historical minimum of 0.417. The 2020–2023 period represented a phase of transformation and optimization. With the rapid expansion of wind and solar power installed capacity, together with continuous improvements in industrial and agricultural energy-utilization efficiency, the index rebounded from 0.420 to 0.569.
From 2005 to 2023, the comprehensive evaluation index of the food subsystem showed a fluctuating “rise–decline–rise” pattern. Breakpoint regression on the food subsystem index identified statistically significant breakpoints at 2013 and 2017 (p < 0.05), corresponding to the expansion and subsequent reduction in rice planting area. The 2005–2012 period witnessed rapid growth; the index jumped from 0.225 to 0.692. The grain-planting area expanded from 43.823 ×10⁴ ha to 67.256 ×10⁴ ha, and agricultural mechanization levels kept rising. Consequently, grain output, grain outflows, and the grain self-sufficiency rate all increased. During 2013–2016, the comprehensive development level of the food subsystem experienced sustained decline, and the index dropped sharply to 0.330. In this phase, grain-planting structures were substantially adjusted: the proportion of rice-sown area rose from 13.916% to 20.014%. This raised unit-area water demand for grain production and fertilizer-application intensity, aggravating pressure on water resource supply and risks of agricultural non-point-source pollution. From 2017 to 2023, the food subsystem entered a recovery and growth phase, and the index gradually rebounded to 0.625. Over this interval, the grain-sown area increased from 67.496 ×10⁴ ha to 70.989 ×10⁴ ha, while the proportion of rice-planting area decreased from 20.827% to 16.019%, effectively lowering unit-area water demand and fertilizer-application intensity. Combined with further improvements in agricultural mechanization, total grain output and outflows increased simultaneously. The green transformation of agricultural production supported the steady recovery of the food-subsystem development level.
From 2005 to 2023, the comprehensive evaluation index of the regional development subsystem exhibited an increasing-then-stabilizing trend, rising from 0.214 to 0.652. Breakpoint regression on the regional development subsystem index identified a statistically significant breakpoint in 2014 (p < 0.05), corresponding to the shift from scale expansion to quality improvement after the decline in crude oil output. The 2005–2014 period was characterized by rapid growth; the index climbed quickly from 0.214 to 0.666. In this stage, Daqing’s GDP and the tertiary industry share of GDP grew rapidly; the urbanization rate and per capita disposable income of urban residents continued to increase. Treatment capacity for industrial and domestic wastewater was expanded. Synergistic progress was achieved in regional economic development, livelihood security, and ecological–environmental governance. The 2015–2023 period represented recovery and stabilization, with the index fluctuating between 0.610 and 0.676. Affected by international oil price volatility and crude oil output reductions, GDP declined markedly in 2015, pulling the index down to 0.610. Thereafter, Daqing shifted its development focus from scale expansion to quality improvement, with steady progress in industrial-structure adjustment and green-transformation development. Despite downward pressure on crude oil production, the city maintained stable economic growth. Since 2018, the index has remained consistently above 0.65.
4.2. Analysis of Comparison Coefficients Between Different Subsystems
The comparison coefficients between different subsystems are shown in Table 3. From 2005 to 2023, λW-E exhibited a fluctuating trend of initial increase followed by decrease. From 2005 to 2012, λW-E remained consistently below 1, indicating that the comprehensive development level of the water subsystem lagged behind that of the energy subsystem. During this period, as a petroleum-resource-based city, Daqing’s oil and gas extraction, refining, and associated production processes consumed large volumes of water. However, constrained by inadequate local water endowments and relatively low development and utilization efficiency, the water subsystem maintained a relatively backward development level. With continuous improvements in water resource utilization efficiency, water consumption per unit GDP and per capita domestic water consumption showed a declining trend, while the effective utilization coefficient of agricultural irrigation water and the domestic wastewater reuse rate increased steadily. Consequently, the comprehensive development level of the water subsystem gradually improved. From 2013 to 2018, λW-E generally stayed above 1, indicating that the comprehensive development level of the water subsystem surpassed that of the energy subsystem. During this stage, upgrades to the Nenjiang River Diversion Project were completed. Water allocation capacity and water-use efficiency continued to rise, greatly strengthening the water resource support capacity for urban development. Meanwhile, affected by sustained shrinkage in crude oil production capacity, the energy subsystem faced insufficient development momentum. The divergent evolutionary trajectories of the two subsystems led to a continuous rise in λW-E. After 2018, driven by full implementation of the strictest water-resources management system and further groundwater-abstraction-reduction policies, the city’s total water supply and water supply–demand ratio declined, leading to a phased drop in the comprehensive development level of the water subsystem. At the same time, transformation achievements of the energy subsystem gradually emerged: the share of new energy output kept growing, energy consumption per unit GDP decreased, and energy processing-conversion efficiency improved continuously. The comprehensive development level of the energy subsystem returned to an upward trajectory. Jointly affected by the above factors, λW-E showed a fluctuating downward trend. The development gap between the two subsystems gradually narrowed toward coordinated development.
Table 3.
The comparison coefficients between different subsystems.
From 2005 to 2023, λW-F exhibited a fluctuating trend of initial growth followed by decline. From 2005 to 2012, λW-F remained consistently below 1, indicating that the comprehensive development level of the water subsystem lagged behind that of the food subsystem. During this period, Daqing’s grain-sown area continued to expand, agricultural mechanization levels steadily improved, and grain output and outflows increased simultaneously, driving a rapid rise in the comprehensive development level of the food subsystem. However, restricted by slow improvements in water-supply capacity and utilization efficiency, the water subsystem grew relatively slowly and could hardly meet the rising water demand caused by grain-production expansion. After 2013, with the Nenjiang River Diversion Project completed and water-saving and efficiency-improvement initiatives intensified, the city’s total water supply and water-use efficiency kept increasing, which greatly enhanced water-resource support capacity for grain production. Accordingly, λW-F exceeded 1 for the first time. After 2016, total water supply declined, and agricultural water availability became increasingly tight. Meanwhile, the grain-sown area expanded further and agricultural water demand continued to rise, resulting in a lower water supply–demand ratio. Consequently, the comprehensive development level of the water subsystem declined. λW-F thus fluctuated downward from its peak of 2.130 in 2016 to 1.039 in 2023, and the two subsystems gradually moved toward a relatively balanced development state.
From 2005 to 2023, λE-F exhibited a “decline–rise–fall” fluctuating trend. From 2005 to 2008, λE-F remained above 1, indicating that the comprehensive development level of the food subsystem lagged behind that of the energy subsystem. During this period, Daqing’s energy industry maintained stable development supported by its oil and gas resource advantages, while food production was still in the initial stage of scale expansion. Agricultural mechanization levels, grain yield per unit area, and total grain output all remained at relatively low levels. From 2009 to 2012, continuous expansion of the grain-sown area, rapid advances in agricultural mechanization, and steady growth in grain output drove substantial growth in the comprehensive development level of the food subsystem. λE-F declined continuously from 0.977 to 0.707, indicating that the comprehensive development level of the food subsystem surpassed that of the energy subsystem. From 2013 to 2018, λE-F returned to above 1. During this phase, prominent adjustments occurred in the grain-planting structure: the proportion of rice-sown area increased, pushing up unit-area water demand and fertilizer-application intensity. Problems including agricultural non-point-source pollution and high water consumption became salient, and the comprehensive development level of the food subsystem declined to a certain extent. After 2019, continuous optimization of the grain-planting structure boosted total grain output. Combined with sustained improvements in agricultural mechanization and steady reduction in fertilizer-application intensity, the comprehensive development index of the food subsystem rebounded moderately. Meanwhile, although the energy subsystem made positive progress in new energy substitution and energy-efficiency improvement, its comprehensive development index grew moderately owing to shrinking crude oil output. λE-F gradually stabilized around 0.9, indicating that Daqing’s energy and food subsystems were shifting from alternating dominance toward coordinated development.
From 2005 to 2023, λW-R exhibited a fluctuating trend of initial growth followed by stabilization. From 2005 to 2015, λW-R remained below 1. During this phase, economic expansion and accelerated urbanization generated rising rigid demand for water resources. Nevertheless, restricted by inadequate local water endowments and relatively low utilization efficiency, the comprehensive development level of the water subsystem grew more slowly than regional development. After 2016, as outcomes of water-saving-society construction gradually emerged, water resource utilization efficiency became increasingly compatible with regional development. λW-R continuously approached 1, indicating that the water subsystem and the regional development subsystem were moving toward coordination.
From 2005 to 2023, λE-R exhibited a fluctuating trend of initial decline followed by steady growth. From 2005 to 2009, λE-R remained above 1, indicating that the comprehensive development level of the energy subsystem outperformed that of the regional-development subsystem. During this phase, supported by abundant oil and gas resources, Daqing’s traditional energy industry strongly underpinned and boosted regional development. After 2010, alongside socioeconomic development, the share of the tertiary industry rose gradually, while residents’ living standards and environmental-governance capacity kept improving. The comprehensive index of the regional-development subsystem climbed steadily. Meanwhile, traditional-energy production capacity shrank, and the energy industrial structure underwent profound adjustment, leaving the energy subsystem with insufficient growth momentum. Divergent evolutionary trajectories of the two subsystems drove λE-R down to 0.617 in 2019. After 2020, thanks to the growing share of new energy output and improved energy-utilization efficiency, λE-R rebounded moderately and converged toward 1; the gap between the two subsystems gradually narrowed.
From 2005 to 2023, λF-R exhibited an “alternating dominance–decline–rise” fluctuating trend. From 2005 to 2012, λF-R fluctuated around 1, with the two subsystems taking turns leading. During this period, the grain-sown area continued to expand, agricultural mechanization levels improved steadily, and grain output maintained stable growth, promoting continuous progress in the comprehensive development level of the food subsystem. Meanwhile, boosted by urbanization and traditional-energy development, the regional-development subsystem also achieved relatively rapid growth, and the development trajectories of the two subsystems were roughly synchronized. From 2013 to 2016, λF-R stayed consistently below 1 and decreased year by year. Influenced by grain-planting-structure adjustments, the share of rice-sown area rose, lifting unit-area water demand and fertilizer-application intensity. Combined with a phased drop in total grain output, the comprehensive development level of the food subsystem fell behind that of the regional-development subsystem. After 2017, λF-R rebounded gradually and converged toward 1. Further expansion of the grain-sown area and appropriate reduction in the share of rice-sown area, together with innovations in agricultural science and technology and the construction of high-standard farmland, pushed the comprehensive development index of the food subsystem back onto an upward track. The development gap between the two subsystems gradually narrowed, and they moved steadily toward coordinated development.
4.3. Coupling Coordination Degree Analysis
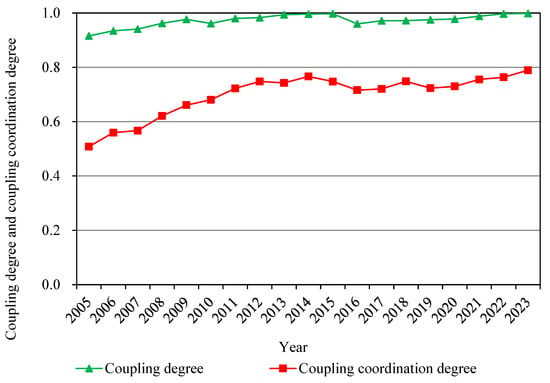
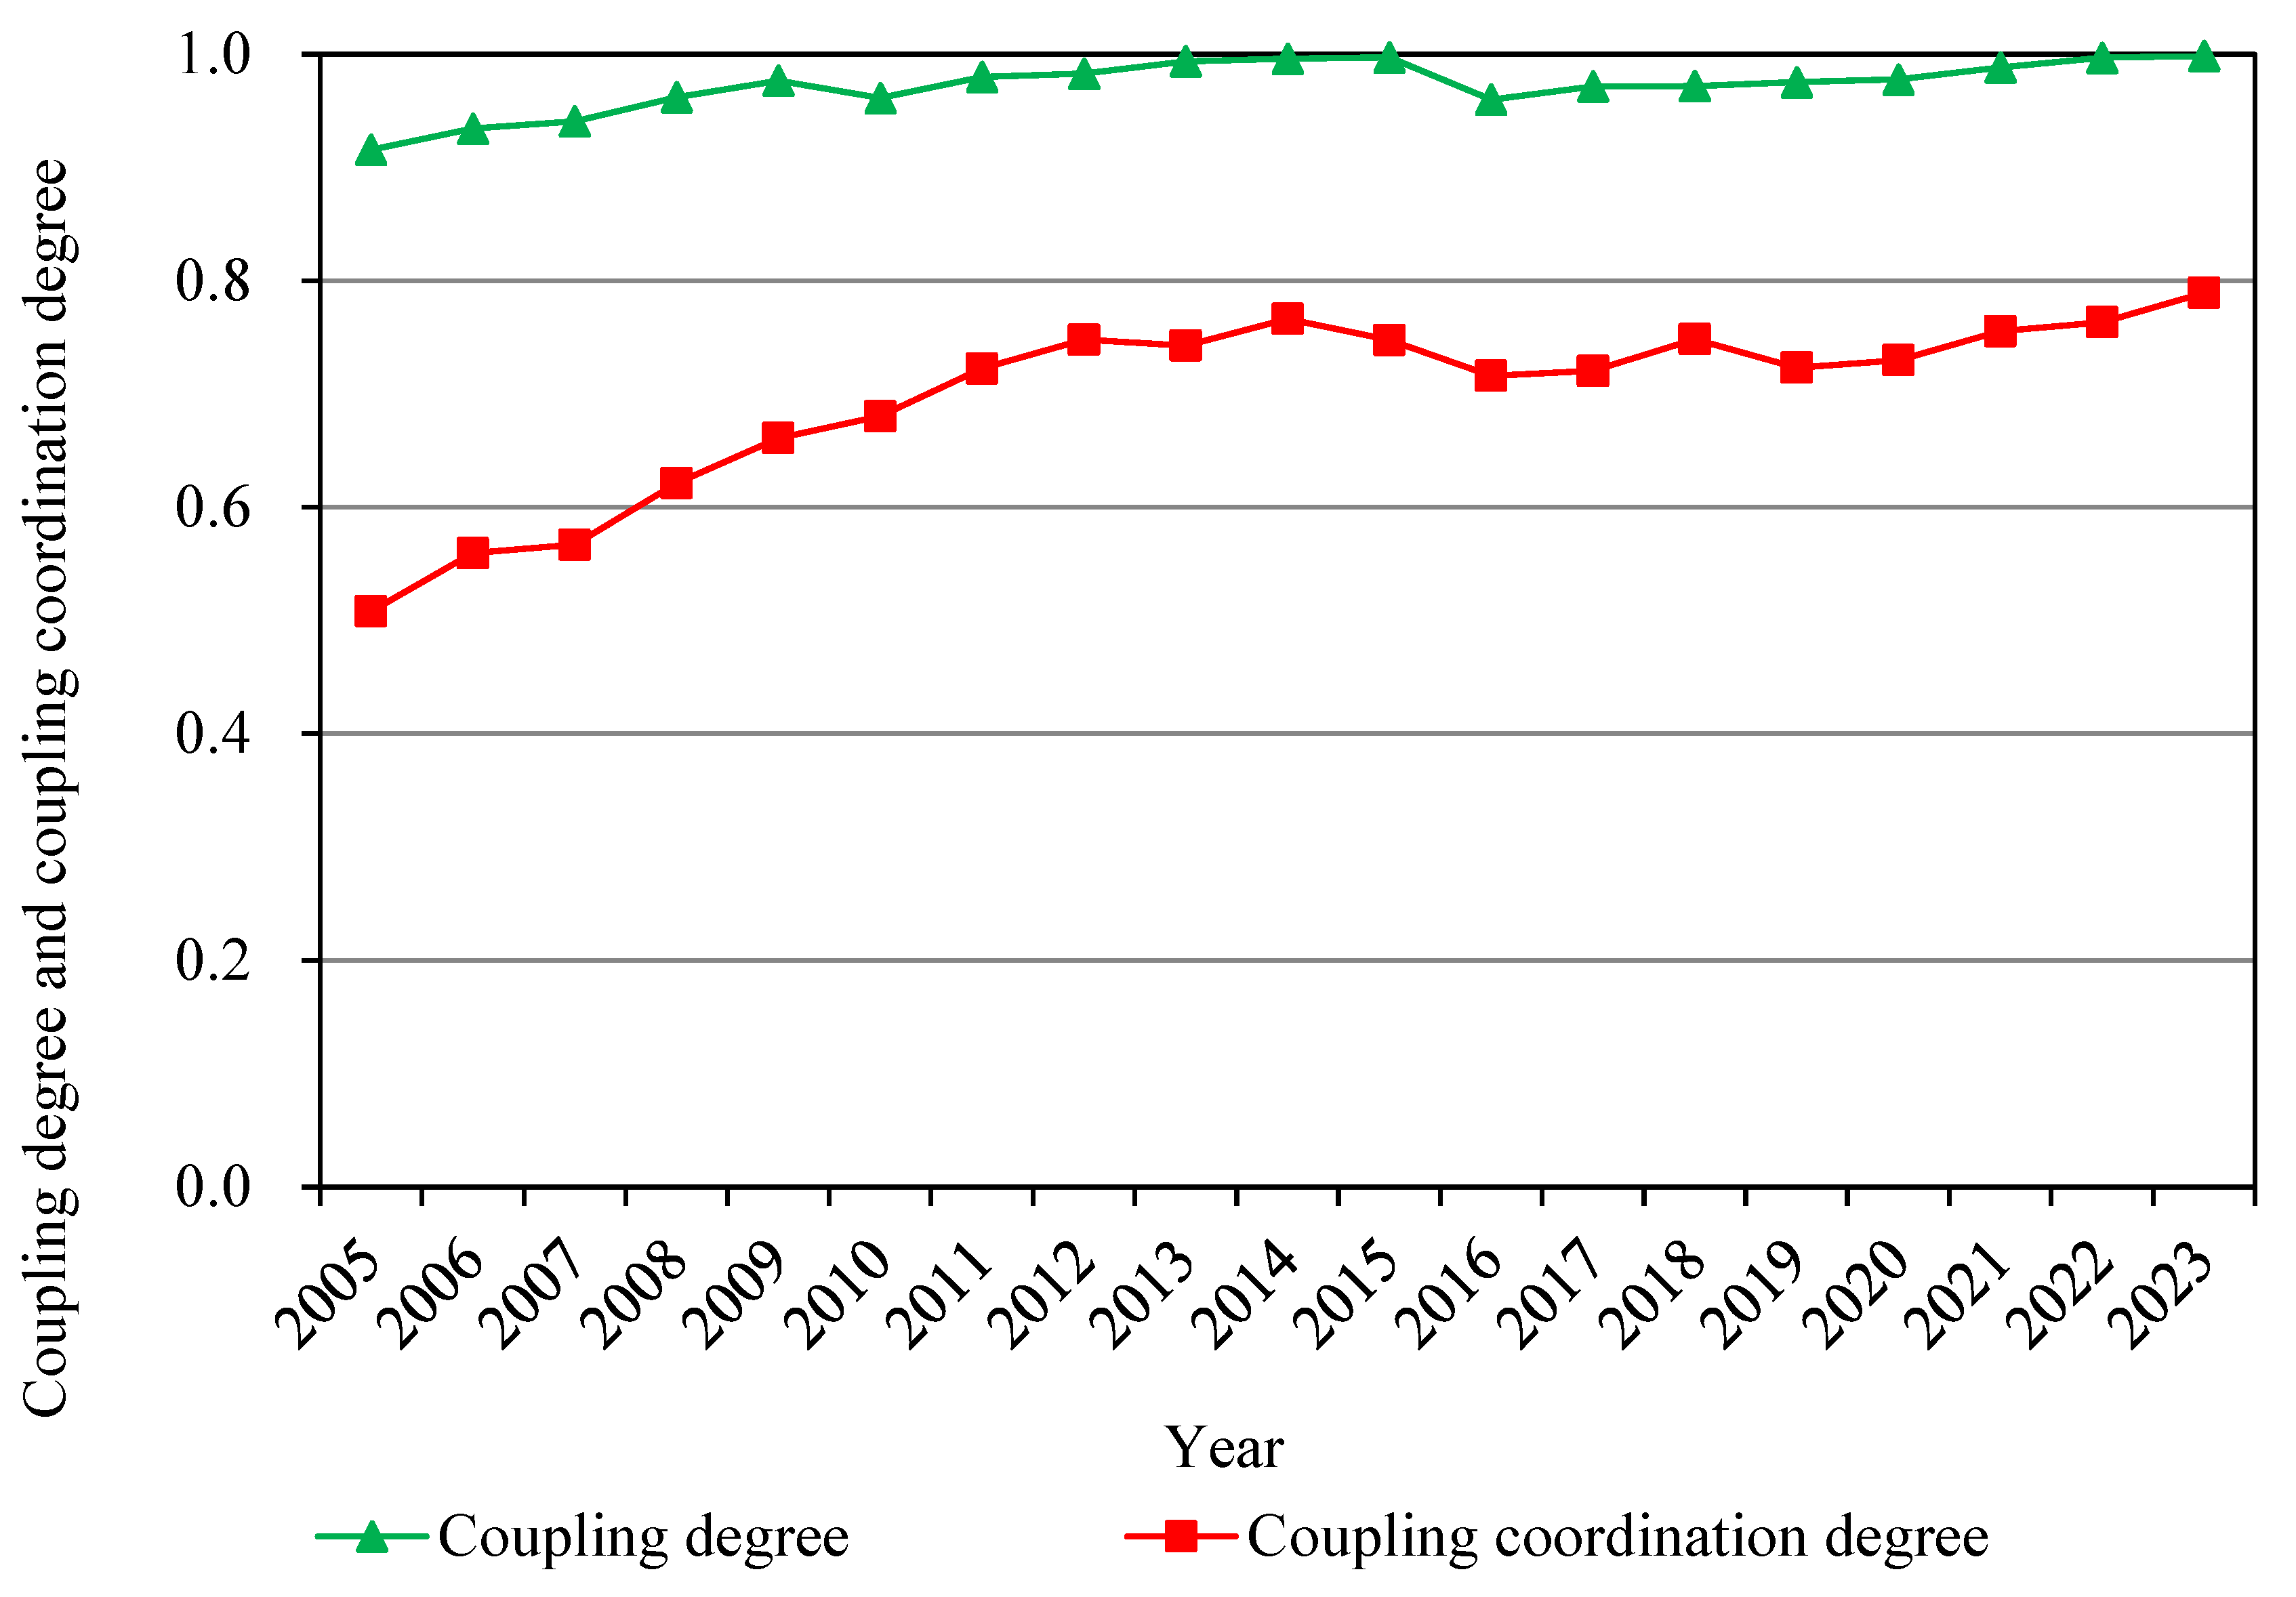
The coupling degree and coupling coordination degree of the WEF system are illustrated in Figure 6. From 2005 to 2023, the coupling degree of Daqing’s WEF system generally exhibited a fluctuating upward trend, rising from 0.915 to 0.999 and remaining at the high-level coupling stage throughout the study period. This indicates that the four subsystem indices remained close in magnitude and that the subsystems were in a relatively balanced state.
Figure 6.
The coupling degree and coupling coordination degree of the WEF system.
From 2005 to 2023, the coupling coordination degree of the WEF system exhibited a fluctuating upward trend, increasing from 0.508 to 0.789 with an average annual growth rate of roughly 2.47%, and went through three evolutionary stages. The period from 2005 to 2012 witnessed rapid growth, during which the coupling coordination type of the WEF system shifted from borderline coordination to moderate coordination. In this phase, the Nenjiang River Diversion Project upgrades were still underway, but the project had already begun to alleviate regional water-supply shortages. Grain-production scale expanded and grain output increased rapidly, while the regional economy maintained steady growth. Synchronized improvements across all subsystems drove the WEF system coordination level upward rapidly. The period from 2013 to 2018 represented a steady-adjustment stage. Jointly affected by crude oil output reduction, grain-planting-structure adjustment, and continuous improvements in water-resource utilization efficiency, the coupling coordination degree of the WEF system fluctuated between 0.716 and 0.766, and the system stayed at the moderate coordination level. The period from 2019 to 2023 was characterized by recovery and improvement. Fueled by accelerated development of the new energy industry, continuous optimization of grain-planting structure, and dividends from water-saving-society construction, the coupling coordination degree of the WEF system climbed from 0.723 to 0.789. Overall, the coupling coordination degree of the WEF system showed a promising development trend, yet considerable room for further improvement remains. In the future, more efforts should be devoted to reconciling regional economic development with the exploitation and utilization of water, energy, and food resources so as to advance the WEF system toward a higher coordination stage.
4.4. Analysis of Factors Influencing Coordinated Development of the WEF System
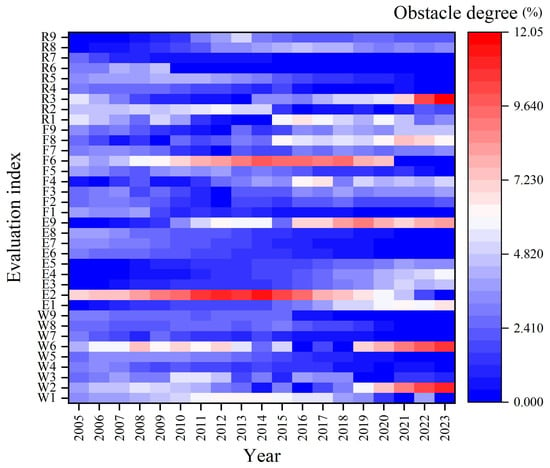
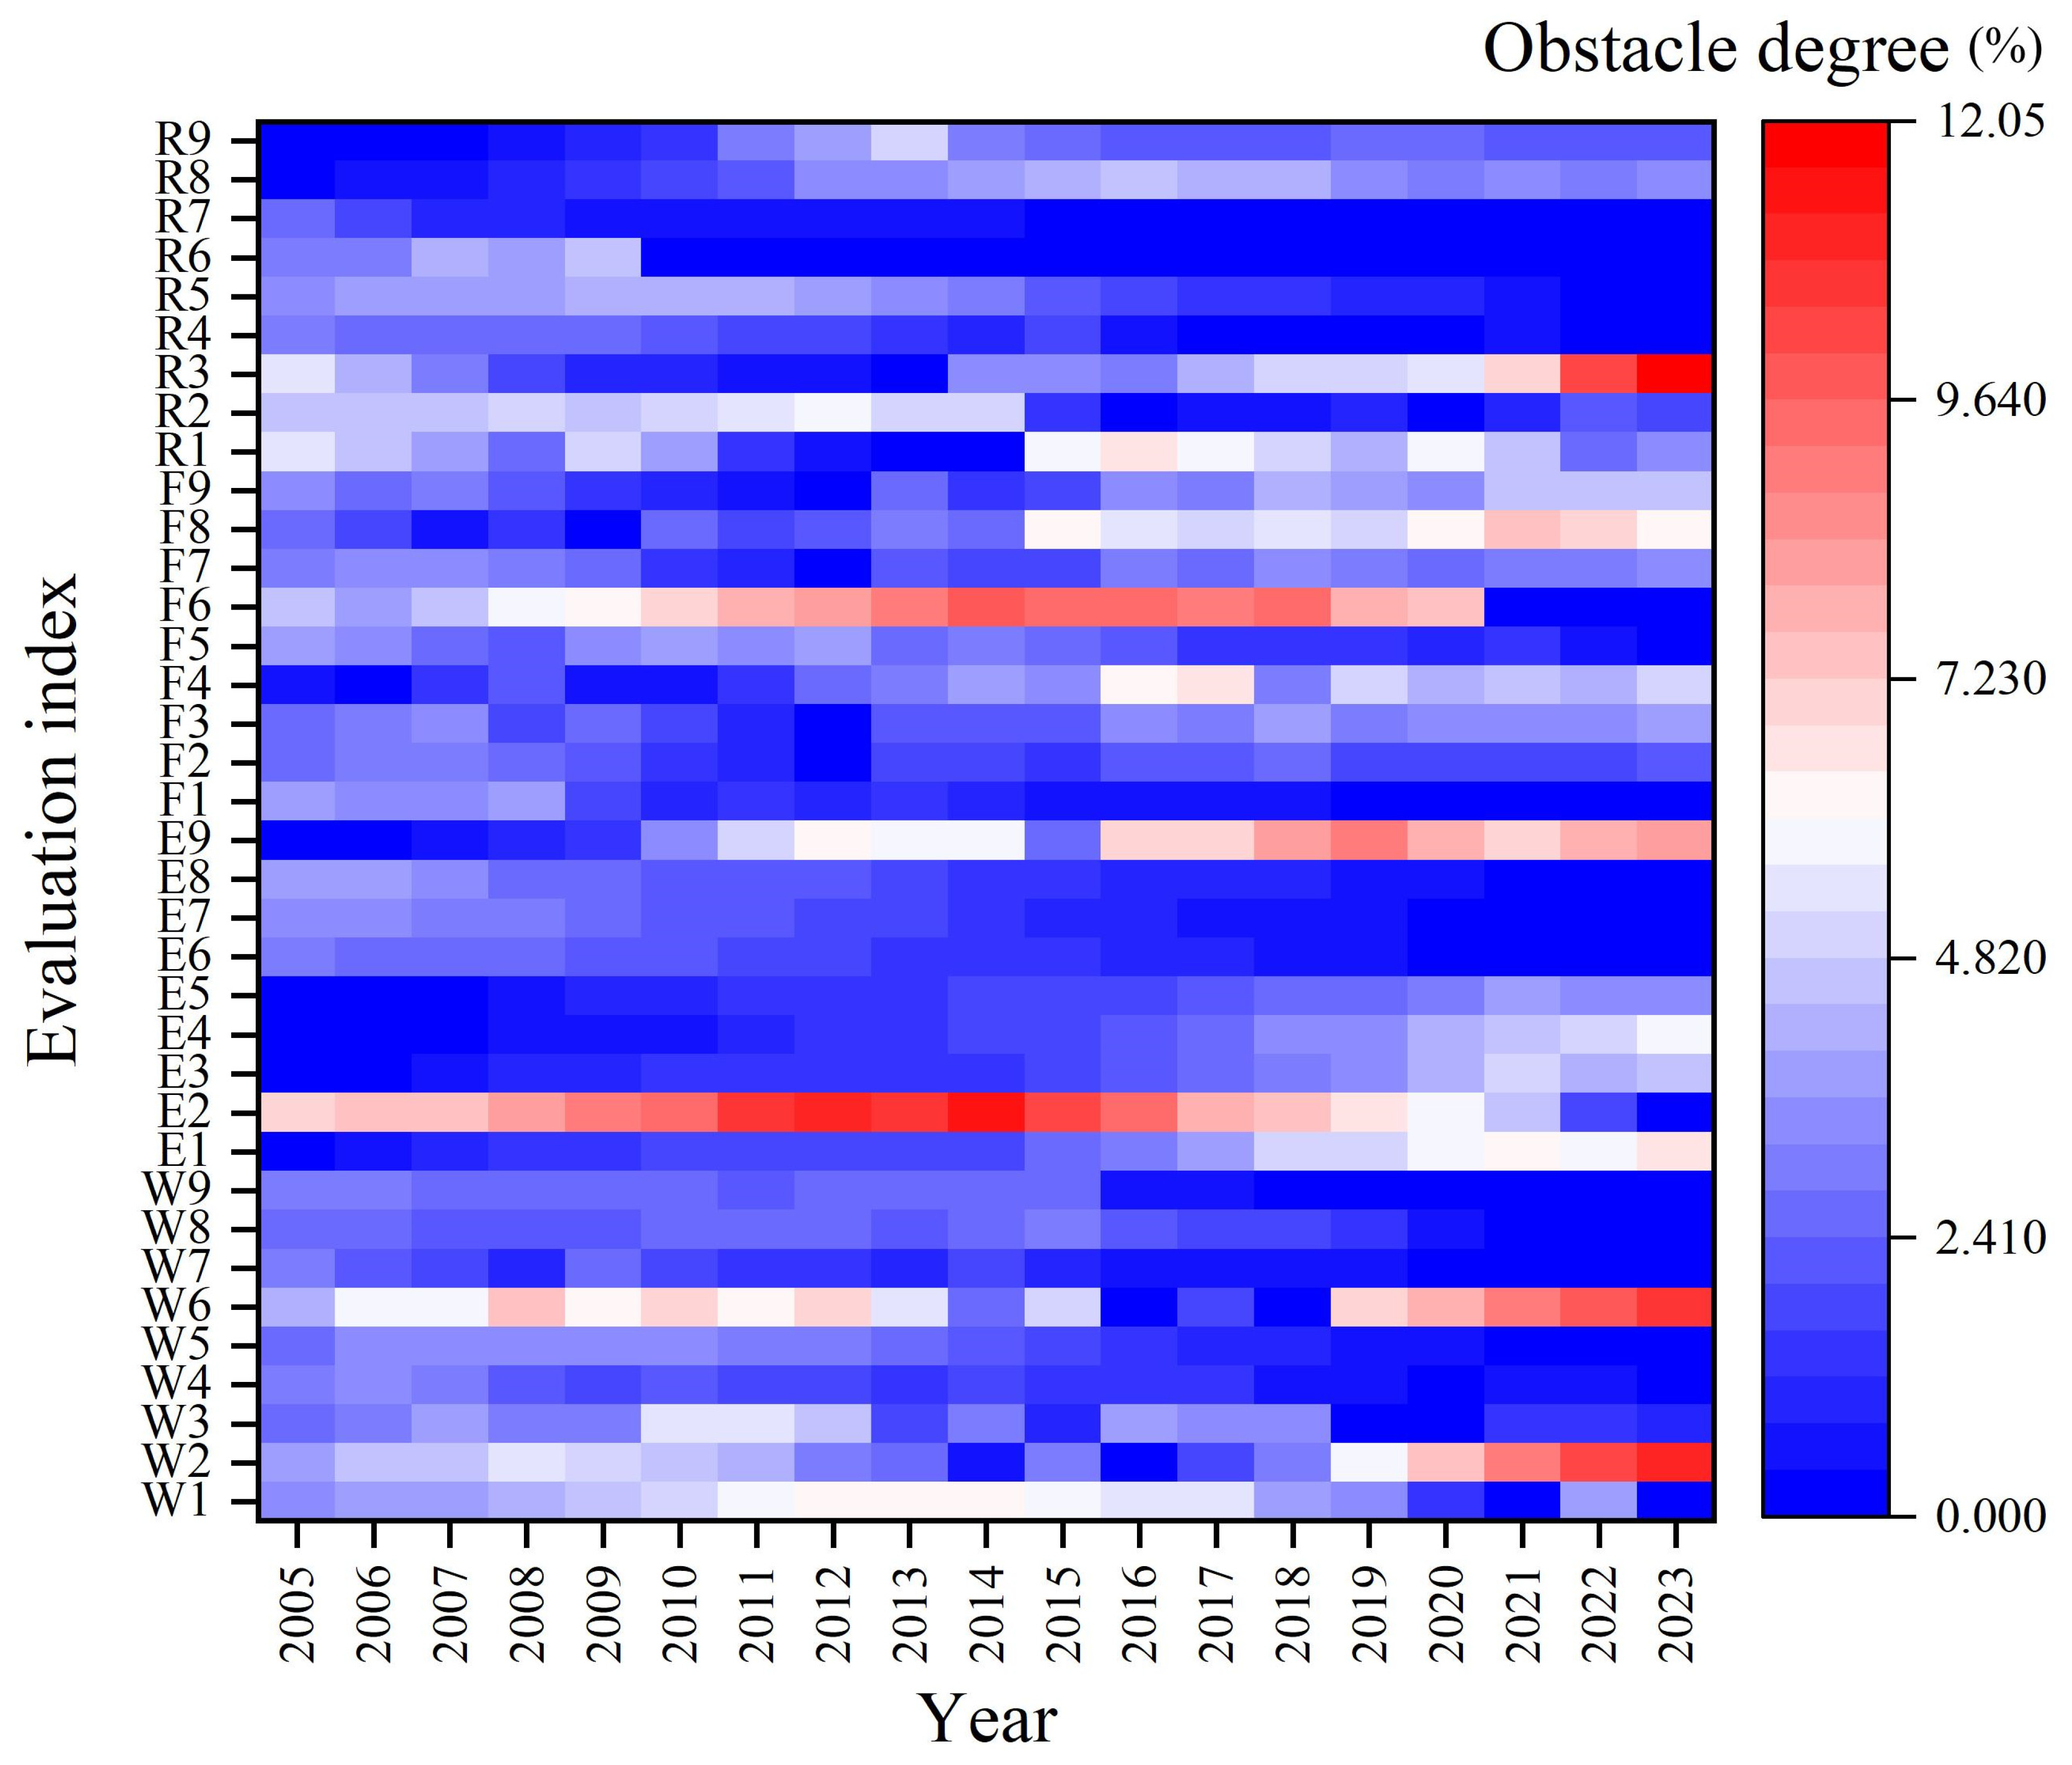
Figure 7 illustrates the obstacle degrees of 36 evaluation indicators for the coordinated development of the WEF system. The complete numerical values for all 36 indicators across 2005–2023 are provided in Table A6 in Appendix A. The darker the red, the greater the obstacle an indicator poses to the system’s coordinated development; the darker the blue, the smaller the obstacle. In this study, indicators with average obstacle degrees in the top 25% were identified as major obstacle factors.
Figure 7.
Obstacle degree of each evaluation indicator for the coordinated development of the WEF system.
The major obstacle factors identified in this study can be grouped into three dimensions. Socio-economic drivers include GDP (R1), the proportion of the tertiary sector in GDP (R2), per capita disposable income of urban residents (R5), and total population (R3). Environmental drivers include fertilizer application intensity (F6), pesticide consumption (R8), and the compliance rate of industrial wastewater discharge (R6). Resource-related drivers include the proportion of new energy production (E2), groundwater exploitation rate (W3), per capita water resources (W1), total water supply (W2), water supply–demand ratio (W6), water requirement per unit area of grain production (F4), diesel use per unit area (E9), per capita grain consumption (F8), primary energy production (E1), per capita residential energy consumption (E4), and energy outflows (E3).
From the perspective of different stages, during 2005–2012, the main obstacle factors were E2 (8.864%), W6 (6.286%), F6 (6.066%), R2 (5.039%), W1 (4.634%), W2 (4.385%), R5 (3.884%), W3 (3.785%), and R1 (3.469%). This reveals that traditional fossil fuels occupied an absolutely dominant position in Daqing during this period. The new energy industry developed slowly and industrial transformation lagged behind, forming a single-industry economic structure. Socio-economic indicators including gross regional product, the share of tertiary industry output value, and per capita disposable income of urban residents remained at relatively low levels. At the same time, oil and gas extraction and processing consumed massive volumes of groundwater. Coupled with continuous groundwater abstraction for urban domestic and agricultural purposes, severe groundwater over-exploitation occurred, and the water supply–demand imbalance continued to deteriorate. Agricultural production still mainly relied on extensive cultivation, and excessive fertilizer application triggered agricultural non-point-source pollution. Overall, bottlenecks restricting the coordinated development of the WEF system mainly stemmed from dual constraints imposed by the energy subsystem and the water subsystem, while constraints from the food subsystem gradually emerged.
During 2013–2018, the main obstacle factors were E2 (9.467%), F6 (9.389%), E9 (6.082%), W1 (5.499%), F8 (4.543%), F4 (4.361%), R8 (4.153%), R1 (3.945%), and R3 (3.206%). Amid adjustments to the grain planting structure, rising unit-area irrigation water demand and high inputs of fertilizers and pesticides not only aggravated the regional water supply burden but also substantially elevated risks of water environmental pollution. Improvements in agricultural mechanization increased diesel consumption per unit area, raising fossil energy consumption. Although the new energy industry achieved modest expansion, the low share of new energy output had not been fundamentally reversed. Affected by crude oil production cuts, gross regional product declined moderately, and continuous labor outflows caused the total population to decrease year by year. At the same time, rising living standards drove steady growth in per capita grain demand. Compared with the previous stage, the core contradiction restricting the coordinated development of the WEF system shifted notably toward the food subsystem. Multiple intertwined pressures originating from agricultural production activities, including water consumption, energy use, and water pollution risks, became prominent.
During 2019–2023, the main obstacle factors were W6 (8.984%), W2 (8.830%), E9 (7.991%), R3 (7.884%), F8 (6.403%), E1 (5.850%), F4 (4.628%), E4 (4.600%), and E3 (4.305%). With the implementation of groundwater-abstraction-reduction policies and full enforcement of the strictest water resources management system, total water supply decreased year by year, further aggravating the regional water supply–demand imbalance and forcing all sectors to implement comprehensive water-saving transformations. As crude oil output kept declining, energy outflows fell accordingly. Population aging and labor outflows further reduced the total population. Continuous improvements in residents’ living standards brought about steady growth in per capita grain consumption and household energy consumption. With the expansion of large-scale agriculture and growing grain-sown areas, diesel usage per unit area and unit-area water demand for grain production remained at relatively high levels. On the whole, following strengthened water supply regulation, the water subsystem became the primary bottleneck restricting the coordinated development of the WEF system.
4.5. Comparison with Other Resource-Based Cities
To distinguish Daqing-specific features from broader patterns of resource-based regional development, we compared Daqing with two other representative resource-based cities in China: Karamay (petroleum-based) and Ordos (coal-based). The comparison focuses on four dimensions: resource type and industry cycle, water resource endowment and reliance on external water diversion, food production function, and transformation pathway. The results show that several features are common to Chinese resource-based cities, including a single-resource-dominated industrial structure, ecological pressures from long-term exploitation, and population outflow after resource depletion. By contrast, Daqing’s distinctive features include the coexistence of petroleum and commodity grain base functions, severe water scarcity with heavy reliance on inter-basin water diversion, and the coupling of oil and gas cycles with grain planting structure adjustment.
5. Conclusions and Suggestions
This study selected Daqing, a typical resource-based city, as the research object and constructed an evaluation system for the coordinated development of the WEF system, covering four subsystems: water, energy, food, and regional development. The CRITIC method was adopted to calculate indicator weights. Based on the comprehensive evaluation index and coupling coordination degree model, this study analyzed the evolutionary characteristics of the WEF system’s coordinated development level. The obstacle degree model was further applied to identify stage-specific obstacle factors. The main conclusions are summarized as follows:
(1) From 2005 to 2023, the comprehensive evaluation index of the WEF system experienced three evolutionary stages: rapid growth, structural adjustment, and recovery and improvement. Benefiting from the Nenjiang River Diversion Project and early water-saving and efficiency-enhancing initiatives, the water subsystem experienced continuous growth. However, it underwent a phased decline under the constraints of the strictest water resources management system and groundwater extraction reduction policies, followed by a rebound in 2023 due to increased precipitation and optimized water-saving measures. The energy subsystem exhibited a W-shaped fluctuating trend. Reduced oil and gas output led to sluggish development in the middle stage, while the growth of new energy industries and improvements in energy conservation and efficiency drove system recovery in the later period. The food subsystem achieved rapid expansion in planting scale, experienced a mid-term downturn caused by the expanded cultivation of high-water-consuming rice, and rebounded after the optimization of planting structure. In the early stage, the regional development subsystem maintained rapid growth driven by the oil-and-gas-based economy. Following the decline in crude oil output, it entered a stable development stage focused on quality improvement.
(2) The subsystem comparison coefficients reflected dynamic changes in inter-subsystem development gaps. From 2005 to 2012, the development level of the water subsystem lagged behind that of the energy and food subsystems. After the completion of the Nenjiang River Diversion Project upgrade, the water subsystem surpassed the other subsystems in 2013. Subsequently, the implementation of strict water resource management policies, energy transition, and planting structure optimization gradually narrowed the inter-subsystem development gaps. The energy and food subsystems underwent a complete evolutionary process, shifting from energy dominance to food subsystem dominance, alternating dominance, and eventual coordinated convergence. Energy transition and planting structure adjustment served as the core drivers of such fluctuations. Before 2015, the water subsystem lagged behind the regional development subsystem, whereas continuous water-saving practices after 2016 gradually narrowed this development gap. Affected by crude oil output reduction, new energy development, and energy efficiency improvement, the gap between the energy and regional development subsystems gradually narrowed. The food and regional development subsystems shifted from synchronous coordination to relative lag after 2013, and agricultural green transformation promoted their return to balanced development.
(3) The coupling degree of Daqing’s WEF system increased from 0.915 to 0.999 and remained at a high-level coupling stage throughout the study period, indicating a relatively balanced development state among the subsystems. The coupling coordination degree rose from 0.508 to 0.789, evolving from borderline coordination to moderate coordination. From 2005 to 2012, the ongoing Nenjiang River Diversion Project upgrades, growing grain output, and economic expansion rapidly improved the overall level of system coordination. From 2013 to 2018, restricted by crude oil production cuts, expanded rice cultivation, and improved water utilization efficiency, the coupling coordination degree fluctuated steadily at a high level. After 2019, the combined benefits of new energy development and planting structure optimization further promoted the growth of the coordination level. Overall, Daqing’s WEF system showed a positive coupling coordination evolution trend, with considerable potential for further improvement toward higher coordination levels.
(4) The dominant obstacle factors restricting WEF system development presented significant stage succession characteristics. From 2005 to 2012, system constraints mainly originated from the energy and water subsystems. Lagging new energy development, long-term groundwater overexploitation, and the city’s single industrial structure constituted the primary development bottlenecks. From 2013 to 2018, restrictive pressure gradually shifted to the food subsystem. Expanded rice cultivation increased irrigation water demand, agrochemical inputs, and agricultural machinery diesel consumption, while the lag in energy structural reform was not fundamentally resolved. From 2019 to 2023, the implementation of the strictest water resources management system reduced the total available water supply, making water supply–demand imbalance the core restrictive factor. Multiple overlapping constraints, including population aging, labor outflow, declining crude oil production capacity, continued growth in residential energy and grain demand, and high water and energy consumption in agricultural production, jointly hindered the coordinated development of the WEF system.
As a typical oil-resource-based city, the coordinated development of Daqing’s WEF system is driven by three core drivers: the boom–bust cycle of the oil and gas industry, water resource regulation policies, and grain planting structure adjustment. In future development, Daqing should further improve the external water allocation system and coordinate groundwater extraction reduction with the utilization of reclaimed water, rainwater, and flood resources, aiming to raise the share of surface water and unconventional water in total water supply and reduce the groundwater exploitation rate. The large-scale development of wind power, photovoltaic power, biomass energy, and other new energy sources should be accelerated to reduce the reliance of industrial development on traditional fossil resources, thereby increasing the proportion of new energy production and reducing energy consumption per unit of GDP. Grain planting structure requires further optimization, including appropriately reducing the cultivation scale of high-water-consuming rice and promoting water-saving irrigation and agrochemical reduction technologies, so as to lower water requirement per unit area of grain production and fertilizer application intensity. It is essential to coordinate industrial transformation, population structure optimization, and resource governance to mitigate cross-system restrictive conflicts, continuously narrow inter-subsystem development gaps, and ultimately promote the WEF system toward higher coordination levels.
This study is a single-city case study, and its findings are conditioned by Daqing’s specific resource endowment, water scarcity, and policy context. The general patterns identified here, such as the single-resource industrial structure and post-depletion transformation pressure, are likely applicable to other resource-based regions in China, whereas the specific mechanisms are more dependent on local resource and policy conditions. In addition, the evaluation index system is case-specific, and applying it to other cities would require adjusting indicators to local data availability and resource conditions. These considerations should be taken into account when generalizing the findings, while the analytical framework itself remains transferable to other resource-based regions.
Author Contributions
Investigation and writing, C.W.; data curation, L.C.; methodology, H.Z.; software and formal analysis, Y.H.; conceptualization, H.L.; review and editing, Y.X.; supervision and validation, Y.C. All authors have read and agreed to the published version of the manuscript.
Funding
This research was supported by Shandong Provincial Natural Science Foundation (Grant No. ZR2024QE357).
Data Availability Statement
The original contributions presented in this study are included in the article. Further inquiries can be directed to the corresponding author.
Acknowledgments
The authors gratefully acknowledge the editor and anonymous reviewers for their comments, which greatly contributed to improving the quality of the manuscript.
Conflicts of Interest
The authors declare no conflicts of interest.
Appendix A
Table A1.
Standardized values of the 36 evaluation indicators for the WEF system in Daqing, 2005–2023.
Table A2.
Correlation matrix of the water subsystem indicators.
Table A3.
Correlation matrix of the energy subsystem indicators.
Table A4.
Correlation matrix of the food subsystem indicators.
Table A5.
Correlation matrix of the regional development subsystem indicators.
Table A6.
Obstacle degrees (%) of the 36 evaluation indicators for the WEF system in Daqing (2005–2023).
References
- de Amorim, W.S.; Valduga, I.B.; Ribeiro, J.M.P.; Williamson, V.G.; Krauser, G.E.; Magtoto, M.K.; Guerra, J.B.S.O.d.A. The nexus between water, energy, and food in the context of the global risks: An analysis of the interactions between food, water, and energy security. Environ. Impact Assess. Rev. 2018, 72, 1–11. [Google Scholar] [CrossRef] [Scilit]
- Ke, J.; Khanna, N.; Zhou, N. Analysis of water-energy nexus and trends in support of the sustainable development goals: A study using longitudinal water-energy use data. J. Clean. Prod. 2022, 371, 133448. [Google Scholar] [CrossRef] [Scilit]
- Sun, L.; Niu, D.; Yu, M.; Li, M.; Yang, X.; Ji, Z. Integrated assessment of the sustainable water-energy-food nexus in China: Case studies on multi-regional sustainability and multi-sectoral synergy. J. Clean. Prod. 2022, 334, 130235. [Google Scholar] [CrossRef] [Scilit]
- Wu, H.; Yue, Q.; Guo, P.; Xu, X.Y. Exploiting the potential of carbon emission reduction in cropping-livestock systems: Managing water-energy-food nexus for sustainable development. Appl. Energy 2025, 377, 124443. [Google Scholar] [CrossRef] [Scilit]
- Davis, K.F.; Rulli, M.C.; Seveso, A.; D’Odorico, P. Increased food production and reduced water use through optimized crop distribution. Nat. Geosci. 2017, 10, 919–924. [Google Scholar] [CrossRef] [Scilit]
- Ling, M.; Qi, T.; Li, W.; Yu, L.; Xia, Q. Simulating and predicting the development trends of the water-energy-food-ecology system in Henan Province, China. Ecol. Indic. 2023, 158, 111513. [Google Scholar] [CrossRef] [Scilit]
- Zhang, C.; Chen, X.; Li, Y.; Ding, W.; Fu, G. Water-energy-food nexus: Concepts, questions and methodologies. J. Clean. Prod. 2018, 195, 625–639. [Google Scholar] [CrossRef] [Scilit]
- Rezaei Kalvani, S.; Celico, F. Analysis of pros and cons in using the water-energy-food nexus approach to assess resource security: A review. Sustainability 2024, 16, 2605. [Google Scholar] [CrossRef] [Scilit]
- Yang, G.Q.; Su, Y.X.; Huo, L.J.; Guo, D.P.; Wu, Y.S. A multi-objective synergistic optimization model considering the water-energy-food-carbon nexus and bioenergy. Agric. Water Manag. 2025, 312, 109431. [Google Scholar] [CrossRef] [Scilit]
- Mercure, J.-F.; Paim, M.A.; Bocquillon, P.; Lindner, S.; Salas, P.; Martinelli, P.; Berchin, I.I.; Guerra, J.B.S.O.A.; Derani, C.; de Albuquerque, C.L., Jr.; et al. System complexity and policy integration challenges: The Brazilian energy-water-food nexus. Renew. Sustain. Energy Rev. 2019, 105, 230–243. [Google Scholar] [CrossRef] [Scilit]
- Hejnowicz, A.P.; Thorn, J.P.R.; Giraudo, M.E.; Sallach, J.B.; Hartley, S.E.; Grugel, J.; Pueppke, S.G.; Emberson, L. Appraising the water-energy-food nexus from a sustainable development perspective: A maturing paradigm? Earth’s Future 2022, 12, e2021EF002622. [Google Scholar] [CrossRef] [Scilit]
- Kellner, E.; Martin, D.A. Learning from past coevolutionary processes to envision sustainable futures: Extending an action situations approach to the water-energy-food nexus. Earth Syst. Gov. 2023, 15, 100168. [Google Scholar] [CrossRef] [Scilit]
- Ojeda-Matos, G.; Jones-Crank, J.L. The potential of the water-energy-food nexus approach in advancing the sustainable development goals: A PRISMA-based systematic review. Environ. Sci. Policy 2025, 163, 103972. [Google Scholar] [CrossRef] [Scilit]
- Wang, Z.; Liu, S.; Kang, P.; Yan, W.; Pan, Z.; Tang, W. Evaluation of the coupled coordination of the water-energy-food-carbon nexus in crop production systems at the irrigation district scale. J. Clean. Prod. 2025, 523, 146403. [Google Scholar] [CrossRef] [Scilit]
- Yuan, Z.; Cao, M.; Chen, M.; Lü, G.; Liu, Y.; Yang, W.; Ni, H. Multi-scale supply-demand security assessment of water-energy-food related ecosystem services from an interaction perspective. Ecol. Indic. 2026, 182, 114584. [Google Scholar] [CrossRef] [Scilit]
- Feng, C.; Liu, C. Prediction and dynamic coupling coordination evaluation of China’s inter-provincial water-energy-food security system. Environ. Sci. Pollut. Res. 2024, 32, 1653–1667. [Google Scholar] [CrossRef] [Scilit]
- Jing, P.; Hu, T.; Sheng, J.; Mahmoud, A.; Liu, Y.; Yang, D.; Guo, L.; Li, M.; Wu, Y. Coupling coordination and spatiotemporal dynamic evolution of the water-energy-food-land (WEFL) nexus in the Yangtze River Economic Belt, China. Environ. Sci. Pollut. Res. 2023, 30, 34978–34995. [Google Scholar] [CrossRef] [Scilit]
- Zhou, Q.; Wang, W.; Tao, H.; Wang, F.; Fu, K.; Qiao, J.; Wu, Y.; Zhang, Z.; Wang, Y.; Liu, Y.; et al. Investigation of the coupling and coordination relationship of water-energy-food-ecology and the driving mechanism in Dalad Banner. Sustainability 2024, 16, 5223. [Google Scholar] [CrossRef] [Scilit]
- Ma, Q.T.; Yang, Y.H.; Sheng, Z.P.; Han, S.M.; Yang, Y.M.; Moiwo, J.P. Hydro-economic model framework for achieving groundwater, food, and economy trade-offs by optimizing crop patterns. Water Res. 2022, 226, 119342. [Google Scholar] [CrossRef] [Scilit]
- Sambo, B.; Sperotto, A.; Aznarez, C.; Terzi, S.; Pittore, M.; Critto, A.; Torresan, S. Managing the water-energy-food nexus in the Adige River Basin: Impacts of climate and land use change on ecosystem services bundles. Clim. Change 2025, 178, 168. [Google Scholar] [CrossRef] [Scilit]
- Pan, M.; Tang, Z.; Zhao, G. Organic farming enhances the synergy of the water-energy-food-ecology nexus. Agric. Syst. 2025, 224, 104247. [Google Scholar] [CrossRef] [Scilit]
- Qu, J.; Lin, J.; Cheng, M.; Zhang, Z.; Feng, K.; Wang, F.; Ren, K.; Zhou, J.; Li, Y. Determination of the spatiotemporal evolution patterns and obstacle factors of coupling coordination of the water–energy–food–ecology system in Ordos City, China. Environ. Geochem. Health 2025, 47, 193. [Google Scholar] [CrossRef] [Scilit]
- Wang, H.; Fang, L. Analysis of the spatio-temporal coupling and coordination of water-energy-food nexus system security in the energy-rich areas of the Loess Plateau: The case of Yuyang District. Chin. J. Environ. Manag. 2023, 15, 43–50. (In Chinese) [Google Scholar] [CrossRef]
- Li, W.; Yi, P.; Zhang, D.; Zhou, Y. Assessment of coordinated development between social economy and ecological environment: Case study of resource-based cities in northeastern China. Sustain. Cities Soc. 2020, 59, 102208. [Google Scholar] [CrossRef] [Scilit]
- Simpson, G.B.; Jewitt, G.P.W. The development of the water-energy-food nexus as a framework for achieving resource security: A review. Front. Environ. Sci. 2019, 7, 8. [Google Scholar] [CrossRef] [Scilit]
- Feng, M.Q.; Chen, Y.N.; Li, Z.; Duan, W.L.; Zhu, Z.Y.; Liu, Y.C.; Zhou, Y.Q. Optimisation model for sustainable agricultural development based on water-energy-food nexus and CO2 emissions: A case study in Tarim River Basin. Energy Convers. Manag. 2024, 303, 118174. [Google Scholar] [CrossRef] [Scilit]
- Tan, Z.W.; Li, H.; Zhu, Z.Y.; Hou, J.W.; Wang, Z.C. A water-energy-food-land nexus framework for multi-objective optimization and risk assessment integrating deep reinforcement learning and copula-based modeling. Water Res. 2025, 287, 124474. [Google Scholar] [CrossRef] [Scilit]
- Liu, X.; Yang, R.; Zhang, X.; Sun, A.; Zhang, F.; Li, C.; Li, J. A novel integrated approach for spatial analysis of the coupling relationship and its driving mechanisms of the water-energy-food-ecology-land nexus in the Yellow River Basin of China. Water 2026, 18, 1577. [Google Scholar] [CrossRef] [Scilit]
- Zhang, C.; Li, M.; Zhao, X.; Wang, Y.; Ju, K. Measurement and prediction of water-energy-food-economy-ecology coupling coordination degree in Shandong Province, China. Ecol. Model. 2026, 517, 111600. [Google Scholar] [CrossRef] [Scilit]
- Han, C.; Han, X.; Ma, B.; Li, D.; Wang, Z.; Hao, Z.; Zhang, X. Research on the coupling coordination relationship and spatial equilibrium measurement of the water-energy-food nexus system in China. Water 2025, 17, 527. [Google Scholar] [CrossRef] [Scilit]
- Wang, S.; Yang, R.; Shi, S.; Wang, A.; Liu, T.; Yang, J. Characteristics and influencing factors of the spatial and temporal variability of the coupled water-energy-food nexus in the Yellow River Basin in Henan Province. Sustainability 2023, 15, 13977. [Google Scholar] [CrossRef] [Scilit]
- Ding, T.; Chen, J. Evaluation and obstacle factors of coordination development of regional water-energy-food-ecology system under green development: A case study of Yangtze River Economic Belt, China. Stoch. Environ. Res. Risk Assess. 2022, 36, 2477–2493. [Google Scholar] [CrossRef] [Scilit]
- Žižović, M.; Miljković, B.; Marinković, D. Objective methods for determining criteria weight coefficients: A modification of the CRITIC method. Decis. Mak. Appl. Manag. Eng. 2020, 3, 149–161. [Google Scholar] [CrossRef] [Scilit]
- Zhang, W.; Liu, C.; Li, L.; Jiang, E.; Zhao, H. The Coupling Coordination Degree and Its Driving Factors for Water–Energy–Food Resources in the Yellow River Irrigation Area of Shandong Province. Sustainability 2024, 16, 8473. [Google Scholar] [CrossRef] [Scilit]
- Chen, J.; Yu, X.; Qiu, L.; Deng, M.; Dong, R. Study on vulnerability and coordination of water-energy-food system in Northwest China. Sustainability 2018, 10, 3712. [Google Scholar] [CrossRef] [Scilit]
- Ren, D.; Hu, Z.; Cao, A. Evaluation and prediction of the coordination degree of coupling water-energy-food-land systems in typical arid areas. Sustainability 2024, 16, 6996. [Google Scholar] [CrossRef] [Scilit]
- Li, L.; Fan, Z.; Feng, W.; Yuxin, C.; Keyu, Q. Coupling coordination degree spatial analysis and driving factor between socio-economic and eco-environment in northern China. Ecol. Indic. 2022, 135, 108555. [Google Scholar] [CrossRef] [Scilit]
- Qi, Y.; Farnoosh, A.; Lin, L.; Liu, H. Coupling coordination analysis of China’s provincial water-energy-food nexus. Environ. Sci. Pollut. Res. 2022, 29, 23303–23313. [Google Scholar] [CrossRef] [Scilit]
- Yirui, W.; Jinxi, S.; Haotian, S. Coupling interactions and spatial equilibrium analysis of water-energy-food in the Yellow River Basin, China. Sustain. Cities Soc. 2023, 88, 104293. [Google Scholar] [CrossRef] [Scilit]
- Yueting, W.; Lidan, G.; Jing, P.; Feng, H.; Wang, H. Coupled water-energy-food-ecology relationships and spatial and temporal differentiation in five Central Asian countries. Arid Zone Stud. 2023, 40, 573–582. [Google Scholar] [CrossRef]



Disclaimer/Publisher’s Note: The statements, opinions and data contained in all publications are solely those of the individual author(s) and contributor(s) and not of MDPI and/or the editor(s). MDPI and/or the editor(s) disclaim responsibility for any injury to people or property resulting from any ideas, methods, instructions or products referred to in the content. |
© 2026 by the authors. Licensee MDPI, Basel, Switzerland. This article is an open access article distributed under the terms and conditions of the Creative Commons Attribution (CC BY) license.