


Abstract
Surface water level changes can alter nearby groundwater levels due to recharge or mechanical loading. It is important to distinguish these processes so that the groundwater recharge mechanisms are not misinterpreted. At Lake Tutchewop, a salt disposal basin in the Murray–Darling Basin of southeastern Australia, groundwater chemistry shows that recharge from the lake generally extends < 165 m laterally, but groundwater levels fluctuate synchronously with lake levels well beyond this distance. To determine whether this synchronicity is due to lake pressure loading, impulse response function (IRF) modelling was applied to groundwater level data from 41 monitoring bores that surround the lake. Models using three inputs (rainfall, evapotranspiration and lake levels) outperformed those using two inputs (rainfall and evapotranspiration) for bores up to ~5 km from the lake and up to ~75 m deep, far beyond the demonstrated extent of physical recharge from the lake. This confirmed that lake pressure loading has a significant influence on groundwater levels around Lake Tutchewop, raising the levels by up to 0.3 m close to the lake. The model results also showed that lake loading has a more substantial impact on groundwater in the confined aquifer beneath the lake, and on clay-dominated lithologies. The results have significant management implications, confirming that lake leakage affects a relatively small area and has little impact on nearby agricultural land.
1. Introduction
Groundwater levels in an aquifer fluctuate in space and time, due to both internal factors (recharge into and discharge out of an aquifer) and external factors, like barometric pressure [1,2] and loading due to the application of additional weight to the aquifer [3], e.g., due to trains [4], tides [5] and dams [6]. Surface water loading impacts groundwater levels in underlying aquifers due to the propagation of pressure waves, which travel away from the surface water body [5] and do not necessarily involve any groundwater flow [3]. It is important to accurately determine the impact of external loading because the resulting rise in groundwater level mimics recharge and could lead to an overestimation of recharge, with significant implications for groundwater management.
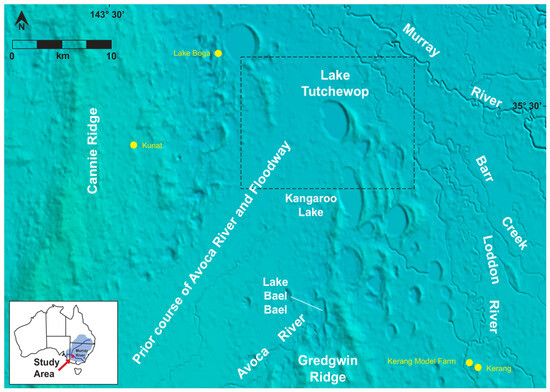
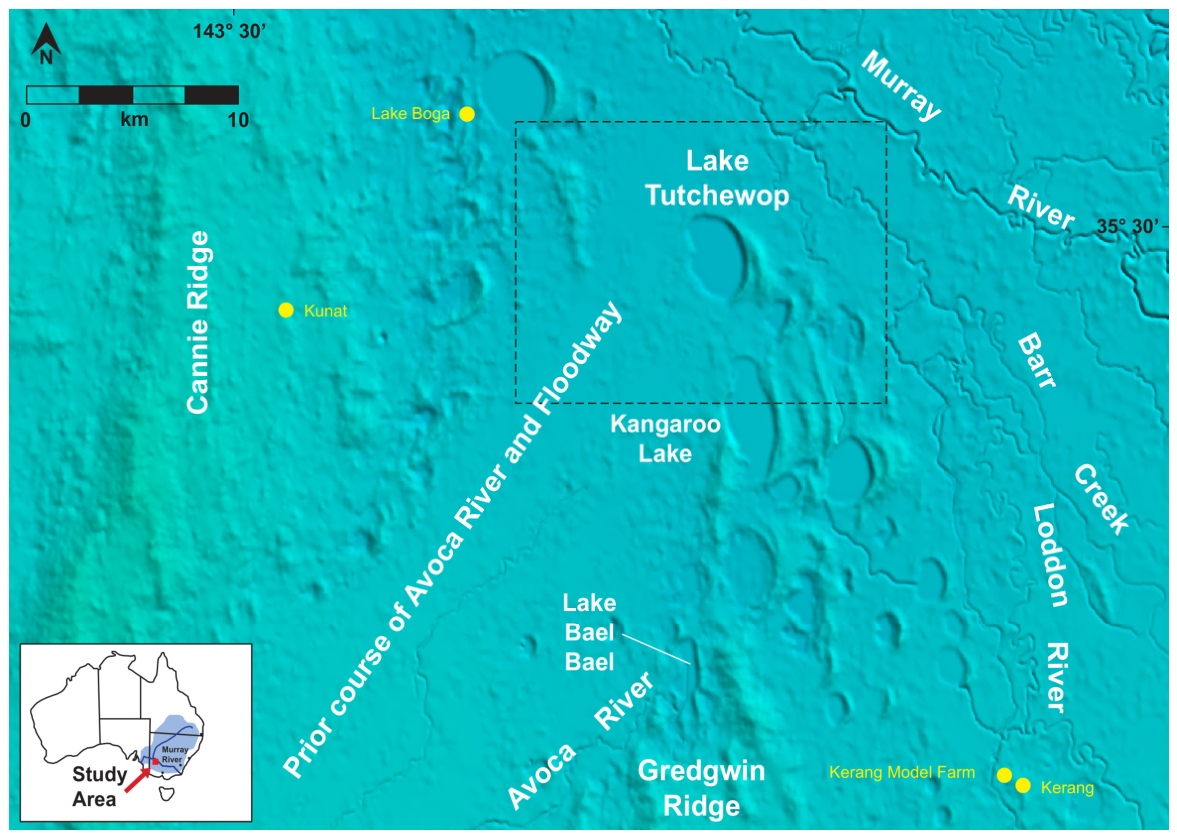
This problem is well illustrated by Lake Tutchewop, a salt disposal basin within the Murray–Darling Basin in southeastern Australia, where most of Australia’s irrigated agriculture industry is located. The Murray River naturally receives saline groundwater discharge, both directly through its banks and via inlet streams, and this has been exacerbated due to extensive land clearing and irrigation since European settlement [7,8]. To reduce this salt input, saline groundwater and irrigation returns are pumped into salt disposal basins [9], which were originally natural depressions containing saline or fresh water [10,11]. The oldest interception scheme, the Barr Creek Drainage Disposal Scheme, has diverted saline water from Barr Creek into Lake Tutchewop since 1968 (Figure 1); prior to implementation, Barr Creek was the largest single point source of salt to the Murray River, discharging > 300 tonnes per day. Lake Tutchewop has received an estimated 0.98 to 1.09 million tonnes of salt since the disposal scheme commenced [12,13].
Figure 1.
Topographic setting of Lake Tutchewop. Topographic DEM obtained from Geoscience Australia, one-second resolution, hydrologically conditioned and drainage enforced and processed to remove vegetation to support delineation of catchments and related hydrological attributes.
The fate of these salt inputs at Lake Tutchewop is well understood [14]. The extent of saline leakage from Lake Tutchewop into surrounding groundwater was determined using groundwater stable isotope analyses and major ion chemistry, which were able to separate the relative influences of lake water, irrigation water and regional groundwater. In ~45 years of operation, the saline water input to Lake Tutchewop infiltrated less than 165 m from the lake edge in most directions, due to the underlying, relatively impermeable, clay-rich sediments. In one area, preferential groundwater flow along a sandier palaeochannel resulted in migration of saline groundwater up to 700 m laterally.
However, groundwater levels in many of the groundwater bores located further than 165 m from the edge of Lake Tutchewop fluctuate synchronously with lake levels. This synchronicity cannot be due to physical leakage of saline water from the lake and is instead likely to be the result of mechanical loading from the weight of lake water (lake pressure loading).
To understand whether this physical groundwater phenomenon is impacting groundwater levels around Lake Tutchewop, stochastic groundwater models can be employed, particularly time series models that use impulse response functions (IRFs) applicable to irregularly spaced groundwater level data [15]. The IRF approach has been used successfully in a variety of hydrogeological settings, including groundwater pumping [16]; groundwater level forecasting [17]; assessing the probability of extreme (shallow) water table levels [18,19]; determining the relative impact of climate change, land use and environmental settings on groundwater levels [20,21]; estimating recharge rates and time lag between recharge and change in groundwater level [22,23]; and determining the extent of river–aquifer interactions [24]. Unlike deterministic groundwater models (e.g., MODFLOW), the IRF models do not rely on prior geological and hydrogeological data; however, the modeller needs to identify likely groundwater stresses [25].
The purpose of the present study was to use an IRF model (implemented using the freely available Menyanthes package) to assess the influence of lake pressure loading on the groundwater levels surrounding Lake Tutchewop.
2. Materials and Methods
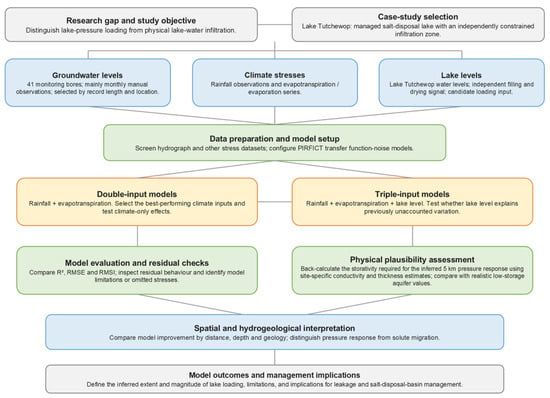
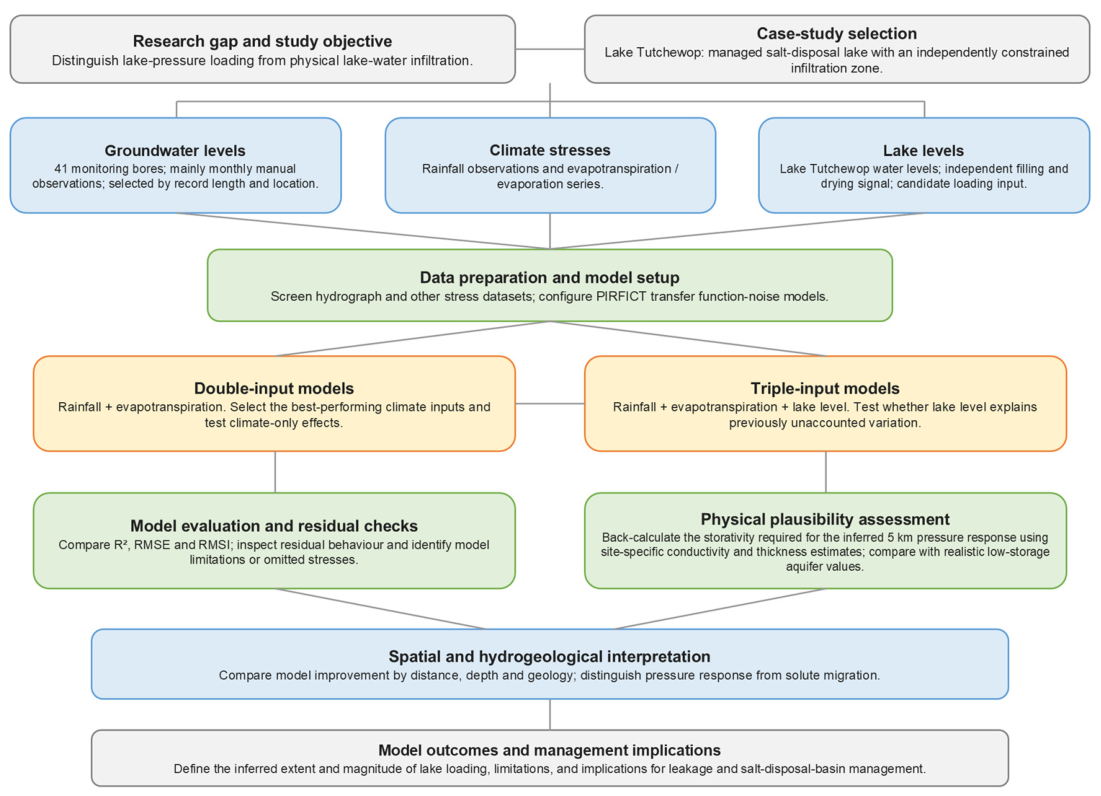
Figure 2 presents the detailed steps of the methodology (including the modelling process), which will be explained in more detail in the following subsections.
Figure 2.
Workflow used to evaluate the influence of lake pressure loading on groundwater levels around Lake Tutchewop.
2.1. Site Setting
Lake Tutchewop is approximately 775 ha in size (~3980 m long and ~2200 m wide) and lies at 70 m Australian Height Datum (AHD) on the southern Riverine Plains in northwestern Victoria, Australia (Figure 1). It is part of the Kerang Lakes complex, which comprise over 50 permanent and temporary lakes, marshes and swamps of varying salinities. Many of these are groundwater discharge features [26], but Lake Tutchewop was formerly intermittently filled with freshwater during large flooding events of the Avoca River, although it is now blocked off from most flooding by a levee.
Irrigation channels were first developed in the area around Lake Tutchewop in the late 1800s, and between 1923 and 1935, the lake was used for temporary water storage within the Torrumbarry Irrigation district [13]. The main irrigation channel (6/7), which bypasses Lake Tutchewop, was constructed around 1945 [13], drawing water from Kangaroo Lake (Figure 1).
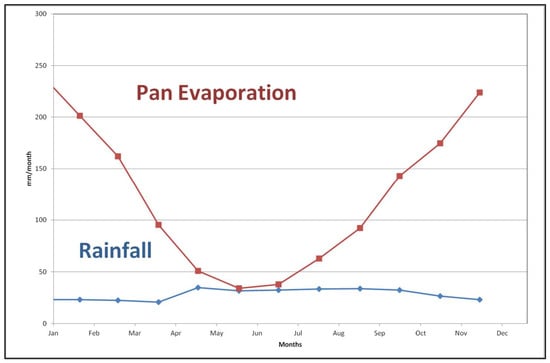
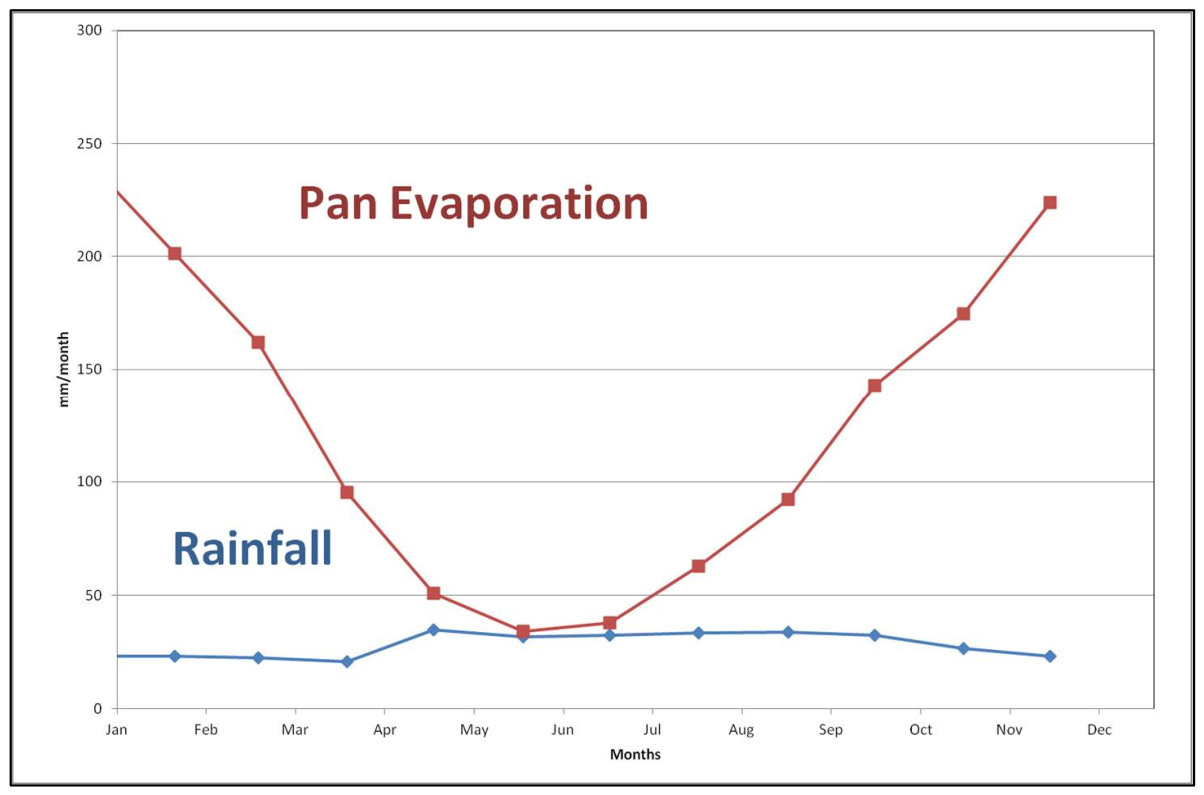
The study area has a semiarid climate; the mean annual pan evaporation of 1522 mm exceeds the mean annual rainfall of 338 mm in every month of an average year (Figure 3). The dominant land use is perennial and some annual pasture; the perennial pasture is irrigated during summer [27]. Irrigation surrounding Lake Tutchewop decreased significantly during the drought that was experienced in the area between 1997 and 2011, at the end of the monitoring period used for this study (1976–2011).
Figure 3.
Average rainfall and pan evaporation at Lake Tutchewop. Plotted from data obtained from the Bureau of Meteorology Lake Boga Weather Station (see Figure 1 for location).
The geology of the area around Lake Tutchewop consists of Neoproterozoic and early Paleozoic basement overlain by ?Paleocene to mid-Miocene Renmark Group, Late Miocene to Pliocene Loxton Sand and Pliocene to Holocene Shepparton Formation [28]. In addition, quaternary lunette dune deposits lie on the eastern side of Lake Tutchewop, and the lake bed is composed of Holocene clays (Yamba Formation). Sediments deposited along current streams (Quaternary Coonambidgal Formation) are present to the south and west of the lake. The Loxton Sand and Shepparton Formation are the geological units relevant to this study and are further described below. For a detailed description of the geology at Lake Tutchewop refer to Robson & Webb [28].
The shallow marine Loxton Sand is typically composed of relatively uniform white/grey/brown sands that are clayey and silty in parts [29]. This unit is the most extensive aquifer beneath the southern Riverine Plains and forms a northwest-flowing regional groundwater system [30], which is recharged to the south on the margins of the Southeastern Highlands through the gravel and coarse sand of the Calivil Formation; this unit interfingers down-basin with the finer Loxton Sand [26,31]. No equivalent continuous aquifer exists in the overlying fluvial Shepparton Formation, which is a grey/brown/red/orange clay-rich unit [29], often mottled, that contains elongate channel sand bodies forming local flow systems [32]. The Shepparton Formation fines northwards, leading to the development of confined to semi-confined conditions in the underlying Loxton Sand [26], and this is responsible for upward hydraulic gradients from Loxton Sand to the Shepparton Formation at Lake Tutchewop [14].
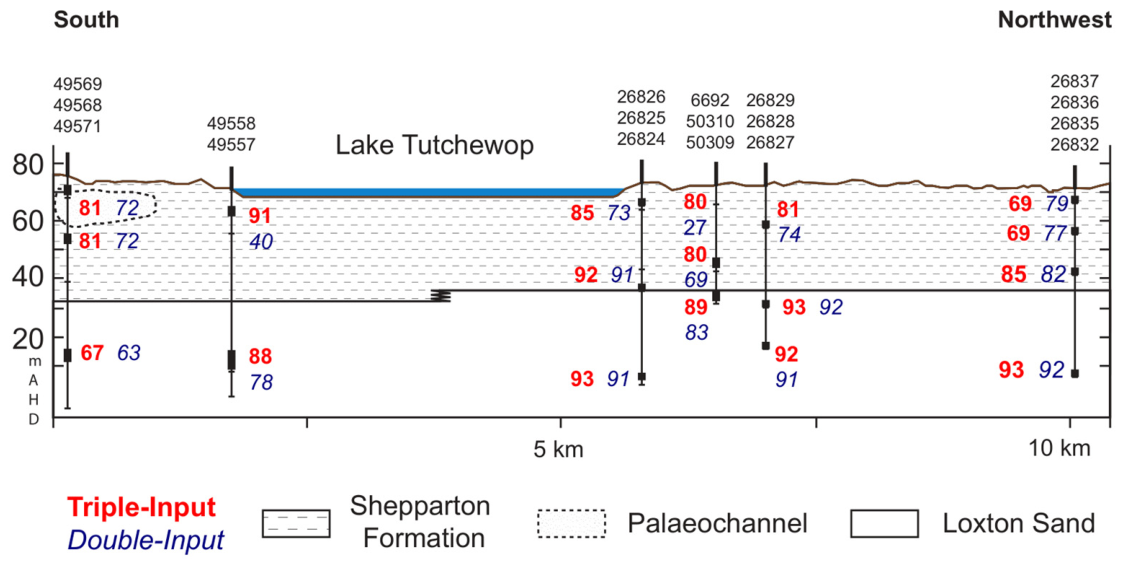
Lake Tutchewop is surrounded by the Shepparton Formation, which is approximately 27 metres thick on the east side of the lake, increasing abruptly up to 37 metres on the west side, as a result of Pliocene reactivation of the Leaghur Fault [28]. The underlying Loxton Sand has not been drilled to its entire depth around Lake Tutchewop, so no bore has encountered the underlying Renmark Group in this area (Figure 4). In terms of lake water–groundwater interaction, the Shepparton Formation and Loxton Sand are the most important geological units.
Figure 4.
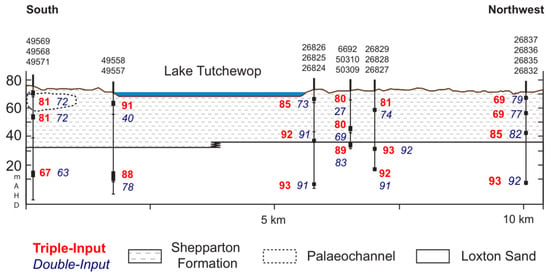
Cross-section from south to northwest beneath Lake Tutchewop showing the underlying stratigraphy and comparing IRF model results (R2 values) for double (blue italics)- and triple (red bold)-input models (see text for details).
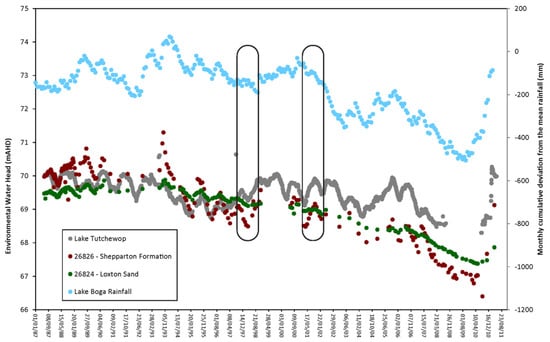
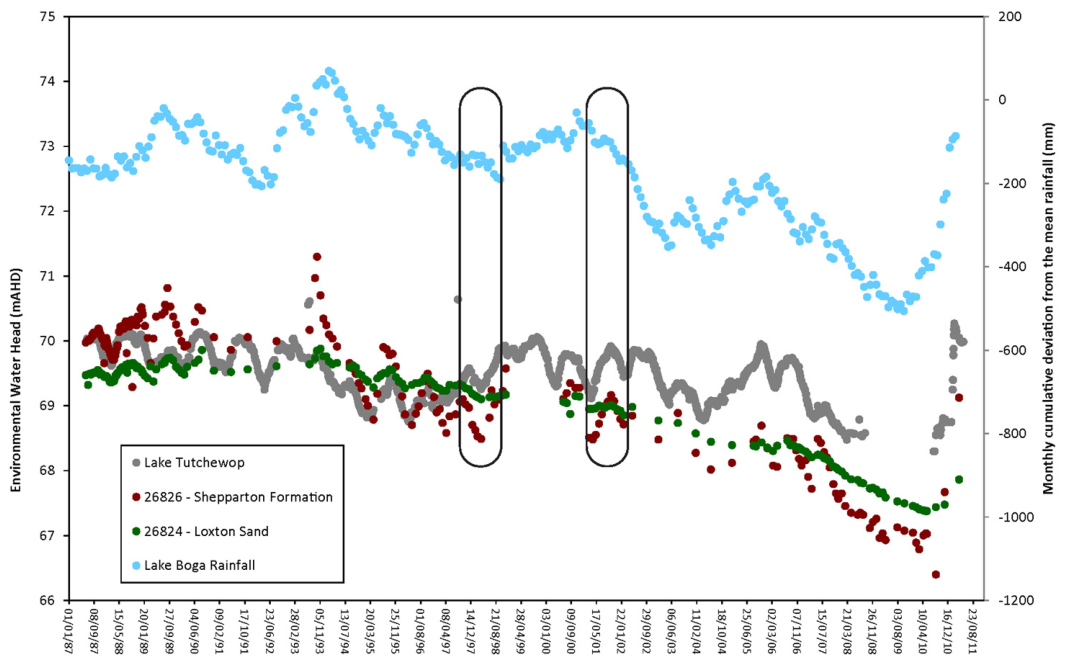
Many of the hydrographs from groundwater monitoring bores screened in the Shepparton Formation close to Lake Tutchewop show fluctuations synchronous with lake levels, rather than rainfall fluctuations (Figure 5), and this has been attributed to either a hydraulic connection between the lake and groundwater [33] or the effect of hydrostatic loading by the lake [13]. In addition, climate variables (effect of rainfall and evapotranspiration on recharge) and irrigation channel water levels may also impact the bore hydrographs. In order to differentiate the relative influences on groundwater responses of these variables, we applied an IRF model. The results of the modelling allowed us to better understand the drivers behind the responses seen in the bore hydrographs surrounding Lake Tutchewop.
Figure 5.
Environmental water heads (EWHs) for bores 26824 and 26826, calculated as per Post [34], compared with Lake Tutchewop level fluctuations and cumulative deviation from mean rainfall for Lake Boga. Groundwater levels move synchronously with lake levels, rather than rainfall fluctuations; two specific instances circled.
2.2. Transfer Function Noise Model
Transfer function noise (TFN) models transform a series of input observations into a series of outputs using multiple regressions [20]. Traditionally, these have required uninterrupted equidistant data and very specific knowledge from the analyst to be able to perform an iterative model identification phase. However, the Predefined Impulse Response Function in Continuous Time (PIRFICT) IRF model is a TFN model that can model irregularly spaced bore hydrograph data [15]. In this approach, the transfer function used in Autoregressive Moving Average (ARMA) models, which is discrete in time, is replaced by a convolution integral in continuous time that defines the impulse response function [25]:
where hi is the predicted head at time t attributable to stress i, Ri is the value of stress i at time t, and θi is the transfer or impulse response function of stress i.
This can then be applied to each of the main stresses on groundwater head. Stresses that cause a very similar response do not necessarily need separate response functions. Thus, the effect of evapotranspiration (e), which has the same effect on the groundwater level as precipitation (p) but in the opposite direction, uses the same response function, which is negative:
where f is a reduction in e as compared to the reference evaporation series.
To assess the IRF model performance and residual behaviour, the following diagnostic checks [35] are used:
- Explained variance (R2), which quantifies the proportion of variability in the observed groundwater levels reproduced by the model and therefore provides an overall measure of model fit;
- Root mean squared error (RMSE), which represents the average magnitude of model residuals (the difference between observed and simulated groundwater levels);
- Root mean squared innovation (RMSI), which represents the average residual error remaining after application of the noise model and therefore provides a measure of unexplained variation in the groundwater level time series.
This residual analysis is particularly useful because non-random residual error may indicate that important groundwater stresses have not been incorporated into the model structure. The PIRFICT methodology explicitly incorporates a stochastic noise model to account for temporal autocorrelation and unexplained variation remaining after simulation of the groundwater stresses, so collectively, the RMSE and RMSI metrics provide measures of both overall model fit and residual behaviour. In Menyanthes, the mean residual is constrained to zero [15]. Accordingly, in addition to RMSE and RMSI, model outputs were visually inspected for extended periods of systematic deviation between observed and simulated groundwater levels, as such behaviour may indicate that important groundwater stresses have not been incorporated into the model structure, or that the model response is not fully consistent with the underlying physical and hydrogeological processes. Where persistent deviations were identified, potential causes were considered in the interpretation of model performance.
Other plausibility checks include [25]:
- The moments of the impulse response functions; these characterise the functioning of the groundwater system and can be related to its geohydrologic properties.
- The local drainage base; this is the groundwater level without precipitation or other influence and should be close to the reference datum for the groundwater data (AHD in this study).
- The evaporation factor; this is the only parameter which is estimated. It represents the average reduction in evaporation due to soil water shortages and depends on soil and land cover. It is considered to be constant in Menyanthes, although it may vary seasonally; it can be constrained to a realistic range using values obtained from modelling surrounding observation wells [20].
The workflow is presented in Figure 2.
Model Inputs
Altogether, 41 bores were selected, based on length of monitoring (between December 1976 and April 2011) and distance from Lake Tutchewop (up to 5.7 km from the centre of the lake); these bores were screened in either the Shepparton Formation (26 bores) or Loxton Sand (15 bores up to 75 m deep), and many locations were nested. The groundwater data was mostly monthly measurements obtained from the Victorian Water Measurement Information System [36], along with manual measurements taken during this study. Routine monitoring for most bores in the area ceased in 2012. The raw data was used in the modelling; density corrections for salinity variations are required only in groundwater flow studies or comparison of data from nested bores [34]. For two bores (115419 and 115421), water level logger data was available for periods between 1995 and 1996; however, it is not known if this dataset was corrected for barometric pressure effects.
Daily rainfall data was obtained from the Bureau of Meteorology for three nearby weather stations (Lake Boga, Kunat and Kerang Model Farm; Figure 1) that had long periods of data collection. Daily pan evaporation data was obtained from Kerang Model Farm station, and daily gridded evapotranspiration data, calculated by FAO56 [37], was obtained from the SILO website [38]. Lake levels were obtained from Goulburn–Murray Water and consisted of irregularly spaced manual measurements of a surface water gauge. Irrigation was not used as an input in the modelling, as no time series data was available.
Lake level data was provided by Goulburn–Murray Water. Since the operation of the Barr Creek Drainage Disposal Scheme is more or less continuous, the lake level fluctuations are not solely driven by rainfall and evaporation, and are largely independent (because the lake lacks significant surface inflow, apart from the saline drainage inflow).
To quantify the effect of lake loading on the groundwater levels at Lake Tutchewop, models of the 41 bore hydrographs using two inputs (rainfall and evapotranspiration) were compared to triple-input models (rainfall, evapotranspiration and lake levels). The double-input models used rainfall from the three weather stations, pan evaporation and FAO56 evapotranspiration in various combinations. Of these variables, it was found that models using rainfall from the closest weather station, Lake Boga, and evapotranspiration calculated using FAO56 performed best, i.e., the modelled bore hydrograph more closely matched the observed groundwater levels, as shown by higher median R2 values and lower median RMSE and RMSI values (Table 1). However, 22 of the models had evaporation factors greater than one. This is unrealistic, as it indicates that actual evapotranspiration is greater than that calculated by FAO56; another bore hydrograph IRF modelling study in Victoria [21] noted a similar outcome. In this study, the unrealistically high evaporation factors were replaced with a value (f = 0.53) representative of results from surrounding monitoring wells.
Table 1.
IRF model results from all bores modelled in the area around Lake Tutchewop.
3. Results
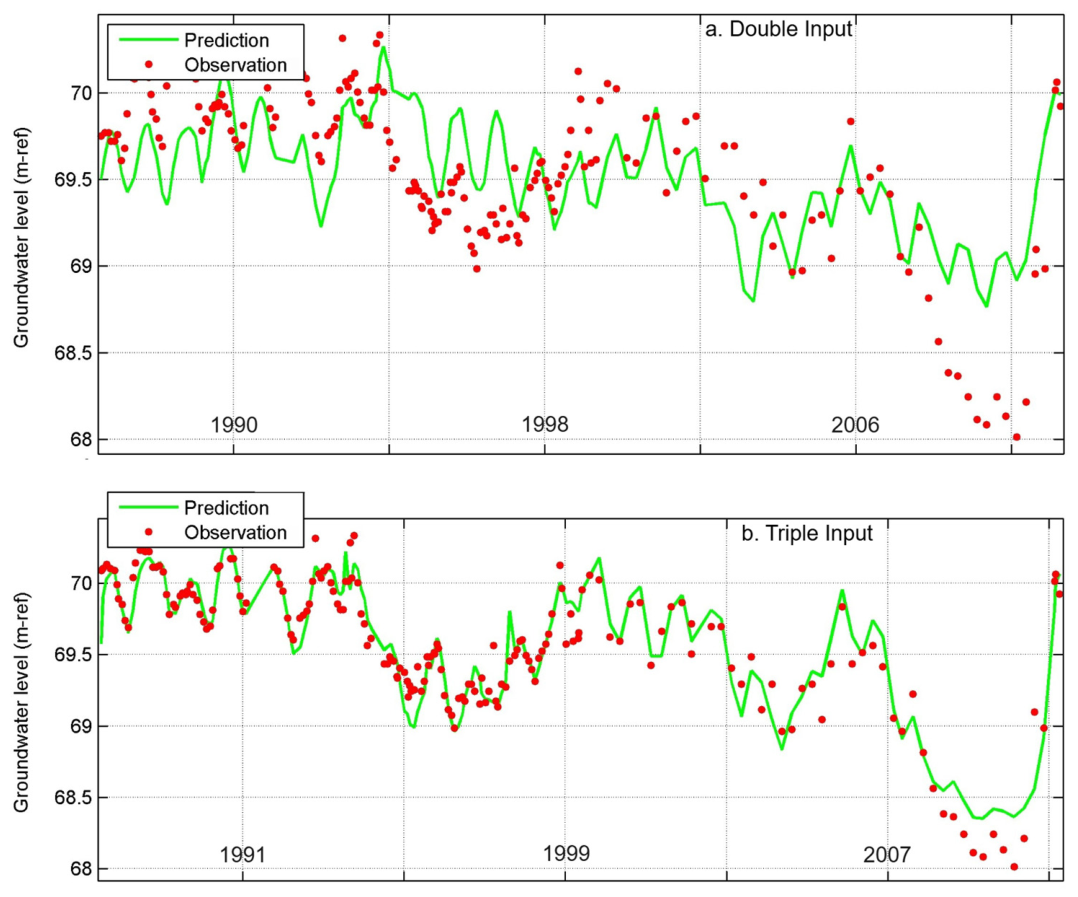
Comparing the results of double input and triple input models (Table 1), the triple input models outperform the double input models for most (32 out of 41) of the bores modelled around Lake Tutchewop. In the triple input models, the modelled and observed bore hydrographs matched more closely, producing higher median R2 values and lower median RMSE and RMSI values (Table 1), demonstrating both an improved fit to the observed groundwater levels and a reduction in unexplained residual variation. For the double input models, the residual analysis indicated that one or more important stresses influencing groundwater levels were not represented in the model structure. Inclusion of lake level as a third input resulted in higher R2 values and lower RMSE and RMSI values, reducing residual error and unexplained variation. Because lake level was the only additional stress introduced, the improvement in model performance demonstrates that fluctuations in Lake Tutchewop levels explain a substantial component of the previously unexplained groundwater level variability and indicates that pressure loading from the water in Lake Tutchewop is influencing the groundwater levels in these bores.
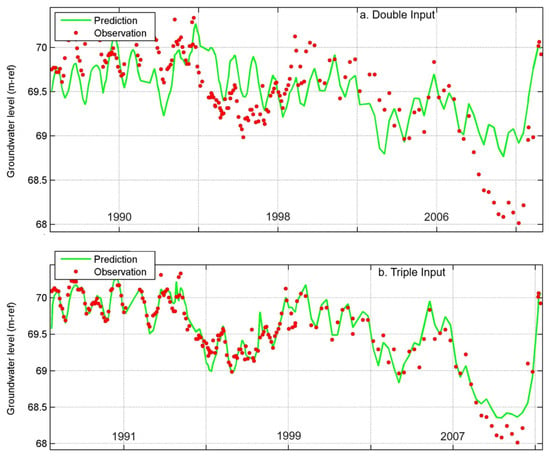
This is illustrated by the representative comparison in Figure 6. In the double-input model, several extended periods of groundwater level fluctuation remain poorly reproduced. Inclusion of lake level substantially improves agreement between observed and simulated groundwater levels, increasing the R2 value from 40 to 91 and reducing the RMSE and RMSI from 0.359 m to 0.142 m and 0.221 m to 0.126 m, respectively. Residuals are generally smaller and show few prolonged systematic departures from the model, indicating that the principal stresses influencing groundwater levels have been captured within the triple-input model.
Figure 6.
Comparison of representative double-input (a) and triple-input (b) models for bore 49558.
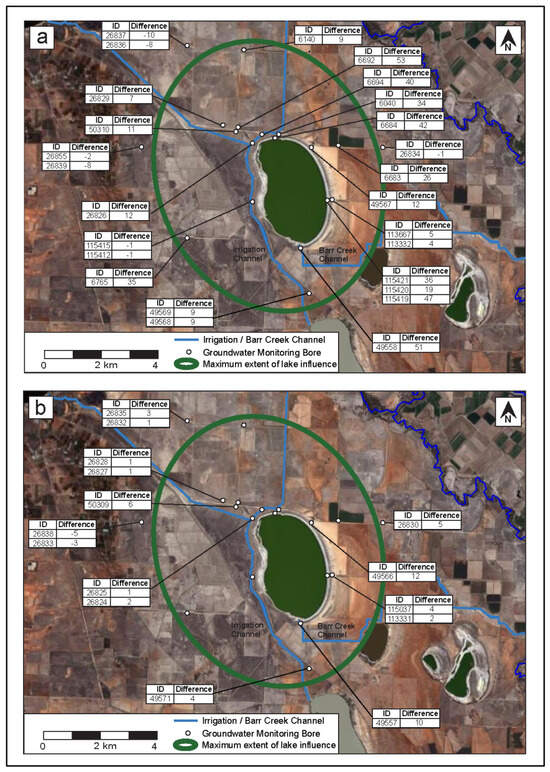
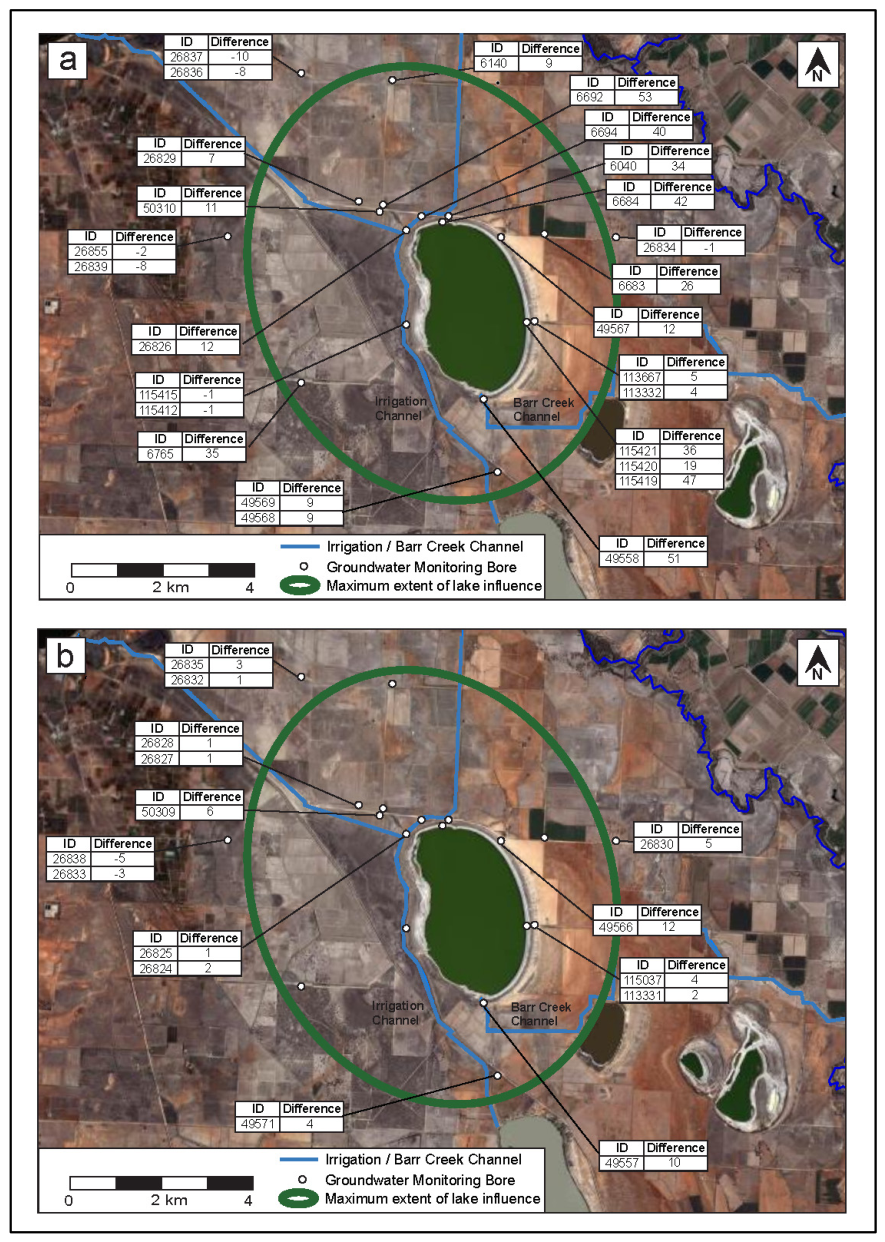
For bores screened in the Shepparton Formation, the triple-input models outperformed the double-input models up to 5.0 km from the centre of Lake Tutchewop (Figure 4 and Figure 7a). Bore 26837, approximately 5.7 km northwest from the centre of the lake, has a better double-input model (Table 1) and is therefore interpreted as being beyond the limit of the influence of Lake Tutchewop level fluctuations on groundwater levels. The distance over which lake levels affect bore hydrographs is slightly greater to the west of the lake, but this is probably a function of bore distribution, rather than lake levels having more influence on this side of the lake. The triple-input models have relatively low and variable R2 values (Table 1, Figure 7a), probably because the Shepparton Formation is heterogeneous, comprising both clay layers and channel sands. In addition, some bore hydrographs are influenced by irrigation water, which is an input not included in the modelling. Bores 6040 and 6683 (R2 values < 70%) are situated close to an irrigation channel and an irrigated area, respectively (Figure 7a). Although irrigation may be important locally, it is not a major and widespread omitted stress across the study area, because the majority of bores achieved satisfactory model performance.
Figure 7.
Difference between R2 values for triple-input and double-input IRF models for bores screened in the (a) Shepparton Formation and (b) Loxton Sand. Positive values indicate improved model performance following inclusion of Lake Tutchewop levels as a third input.
To assess whether the ~5 km extent of the inferred pressure response in the Shepparton Formation is physically plausible, the hydraulic diffusivity and characteristic propagation–time relationships [39] were used to calculate the storativity of the aquifer, for which no site-specific estimate was available. A midpoint Shepparton Formation thickness of 32 m, a response distance of 5 km, and clay and sandy/silty horizontal hydraulic conductivity values of 0.06 and 0.4 m/day obtained in the vicinity of Lake Tutchewop [13] were adopted. For a characteristic response time of 30 days, representing the approximate temporal resolution of the predominantly monthly groundwater observations, the calculated storativity values are 4.61 × 10⁻⁶ to 3.07 × 10⁻⁵ for the clay and sandy/silty beds, respectively. These estimates are physically reasonable for this low-storage aquifer system and indicate that the inferred response distance of ~5 km is plausible.
For bores screened in the Loxton Sand, triple-input models outperform the double-input models to depths of ~75 metres and distances of ~5 km from the centre of the lake (Figure 4 and Figure 7b). Within this area, the triple-input Loxton Sand models have higher, more consistent R2 values than the triple-input Shepparton Formation models (Table 1), reflecting the degree of confinement, homogeneity of the marine sands and the damping out with depth of the effects of any irrigation water inputs. Bore 49571 performs poorly (R2 value < 70%) because it is close to Kangaroo Lake (Figure 7b), and the levels in this lake, which are kept relatively constant year-round compared to Lake Tutchewop, are likely to be affecting this bore hydrograph.
4. Discussion
The fact that the triple-input models outperform the double-input models indicates that the filling and drying cycles of Lake Tutchewop impact the groundwater pressures in the adjacent and underlying aquifers, resulting in synchronicity of the groundwater and lake levels over significant distances from the lake. The residual analysis demonstrates that the double-input models do not completely explain the observed groundwater level fluctuations. The improved model fit and reduction in residual error achieved by adding lake level indicates that a significant component of the unexplained variability in the double-input models is attributable to fluctuations in Lake Tutchewop levels. The improvement in model performance following inclusion of lake level indicates that an important stress, or stresses, affecting groundwater levels was omitted from the double-input models. As lake level was the only additional stress incorporated, the results support the interpretation that lake pressure loading is responsible for a substantial proportion of the previously unexplained groundwater level variability. This interpretation is consistent with the observed synchronicity between groundwater and lake level fluctuations (Figure 5) and the improvement observed across a large proportion of the groundwater bores used in this analysis.
Therefore, the groundwater level fluctuations measured in the groundwater bores are largely a pressure response, rather than due to physical leakage of saline disposal water from the lake. Nevertheless, some recharge from the lake into the Shepparton Formation does occur, as identified using chemical and isotopic data [14]. However, this extends only 165 m from the lake shore in most directions, and a maximum of 700 m laterally and 11.5 m deep along the western lake margin, due to preferential groundwater flow within palaeochannel sand in the Shepparton Formation.
The lake loading response observed in the bore hydrographs around Lake Tutchewop, whereby the filling and evaporation cycles of Lake Tutchewop are imprinted on the surrounding groundwater levels, confirms that the lake is hydraulically connected with the underlying groundwater, i.e., there is no unsaturated zone beneath the lake.
For the bores near Lake Tutchewop, the maximum impact of lake loading on groundwater level can be assessed by comparing the measured groundwater level when the lake was full to the calculated groundwater level from the double-input models (using only rainfall and evapotranspiration as inputs; Table 2). Bores were chosen outside areas where other potential factors like irrigation channels could be affecting groundwater levels. The maximum operating level of Lake Tutchewop is 70.1 mAHD [13], but no groundwater monitoring records are available for times when the lake was at this level. Instead, a lake level of 70.0 mAHD, measured on 4 November 1999, was used to calculate the impact of lake loading on groundwater level, because groundwater levels were recorded on 27 October 1999 and 5 November 1999 (different bores were monitored on different days). The calculations show that bores close to the lake in both the Shepparton Formation and Loxton Sand have measured groundwater levels up to 0.3 m higher than the level predicted from the double-input models (Table 2), so this represents the maximum impact that the lake has on groundwater levels. The lake volume at 70.0 mAHD is 11,297 ML [40], so this corresponds to a rise of 0.13 m per 5000 ML (Table 2). These impacts decrease with increasing distance from the lake to only 0.05 m at a distance of 210 m, and are difficult to quantify at greater distances, due to measurement precision and model uncertainties, even though the modelling shows that the impact of lake loading extends ~5 km from the lake.
Table 2.
Difference between predicted groundwater level from the double-input IRF model and measured groundwater level for selected bores (see Figure 7a,b for locations).
Deeper bores screened in the Loxton Sand show similar or slightly greater impacts of lake loading than shallow bores in the Shepparton Formation, demonstrating that the response of groundwater levels to the application of a surface load from Lake Tutchewop is affected more by degree of confinement and aquifer lithology than depth. Overall model performance was better for the Loxton Sand (Table 3), because the lake loading is transferred more efficiently to the confined Loxton Sand than the unconfined Shepparton Formation. In unconfined aquifers like the Shepparton Formation, the lake loading pressure response generates changes in storage as the water table fluctuates, whereas in confined aquifers like the Loxton Sand, it causes changes in fluid pressure [5].
Table 3.
The IRF model results of all bores divided into lithology at the bore screen.
Dividing the lithologies of the screened interval of the groundwater bores into clay-dominated (clay, silt, silty clay and sandy clay) and sand-dominated (silty sand, sand) (Table 3) showed that the triple-input models performed much better than the double-input models for clay-dominated lithologies in both the Shepparton Formation and the Loxton Sand. This is probably due to the greater compressibility of the clay beds, which, because they are only shallowly buried, retain moderate permeability, allowing rapid lateral pressure transmission (low permeability impedes pressure wave propagation). For the sandy parts of these units, the R2 values for double- and triple-input models are not significantly different, indicating that the impact of lake loading is much lower for sandy units, which have substantially lower compressibility [3].
Groundwater levels respond rapidly to an applied load, so for loading due to a surface water body, the fluctuations of surface water level modify the adjacent hydraulic heads on a similar timescale [6]. In the case of Lake Tutchewop, the lake levels rise and fall slowly (Figure 5), so that the monthly time step in the available bore hydrograph data was successful in modelling the influence of the lake on the groundwater levels. Other influences, like barometric pressure loading and earth tides (resulting from gravitational and centripetal forces) will constantly change groundwater and lake levels [1,2,41], but the effects are too short-term (hourly–daily) and too small-scale (generally cm fluctuations) to influence the current dataset.
This study has shown that groundwater mounding commonly occurring around lakes may be caused both by a pressure response (lake pressure loading) and physical infiltration of water from the lake. The relative impact and lateral extent of these two factors can vary. At Lake Tutchewop, the effect of lake loading extends much further than lake water infiltration, but at the Noora salt disposal basin, located ~300 km northwest of Lake Tutchewop, salt disposal water migrated about 500 m, and the corresponding mound caused groundwater levels to increase up to 10 km from the basin [10], far beyond the influence of surface water loading. The Noora disposal basin is directly underlain by the high-permeability Loxton Sand; the basin contains little or no open water due to relatively fast infiltration, and rapid groundwater migration is responsible for the extent of raised groundwater levels. In contrast, at Lake Tutchewop, slower infiltration through the mostly clay-rich Shepparton Formation maintains a substantial lake, and groundwater movement is also relatively slow.
The relative impacts of pressure loading and physical infiltration around lakes are important for determining surface water–groundwater fluxes; neglecting the pressure effect will lead to an overestimation of surface water infiltration. This can have significant ramifications for assessing management strategies for a lake, as shown clearly at Lake Tutchewop. Here it was thought that the synchronous response of bore hydrographs to changes in lake level indicated substantial leakage of saline water from the lake, causing salinization issues on nearby farms [33], and at the same time threatening the commercial viability of salt harvesting from the lake by removing a significant part of the saline resource [13]. However, the present study has demonstrated that pressure loading is the dominant cause of the synchronicity of groundwater and lake levels, and groundwater chemical and isotopic data [14] showed that leakage from the lake is limited (~165 m from the lake shore, apart from 700 m along a restricted palaeochannel). Therefore, Lake Tutchewop can form the basis of a viable salt harvesting operation because little of the saline water flowing into the lake is lost to infiltration. Furthermore, beyond 200 m from the lake, rises in the water table due to lake loading are only small, and there is very little leakage of lake water, so there will be little, if any, negative impact on the immediately surrounding farms. This is particularly important because most of Australia’s irrigated agriculture is situated in the Murray–Darling Basin, so salt disposal basins need to be managed in a way that does not affect surrounding land uses.
The present study shows that IRF modelling of bore hydrographs is a relatively quick, straightforward way to determine the impact of lake loading on groundwater levels, provided that appropriate data are available, in particular if fluctuations in lake levels are not determined solely by rainfall and evaporation.
The outcomes of this study contribute to the United Nations Sustainable Development Goals 6 (Clean Water and Sanitation), 14 (Life Below Water) and 15 (Life on Land) by improving the understanding of groundwater system behaviour in response to external physical stresses. By providing a framework to distinguish pressure-driven stresses on groundwater aquifers from recharge processes, the approach supports more accurate groundwater resource assessments, modelling and sustainable management.
5. Conclusions
Lake Tutchewop is a salt disposal basin within the Murray–Darling Basin; it receives diverted saline water, and lake level fluctuations are largely independent of rainfall (because the lake lacks surface inflow, apart from the saline drainage). Groundwater hydrographs from bores around the lake show fluctuations synchronous with lake levels. To differentiate the relative influence on groundwater responses of lake levels and climate variables (rainfall and evapotranspiration), IRF modelling was applied to 41 bores up to 5.7 km from the centre of the lake, in both the fluvial Shepparton Formation aquifer (clay with sandy palaeochannel lenses) and the underlying shallow marine Loxton Sand (relatively uniform sand). Modelling of the bore hydrographs was carried out using two inputs (rainfall and evapotranspiration) and three inputs (rainfall, evapotranspiration and lake levels). This application of IRF modelling demonstrates its usefulness for assessing surface loading effects on groundwater systems.
The triple-input models outperformed the double-input models for bores in the Shepparton Formation and the Loxton Sand up to ~5 km from the centre of Lake Tutchewop, and up to depths of ~75 m in the Loxton Sand, in that the modelled and observed bore hydrographs for the triple-input models matched more closely. This indicates that pressure loading from the water in Lake Tutchewop is influencing the groundwater levels this distance from and depth below the lake. The impact of lake loading on groundwater levels is given by the difference between measured groundwater levels and those predicted from the double-input models; this varies from 0.3 m close to the lake to only 0.05 m at a distance of 210 m. The modelling demonstrates that the impact of lake loading extends much further, but the effects are too small to quantify with the data available.
Overall model performance was superior for the Loxton Sand bores compared to Shepparton Formation bores, reflecting the more efficient transfer of lake loading to confined rather than unconfined aquifers, the greater homogeneity of the Loxton Sand, and the damping out with depth of the effects of irrigation water inputs that affect some bores in the shallower Shepparton Formation. Model performance was superior for clay-dominated lithologies in both the Shepparton Formation and the Loxton Sand, probably due to the greater compressibility of clay.
Compared to the impact of lake loading on groundwater levels, the physical leakage of salt disposal water from the lake, identified using chemical and isotopic data, is much more restricted: <165 m from the lake shore except within a palaeochannel (700 m laterally and 11.5 metres deep). The determination of the relative lateral extent of pressure loading and physical infiltration of water around Lake Tutchewop can be used to assess the viability of the lake as a salt disposal basin. Beyond 200 m from the lake, rises in the water table due to lake loading are only small, and there is also very little leakage of lake water within this distance, so there is unlikely to be a negative impact on nearby farms. The limited loss of saline input water to physical leakage means that salt harvesting from the lake is likely to be commercially feasible.
6. Recommendations
Based on the findings of this study, the following recommendations are made:
- Groundwater assessments in the vicinity of large water bodies should consider pressure loading effects.
- Future studies should investigate pressure loading effects around large water bodies to further explore the phenomenon and determine its importance in hydrogeological conceptualization.
- Impulse response function modelling should be considered as a screening tool for groundwater systems suspected to be affected by surface water loading.
Author Contributions
Conceptualization, T.R. and J.W.; investigation, data processing, analysis, and data curation, T.R.; writing—original draft preparation, T.R.; writing—review and editing, T.R. and J.W. All authors have read and agreed to the published version of the manuscript.
Funding
This research received no external funding.
Data Availability Statement
The original contributions presented in this study are included in the article. Further inquiries can be directed to the corresponding author.
Acknowledgments
We thank Goulburn–Murray Water and the Murray–Darling Basin Authority for providing access to the groundwater bores and previously collected data, and Aquaterra Pty Ltd. for providing data collected from their field investigations at Lake Tutchewop. Also, thanks to Yohannes Yihdego, Jos Von Asmuth and the other developers of Menyanthes for support setting up the program and models.
Conflicts of Interest
Author Timothy Robson owns the company Creekside Environmental Pty Ltd. The remaining authors declare that the research was conducted in the absence of any commercial or financial relationships that could be construed as a potential conflict of interest.
Abbreviations
The following abbreviations are used in this manuscript:
| AHD | Australian Height Datum |
| ARMA | Autoregressive Moving Average |
| IRF | Impulse Response Function |
| mbgl | Metres below ground level |
| PIRFICT | Predefined Impulse Response Function in Continuous Time |
| RMSE | Root mean squared error |
| RMSI | Root mean squared innovation |
| SILO | Scientific Information for Land Owners |
| TFN | Transfer function noise |
References
- Rasmussen, T.C.; Crawford, L.A. Identifying and removing barometric pressure effects in confined and unconfined aquifers. Groundwater 2005, 35, 502–511. [Google Scholar] [CrossRef] [Scilit]
- Toll, N.J.; Rasmussen, T.C. Removal of barometric pressure effects and earth tides from observed water levels. Groundwater 2007, 45, 101–105. [Google Scholar] [CrossRef] [Scilit] [PubMed]
- Van der Kamp, G.; Maathuis, H. Annual fluctuations of groundwater levels as a result of loading by surface moisture. J. Hydrol. 1991, 127, 137–152. [Google Scholar] [CrossRef] [Scilit]
- Jacob, C.E. Fluctuations in artesian pressure produced by passing railroad-trains as shown in a well on Long Island, New York. Eos Trans. Am. Geophys. Union 1939, 20, 666–674. [Google Scholar] [CrossRef] [Scilit]
- Serfes, M.E. Determining the mean hydraulic gradient of ground water affected by tidal fluctuations. Groundwater 1991, 29, 549–555. [Google Scholar] [CrossRef] [Scilit]
- Boutt, D.F. Poroelastic loading of an aquifer due to upstream dam releases. Groundwater 2010, 48, 580–592. [Google Scholar] [CrossRef] [Scilit] [PubMed]
- Allison, G.B.; Cook, P.G.; Barnett, S.R.; Walker, G.R.; Jolly, I.D.; Hughes, M.W. Land clearance and river salinisation in the Western Murray Basin, Australia. J. Hydrol. 1990, 119, 1–20. [Google Scholar] [CrossRef] [Scilit]
- Herczeg, A.L.; Dogramaci, S.S.; Leaney, F.W.J. Origin of dissolved salts in a large, semi-arid groundwater system: Murray Basin, Australia. Mar. Freshw. Res. J. 2001, 52, 41–52. [Google Scholar] [CrossRef] [Scilit]
- Evans, R.S. Saline water disposal options in the Murray Basin. J. Aust. Geol. Geophys. 1989, 11, 167–185. [Google Scholar]
- Chambers, L.A.; Williams, B.G.; Barnes, C.J.; Wasson, R.J. The effects of irrigation waste-water disposal in a former discharge zone of the Murray Basin, Australia. J. Hydrol. 1992, 136, 303–332. [Google Scholar] [CrossRef] [Scilit]
- Simmons, C.T.; Narayan, K.A. Modelling density-dependent flow and solute transport at the Lake Tutchewop saline disposal complex, Victoria. J. Hydrol. 1998, 206, 219–236. [Google Scholar] [CrossRef] [Scilit]
- Aquaterra Pty Ltd. Lake Tutchewop Groundwater Interaction Investigations, Volume 1: Field Investigations; Publication No. 18/12; Murray-Darling Basin Authority: Canberra, Australia, 2011.
- Aquaterra Pty Ltd. Lake Tutchewop Groundwater Interaction Investigations, Volume 2: Assessment; Publication No. 18/12; Murray-Darling Basin Authority: Canberra, Australia, 2011.
- Robson, T.C.; Webb, J.A. The use of environmental tracers to determine focused recharge from a saline disposal basin in a semiarid environment in Southeastern Australia. J. Hydrol. 2016, 538, 326–338. [Google Scholar] [CrossRef] [Scilit]
- Von Asmuth, J.R.; Bierkens, M.F.; Maas, K. Transfer function-noise modeling in continuous time using predefined impulse response functions. Water Resour. Res. 2002, 38, 1287. [Google Scholar] [CrossRef] [Scilit]
- Lin, Y.; Tseng, H.; Lee, S.; Yu, H. Analysis of groundwater time series with limited pumping information in unconfined aquifer: Response function based on lagging theory. Water Resour. Res. 2024, 60, e2023WR03674. [Google Scholar] [CrossRef] [Scilit]
- Collenteur, R.A.; Bogner, K.; Zappa, M.; Schirmer, M.; Moeck, C. An ensemble groundwater prediction (EGP) system to forecast groundwater levels in alluvial aquifers in Switzerland. EGUSphere, 2025; preprint. [CrossRef] [Scilit]
- Manzione, R.L.; Knotters, M.; Heuvelink, G.B.; Von Asmuth, J.R. Transfer function-noise modeling and spatial interpolation to evaluate the risk of extreme (shallow) water-table levels in the Brazilian Cerrados. Hydrogeol. J. 2010, 18, 1927–1937. [Google Scholar] [CrossRef] [Scilit]
- Manzione, R.L.; Wendland, E.; Tanikawa, D.H. Stochastic simulation of time-series models combined with geostatistics to predict water-table scenarios in a Guarani Aquifer System outcrop area, Brazil. Hydrogeol. J. 2012, 20, 1239–1249. [Google Scholar] [CrossRef] [Scilit]
- Yihdego, Y.; Webb, J.A. Modeling of bore hydrographs to determine the impact of climate and land-use change in a temperate subhumid region of southeastern Australia. Hydrogeol. J. 2011, 19, 877–887. [Google Scholar] [CrossRef] [Scilit]
- Jemeljanova, M.; Collenteur, R.A.; Kmoch, A.; Bikše, J.; Popovs, K.; Kalvāns, A. Modeling hydraulic heads with impulse response functions in different environmental settings of the Baltic countries. J. Hydrol. Reg. Stud. 2023, 47, 101416. [Google Scholar] [CrossRef] [Scilit]
- Hocking, M.; Kelly, B.F.J. Groundwater recharge and time lag measurements through Vertisols using impulse response functions. J. Hydrol. 2016, 535, 22–35. [Google Scholar] [CrossRef] [Scilit]
- Collenteur, R.A.; Bakker, M.; Klammler, G. Estimation of groundwater recharge from groundwater levels using nonlinear transfer function noise models and comparison to lysimeter data. Hydrol. Earth Syst. Sci. 2021, 25, 2931–2949. [Google Scholar] [CrossRef] [Scilit]
- Lu, M.; Rogiers, B.; Beerten, K.; Gedeon, M.; Huysmans, M. Exploring river–aquifer interactions and hydrological system response using baseflow separation, impulse response modeling, and time series analysis in three temperate lowland catchments. Hydrol. Earth Syst. Sci. 2022, 26, 3629–3649. [Google Scholar] [CrossRef] [Scilit]
- Von Asmuth, J.R.; Maas, K.; Bakker, M.; Petersen, J. Modeling time series of ground water head fluctuations subjected to multiple stresses. Groundwater 2008, 46, 30–40. [Google Scholar] [CrossRef] [Scilit] [PubMed]
- Macumber, P.G. Interactions Between Groundwater and Surface Systems in Northern Victoria; Department of Conservation and Environment: East Melbourne, Australia, 1991.
- Selle, B.; Thayalakumaran, T.; Morris, M. Understanding salt mobilization from an irrigated catchment in south-eastern Australia. Hydrol. Process 2010, 24, 3307–3321. [Google Scholar] [CrossRef] [Scilit]
- Robson, T.C.; Webb, J.A. Late Neogene tectonics in northwestern Victoria: Evidence from the Late Miocene–Pliocene Loxton Sand. Aust. J. Earth Sci. 2011, 58, 579–586. [Google Scholar] [CrossRef] [Scilit]
- Australian Geological Survey Organisation. The Lake Tutchewop, Lake William and Lake Kelly Saline Water Disposal Basins, Murray Basin, Australia: Lithostratigraphy, Hydrodynamics, and Hydrochemistry; Department of Primary Industries and Energy: Canberra, Australia, 1997.
- O’Rourke, M.E. Murray Basin Hydrogeological Map Series; Sheet SI 54-16, Swan Hill, Victoria and New South Wales; Bureau of Mineral Resources, Geology and Geophysics: Canberra, Australia, 1992.
- Tickell, S.; Humphries, W. Groundwater Resources and Associated Salinity Problems of the Victorian Riverine Plains; Report 84; Department of Industry, Technology and Resources: Melbourne, Australia; Geological Survey of Victoria: Melbourne, Australia, 1992.
- Hoxley, G.; Ife, D.; Pratt, M. Kerang Lakes Area Hydrogeological Assessment. Rural Water Corporation Technical Services. 1989; unpublished report.
- Macumber, P.G. The Hydrogeology of Lake Tutchewop. 2007; unpublished report. [CrossRef] [Scilit]
- Post, V.; Kooi, H.; Simmons, C. Using hydraulic head measurements in variable-density ground water flow analyses. Groundwater 2007, 45, 664–671. [Google Scholar] [CrossRef] [Scilit] [PubMed]
- Box, G.E.; Jenkins, G.M. Time Series Analysis: Forecasting and Control; Holden-Day, Ed.; Holden-Day: San Francisco, CA, USA, 1970. [Google Scholar]
- Victorian Water Measurement Information System Website. Available online: https://data.water.vic.gov.au/ (accessed on 10 March 2010).
- Allen, R.G.; Pereira, L.S.; Raes, D.; Smith, M. Crop Evapotranspiration–Guidelines for Computing Water Requirements; Irrigation and drainage paper 56; Food and Agricultural Organisation of the United Nations: Rome, Italy, 1998. [Google Scholar]
- Scientific Information for Land Owners (SILO) Website. Available online: www.longpaddock.qld.gov.au/silo/ (accessed on 2 May 2011).
- Wang, H.F. Groundwater Storage in Confined Aquifers; The Groundwater Project: Waterloo, ON, Canada, 2020. [Google Scholar] [CrossRef] [Scilit]
- Goulburn Murray Water. Lake Tutchewop Capacity Survey, Capacity Table (Megalitres)–June 2011, Survey No. 5358. 2011; unpublished data. [PubMed]
- Maliva, R.G.; Coulibaly, K.; Guo, W.; Missimer, T.M. Confined aquifer loading: Implications for groundwater management. Groundwater 2011, 49, 302–304. [Google Scholar] [CrossRef] [Scilit] [PubMed]

Disclaimer/Publisher’s Note: The statements, opinions and data contained in all publications are solely those of the individual author(s) and contributor(s) and not of MDPI and/or the editor(s). MDPI and/or the editor(s) disclaim responsibility for any injury to people or property resulting from any ideas, methods, instructions or products referred to in the content. |
© 2026 by the authors. Licensee MDPI, Basel, Switzerland. This article is an open access article distributed under the terms and conditions of the Creative Commons Attribution (CC BY) license.