2.1. Study Site and System Configuration
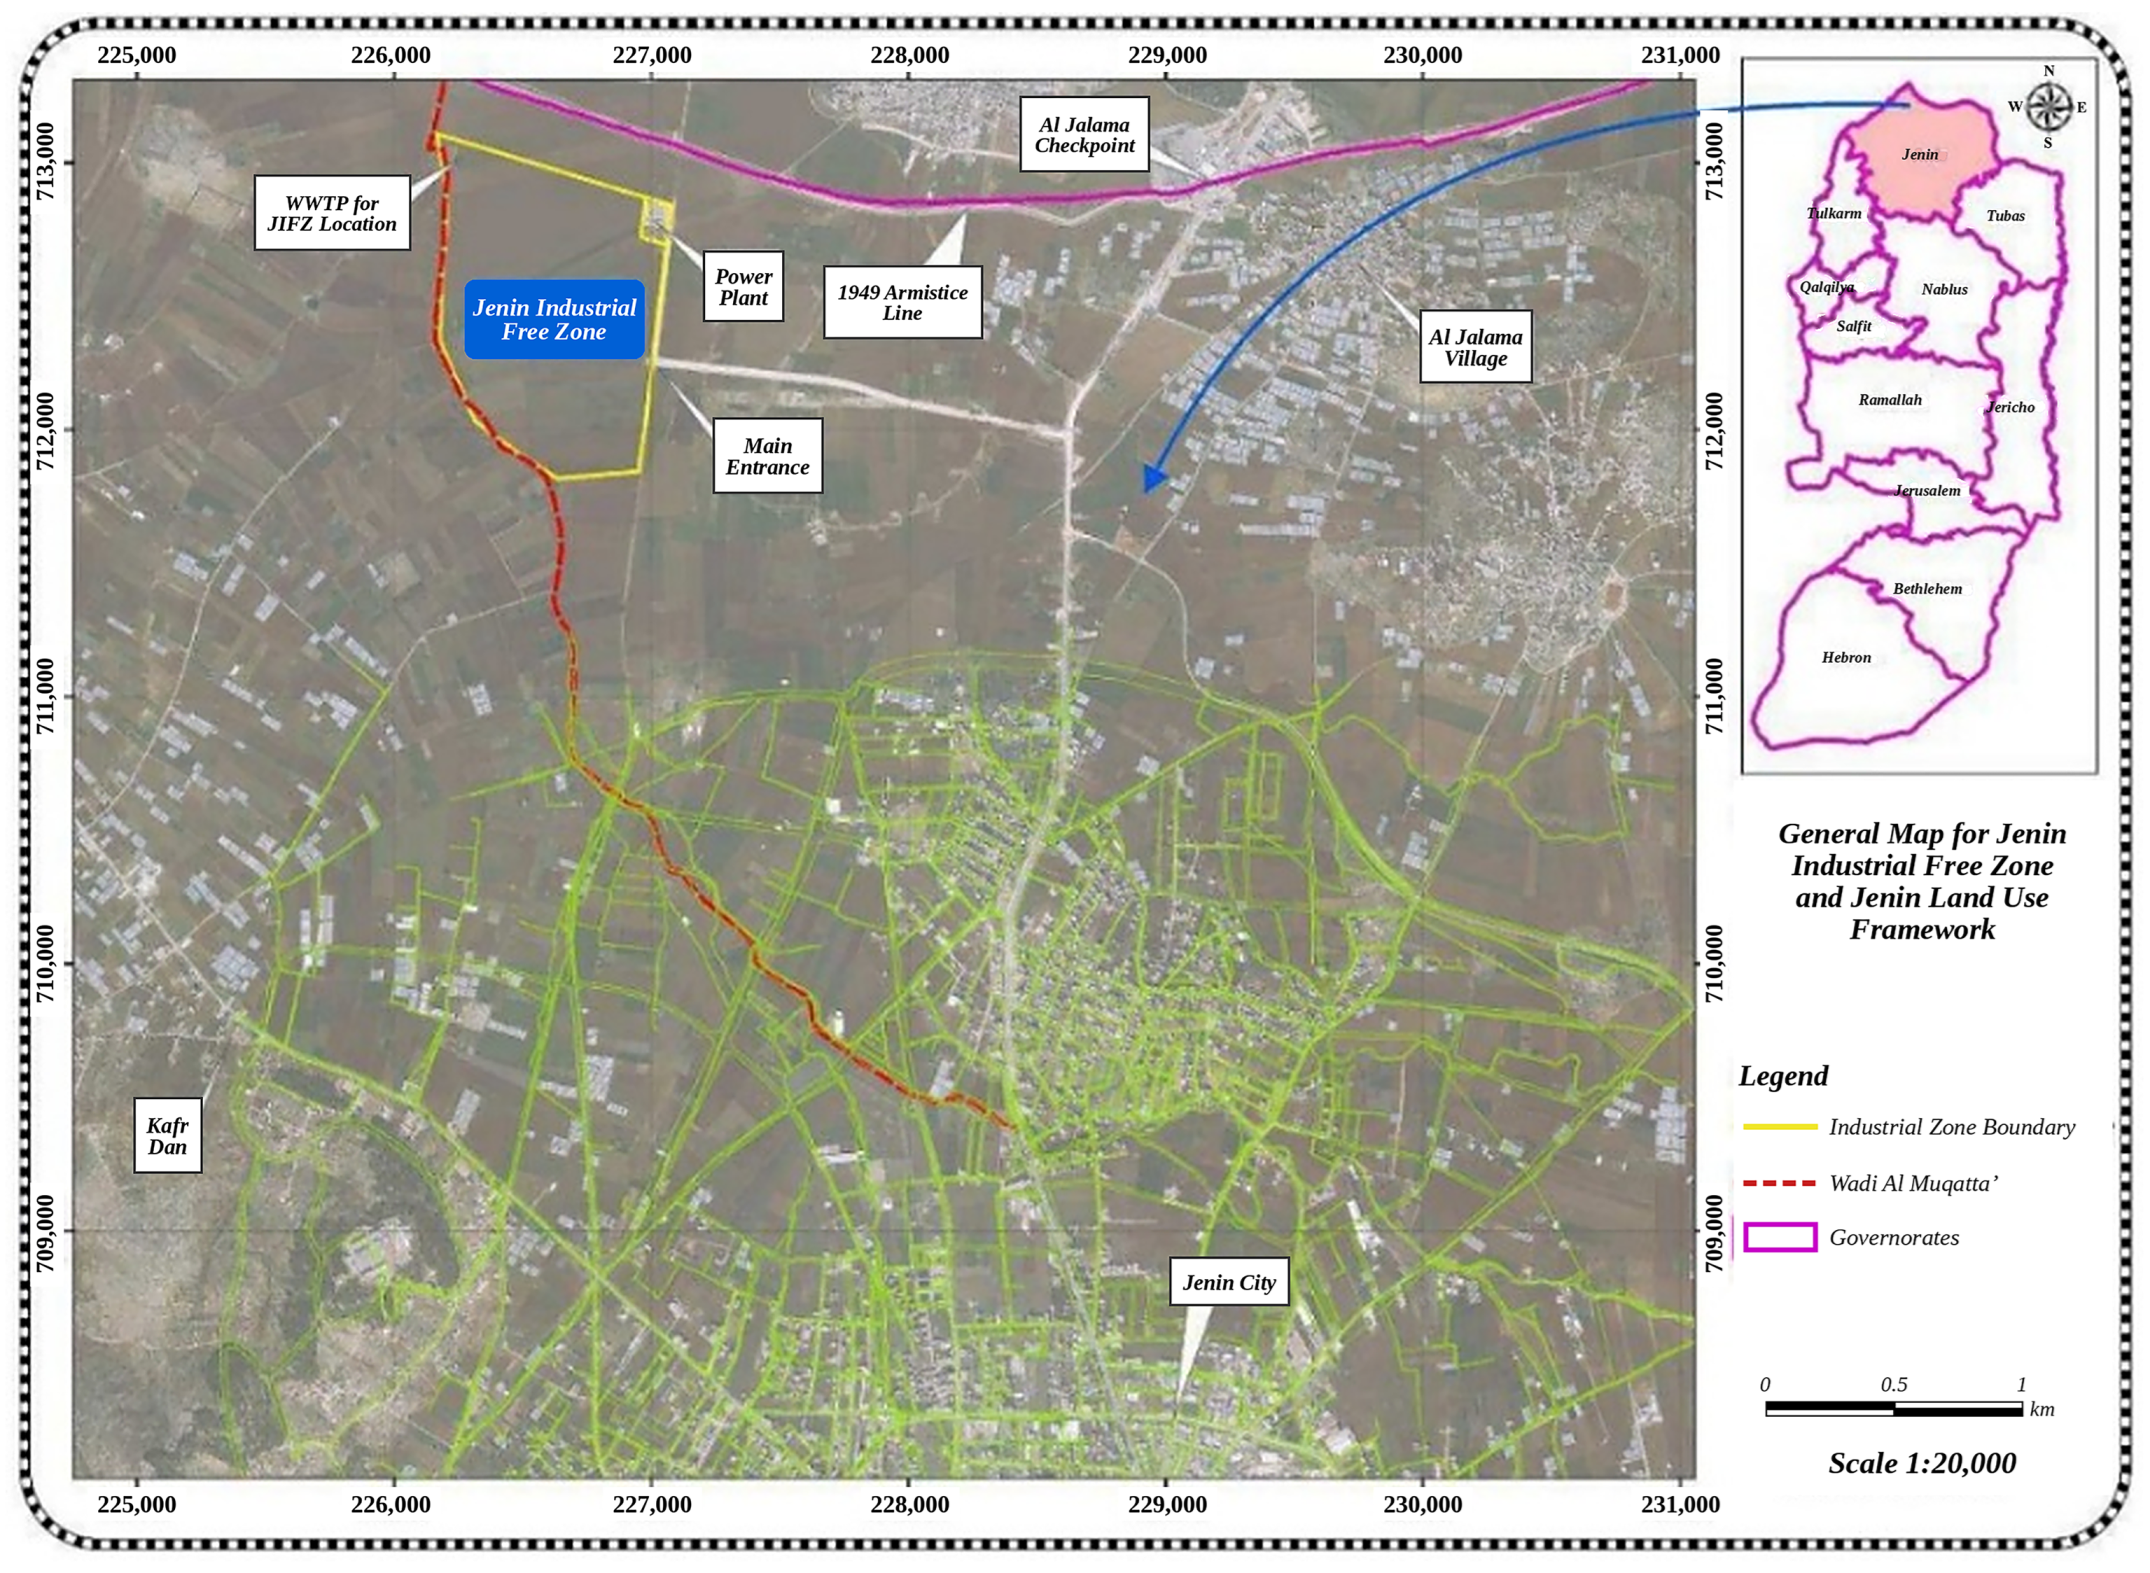
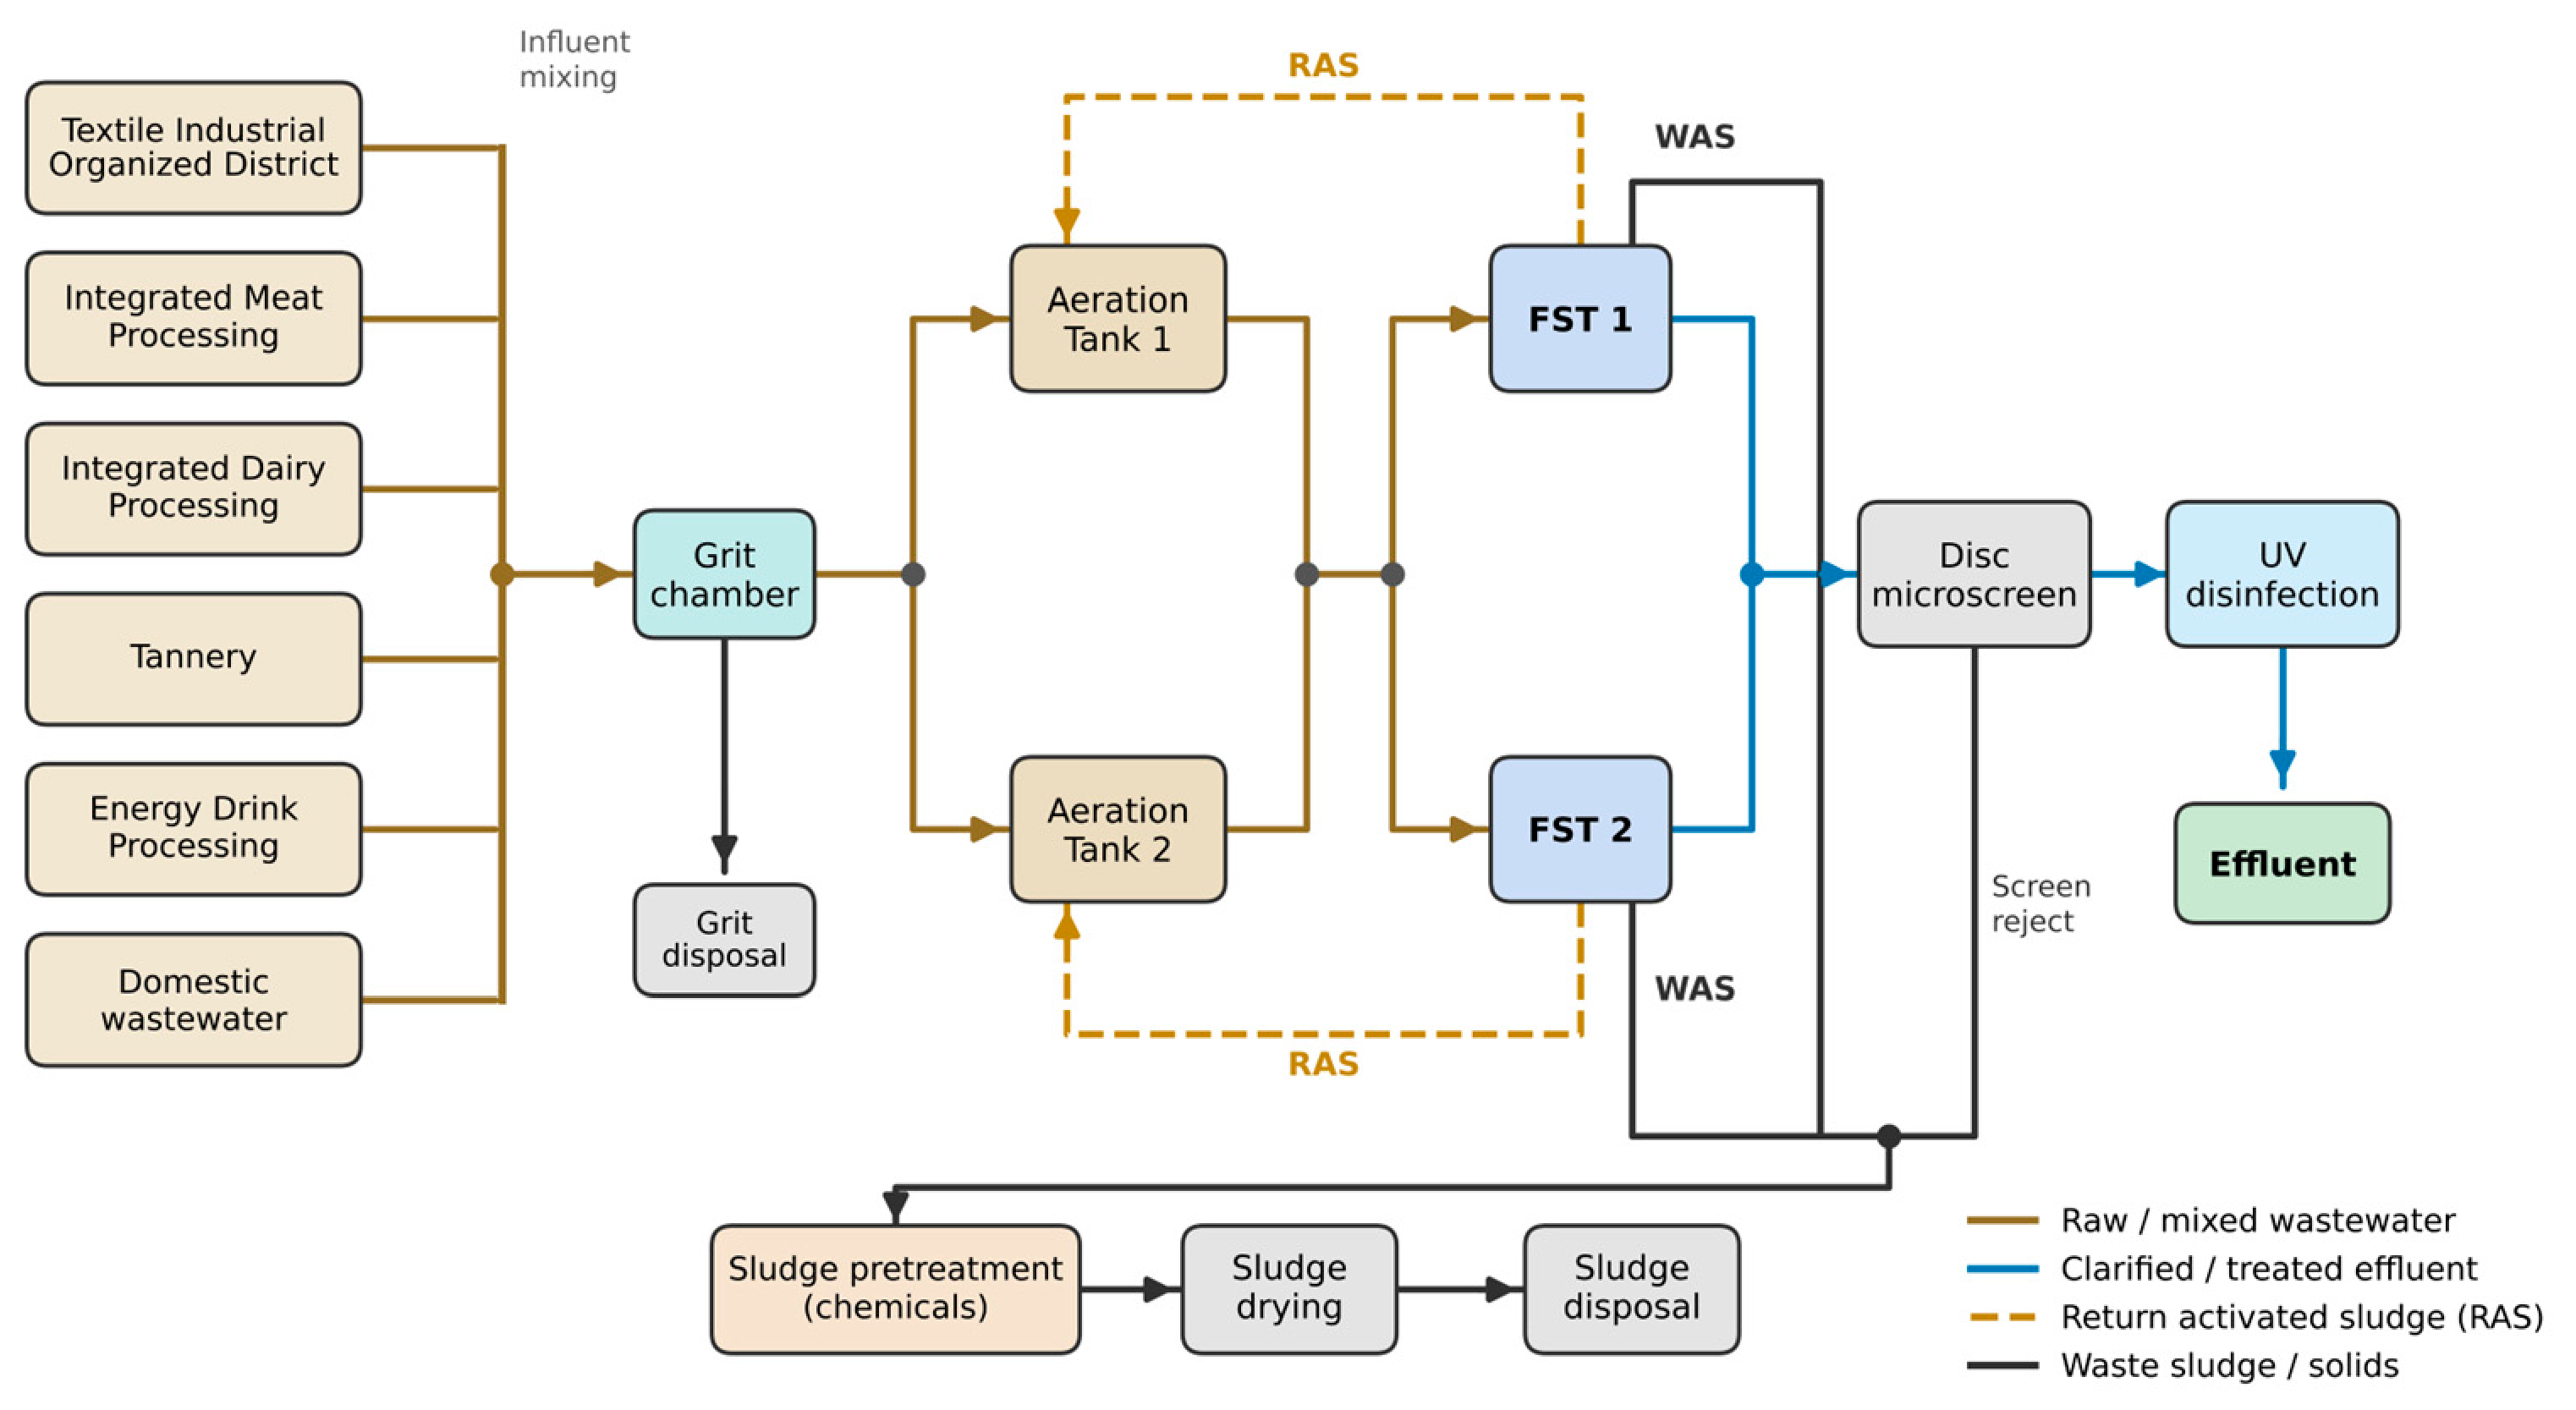
The JIFZ-WWTP is located in the northeastern section of the Jenin Industrial Free Zone, Jenin Governorate, northern West Bank (approximately 32°27′ N, 35°17′ E; elevation +490 m AMSL). The plant employs extended-aeration activated-sludge technology and was designed for flows ranging from 1000 to 2000 m3/day at Stage 1 and Stage 2 of the zone’s phased development. The treatment train comprises an inlet works, two parallel aeration tanks (AT1 and AT2, each 1209 m3), two final sedimentation tanks (FST1 and FST2, each 168.7 m3), return-activated-sludge (RAS) and waste-activated-sludge (WAS) systems, and sludge-handling infrastructure. The process hydraulic retention time (HRT) is 29.07 h per aeration tank, and the design sludge retention time (SRT) is 20 days.
Design influent characteristics at Stage 1 include a BOD5 of 520 mg/L, COD of approximately 1040 mg/L, TSS of 520 mg/L, and TKN of 64 mg/L. Effluent quality targets for reuse in agricultural irrigation (Class C, Palestinian specifications) require a BOD5 ≤ 40 mg/L, COD ≤ 100 mg/L, TSS ≤ 50 mg/L, and TN ≤ 45 mg/L, along with nematode egg limits of ≤1 egg/L at Stage 2. Where a more stringent nitrogen figure (e.g., 10 mg/L TN) is referenced elsewhere in this manuscript for contextual comparison with other regulatory frameworks, this is explicitly noted as a non-operative benchmark; the Class C figure of ≤45 mg/L TN is the compliance criterion applied throughout this study. The Class C ammonia–nitrogen limit is a separate, more stringent criterion (NH4-N ≤ 10 mg/L) and should not be conflated with the total-nitrogen limit (TN ≤ 45 mg/L); nitrite–N is reported without a limit because neither Palestinian standard sets one.
2.3. Model Calibration
Because the JIFZ-WWTP was not yet fully operational at the time of this study, model calibration was performed using data from the Jericho Wastewater Treatment Plant (Jericho WWTP), which employs the same extended-aeration activated-sludge technology under comparable Palestinian operating conditions. Calibration data comprised 728 laboratory measurements conducted in November 2024, encompassing influent and effluent concentrations for COD, BOD5, TSS, TN, NH4-N, and PO4-P across a full operational month.
The calibration strategy followed a sequential, parameter-by-parameter approach aligned with the IWA Good Modelling Practice (GMP) guidelines [
23], structured in five explicit steps: (1) influent characterization and fractionation—total COD was partitioned into its soluble inert, particulate inert, readily biodegradable, and slowly biodegradable fractions using the respirometry and stoichiometric relationships embedded in the MANTIS2 framework; (2) mixed liquor suspended solids (MLSSs) matching—achieved by adjusting the volatile fraction of the influent TSS (VSS/TSS ratio, calibrated from 0.75 to 0.61) and the particulate inert COD fraction (reduced from 0.13 to 0.055); (3) dissolved oxygen (DO) concentration calibration—achieved by adjusting the alpha factor for fine-bubble aeration (set at 0.7) and accounting for site-specific oxygen saturation at the calibrated elevation and an operating temperature of 25.1 °C; (4) sludge production adjustment—verified by matching observed effluent TSS against simulated values, with the sludge volume index (SVI) calibrated at 189.5 mL/g; and (5) effluent quality verification across all monitored parameters. This structured sequence ensured that each subset of parameters was fixed before the next was adjusted, preventing compensatory errors between interdependent variables.
The use of Jericho WWTP data as a surrogate-calibration dataset warrants explicit justification and a transparent acknowledgement of the uncertainty it introduces. Both plants employ identical extended-aeration activated-sludge technology with comparable hydraulic retention times (≥24 h) and sludge retention times (≥20 days), and both operate under Palestinian Authority regulatory and operational norms. Climatically, Jericho and Jenin share a semi-arid Mediterranean profile, with similar summer temperatures (25–32 °C) and comparable seasonal rainfall patterns, though Jericho’s lower elevation (−258 m AMSL, below sea level, versus +490 m AMSL for JIFZ) produces slightly different oxygen saturation values, a difference corrected for in the model. The primary source of uncertainty introduced by surrogate calibration lies in influent composition: Jericho WWTP receives predominantly domestic sewage, whereas the JIFZ-WWTP is designed to receive industrial-equivalent effluents from agro-food and light manufacturing operations. To account for this, the readily biodegradable COD fraction was adjusted upward from the Jericho-calibrated value of 0.2 to 0.7, and TKN and total phosphorus concentrations were re-estimated from PIEFZA technical documentation rather than from Jericho influent measurements.
A structured comparison of the two facilities is summarized in
Table 1.
While this transfer approach introduces parametric uncertainty—particularly in kinetic constants governing nitrification and denitrification—it represents the most defensible option available prior to plant commissioning. To make this uncertainty explicit rather than implicit, an approximate error envelope is estimated below.
Approximate propagated uncertainty: because effluent COD, cBOD5 and TN are most sensitive to the readily biodegradable COD fraction and to TKN/TP inputs—the two parameter groups re-estimated from PIEFZA documentation rather than transferred directly from Jericho—the Monte Carlo ranges applied to these inputs (
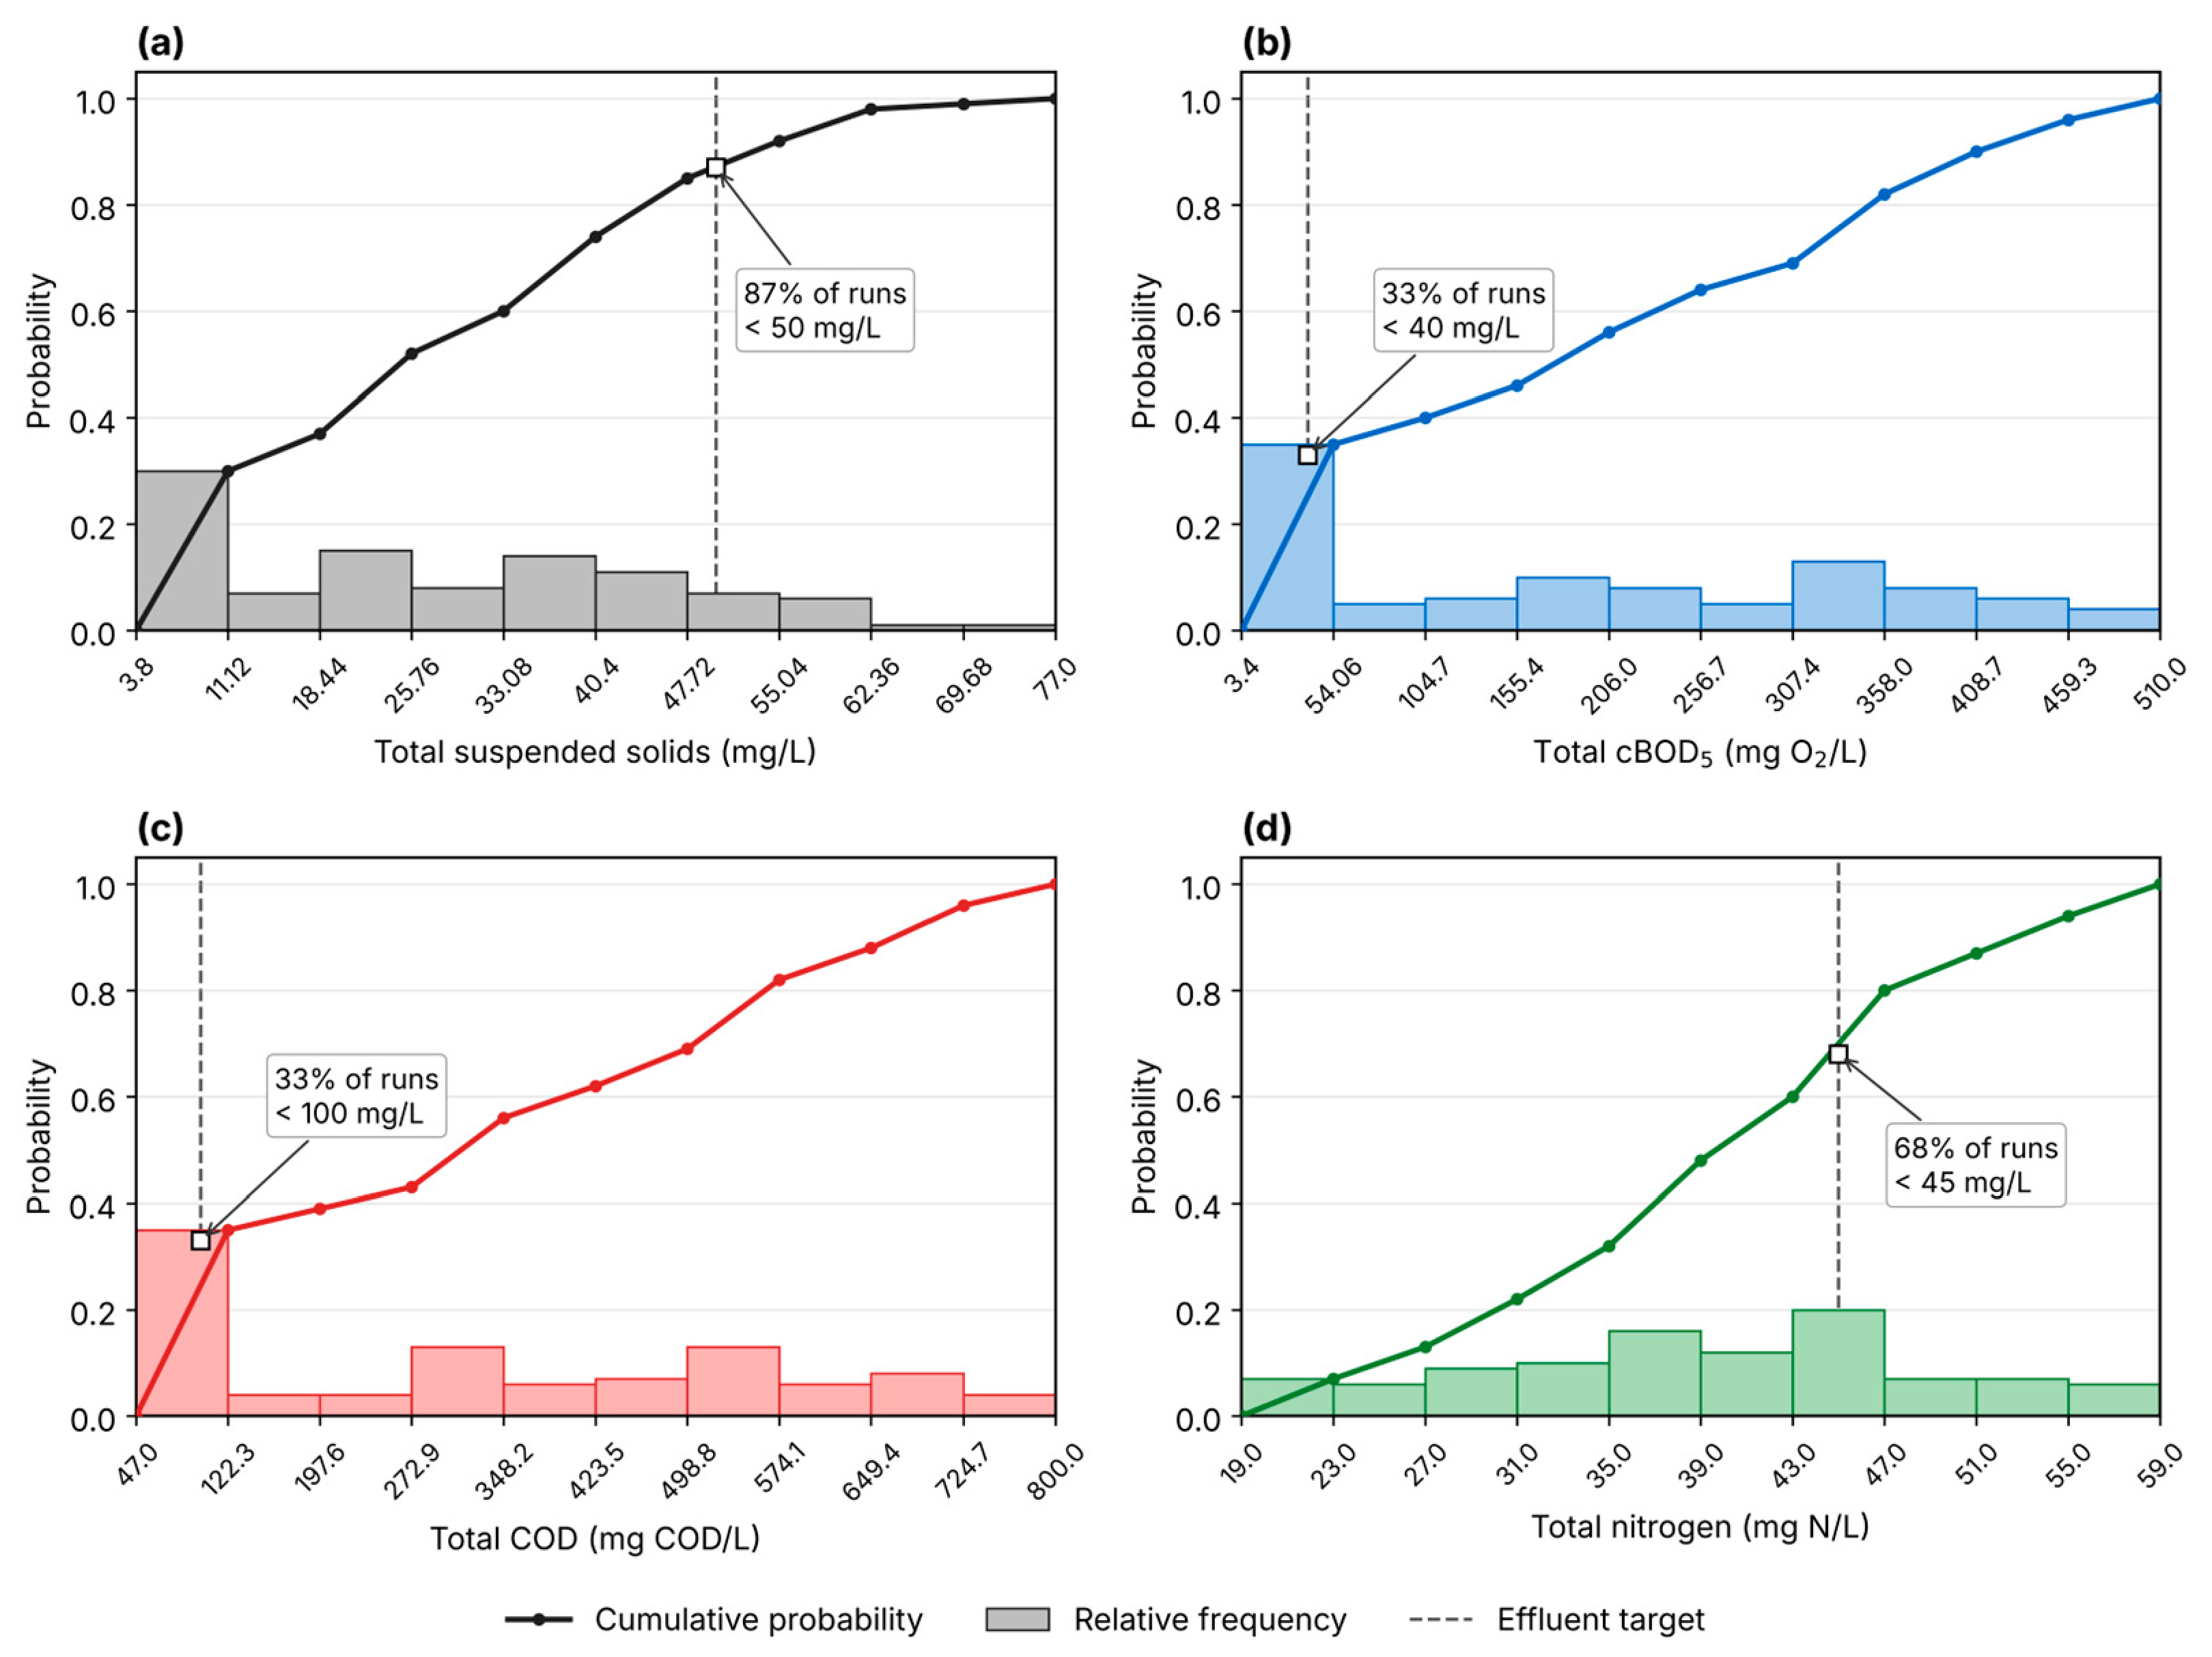
Section 2.4) are treated in this study as a first-order proxy for surrogate-calibration uncertainty, rather than as representing measurement or sampling variability alone. Under this framing, the compliance probabilities reported in
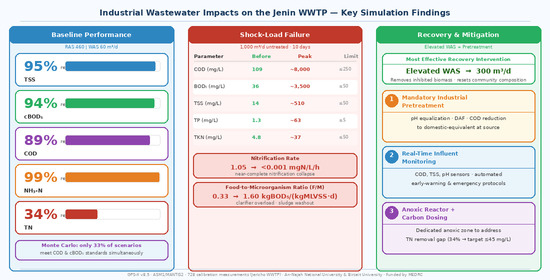
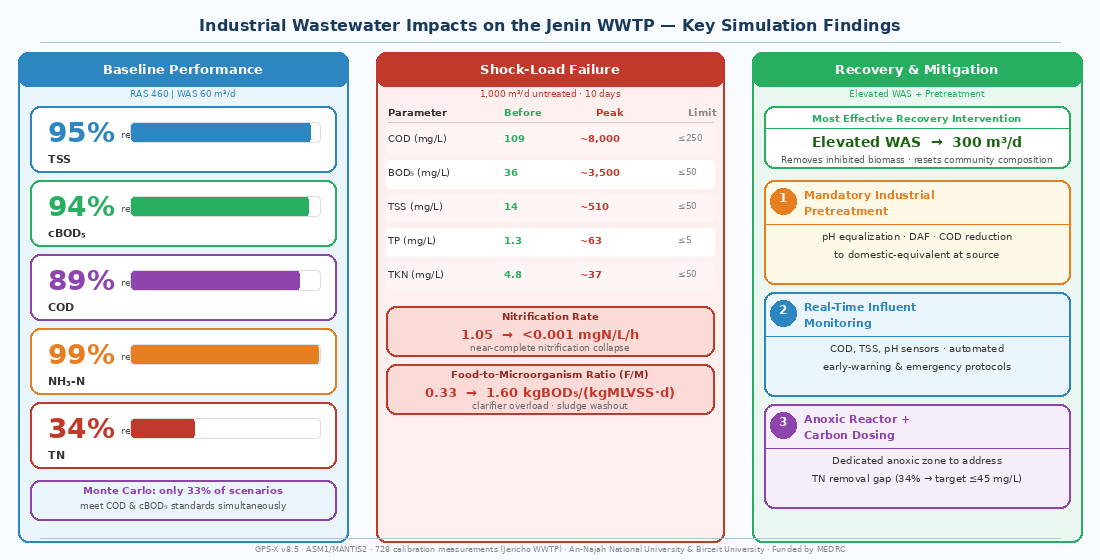
Section 3.3 (e.g., 33% joint COD/cBOD5 compliance) should be read as reflecting combined influent-variability and surrogate-transfer uncertainty, and the true confidence interval on any single point estimate (e.g., baseline COD = 109.2 mg/L) is wider than a calibration-only analysis would suggest.
Note on units: concentrations expressed in mg/L are numerically equivalent to g/m3 (i.e., 1 mg/L = 1 g/m3 for dilute aqueous solutions); gCOD/m3, gN/m3 and gP/m3 values reported for GPS-X model variables are therefore directly comparable to the corresponding mg/L concentrations reported elsewhere in the text and tables.
Key calibrated parameters included total COD (increased from 430 to 981 gCOD/m3), total TKN (adjusted from 40 to 57.4 gN/m3), total phosphorus (modified from 10.0 to 17.3 gP/m3), and the readily biodegradable fraction of total COD (increased from the Jericho-fitted value of 0.2 to an assumed 0.7 for the JIFZ industrial catchment; the latter is a design assumption, not a calibrated value), reflecting the elevated organic and nutrient strengths of Palestinian industrial wastewater. Site-specific adjustments were applied for operating temperature (25.1 °C), elevation (affecting oxygen solubility), and clarifier geometry (sloping-bottom design, sidewall depth 5.63 m, area 214.74 m2). The alpha factor for fine-bubble aeration was set at 0.7, and the sludge volume index (SVI) was calibrated at 189.5 mL/g.
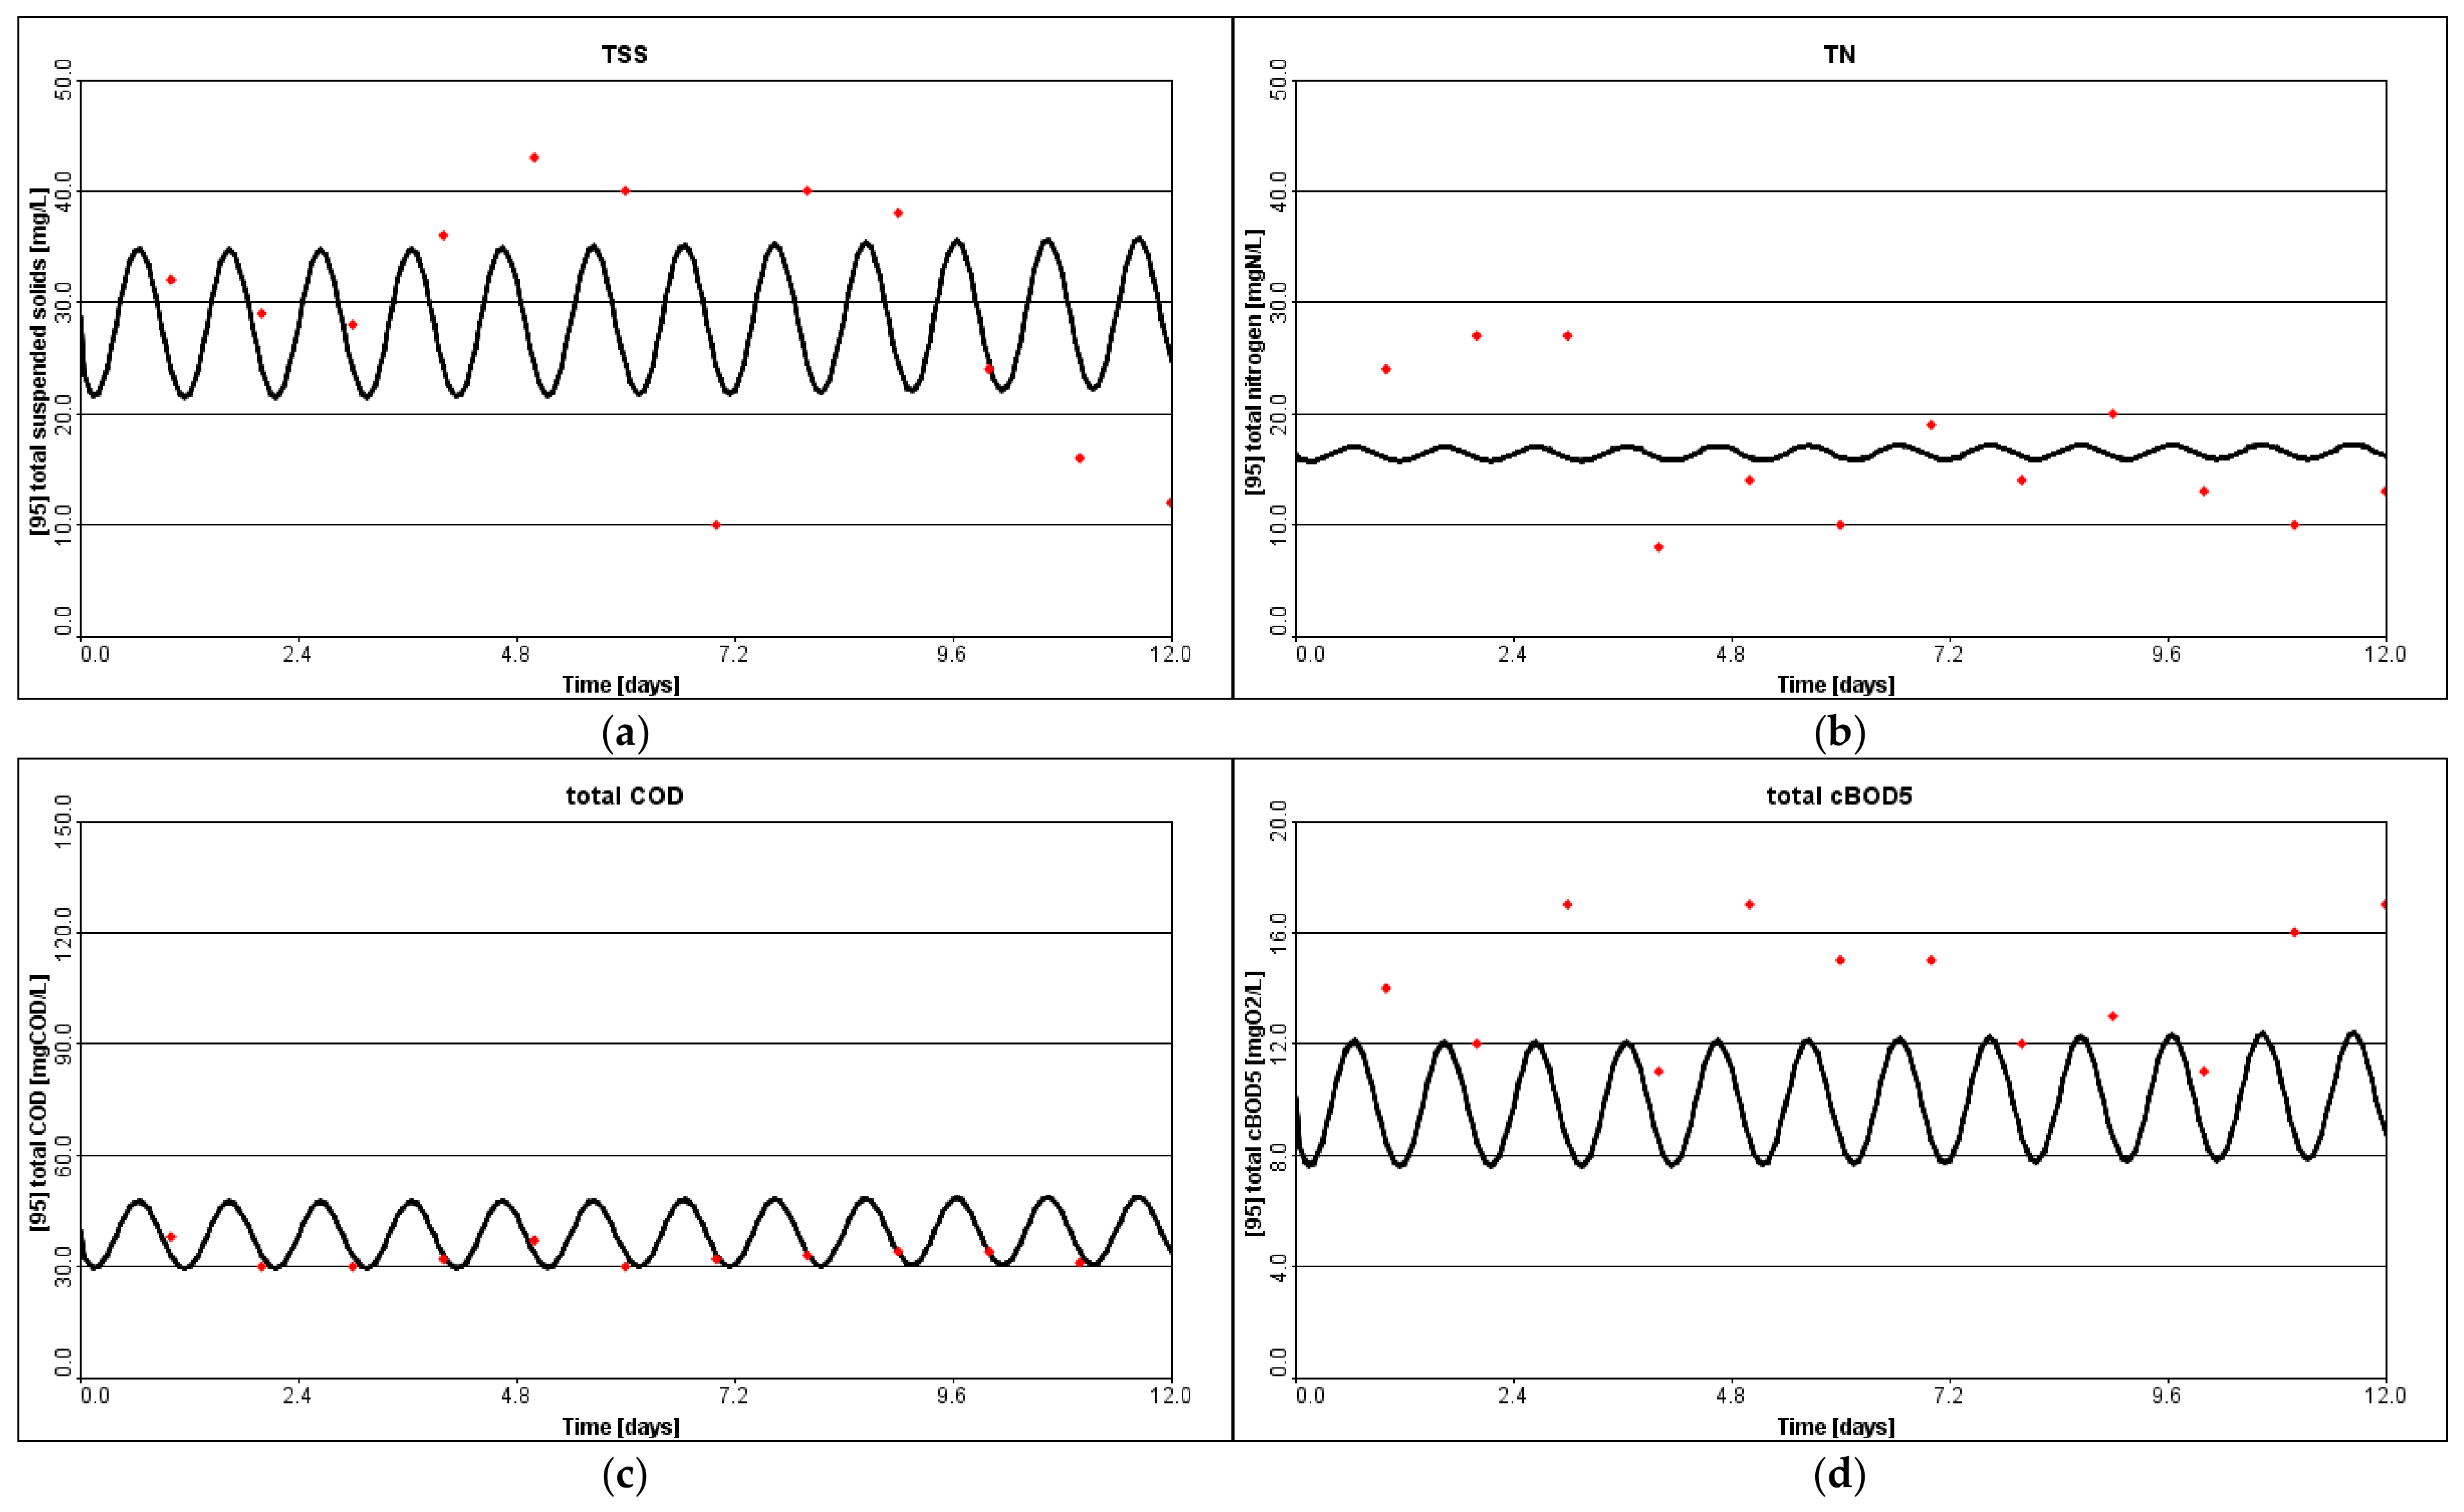
Calibration performance was assessed by comparing simulated effluent concentrations against measured values from Jericho WWTP. The calibrated model yielded an effluent TSS of 17.2 mg/L, COD of 33.6 mg/L, BOD
5 of 14.8 mg/L, and ammonia–N of 0.119 mg/L, which fall within acceptable ranges relative to observed values. The wave-like (oscillatory) pattern visible in the calibrated effluent traces (
Figure 3) reflects the diurnal dynamic influent pattern used to drive the simulation: the daily load cycle propagates to the effluent in attenuated form, damped by the hydraulic retention time and the biological buffering of the extended-aeration reactor, and it stabilizes as the model approaches steady state. The calibrated model was subsequently adapted to JIFZ-WWTP by incorporating No independent validation dataset exists: the November 2024 Jericho record was used in full for calibration, and the JIFZ-WWTP was not yet commissioned, so the adapted model has not been validated against observed plant performance (
Table 2). As
Table 3 shows, the calibrated model reproduces effluent COD within the observed monthly range but over-predicts effluent solids and under-predicts effluent ammonia; this residual bias is carried forward as a limitation rather than presented as agreement.
Table 4 summarizes the provenance of all model inputs, distinguishing values measured at Jericho WWTP, parameters fitted during calibration, MANTIS2 coefficients transferred unchanged, and design assumptions adopted for JIFZ-WWTP. The plant’s specific tank geometry, design flow rates, and influent composition were estimated from PIEFZA technical documentation.
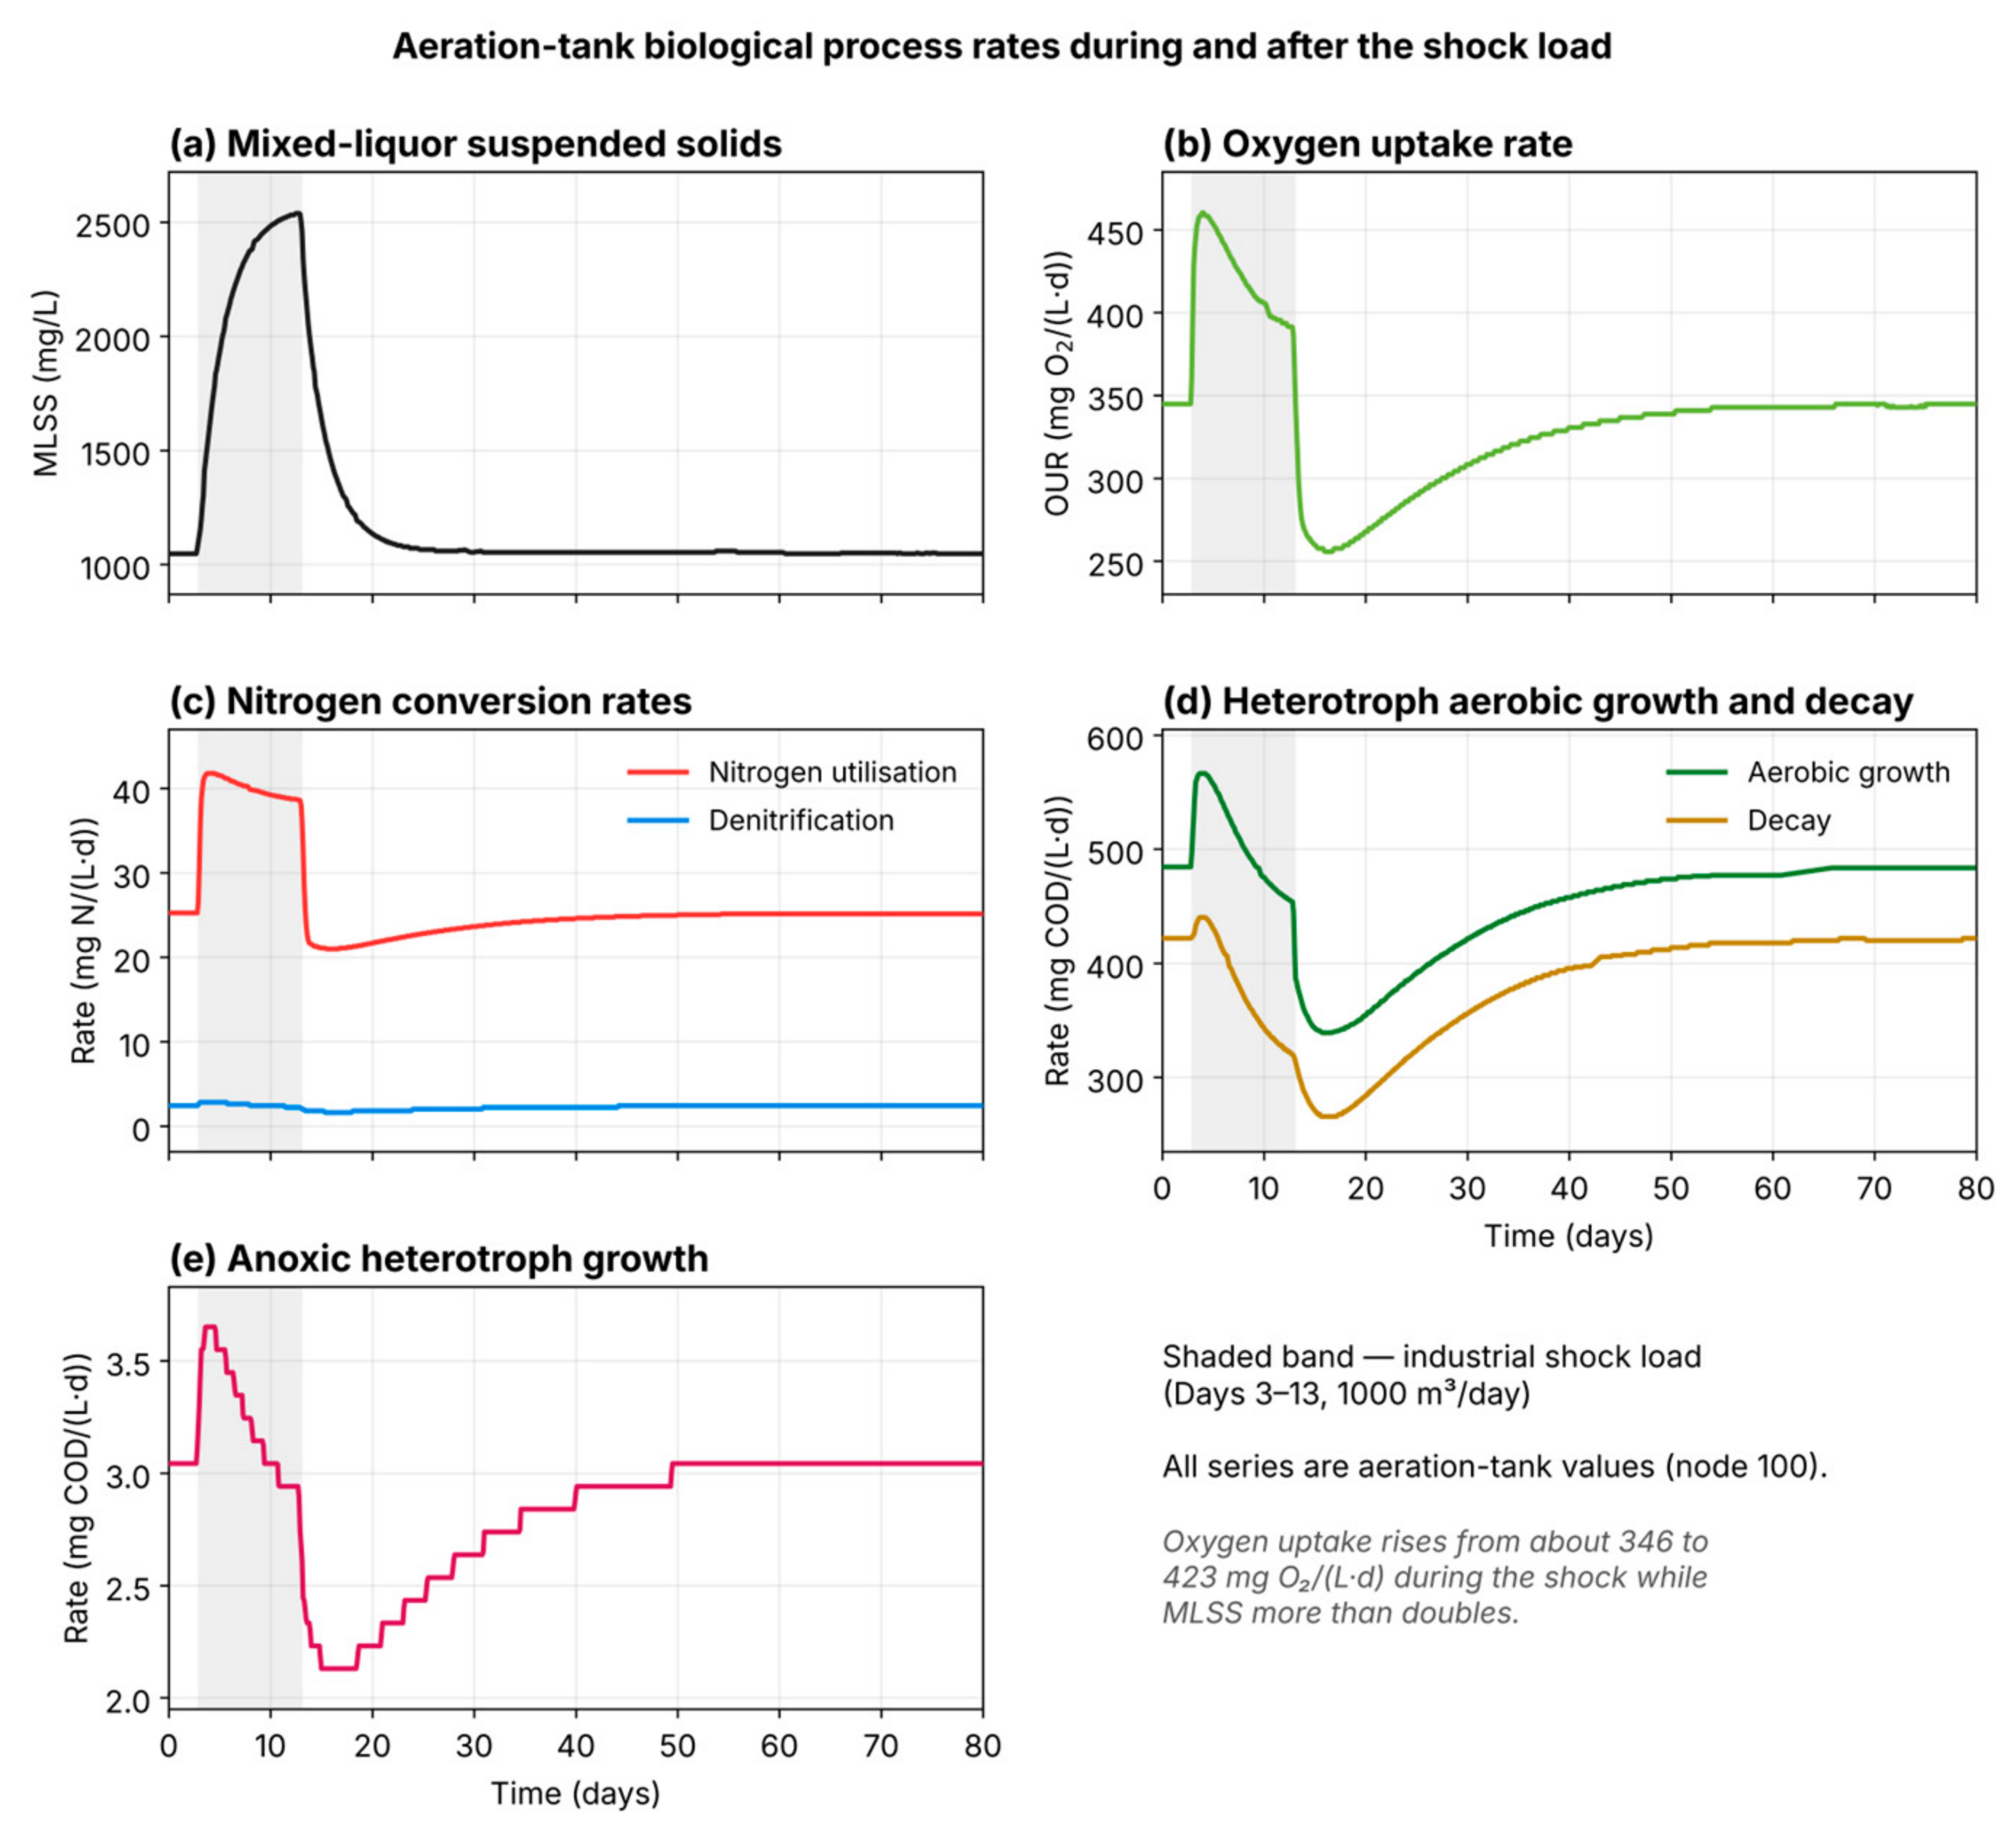
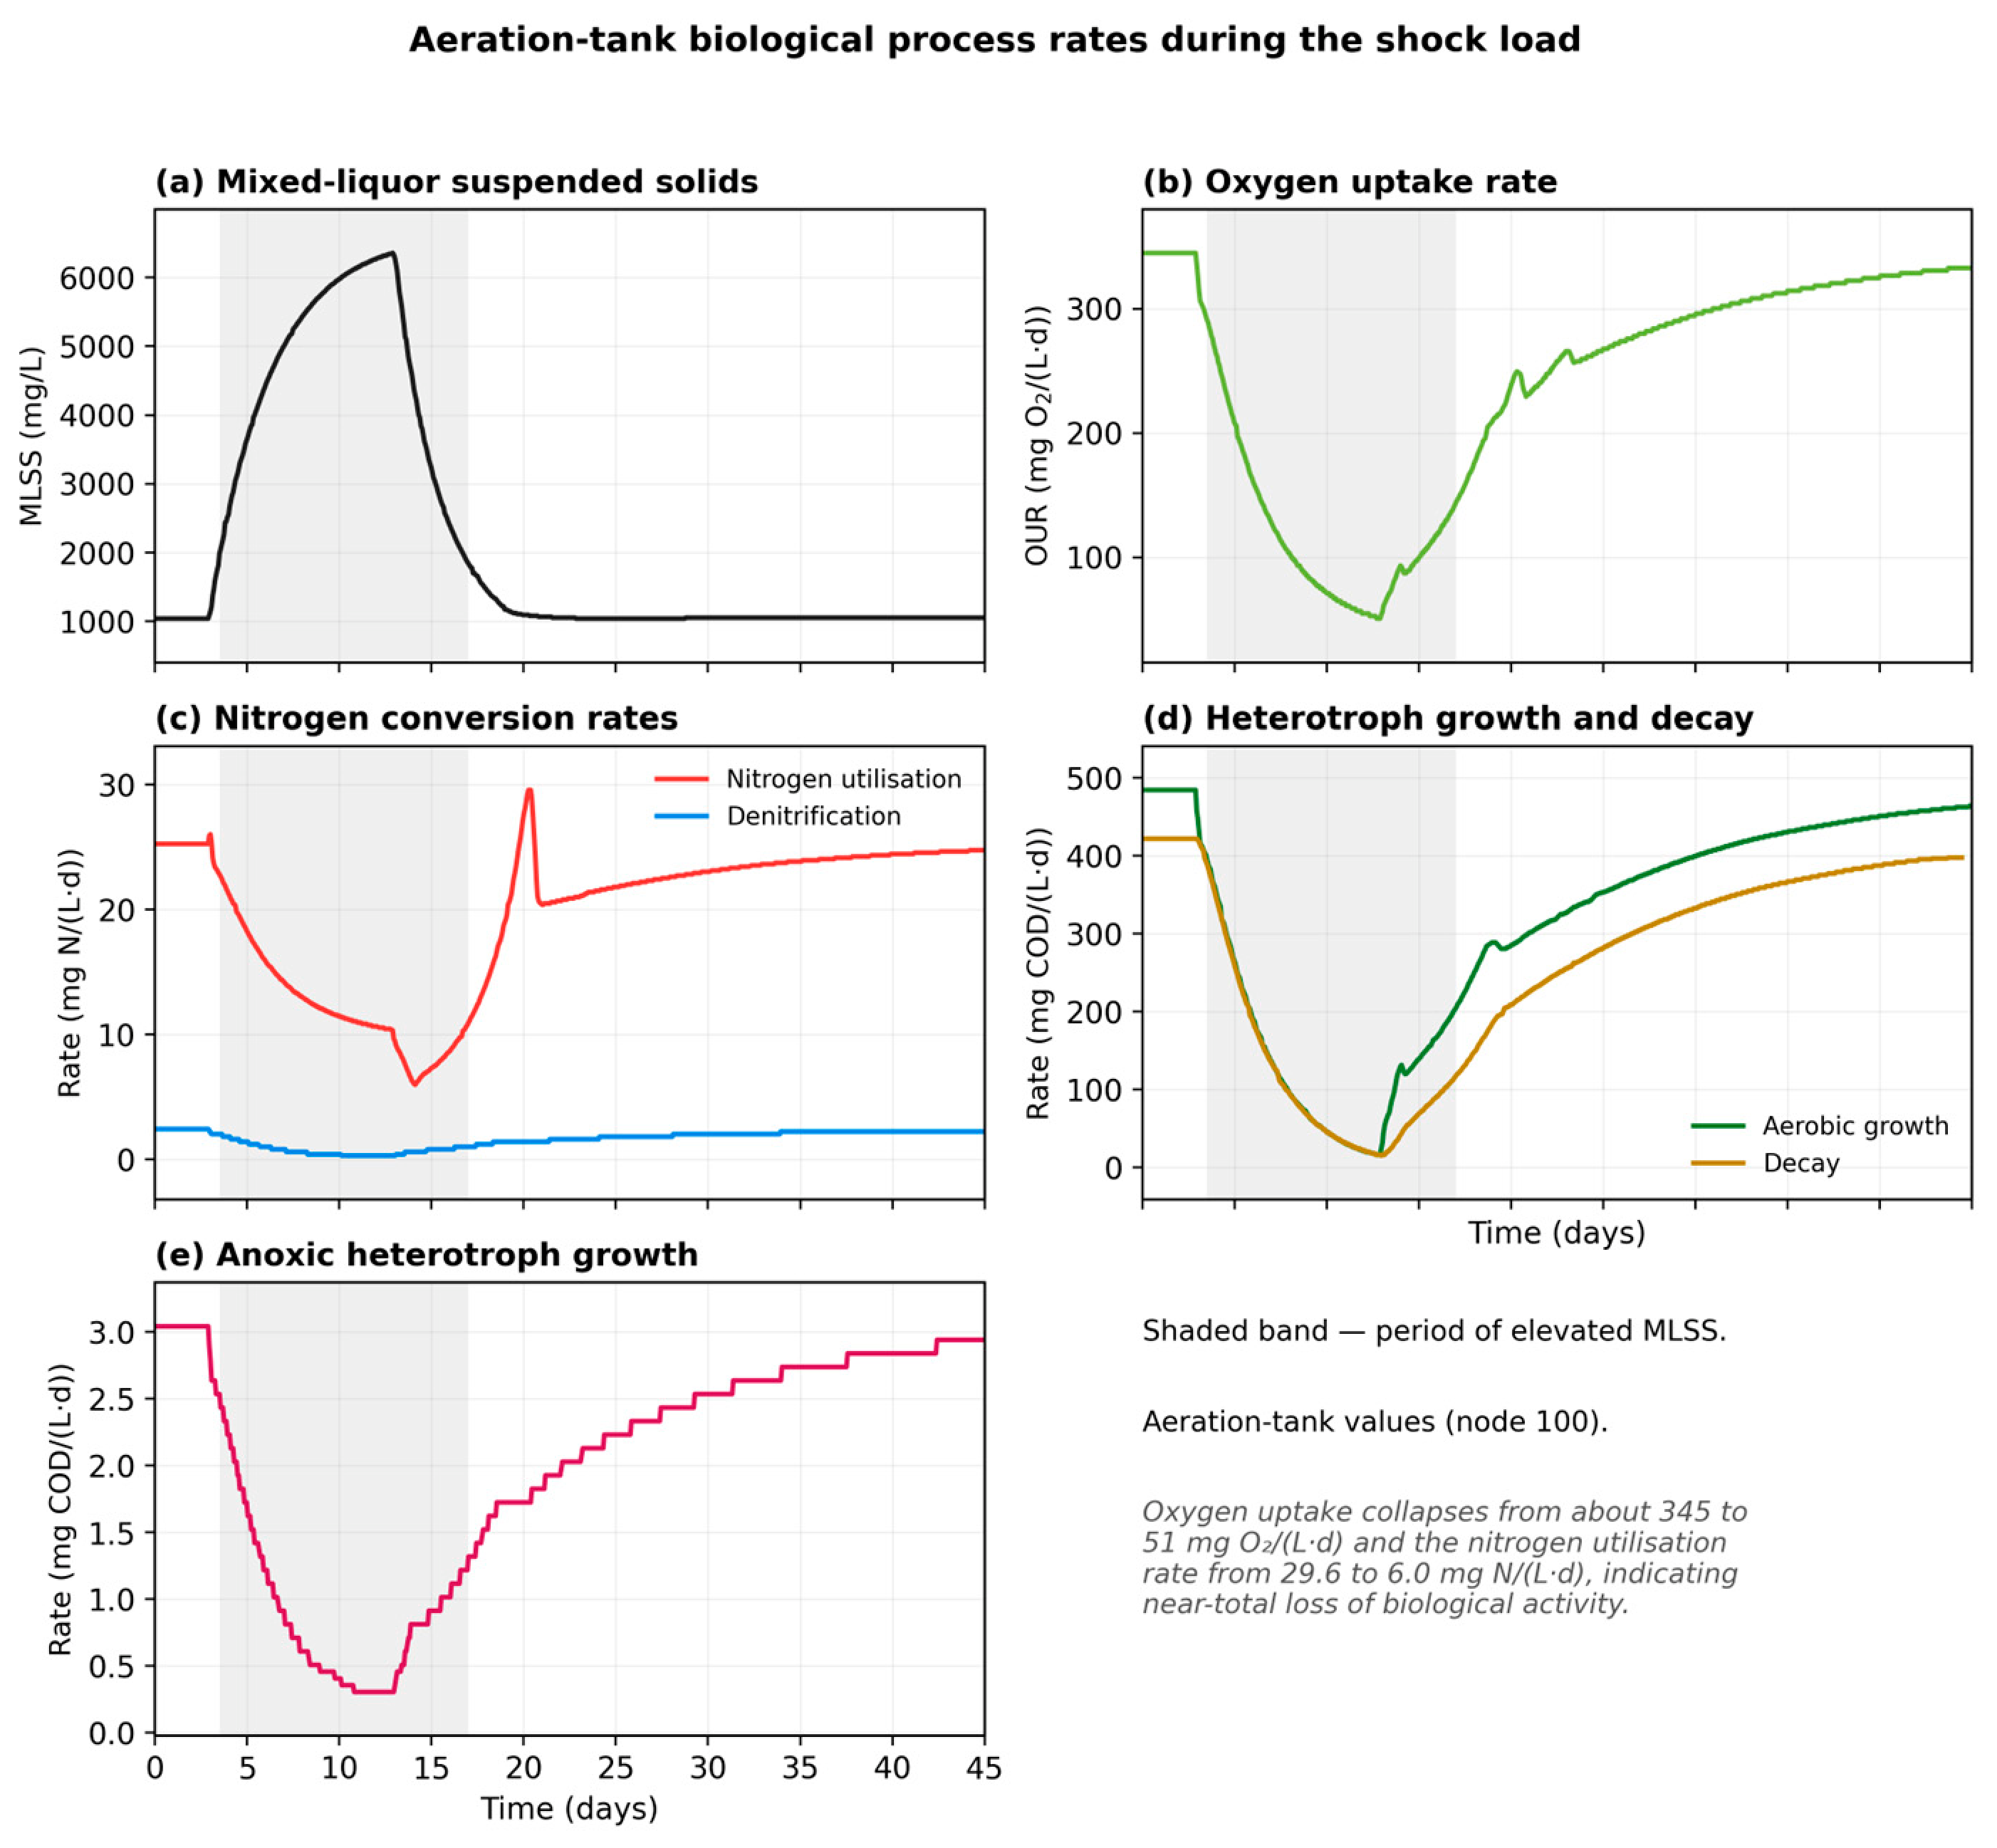
All simulations used the GPS-X MANTIS2 biological library, which extends ASM1 with explicit phosphate-accumulating-organism (PAO) kinetics and chemical-precipitation pathways; enhanced biological phosphorus removal is therefore represented, unlike in unmodified ASM1. The near-complete simulated orthophosphate removal (99.88%) arises from two co-active mechanisms: biological uptake by PAOs (PHA storage/release) and mineral precipitation. The MANTIS2 aeration-tank rate outputs (Appendices E and F, before and during the shock load) show non-zero calcium carbonate and struvite precipitation rates, with only minor AlPO4/FePO4 contributions, confirming that these precipitation processes were active. Because this efficiency is high relative to biological-only removal, it should be validated against measured JIFZ effluent phosphorus once the plant is commissioned.
Calibration performance was assessed by comparing simulated effluent concentrations against measured values from Jericho WWTP. The calibrated model yielded an effluent TSS of 17.2 mg/L, COD of 33.6 mg/L, BOD5 of 14.8 mg/L, and ammonia–N of 0.119 mg/L, which fall within acceptable ranges relative to observed values.
The calibrated model was subsequently adapted to JIFZ-WWTP by incorporating the plant’s specific tank geometry, design flow rates, and influent composition estimated from PIEFZA technical documentation. For clarity, three distinct modeling steps are therefore involved and are kept terminologically distinct throughout this manuscript: (i) calibration of influent characteristics and kinetic and settling parameters against Jericho WWTP data (
Table 5 and
Table 6); (ii) transfer/adaptation of the calibrated parameter set to JIFZ-specific geometry and estimated influent; and (iii) scenario simulation (baseline, Monte Carlo, shock-load) using the adapted JIFZ model. The resulting model is referred to as an ‘adapted’ or ‘transferred’ model of JIFZ-WWTP rather than a fully calibrated model of JIFZ-WWTP itself.
2.4. Simulation Scenarios
Three primary simulation scenarios were examined:
(1) Baseline steady-state performance: The JIFZ-WWTP was operated at the design influent composition and at the optimal RAS/WAS setpoints determined through parametric optimization. Key performance indicators (removal efficiencies for TSS, VSS, COD, cBOD5, TN, TKN, NH3-N, S-PO4, and TP) were recorded.
(2) Monte Carlo probabilistic analysis: To quantify performance variability under realistically uncertain influent conditions, 1000 Monte Carlo simulation runs were executed. Four input parameters were assigned uniform probability distributions: total COD (800–1500 mg/L), TKN (40–80 mg/L), readily biodegradable COD fraction (0.4–0.8), and orthophosphate (1–5 mg/L). The four inputs were sampled independently, with no imposed correlations. This is therefore a four-parameter screening exercise rather than a sensitivity analysis: because run-level records were not retained, the drivers of non-compliance cannot be ranked and surrogate-calibration uncertainty cannot be propagated, so the compliance frequencies reported below should be read as indicative only. Compliance probabilities were computed for effluent TSS (<50 mg/L), cBOD5 (<40 mg/L), COD (<100 mg/L), and TN (<45 mg/L). The uniform distribution was selected as a conservative, minimally informative choice in the absence of a measured JIFZ influent distribution; it assigns equal probability mass across the full plausible range rather than concentrating probability around an assumed central estimate, which would not be justifiable without operational data. This choice is acknowledged as a simplification: uniform distributions do not reflect the more centrally weighted variability typically observed in real industrial discharge records.
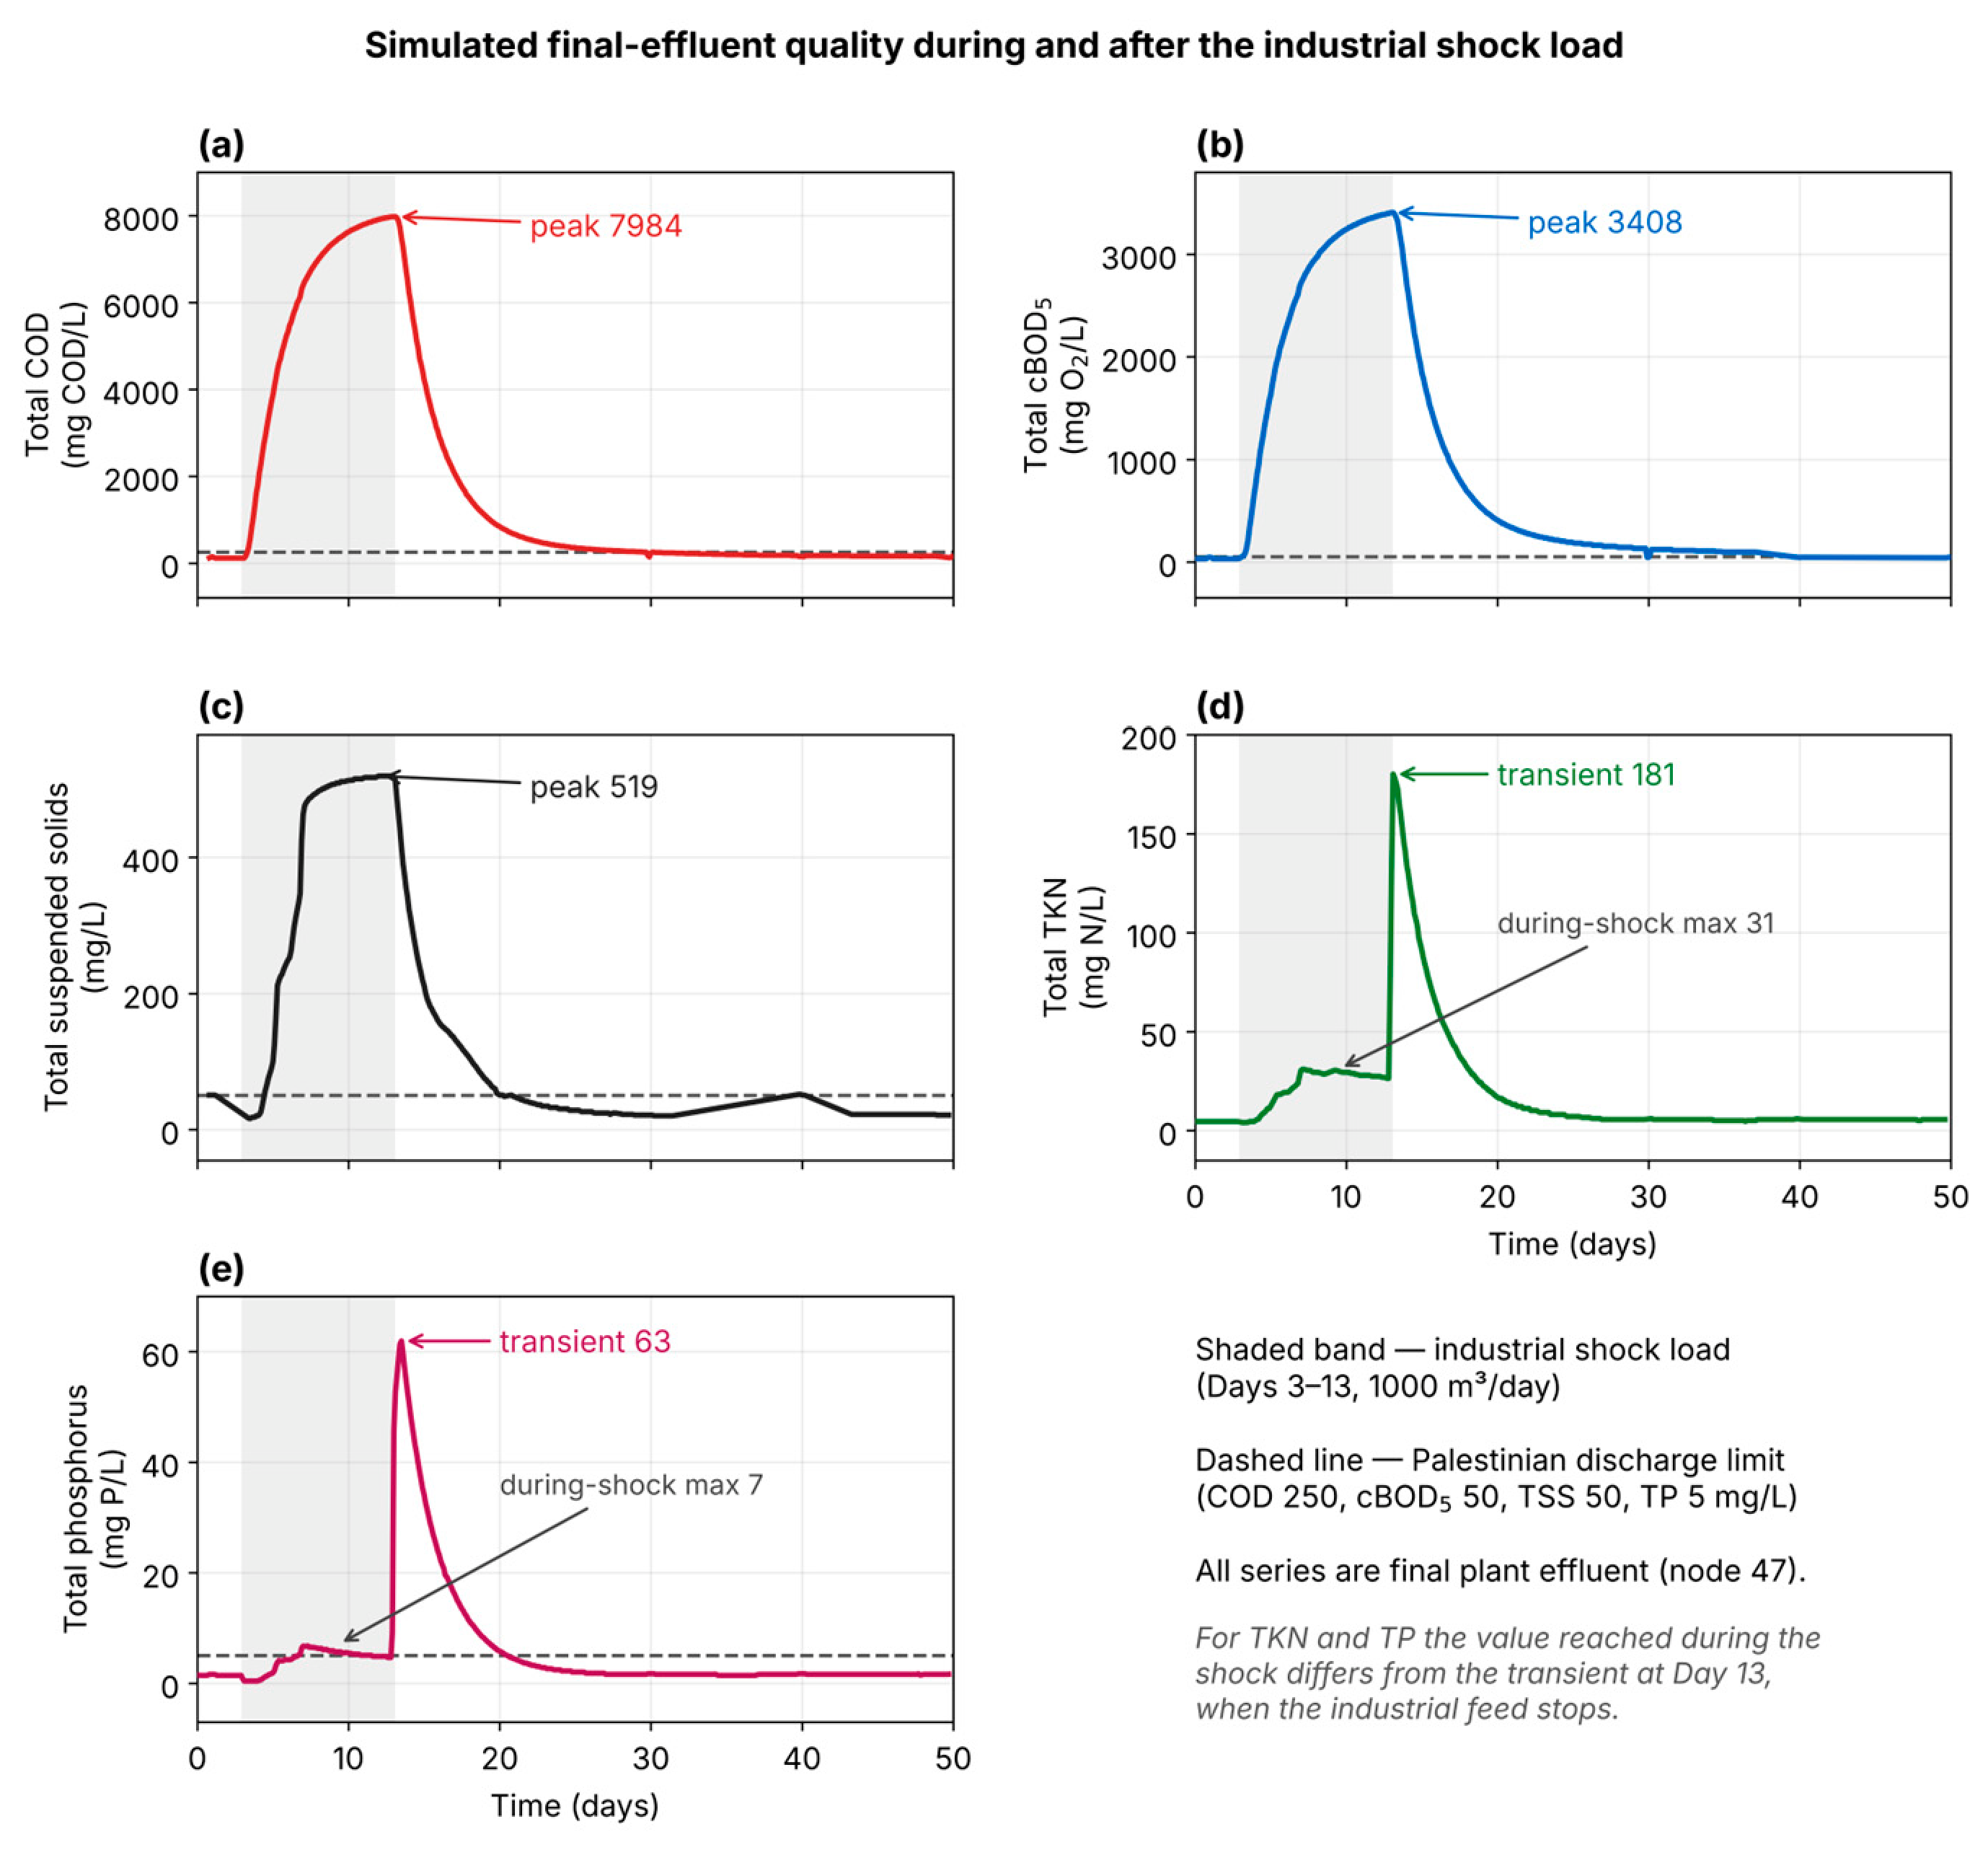
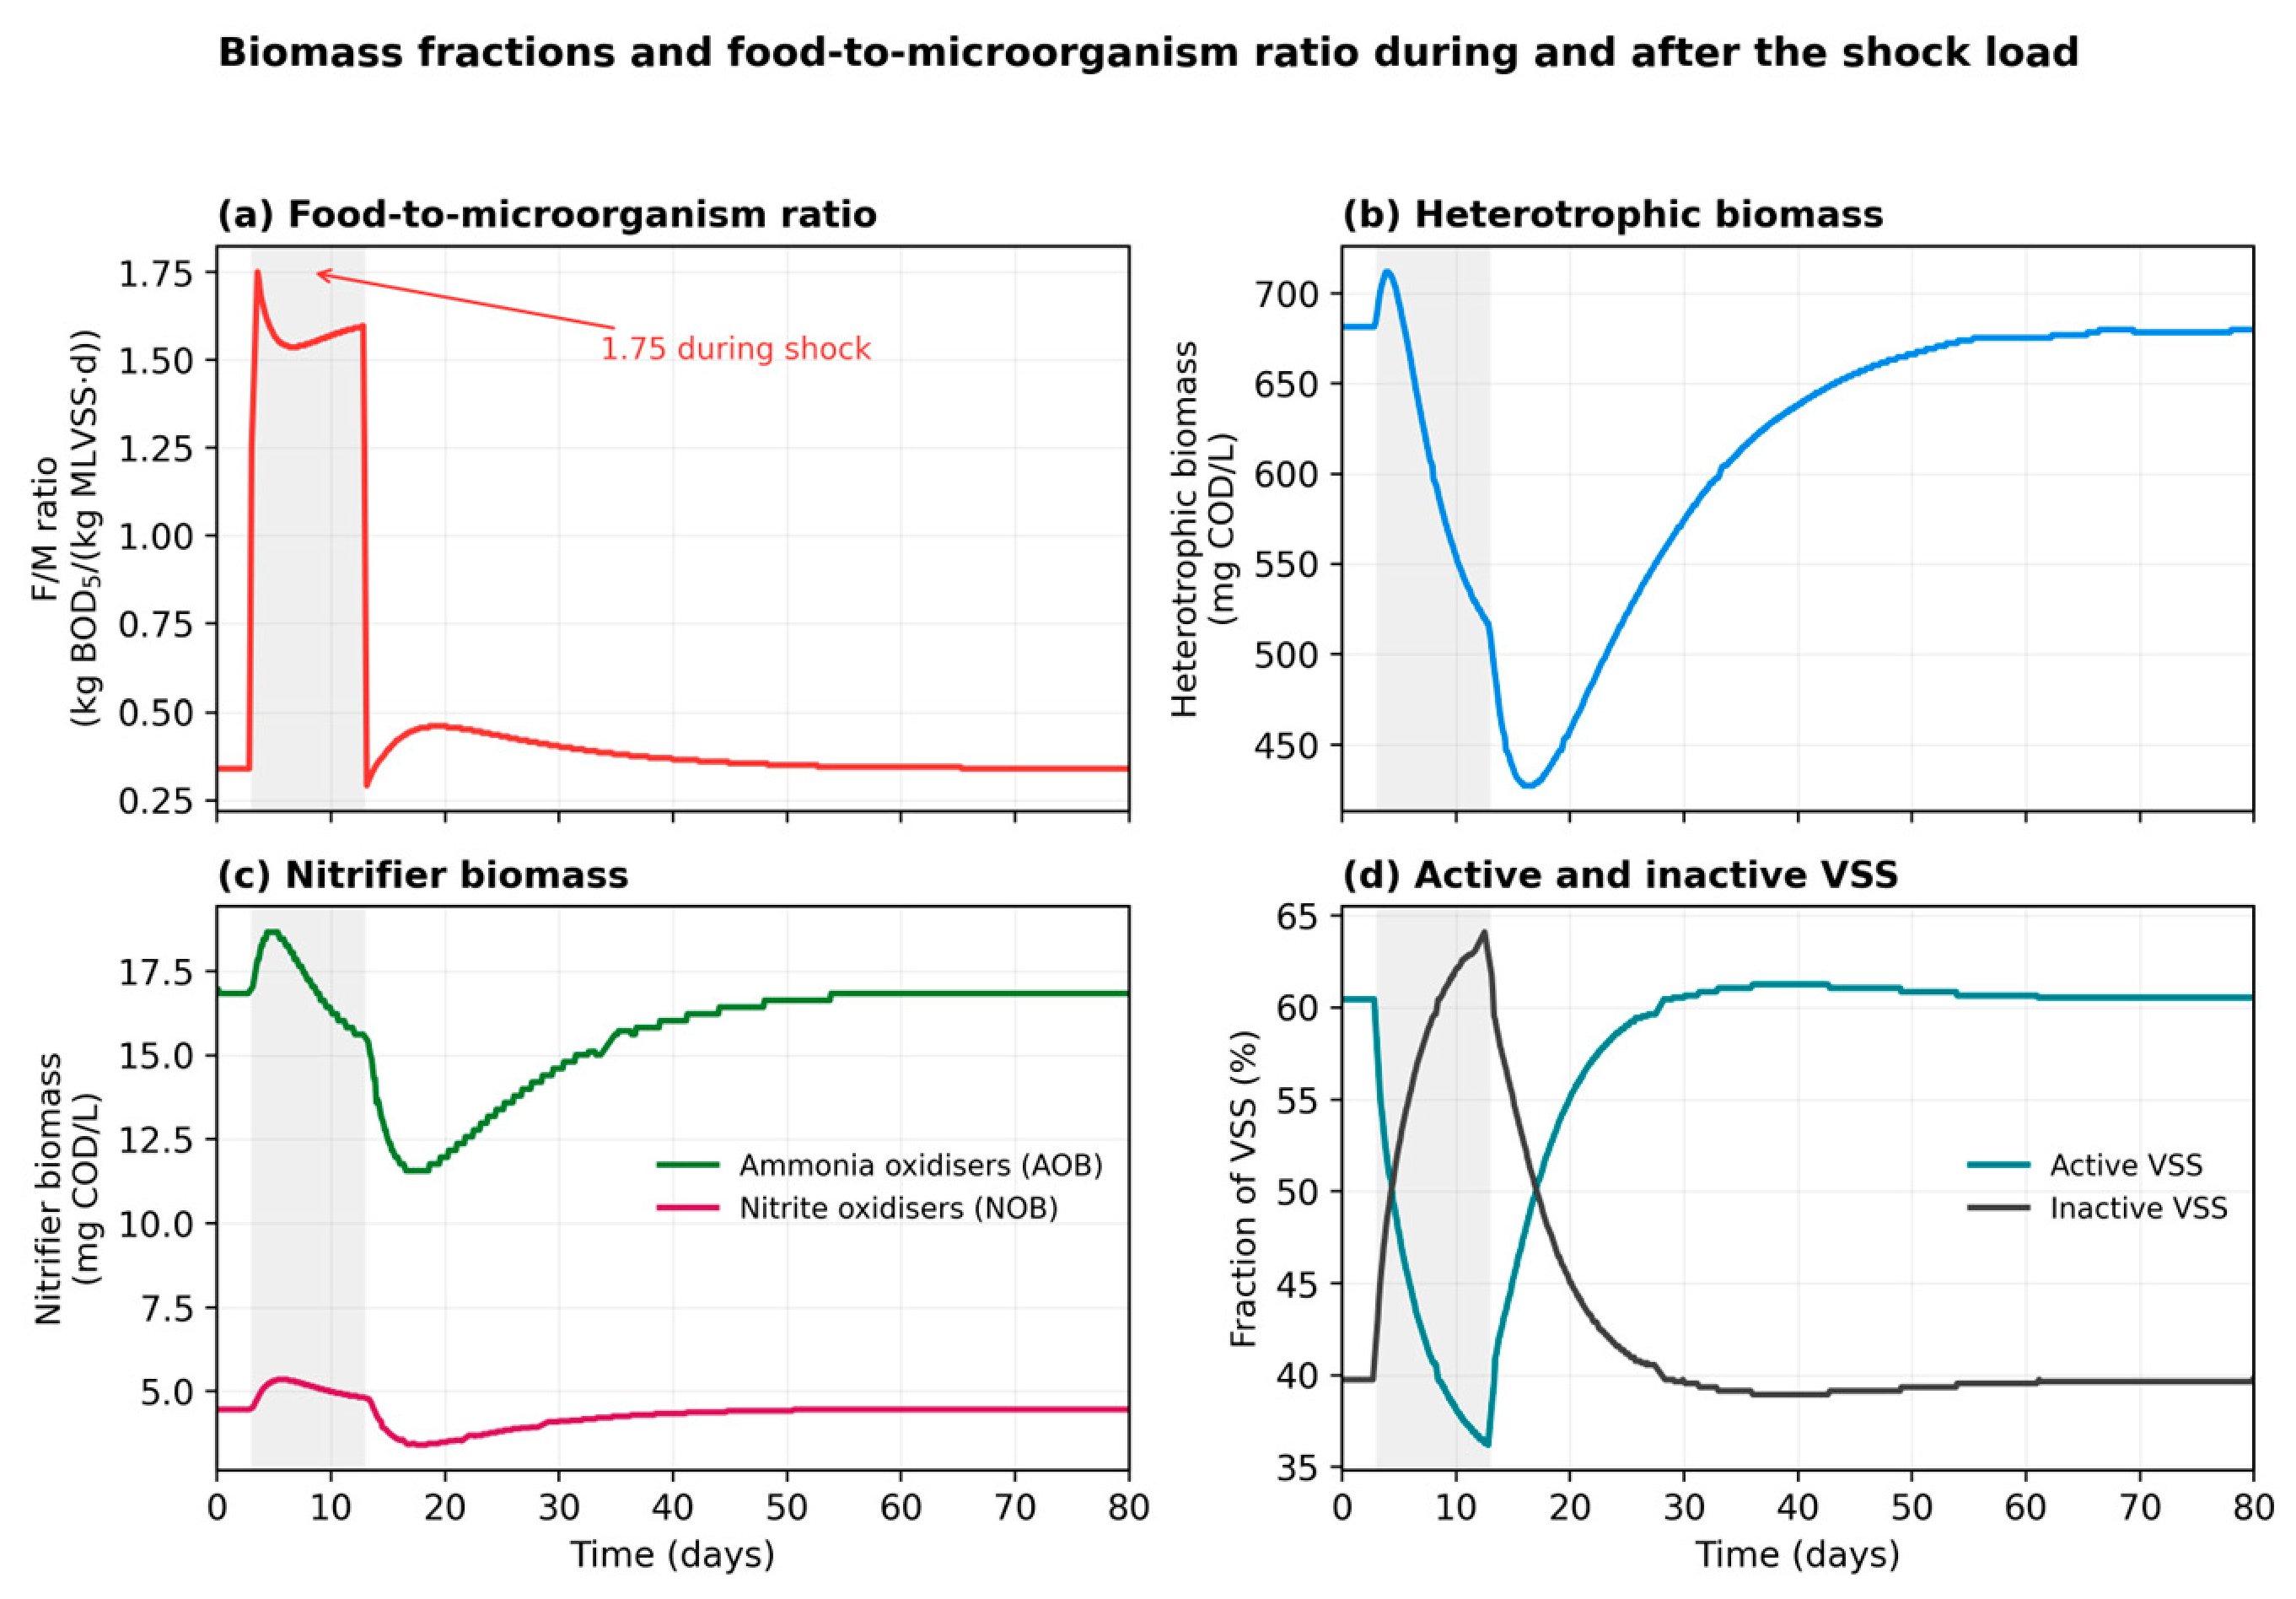
All dynamic simulations were initialized from steady state: the adapted JIFZ-WWTP model was first run to equilibrium, and the resulting state served as the starting condition for each scenario. Dynamic runs used an adaptive Runge–Kutta solver with a base integration time step of 0.1–0.25 h. A stabilization period of 3–5 days preceded each shock-load scenario to ensure a stable operating point before perturbation. The shock was introduced as a step increase of 1000 m3/day of untreated industrial flow on Day 3, sustained for 10 days, using time-series influent data derived from the PIEFZA estimates and literature values for the mixed industrial streams.
The four influent variables were sampled from independent uniform distributions with no imposed inter-parameter correlations. GPS-X returned only the aggregate compliance frequencies rather than a per-realization input–output log; consequently, a formal sensitivity ranking of the drivers of non-compliance could not be computed for this version and is identified as a priority for future work, in which the runs will be scripted so that each realization’s inputs and outputs are retained.
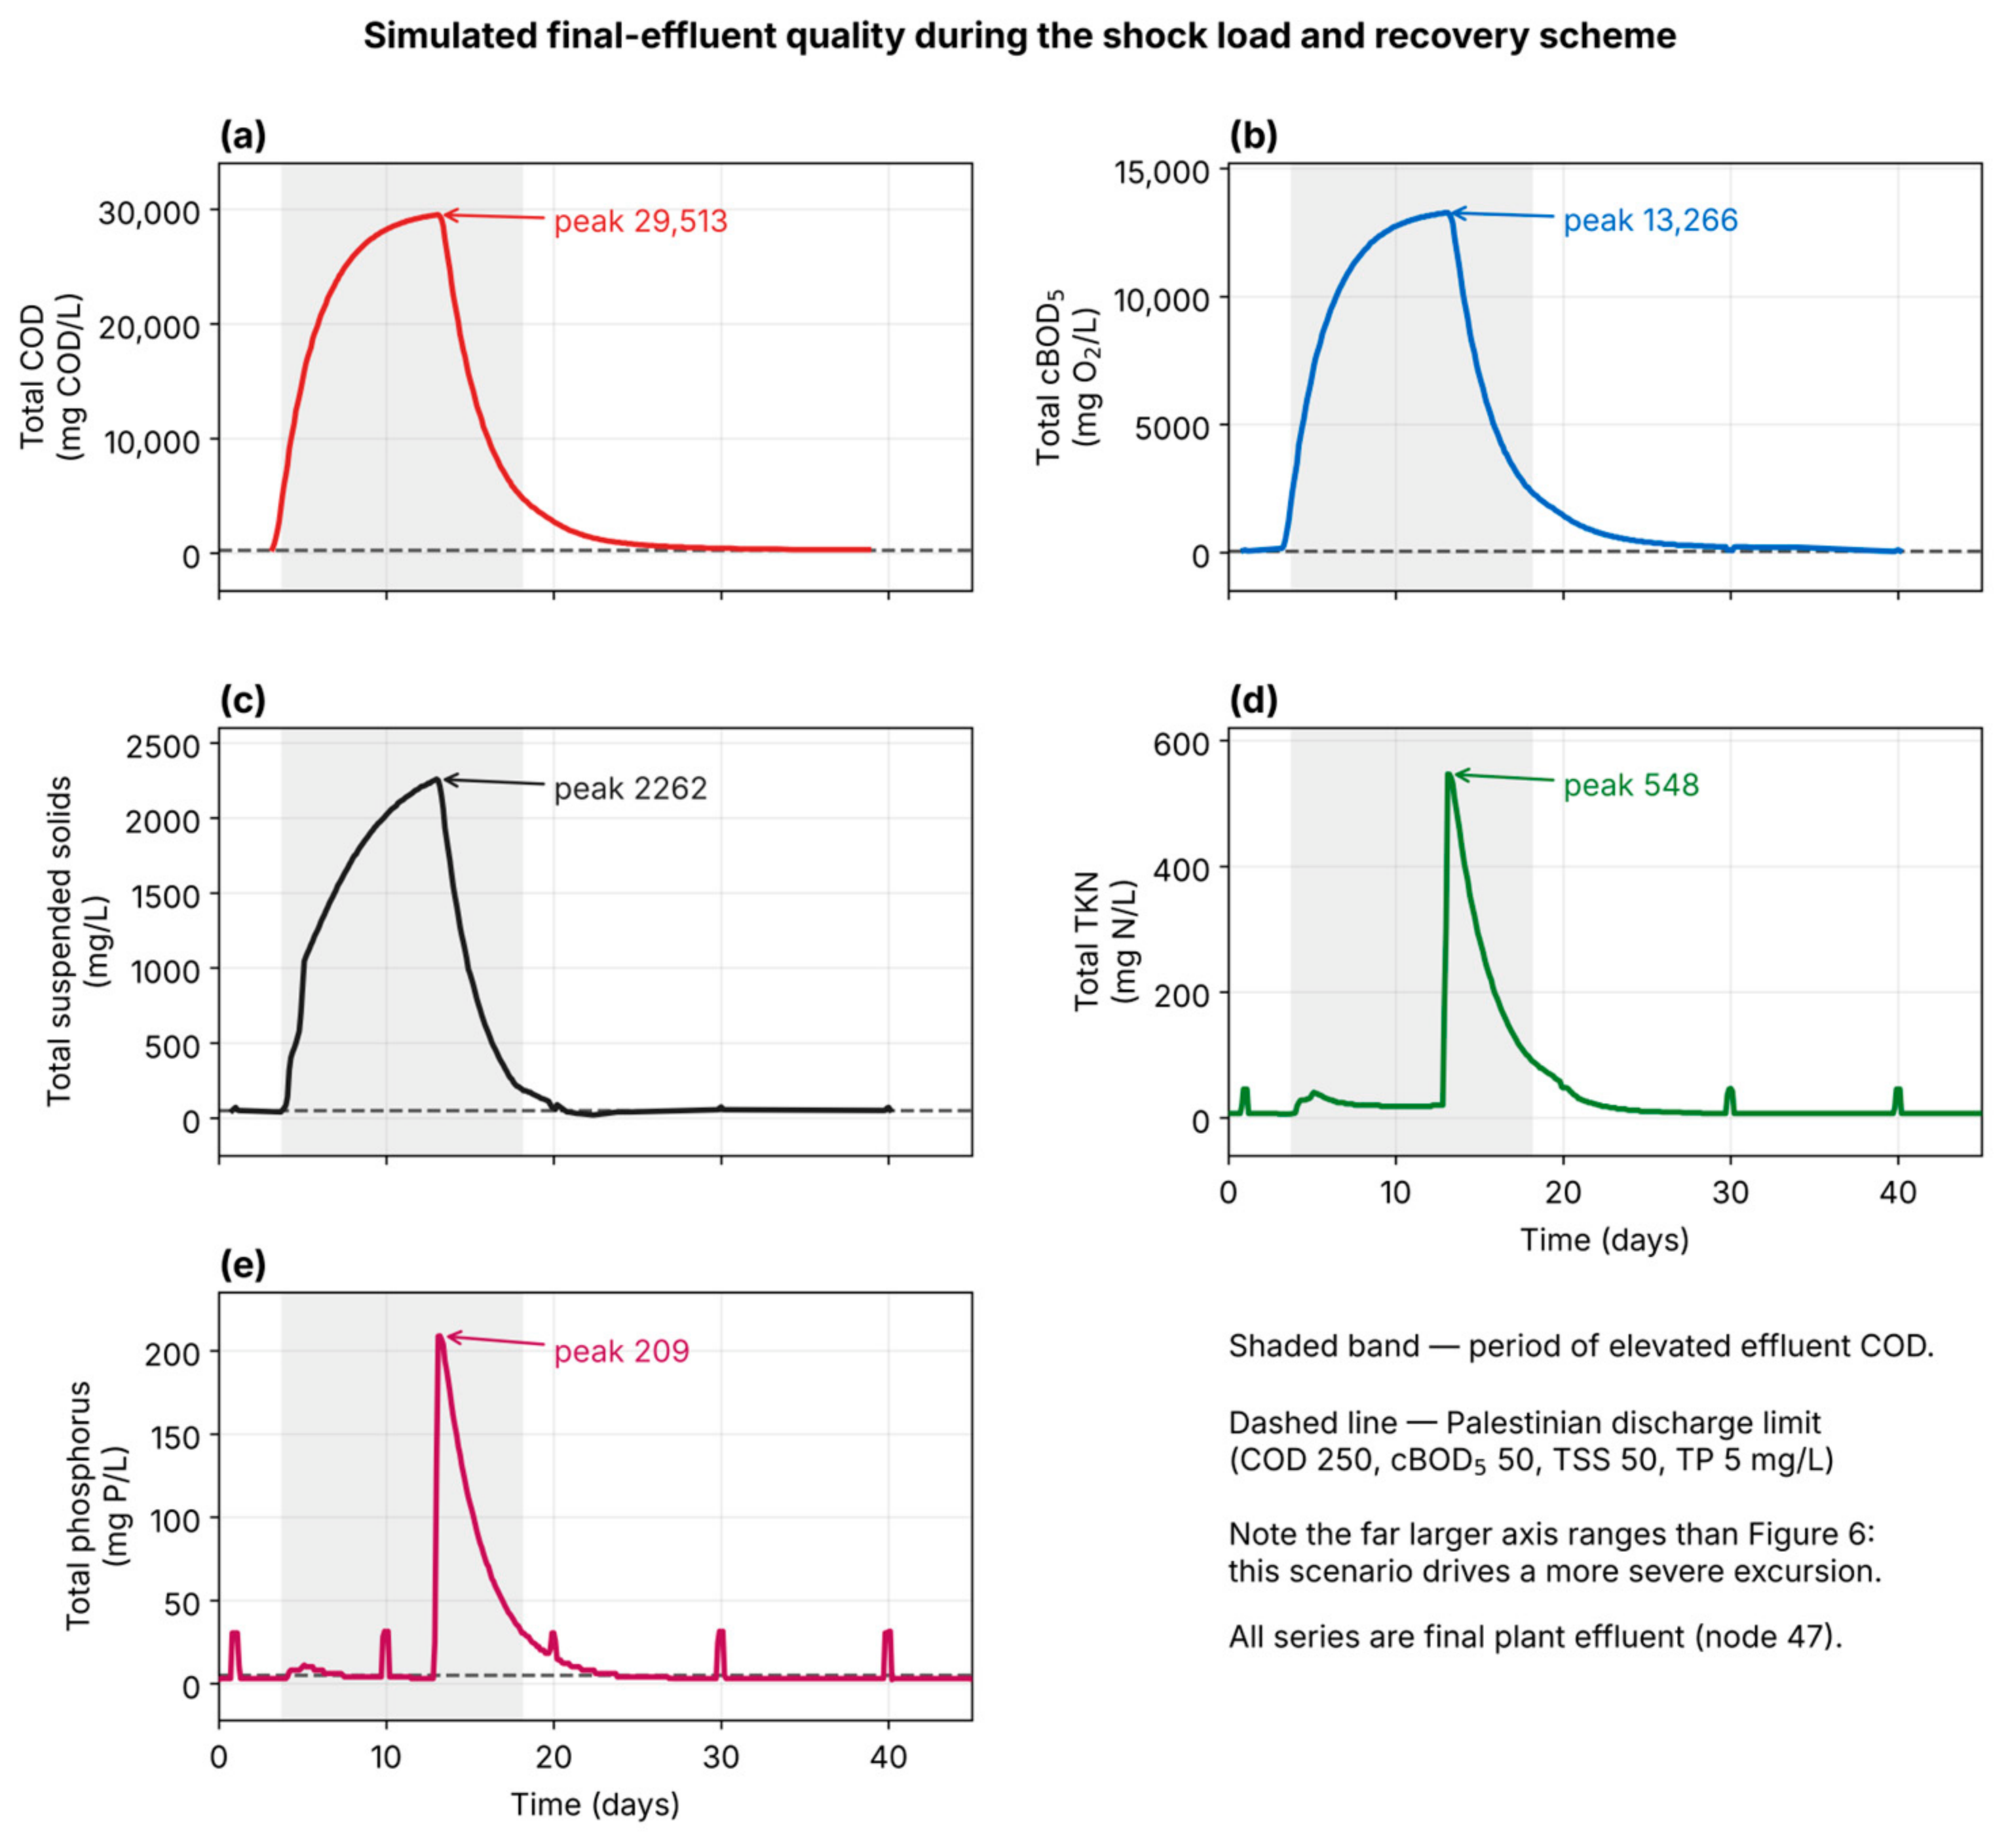
(3) Industrial shock-load scenario: A sudden discharge of 1000 m
3/day of untreated industrial effluent, representative of the blended output of the five industrial sectors (
Table 7), and, separately, (4) a high-strength variant in which the influent is dominated by energy-drink processing effluent, reported in
Section 3.6; the two differ by influent composition rather than by flow, and are distinguished throughout the Results, of combined output from energy drink manufacturing, meat and dairy processing, textile, and tannery industries present in the JIFZ, was superimposed on the normal influent stream on Day 3, persisting for ten days (Days 3–13). The shock load replaced the baseline influent flow, so total plant throughput remained approximately 1000 m
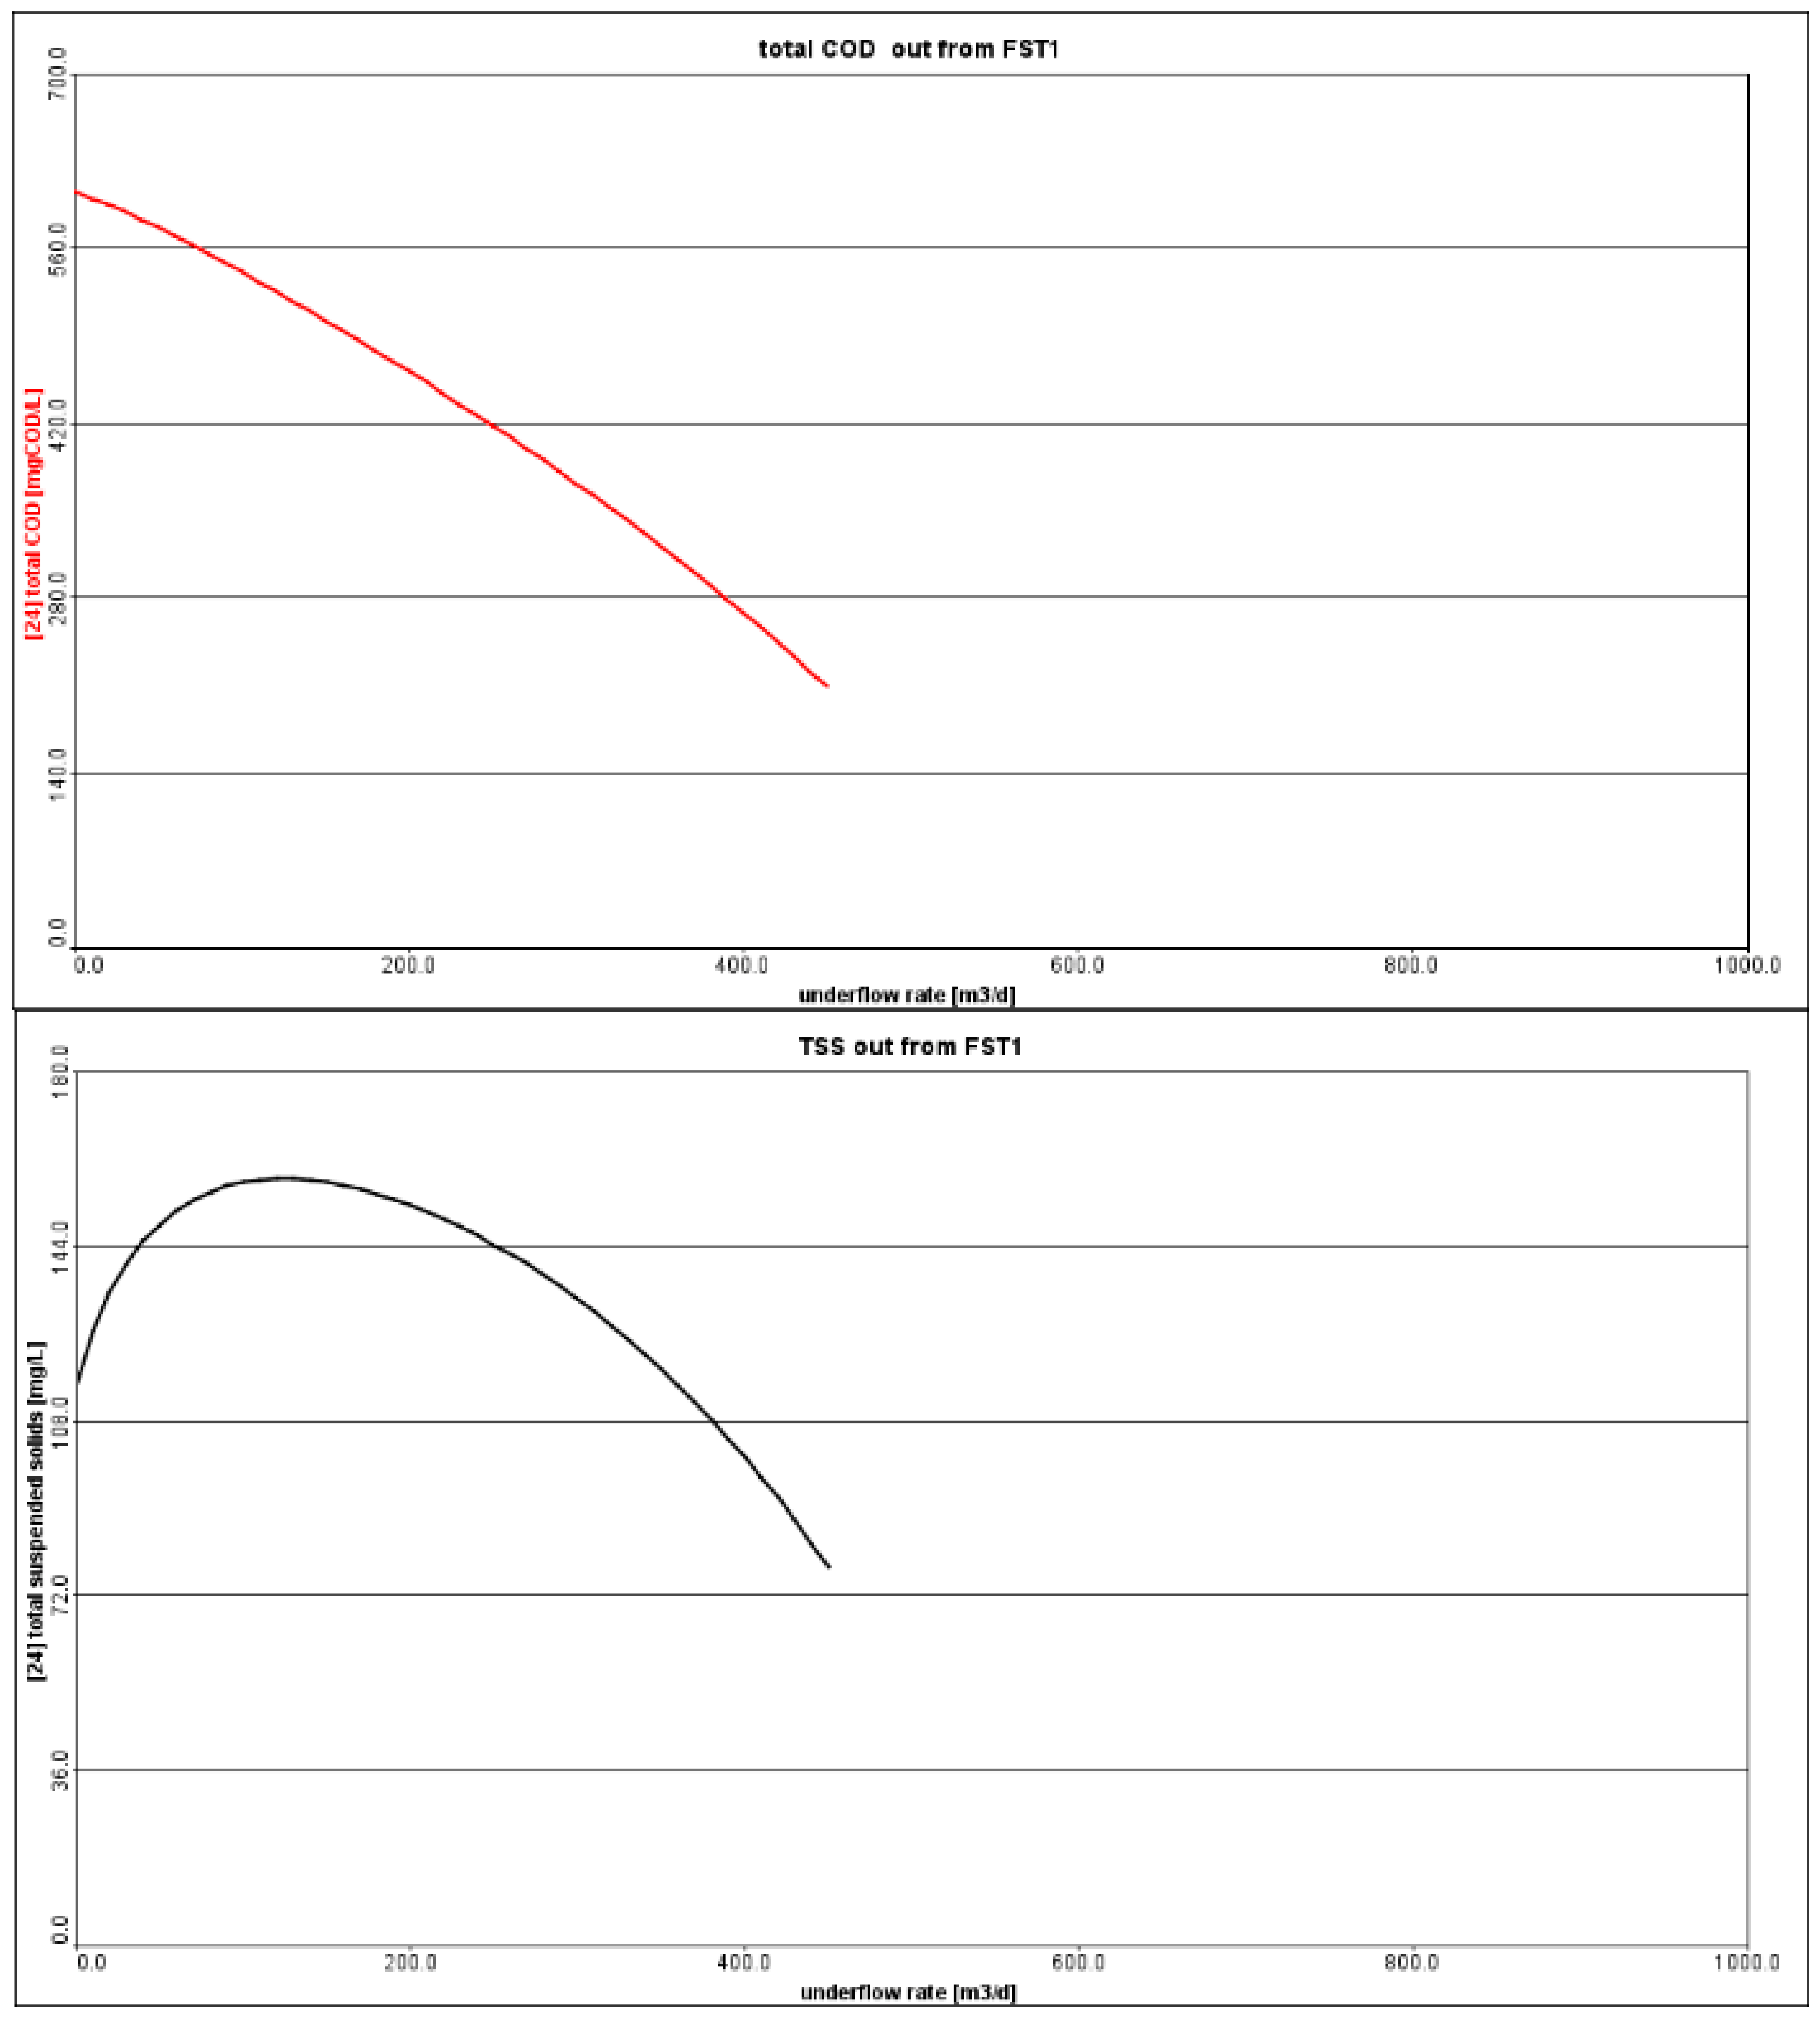
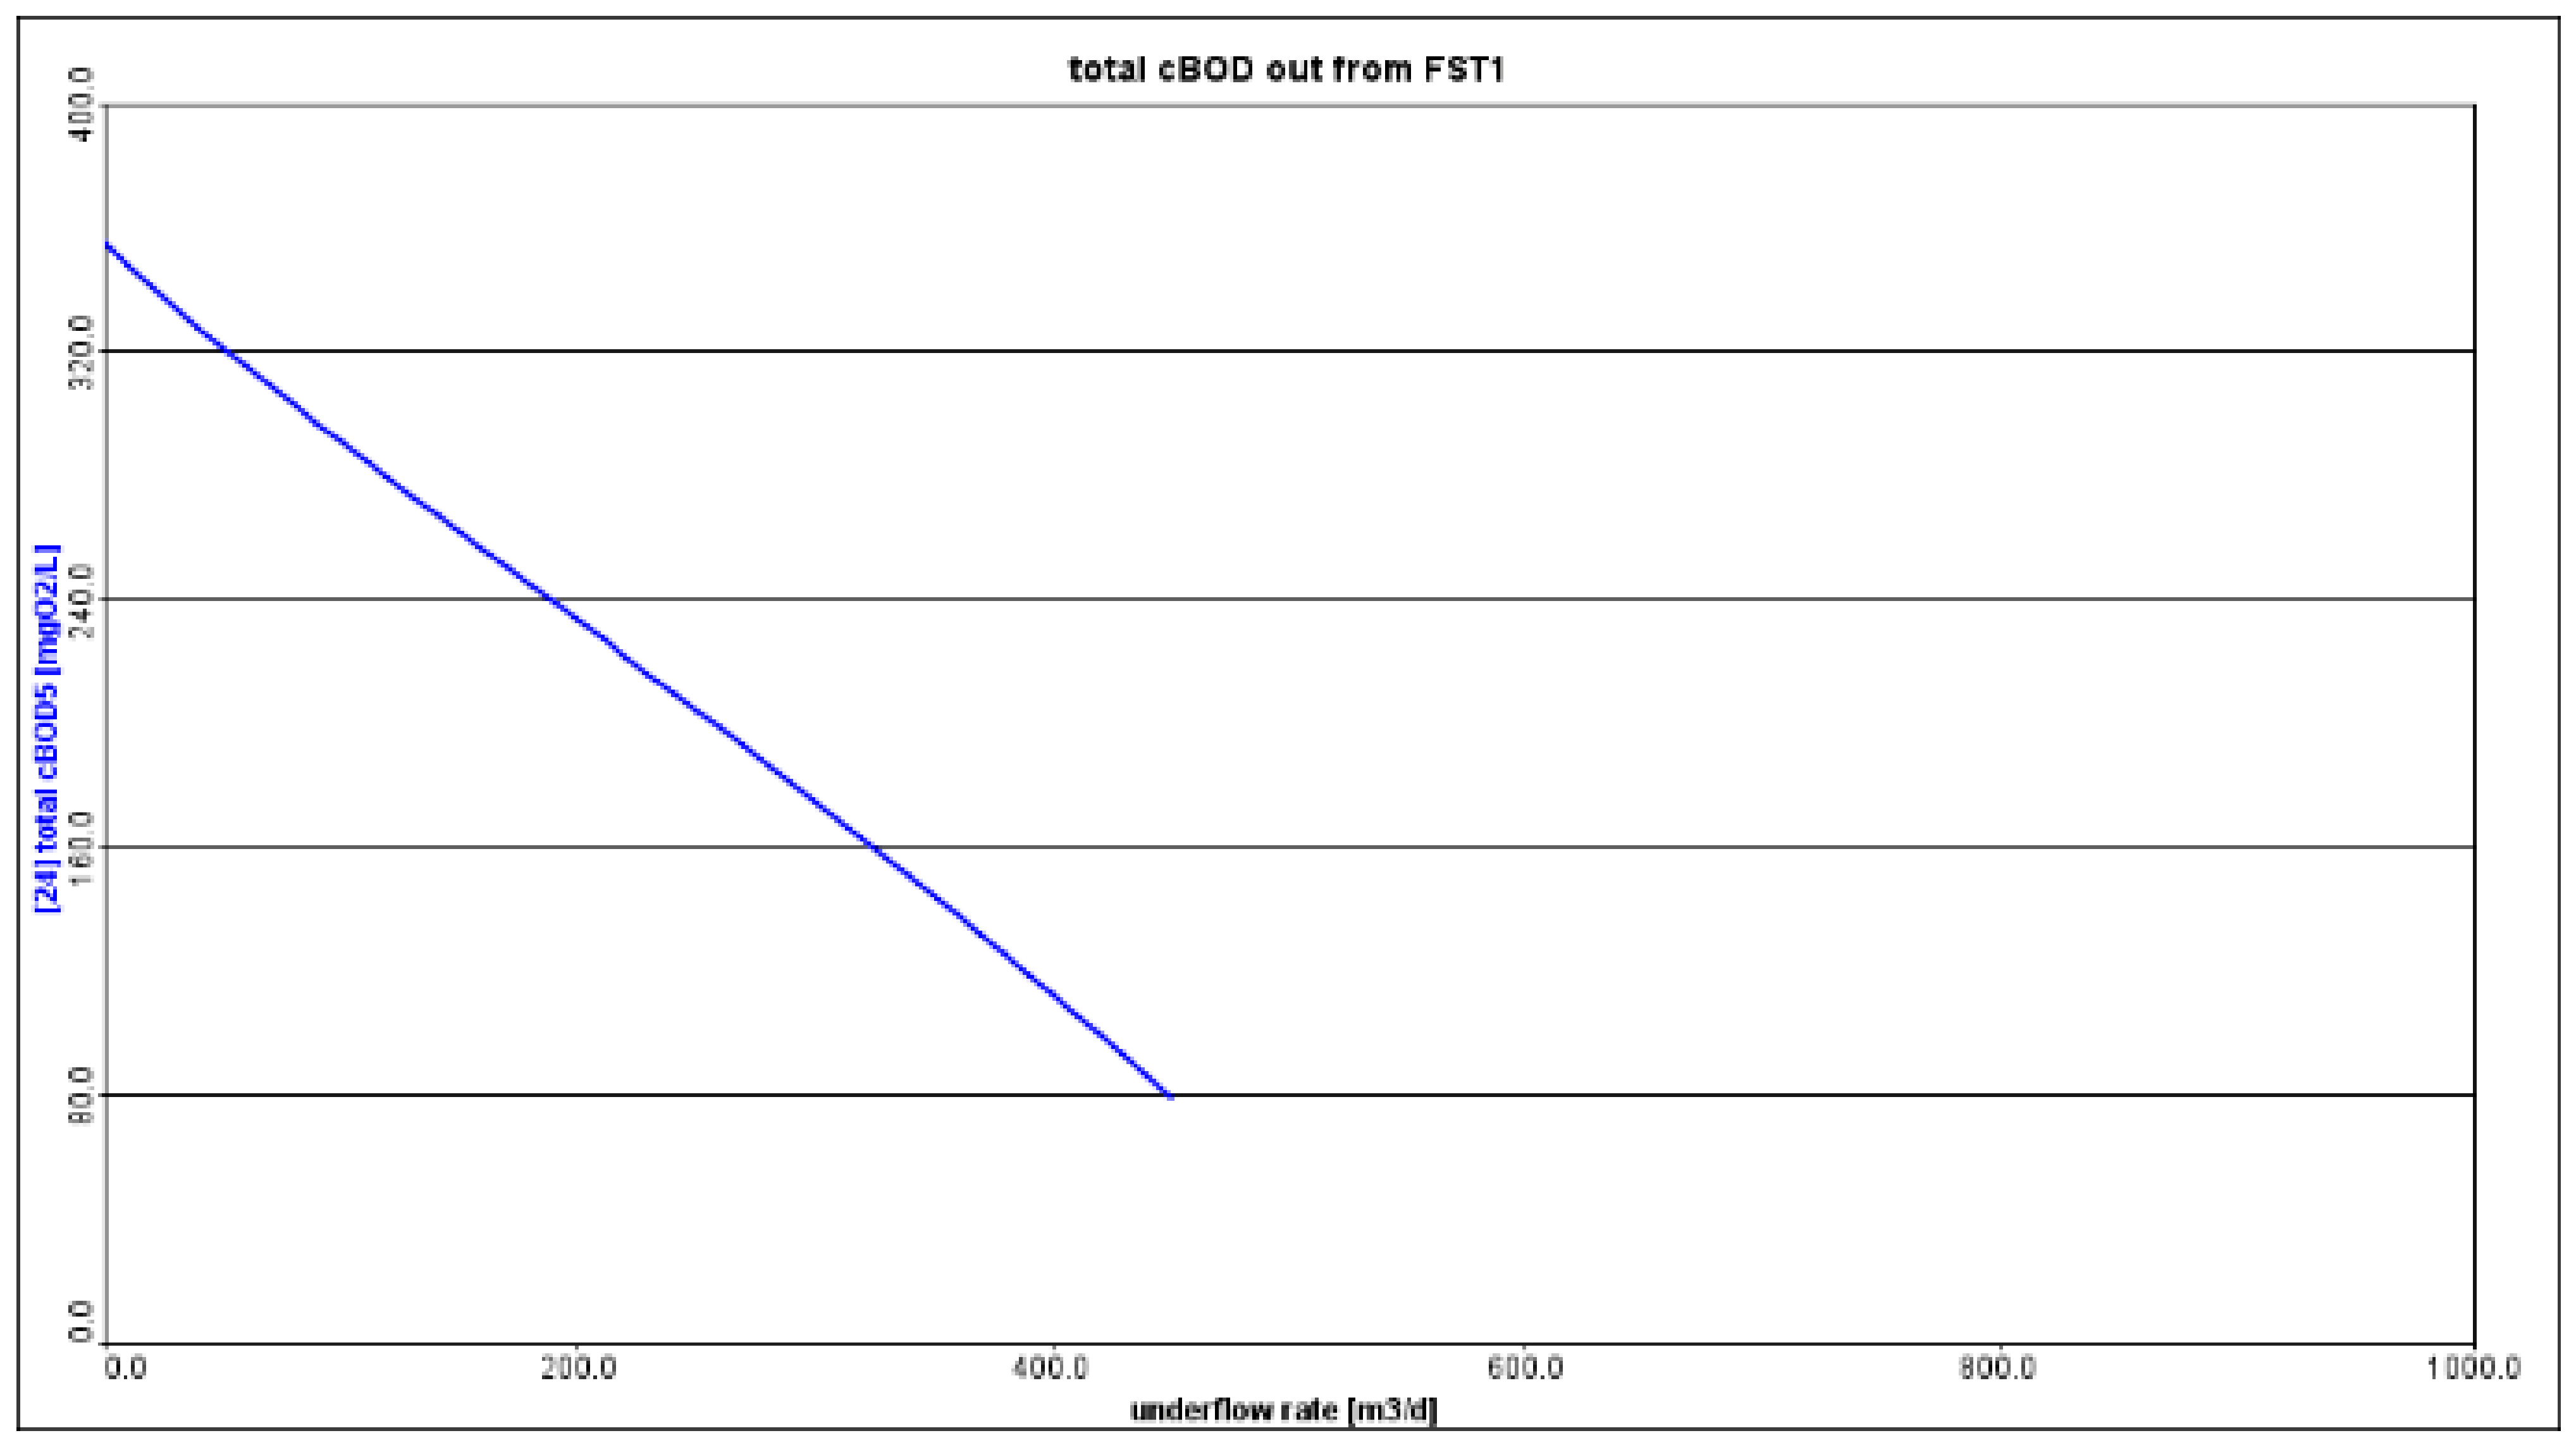
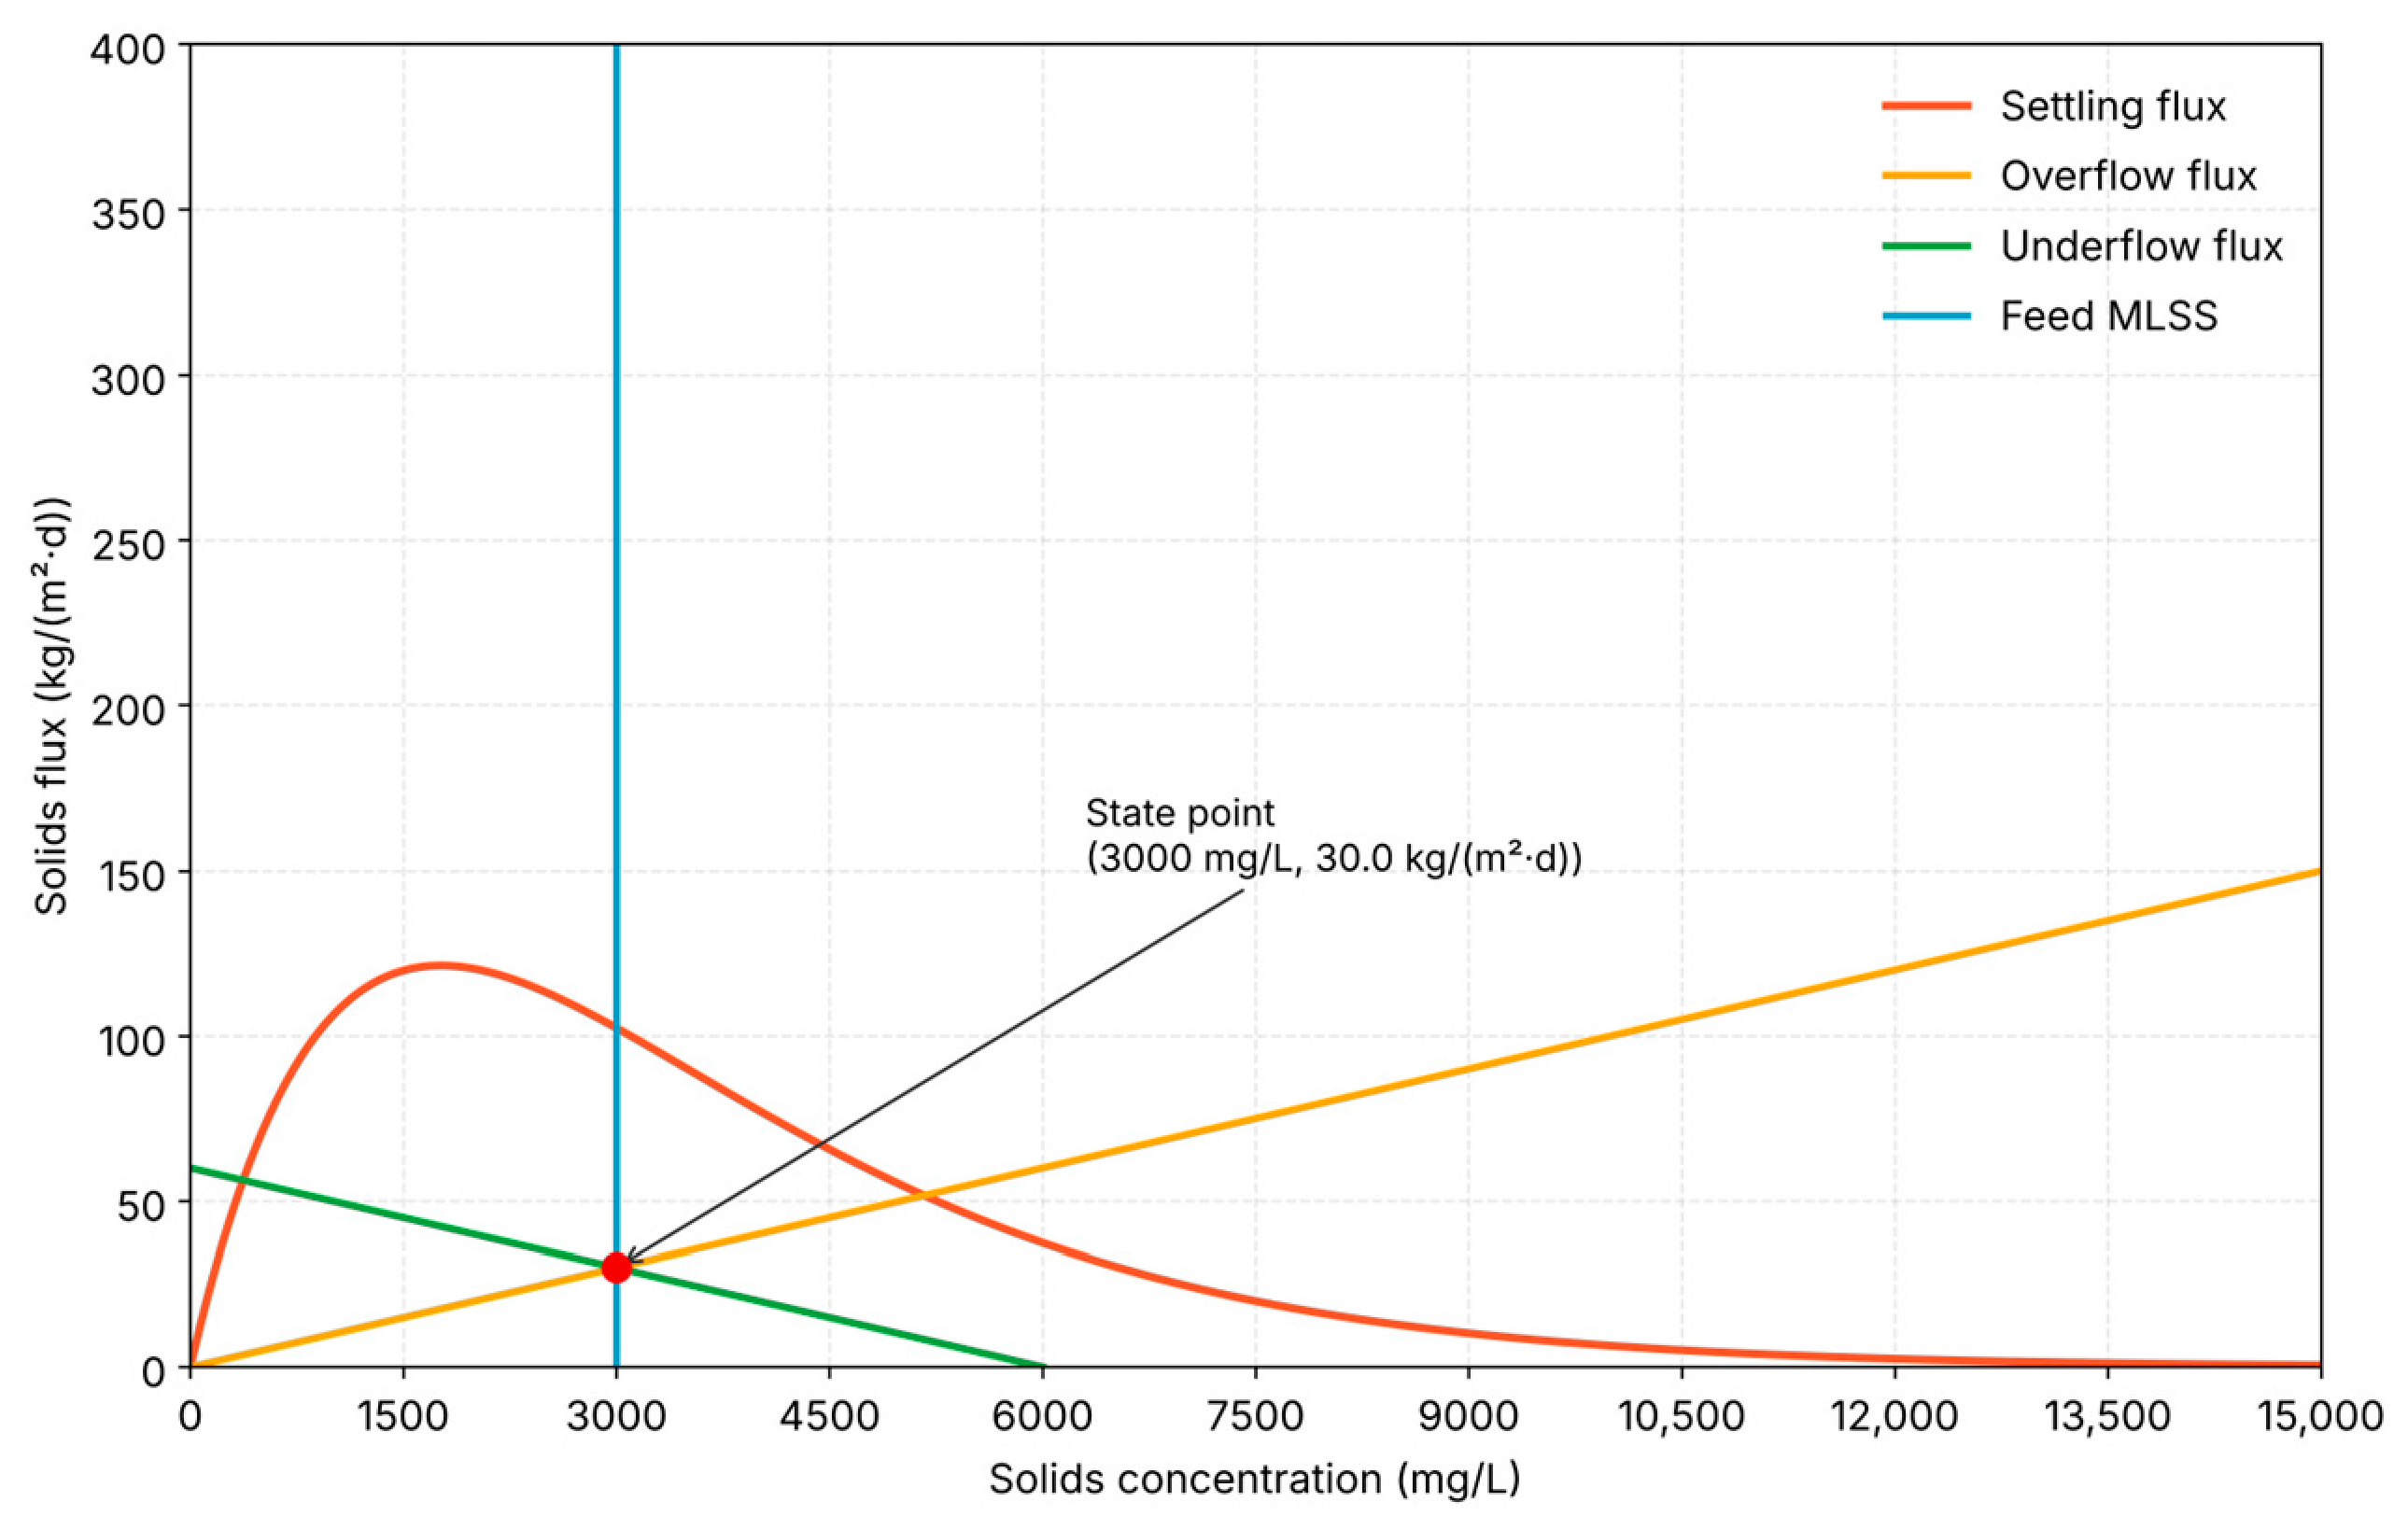
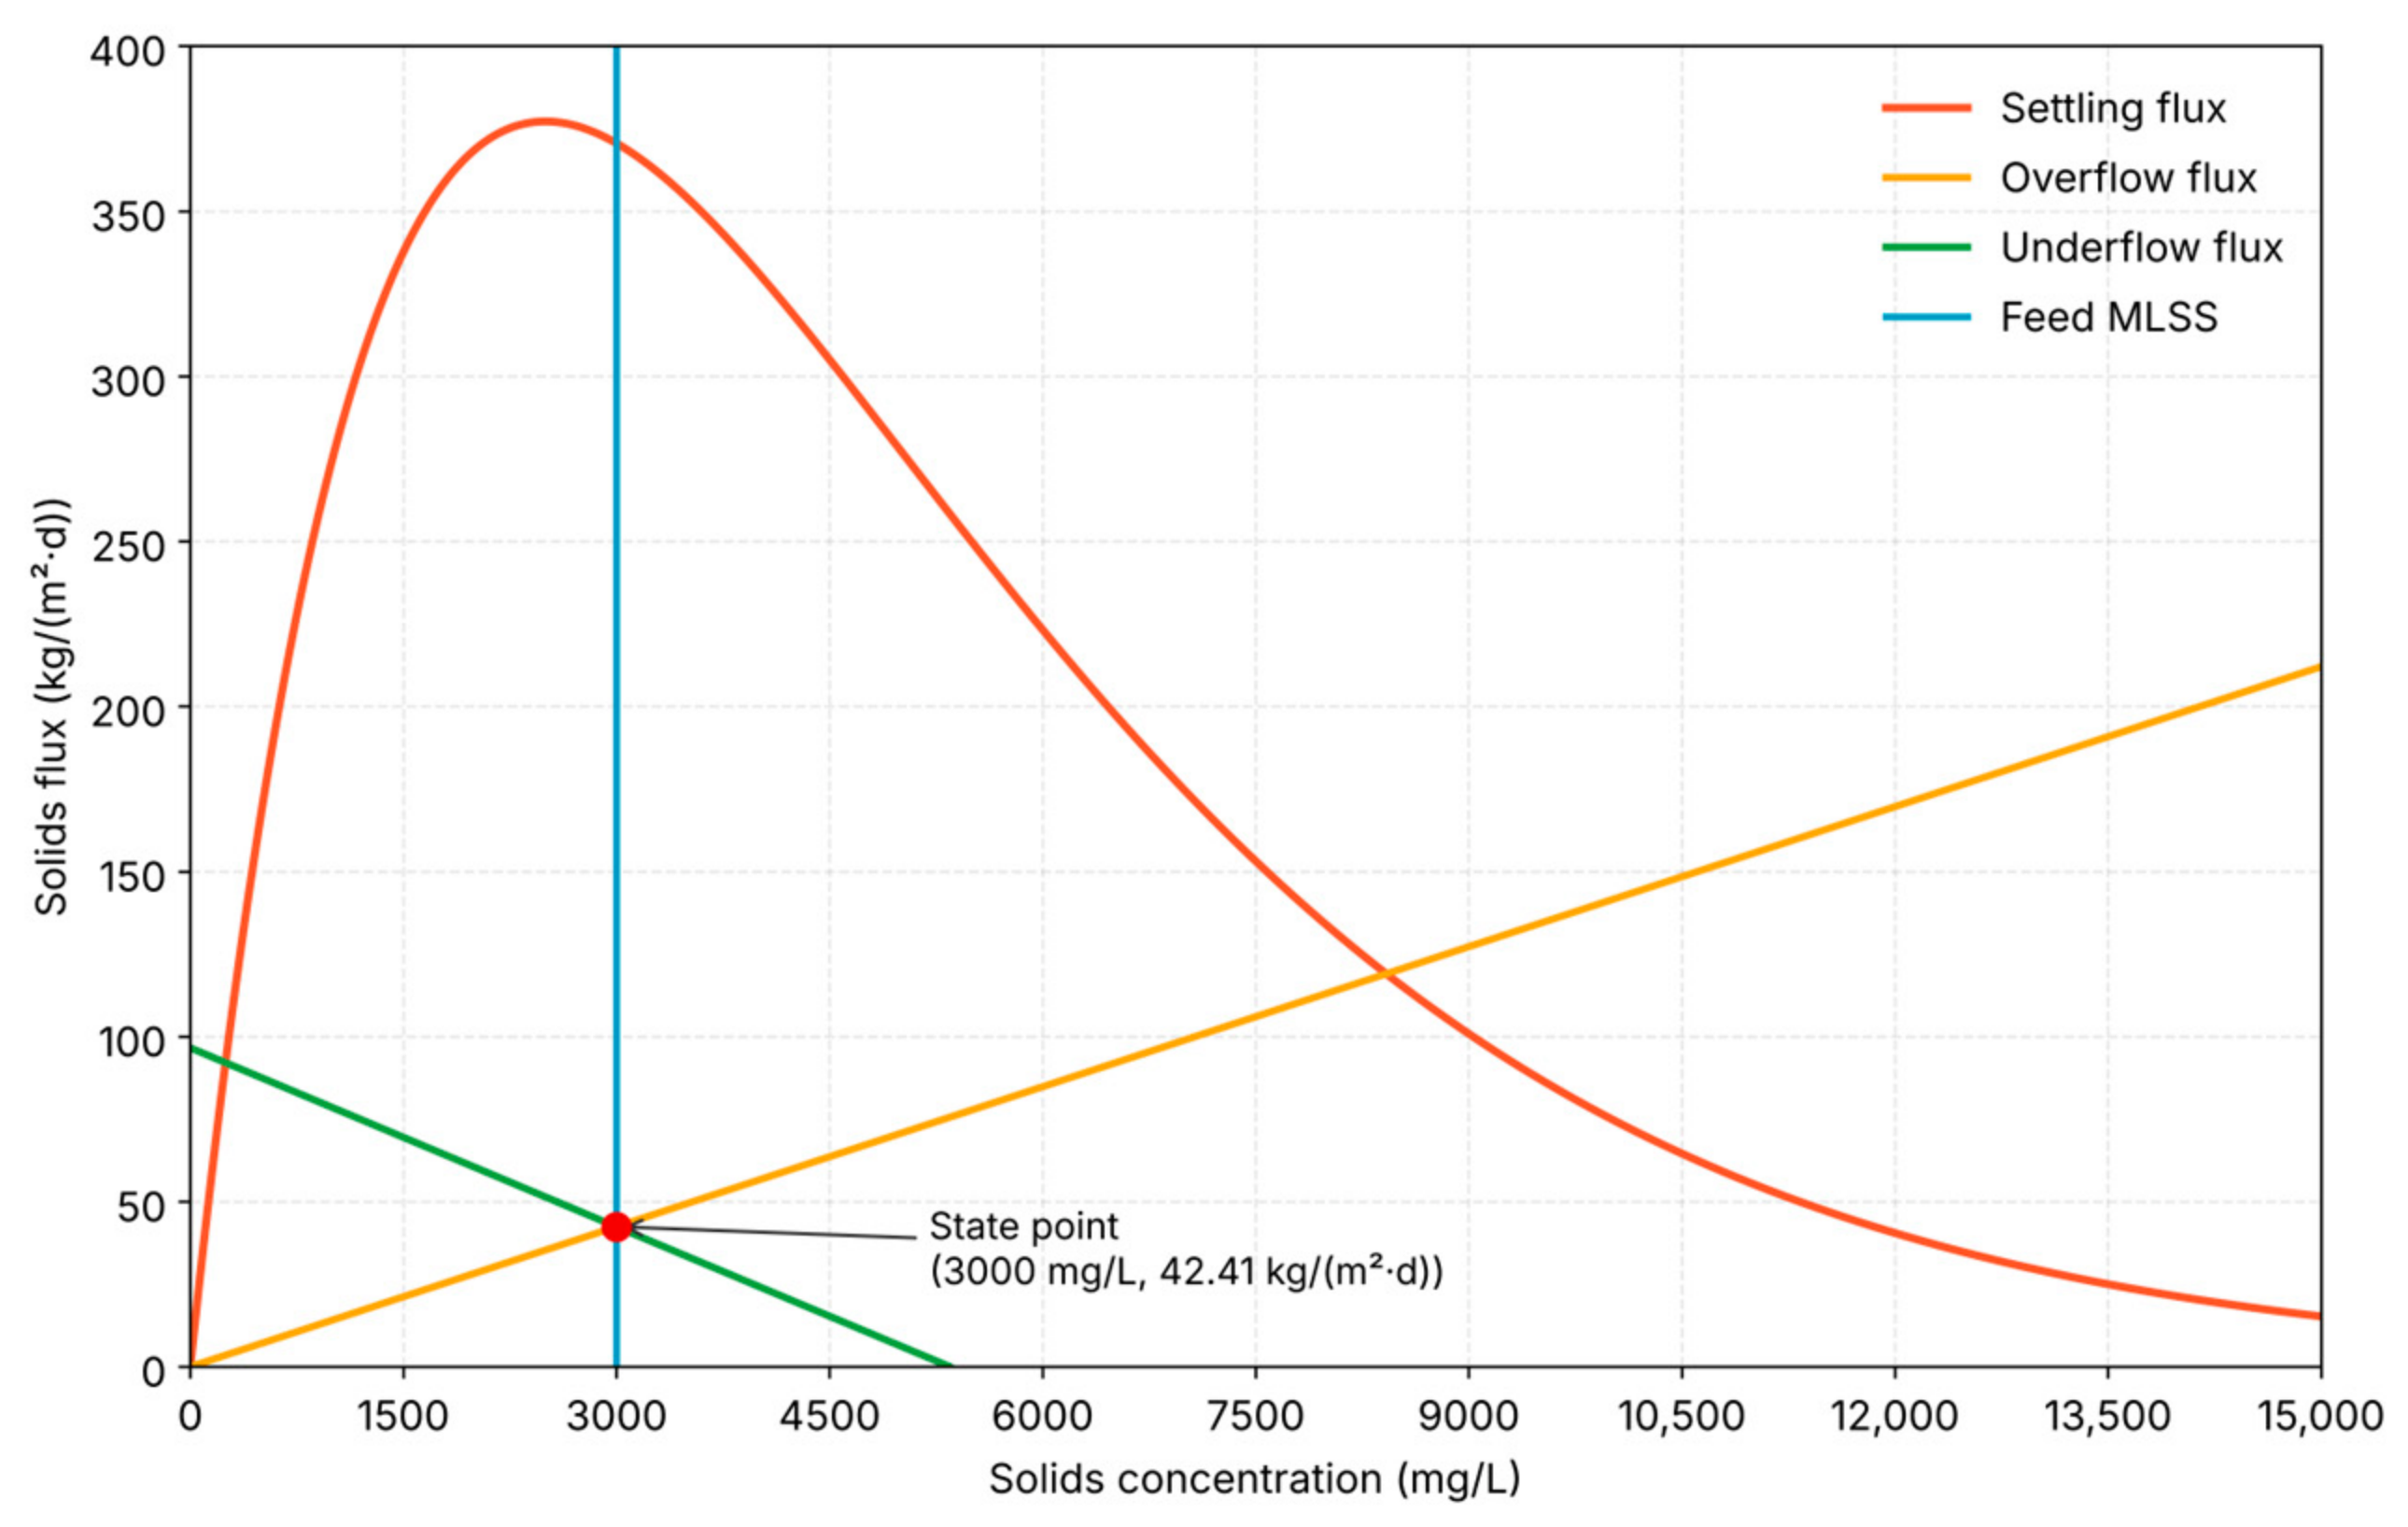
3/day during the event; this is confirmed by the secondary-clarifier flow balance reported in
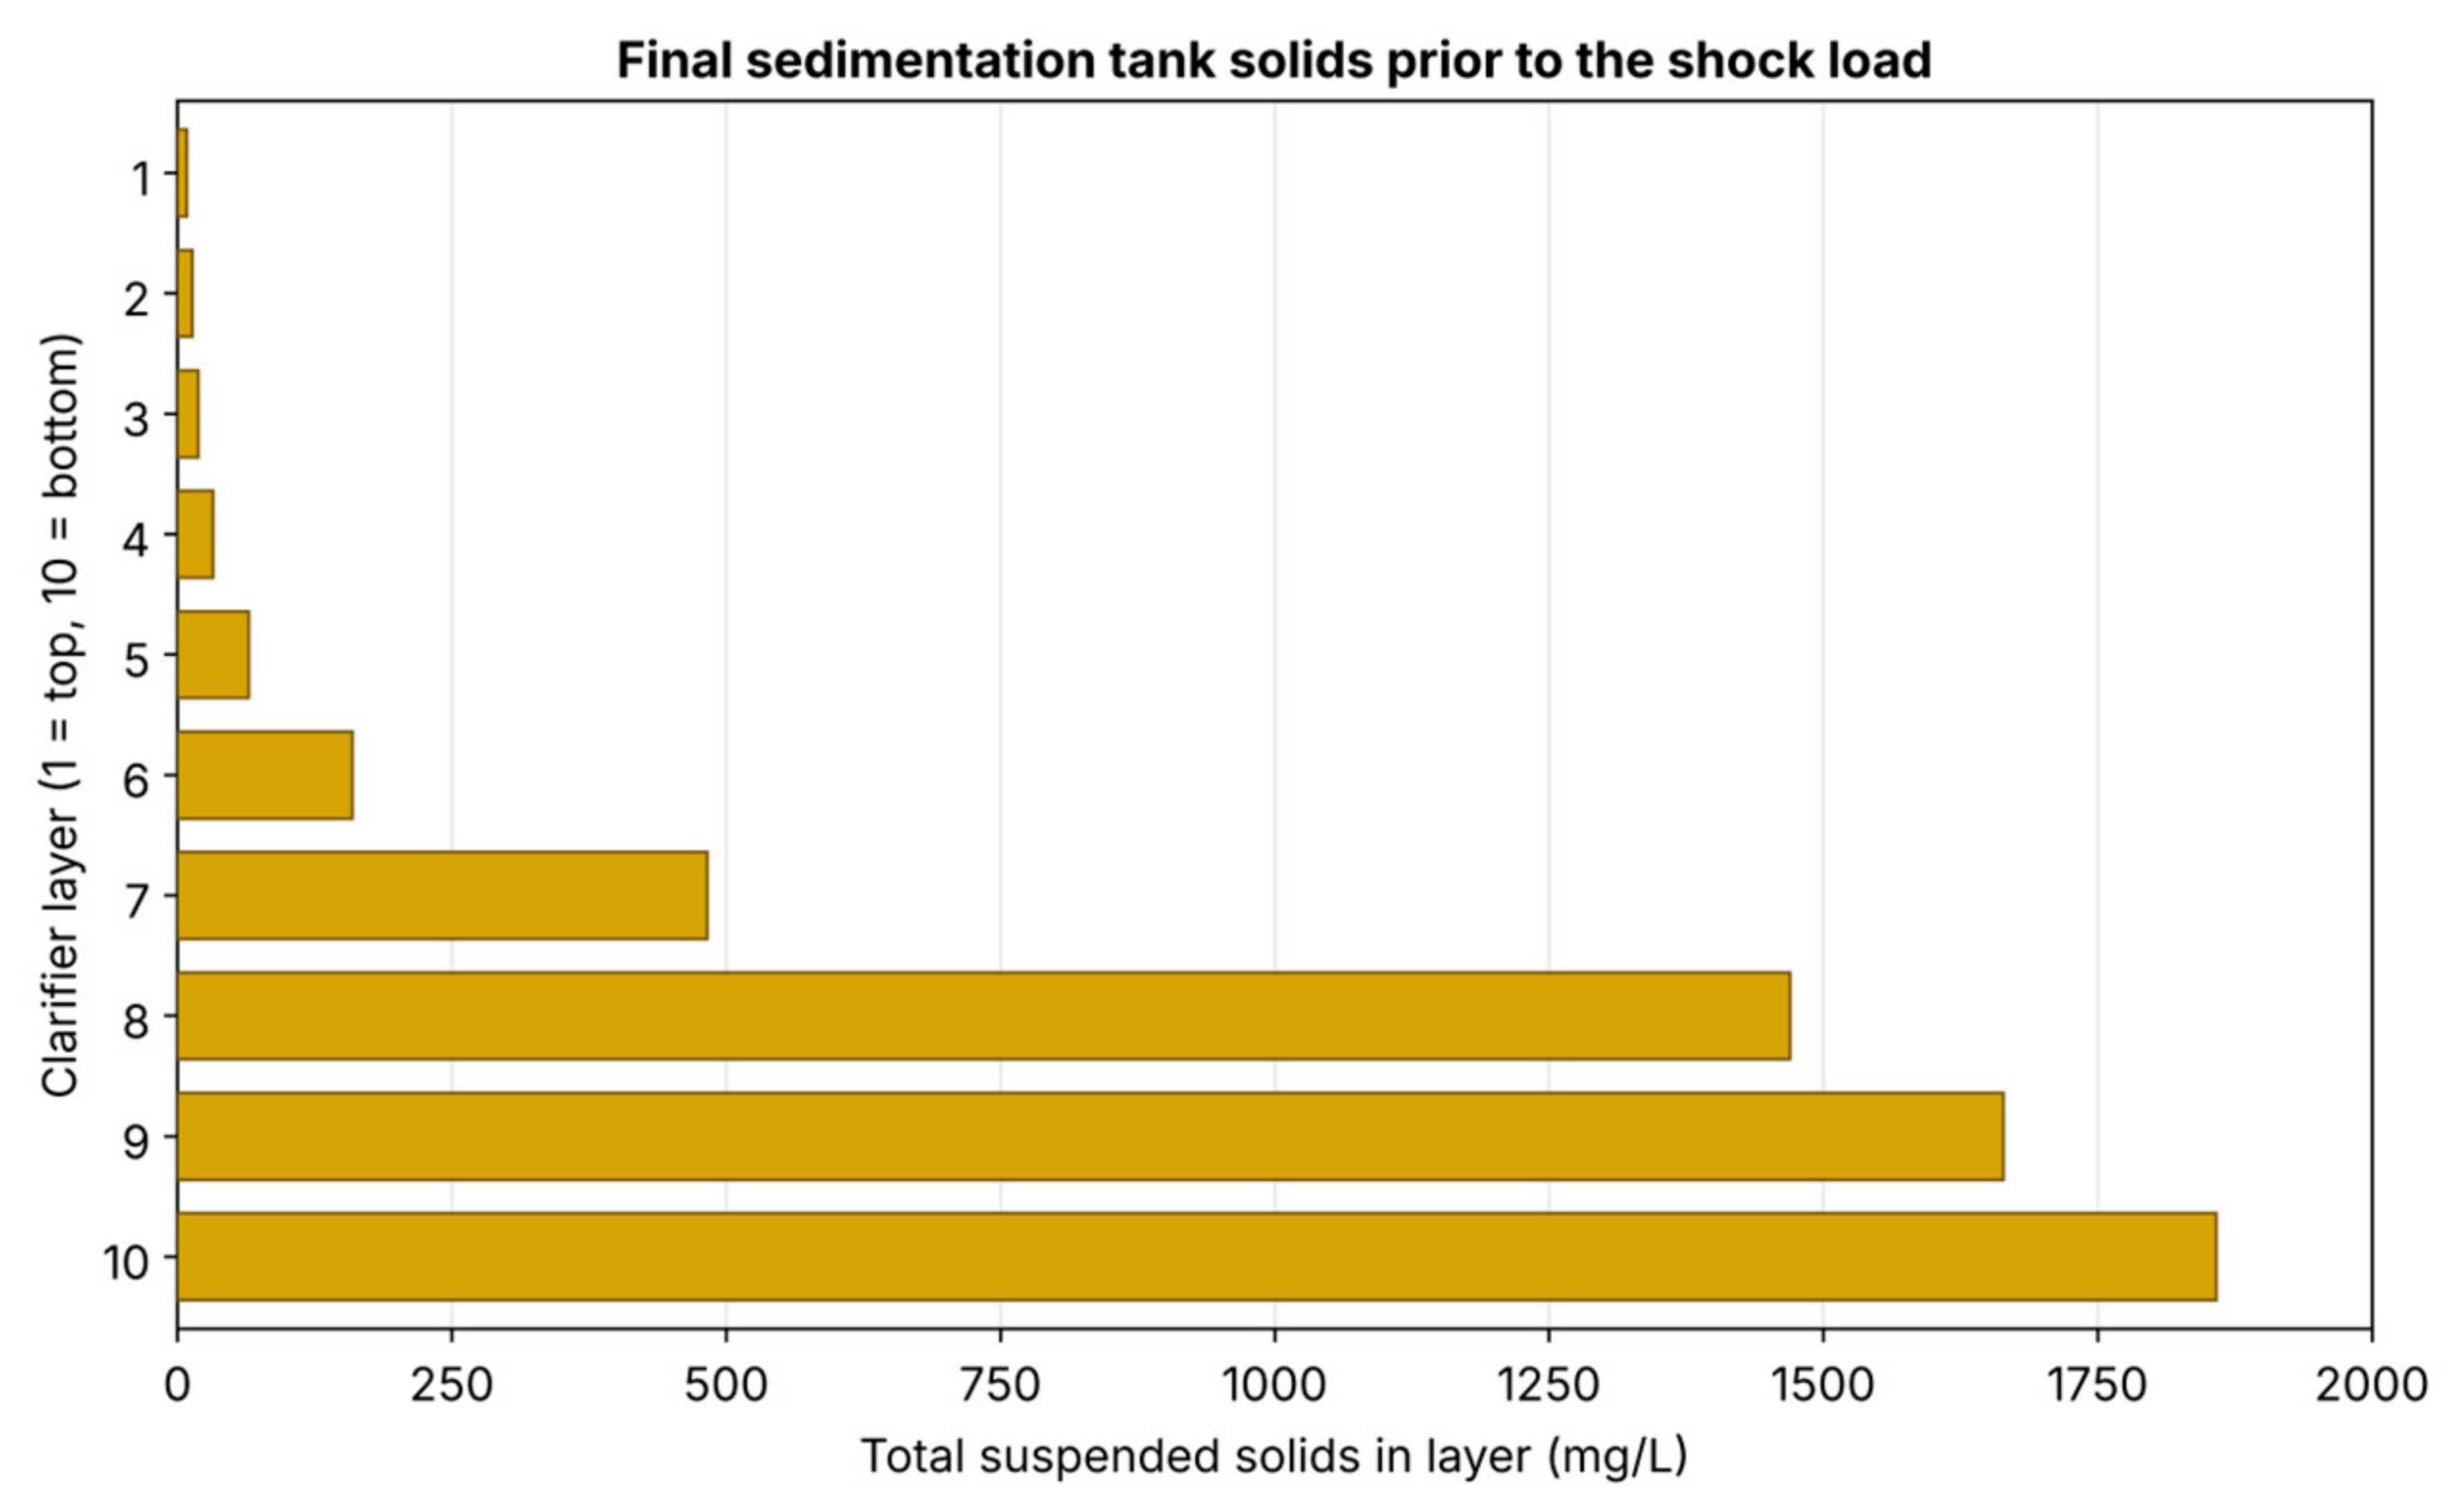
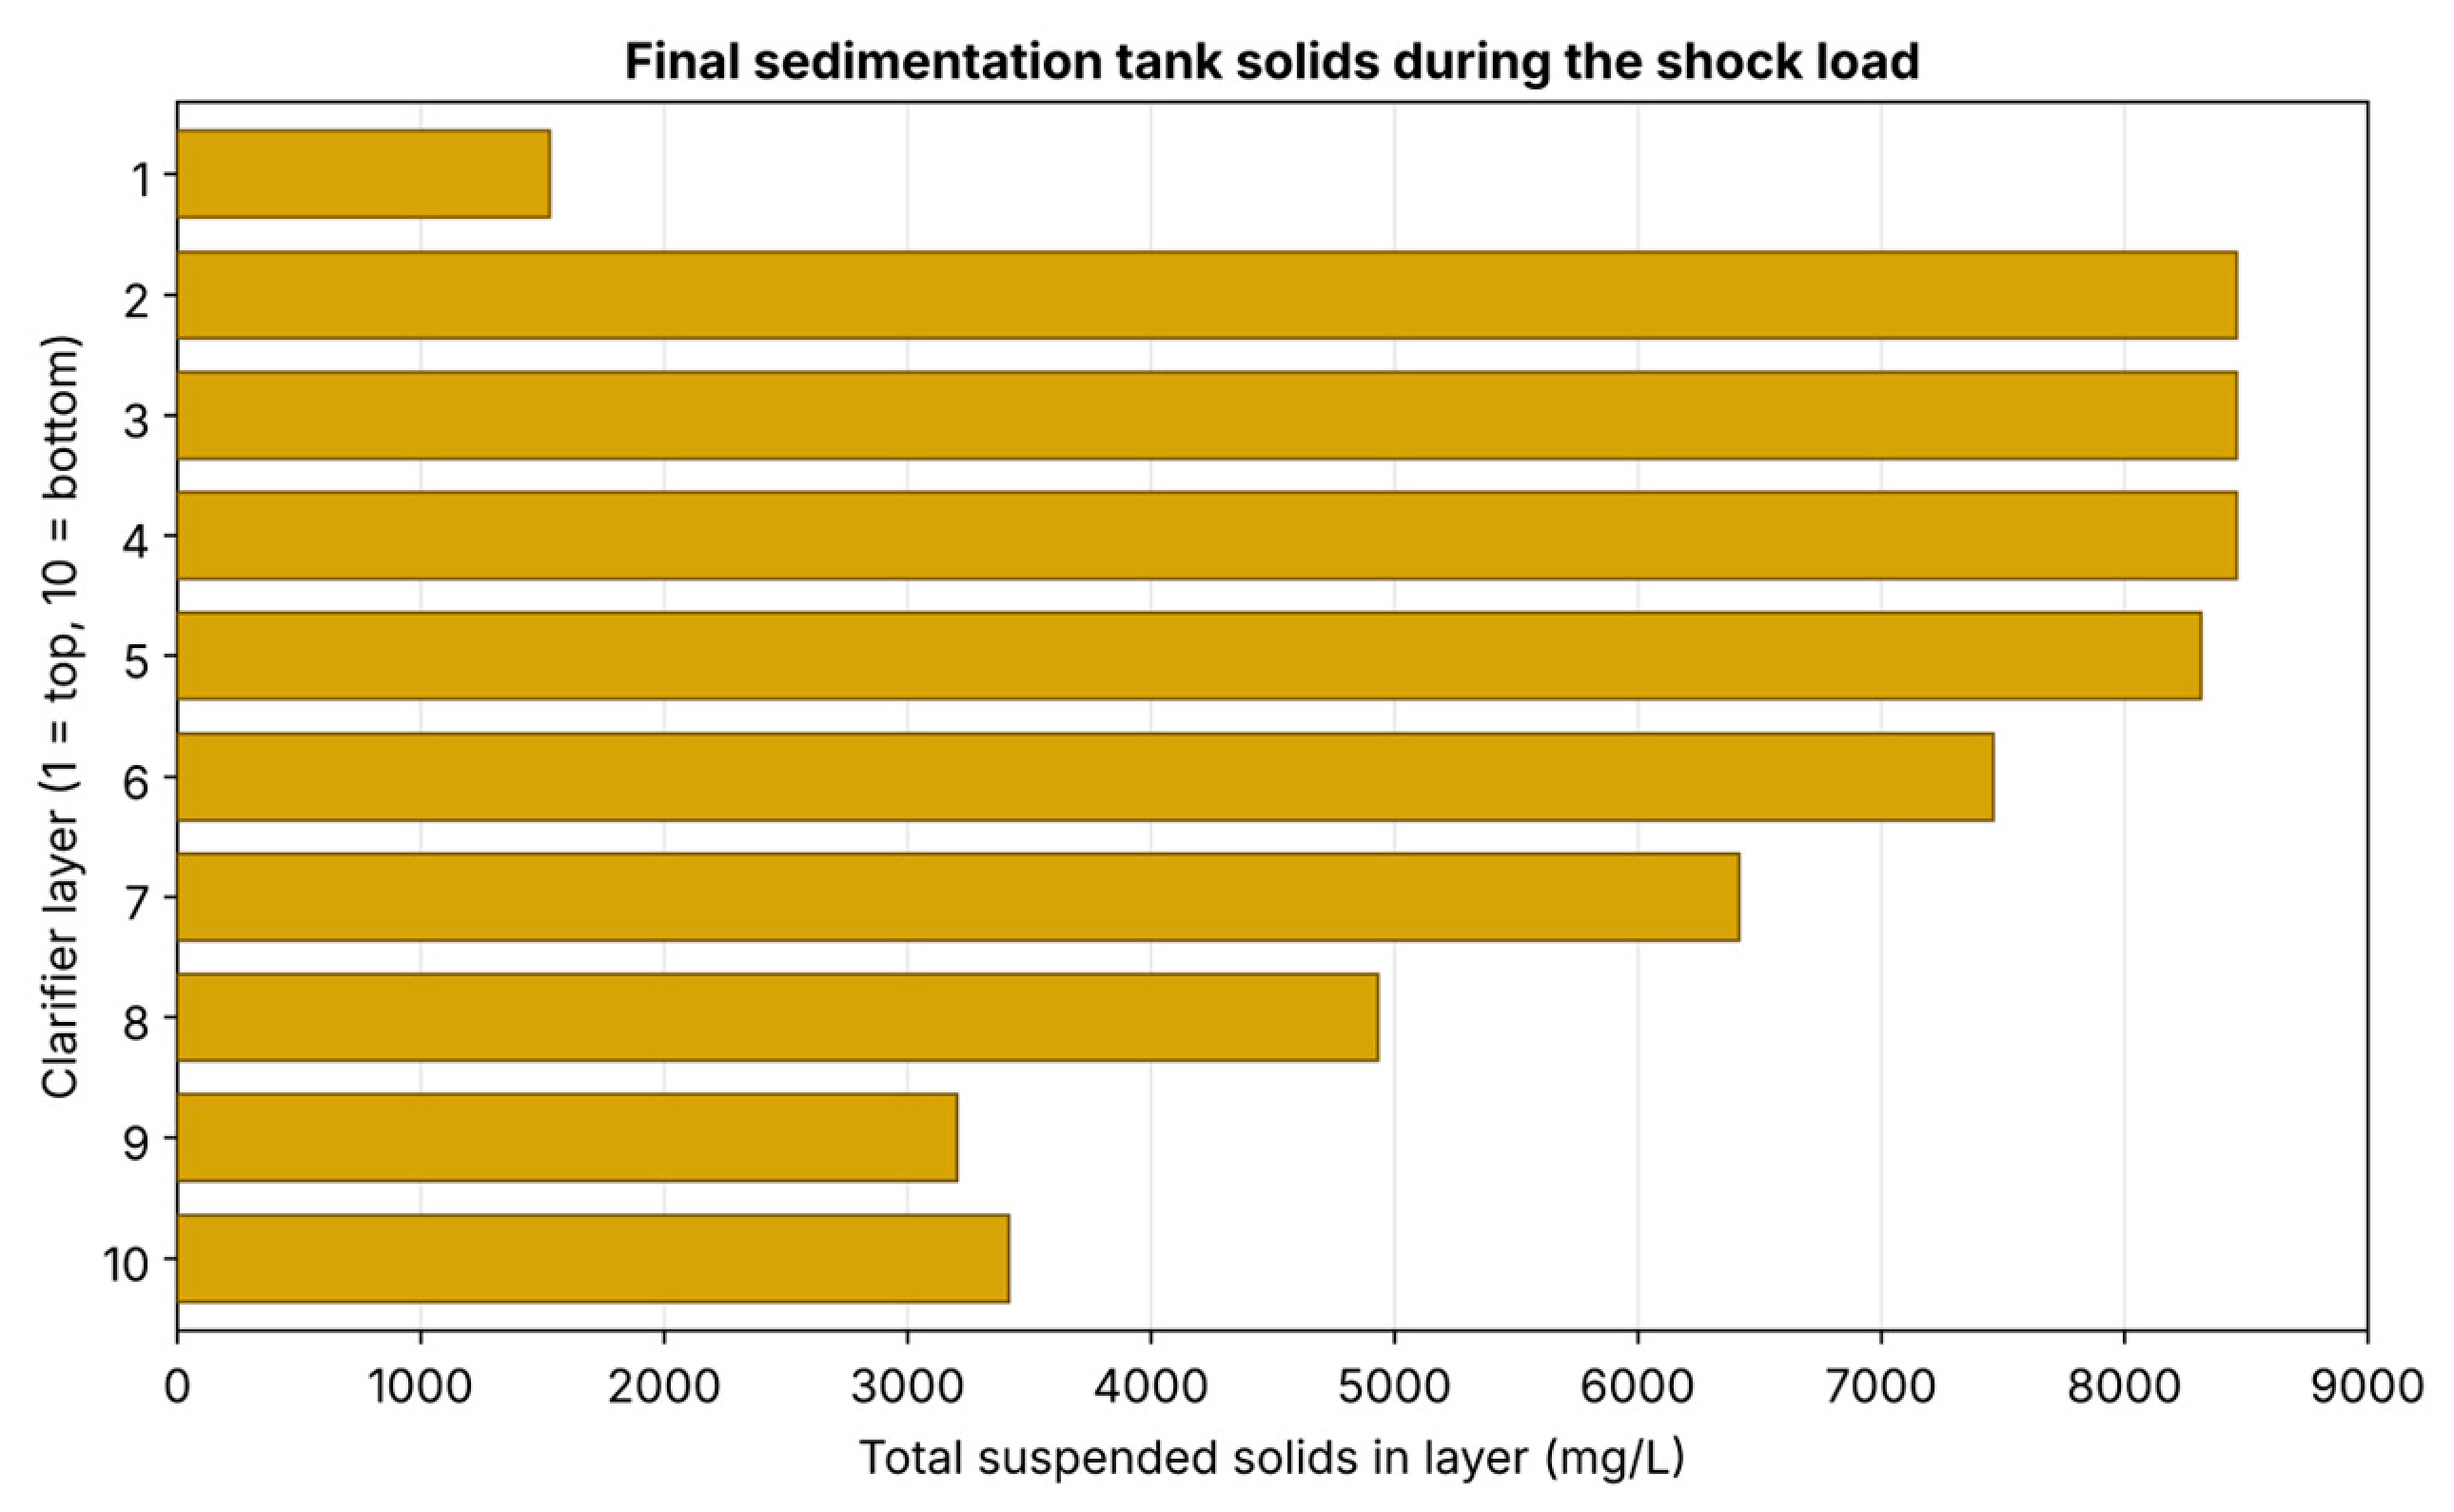
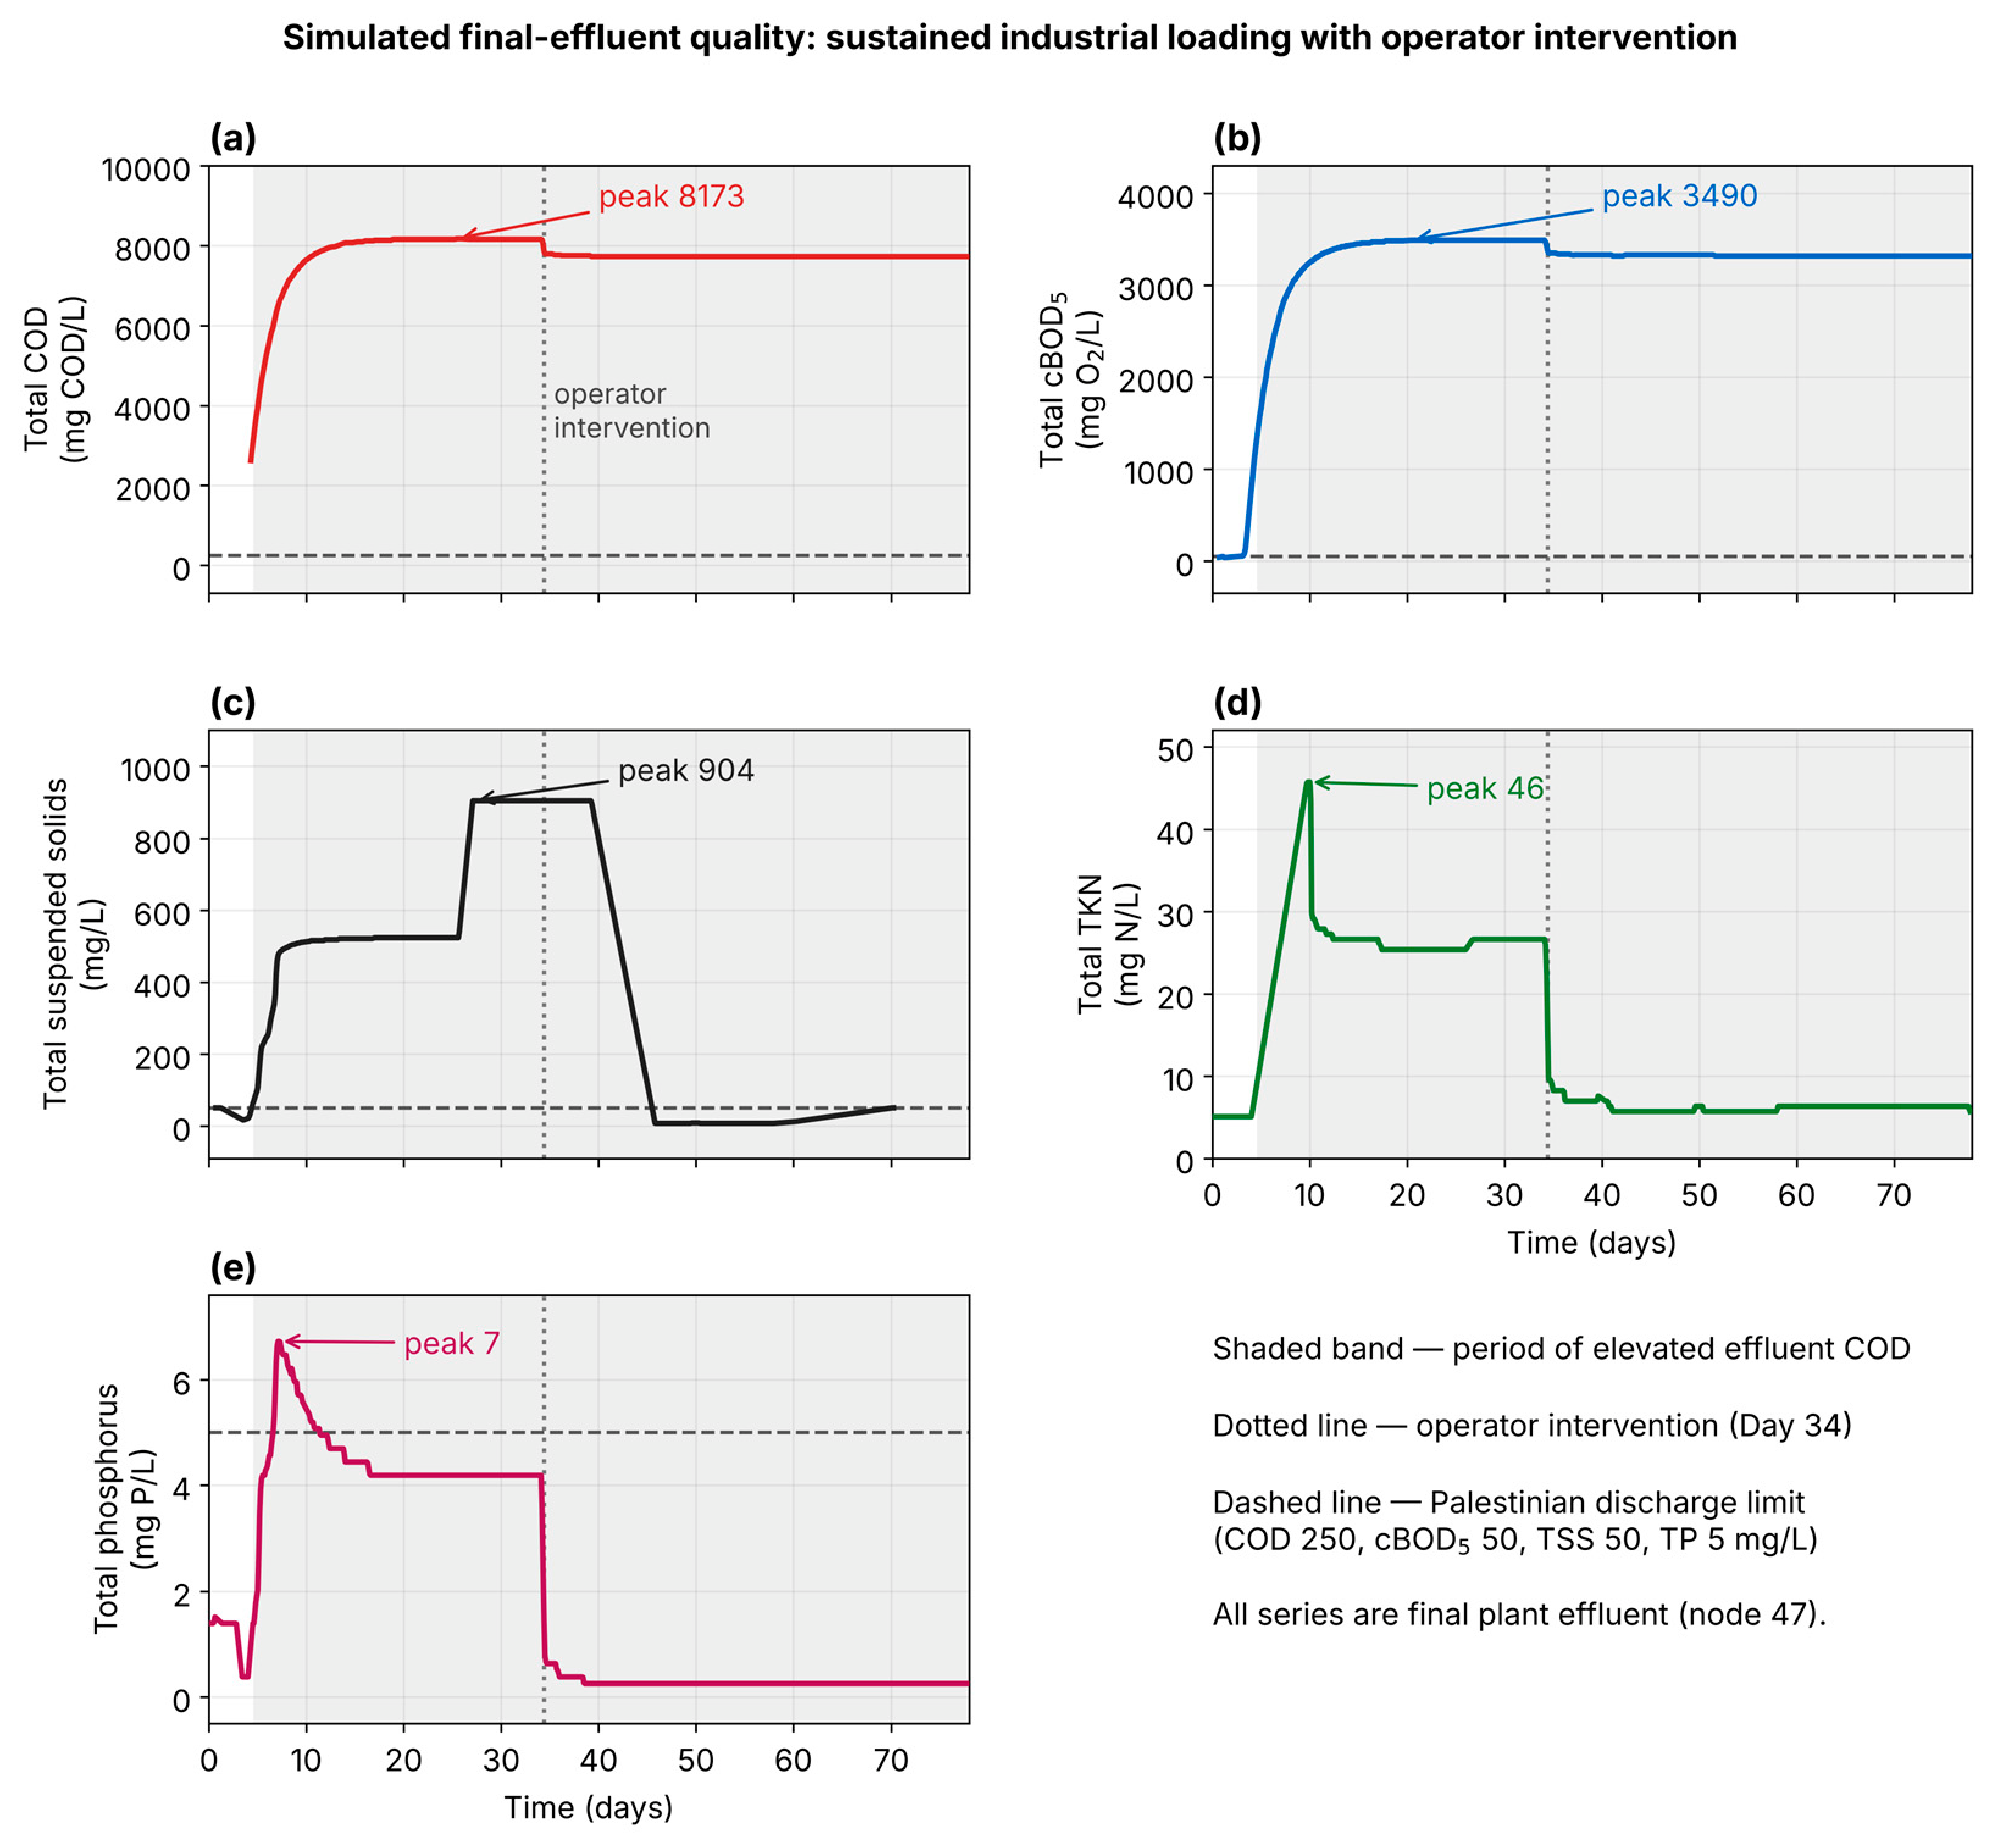
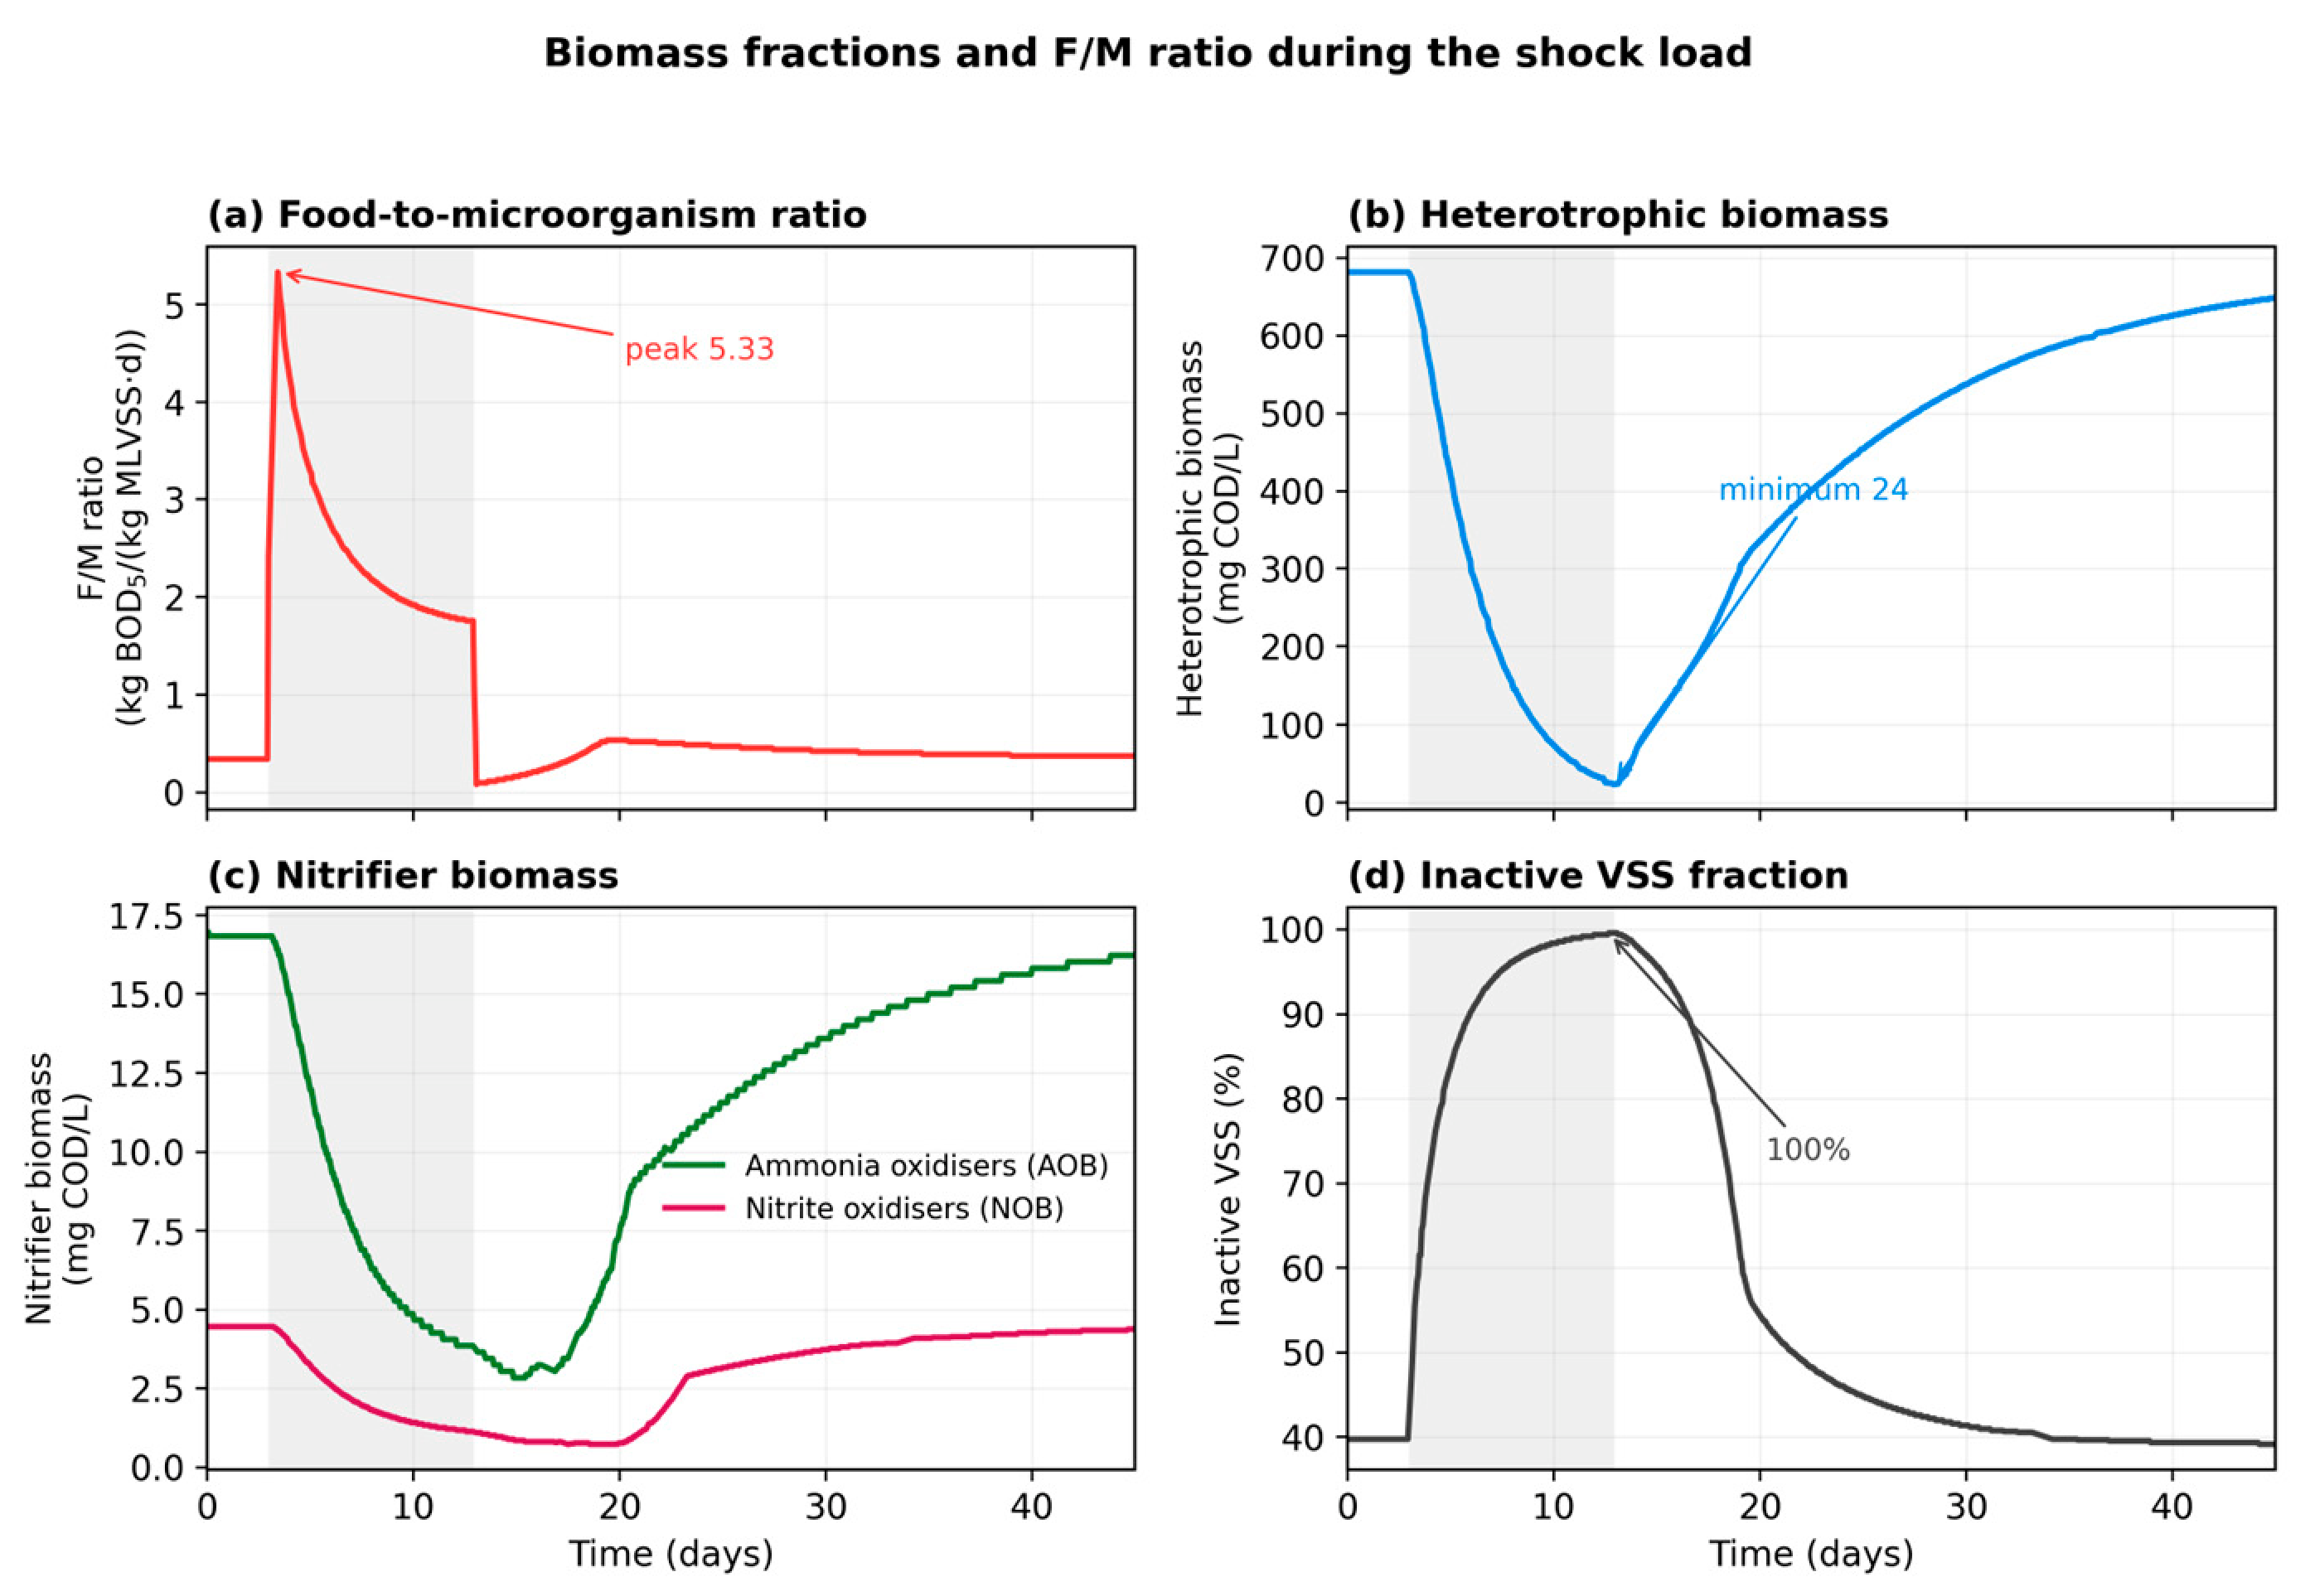
Section 3.5. The effluent quality trajectory, microbial population dynamics, clarifier behavior, and recovery kinetics were tracked over the simulation period.
In addition to the primary worst-case shock-load scenario (1000 m3/day of untreated industrial effluent over ten days), two supplementary scenarios were simulated to define operational thresholds and improve the practical relevance of the findings for plant operators and regulators: (a) a moderate shock load of 500 m3/day of industrial effluent over five days, representing a partial pretreatment failure or a single-factory discharge event; (b) a brief high-intensity shock of 1000 m3/day over three days, simulating an emergency bypass or accidental spill of short duration. These scenarios were designed to identify the threshold conditions under which the JIFZ-WWTP retains the capacity for self-recovery without operator intervention, and to distinguish transient disturbances from events that require active emergency management. All shock-load results should be interpreted as worst-case stress tests of plausible upper-bound industrial inputs rather than as predictions of routine operating conditions.