


Abstract
Joint refill of cascade reservoirs must balance flood control safety against water conservation and hydropower generation, yet conventional operation applies fixed flood-limiting water levels that ignore the time-varying nature of flood risk within a flood season. Existing refill optimization models rarely embed flood season staging as time-varying operational constraints, which limits their ability to capture stage-dependent flood risk and refill opportunity, particularly in cascades headed by a large regulating reservoir. This study develops a framework that identifies flood season stages via the mean change-point method across multiple hydrological stations, transforms the stage boundaries into time-varying water-level constraints, and embeds them in a genetic algorithm-based joint refill optimization model for the Dadu River cascade in southwestern China. Applied to a 65-year inflow record, the framework consistently identifies early August as the main-to-post-flood transition and a secondary autumn flood rebound from mid-September to early October. Relative to the design scheme based on approved conventional operating rules and fixed flood-limiting water level controls, the optimized operation increases the multi-year average total generation of the five-station cascade by 10.08%, from 507.98 × 10⁸ kWh to 559.16 × 10⁸ kWh, while achieving a 100% filling rate at the leading Shuangjiangkou reservoir and maintaining acceptable flood storage during the post-flood period. By demonstrating that within-year inflow trend substantially modulates refill outcomes, especially when annual inflow volumes are comparable, the framework offers differentiated refill strategies and a transferable approach for cascade systems with newly commissioned leading reservoirs in monsoon-driven basins.
1. Introduction
Hydropower remains the largest renewable source of electricity worldwide, and its role in decarbonizing energysystems continues to grow [1]. In mountainous river basins, hydropower is commonly developed through cascades of reservoirs whose coordinated operation can substantially increase energy yield and operational reliability compared with individual plant scheduling [2]. The end-of-flood-season refill of such cascades embodies a persistent operational conflict: advancing refill gains generation and water supply but increases flood exposure, whereas delaying it may leave storage unfilled before the dry season. This conflict is amplified in cascade systems because the refill decision of an upstream reservoir alters the flow regime and refill opportunity of every downstream station. Resolving it requires recognizing that flood risk is not uniform across the flood season but varies among sub-periods with distinct flood frequencies—a concept known as flood season staging.
The optimization of multireservoir operation has been studied for several decades. Early work relied on dynamic programming (DP) and its variants [3,4,5], but the dimensionality of real cascade systems limited their application. Heuristic and evolutionary algorithms subsequently emerged as practical alternatives. Oliveira and Loucks [6] demonstrated that genetic algorithms (GAs) could derive effective operating policies for multireservoir systems, and Wardlaw and Sharif [7] systematically evaluated GA configurations on benchmark problems, showing that real-coded GAs with tournament selection and uniform crossover performed well. Applications followed in diverse settings [8,9,10]. More recent efforts have coupled GAs with stochastic inflow representation, linked them with DP, and incorporated multiple objectives such as ecological flow and climate adaptation [11,12,13]. Coban [14] showed that coordinated cascade operation increased revenue by 18% relative to individual scheduling at a Turkish hydropower cascade, while Hunt et al. [15] demonstrated that reservoir filling strategies in Brazil significantly affect downstream flow and power generation. These studies confirm that evolutionary optimization is robust across basin settings, but most treat flood-season water level limits as fixed rather than time-varying, which constrains the refill solution space.
A parallel line of research addresses flood season staging—the division of the flood season into sub-periods with distinct flood frequencies. Rather than applying a single flood-limited water level (FLWL) throughout, staging permits stage-specific limits that better match the seasonal flood regime. Such regimes are increasingly recognized as non-stationary and spatially heterogeneous under changing precipitation, population, and land cover, and recent advances in remote sensing, geographic information systems (GIS), multi-criteria decision analysis (MCDA), and machine learning have substantially improved the characterization of flood susceptibility and resilience. Tayyab et al. [16] coupled a GIS-based analytic hierarchy process (AHP) with remote sensing and random-forest/XGBoost classifiers to assess susceptibility to riverine, urban, and flash floods, and Hussain et al. [17] developed a capacity-based flood resilience model that combines machine learning with GIS-based MCDA to integrate hazard susceptibility with coping, adaptive, and transformative capacities. Extending these predominantly contemporary maps toward future conditions, Rahman et al. [18] projected the spatiotemporal dynamics of flood susceptibility under future precipitation variability, population growth, and land-cover change, revealing how the location and extent of high-susceptibility areas shift across scenarios. These frameworks resolve the spatial—and increasingly spatiotemporal—distribution of flood risk across landscapes, whereas flood season staging resolves the temporal distribution of risk within a single flood season; the two perspectives are complementary. Liu et al. [19] applied probability change-point analysis to segment the flood season at the Three Gorges reach, and Jiang et al. [20] combined fuzzy clustering, change-point analysis, and statistical graphics in an ensemble framework. The mean change-point method is conceptually straightforward and has been widely applied; multiple change points can be identified by recursive application [21]. Staging results have been used to adjust FLWLs and assess flood resource utilization [22,23], and dynamic control methods that incorporate forecast information have further advanced the field [24]. Nevertheless, staging studies typically focus on a single reservoir and on determining stage boundaries or FLWL values, rather than on embedding the staging results directly into a cascade-wide refill optimization.
Joint refill of cascade reservoirs has received increasing attention. Liu et al. [25] derived refill operating rules using a DP-based neural network model, and Zhou et al. [26] proposed a multi-objective framework for joint refill of the Jinsha–Three Gorges cascade, showing that synchronous refill rules increased hydropower by 3.25% without raising flood risk. He et al. [27] coupled parallel dynamic programming with importance sampling and successive approximation for an 11-reservoir impoundment problem, while Zhou et al. [28] used an evolutionary algorithm with successive approximation to boost output from 21 cascade reservoirs. Seasonal streamflow forecasts have also been explored to support impoundment decisions [29]. Beyond refill, coordinated cascade operation has also been pursued through multi-objective optimization and intelligent dispatch. Yuan et al. [30] coupled the NSGA-II algorithm with a TOPSIS evaluation model to jointly optimize power generation, ecological flow shortage, and navigation disruption for a cascade in the lower Jinsha River; Mou et al. [31] developed an offline-calculation and online-search method for joint sluice operation of the middle-reach Dadu cascade under high-intensity peak shaving and frequency regulation, reducing the number of gate adjustments by 43.5%; and Yang et al. [32] summarized the intelligent dispatch practice of the Dadu cascade as a “precision forecasting–risk-informed dispatch–cooperative control” chain that integrates physics- and data-driven runoff forecasting with multi-unit real-time control. These studies have respectively advanced multi-objective daily scheduling, short-term sluice regulation, and basin-level dispatch system construction, but they either treat flood-limiting water levels as fixed operational conditions, operate at daily or shorter time scales driven by power-grid load demand, or emphasize system construction rather than a physically constrained long-term refill trajectory.
Three gaps remain. First, flood season staging and cascade refill optimization are often treated separately; embedding stage-specific water level constraints directly into the optimization model has not been systematically explored. Second, the within-year temporal distribution of inflow—such as wet-then-dry or dry-then-wet patterns—can substantially influence refill success, particularly when annual runoff volumes are comparable, yet this dimension is rarely incorporated into refill strategy design. Third, existing refill studies concentrate on a small number of large systems, and evidence from cascade configurations with a newly commissioned leading reservoir is limited.
This study addresses these gaps using the Dadu River cascade in southwestern China, a “three-reservoir five-station” system headed by the Shuangjiangkou reservoir, which is scheduled for operational commissioning in June 2026 and controls over half of the basin area. As the leading reservoir of the cascade, Shuangjiangkou is expected to substantially modify downstream flow regimes after commissioning. The main contributions are threefold. First, flood season staging is identified using the mean change-point method across four hydrological stations, providing basin-consistent stage boundaries and characterizing the autumn flood rebound. Second, the staging results are directly embedded into a cascade refill optimization model as time-varying water-level constraints, rather than being used only for post hoc determination of FLWLs. Third, refill performance is evaluated not only by hydrological year class but also by within-year inflow trend, leading to differentiated water level strategies for wet, normal, and dry years together with an associated flood control risk assessment.
2. Materials and Methods
2.1. Study Area
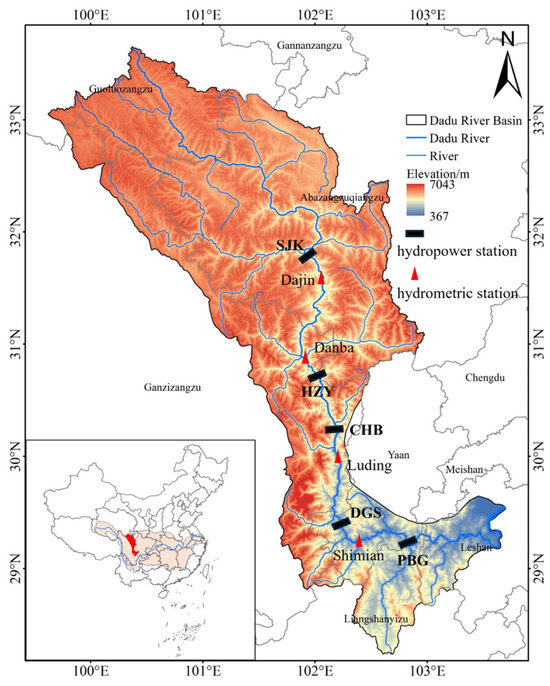
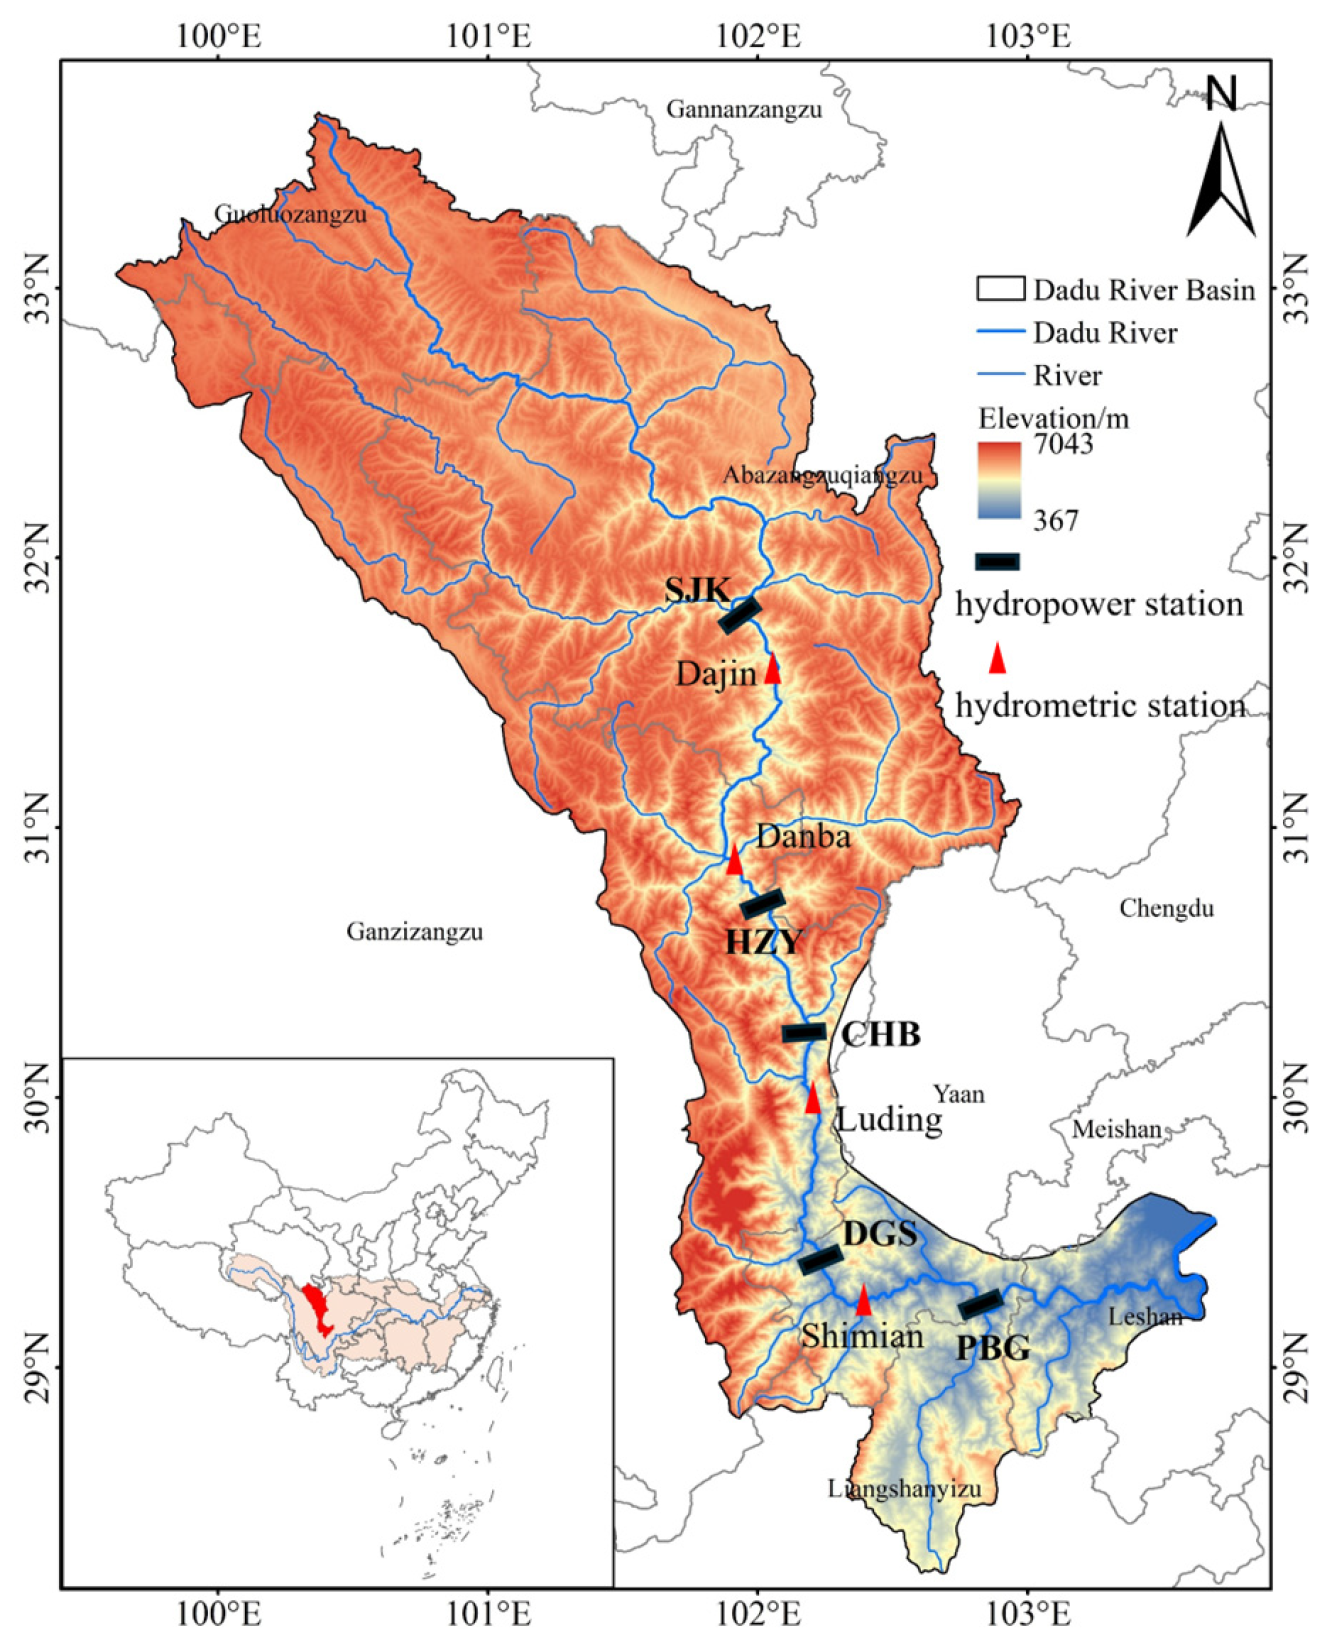
The Dadu River, a tributary of the Min River in the upper Yangtze basin, drains approximately 77,400 km2. Its main stem has been developed into a cascade of 16 hydropower stations with a combined installed capacity of about 18,916 MW. This study focuses on the “three-reservoir five-station” system, which comprises three regulating reservoirs—Shuangjiangkou (SJK), Houziyan (HZY), and Pubugou (PBG)—and two run-of-river stations, Changheba (CHB) and Dagangshan (DGS), located between Houziyan and Pubugou (Figure 1). The topological sequence is SJK → HZY → CHB → DGS → PBG.
Figure 1.
Geographical location of the Dadu River Basin and the spatial distribution of the “three-reservoir five-station” cascade system, including hydropower stations/reservoirs and hydrometric stations.
Shuangjiangkou is the leading reservoir of the cascade, situated approximately 2 km below the confluence of the Zumuzu and Chuosijia rivers. It controls a drainage area of 39,330 km2; its normal pool level (NPL) is 2500 m, dead water level 2420 m, and active storage 19.17 × 10⁸ m3, providing annual regulation. Because of its large storage and upstream position, Shuangjiangkou can store early post-flood flows and release them gradually, thereby altering the hydrological regime experienced by all downstream stations. Houziyan, located downstream, has an active storage of 3.87 × 10⁸ m3 and seasonal regulation, whereas Pubugou, the largest reservoir by total storage in the middle reaches with an NPL of 850 m and serves as the cascade’s core flood control reservoir. Changheba and Dagangshan are run-of-river stations that maintain inflow–outflow balance. Key parameters are summarized in Table 1.
Table 1.
Key parameters of the reservoirs and hydropower stations in the Dadu River cascade.
2.2. Data
Daily discharge data from four hydrological stations—Dajin, Danba, Luding, and Shimian—covering the flood season (May–October) for 1957–2021 (65 years) are used for flood season staging. The locations of the four hydrological stations are illustrated in Figure 1. For the optimization model, ten-day mean inflow series at the Shuangjiangkou dam site and at each intermediate interval for the same 65-year period are used.
2.3. Mean Change-Point Method
The mean change-point method identifies the point at which the mean of a time series shifts significantly. For a sequence of daily flood season discharges x1, x2, …, xn, a candidate change point at position k divides the series into two contiguous segments of lengths k and n − k with sample means and and grand mean . The within-segment (residual) sum of squares is:
and the between-segment sum of squares, which serves as the change-point statistic, is:
where is the overall mean. . The change point is the value of k = argmaxkSb(k). The significance of the shift is tested by comparing the maximum value of the statistic against a critical value derived from its distribution under the null hypothesis of no change [21]. Multiple change points are identified by recursively applying the test to each segment until no further significant shift is detected. The method is applied independently to each of the four stations, and the consistency of stage boundaries across stations is examined.
3. Model Building
3.1. Modeling Framework
The joint refill model couples flood season staging with GA-based optimization through a five-step closed loop. First, the mean change-point method partitions the flood season into pre-flood, main-flood, and post-flood stages using multi-station daily discharge records. Second, the identified stage boundaries are combined with approved flood control requirements to construct stage-specific upper water level limits for each reservoir. Third, these limits are encoded as time-varying upper-bound constraints in the optimization model, directly linking the staging results to the feasible solution space. Fourth, the GA searches for the optimal ten-day water level trajectories of the three regulating reservoirs that maximize total cascade generation subject to physical and operational constraints. Fifth, the optimized schedules are validated through multi-year simulation, typical-year comparison, and classification by within-year inflow trend, and the resulting strategies are assessed for both generation benefit and flood control risk. The model operates at a ten-day time step from the first ten-day period of May to the last ten-day period of April of the following year (36 periods), covering one complete refill–drawdown cycle.
3.2. Objective Function
The objective is to maximize the total hydropower generation of the five-station cascade, including Shuangjiangkou, Houziyan, Changheba, Dagangshan, and Pubugou, over the operation period:
where E is total generation (kWh); Ki is the power coefficient of station i; Qi,j is the turbined release through station i in period j (m3/s); Hi,j is the net head (m); and Δtj is the number of seconds in period j. The net head is computed as the difference between the forebay water level and the tailwater level, with the latter estimated from the release–rating curve at each station.
3.3. Constraints
The model is subject to the following constraints:
- (1)
- Water balance:
Vi,j+1 = Vi,j + (Ii,j − Qi,j − Si,j)⋅Δtj
- (2)
- Stage-specific water level constraints (core of the model):
Table 2.
Water level control conditions of the joint refill optimization model (unit: m).
- (3)
- Turbine capacity and release constraints:
- (4)
- Water level rise/fall rate constraints:
- (5)
- Initial and terminal water level conditions:
- (6)
- Power output constraints:
For the two run-of-river stations (Changheba and Dagangshan), inflow equals outflow on a ten-day basis, and their water levels are held constant.
3.4. GA Solution Procedure
The GA chromosome encodes the ten-day water levels of Shuangjiangkou, Houziyan, and Pubugou as a real-valued vector of length 108 (3 reservoirs × 36 periods). Initial populations are generated randomly within feasible water level bounds. Fitness is evaluated by simulating cascade operation under each chromosome, computing total generation, and applying penalties for violations of water balance, release, and output constraints; penalty coefficients are set sufficiently large (1012) to ensure that infeasible solutions are eliminated during selection.
The GA parameters are set as follows: population size = 500, maximum generations = 1000, maximum stall generations = 100, crossover fraction = 0.7, uniform mutation rate = 0.05, and tournament selection size = 2. For each hydrological year, a dynamic programming (DP)-based feasible solution is used as a seed for the initial population when available, with the remaining individuals generated by perturbation or random sampling within feasible bounds. This seeding strategy ensures reproducibility and reduces premature convergence. The algorithm terminates when the improvement in best fitness over 100 consecutive generations falls below 0.01%, or when the maximum generation is reached. For each hydrological year, the GA was independently executed 30 times with different random seeds, with the DP-based feasible solution included in the initial population of every run, and the best feasible solution among these runs was retained as the final schedule.
3.5. Scenario Design
The model is applied under three sets of scenarios. Multi-year simulation (1957–2021): the model is run for each of the 65 years using observed ten-day inflows, yielding a distribution of refill outcomes and multi-year average water level trajectories.
Typical hydrological years: years corresponding to 25% (wet), 50% (normal), and 75% (dry) annual runoff exceedance probability at the Pubugou dam site are selected. The specific years are 2017–2018, 1976–1977, and 2010–2011, with annual inflows of 447.8 × 10⁸ m3, 417.9 × 10⁸ m3, and 381.5 × 10⁸ m3, respectively. The 25%, 50%, and 75% exceedance probabilities are the standard design frequencies for representative wet, normal, and dry years in engineering hydrology [33].
Inflow trend types: Inflow trend types are classified based on the inflow anomaly at the Pubugou dam site, with October used as the dividing point. The year is divided into two periods: the flood season from May to October and the non-flood season from November to April of the following year. For each period, the inflow anomaly is calculated as the relative deviation of the mean inflow from the long-term mean inflow for the same period. An anomaly greater than 10% indicates a wet condition, while an anomaly lower than −10% indicates a dry condition; anomalies between −10% and 10% are regarded as normal. These thresholds are consistent with the widely used percentage-anomaly classification, in which the normal class spans −10% to +10% [34]. Based on the wet/dry conditions before and after October, within-year inflow patterns are identified, such as wet-then-dry, dry-then-wet, sustained-wet, sustained-dry, or sustained-normal. Dry years are not further subdivided.
4. Results and Discussion
4.1. Flood Season Staging
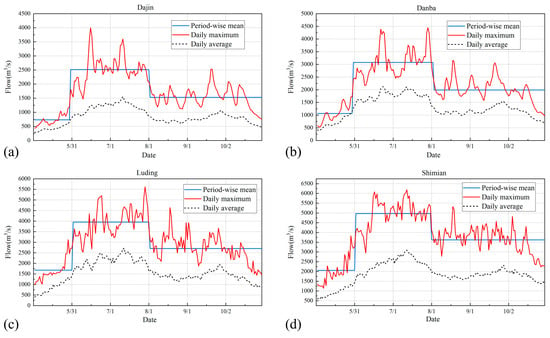
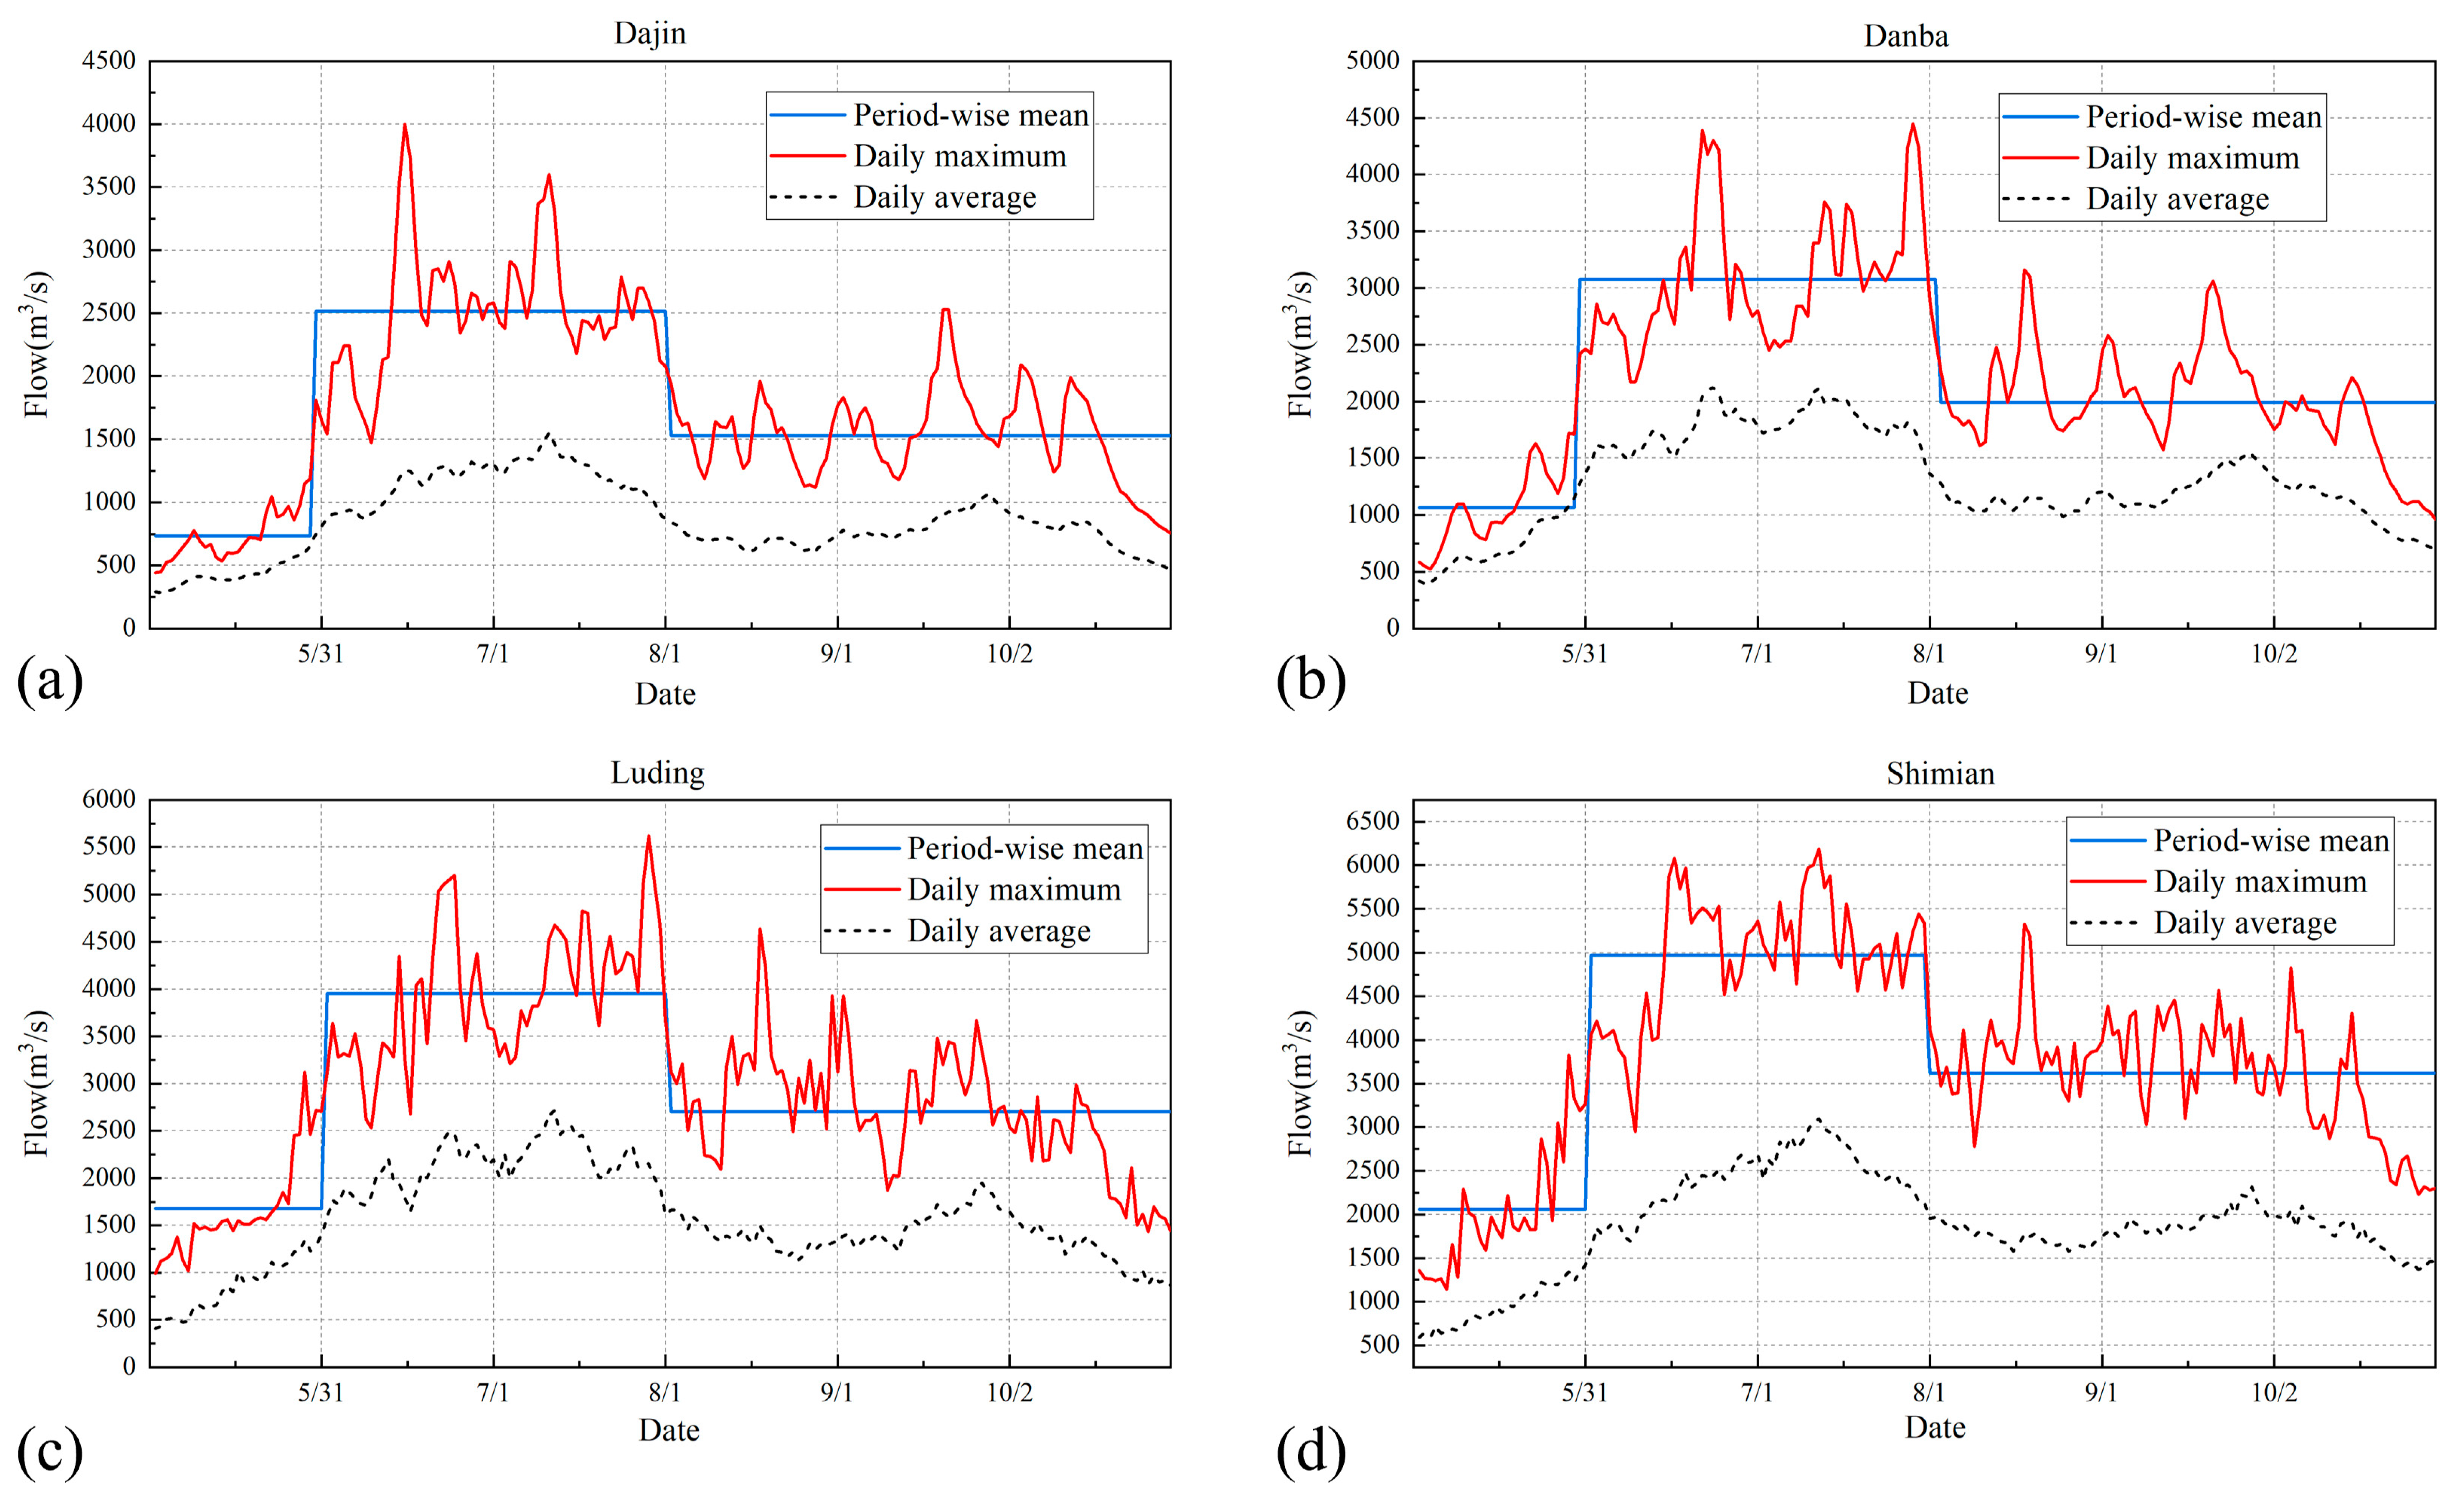
As shown in Figure 2, the mean change-point method identifies three stages at all four stations, confirming early August as the basin-consistent transition from main flood to post-flood. The pre-flood stage spans May, with mean discharges of 734, 1067, 1678, and 2056 m3/s at Dajin (Figure 2a), Danba (Figure 2b), Luding (Figure 2c), and Shimian (Figure 2d), respectively. The main flood stage runs from approximately 31 May to 2 August at Dajin and from 1 June to early August at the other stations, with mean discharges 2.9–3.4 times the pre-flood means. The post-flood stage extends from early August to the end of October, with means declining to 1.6–2.1 times the pre-flood level.
Figure 2.
Daily discharge hydrographs and identified change points at (a) Danba, (b) Dajin, (c) Luding, and (d) Shimian stations.
Examination of ten-day mean discharges within the post-flood stage reveals a secondary increase from mid-September to early October, corresponding to the autumn flood rebound characteristic of rivers in southwestern China. The rebound appears at all four stations and is most pronounced upstream, implying that the leading reservoir must retain flood storage later in the season than a single-stage FLWL would suggest. Flood composition analysis further indicates that floods at Danba are dominated by inflows from the Shuangjiangkou catchment upstream of Dajin, whereas severe encounters between local interval floods and main-stem floods are infrequent. This supports the premise that the leading reservoir can regulate the majority of flood volume reaching downstream stations.
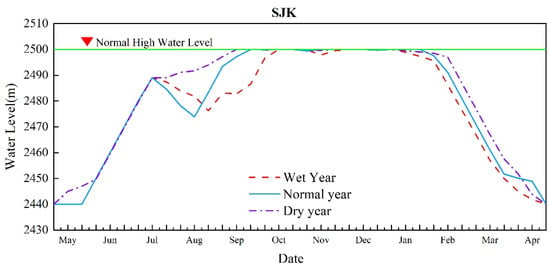
Based on the current flood season water level control regulations for the Dadu River cascade and the staging results above, the water level control conditions for the joint refill optimization model are established (Table 2). The simulation period extends from early May to late April of the following year, covering a complete flood season and the subsequent refill and supply cycle. In accordance with the post-flood stage commencing in early August, both Shuangjiangkou and Pubugou are permitted to begin impounding from August. For Shuangjiangkou, the upper water level limit is set at 2485 m in early July and 2489 m in mid-to-late July to reserve flood storage during the main flood period, and restored to 2500 m from August through April of the following year. For Pubugou, the upper limit is 850 m in May, 836.2 m during June–July, raised to 841 m in August–September to initiate refill, and returned to 850 m from October through April. For Houziyan, the upper limit is maintained at 1835 m from May through early October and raised to 1842 m from late October onward. The two run-of-river stations, Changheba and Dagangshan, are held at constant water levels of 1685 m and 1123 m, respectively. The dead water levels, initial and terminal water levels, and lower water level limits for each reservoir are also specified in Table 2.
4.2. Multi-Year Simulation
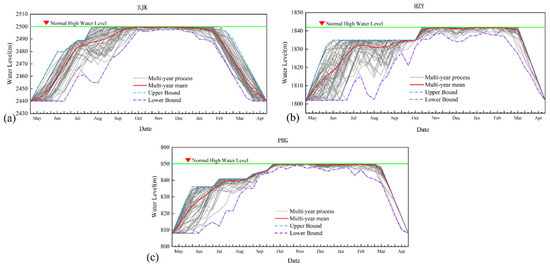
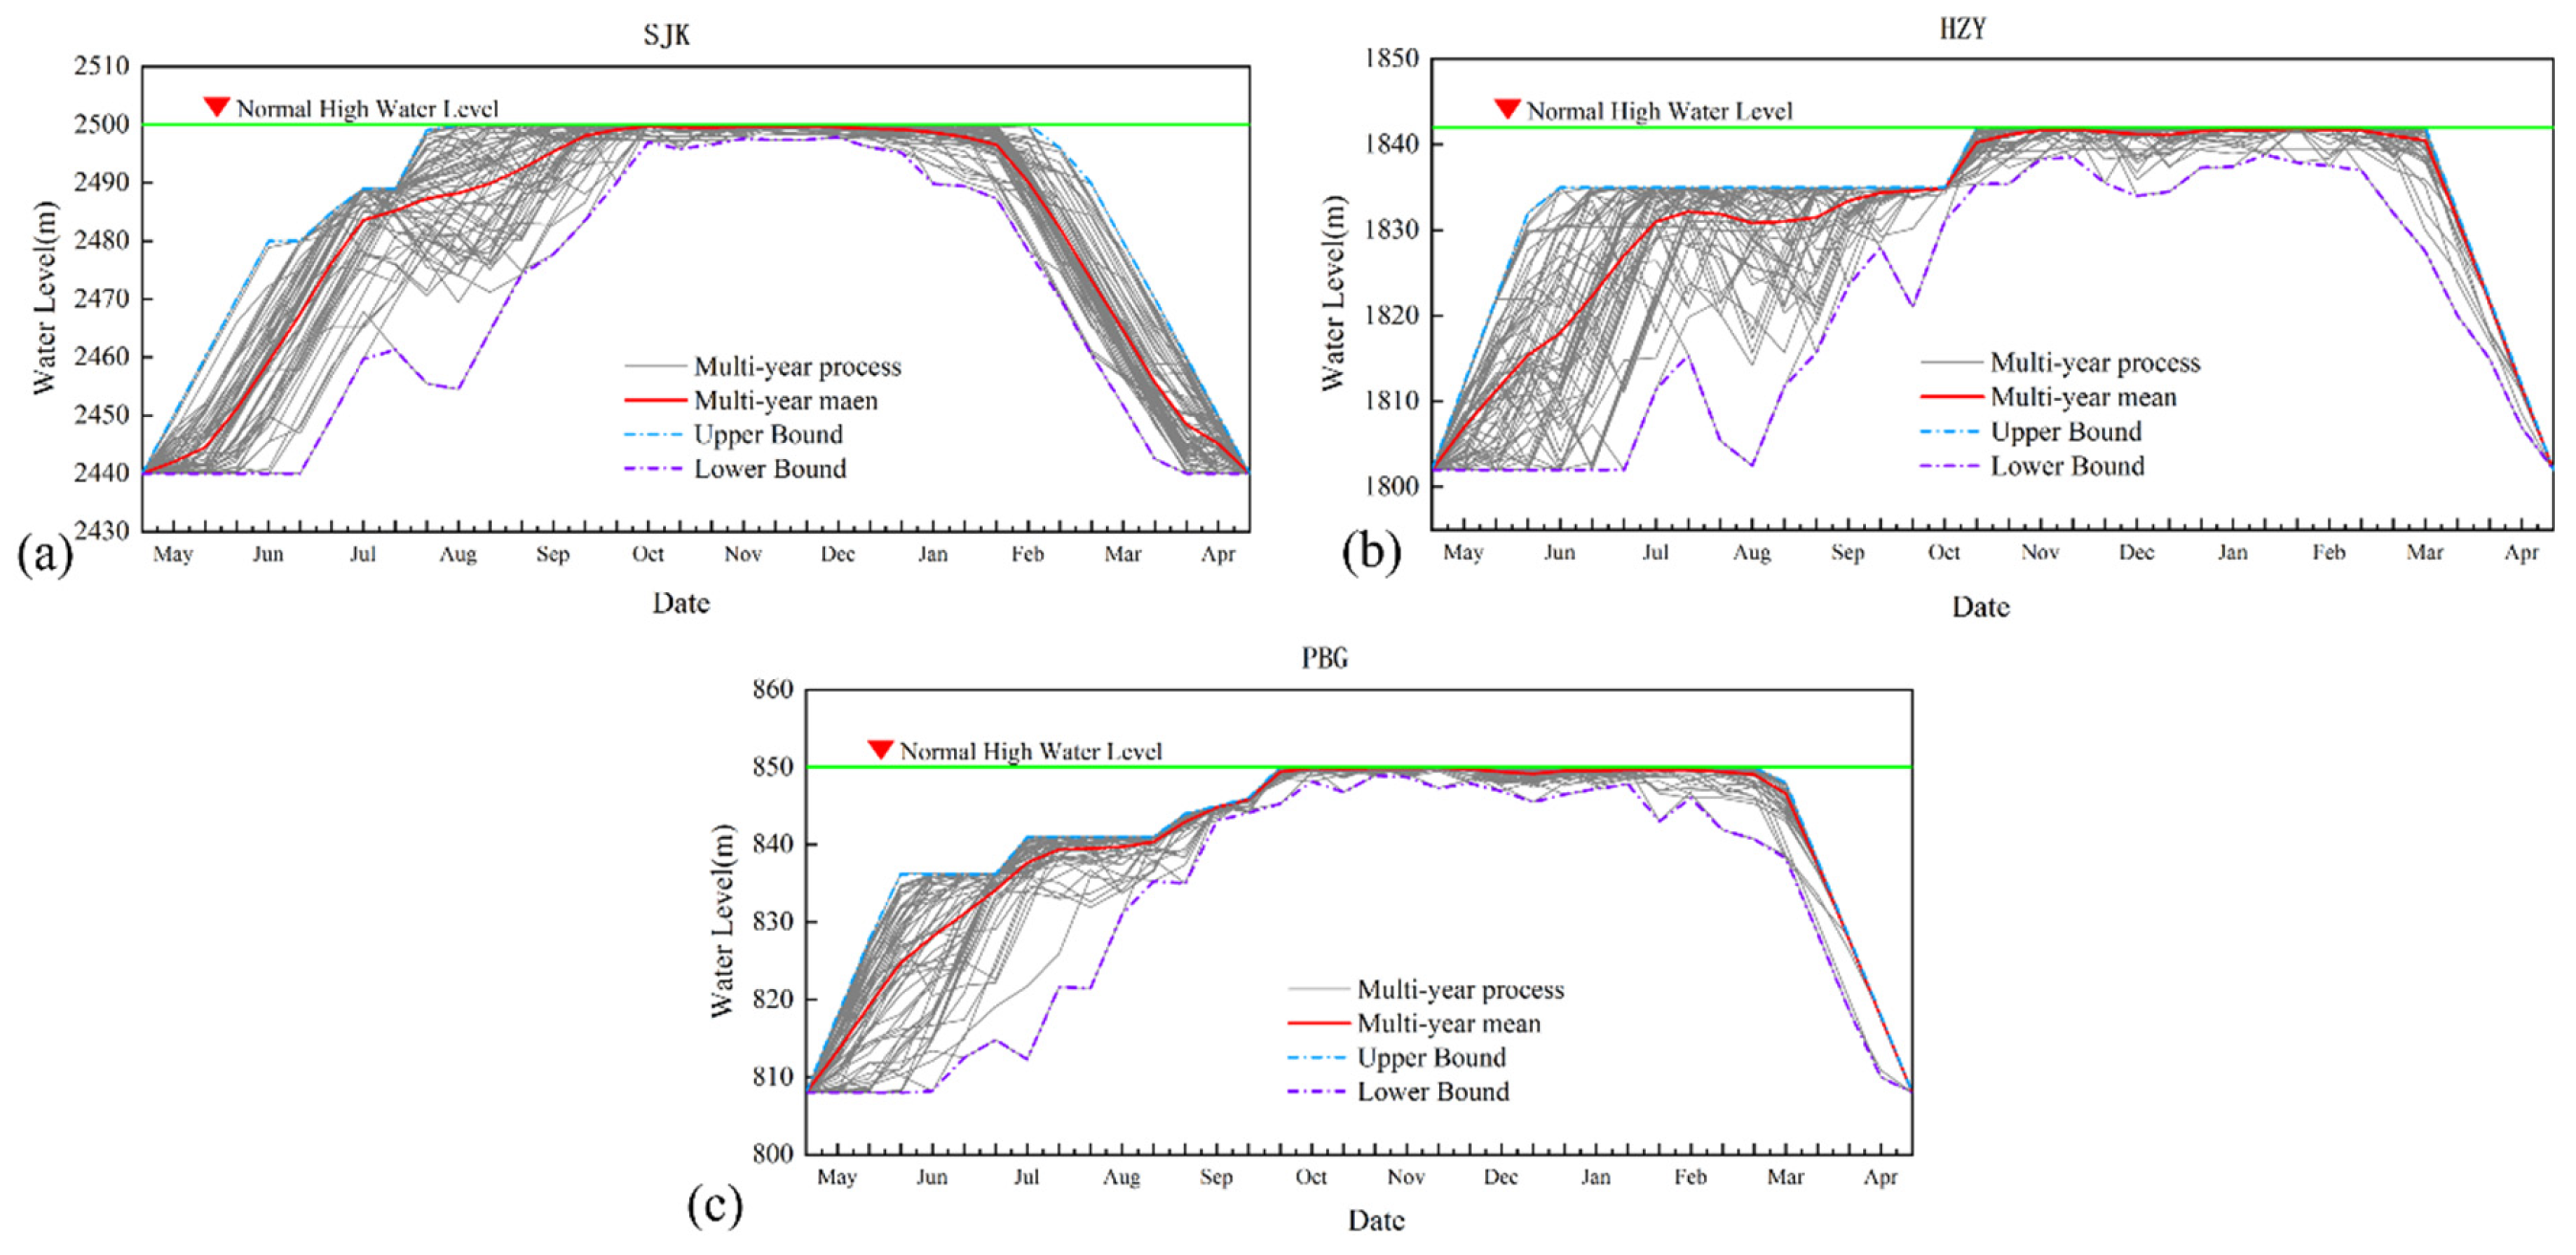
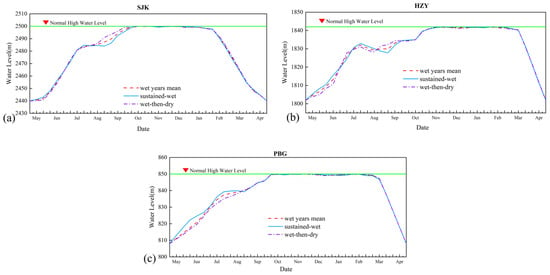
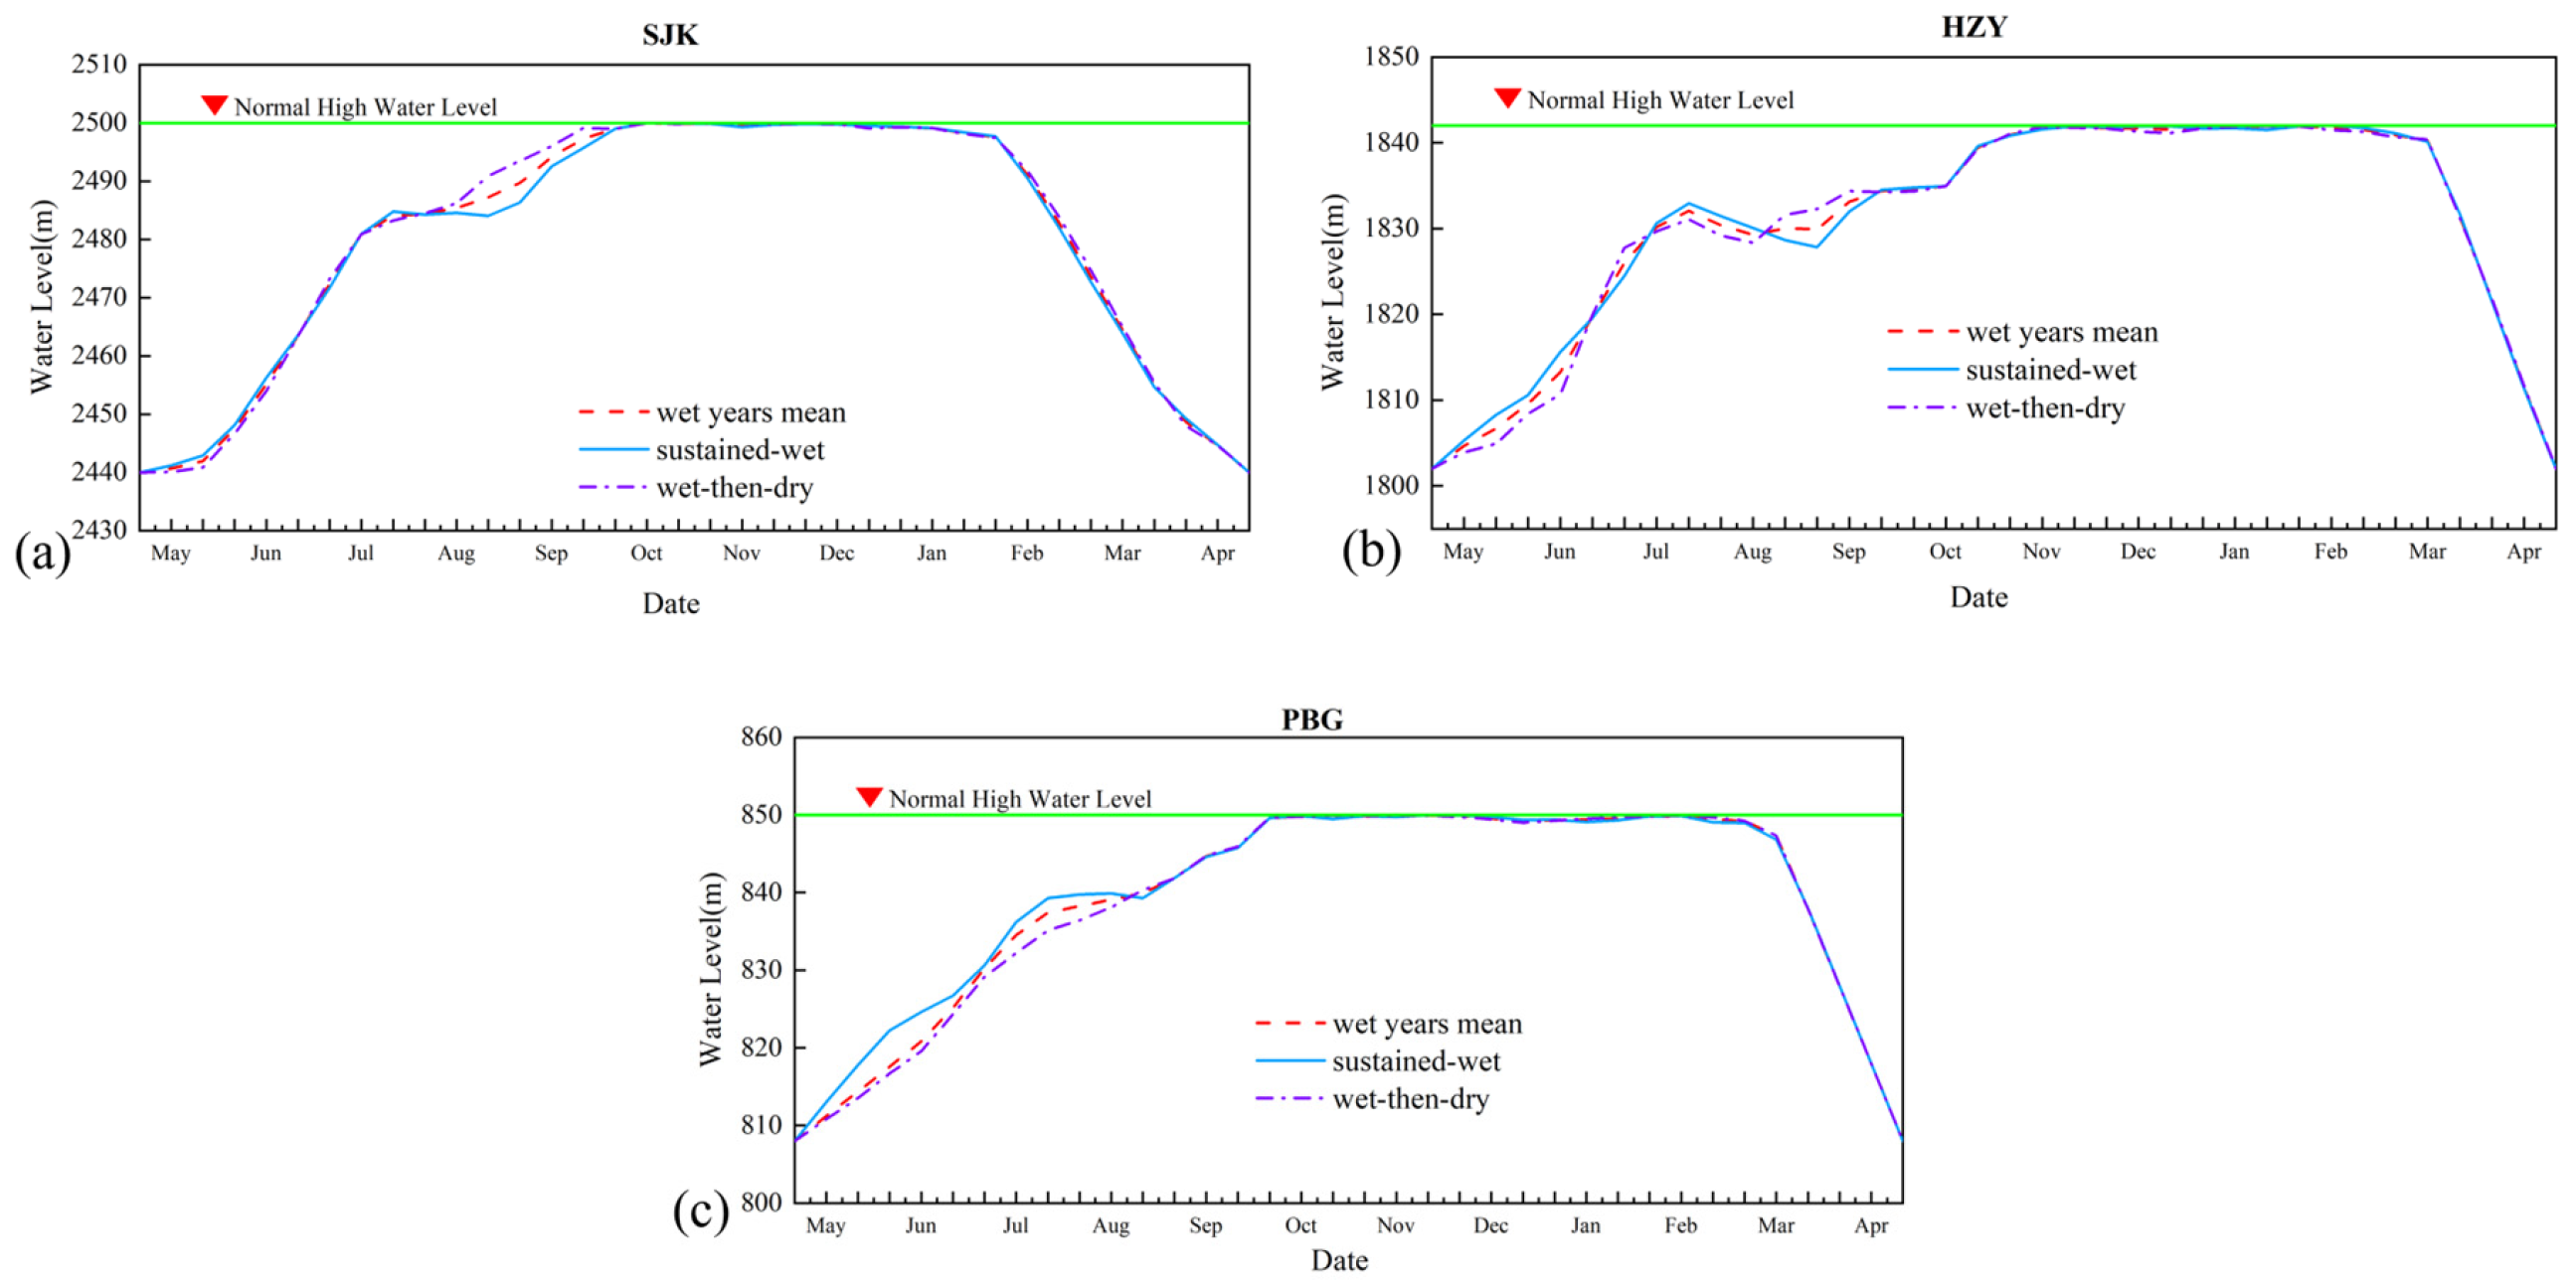
Applying the model to the 65-year record yields the multi-year average water level trajectories shown in Figure 3. All three regulating reservoirs follow a common pattern of flood-season impoundment, sustained high-level operation, and concentrated pre-flood drawdown. Shuangjiangkou rises rapidly from late May and reaches the NPL of 2500 m around early October, remaining near the NPL until early January of the following year; from mid-January onward, the level recedes gradually to 2490 m by mid-February and reaches the annual minimum of 2440 m by late April. Houziyan ascends gradually from 1802 m in early May to approximately 1831 m by mid-July, stays around 1831 m during July–August, then rises steadily from early September to attain the NPL of 1842 m around mid-November, maintaining near the NPL until late February before a rapid drawdown in early March returns it to 1802 m by late April. Pubugou begins impounding from 808 m in early May, reaches about 839 m by late July and the NPL of 850 m by mid-October, fluctuates near the NPL until late February, and then falls rapidly from mid-March to around 808 m by early April. The trajectories lie close to the stage-dependent upper envelope, indicating that the optimization exploits the full permissible storage space while respecting flood control limits.
Figure 3.
Multi-year average optimal water level processes of (a) Shuangjiangkou, (b) Houziyan, and (c) Pubugou.
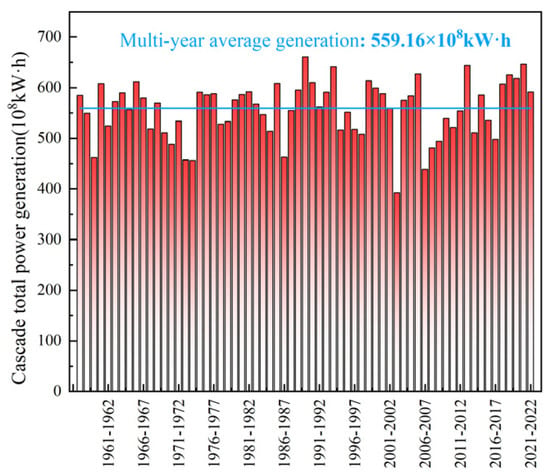
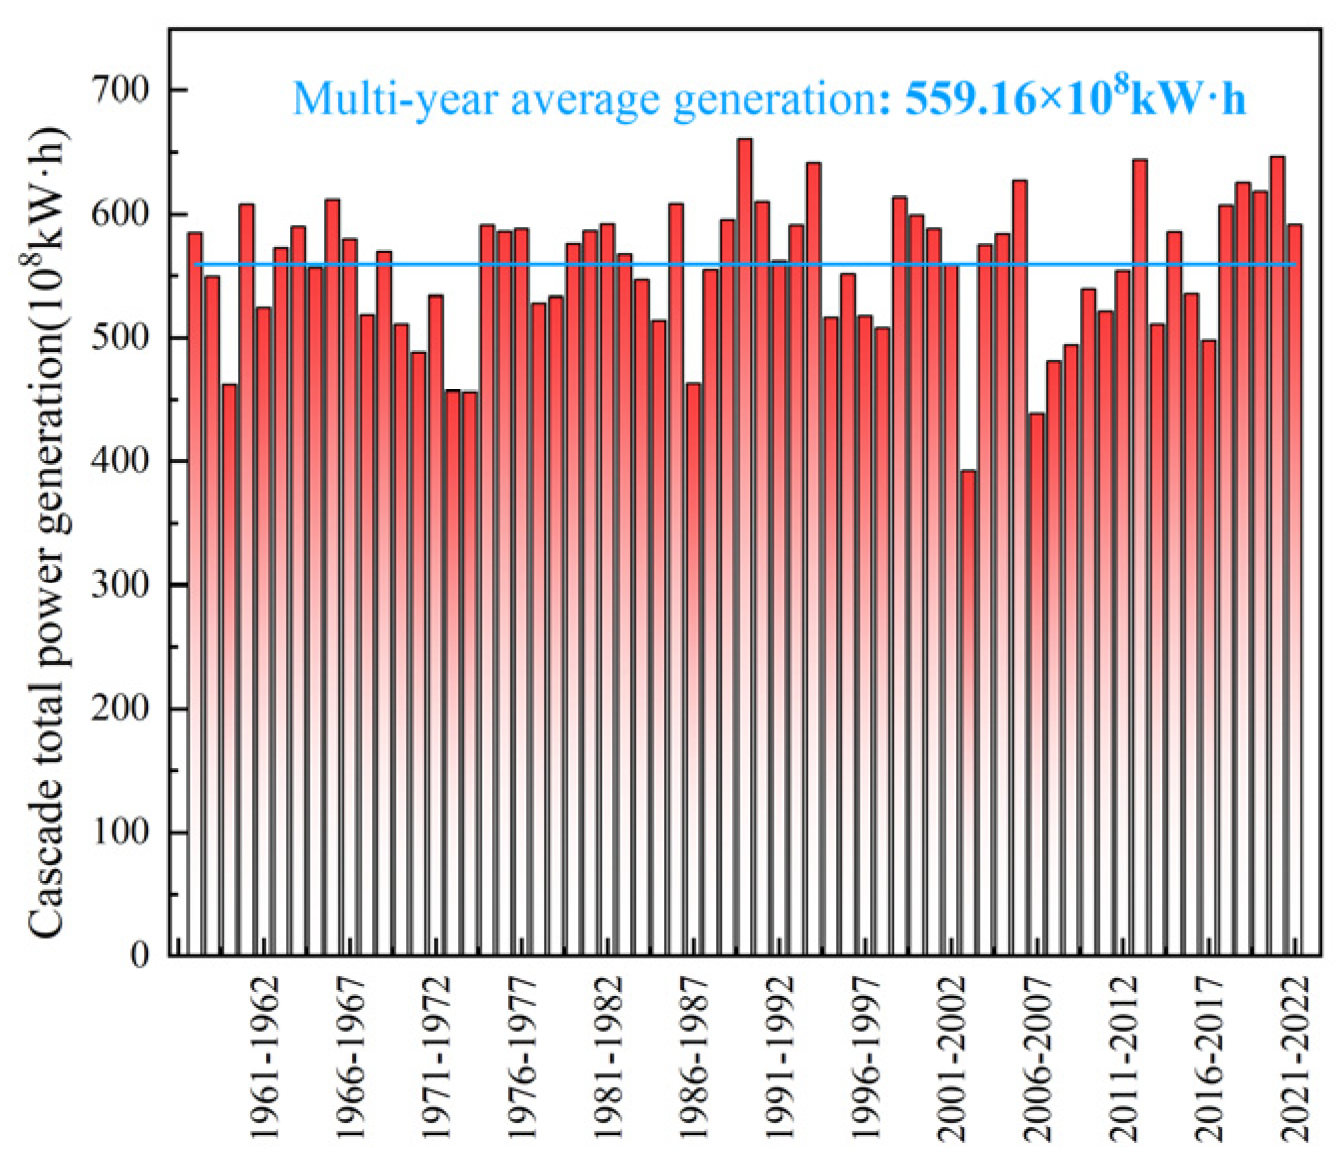
The optimized schedule increases the multi-year average total generation of the five-station cascade to 559.16 × 10⁸ kWh (Figure 4), which is 10.08% higher than the design value of 507.98 × 10⁸ kWh (Table 3). At the station scale, Shuangjiangkou generates 85.96 × 10⁸ kWh, 11.53% above its design value, while Pubugou generates 155.10 × 10⁸ kWh, 8.57% above its design value. The two run-of-river stations also benefit substantially from the optimized upstream regulation: Changheba and Dagangshan generate 124.67 × 10⁸ kWh and 130.78 × 10⁸ kWh, corresponding to increases of 15.54% and 18.89%, respectively. Houziyan generates 62.65 × 10⁸ kWh, 10.69% below its design value. This reduction reflects the redistribution of storage and releases within the cascade: the optimization favors the larger regulating reservoirs and improves the flow and head conditions of the downstream stations, thereby maximizing the total generation of the five-station system rather than the output of each individual station.
Figure 4.
Annual cascade power generation under optimal operation (1957–2021), the red bars represent the annual power generation, and the blue line indicates the multi-year average power generation.
Table 3.
Multi-year average generation of the five-station cascade under optimal and design operation.
4.3. Refill Timing Varies Systematically with Hydrological Year Type
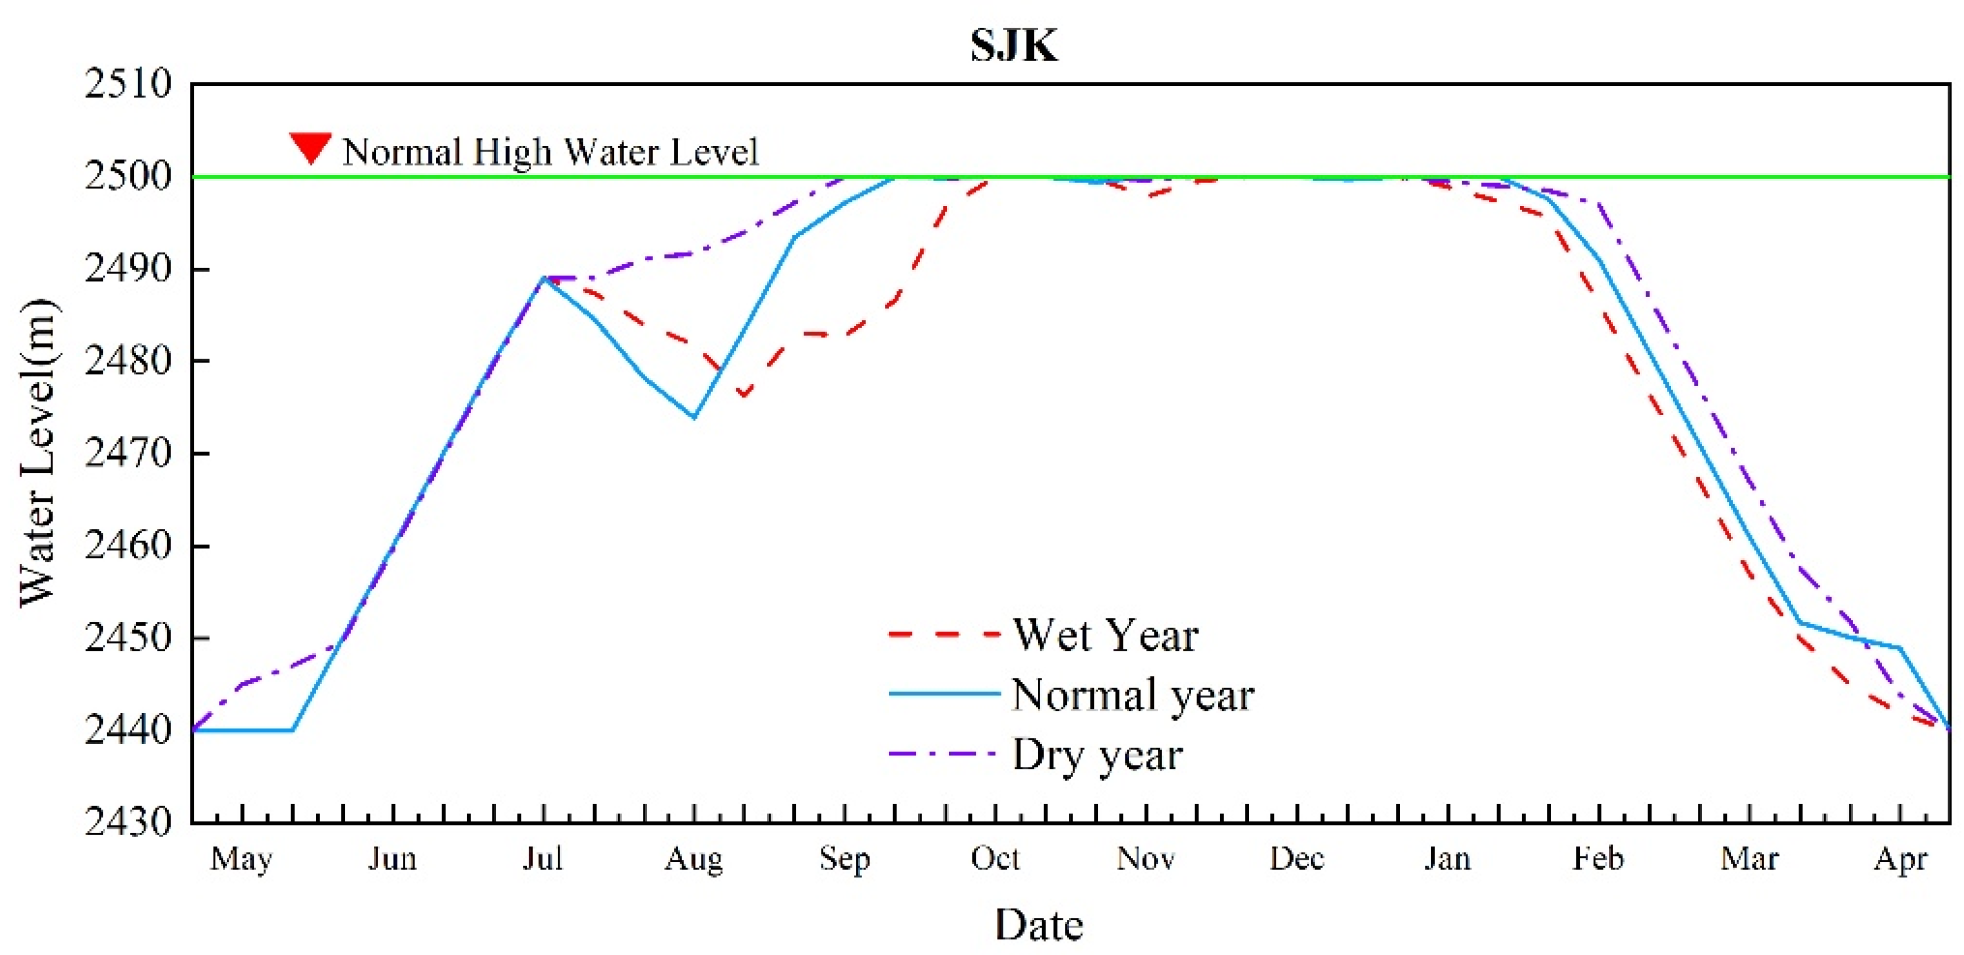
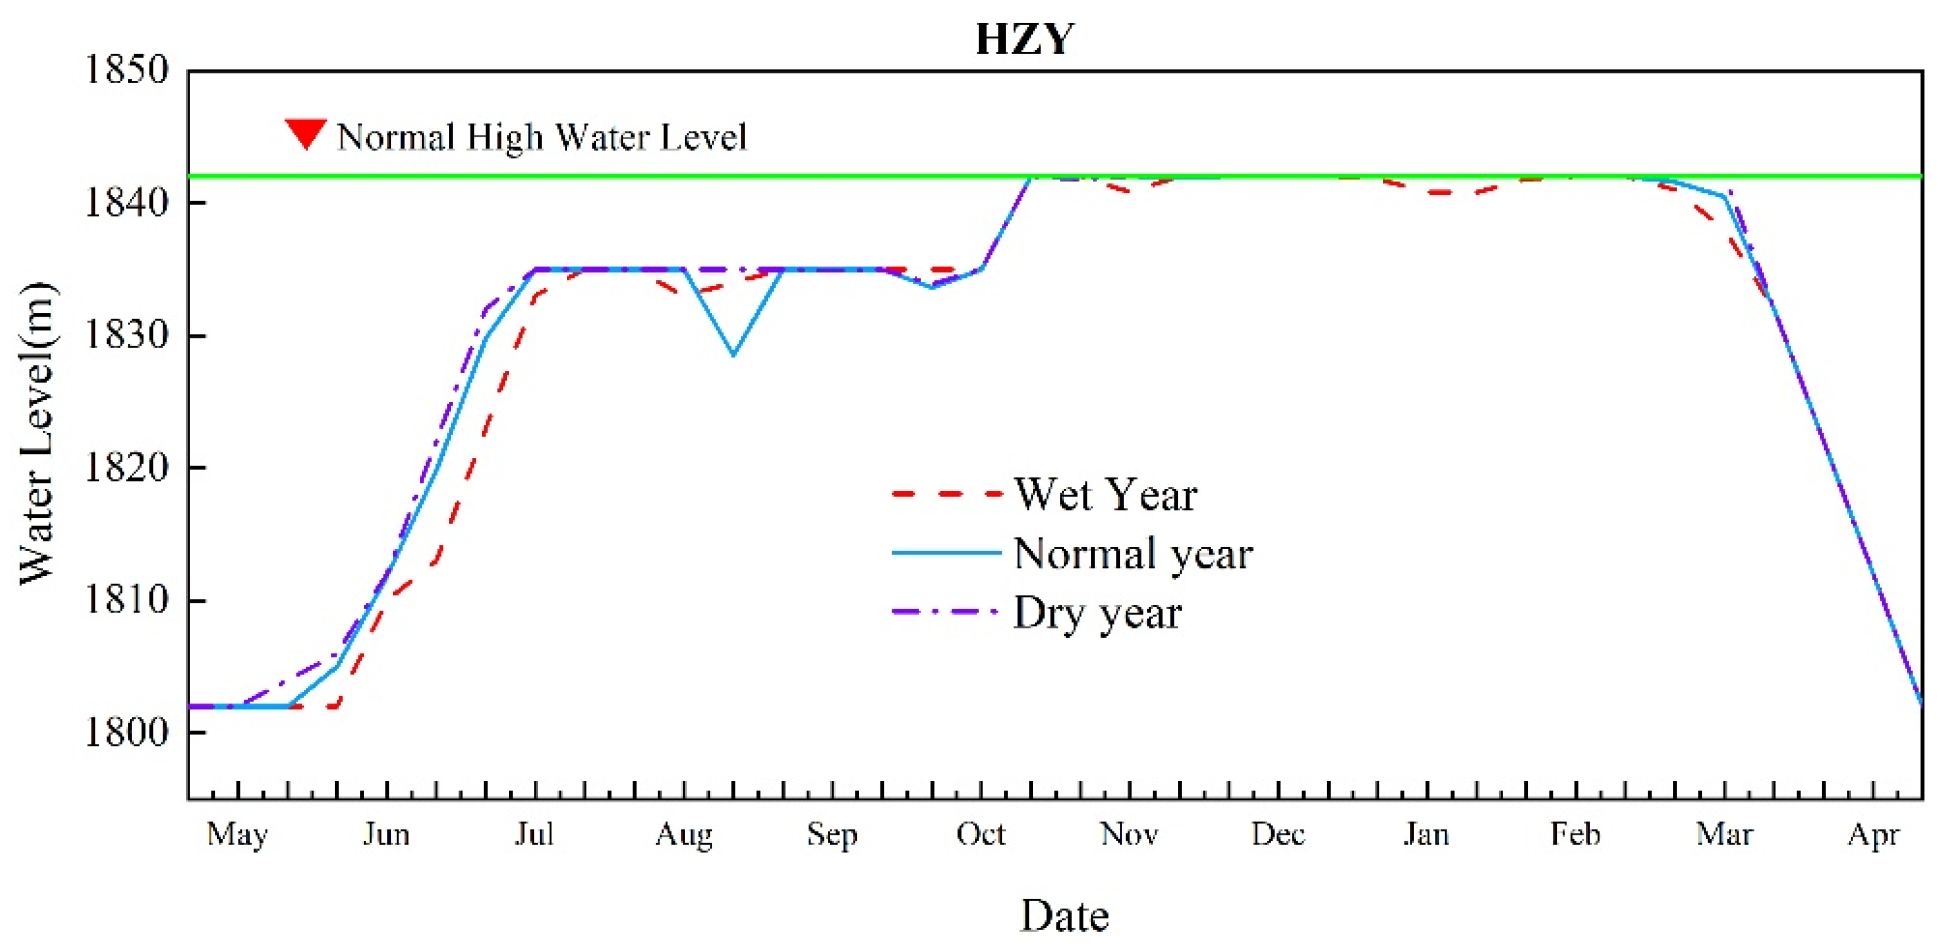
The optimized water level trajectories for three typical years—a wet year (25% exceedance probability, 2017–2018), a normal year (50%, 1976–1977), and a dry year (75%, 2010–2011)—are presented in Figure 5, Figure 6 and Figure 7, with key characteristic values summarized in Table 4.
Figure 5.
Water level processes of Shuangjiangkou in wet, normal, and dry typical years.
Figure 6.
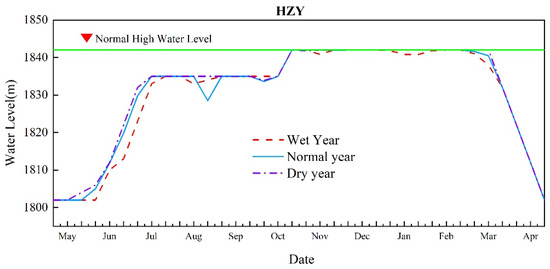
Water level processes of Houziyan in wet, normal, and dry typical years.
Figure 7.
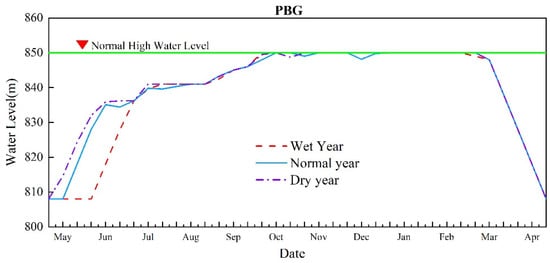
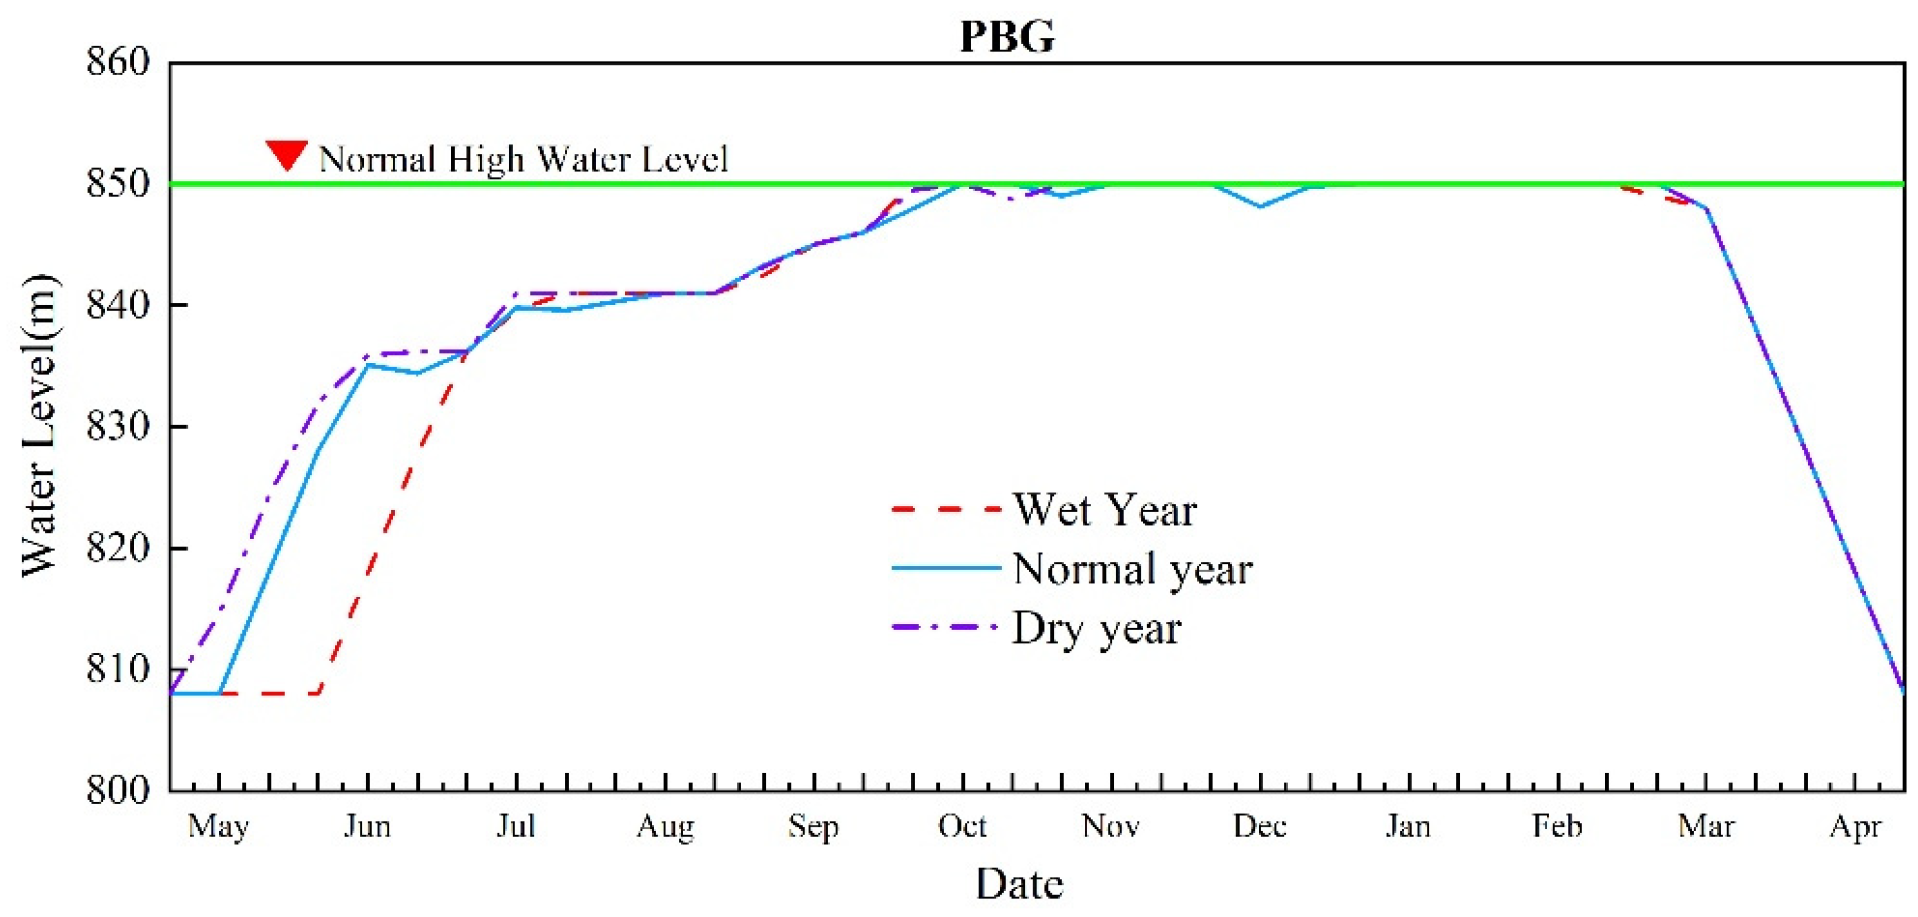
Water level processes of Pubugou in wet, normal, and dry typical years.
Table 4.
Characteristic values of optimized operation in typical years.
In the wet year, with an annual inflow of 447.8 × 10⁸ m3 at the Pubugou dam site, total cascade generation reaches 607.4 × 10⁸ kWh. Elevated flood risk delays the start of impoundment: Shuangjiangkou begins rising from 2440 m in early June and reaches the NPL of 2500 m in mid-October, remaining near the NPL until early January before receding gradually from mid-January. Houziyan begins filling in mid-June, attains 1835 m in early September and the NPL of 1842 m in late October, with drawdown commencing in early March. Pubugou also starts impounding in mid-June, reaches 841 m in late July and the NPL of 850 m in early October, and drops to 808 m by late April following drawdown initiated in mid-March.
In the normal year, with an annual inflow of 417.9 × 10⁸ m3, total cascade generation is 588.1 × 10⁸ kWh. Moderate inflows support an orderly filling schedule: Shuangjiangkou starts filling in early June and reaches the NPL in late September, with gradual drawdown beginning in early February; Houziyan starts impounding in early June, reaches 1835 m by mid-July and the NPL in late October, sustains the high level thereafter, and undergoes concentrated drawdown from early March to 1802 m by late April; Pubugou begins filling in late May, reaches 841 m by mid-August and the NPL by mid-October, and recedes to 808 m by late April through concentrated drawdown starting in mid-March.
In the dry year, with an annual inflow of 381.5 × 10⁸ m3, total cascade generation is 521.7 × 10⁸ kWh. Limited inflow prompts earlier filling initiation: Shuangjiangkou rises gradually from 2440 m to 2489 m between early May and late July, reaches the NPL in mid-September, maintains near the NPL until early February, and then recedes gradually from mid-February; Houziyan starts filling in late May, reaches 1835 m by mid-July and the NPL in late October, and begins concentrated drawdown in late March; Pubugou rises from 808 m to 841 m between early May and mid-July, reaches 841 m in mid-September and 850 m in early October, and falls back to 808 m by late April through concentrated drawdown from late March.
The three typical years exhibit systematic differences in filling initiation, impoundment progression, high-level duration, and pre-flood drawdown rhythm. In dry years, limited inflow prompts the earliest filling initiation—Shuangjiangkou in early May, Houziyan in late May, and Pubugou in early May—enabling the reservoirs to capture early flood-season flows, complete refill promptly, and sustain the NPL for an extended period to maximize operating head. In normal years, moderate inflows support an orderly schedule, with Shuangjiangkou and Houziyan starting in early June and Pubugou in late May. In wet years, elevated flood risk delays filling until early-to-mid June, resulting in later refill completion, a shortened high-level maintenance period, and earlier pre-flood drawdown. This pattern demonstrates that the optimization model adaptively shifts refill timing in response to annual water availability, conservatively delaying impoundment under flood risk and advancing it under water scarcity.
4.4. Within-Year Inflow Trend Substantially Modulates Refill Success
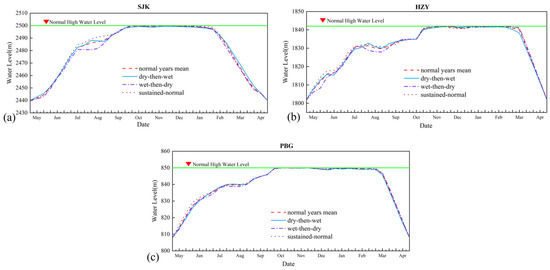
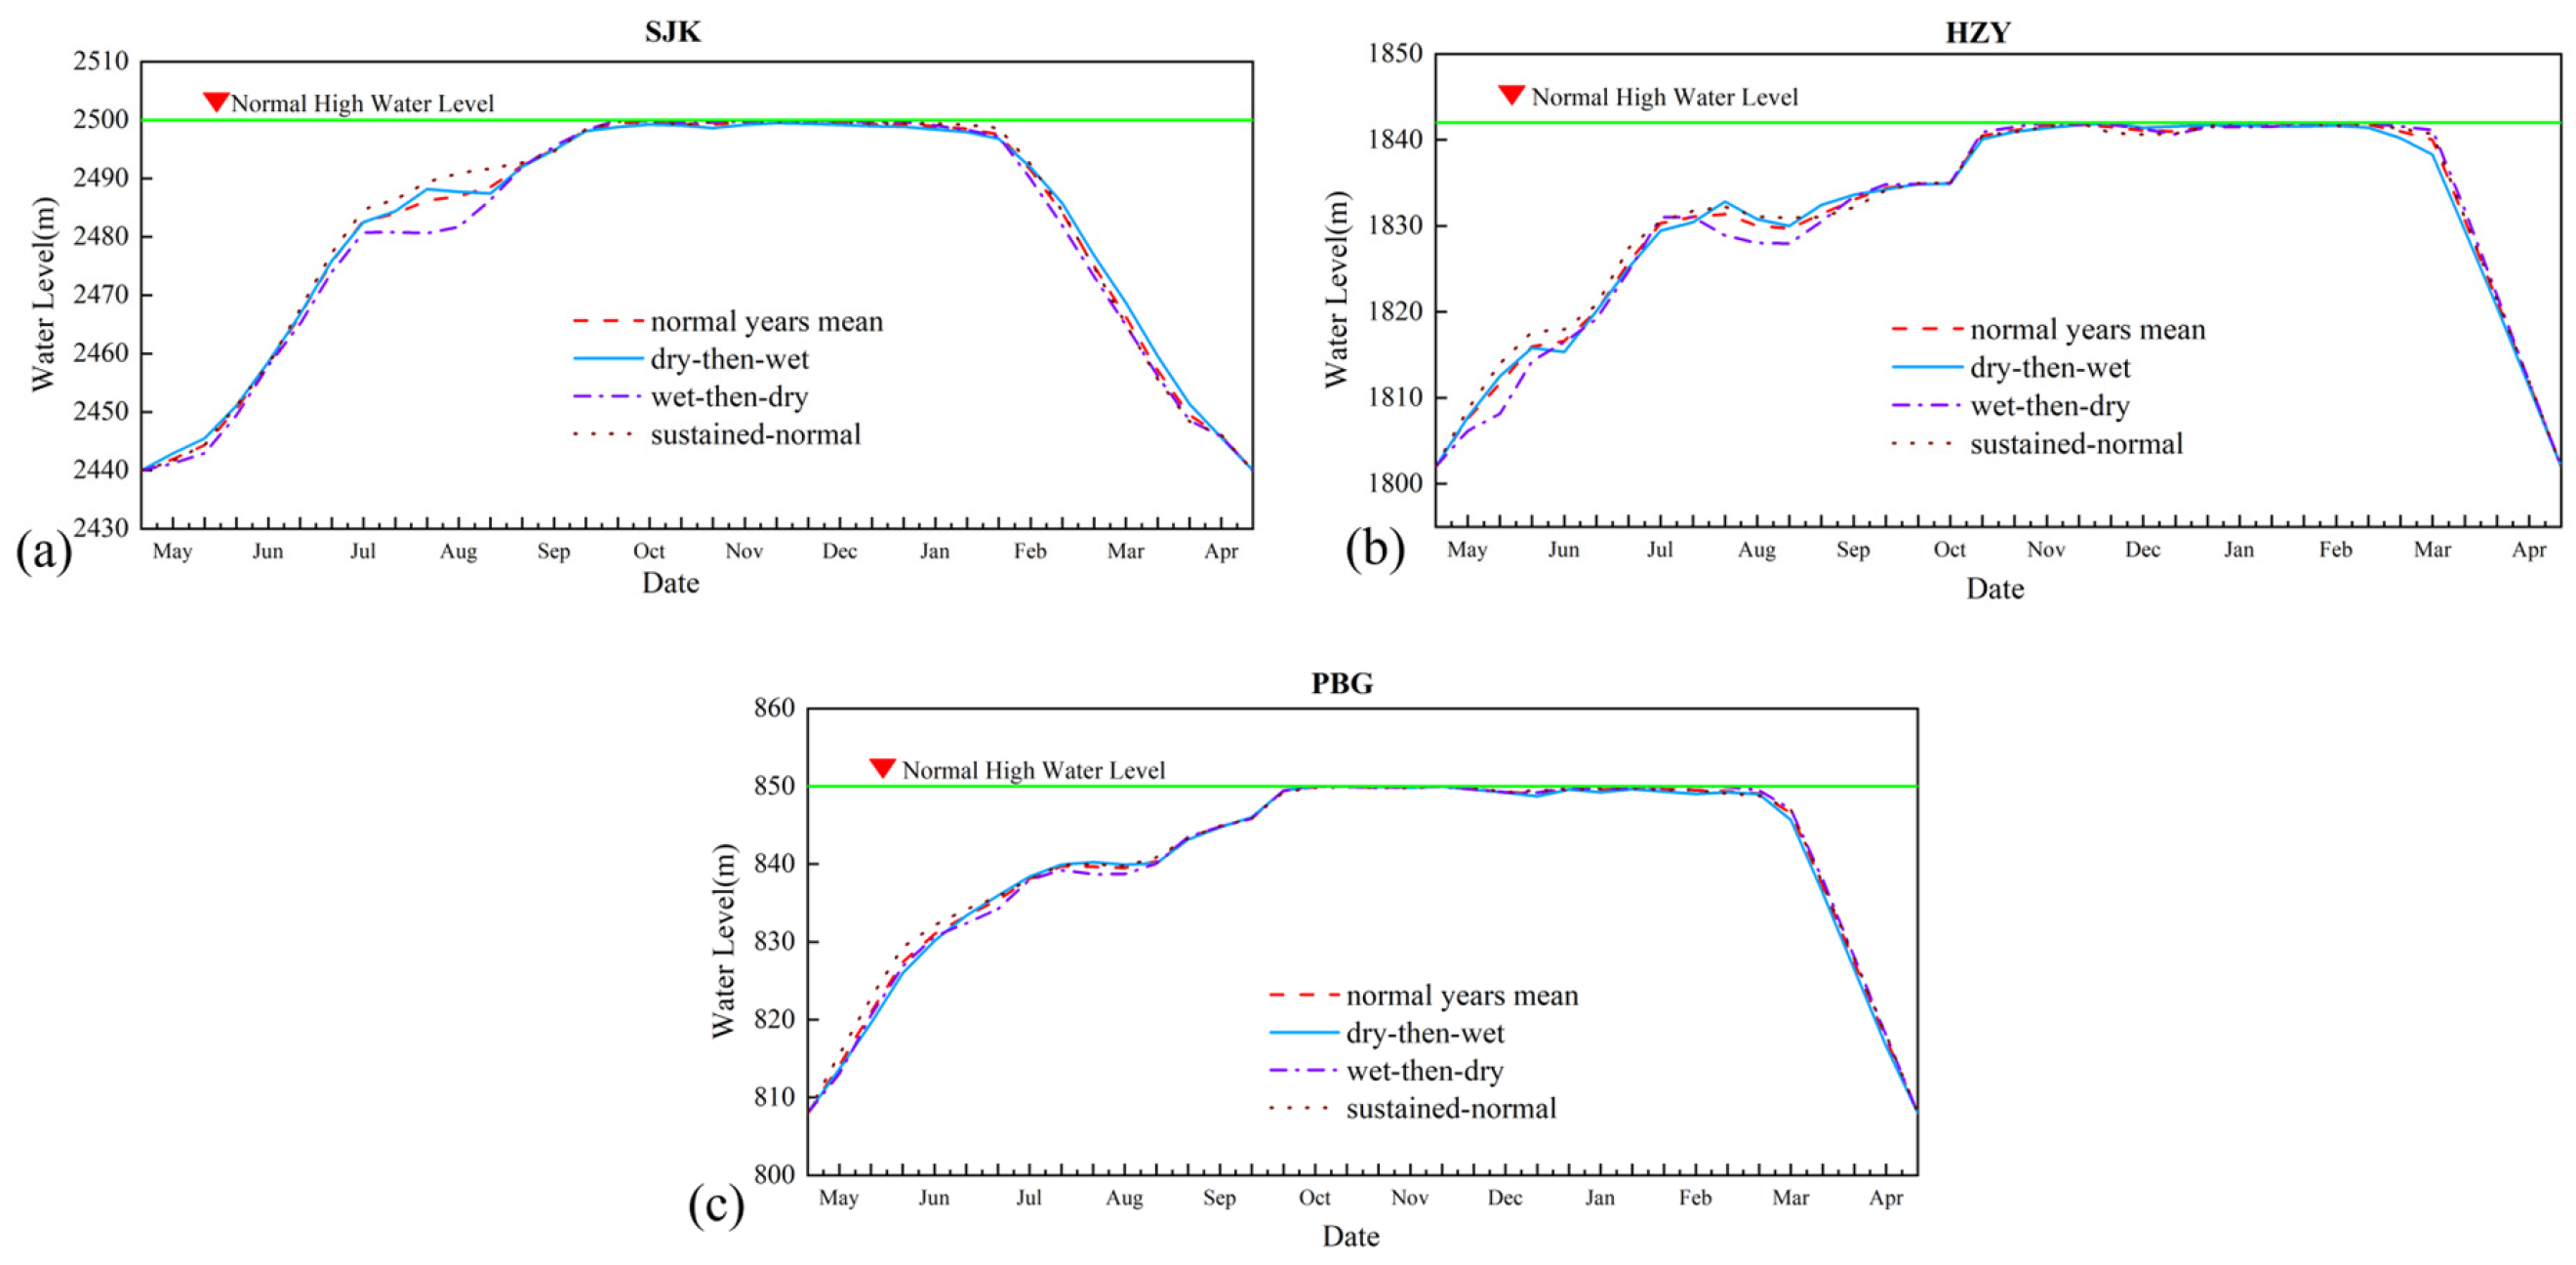
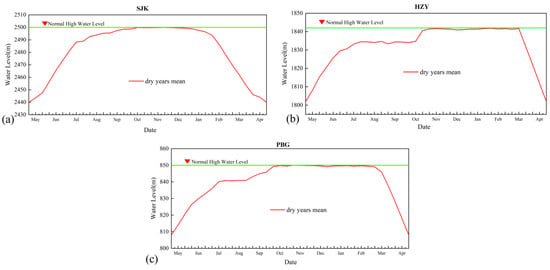
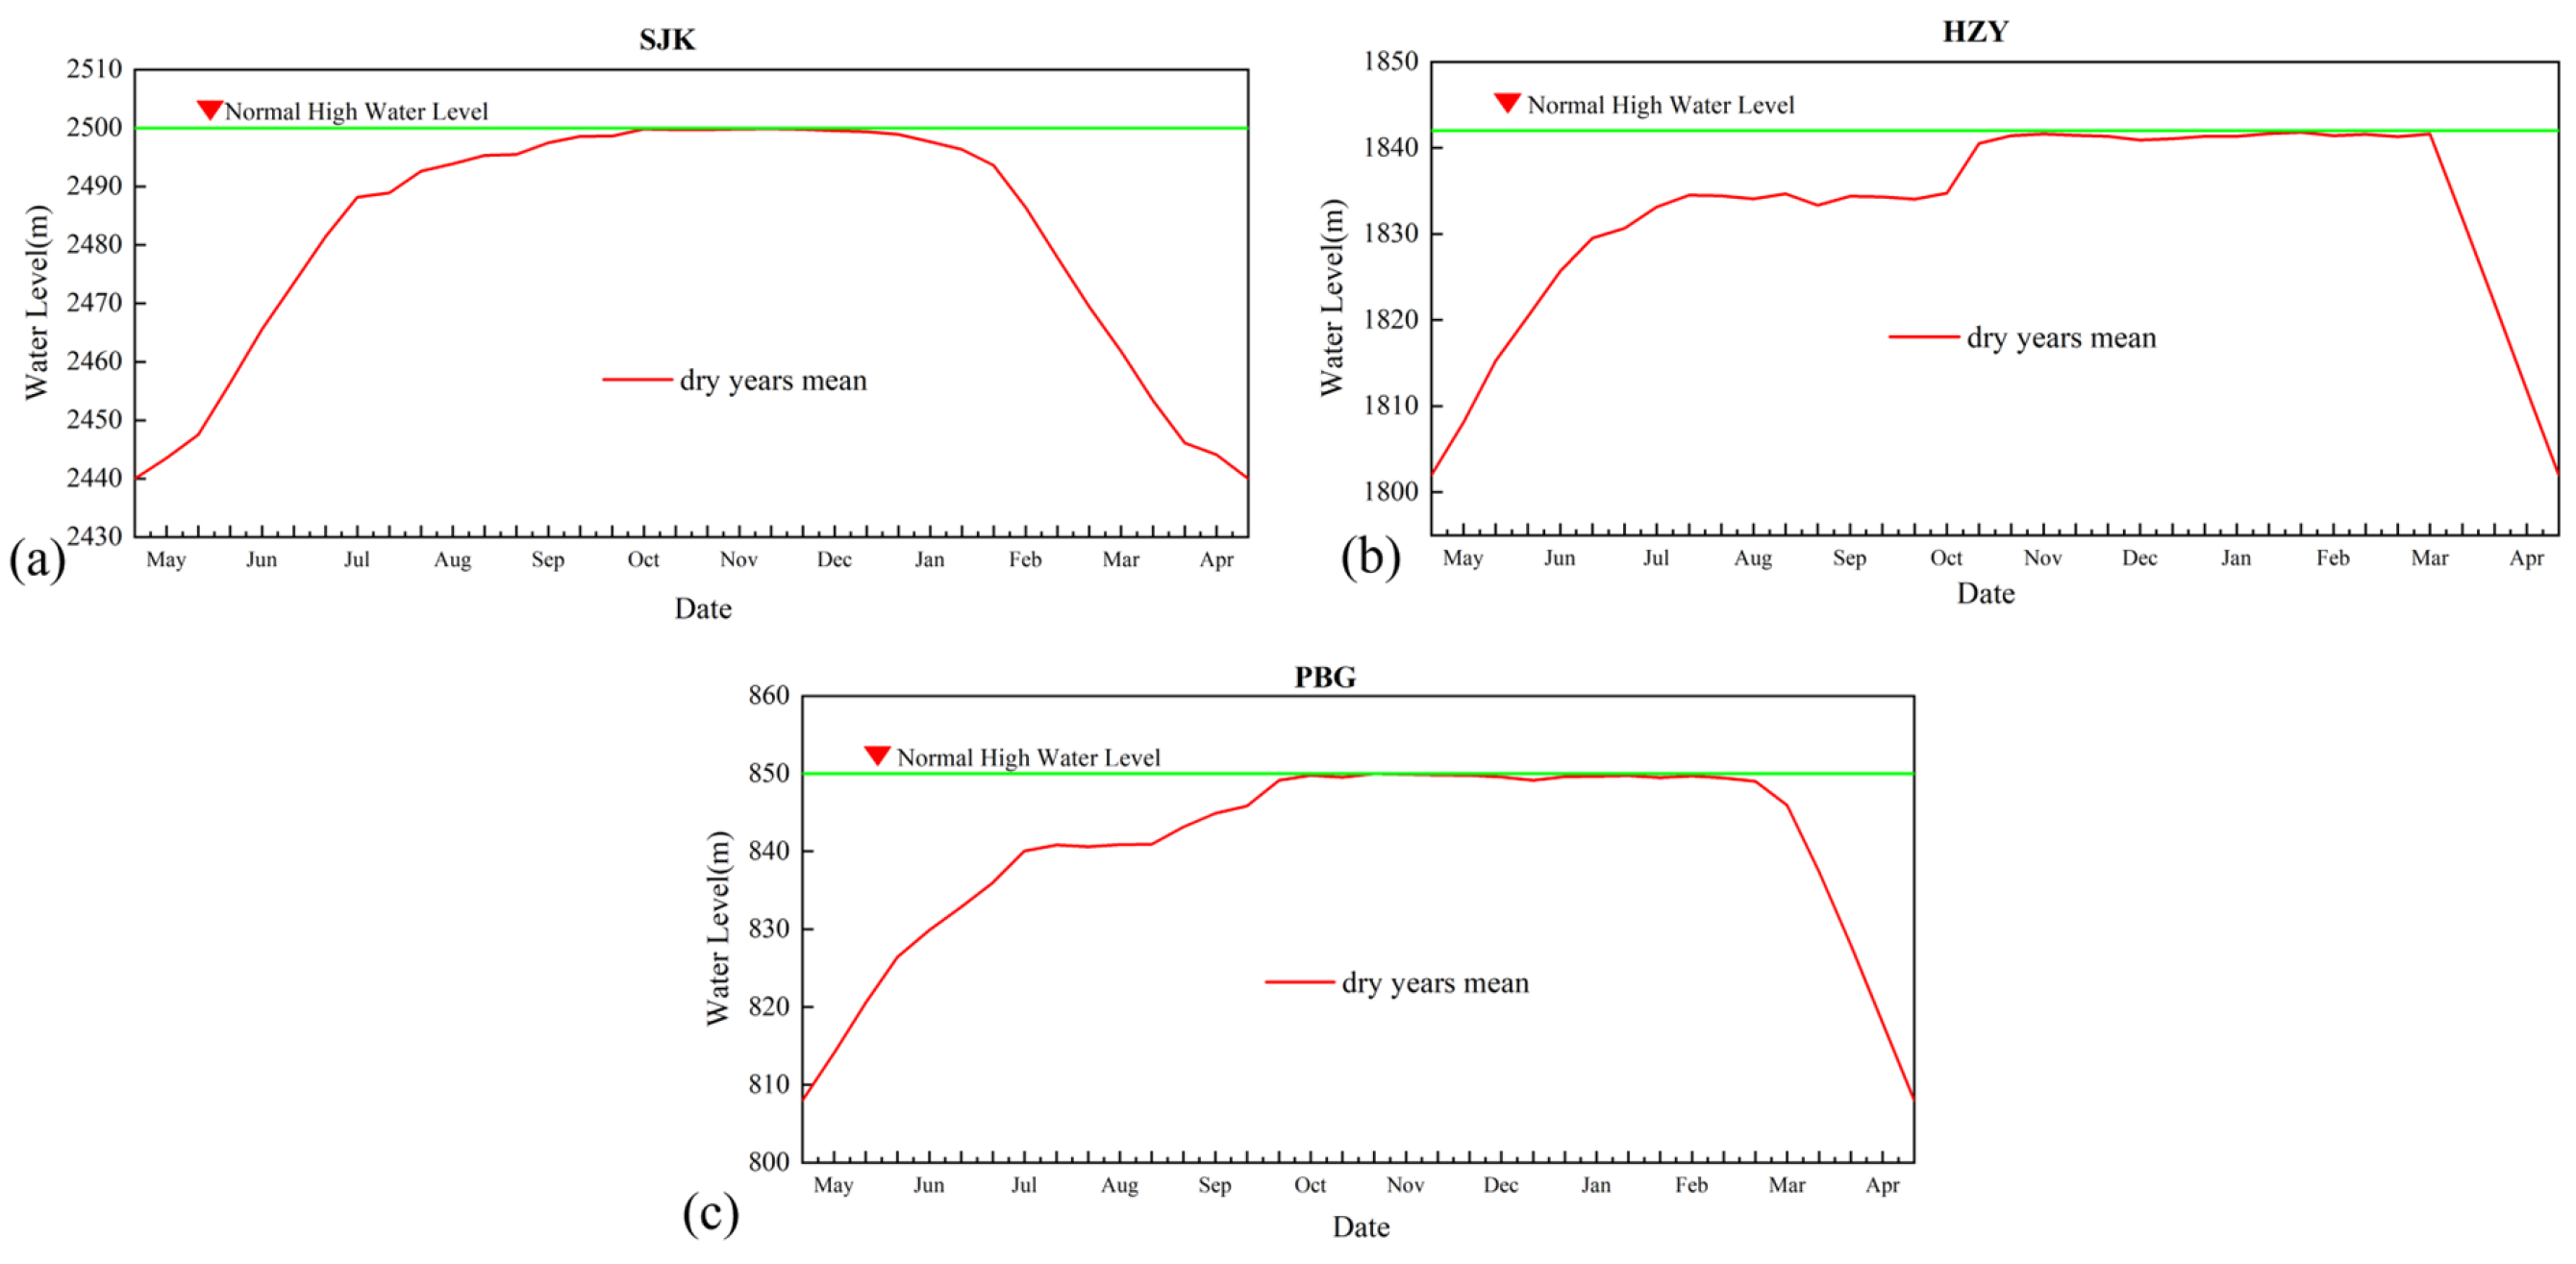
The within-year distribution of inflow can substantially influence refill performance and power generation even among years belonging to the same wetness category. To examine this effect, optimized operation results are compared across inflow trend types for wet, normal, and dry years (Figure 8, Figure 9 and Figure 10).
Figure 8.
Water level processes of cascade reservoirs under different inflow trend types in wet years: (a) Shuangjiangkou, (b) Houziyan, (c) Pubugou.
Figure 9.
Water level processes of cascade reservoirs under different inflow trend types in normal years: (a) Shuangjiangkou, (b) Houziyan, (c) Pubugou.
Figure 10.
Water level processes of cascade reservoirs under different inflow trend types in dry years: (a) Shuangjiangkou, (b) Houziyan, (c) Pubugou.
For wet years, the average annual inflow at the Pubugou dam site is 447.0 × 10⁸ m3 and the corresponding cascade generation is 615.3 × 10⁸ kWh. All three reservoirs commence impounding in early-to-mid May and rise rapidly through the flood season under the stage-specific control limits; Shuangjiangkou and Pubugou reach the NPL in early October, whereas Houziyan attains the NPL by mid-November, and the reservoirs remain near the NPL through December before drawdown begins between February and March. Within the wet-year category, the sustained-wet scenario (449.9 × 10⁸ m3; 621.0 × 10⁸ kWh) yields higher generation than the wet-then-dry scenario (443.7 × 10⁸ m3; 608.7 × 10⁸ kWh), indicating that cascade generation remains positively correlated with annual inflow volume even in wet years.
For normal years, the average annual inflow is 388.0 × 10⁸ m3 with a cascade generation of 559.5 × 10⁸ kWh. The overall refill trajectories resemble those of wet years, although Shuangjiangkou reaches the NPL slightly later and the drawdown of Houziyan and Pubugou is deferred to late March. A more nuanced picture emerges from comparing the three trend types: the wet-then-dry scenario (400.5 × 10⁸ m3; 576.3 × 10⁸ kWh) and the sustained-normal scenario (382.8 × 10⁸ m3; 577.8 × 10⁸ kWh) both outperform the dry-then-wet scenario (381.9 × 10⁸ m3; 546.1 × 10⁸ kWh) by a considerable margin, despite the latter two having nearly identical annual inflow totals. This result highlights that, when annual water volume is comparable, abundant early flood-season inflow is more conducive to cascade power generation because it enables the reservoirs to attain higher water levels earlier and sustain greater operating heads throughout the refill period.
For dry years, the average annual inflow is 335.1 × 10⁸ m3 and cascade generation is 489.4 × 10⁸ kWh. The reservoirs initiate impounding earlier than in wetter years—Shuangjiangkou begins rising in early May—and all three reach the NPL by mid-October, with Shuangjiangkou maintaining near the NPL until mid-February. This early-start, prolonged high-level strategy allows the cascade to capture limited early-season flows and maximize operating head under water-scarce conditions, although the reduced inflow volume inevitably results in lower total generation.
Across all wetness categories, the results demonstrate that both annual inflow volume and its temporal distribution jointly govern refill outcomes and generation benefits. Annual inflow volume is the primary determinant, as cascade generation decreases monotonically from wet to normal to dry years. The within-year allocation of flow plays a secondary but important modulating role, particularly when annual inflow totals are comparable. Under such conditions, years with ample early flood-season inflow consistently outperform those with delayed high flows, because earlier refill allows reservoirs to maintain higher operating heads for a longer duration. The model adapts to these conditions by adjusting filling initiation and drawdown timing—advancing impoundment and extending high-level operation in dry years to conserve water and head, while adopting more conservative refill scheduling in wet years to mitigate flood risk and still achieve full refill.
4.5. Differentiated Water Level Strategies
Based on the optimization results across the 65-year simulation and the preceding typical-year and inflow-trend analyses, two categories of recommended water level strategies are proposed: one for normal and wetter years and one for dry years. The recommended ten-day water level control values for the three regulating reservoirs are summarized in Table 5.
Table 5.
Recommended ten-day water level strategies for the three regulating reservoirs (unit: m).
For normal and wetter years, when basin inflow conditions are favorable, joint operation prioritizes flood safety while fully exploiting cascade generation benefits. Shuangjiangkou starts at 2440 m in late May, rises to 2475 m by early July and 2485 m by mid-to-late July, impounds gradually in August depending on real-time inflow to reach 2490 m by late August, and can attain the NPL of 2500 m as early as early October. Houziyan starts at 1802 m in mid-May, reaches 1830 m by mid-July and 1835 m by early October, and fills to the NPL of 1842 m in November. Pubugou starts at 808 m in early May, is controlled below 836.2 m in June, rises to 840 m by early August and 845 m by late September, and reaches the NPL of 850 m in early October.
For dry years, the strategy emphasizes early impoundment to secure refill under constrained inflow. Shuangjiangkou starts at 2440 m in mid-May—earlier than in normal and wetter years—rises to 2480 m by early July and 2490 m by mid-to-late July, reaches 2495 m by late August, and can attain the NPL as early as late September. Houziyan starts at 1802 m in early May, can reach 1835 m by early August depending on inflow conditions, and fills to the NPL in November. Pubugou starts at 808 m in early May, is controlled below 836.2 m in June, rises to 841 m by early August and maintains this level through August, reaches 845 m by late September, and attains the NPL in early October.
Compared with the normal-and-wetter strategy, the dry-year strategy advances the filling initiation of Shuangjiangkou from late May to mid-May and maintains higher intermediate water levels during July–August (e.g., 2490 m vs. 2485 m in mid-to-late July, and 2495 m vs. 2490 m in late August), enabling the leading reservoir to reach the NPL by late September—approximately one dekad earlier. Houziyan likewise reaches the 1835 m control level by early August, two months ahead of the normal-and-wetter schedule. Pubugou adopts a slightly higher August level (841 m vs. 840 m) to capture limited early-season flows. These adjustments embody the core principle of the dry-year strategy: initiating impoundment earlier and sustaining higher permissible water levels during the flood season to fully utilize available water resources while remaining within prescribed flood control limits.
5. Benefit and Risk Analysis
5.1. Filling Rate
Over the 65-year simulation, Shuangjiangkou reaches the NPL in all 65 years (100% filling rate), reflecting its large active storage relative to catchment yield and its upstream position, which allows it to capture the first post-flood inflows. Pubugou also achieves a 100% filling rate (Table 6), owing to its substantial storage and its position downstream of the cascade’s flood control buffers. Houziyan reaches the NPL in 62 years (95.4%); the three unfilled years are all dry years with unfavorable inflow trends (sustained dry or wet-then-dry), in which late-season inflows are insufficient after the leading reservoir has filled. This pattern confirms that the leading reservoir governs the cascade refill rhythm and that the smallest regulating reservoir is the most sensitive to unfavorable inflow trends.
Table 6.
Reservoir filling rates over the 65-year simulation.
5.2. Spillage Risk
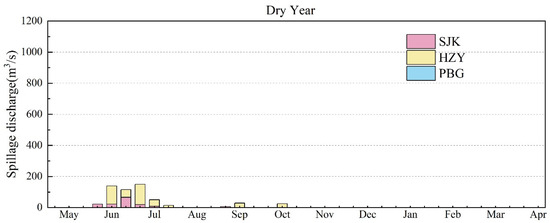
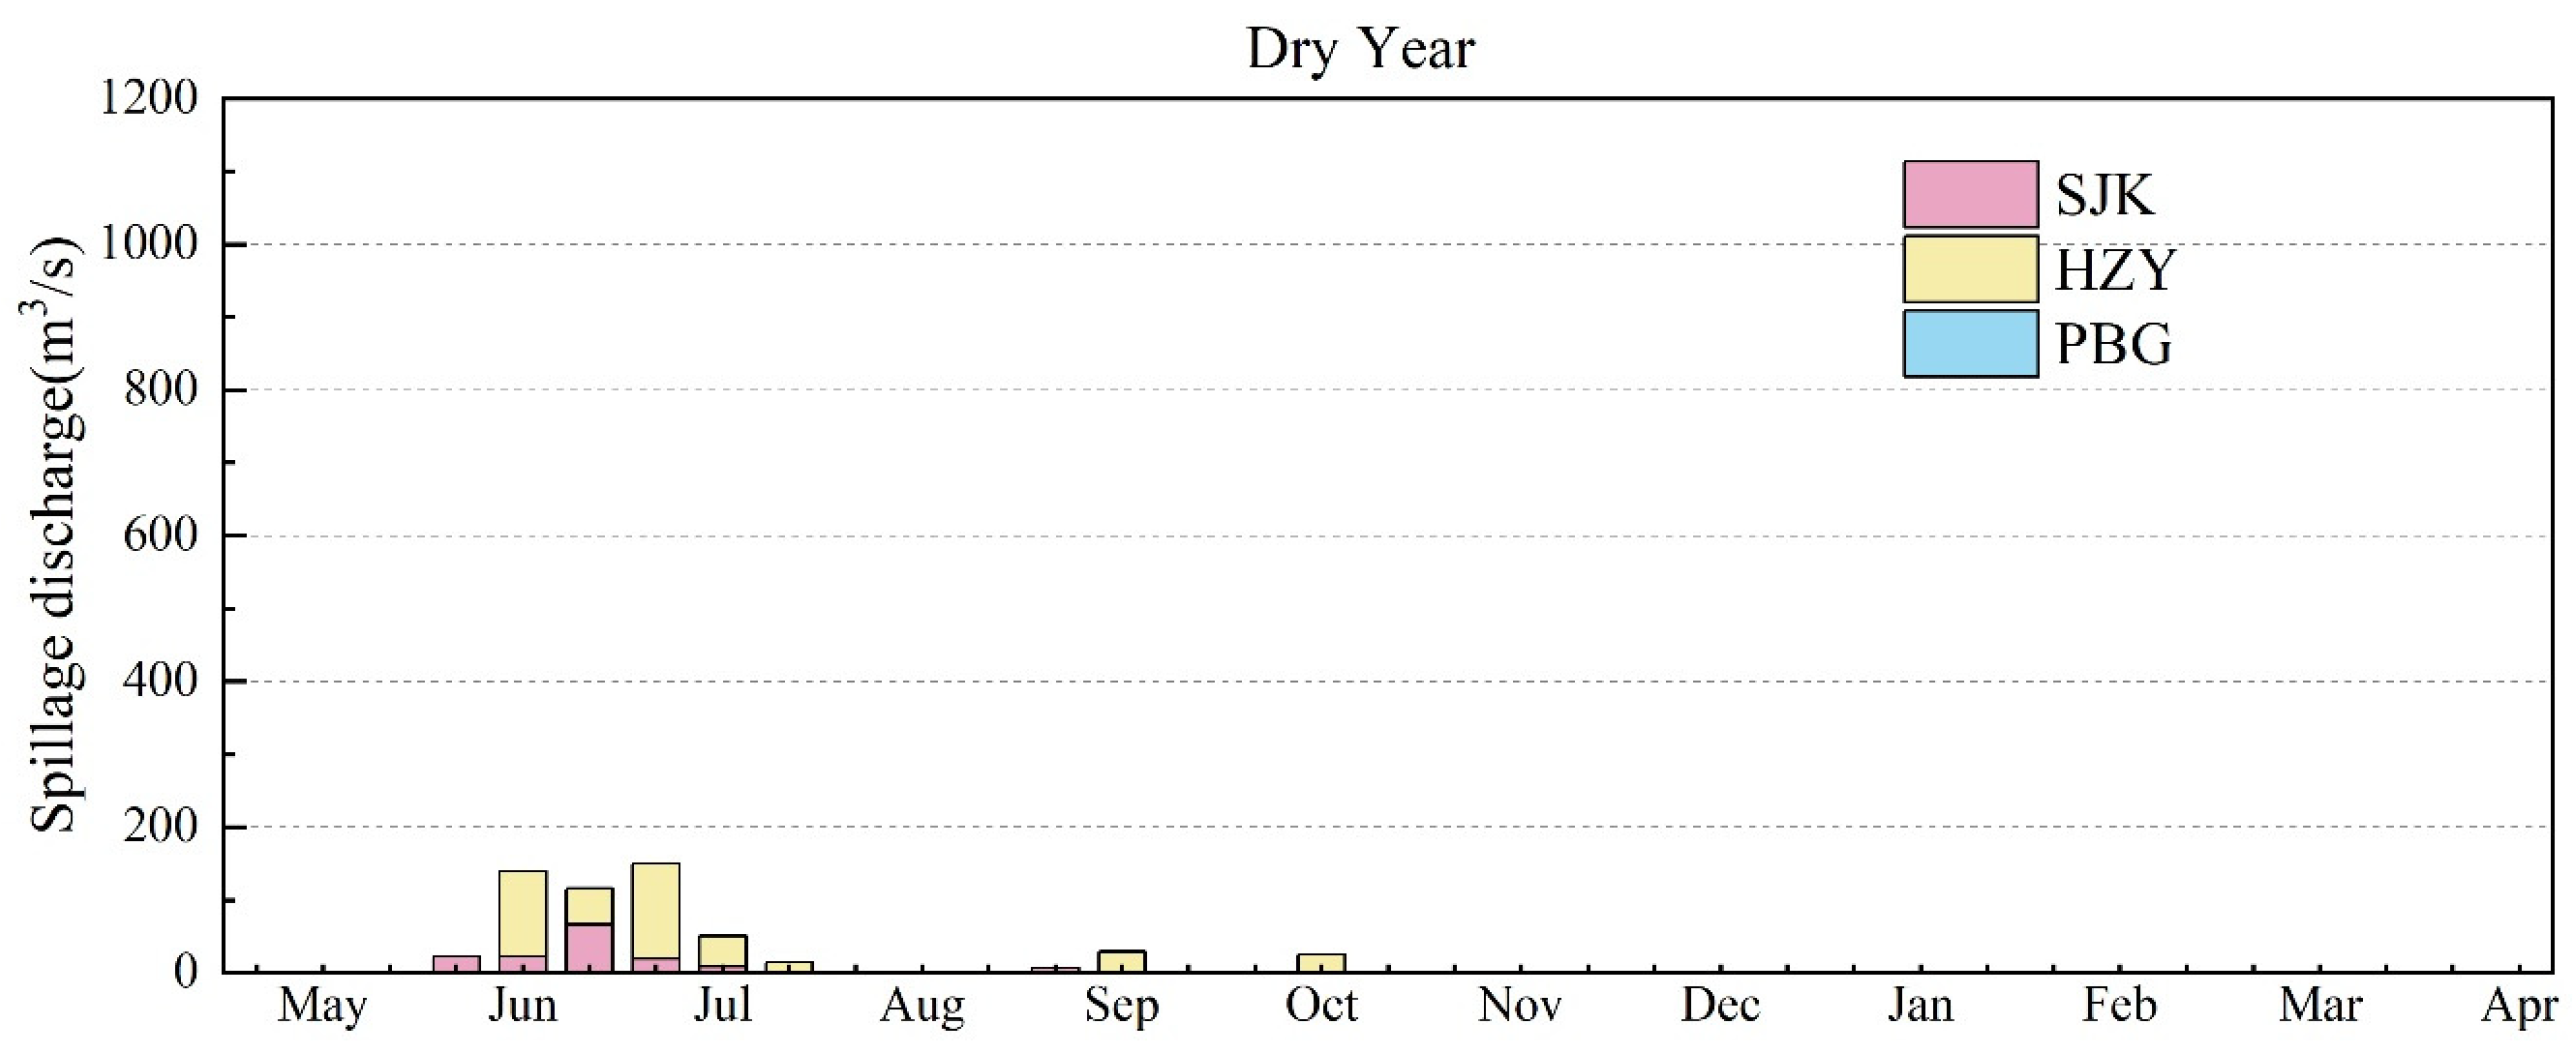
Based on the multi-year average spillage volumes of the Shuangjiangkou–Houziyan–Pubugou cascade under wet, normal, and dry hydrological conditions (Table 7) and the ten-day spillage discharge statistics (Figure 11, Figure 12 and Figure 13), the spatiotemporal distribution of cascade spillage and its associated risks are analyzed.
Table 7.
Multi-year average spillage volumes of the three reservoirs under different hydrological conditions (unit: 108 m3).
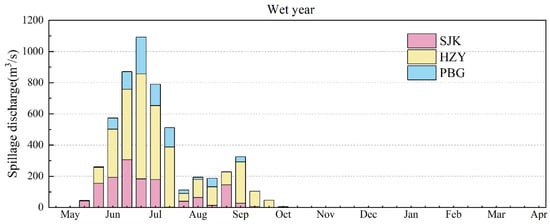
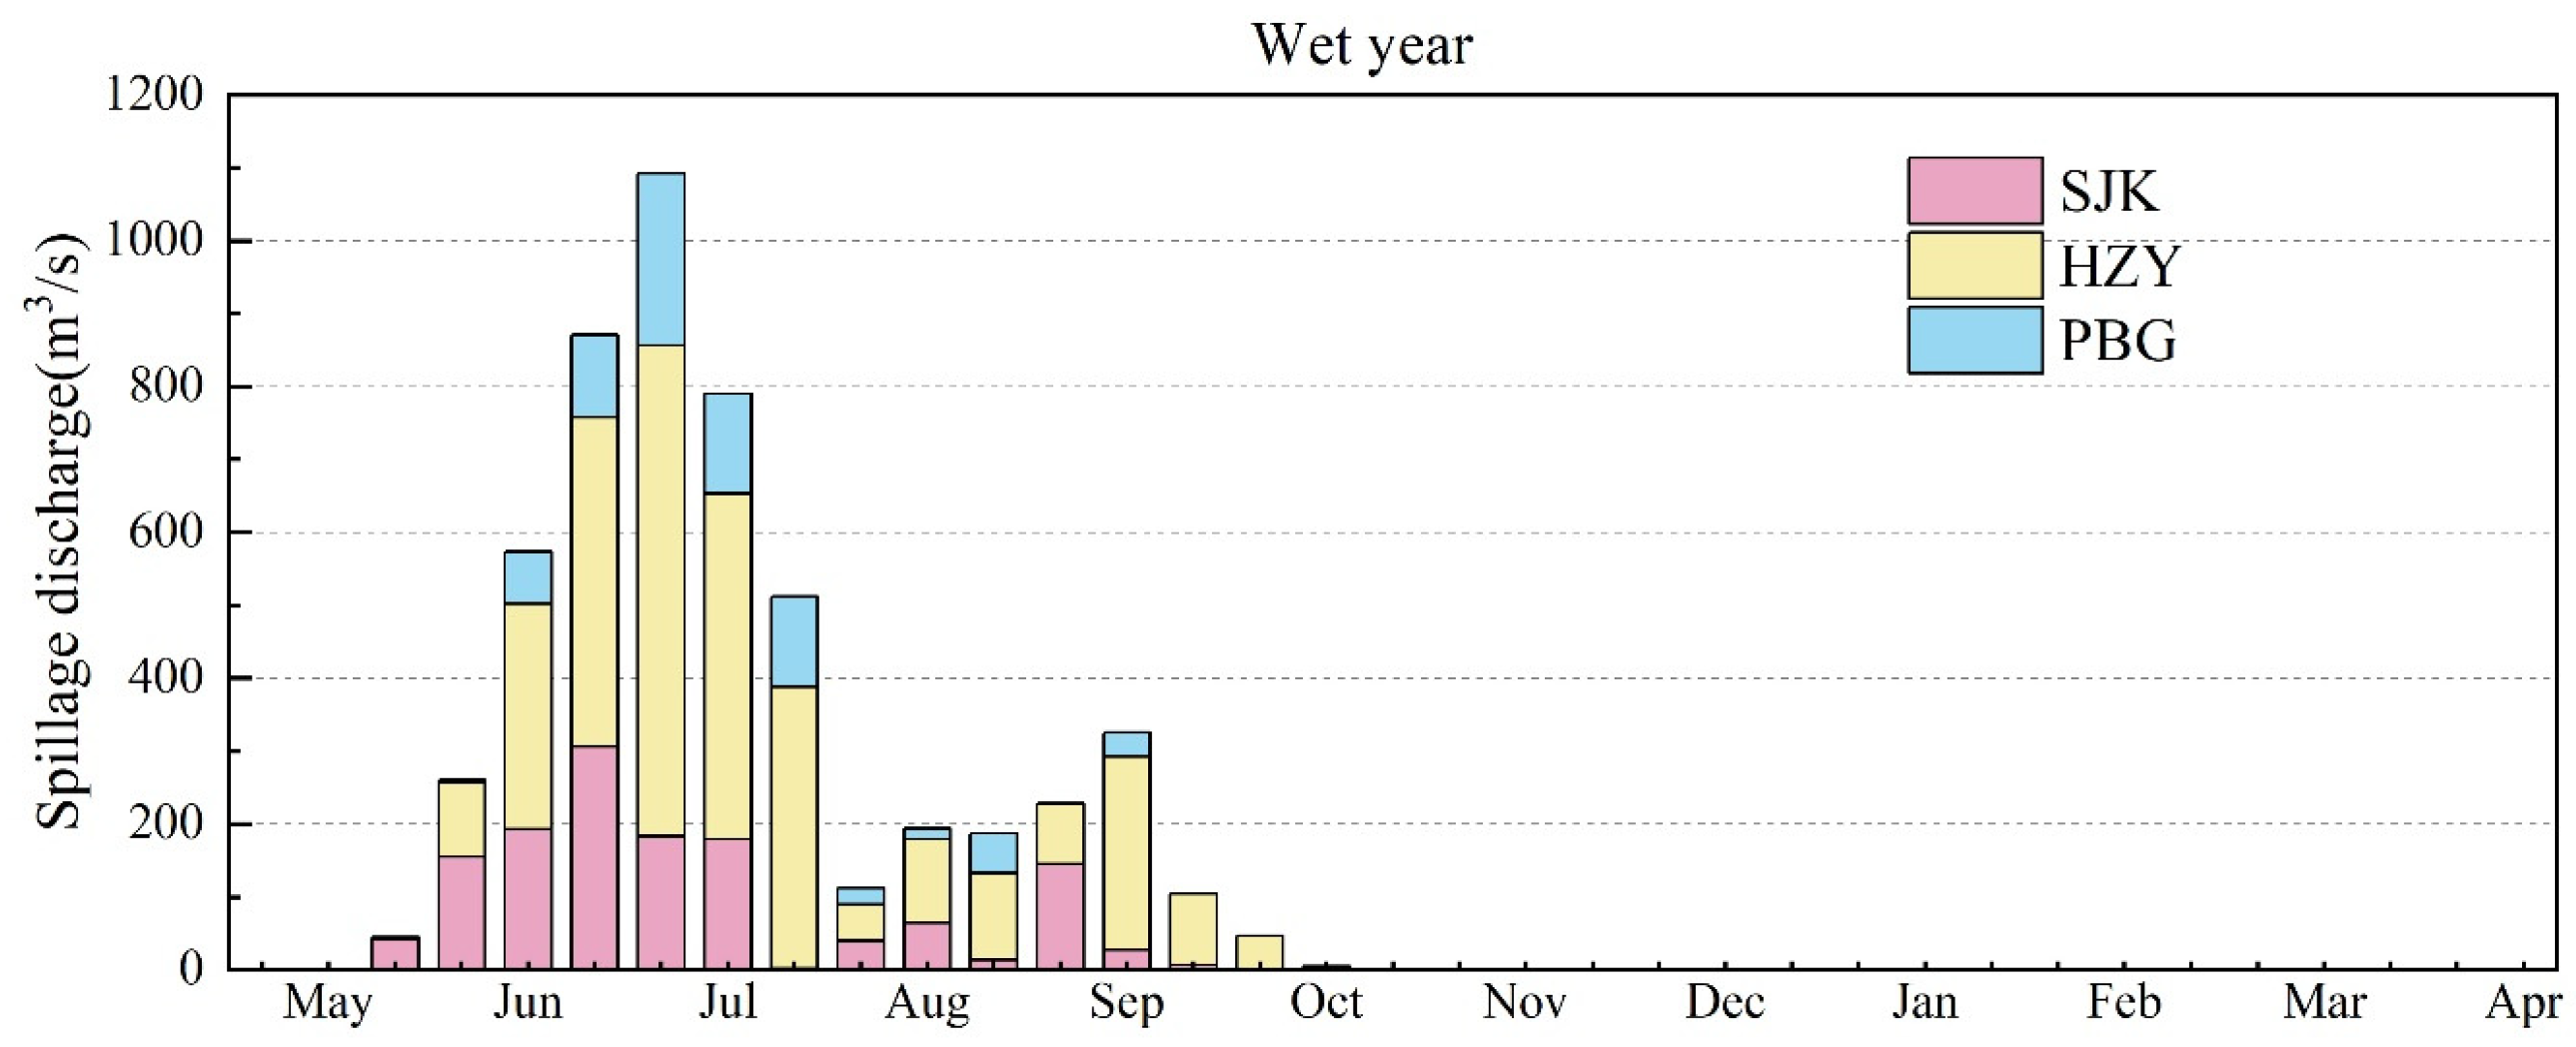
Figure 11.
Ten-day spillage discharges of the three reservoirs in wet years.
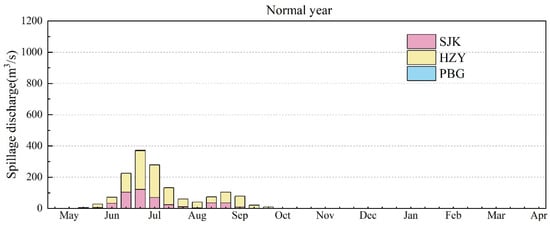
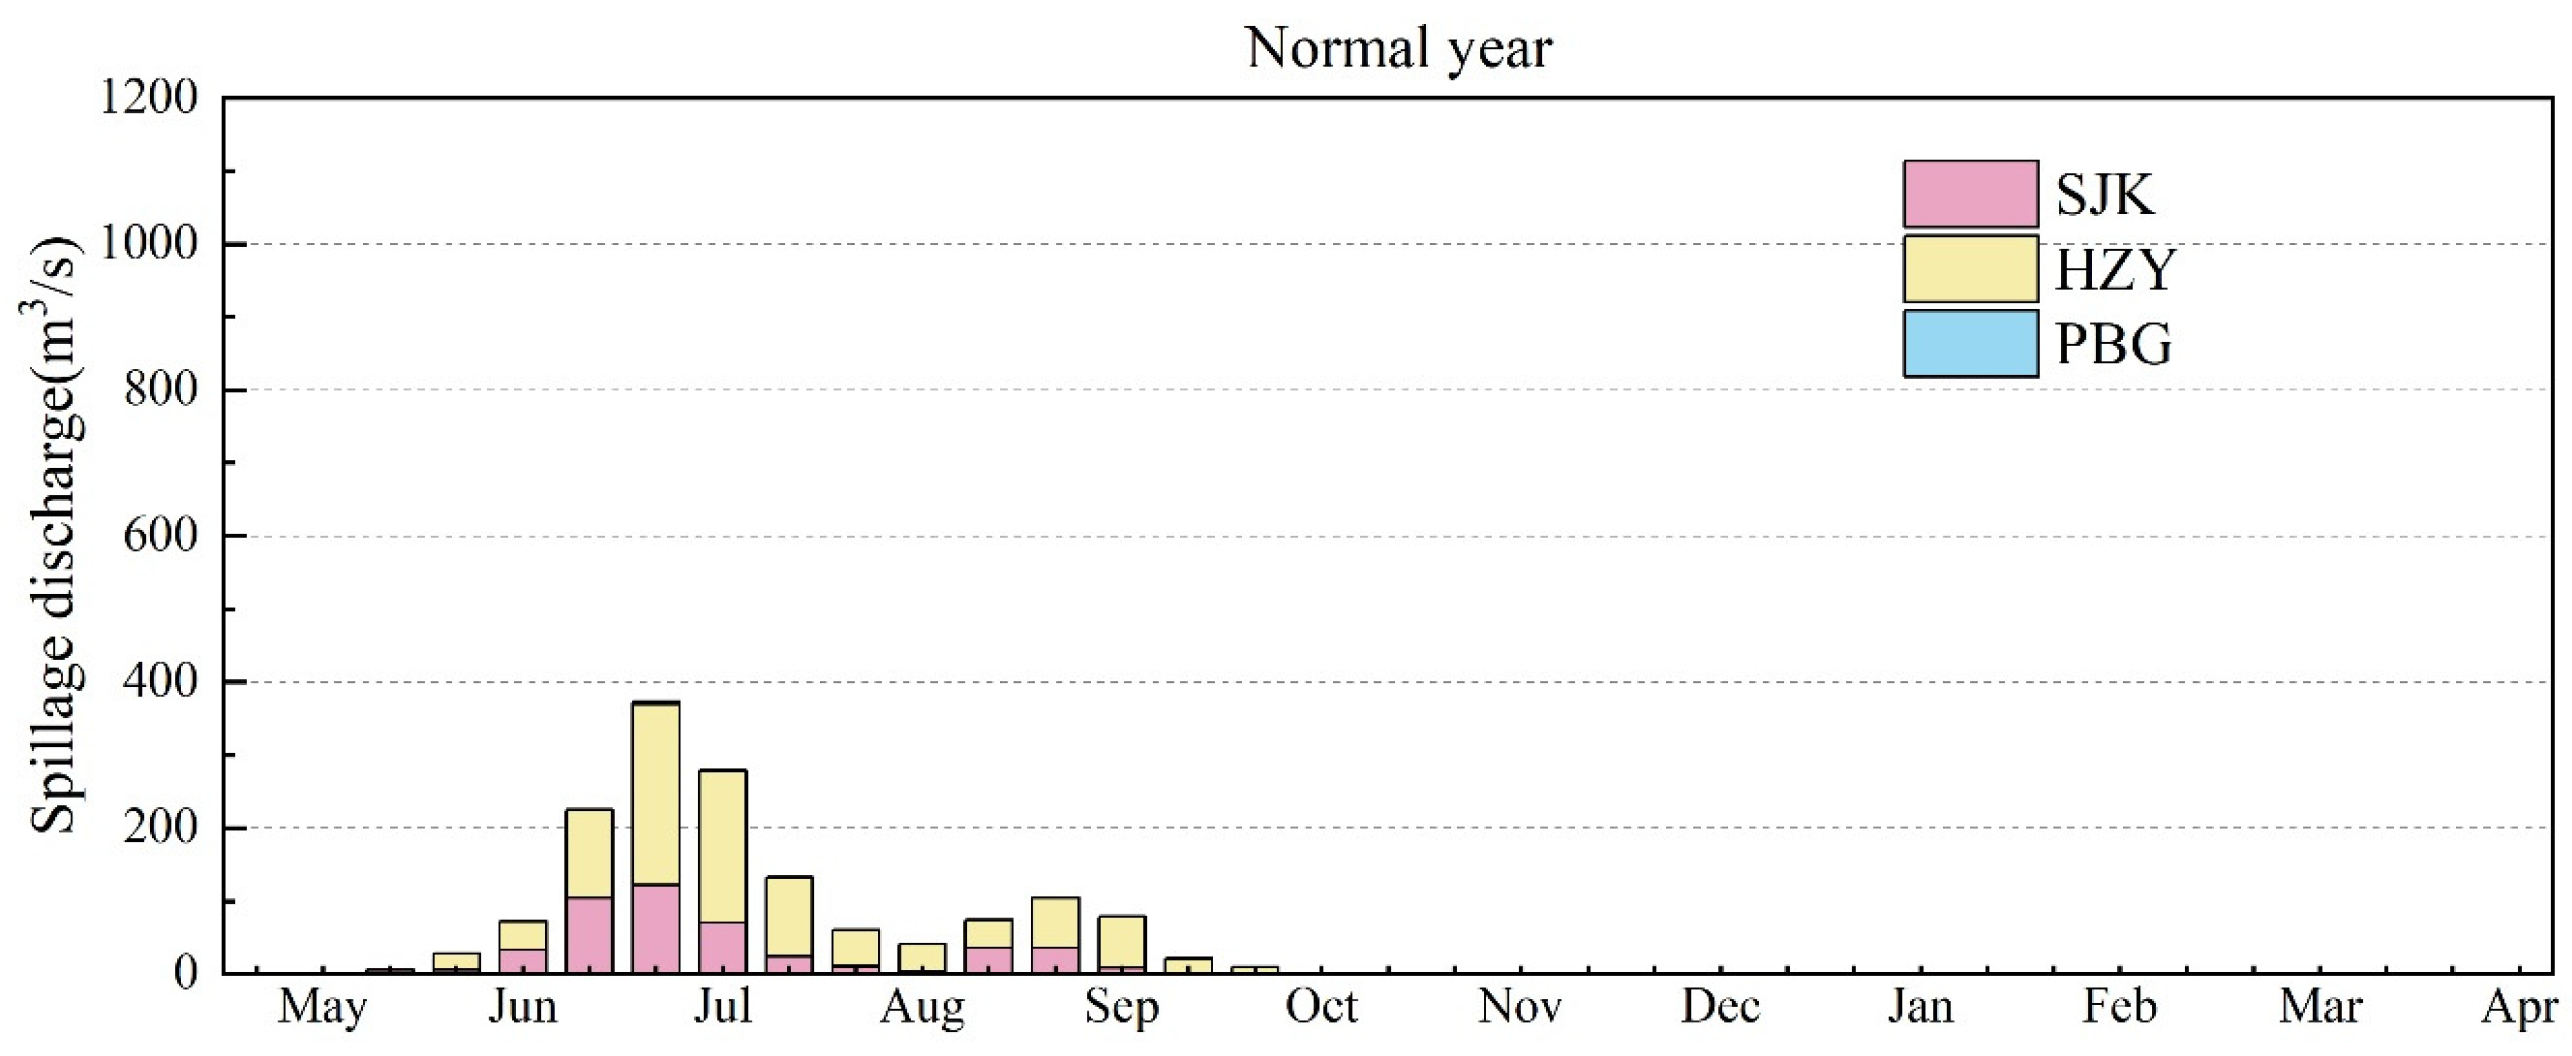
Figure 12.
Ten-day spillage discharges of the three reservoirs in normal years. (The color does not appear in the figure because the spillage discharge is zero).
Figure 13.
Ten-day spillage discharges of the three reservoirs in dry years. (The color does not appear in the figure because the spillage discharge is zero).
Spillage across the three reservoirs exhibits a strongly seasonal intra-annual pattern. No spillage occurs throughout the non-flood season (early November to late April); all spillage is confined to the flood season from late May to early October. Spillage generally commences in late May, reaches its highest frequency and peak magnitude in June–July, gradually recedes in August–September, and essentially ceases after mid-October, by which time the reservoirs have completed refill and operate stably at the NPL with no surplus inflow to discharge. This concentration confirms that spillage is governed primarily by main-flood-season inflows that exceed the turbines’ hydraulic capacity, rather than by refill operations.
Spillage risk increases monotonically from dry to wet years, governed by both annual inflow volume and flood-season intensity. The multi-year average total cascade spillage is 21.4 × 10⁸ m3, comprising 46.2 × 10⁸ m3 in wet years, 13.0 × 10⁸ m3 in normal years, and only 4.8 × 10⁸ m3 in dry years. In wet years, abundant flood-season inflow substantially elevates total spillage, whereas in dry years the limited and relatively steady flood-season flows are almost fully accommodated by the cascade, with only minor instantaneous spillage during a few flood periods, resulting in negligible annual spillage and an overall controllable risk level.
A longitudinal comparison across the cascade reveals marked stratification in spillage characteristics. Houziyan exhibits the highest spillage risk, with annual spillage volumes of 27.5 × 10⁸ m3 in wet years, 9.0 × 10⁸ m3 in normal years, and 3.5 × 10⁸ m3 in dry years; its spillage discharges peak prominently in June–July, reaching a maximum of 673.3 m3/s. Shuangjiangkou ranks second, with spillage volumes of 11.8 × 10⁸, 4.0 × 10⁸, and 1.3 × 10⁸ m3 in wet, normal, and dry years, respectively; its spillage is concentrated in June–September with a peak in early July, but its large storage capacity effectively mitigates the total volume and keeps the risk manageable. Pubugou presents the lowest spillage risk, producing only 7.0 × 10⁸ m3 of spillage in wet years and virtually none in normal and dry years, reflecting its strong storage regulation capability and high compatibility with joint cascade operation. The stratification arises because Houziyan has limited storage relative to the inflows it receives from upstream and interval catchments, whereas Pubugou benefits from the regulation provided by the upstream reservoirs.
5.3. Flood Control Risk During Refill
To evaluate the applicability of the recommended water level strategies, a flood control risk analysis is conducted for Shuangjiangkou, Houziyan, and Pubugou using the recommended operation levels for normal and wetter years (Section 4.5). As the reservoirs progressively impound and water levels rise, available flood control storage decreases month by month (Table 8).
Table 8.
Available flood control storage of the three reservoirs during refill under normal and wetter conditions (unit: 108 m3).
In July, Shuangjiangkou retains 5.143 × 10⁸ m3 of available flood storage, which declines to 3.514 × 10⁸ m3 in August and further diminishes to 0.72 × 10⁸ m3 in September, leaving limited flood buffering capacity in the late flood season. Houziyan maintains a relatively stable available storage of 1.393 × 10⁸ m3 in both July and August, decreasing only slightly to 0.95 × 10⁸ m3 in September. As the core flood control reservoir of the cascade, Pubugou maintains a substantial 7.957 × 10⁸ m3 of available storage in July and August, providing reliable flood protection, although this declines to 3.982 × 10⁸ m3 in September as its water level rises.
At the cascade scale, total available flood storage is 14.493 × 10⁸ m3 in July, sufficient to manage main flood-season events, and decreases only marginally to 12.864 × 10⁸ m3 in August, still retaining an appreciable flood control margin. Entering September, however, total available storage drops sharply to 5.652 × 10⁸ m3, substantially compressing the cascade’s flood buffering space.
Combining the storage trajectory with the basin’s flood season staging results (Section 4.1), the post-flood period from mid-to-late September through early October still carries a non-negligible probability of autumn flood rebound. Under extreme weather, regional concentrated rainstorms can still generate flood events, meaning that September—when flood storage is most depleted—represents the period of highest flood control pressure, with risk markedly elevated relative to July and August.
Accordingly, in practical operation, it is essential to continuously track medium- and long-term hydrometeorological forecasts, monitor real-time rainfall, water levels, and storage changes, and dynamically adjust the joint operation scheme. To address the autumn flood rebound risk in September, the refill pace can be moderately decelerated based on inflow forecasts to proactively reserve necessary flood storage and supplement late-season buffering capacity, thereby mitigating threats from the autumn flood rebound and safeguarding the flood security and operational stability of the cascade.
5.4. Discussion
Embedding flood season staging results as time-varying water level constraints offer clear advantages over a fixed FLWL. Because the constraints follow the physically based transition in flood risk between stages, the leading reservoir can begin refilling in early August without compromising main-flood safety, while explicit recognition of the autumn flood rebound prevents overly aggressive refill in September. This staging-aware approach complements the dynamic control methods proposed in previous studies [35,36] by providing an optimization-based framework for determining the entire refill trajectory rather than adjusting a single water level. Viewed within the broader flood-risk literature, this temporal, operation-oriented perspective is complementary to machine-learning, remote-sensing, and GIS-based multi-criteria susceptibility mapping rather than a substitute for it. Tayyab et al. [16] and Hussain et al. [17] integrated GIS-based analytic hierarchy process weighting, remote-sensing predictors, and machine-learning classifiers such as random forest and XGBoost to map flood susceptibility and capacity-based resilience across landscapes, and Rahman et al. [18] further projected how such susceptibility patterns migrate under future precipitation, population, and land-cover scenarios. These approaches excel at delineating where hazard, exposure, and vulnerability concentrate for land-use and non-structural planning, but they generally treat risk as a spatial surface—static or scenario-averaged—and resolve neither its intra-annual variation nor the regulated flow regime imposed by a reservoir cascade. Conversely, the present framework does not remap spatial susceptibility; it identifies when flood risk rises and recedes within the flood season and translates these transitions into time-varying water-level constraints that actively reshape downstream hazard through reservoir regulation. Coupling the two families—using susceptibility and resilience maps to characterize the consequences of regulated releases, and scenario- or observation-driven precipitation information to update stage boundaries as conditions evolve—would provide a more complete basis for flood risk governance and is a promising direction for future work.
The contrast between wet-then-dry and dry-then-wet years underscores the value of inflow trend classification. In wet-then-dry years, the model exploits early inflows to fill Shuangjiangkou promptly but must manage downstream refill carefully as late flows recede. In dry-then-wet years, it delays refill commitments until post-flood inflows materialize, avoiding the risk of filling on optimistic early-season expectations. This adaptive behavior is consistent with the findings of Chen et al. [29] on the value of seasonal forecasts for impoundment, although the present approach uses historical patterns rather than forecast products; integrating real-time ensemble forecasts into the framework is a natural next step.
The leading reservoir’s compensation effect is a key mechanism behind the cascade benefits. By storing early post-flood flows and releasing them gradually, Shuangjiangkou raises dry-season hydropower output at all downstream stations and reduces their dependence on late-season inflows. This finding is consistent with He et al. [27] for large upper Yangtze cascade systems and Wu et al. [35] for southwestern cascades, and extends them to the specific context of a newly commissioned leading reservoir. From a practical standpoint, the recommended ten-day strategies can be incorporated directly into annual operation plans; they are consistent with approved flood control limits and provide explicit guidance on refill timing and rate for different inflow conditions. The framework is transferable to other cascade systems with newly commissioned leading reservoirs in monsoon-driven basins.
5.5. Limitations and Future Work
Several limitations should be noted. The model operates at a ten-day time step and does not incorporate short- or medium-term forecasts; rolling ensemble forecasts could enable adaptive adjustments, particularly during transition periods. The objective function considers only hydropower generation, and other objectives such as ecological flows, navigation, and water supply could be added in a multi-objective framework [13,36]. The flood risk assessment relies on available storage and design flood routing; a probabilistic risk analysis using stochastic flood simulation would provide additional insight [37,38]. Finally, the inflow trend classification is based on historical patterns, and under climate change the frequency and characteristics of inflow trends may shift, necessitating adaptive updates [39,40].
6. Conclusions
This study developed a flood season staging-based joint refill optimization framework for the Dadu River “three-reservoir five-station” cascade and demonstrated that embedding staging-derived, time-varying water level constraints into GA-based optimization can simultaneously enhance hydropower generation and maintain flood control safety. The mean change-point method consistently divided the flood season into three stages at all four hydrological stations—pre-flood (May), main flood (late May–early August), and post-flood (early August–October)—with early August identified as the key transition point and an autumn flood rebound from mid-September to early October. These findings establish that flood season staging exerts a decisive control on refill timing: the early-August transition permits the leading reservoir to begin impounding while main-flood storage is still required, and the autumn rebound necessitates continued caution in September.
The results further demonstrate that annual inflow volume is the primary control on refill performance, while within-year inflow distribution plays a secondary but important modulating role, especially when annual inflow totals are comparable. Years with abundant early flood-season inflow outperform dry-then-wet years with similar annual totals because early filling sustains higher operating heads throughout the refill period; this finding supports the differentiated water level strategies proposed for normal/wetter and dry years. The leading reservoir emerges as the key determinant of cascade refill rhythm: Shuangjiangkou achieved a 100% filling rate over the 65-year simulation, and its compensation regulation raised generation at all downstream stations, although Houziyan’s 95.4% filling rate reveals the vulnerability of smaller regulating reservoirs to unfavorable inflow trends. Flood control risk remains manageable in July–August but rises sharply in September, when available cascade storage declines to 5.652 × 10⁸ m3 and autumn flood rebound persists, underscoring the need for forecast-informed adaptive refill scheduling. By directly coupling staging with optimization and incorporating inflow trend classification, the framework provides practical support for the Dadu River cascade and offers a transferable approach for other multi-reservoir systems with newly commissioned leading reservoirs in monsoon-driven basins.
Author Contributions
Conceptualization, J.L. and S.M.; methodology, L.Y.; software, Y.X.; validation, Y.Y. and Z.C.; formal analysis, L.Y. and Y.X.; investigation, J.L.; resources, J.Z.; data curation, Y.Z.; writing—original draft preparation, L.Y.; writing—review and editing, J.L.; visualization, S.M.; supervision, Y.Y.; project administration, J.Z.; funding acquisition, Y.Z. All authors have read and agreed to the published version of the manuscript.
Funding
This research was funded by National Natural Science Foundation of China Changjiang Water Science Research Joint Fund (grant number U2340213) and Technical Service Project of CHN Energy Dadu River Basin Hydropower Development Co., Ltd., grant number SCZH-KY-2024-001.
Data Availability Statement
The data presented in this study are available on request from the corresponding author.
Conflicts of Interest
Authors Jia Li, Shiyu Mou, Zaini Chen and Yanjun Zhu were employed by the company CHNEnergy Dadu River Basin Hydropower Development Co., Ltd. The funder was not involved in the study design, collection, analysis, interpretation of data, the writing of this article, or the decision to submit it for publication.
Abbreviations
The following abbreviations are used in this manuscript:
| CHB | Changheba |
| DGS | Dagangshan |
| DP | Dynamic Programming |
| FLWL | Flood Limited Water Level |
| GA | Genetic Algorithm |
| HZY | Houziyan |
| NPL | Normal Pool Level |
| PBG | Pubugou |
| SJK | Shuangjiangkou |
References
- Gernaat, D.E.H.J.; de Boer, H.S.; Daioglou, V.; Yalew, S.G.; Müller, C.; van Vuuren, D.P. Climate change impacts on renewable energy supply. Nat. Clim. Change 2021, 11, 119–125. [Google Scholar] [CrossRef] [Scilit]
- Feng, Z.-K.; Niu, W.-J.; Cheng, C.-T. China’s large-scale hydropower system: Operation characteristics, modeling challenge and dimensionality reduction possibilities. Renew. Energy 2019, 136, 805–818. [Google Scholar] [CrossRef] [Scilit]
- Yakowitz, S. Dynamic programming applications in water resources. Water Resour. Res. 1982, 18, 673–696. [Google Scholar] [CrossRef] [Scilit]
- Yeh, W.W.G. Reservoir Management and Operations Models: A State-of-the-Art Review. Water Resour. Res. 1985, 21, 1797–1818. [Google Scholar] [CrossRef] [Scilit]
- Labadie, J.W. Optimal Operation of Multireservoir Systems: State-of-the-Art Review. J. Water Resour. Plan. Manag. 2004, 130, 93–111. [Google Scholar] [CrossRef] [Scilit]
- Oliveira, R.; Loucks, D.P. Operating rules for multireservoir systems. Water Resour. Res. 1997, 33, 839–852. [Google Scholar] [CrossRef] [Scilit]
- Wardlaw, R.; Sharif, M. Evaluation of Genetic Algorithms for Optimal Reservoir System Operation. J. Water Resour. Plan. Manag. 1999, 125, 25–33. [Google Scholar] [CrossRef] [Scilit]
- Sharif, M.; Wardlaw, R. Multireservoir Systems Optimization Using Genetic Algorithms: Case Study. J. Comput. Civ. Eng. 2000, 14, 255–263. [Google Scholar] [CrossRef] [Scilit]
- Kumphon, B. Genetic Algorithms for Multi-objective Optimization: Application to a Multi-reservoir System in the Chi River Basin, Thailand. Water Resour. Manag. 2013, 27, 4369–4378. [Google Scholar] [CrossRef] [Scilit]
- Reddy, M.J.; Kumar, D.N. Multiobjective Differential Evolution with Application to Reservoir System Optimization. J. Comput. Civ. Eng. 2007, 21, 136–146. [Google Scholar] [CrossRef] [Scilit]
- Huang, W.-C.; Yuan, L.-C.; Lee, C.-M. Linking genetic algorithms with stochastic dynamic programming to the long-term operation of a multireservoir system. Water Resour. Res. 2002, 38, 40-41–40-49. [Google Scholar] [CrossRef] [Scilit]
- Tegegne, G.; Kim, Y.O. Representing inflow uncertainty for the development of monthly reservoir operations using genetic algorithms. J. Hydrol. 2020, 586, 124876. [Google Scholar] [CrossRef] [Scilit]
- Jiang, Z.-Q.; Liu, P.; Ji, C.-M.; Zhang, H.; Chen, Y. Ecological flow considered multi-objective storage energy operation chart optimization of large-scale mixed reservoirs. J. Hydrol. 2019, 577, 123949. [Google Scholar] [CrossRef] [Scilit]
- Coban, H.H. Maximizing Income of a Cascade Hydropower with Optimization Modeling. J. Renew. Energy Environ. 2020, 7, 12–17. [Google Scholar] [CrossRef] [Scilit]
- Hunt, J.D.; Nascimento, A.; Caten, C.S.T.; Tomé, F.M.C.; Schneider, P.S.; Thomazoni, A.L.R.; Castro, N.D.; Brandão, R.; Freitas, M.A.V.; Martini, J.S.C.; et al. Energy crisis in Brazil: Impact of hydropower reservoir level on the river flow. Energy 2022, 239, 121927. [Google Scholar] [CrossRef] [Scilit]
- Tayyab, M.; Hussain, M.; Zhang, J.; Ullah, S.; Tong, Z.; Rahman, Z.U.; Al-Aizari, A.R.; Al-Shaibah, B. Leveraging GIS-based AHP, remote sensing, and machine learning for susceptibility assessment of different flood types in Peshawar, Pakistan. J. Environ. Manag. 2024, 371, 123094. [Google Scholar] [CrossRef] [Scilit] [PubMed]
- Hussain, M.; Tayyab, M.; Ullah, K.; Ullah, S.; Rahman, Z.U.; Zhang, J.; Al-Shaibah, B. Development of a new integrated flood resilience model using machine learning with GIS-based multi-criteria decision analysis. Urban Clim. 2023, 50, 101589. [Google Scholar] [CrossRef] [Scilit]
- Rahman, Z.U.; Zhang, M.; Chen, F.; Ullah, S.; Wang, L.; Ahmad, Z.; Baqa, M.F. Spatiotemporal dynamics of flood susceptibility under future precipitation variability, population growth, and land cover change. Int. J. Appl. Earth Obs. Geoinf. 2026, 147, 105193. [Google Scholar] [CrossRef] [Scilit]
- Liu, P.; Guo, S.; Xiong, L.; Chen, L. Flood season segmentation based on the probability change-point analysis technique. Hydrol. Sci. J. 2010, 55, 540–554. [Google Scholar] [CrossRef] [Scilit]
- Jiang, H.; Yu, Z.; Mo, C.-X. Reservoir Flood Season Segmentation and Optimal Operation of Flood-Limiting Water Levels. J. Hydrol. Eng. 2015, 20, 05014035. [Google Scholar] [CrossRef] [Scilit]
- Killick, R.; Fearnhead, P.; Eckley, I.A. Optimal Detection of Changepoints With a Linear Computational Cost. J. Am. Stat. Assoc. 2012, 107, 1590–1598. [Google Scholar] [CrossRef] [Scilit]
- Sun, B.; Guo, S.; Zhong, S.; Wang, X.; Li, N. Seasonal Design Floods Estimated by Stationary and Nonstationary Flood Frequency Analysis Methods for Three Gorges Reservoir. Hydrology 2025, 12, 2306–5338. [Google Scholar] [CrossRef] [Scilit]
- Lu, S.; Sun, H.; Sun, D.; Guo, M.; Bai, X. Assessment on reservoir flood resources utilization of Ankang Reservoir, China. Resour. Policy 2020, 68, 101745. [Google Scholar] [CrossRef] [Scilit]
- Wan, W.; Lei, X.; Zhao, J.; Wang, M.; Khu, S.-T.; Wang, C. A Forecast-Skill-Based Dynamic Pre-Storm Level Control for Reservoir Flood-Control Operation. Water 2021, 13, 556. [Google Scholar] [CrossRef] [Scilit]
- Liu, P.; Guo, S.; Xiong, L.; Li, W.; Zhang, H. Deriving Reservoir Refill Operating Rules by Using the Proposed DPNS Model. Water Resour. Manag. 2006, 20, 337–357. [Google Scholar] [CrossRef] [Scilit]
- Zhou, Y.; Guo, S.; Xu, C.-Y.; Liu, P.; Qin, H. Deriving joint optimal refill rules for cascade reservoirs with multi-objective evaluation. J. Hydrol. 2015, 524, 166–181. [Google Scholar] [CrossRef] [Scilit]
- He, S.; Guo, S.; Chen, K.; Deng, L.; Liao, Z.; Xiong, F.; Yin, J. Optimal impoundment operation for cascade reservoirs coupling parallel dynamic programming with importance sampling and successive approximation. Adv. Water Resour. 2019, 131, 103375. [Google Scholar] [CrossRef] [Scilit]
- Zhou, Y.; Guo, S.; Chang, F.-J.; Xu, C.-Y. Boosting hydropower output of mega cascade reservoirs using an evolutionary algorithm with successive approximation. Appl. Energy 2018, 228, 1726–1739. [Google Scholar] [CrossRef] [Scilit]
- Chen, K.; Guo, S.; Wang, J.; Qin, P.; He, S.; Sun, S.; Naeini, M.R. Evaluation of GloFAS-Seasonal Forecasts for Cascade Reservoir Impoundment Operation in the Upper Yangtze River. Water 2019, 11, 2539. [Google Scholar] [CrossRef] [Scilit]
- Yuan, L.; Liu, H.; Lu, Y.; Zhou, C.; Zhou, C.; Lu, Y. Multi-objective integrated decision method of cascade hydropower stations based on optimization algorithm and evaluation model. J. Hydrol. 2024, 638, 131533. [Google Scholar] [CrossRef] [Scilit]
- Mou, S.; Qu, T.; Li, J.; Wen, X.; Liu, Y. Joint optimal use of sluices of a group of cascade hydropower stations under high-intensity peak shaving and frequency regulation. Water 2024, 16, 275. [Google Scholar] [CrossRef] [Scilit]
- Yang, Z.; Mou, S.; Chen, Z.; Qu, T. Practice on intelligent dispatch construction of cascade hydropower stations in Dadu River Basin. Express Water Resour. Hydropower Inf. 2025, 46, 90–95, 115. [Google Scholar]
- Nikitina, O.I.; Dubinina, V.G.; Bolgov, M.V.; Parilov, M.P.; Parilova, T.A. Environmental Flow Releases for Wetland Biodiversity Conservation in the Amur River Basin. Water 2020, 12, 2812. [Google Scholar] [CrossRef] [Scilit]
- Gao, Y.; Zhang, Y. Effects of the Three Gorges Project on Runoff and Related Benefits of the Key Regions along Main Branches of the Yangtze River. Water 2019, 11, 269. [Google Scholar] [CrossRef] [Scilit]
- Wu, X.; Cheng, C.-T.; Zeng, Y.; Lund, J.R. Centralized versus distributed cooperative operating rules for multiple cascaded hydropower reservoirs. J. Water Resour. Plan. Manag. 2016, 142, 05016008. [Google Scholar] [CrossRef] [Scilit]
- Chang, L.C.; Chang, F.J. Multi-objective evolutionary algorithm for operating parallel reservoir system. J. Hydrol. 2009, 377, 12–20. [Google Scholar] [CrossRef] [Scilit]
- Zhang, X.; Liu, P.; Xu, C.-Y.; Gong, Y.; Cheng, L.; He, S. Real-time reservoir flood control operation for cascade reservoirs using a two-stage flood risk analysis method. J. Hydrol. 2019, 577, 123954. [Google Scholar] [CrossRef] [Scilit]
- Mo, C.; Jiang, C.; Lei, X.; Cen, W.; Yan, Z.; Tang, G.; Li, L.; Sun, G.; Xing, Z. Optimal Scheduling of Reservoir Flood Control under Non-Stationary Conditions. Sustainability 2023, 15, 11530. [Google Scholar] [CrossRef] [Scilit]
- Chang, J.-X.; Wang, X.; Li, Y.; Wang, Y.; Zhang, H. Hydropower plant operation rules optimization response to climate change. Energy 2018, 160, 886–897. [Google Scholar] [CrossRef] [Scilit]
- Song, Y.; Wang, H. Study on stage method of reservoir flood season. Energy Rep. 2022, 8, 138–146. [Google Scholar] [CrossRef] [Scilit]

Disclaimer/Publisher’s Note: The statements, opinions and data contained in all publications are solely those of the individual author(s) and contributor(s) and not of MDPI and/or the editor(s). MDPI and/or the editor(s) disclaim responsibility for any injury to people or property resulting from any ideas, methods, instructions or products referred to in the content. |
© 2026 by the authors. Licensee MDPI, Basel, Switzerland. This article is an open access article distributed under the terms and conditions of the Creative Commons Attribution (CC BY) license.