


Abstract
Community irrigation systems integrate water, infrastructure, governance, environmental, and market conditions, yet comparative evidence on their multidimensional sustainability remains limited in the Andes. This cross-sectional secondary analysis developed a bounded 10-indicator formative territorial sustainability index for 241 community irrigation systems in Azuay Province, Ecuador, and used multivariable models to examine conditional associations with system characteristics. Physical infrastructure condition and organizational activity planning showed the clearest positive coefficient patterns in the global model under nominal inference, but neither remained below 0.05 after Benjamini–Hochberg adjustment; the global model explained 12.1% of between-system variation. In the original water-domain model, reported source-area contamination was associated with a lower score (B = −14.23, 95% CI: −22.00 to −6.47; BH-adjusted p = 0.016). When perceived water quality was removed from the domain outcome, the contamination coefficient remained negative, although multiplicity-adjusted support was attenuated. The aggregate–domain contrast illustrates how a multidimensional composite score can obscure a domain-specific environmental constraint. The framework extends descriptive inventory information into a comparative, sensitivity-tested territorial assessment, but the non-probability, questionnaire-based design does not support causal or population-wide inference. Direct hydrological and water-quality monitoring should complement future applications.
1. Introduction
Sustainable irrigation in mountain watersheds cannot be understood solely as a problem of technical water delivery. Irrigation sustains food production and rural livelihoods while interacting with river flows, soils, groundwater, ecosystems, infrastructure, and the institutions governing water access and allocation. Improvements in application efficiency do not necessarily reduce total water depletion when they are accompanied by expansion, intensification, or reallocation without appropriate basin-scale controls [1,2]. Irrigation sustainability therefore concerns the combined functioning of water resources, productive activities, ecological processes, and territorial institutions rather than the performance of a single technical component. Recent research on smallholder and community-managed irrigation likewise shows that sustained improvements require combinations of technological and socio-institutional capacities and multidimensional management considerations rather than isolated infrastructure interventions [3,4].
This interdependence is particularly relevant for community-managed irrigation systems. Social–ecological approaches conceptualize irrigation systems as coupled configurations of resource systems, resource units, users, governance arrangements, and their interactions [5], while adaptive-governance perspectives emphasize coordination across decision levels, institutional learning, and the capacity to adjust rules under changing environmental conditions [6]. In the tropical Andes, these institutional relationships operate within mountain ecosystems where páramo soils, vegetation, wetlands, and headwaters play important roles in water storage, streamflow generation, and flow regulation [7,8,9,10]. Irrigation governance in the Andes also involves the coexistence of formal and informal institutions, water rights, collective action, locally negotiated rules and water-sharing arrangements, infrastructure management, and relationships with public institutions [11,12,13]. Recent Ecuadorian research accordingly evaluates community-managed Andean irrigation through context-specific sustainability indicators spanning environmental, social, economic, political, and technological dimensions [14].
Within this setting, territorial sustainability provides a broader conceptual lens than irrigation performance alone. From a geographical perspective, territorial sustainability is place-specific, multidimensional, and multiscale: it emerges from interactions between social and ecological subsystems and is shaped by economic, political, institutional, cultural, and environmental processes mediated by actors and governance arrangements [15]. Territory is therefore not merely the geographic location in which sustainability is assessed, but a dynamic socio-environmental system in which resource use, institutions, communities, and ecosystem functions interact over time and across scales [15]. Quantitative territorial assessments similarly emphasize that sustainability performance depends on the geographic scale adopted and on the social, economic, and environmental attributes represented by the selected indicators [16]. Accordingly, this study uses territorial sustainability as a place-based analytical lens: community irrigation systems are treated as territorially embedded social–ecological units through which mountain water resources, infrastructure, collective governance, agricultural production, and market relations interact.
Operationalizing such a broad construct requires an explicit empirical boundary. Composite indicators can synthesize multidimensional sustainability and facilitate comparison among heterogeneous units, but their meaning depends on indicator selection, normalization, weighting, aggregation, and the degree of compensation allowed across dimensions [17,18]. These methodological choices contain normative elements and should therefore be transparent and examined through sensitivity analysis [18]. Moreover, when assessment is constrained by the variables consistently available across units, a composite index is more appropriately interpreted as a relative representation of selected sustainability attributes than as an exhaustive measure of sustainability [18]. In the present study, territorial sustainability is therefore operationalized as a bounded, formative, system-level measure of three domains consistently represented in the provincial irrigation inventory: water condition and hydrological pressure, environmental governance and conservation, and commercial organization and market constraints. The index is not intended to capture every ecological, hydrological, economic, institutional, or social dimension of territorial sustainability.
This boundary is especially important for the water component. Agricultural water performance is commonly evaluated using direct measures such as irrigation efficiency, water productivity, relative irrigation or water supply, adequacy, equity, relative evapotranspiration, depleted fraction, and dependability [19]. These measures provide information that questionnaire-based indicators cannot replace. The provincial inventory analyzed here did not contain consistent direct measurements of water productivity, crop water consumption, physicochemical or microbiological water quality, or system-level water balances for all irrigation systems. Consequently, the water domain used in this study represents reported water condition and hydrological pressure—through perceived water quality and reported changes in flows and drought/flood occurrence—rather than a comprehensive measurement of hydrological performance. This distinction defines the practical scope of the index and is essential when interpreting both aggregate and domain-specific results.
Recent studies have advanced sustainability assessment for community irrigation but leave a distinct analytical gap. Cachipuendo et al. developed 31 context-specific indicators for Ecuadorian community irrigation systems, organized across seven sustainability attributes and five dimensions and aligned with multiple Sustainable Development Goals (SDGs) [14]. Berhe et al. combined multicriteria analysis and indicator-based sustainability assessment to examine community-managed irrigation systems and highlighted both the value and limitations of multidimensional approaches under data constraints [4]. Most directly, Berrones and Célleri analyzed 235 irrigation systems from the same 2022 Azuay provincial inventory used as the source for the present study, comparing sustainability challenges across system-size categories through descriptive analyses, non-parametric tests, and correlations [20]. Their study documented water-resource, socioeconomic, user, and governance challenges and emphasized the need for systematic performance assessment. The unresolved question addressed here is different: whether between-system variation can be summarized through a theoretically bounded multidimensional sustainability measure and whether technical, organizational, environmental, and market characteristics show conditional associations with that measure after simultaneous adjustment for other system attributes.
Azuay Province provides a pertinent setting for addressing this question. Its mountain territory combines inter-Andean valleys, montane ecosystems, and high-elevation páramo, while irrigation systems operate under heterogeneous climatic, productive, and institutional conditions. Research in the Paute River watershed has documented interconnected environmental and livelihood vulnerabilities associated with land-use change, erosion risk, and migration [21], while provincial planning documents describe marked physical, environmental, productive, infrastructural, and territorial heterogeneity across Azuay [22]. These characteristics make the province suitable for examining sustainability as territorially differentiated rather than as a uniform property of irrigation systems. At the same time, the institutional nature of the inventory and its non-probability coverage require that inference remain restricted to the systems represented in the analytical database.
The SDGs provide a broader normative framework within which these territorial conditions can be interpreted. Community irrigation is potentially relevant to food production, water management, infrastructure, responsible production, climate adaptation, ecosystem conservation, governance, and institutional cooperation, and recent Ecuadorian research has likewise aligned irrigation-sustainability indicators with multiple SDG targets [14,23]. In this study, that interpretive layer concerns SDGs 2, 6, 9, 12, 13, 15, 16, and 17. However, SDG targets are not outcomes of the econometric models estimated here, and statistical relationships among SDGs are not directly tested. The SDG framework is therefore used only as a secondary interpretive layer for considering how empirical associations observed at irrigation-system level may relate to wider sustainable-development pathways. This preserves the link between irrigation sustainability and the 2030 Agenda without assigning causal or statistical meaning to relationships that were not directly estimated.
Accordingly, this study aims to develop and empirically apply an econometric assessment of territorial sustainability among community irrigation systems in Azuay Province, Ecuador. Using a cross-sectional secondary analysis of 241 systems, the study: (i) constructs a transparent 0–100 formative index representing the three bounded domains described above; (ii) estimates conditional associations between aggregate and domain scores and technical, organizational, environmental, and market characteristics; (iii) evaluates the stability of the principal coefficient patterns through alternative index specifications, complete-case analysis, multiplicity assessment, and additional sensitivity and diagnostic analyses; and (iv) uses the SDGs as a secondary framework for interpretation rather than as statistically estimated outcomes. The contribution lies in integrating and applying established sustainability-assessment and econometric procedures to characterize territorial variation among community irrigation systems, rather than in proposing a fundamentally new statistical methodology. Given the observational and geographically bounded design, the estimates are interpreted as conditional associations among the analyzed Azuay systems and not as causal effects or population-wide estimates for all irrigation systems in Azuay or elsewhere in the Ecuadorian Andes.
2. Materials and Methods
2.1. Study Design and Territorial Context
A quantitative, observational, cross-sectional secondary analysis was conducted to examine between-system variation in territorial sustainability among community irrigation systems. The study area was Azuay Province in southern Ecuador, a mountain territory comprising inter-Andean valleys, montane ecosystems, and high-elevation páramo. Community irrigation systems operate across heterogeneous climatic, productive, environmental, and institutional settings. The community irrigation system was the unit of analysis.
The primary analyses included 241 irrigation systems. Of these, 154 had valid geographic coordinates within Azuay and are displayed in Figure 1; all 241 systems were retained in the nonspatial analyses. Geographic information was used to describe the territorial distribution of the analytical sample and, in a sensitivity analysis, to examine whether residual spatial dependence affected the main econometric specification. Because the source inventory was not based on probability sampling, statistical inference in this study refers to associations among the observed systems and not to population-level estimates or causal effects for all irrigation systems in Azuay or the Ecuadorian Andes.
Figure 1.
(a) Location of Azuay Province in mainland Ecuador. (b) Elevation and georeferenced locations of the 154 systems with valid coordinates within the 241-system analytical sample. Elevation is expressed in meters above sea level. Data sources: survey coordinates; GADM version 4.1 administrative boundaries [24]; and WorldClim version 2 elevation data at 30 arc-seconds [25]. All spatial processing and cartographic design were undertaken by the authors.
2.2. Data Source, Questionnaire, and Analytical Sample
The source data were collected in 2022 through the provincial inventory of community irrigation systems undertaken by the Provincial Government of Azuay to support territorial irrigation planning and the preparation of the Provincial Irrigation, Drainage and Groundwater Plan of Azuay [26]. The data-collection instrument was jointly developed by the Directorate of Irrigation of the Provincial Government of Azuay, the Department of Water Resources and Environmental Sciences (iDRHiCA) of the University of Cuenca, and the consulting team, and was implemented using the KoboToolbox digital platform.
The inventory compiled technical, organizational, productive, commercial, and environmental information at irrigation-system level. The source database available for the present study contained 463 recorded fields organized into 11 questionnaire sections addressing location, water abstraction, water quality and flow, infrastructure, distribution practices, administration, environmental conservation, productive activities, commercialization, and general system characteristics. The original blank questionnaire, including the electronic informed-consent item presented before the substantive questionnaire items, is provided as Supplementary File S2.
The original institutional database contained 267 irrigation-system records, consistent with the number of available systems reported by Berrones and Célleri [20]. Construction of the analytical dataset proceeded in two screening stages. Fourteen substantially incomplete records were not retained during the initial data-quality screening, leaving 253 systems for detailed analytical review. Twelve additional systems were excluded because missing information was sufficiently extensive or affected variables required for the predefined analytical workflow. The final analytical sample therefore comprised 241 community irrigation systems (267 → 253 → 241). No fixed threshold for the percentage of missing data was imposed; exclusions were based on the availability of information required to construct a coherent analytical record for the planned analyses.
A previous study by Berrones and Célleri [20] analyzed 235 systems from the same 2022 provincial inventory, using size-based comparisons, non-parametric tests, correlations, and descriptive assessments of water-resource, user, socioeconomic, and governance conditions. The present study addresses a different analytical question and uses an independently defined analytical sample and workflow. Specifically, it constructs a bounded formative territorial sustainability index and estimates multivariable conditional associations with technical, organizational, environmental, and market characteristics.
No new primary data were collected for the present study. The analysis used a pre-existing, de-identified institutional database; respondents were not recruited or re-contacted, no intervention was performed, and no additional personal information was collected. Because the original inventory did not use probability sampling, the analytical sample supports comparative inference among the observed systems rather than population-level estimates for all community irrigation systems in Azuay or Ecuador.
2.3. Data Cleaning and Multiple Imputation
Data preparation included checks for duplicate records, impossible values, coding consistency, variable ranges, logical consistency, and missingness. Within the final 241-system analytical dataset, 158 systems (65.56%) were complete across the 67 variables in the pre-imputation dataset, whereas 83 had at least one missing value. Twelve variables contained missing observations, totaling 151 missing cells, with variable-level missingness ranging from 1.24% to 11.62%. Complete-case deletion was not adopted as the primary strategy because it would discard partially observed information and reduce statistical precision; depending on the missing-data mechanism, it can also alter the composition of the analytical sample [27].
Multiple imputation was implemented under a Missing at Random (MAR) working assumption conditional on the observed information included in the imputation model. Because MAR cannot be verified from the observed data alone, it was treated as a working assumption rather than as an established property of the dataset. The imputation model included every incomplete variable used in the final econometric specifications, together with substantively relevant auxiliary variables spanning technical, organizational, productive, commercial, environmental, and system-level information. Including observed auxiliary information can improve the plausibility of the imputation model and reduce bias and loss of precision when those variables are informative about incomplete variables [27]. Multiple imputation followed a fully conditional specification framework [28,29,30]. All 12 incomplete variables were numerical. Seven were quantitative measurements: distance from source to headworks, authorized flow, irrigated area, maintenance investment, maximum and minimum distribution duration, and dependence on agricultural activities (%). Five were discrete counts: number of water rights, number of women on the board, number of irrigation-system users, number of water sources, and assembly meeting frequency. No binary, ordinal, or unordered categorical variable contained missing values in the final analytical dataset; such variables could enter the predictor matrix as fully observed predictors or auxiliary variables but were not themselves imputed. Consequently, logistic, ordinal-logistic, and multinomial-logistic imputation models were not used.
All 12 incomplete numerical variables were imputed using predictive mean matching (PMM). In the mice package, PMM is implemented for numeric variables and restricts imputations to observed donor values [30]. This property was particularly appropriate for the present variables because it preserved their observed empirical support, including the integer-valued support of the discrete count variables. Twenty completed datasets were generated in R using multivariate imputation by chained equations (MICE), with 20 iterations, five donors, and a fixed random seed of 20260802. Using 20 imputations provided a more stable basis for pooled inference than relying on a very small number of imputed datasets [31]. The initial predictor matrix was generated using minimum-correlation and usable-case thresholds of 0.05 and 0.25, respectively, and was subsequently supplemented with substantively relevant auxiliary variables. Redundant dummy variables were excluded as predictors. The numbers of water rights and irrigation-system users were nearly perfectly correlated (); both variables were retained in the dataset but were prevented from predicting one another during imputation to avoid numerical instability. The final imputation run produced no logged events. Convergence was assessed from the imputation-chain traces, and the plausibility of the completed data was examined by comparing observed and imputed distributions and numerical ranges [30].
The 10 indicators constituting the final territorial sustainability index were complete for all 241 systems and were therefore not imputed. The aggregate index and its three domain scores were constructed exclusively from these observed indicators after the indicator audit described below. Multiple imputation consequently affected only incomplete variables used in the econometric models or related analyses; the resulting model estimates were subsequently pooled across the 20 completed datasets according to the multiple-imputation framework [28,30].
As a sensitivity analysis to the imputation strategy, the principal global econometric model was also estimated using only systems with complete data for all variables required by that specification (n = 226). Agreement in coefficient direction and approximate magnitude between the multiply imputed and complete-case models was used to assess sensitivity to the treatment of missing data; this comparison does not constitute a test of the Missing at Random assumption.
2.4. Indicator Audit and Construction of the Formative Territorial Sustainability Index
The dependent variable was operationalized as a formative territorial sustainability index. Under a formative specification, the indicators jointly constitute the operational measure rather than being treated as interchangeable manifestations of an underlying reflective construct [32,33]. Accordingly, the indicator audit prioritized content coverage, normative directionality, and minimization of conceptual and operational overlap with the regression predictors. Indicators derived from the same questionnaire item as a predictor were removed, as were conceptually overlapping indicators and conditional commercialization items that could generate mechanical associations between the constructed outcome and its regressors.
The final index contains 10 indicators organized into three domains: (1) water condition and hydrological pressure; (2) environmental governance and conservation; and (3) commercial organization and market constraints. Composite-indicator guidance emphasizes that weighting and aggregation choices affect the meaning of the resulting index and should therefore be theoretically explicit and subjected to sensitivity assessment [18,34,35]. Equal weighting was adopted as a transparent baseline rather than as an empirically optimal solution. Indicators received equal weights within each domain, and the three domains received equal weights in the aggregate index. This hierarchical equal-weighting structure prevents domains containing more indicators from mechanically receiving greater aggregate weight, while recognizing that equal weighting remains a normative choice [34,35]. Because arithmetic aggregation is compensatory, domain-specific scores were retained and reported alongside the aggregate score so that unfavorable conditions in one domain remained visible even when offset numerically by more favorable conditions elsewhere [34,35]. Sensitivity to the weighting choice was assessed using an alternative specification in which each of the 10 indicators received equal aggregate weight rather than assigning equal aggregate weight to the three domains. Table 1 presents the final composition, directional coding, and main-specification weights.
Table 1.
Indicators, directional coding, domains, and main-specification weights used to construct the formative territorial sustainability index.
For system , the score for domain was calculated as follows:
where is the oriented score for indicator in domain , is the number of indicators in that domain, and denotes the water, environmental-governance, and market domains, respectively. Accordingly, , , and in Equation (2) are the specific instances of obtained by setting , , and , respectively.
The aggregate index was then calculated as follows:
where is the formative territorial sustainability index for system , and , , and are its three domain scores. Higher values indicate comparatively more favorable observed conditions; the index is not a probabilistic or causal measure.
2.5. Exploratory Structural Assessment
Principal component analysis (PCA) was used solely as an exploratory structural diagnostic of the 10-indicator set. The three analytical domains were defined a priori through the conceptual and indicator audit described in Section 2.4 and were not derived from the PCA. Accordingly, component extraction did not determine indicator inclusion, domain assignment, or index weights, and the PCA was not used to claim factorial or reflective-scale validation. Its purpose was limited to examining whether the observed correlation structure showed an approximate multidimensional organization compatible with the conceptually defined domains.
Sampling adequacy and the presence of sufficient correlation structure for exploratory component analysis were examined using the Kaiser–Meyer–Olkin (KMO) statistic and Bartlett’s test of sphericity. The number of components was evaluated using parallel analysis, which compares the observed eigenvalues with eigenvalues generated from random data of corresponding dimensionality and sample size [36]. A three-component Varimax-rotated solution was then examined using Pearson correlations as the primary specification. Because nine indicators were binary and perceived water quality was ordinal, a sensitivity analysis was also conducted using a mixed correlation matrix combining tetrachoric correlations for the binary indicators and a polychoric correlation for the ordinal indicator. The mixed matrix was smoothed when required to ensure numerical admissibility before component extraction. Absolute loadings of 0.40 or greater were treated as descriptively salient, while substantive interpretation remained based primarily on theoretical and content coherence rather than on loading magnitude alone [36].
Similarity between the Pearson and mixed-correlation solutions was evaluated using Tucker’s congruence coefficient [37]. Following Lorenzo-Seva and ten Berge [37], congruence values from 0.85 to 0.94 were interpreted as indicating fair similarity, whereas values above 0.95 indicated that the compared factors or components could be considered equal; these values were used as descriptive benchmarks rather than as formal hypothesis-testing thresholds. Because the 10 final indicators were complete for all 241 systems and therefore identical across the 20 completed datasets, PCA was conducted once on the observed indicator matrix rather than repeatedly estimating identical structural solutions after multiple imputation. Sampling stability was evaluated through 1000 case-resampling bootstrap replications. In each replication, 241 systems were sampled with replacement, the three-component solution was re-estimated, and components were aligned with the reference solution through optimal permutation and sign adjustment. The distributions of congruence coefficients, primary loadings, and component assignments were then summarized. These analyses were used to characterize the empirical stability of the exploratory structure and not as criteria for accepting or rejecting the formative index.
2.6. Econometric Specification
The aggregate formative territorial sustainability index was modeled as a continuous 0–100 outcome using ordinary least squares (OLS). The analytical objective was to estimate conditional associations between the index and observed irrigation-system characteristics, rather than to maximize predictive performance or identify causal effects. Fourteen predictors were entered simultaneously to represent infrastructure and water regulation, water quality, institutional formalization, commercialization, production, organizational capacity, participation, and operational problems. Predictor selection was theory-informed and did not rely on automated stepwise procedures. Variables incorporated into the final sustainability index were excluded from the predictor set to minimize direct conceptual and operational overlap between the dependent variable and the explanatory variables. The resulting specification was therefore interpreted as a multivariable associational model conditional on the included system characteristics; it was not intended to represent an exhaustive model of the determinants of territorial sustainability.
Three nonnegative count variables—assembly meeting frequency, number of water rights, and number of women on the board—showed right-skewed distributions and included zero-valued observations. They were therefore transformed as , preserving zero observations while reducing right-skewness. Accordingly, the transformed predictors were , , and . Table 2 defines the 14 predictors, coding rules, analytical domains, and reference categories used in the primary econometric specification.
Table 2.
Predictors, coding rules, reference categories, and analytical domains in the primary econometric model.
The model estimated separately in each completed dataset was specified as follows:
where is the intercept, is predictor for irrigation system , is its regression coefficient, and is the system-specific error term. Because the dependent variable is expressed on a 0–100 scale, unstandardized coefficients are interpreted in index points. For binary predictors, a coefficient represents the adjusted difference in the aggregate sustainability index between the indicated category and its reference category, conditional on the remaining predictors. For the three log-transformed count predictors, a coefficient represents the adjusted difference in the index associated with a one-unit increase in , conditional on the remaining predictors. All coefficients are interpreted as conditional associations and not as causal effects.
2.7. Pooling, Robust Inference, Diagnostics, and Sensitivity Analyses
The primary model was fitted separately in each of the 20 completed datasets. Coefficient estimates and their variance–covariance matrices were combined across imputations according to Rubin’s rules [28]. For the primary coefficient-level inference, the coefficient vector and HC3 heteroscedasticity-consistent covariance matrix were obtained separately in each completed dataset and then combined within the multiple-imputation framework. HC3 was selected because of its favorable finite-sample performance and was used independently of the outcome of a preliminary heteroscedasticity test [38]. Overall model significance was evaluated using a pooled D1 test, and pooled R2 was reported with a 95% confidence interval. Because the primary model simultaneously evaluated 14 non-intercept coefficients, nominal HC3 p-values and confidence intervals were supplemented by a Benjamini–Hochberg false-discovery-rate adjustment across these 14 coefficients [39]. The adjusted p-values were treated as a multiplicity sensitivity analysis of coefficient-level evidence and did not alter the prespecified global-model structure.
Multicollinearity was examined using variance inflation factors (VIFs). Residual normality, heteroscedasticity, and functional form were evaluated in the first completed dataset as a representative diagnostic dataset using the Shapiro–Wilk, Breusch–Pagan, and Ramsey RESET tests, respectively. Cook’s distance was calculated separately in each of the 20 completed datasets using as a screening threshold. Systems exceeding this threshold in at least one completed dataset were combined into a single set and excluded only in an influence sensitivity analysis; no observation was removed from the primary analysis on the basis of influence diagnostics.
Model sensitivity was examined through complementary specifications. These included: (i) the complete-case global model described in Section 2.3 (); (ii) the alternative equal-indicator weighting specification described in Section 2.4, in which each of the 10 indicators received equal aggregate weight; (iii) an 11-indicator specification that restored production programming to the market domain; (iv) re-estimation of the primary index model after excluding organizational activity planning from the predictor set; and (v) re-estimation after excluding the union of systems identified by the Cook’s-distance screening procedure. Unless otherwise stated, these models retained the same predictor structure as the primary specification. For the multiply imputed sensitivity models, pooled HC3 coefficients with 95% confidence intervals and pooled estimates with 95% confidence intervals were calculated to facilitate comparison across specifications; the complete-case model used HC3 inference and conventional and adjusted .
Three additional analyses addressed domain-specific and spatial sensitivity. First, separate regressions were estimated for the water-condition and hydrological-pressure, environmental-governance and conservation, and commercial-organization and market-constraints scores using the same predictor set. Because these models were exploratory, Benjamini–Hochberg-adjusted p-values were calculated jointly across all non-intercept coefficients from the three domain models. Second, to assess potential conceptual overlap between reported contamination around the water source and perceived water quality, the water-domain model was re-estimated after removing perceived water quality from the outcome; Benjamini–Hochberg adjustment was then applied across the 14 non-intercept coefficients of this sensitivity model. Third, residual spatial dependence was examined in the 150 systems having both valid geographic coordinates and complete data for the global specification. Moran’s was evaluated using symmetric -nearest-neighbor spatial weights with , , and , row-standardized weights, and 9999 two-sided Monte Carlo permutations. The use of multiple neighborhood definitions was intended to assess whether conclusions depended on a single spatial-weight specification.
2.8. SDG-Oriented Interpretive Framework
The SDGs were used as a secondary interpretive framework and not as outcomes or explanatory variables of the econometric analysis. No SDG-target scores were constructed, and no statistical associations, reciprocal relationships, or causal effects among SDG targets were estimated. After completion of the econometric analyses, selected system-level findings were mapped to the official wording of relevant SDG targets in the 2030 Agenda [23] and interpreted with reference to established approaches for conceptualizing or empirically examining SDG interactions [40,41,42]. This post-estimation mapping was intended to organize the sustainable-development relevance of the irrigation-system findings rather than to generate an additional statistical layer of results.
The interpretation distinguished three levels of evidential support. Empirically anchored pathways were based on associations estimated in the global or domain-specific econometric models, while retaining the strength and uncertainty of the corresponding statistical evidence. Suggestive or context-dependent pathways were used when an estimated association was statistically uncertain or when its potential sustainability implications depended on hydrological, institutional, or operational conditions not directly measured by the model. Contextual pathways were reserved for SDG linkages supported by the territorial and ecological framework of the study but not estimated as independent econometric relationships. Accordingly, the sign or magnitude of a coefficient was not interpreted as evidence of a causal relationship between SDG targets.
For interpretive organization, a pathway was described as reinforcing when a comparatively favorable irrigation-system attribute was consistent with conditions relevant to progress across two or more related SDG targets; constraining when an adverse system-level condition was associated with a less favorable sustainability-domain score and was consistent with potential limitations on related targets; and context-dependent when the expected relationship depended on safeguards, institutional arrangements, or ecological conditions beyond the estimated model. No numerical SDG-interaction score was calculated. The resulting framework therefore represents a structured interpretation of the econometric and territorial evidence and should not be read as a measured SDG network.
2.9. Software, Reproducibility, and Use of Generative AI
Data preparation and statistical analyses were conducted in R version 4.6.0 within RStudio 2026.07.1 Build 147 (Posit Software, PBC, Boston, MA, USA). Multiple imputation was implemented using the mice package version 3.19.0; exploratory component analyses and mixed-correlation matrices using psych version 2.6.5 and GPArotation version 2026.4-1; component alignment using clue version 0.3-68; pooled estimation and HC3 heteroscedasticity-consistent inference using mitools version 2.4 and sandwich version 3.1-1; regression diagnostics using car version 3.1-5 and lmtest version 0.9-40; and spatial-neighbor construction and residual spatial-autocorrelation analyses using spdep version 1.4.2. Data manipulation and figure generation were performed primarily using dplyr version 1.2.1, readr version 2.2.0, sf version 1.1-1, and ggplot2 version 4.0.3. Exact package versions, the operating system, and the computational environment are documented through sessionInfo() in the reproducibility materials.
The analytical workflow is summarized in Figure 2, from screening of the 267 source records and definition of the 241-system analytical sample through multiple imputation, indicator audit, construction of the formative territorial sustainability index, exploratory structural assessment, pooled econometric modeling, diagnostic and sensitivity analyses, spatial assessment, and SDG-oriented interpretation. The revised non-confidential reproducibility package includes the R scripts used for data preparation, multiple imputation, index construction, exploratory structural assessment, econometric modeling, sensitivity and spatial analyses, and figure generation, together with the README, file manifest, summarized diagnostic outputs, and session information required to document the computational workflow. The source institutional database, completed imputed system-level datasets, and multiple-imputation object remain subject to the access restrictions described in the Data Availability Statement.
Figure 2.
Sample selection and analytical workflow. (a) The source institutional inventory contained 267 irrigation-system records. After exclusion of 14 substantially incomplete records, 253 systems remained; 12 additional records were excluded because of extensive missingness or missing variables required by the predefined analytical workflow, yielding a final analytical sample of 241 systems. Of these, 154 had valid geographic coordinates and 150 had complete information for the residual spatial-autocorrelation analysis. (b) Analytical workflow from data preparation and multiple imputation through construction of the formative territorial sustainability index, exploratory structural assessment, pooled econometric modeling, sensitivity and domain-specific analyses, residual spatial assessment, and secondary SDG-oriented interpretation. BH, Benjamini–Hochberg; FDR, false discovery rate; HC3, heteroscedasticity-consistent covariance estimator type 3; MICE, multivariate imputation by chained equations; OLS, ordinary least squares; PMM, predictive mean matching; SDG, Sustainable Development Goal.
Generative artificial intelligence was not used to collect, generate, or alter the source data; define the analytical strategy; select variables or models; execute statistical analyses; generate statistical results; or make methodological or interpretive decisions. During manuscript preparation and revision, ChatGPT (OpenAI) was used to assist with manuscript organization, figure-layout refinement, troubleshooting and refinement of author-directed R code, and preparation of reproducibility documentation. All statistical analyses were executed by the authors in the local R environment. AI-assisted textual and technical suggestions were reviewed and edited by the authors, who retained responsibility for all methodological, analytical, interpretive, and editorial decisions.
2.10. Ethical Considerations
The source information was collected in 2022 by the Provincial Government of Azuay as part of the institutional process supporting the preparation of the Provincial Irrigation, Drainage and Groundwater Plan of Azuay, rather than being collected specifically for the research reported in this article. The official planning documentation records that the data-collection form was jointly developed by the Directorate of Irrigation of the Provincial Government of Azuay, the Department of Water Resources and Environmental Sciences (iDRHiCA) of the University of Cuenca, and the consulting team, and that the instrument was implemented using the KoboToolbox digital platform [26].
Electronic informed consent was obtained from the adult organizational representatives participating in the original inventory. Before the substantive questionnaire items, respondents were informed of the institutional purpose of the inventory, the voluntary nature of participation, the confidential treatment of the information provided, and its potential subsequent use in anonymous and confidential form for academic and scientific purposes. Respondents were then asked to indicate electronically whether they voluntarily agreed to participate by selecting “Yes” or “No” in KoboToolbox (Supplementary File S2).
The present study involved only secondary analysis of the resulting pre-existing, de-identified institutional database. The community irrigation system, rather than the individual respondent, was the unit of analysis. The analytical dataset did not contain directly identifying or sensitive personal information about respondents. No participants were recruited or re-contacted for the present research, no intervention was performed, and no additional information was collected from individuals. No identifiable participant information is reported in this article.
3. Results
3.1. Missing Data and Imputation Diagnostics
The pre-imputation dataset contained 151 missing cells across 12 of the 67 variables included in the imputation workflow. The highest variable-level missingness was 11.62% for authorized flow, followed by maintenance investment (9.96%), minimum distribution duration (7.88%), and irrigated area (7.88%) (Table S1). The 10 final indicators used to construct the formative territorial sustainability index were complete for all 241 systems and therefore did not require imputation. Twenty completed datasets were generated without logged events after the predictor matrix was configured to prevent the nearly perfectly correlated numbers of water rights and irrigation-system users from predicting one another. Trace plots showed no persistent trends or separation among the imputation chains. Imputed values remained within the corresponding observed ranges, and the completed distributions preserved the marked right-skewness of flow, investment, area, water rights, and number of users. No convergence, range, or distributional anomalies were identified that would preclude use of the multiple-imputation results in the pooled econometric analyses.
3.2. Exploratory Structure and Distribution of the Formative Territorial Sustainability Index
Because the 10 final indicators contained no missing values, their values were identical across the 20 completed datasets. The exploratory structural assessment was therefore conducted once on the verified indicator matrix rather than treating the completed datasets as independent structural replications. Parallel analysis supported a three-component solution. In the Pearson-correlation analysis, the overall KMO was 0.549, and Bartlett’s test rejected the null hypothesis of an identity correlation matrix, χ2(45) = 115.95, p < 0.001. The three components explained 43.12% of the total variance. The mixed-correlation sensitivity analysis produced a KMO of 0.496 and explained 54.38% of the variance. The Pearson KMO was only modestly above 0.50, whereas the mixed-correlation KMO fell slightly below that threshold; these results limit the strength of structural claims based on the PCA. The corresponding components were nevertheless highly similar across the two correlation approaches, with Tucker congruence coefficients of 0.999, 1.000, and 0.998 for Components 1–3, respectively (Figure 3). All three coefficients exceeded the 0.95 benchmark for considering the matched components equal across the Pearson and mixed-correlation solutions. This cross-method similarity indicates consistency between the two correlation specifications but does not constitute validation of the three-domain formative structure.
Figure 3.
Exploratory structural diagnostic of the 10 indicators constituting the formative territorial sustainability index. (a) Parallel analysis supporting retention of three components; (b) Varimax-rotated loadings obtained from the Pearson correlation matrix; and (c) Varimax-rotated loadings obtained from the mixed tetrachoric–polychoric correlation matrix. Values with absolute loadings ≥ 0.40 are emphasized as descriptively salient. Component signs are arbitrary and do not determine indicator directionality, domain membership, or weights in the formative territorial sustainability index. PCA, principal component analysis.
The first component showed its primary loadings on the four indicators assigned a priori to the environmental-governance and conservation domain: conservation projects, source protection, conservation funding, and user fee payment. The second showed its primary loadings on perceived water quality, reported flow reduction, and increased droughts or floods, corresponding to the a priori water-condition and hydrological-pressure domain. The negative loading of perceived water quality reflects the arbitrary sign orientation of the component and does not alter the directional coding of the indicator used in construction of the formative index. The third component showed its primary loadings on low prices, productive association, and high transport costs, corresponding to the a priori commercial-organization and market-constraints domain. Thus, the component labels describe the observed loading patterns in relation to domains defined conceptually before the PCA; they were not used to define or validate those domains.
Bootstrap stability was comparatively higher for environmental governance and conservation, with a mean congruence of 0.951 and a 2.5th percentile of 0.772, and for water condition and hydrological pressure, with a mean congruence of 0.936 and a 2.5th percentile of 0.798. The commercial-organization and market-constraints component was less stable, with a mean congruence of 0.878 and a 2.5th percentile of 0.406. Relative to the descriptive benchmarks specified in Section 2.5, the environmental-governance mean slightly exceeded 0.95, whereas the water and market means fell within the fair-similarity range of 0.85–0.94; the market component’s 2.5th percentile of 0.406 nevertheless indicated pronounced lower-tail instability. This lower stability was concentrated principally in productive association, which remained assigned to the market component in 72.3% of the bootstrap replications. The parallel-analysis, cross-matrix, and bootstrap results were compatible with an approximate empirical organization corresponding to the a priori domains; however, the modest KMO values and lower stability of the market component limit the evidential role of the PCA. The PCA therefore remains an exploratory structural diagnostic and does not constitute factorial validation of the formative index or validation of a reflective latent scale. Table 3 summarizes the exploratory component patterns, primary-loading ranges, and bootstrap stability results.
Table 3.
Component interpretation and bootstrap stability of the final indicator set.
The final formative territorial sustainability index had a mean of 39.59 points (SD = 16.07), with observed values ranging from 5.56 to 83.33. Mean domain scores were 48.76 for water condition and hydrological pressure (SD = 29.04), 37.66 for environmental governance and conservation (SD = 26.92), and 32.37 for commercial organization and market constraints (SD = 23.84). The domain-specific distributions showed substantial heterogeneity that was not fully represented by the aggregate score alone.
3.3. Pooled Global Econometric Model
The pooled D1 test rejected the joint null hypothesis that all 14 non-intercept coefficients in the global model were zero, F(14, 224.01) = 2.21, p = 0.008. The model explained 12.10% of the between-system variation in the formative territorial sustainability index (pooled R2 = 0.121, 95% CI: 0.054–0.206). Thus, although the predictors were jointly informative, the global specification had limited explanatory scope and left most of the observed between-system variation unaccounted for.
Under nominal pooled HC3 inference, two coefficients had p < 0.05. Very good or good physical infrastructure condition was associated with a 6.93-point higher aggregate index score relative to regular or bad infrastructure condition, conditional on the remaining predictors (B = 6.93, 95% CI: 2.27–11.59, p = 0.004). Organizational activity planning was associated with a 6.67-point higher index score (B = 6.67, 95% CI: 0.62–12.72, p = 0.031). Because 14 non-intercept coefficients were evaluated simultaneously, Benjamini–Hochberg adjustment was additionally applied as a multiplicity sensitivity analysis. The corresponding BH-adjusted p-values were 0.052 for physical infrastructure condition and 0.217 for organizational activity planning, and no global-model coefficient remained below the 0.05 threshold after adjustment. The coefficient directions and magnitudes were unchanged, but the strength of coefficient-level statistical evidence was attenuated under multiplicity control.
Reservoir presence showed a positive but statistically uncertain association with the aggregate index (B = 3.65, 95% CI: −0.59 to 7.89, nominal p = 0.092; BH-adjusted p = 0.404). The nominal 95% confidence intervals for the remaining predictors also included zero, and none had a BH-adjusted p-value below 0.05. Table 4 presents the complete pooled estimates together with nominal and multiplicity-adjusted p-values, and Figure 4 displays the coefficient estimates and corresponding 95% confidence intervals. All coefficients represent conditional associations on the 0–100 index scale and should not be interpreted as causal effects.
Table 4.
Pooled OLS estimates for the 10-indicator formative territorial sustainability index using pooled HC3 heteroscedasticity-consistent inference and multiplicity sensitivity.
Figure 4.
Pooled coefficients and 95% confidence intervals from the global econometric model using pooled HC3 heteroscedasticity-consistent inference. Filled symbols identify coefficients with nominal p < 0.05, whereas open symbols identify coefficients with nominal p ≥ 0.05. No coefficient remained below the 0.05 threshold after Benjamini–Hochberg adjustment across the 14 non-intercept coefficients. The vertical dashed line represents a coefficient of zero. Coefficients represent conditional associations on the 0–100 formative territorial sustainability index scale and should not be interpreted as causal effects.
3.4. Sensitivity and Domain-Specific Models
The directions and magnitudes of the principal global-model coefficients were broadly similar across alternative index-construction, missing-data, and predictor-specification sensitivities (Table 5). Under the alternative weighting scheme that assigned equal aggregate weight to each of the 10 indicators, physical infrastructure condition remained positively associated with the index (B = 6.76, 95% CI: 2.13–11.39, p = 0.004), as did organizational activity planning (B = 6.73, 95% CI: 0.69–12.78, p = 0.029); pooled R2 was 0.121 (95% CI: 0.054–0.206). The 11-indicator specification produced similar estimates for physical condition (B = 5.98, 95% CI: 1.63–10.34, p = 0.007) and organizational planning (B = 6.65, 95% CI: 0.95–12.35, p = 0.022), with pooled R2 = 0.119 (95% CI: 0.052–0.204). In the complete-case analysis (n = 226), the corresponding estimates were B = 6.71 (95% CI: 1.82–11.61, p = 0.007) and B = 6.29 (95% CI: 0.13–12.45, p = 0.045), respectively, with R2 = 0.116 and adjusted R2 = 0.057. The similarity of the complete-case and multiply imputed estimates indicates limited sensitivity of these coefficient patterns to the treatment of missing data; it does not constitute a test or validation of the MAR assumption.
Table 5.
Summary of the principal global sensitivity and domain-specific models.
Additional predictor-specification and influence checks produced broadly comparable coefficient patterns. When organizational planning was omitted from the predictor set, the physical-condition coefficient was B = 7.15 (95% CI: 2.57–11.74, p = 0.002), with pooled R2 = 0.100 (95% CI: 0.039–0.182). Sixteen unique systems exceeded the Cook’s-distance screening threshold in at least one completed dataset. After excluding these systems (n = 225), physical condition (B = 6.79, 95% CI: 2.65–10.94, p = 0.001) and organizational planning (B = 6.06, 95% CI: 0.71–11.41, p = 0.026) retained similar directions and magnitudes, while pooled R2 increased to 0.164 (95% CI: 0.083–0.258). Secondary-conveyance damage was negatively associated with the index in this specification (B = −5.16, 95% CI: −9.20 to −1.12, p = 0.013), but this association was not reproduced in the primary or other sensitivity specifications and was therefore treated as influence-sensitive rather than as a stable global pattern. Reservoir presence remained positive but statistically uncertain (B = 3.78, 95% CI: −0.07 to 7.64, p = 0.054).
The exploratory domain-specific models showed heterogeneity that was not apparent in the aggregate index. The water-condition and hydrological-pressure model explained 17.11% of the variation in its outcome (pooled R2 = 0.171, 95% CI: 0.092–0.263). Physical infrastructure condition was positively associated with the water-domain score (B = 14.62, 95% CI: 5.88–23.35, nominal p = 0.001, BH-adjusted p = 0.024), whereas reported contamination around the water source was negatively associated with it (B = −14.23, 95% CI: −22.00 to −6.47, nominal p < 0.001, BH-adjusted p = 0.016). These were the only coefficients across the three original domain-specific models that remained below the 0.05 threshold after the Benjamini–Hochberg adjustment applied jointly across their non-intercept coefficients. The environmental-governance and conservation model had pooled R2 = 0.119 (95% CI: 0.052–0.204), and the commercial-organization and market-constraints model had pooled R2 = 0.023 (95% CI: 0.001–0.075); neither model contained a coefficient with BH-adjusted p < 0.05.
Because reported contamination around the water source is conceptually close to perceived water quality, the water-domain model was re-estimated after removing perceived water quality from the outcome. The reduced water-domain model had pooled R2 = 0.133 (95% CI: 0.062–0.220). The contamination coefficient remained negative (B = −11.51, 95% CI: −21.73 to −1.30, nominal p = 0.027), while physical infrastructure condition remained positive (B = 15.89, 95% CI: 4.26–27.51, nominal p = 0.008). After Benjamini–Hochberg adjustment across the 14 non-intercept coefficients of this sensitivity model, the corresponding adjusted p-values were 0.191 for contamination and 0.107 for physical condition. Removing perceived water quality therefore preserved the direction and approximate magnitude of the contamination coefficient, but neither contamination nor physical condition remained below the 0.05 threshold after multiplicity adjustment in this sensitivity model.
Residual spatial dependence was assessed among the 150 georeferenced systems with complete data for the global-model variables. Moran’s I was 0.021 for k = 4 (permutation p = 0.555), −0.018 for k = 5 (p = 0.823), and 0.005 for k = 8 (p = 0.674), based on 9999 permutations. None of the tested neighborhood specifications provided evidence of residual spatial autocorrelation. These results indicate that detectable residual spatial clustering was not identified under the specified k-nearest-neighbor structures; they do not establish the absence of spatial dependence under other neighborhood definitions or geographic processes.
4. Discussion
Throughout this Discussion, regression coefficients are interpreted as conditional associations among the analyzed irrigation systems. As detailed in Section 4.7, the observational, cross-sectional, non-probability, and predominantly questionnaire-based design precludes causal or population-wide inference, while the limited explanatory scope of several models further constrains substantive interpretation.
4.1. Infrastructure and Organizational Planning as Complementary Territorial Capacities
Physical infrastructure condition and organizational activity planning showed the clearest positive coefficient patterns in the global model. Under nominal pooled HC3 inference, very good or good physical infrastructure condition was associated with a 6.93-point higher aggregate index score, whereas organizational activity planning was associated with a 6.67-point higher score, conditional on the remaining predictors. The directions and approximate magnitudes of both coefficients were broadly preserved under alternative indicator weighting, the 11-indicator specification, complete-case analysis, and the influence sensitivity. However, neither coefficient remained below the 0.05 threshold after Benjamini–Hochberg adjustment across the 14 global-model predictors (BH-adjusted p = 0.052 for physical condition and 0.217 for organizational planning). These results indicate comparatively consistent positive directions and approximate magnitudes across specifications. This distinction is important given that the global model explained a limited proportion of between-system variation (R2 = 0.121, 95% CI: 0.054–0.206).
The observed pattern is substantively consistent with evidence that irrigation infrastructure operates within, rather than independently of, organizational and institutional arrangements. Recent research on smallholder and community-managed irrigation indicates that sustained improvements can depend on combinations of technological and socio-institutional capacities rather than on physical interventions alone [3,4]. Evidence from Andean irrigation likewise shows that institutional adaptation, water-sharing arrangements, infrastructure management, and collective organization evolve together in response to changing local conditions [13]. More recent evidence from smallholder irrigation schemes shows that duplication, overlap, and fragmentation of institutional mandates can weaken cooperation and hinder infrastructure utilization and maintenance, while socially embedded collective arrangements may assume important roles in repair and operation [43]. These findings support interpreting physical condition as one component of a broader organizational and institutional configuration rather than as an autonomous determinant of sustainability.
Organizational activity planning represents a related but empirically distinct characteristic. The inventory variable identifies whether the irrigation organization reported planning its activities; it does not measure the formalization, frequency, implementation, quality, or effectiveness of that planning. Its positive coefficient should therefore not be interpreted as evidence that planning itself produces higher sustainability. Rather, planning may serve as an observable marker of broader coordination capacity associated with organizing maintenance, water-distribution schedules, collective contributions, conservation activities, and responses to operational or environmental pressures [5,6,13,43]. These mechanisms are theoretically and empirically plausible, but they were not separately measured in the present dataset and consequently remain interpretive explanations of the observed association.
Physical condition and organizational planning can therefore be described as complementary territorial capacities only in an interpretive sense. The econometric model estimated their separate conditional coefficients and did not include an infrastructure-by-planning interaction term; statistical complementarity was therefore not tested. Accordingly, these findings identify two system characteristics that may warrant joint consideration in comparative assessment and subsequent, more targeted investigation, rather than supporting a prescriptive claim that infrastructure construction, rehabilitation, or organizational planning alone will increase territorial sustainability.
4.2. Reported Source-Area Contamination and Water-Domain Sustainability
Reported contamination around the water source showed different patterns depending on the level of aggregation. In the global model, its coefficient was negative but statistically uncertain (B = −3.48, 95% CI: −7.81 to 0.86, nominal p = 0.115). In contrast, the original water-condition and hydrological-pressure model showed a substantially larger negative association (B = −14.23, 95% CI: −22.00 to −6.47), which remained below the 0.05 threshold after Benjamini–Hochberg adjustment. Because perceived water quality was one of the indicators constituting that domain, the model was re-estimated after removing this indicator from the outcome. The contamination coefficient remained negative and of substantial magnitude (B = −11.51, 95% CI: −21.73 to −1.30, nominal p = 0.027), but it no longer remained below the 0.05 threshold after multiplicity adjustment (BH-adjusted p = 0.191). Thus, removing perceived water quality did not eliminate the negative coefficient, but the multiplicity-adjusted support observed in the original water-domain model did not persist under this alternative outcome specification. The contamination result should therefore be regarded as domain specific and sensitive in inferential strength to the precise construction of the water-domain outcome.
This distinction also clarifies the empirical boundary of the water domain. The predictor identifies reported contamination around the water source; it does not establish the presence, concentration, origin, or temporal persistence of contaminants in irrigation water. Likewise, the domain does not represent a comprehensive hydrological-performance measure. Direct irrigation-performance assessment commonly relies on measured variables such as flow, delivery adequacy and dependability, evapotranspiration, water productivity, and related quantitative performance indicators [19]. High-Andean water-quality assessment additionally requires context-sensitive combinations of physicochemical and biological information, and available reviews emphasize both the limited evidence base and the absence of universally suitable indices for these distinctive mountain environments [44]. Consequently, the questionnaire-based indicators used here should be interpreted as information on reported water conditions and pressures, not as substitutes for direct hydrological or water-quality monitoring.
Recent Andean evidence illustrates why this distinction matters. Five-year monitoring in an Andean basin in southwestern Colombia combined physicochemical and biological water-quality measurements with land-use analysis and socioecological information, showing that agricultural activities, land-cover dynamics, water-use practices, and actor relationships were linked to measured water-quality conditions [45]. More recent monitoring in an Ecuadorian high-Andean páramo river used repeated sampling across ten stations and six bimonthly campaigns and measured hydrochemical, nutrient, suspended-solid, organic-matter, and microbiological variables [46]. That study distinguished dominant natural hydrogeochemical controls from secondary anthropogenic signals that varied spatially and seasonally [46]. These findings are consistent with broader evidence that páramo water resources are governed by interacting hydrological, ecological, and social processes and remain affected by important monitoring and knowledge gaps [9]. They reinforce the need to distinguish reported environmental pressure from directly measured water-quality degradation.
The contrast between the aggregate and water-domain estimates also illustrates a substantive consequence of using a compensatory multidimensional index. Under compensatory aggregation, an unfavorable condition within one domain can be numerically offset by more favorable conditions elsewhere [34,35]. The absence of a clear aggregate contamination coefficient therefore does not demonstrate that source-area contamination is irrelevant to the water dimension. Conversely, the stronger domain coefficient should not be generalized to overall territorial sustainability. For future territorial assessments, this domain-specific result is best used as a screening signal for targeted monitoring of water quality, seasonal flow conditions, contaminant sources, and hydrological performance.
4.3. Reservoir Presence and Context-Dependent Storage Performance
Reservoir presence showed a positive but statistically uncertain association with the aggregate territorial sustainability index (B = 3.65, 95% CI: −0.59 to 7.89, nominal p = 0.092; BH-adjusted p = 0.404). The positive direction was broadly preserved across the alternative weighting, 11-indicator, complete-case, planning-excluded, and influence sensitivity specifications, but the corresponding confidence intervals remained compatible with no association. The analysis therefore does not support the conclusion that reservoir presence independently increases territorial sustainability. Instead, reservoir presence is best treated as a potentially relevant system characteristic whose interpretation depends on hydrological, operational, organizational, and territorial conditions not captured by the binary predictor.
This interpretation is consistent with recent work in data-scarce mountain regions. In the Peruvian Andes, water-management strategies have been evaluated under simultaneous uncertainty in climate, socioeconomic change, hydrological parameters, irrigation efficiency, and reservoir configurations [47]. Across 12,000 simulations, reservoir and irrigation-efficiency policies were important determinants of the modeled water-sufficiency metric, but policy implementation improved conditions in some scenarios while contributing to water scarcity in others [47]. The study consequently emphasizes the identification of operational ranges and conditions under which management strategies may succeed or fail rather than treating storage infrastructure as uniformly beneficial [47].
Basin-scale evidence also indicates that storage infrastructure can produce cumulative effects that are not apparent when reservoirs are considered individually. Modeling of dense networks of small reservoirs in a semi-arid Brazilian basin showed that reservoir configuration altered drought propagation, downstream strategic-reservoir recharge, and the spatial distribution of storage; in that particular setting, the reservoir network accelerated the transition toward hydrological drought and slowed recharge of downstream strategic reservoirs [48]. These results should not be transferred directly to the Azuay systems, which differ hydrologically and institutionally, but they demonstrate the broader principle that reservoir effects depend on location, cumulative storage, connectivity, downstream requirements, and basin-scale dynamics rather than on infrastructure presence alone.
The provincial inventory used in the present study did not record reservoir storage capacity, current stored volume, bathymetry, seasonal inflows and releases, evaporation losses, physical condition, operating reliability, allocation rules, or downstream effects. Nor did it establish whether a reported reservoir was functional or effectively available during periods of scarcity. Consequently, the coefficient cannot be interpreted as an estimate of the effect of storage volume or reservoir operation. Future territorial assessments should distinguish the presence of storage infrastructure from its capacity, condition, operation, reliability, and hydrological performance, ideally combining system-level information with seasonal flow and storage observations. Section 4.5 therefore treats potential connections between storage, climate adaptation, water-use efficiency, and integrated water resources management as context-dependent interpretive pathways.
4.4. Market Organization and the Limits of Available Commercialization Indicators
The available commercialization variables provided limited evidence of association with either the aggregate index or the market-domain score. In the global model, neither commercialization through intermediaries nor commercialization within the parish showed a clear conditional association with the aggregate territorial sustainability index. The exploratory commercial-organization and market-constraints model likewise explained only a small proportion of variation in its domain outcome (pooled R2 = 0.023, 95% CI: 0.001–0.075), and no coefficient remained below the 0.05 threshold after the Benjamini–Hochberg adjustment applied jointly across the three original domain models. This very limited explanatory performance indicates that the available predictors captured little of the between-system variation represented by the market domain and precludes interpreting the absence of adjusted associations as evidence that market conditions are unimportant for territorial sustainability.
Measurement and questionnaire structure provide part of the explanation for this result. Location-of-sale questions were conditional on production not being primarily destined for self-consumption, so commercialization variables did not represent equivalent information for all irrigation systems. In addition, indicators that were conceptually or operationally overlapping with predictors were excluded from the final index to avoid mechanically embedding similar information on both sides of the regression. These decisions reduced circularity but also left the econometric specification with a relatively narrow representation of market organization. The exploratory structural analysis reinforces this caution: the commercial-organization and market-constraints component had lower bootstrap stability than the water and environmental-governance components (mean congruence = 0.878; 2.5th percentile = 0.406), and productive association remained assigned to this component in only 72.3% of bootstrap replications. The market domain should therefore be treated as the least empirically stable of the three formative domains rather than as a validated latent market construct.
Recent evidence from irrigated smallholder agriculture illustrates the range of market conditions not captured by the present variables. Among irrigated smallholder vegetable producers, market participation has been associated with economic, technical, institutional, social, and cultural characteristics rather than with a single commercialization channel [49]. In that setting, distance to market centers, access to credit and extension services, income, production conditions, transportation, and market information were among the factors associated with participation or its intensity [49]. These findings do not imply that the same determinants operate with the same magnitude in Azuay, but they demonstrate why variables limited to destination of sale, intermediary use, price constraints, transport constraints, and productive association cannot be assumed to exhaust the commercial conditions affecting community irrigation systems.
Market power and bargaining conditions constitute another potentially relevant but unmeasured layer. Recent food-systems research shows that concentrated market structures and buyer power can affect prices, livelihood opportunities, choices, and agency, while also emphasizing that these relationships vary substantially across commodities and contexts [50]. For small-scale producers specifically, available evidence is heterogeneous, and data limitations make the extent and consequences of buyer power difficult to quantify in many settings [50]. The present study did not measure market concentration, bargaining power, contractual conditions, farm-gate versus final prices, margins, volumes sold, access to market information, or transaction costs. Accordingly, Clapp et al. [50] are cited here to identify examples of structural market dimensions absent from the dataset, not as evidence that corporate concentration or buyer power characterizes the irrigation systems of Azuay.
Future assessments should therefore broaden the commercial domain before stronger conclusions are drawn about the relationship between market organization and territorial sustainability. Until such information is available, the market results are best interpreted as inconclusive within the present measurement framework rather than as evidence of no relationship between market organization and sustainability.
4.5. SDG-Oriented Interpretive Synthesis
The econometric findings can be situated within the 2030 Agenda [23], but this SDG-oriented synthesis is intentionally secondary to the empirical results. The estimated models did not include SDG indicators as outcomes or predictors, did not estimate statistical relationships among SDG targets, and did not assign numerical interaction scores. This differs from approaches specifically designed to analyze SDG interactions. Nilsson et al. proposed a qualitative framework for classifying interactions according to their direction, strength, reversibility, and degree of certainty [40], whereas Pradhan et al. operationalized synergies and trade-offs empirically through correlations between official SDG indicators [41]. Participatory system-dynamics approaches have gone further by explicitly modeling and quantifying interactions among locally prioritized SDGs in an irrigation district [42]. These approaches differ from the present analysis, which uses the corresponding frameworks only to organize a post-estimation interpretation of irrigation-system findings whose statistical evidence was established independently of the SDG mapping.
Within this restricted interpretive role, physical infrastructure condition and organizational activity planning provide potential reinforcing pathways. Better physical condition can be related conceptually to sustainable and resilient infrastructure (SDG 9.1), water-use efficiency and integrated water resources management (SDGs 6.4 and 6.5), and conditions supportive of resilient agricultural production (SDG 2.4). Organizational planning can similarly be considered in relation to effective institutions and policy coherence (SDGs 16.6 and 17.14), integrated water resources management (SDG 6.5), and community participation (SDG 6.b). These pathways are anchored only in the positive conditional coefficients observed at the irrigation-system level. Because neither global-model coefficient remained below the 0.05 threshold after Benjamini–Hochberg adjustment, the pathways should be understood as plausible reinforcing interpretations rather than as statistically established interactions among the cited SDG targets.
Reported contamination around the water source provides a more specific, but still qualified, basis for a constraining interpretation involving water-quality protection (SDG 6.3) and conditions relevant to resilient agricultural production (SDG 2.4). The negative contamination coefficient remained below the multiplicity-adjusted threshold in the original water-domain model, whereas the sensitivity model excluding perceived water quality preserved its negative direction and nominal association but not its Benjamini–Hochberg-adjusted statistical support. The SDG interpretation is therefore tied to a domain-specific water finding and should not be generalized to overall territorial sustainability. Reservoir presence provides a weaker and explicitly context-dependent pathway potentially relevant to climate adaptation (SDG 13.1), water-use efficiency (SDG 6.4), and integrated water resources management (SDG 6.5), because its global coefficient was positive but statistically uncertain. This contextual treatment is consistent with interaction frameworks emphasizing that geography, governance, technology, directionality, and evidential certainty can alter how apparently similar SDG relationships operate in different settings [40].
Mountain-ecosystem protection (SDGs 15.4 and 15.9) and protection of water-related ecosystems (SDG 6.6) are retained as ecological context rather than as independently estimated econometric relationships. Similarly, no directional SDG interpretation is assigned to market organization because the market-domain model had very limited explanatory power and no multiplicity-adjusted coefficient-level associations. This restraint is important because empirical SDG studies themselves show that the sign and prevalence of interactions can vary across countries and contexts and that correlation does not establish causality [41]. Table 6 therefore summarizes the evidential basis and limits of the selected SDG-oriented pathways, while Figure 5 provides a visual synthesis. Neither should be interpreted as an estimated SDG network, a causal diagram, or a quantitative assessment of progress toward the cited targets.
Table 6.
SDG-oriented interpretive pathways associated with the empirical and territorial findings.
Figure 5.
Secondary SDG-oriented interpretation of the empirical and territorial findings. The left column identifies the irrigation-system findings underlying the interpretation, the middle column indicates their evidential or interpretive status, and the right column lists the SDG targets considered. Connecting lines are organizational devices only and do not represent estimated statistical, reciprocal, or causal relationships among SDG targets. Statistical evidence refers exclusively to the underlying irrigation-system coefficients reported in the econometric analyses. SDG targets were not modeled as outcomes or predictors, and no numerical SDG-interaction scores were estimated. Detailed evidential boundaries are provided in Table 6. BH, Benjamini–Hochberg; SDG, Sustainable Development Goal.
4.6. Methodological Integration and Analytical Contribution
The contribution of this study lies in the integration and empirical application of established sustainability-assessment and econometric procedures to a territorially bounded set of community irrigation systems, rather than in the proposal of a new statistical methodology. Composite sustainability assessment necessarily involves methodological choices concerning indicator selection, normalization, weighting, aggregation, and compensation among dimensions, and these choices can materially affect the resulting assessment [18,34,35]. The present workflow therefore treats index construction, exploratory structural assessment, missing-data treatment, econometric estimation, multiplicity control, and sensitivity analysis as distinct analytical stages rather than as evidence that a single statistical procedure validates territorial sustainability.
This analytical contribution is distinct from the earlier study by Berrones and Célleri, despite both studies drawing on the 2022 Azuay provincial irrigation inventory [20]. Berrones and Célleri analyzed 235 irrigation systems and sought to identify major sustainability challenges across four irrigation-system size categories, considering socioeconomic conditions, water resources, governance, and user dynamics. Their analyses included descriptive comparisons, Kruskal–Wallis tests with Dunn post hoc comparisons, and Spearman correlations among selected variables [20]. The present study addresses a different estimate and analytical question: it constructs a bounded 0–100 formative territorial sustainability outcome for 241 analytically retained systems and estimates simultaneous conditional associations between that outcome—and its constituent domains—and technical, organizational, environmental, and market characteristics. The novelty therefore does not arise from a different geographic population or from newly collected primary data, but from transforming the inventory into a multidimensional outcome and evaluating between-system variation through a multivariable, sensitivity-tested econometric framework.
Several design features strengthen that distinction. First, indicators with direct or conceptual overlap with candidate predictors were removed to reduce mechanically induced associations between the sustainability outcome and its regressors. Second, equal domain weighting was made explicit as the principal normative specification and was compared with alternative indicator weighting and an 11-indicator specification. Third, missing predictor information was addressed through multiple imputation and compared with complete-case estimates rather than relying on a single treatment of item nonresponse. Fourth, the global estimates were evaluated using HC3 heteroscedasticity-consistent inference, Benjamini–Hochberg multiplicity sensitivity, influence analysis, alternative index specifications, and residual spatial-autocorrelation tests, while domain-specific models were used to examine relationships that could be obscured by compensatory aggregation. The PCA served only as an exploratory structural diagnostic and did not determine indicator inclusion, domain membership, or weights. These elements do not constitute a new econometric method; their contribution is to provide a transparent sequence for separating normative index-construction decisions from empirical conditional associations and subsequent interpretive inference.
The contrast between aggregate and domain-specific findings illustrates the analytical value of this integration. Reported source-area contamination did not show a clear association with the aggregate territorial sustainability score, whereas a substantially stronger negative coefficient emerged within the water domain; its direction and approximate magnitude persisted after perceived water quality was removed, although multiplicity-adjusted support was attenuated in that sensitivity specification. Conversely, the market-domain model explained very little variation, making strong conclusions about commercialization inappropriate. These contrasts illustrate why a multidimensional sustainability index should not be interpreted only through its aggregate score and why domain results, specification sensitivity, and measurement boundaries must remain visible. The resulting framework is therefore best understood as a reproducible empirical workflow for comparative assessment of the observed Azuay irrigation systems, subject to the inferential and measurement limits detailed in Section 4.7.
4.7. Limitations and Future Research
Several limitations define the inferential scope of this study. First, the analysis is observational and cross-sectional; the estimated coefficients therefore describe conditional between-system associations and cannot establish temporal ordering or causal effects. Characteristics such as infrastructure condition, organizational planning, contamination, and sustainability may evolve jointly, and the present design cannot determine whether the observed system characteristics preceded, followed, or co-developed with the corresponding sustainability conditions. Second, the source inventory was institutional rather than probability based. The results consequently characterize variation among the community irrigation systems represented in the analytical Azuay dataset and should not be interpreted as population estimates for all irrigation systems in Azuay, Ecuador, or the Ecuadorian Andes. These restrictions apply equally to coefficient estimates, domain comparisons, and the secondary SDG-oriented interpretation.
The explanatory scope of the econometric models is also limited. The global specification explained 12.1% of the variation in the formative territorial sustainability index (R2 = 0.121, 95% CI: 0.054–0.206), indicating that most between-system variation lies outside the predictors included in the model. This is particularly evident for the commercial-organization and market-constraints model, whose pooled R2 was 0.023 (95% CI: 0.001–0.075). Moreover, although physical infrastructure condition and organizational activity planning had nominal pooled HC3 p-values below 0.05 in the global model, neither remained below that threshold after Benjamini–Hochberg adjustment across the 14 non-intercept coefficients. The findings should therefore be interpreted primarily in terms of coefficient direction, magnitude, uncertainty, and consistency across sensitivity specifications rather than as a set of independently confirmed determinants. Relevant omitted characteristics may include direct hydrological performance, maintenance expenditures, financial capacity, leadership and organizational quality, crop and production structure, household or user socioeconomic conditions, market prices and margins, transaction costs, and watershed-level environmental processes.
A further limitation concerns measurement source and measurement depth. Several predictors and index components were obtained through the same institutional questionnaire and often from the same organizational representative. Consequently, shared respondent knowledge, perception, recall, item context, or other method-related influences may have affected some observed relationships. Common-method research shows that uncontrolled same-source measurement can bias estimated relationships and that common-method variance may inflate, attenuate, or have no net effect on the estimated association between constructs [51]. Its direction and magnitude therefore cannot be determined retrospectively for the present dataset. This limitation is particularly relevant to reported source-area contamination and perceived or reported water conditions. The inventory did not provide consistent physicochemical or microbiological measurements, continuous or seasonal flow observations, water balances, or water-productivity measures across all systems. Similarly, reservoir information captured presence rather than effective storage capacity, current volume, operating reliability, seasonal inflows and releases, or downstream effects, while the commercialization variables did not measure margins, bargaining power, contracts, quantities sold, or complete transaction costs. Recent high-Andean research illustrates the additional information provided by repeated physicochemical, biological, hydrochemical, and microbiological monitoring [44,45,46].
The construction and structural assessment of the sustainability outcome also involve methodological limitations. The index is formative and deliberately bounded to the three domains consistently represented in the provincial inventory; it is not an exhaustive measure of territorial sustainability. Equal domain weighting improves transparency and prevents domains with more indicators from mechanically dominating the aggregate score, but it remains a normative choice. The alternative equal-indicator weighting and the 11-indicator sensitivity specification reduce dependence on a single construction rule but do not exhaust the possible weighting or aggregation structures. In particular, additional threshold-based or non-compensatory formulations could be examined where poor performance in water quality or ecosystem condition should not be offset by favorable conditions elsewhere [18,34,35]. The PCA provides only limited structural reassurance: KMO values were modest (0.549 for the Pearson solution and 0.496 for the mixed-correlation sensitivity), and the market component showed lower bootstrap stability. Accordingly, the PCA should not be interpreted as factorial validation of a reflective construct; it remains an exploratory diagnostic of the organization of a priori formative domains.
Missing-data and spatial analyses also have bounded interpretations. Multiple imputation preserved observed information and the complete-case sensitivity produced broadly comparable coefficient directions and magnitudes, but the imputation procedure relies on a Missing at Random working assumption conditional on the observed information. That assumption is not empirically testable from these data [27], and agreement with the complete-case analysis does not validate it or exclude bias under Missing Not at Random mechanisms. Spatial sensitivity was necessarily restricted to systems with both valid coordinates and complete information for the corresponding global specification. The residual Moran tests for the 150 eligible systems provided no evidence of spatial autocorrelation under the tested k-nearest-neighbor definitions (k = 4, 5, and 8; 9999 permutations), but this result should not be interpreted as proof of spatial independence at all geographic scales. Unmeasured watershed connectivity, hydrological networks, administrative clustering, or other forms of spatial structure could remain relevant.
Future research should therefore combine broader measurement with stronger temporal and spatial designs. Repeated observations of the same irrigation systems would permit analysis of change and temporal ordering, while longitudinal, multilevel, watershed-based, or quasi-experimental designs could better distinguish system-level from catchment- and territorial-level influences. Direct field measurements should include seasonal flow, delivery adequacy and reliability, physicochemical and microbiological water quality, storage capacity and operation, irrigated area, water productivity, maintenance investment, and relevant ecosystem conditions. Commercial data should distinguish production destination from actual market participation and include quantities sold, farm-gate prices, margins, transport and transaction costs, contracts, market information, collective marketing, and bargaining conditions. Future data collection should also, where feasible, obtain predictor and outcome information from different sources or at different time points to reduce common-source dependence; contemporary methodological guidance identifies different-source measurement and temporal separation as important design-stage remedies for common-method bias [51]. These extensions would allow the formative framework developed here to be examined under richer measurement conditions and would clarify which observed associations persist when direct environmental, economic, organizational, temporal, and spatial information is available.
5. Conclusions
This study developed and empirically applied a bounded formative assessment of territorial sustainability to 241 community irrigation systems in Azuay Province, Ecuador. The 10-indicator index represented three analytically distinct domains—water condition and hydrological pressure, environmental governance and conservation, and commercial organization and market constraints—and was used to examine conditional associations with technical, organizational, environmental, and market characteristics. Physical infrastructure condition and organizational activity planning showed the clearest positive coefficient patterns in the global model, with similar directions and approximate magnitudes across several sensitivity specifications. However, although both coefficients had nominal pooled HC3 p-values below 0.05, neither remained below the 0.05 threshold after Benjamini–Hochberg adjustment across the 14 global-model predictors. Together with the limited explanatory scope of the global specification (R2 = 0.121, 95% CI: 0.054–0.206), these results support interpreting infrastructure condition and organizational planning as comparatively consistent conditional correlates within the analyzed systems rather than as independently confirmed determinants of territorial sustainability.
Domain-specific analysis revealed information that was not apparent from the aggregate index. Reported contamination around the water source was not clearly associated with aggregate territorial sustainability but showed a substantially larger negative association in the original water-domain model (B = −14.23, 95% CI: −22.00 to −6.47; BH-adjusted p = 0.016). When perceived water quality was removed from the domain outcome, the contamination coefficient remained negative and nominally different from zero (B = −11.51, 95% CI: −21.73 to −1.30; nominal p = 0.027), but it no longer remained below the multiplicity-adjusted threshold (BH-adjusted p = 0.191). The direction and approximate magnitude of the coefficient therefore persisted, whereas the strength of multiplicity-adjusted evidence depended on the precise specification of the water-domain outcome. More generally, this aggregate–domain contrast illustrates why compensatory sustainability scores should be interpreted together with their constituent domains rather than as substitutes for domain-specific environmental information.
Other findings were more uncertain. Reservoir presence showed a positive but statistically uncertain global coefficient and cannot be interpreted as evidence that the presence of storage infrastructure itself improves territorial sustainability, particularly because storage capacity, condition, operation, reliability, and basin-scale hydrological effects were not measured. The commercial domain was even less conclusive: its model explained only a small proportion of variation (R2 = 0.023, 95% CI: 0.001–0.075), and the available commercialization variables yielded no multiplicity-adjusted coefficient-level evidence of clear conditional associations. The SDG-oriented pathways developed in this study should likewise remain secondary interpretations of the irrigation-system findings. SDG targets were not modeled as outcomes or predictors, and the study did not estimate statistical, reciprocal, or causal relationships among them.
The principal contribution of the study is therefore the integration and empirical application of established sustainability-assessment and econometric procedures rather than the development of a fundamentally new statistical method. The analytical workflow operationalizes a multidimensional formative outcome, estimates simultaneous conditional associations, distinguishes aggregate from domain-specific information, and evaluates sensitivity to weighting, missing-data treatment, multiplicity, influential observations, predictor specification, and residual spatial structure. These contributions remain bounded by the cross-sectional, non-probability, and predominantly questionnaire-based design, which limits causal interpretation, population generalization, and direct hydrological inference. Future applications should combine repeated system-level observations with direct measurements of water quality, flow, storage performance, irrigation performance, organizational processes, and commercial conditions. With richer measurement and longitudinal data, the formative framework may provide a transparent basis for comparative territorial assessment while preserving the distinction between empirical evidence, normative index-construction choices, and broader sustainability interpretation.
Supplementary Materials
The following supporting information can be downloaded at: https://www.mdpi.com/article/10.3390/w18182227/s1, Table S1: Variable-level missingness and imputation methods; Table S2: Detailed construction of the 10-indicator formative territorial sustainability index; Table S3: Pearson- and mixed-correlation primary loadings with bootstrap stability; Figure S1: Bootstrap stability of the primary component loadings for the final indicator set; Table S4: Complete pooled HC3 results for the global sensitivity, water-domain sensitivity, and domain-specific models; Table S5: Global-model fit, multicollinearity, diagnostic, and residual spatial-autocorrelation sensitivity results; Supplementary File S1: Reproducibility materials, including R scripts, README, file manifest, and session-information file supporting the analytical and figure-generation workflow; Supplementary File S2: Original blank KoboToolbox questionnaire used in the 2022 provincial inventory (Spanish), including the electronic informed-consent item presented before the substantive questionnaire items; Supplementary File S3: English version of KoboToolbox questionnaire.
Author Contributions
Conceptualization, J.Á.-L. and F.H.-S.; methodology, J.Á.-L. and F.H.-S.; software, J.Á.-L.; validation, J.Á.-L. and F.H.-S.; formal analysis, J.Á.-L.; investigation, J.Á.-L.; resources, J.Á.-L.; data curation, J.Á.-L.; writing—original draft preparation, J.Á.-L.; writing—review and editing, J.Á.-L. and F.H.-S.; visualization, J.Á.-L.; supervision, F.H.-S.; project administration, J.Á.-L. All authors have read and agreed to the published version of the manuscript.
Funding
This research received no external funding.
Informed Consent Statement
Electronic informed consent was obtained from the adult organizational representatives participating in the original 2022 institutional inventory. Before the substantive questionnaire items, respondents were informed of the purpose of the inventory, the voluntary nature of participation, the confidential treatment of the information provided, and its potential subsequent use in anonymous and confidential form for academic and scientific purposes. Consent was recorded electronically through a “Yes/No” response to the first item in KoboToolbox (Supplementary File S2). The present study involved only secondary analysis of the resulting de-identified institutional database, with no participant re-contact or additional data collection.
Data Availability Statement
Restrictions apply to the availability of the source data. The de-identified analytical dataset was derived from the 2022 provincial inventory conducted by the Provincial Government of Azuay and is not publicly available because the authors do not hold unilateral authorization to redistribute the institutional database. Requests for access to the source data should be directed to the Provincial Government of Azuay and are subject to institutional authorization and applicable data-protection and confidentiality requirements. The R analysis scripts, summarized diagnostic outputs, and other non-confidential reproducibility materials are provided in the Supplementary Materials. The original blank questionnaire used in the inventory is provided as Supplementary File S2.
Acknowledgments
The authors thank the representatives of the community irrigation systems who participated in the provincial inventory and the fieldwork team responsible for data collection. The authors also acknowledge the Provincial Government of Azuay, the Department of Water Resources and Environmental Sciences (iDRHiCA) of the University of Cuenca, and the consulting team for their respective institutional and technical contributions to the inventory and data-collection instrument. The authors further acknowledge the Spanish Government and European Commission (project Green4Grey-PCI2025-167134-2-Water4ALL 2024) for their support. During manuscript preparation and revision, ChatGPT (OpenAI, GPT-5.6) was used to assist with editorial and organizational refinement of the manuscript, figure-layout refinement, troubleshooting and refinement of author-directed R code, and preparation of reproducibility documentation. ChatGPT was not used to collect, generate, or alter the source data; define the analytical strategy; select variables or models; execute statistical analyses; or generate statistical results. All statistical analyses were performed by the authors in the local R environment. The authors reviewed and edited the AI-assisted textual and technical suggestions and take full responsibility for the final content of the manuscript.
Conflicts of Interest
The authors declare no conflicts of interest.
Abbreviations
The following abbreviations are used in this manuscript:
| BH | Benjamini–Hochberg |
| CI | Confidence interval |
| FDR | False discovery rate |
| HC3 | Heteroscedasticity-consistent covariance estimator type 3 |
| KMO | Kaiser–Meyer–Olkin |
| MAR | Missing at Random |
| MICE | Multivariate imputation by chained equations |
| OLS | Ordinary least squares |
| PCA | Principal component analysis |
| PMM | Predictive mean matching |
| SDG | Sustainable Development Goal |
| SI | Sustainability index |
| VIF | Variance inflation factor |
References
- Grafton, R.Q.; Williams, J.; Perry, C.J.; Molle, F.; Ringler, C.; Steduto, P.; Udall, B.; Wheeler, S.A.; Wang, Y.; Garrick, D.; et al. The paradox of irrigation efficiency. Science 2018, 361, 748–750. [Google Scholar] [CrossRef] [Scilit] [PubMed]
- Lankford, B.A. Resolving the paradoxes of irrigation efficiency: Irrigated systems accounting analyses depletion-based water conservation for reallocation. Agric. Water Manag. 2023, 287, 108437. [Google Scholar] [CrossRef] [Scilit]
- Bjornlund, H.; Parry, K.; van Rooyen, A.; Pittock, J. Institutional and technological innovations for sustained change in smallholder irrigation schemes in southern and Eastern Africa. Agric. Water Manag. 2025, 309, 109330. [Google Scholar] [CrossRef] [Scilit]
- Berhe, G.T.; Grum, B.; Baartman, J.E.M.; Veldwisch, G.J.; Ritsema, C.J. Assessing the sustainability of community-managed irrigation systems using multicriteria analysis and sustainability indicators in Northern Ethiopia: A holistic approach. Irrig. Drain. 2026, 75, 330–343. [Google Scholar] [CrossRef] [Scilit]
- Ostrom, E. A general framework for analyzing sustainability of social-ecological systems. Science 2009, 325, 419–422. [Google Scholar] [CrossRef] [Scilit] [PubMed]
- Pahl-Wostl, C. A conceptual framework for analysing adaptive capacity and multi-level learning processes in resource governance regimes. Glob. Environ. Change 2009, 19, 354–365. [Google Scholar] [CrossRef] [Scilit]
- Buytaert, W.; Célleri, R.; De Bièvre, B.; Cisneros, F.; Wyseure, G.; Deckers, J.; Hofstede, R. Human impact on the hydrology of the Andean páramos. Earth-Sci. Rev. 2006, 79, 53–72. [Google Scholar] [CrossRef] [Scilit]
- Célleri, R.; Feyen, J. The hydrology of tropical Andean ecosystems: Importance, knowledge status, and perspectives. Mt. Res. Dev. 2009, 29, 350–355. [Google Scholar] [CrossRef] [Scilit]
- Mosquera, G.M.; Hofstede, R.; Bremer, L.L.; Asbjornsen, H.; Carabajo-Hidalgo, A.; Célleri, R.; Crespo, P.; Esquivel-Hernández, G.; Feyen, J.; Manosalvas, R.; et al. Frontiers in páramo water resources research: A multidisciplinary assessment. Sci. Total Environ. 2023, 892, 164373. [Google Scholar] [CrossRef] [Scilit] [PubMed]
- Ochoa-Tocachi, B.F.; Buytaert, W.; De Bièvre, B.; Célleri, R.; Crespo, P.; Villacís, M.; Llerena, C.A.; Acosta, L.; Villazón, M.; Guallpa, M.; et al. Impacts of land use on the hydrological response of tropical Andean catchments. Hydrol. Process. 2016, 30, 4074–4089. [Google Scholar] [CrossRef] [Scilit]
- Gutiérrez-Malaxechebarría, Á.M. Formal and informal irrigation in the Andean countries: An overview. Cuad. Desarro. Rural 2014, 11, 75–99. [Google Scholar] [CrossRef] [Scilit]
- Hoogesteger, J. Normative structures, collaboration and conflict in irrigation; a case study of the Pillaro North Canal Irrigation System, Ecuadorian Highlands. Int. J. Commons 2015, 9, 398–415. [Google Scholar] [CrossRef]
- Leroy, D.; García, S.B.; Porto Tapiquén, E. Understanding institutional changes in irrigation management: A comparative case study of two communities in the Venezuelan Andes. Water Int. 2022, 47, 1287–1309. [Google Scholar] [CrossRef] [Scilit]
- Cachipuendo, C.; Ilbay, M.; Requelme, N. Gestión comunitaria y sostenibilidad en sistemas de riego andinos mediante indicadores de uso eficiente del agua en la agricultura. Granja Rev. Cienc. Vida 2025, 42, 41–60. [Google Scholar] [CrossRef] [Scilit]
- Ramirez, M.A.; Lizarazo, I. Geographic perspectives on sustainability: Towards a conceptual framework. Environ. Dev. 2025, 53, 101121. [Google Scholar] [CrossRef] [Scilit]
- Malah, A.; Bahi, H.; Bounoua, L.; Tahiri, M.; Chaabane, M.S.; Sabri, A. Territorial sustainability performance assessment in African context: Case study of the Moroccan provinces. J. Clean. Prod. 2023, 433, 139781. [Google Scholar] [CrossRef] [Scilit]
- Cicciù, B.; Schramm, F.; Schramm, V.B. Multi-criteria decision making/aid methods for assessing agricultural sustainability: A literature review. Environ. Sci. Policy 2022, 138, 85–96. [Google Scholar] [CrossRef] [Scilit]
- Sinisterra-Solís, N.K.; Sanjuan, N.; Ribal, J.; Estruch, V.; Clemente, G.; Rozakis, S. Developing a composite indicator to assess agricultural sustainability: Influence of some critical choices. Ecol. Indic. 2024, 161, 111934. [Google Scholar] [CrossRef] [Scilit]
- Ahmad, M.T.; Haie, N.; Gonçalves, J.M.; Pinho, J.; Yen, H.; Yakubu, M.L.; Mohammed, M.U.; Suleimana, A. Performance assessment and indicators for agricultural water management—A review. Water Environ. J. 2024, 38, 192–211. [Google Scholar] [CrossRef] [Scilit]
- Berrones, G.; Célleri, R. Análisis de los desafíos de sostenibilidad en sistemas de riego de los Andes. Granja Rev. Cienc. Vida 2025, 42, 22–40. [Google Scholar] [CrossRef] [Scilit]
- Donoso, M.E.; Sarmiento, F.O. Changing mountain farmscapes: Vulnerability and migration drivers in the Paute River watershed, Southern Ecuador. J. Mt. Sci. 2021, 18, 1902–1919. [Google Scholar] [CrossRef] [Scilit]
- Gobierno Autónomo Descentralizado Provincial del Azuay (GADPA). Plan de Desarrollo y Ordenamiento Territorial de la Provincia del Azuay: Actualización 2024. Resumen Ejecutivo; GADPA: Cuenca, Ecuador, 2025. Available online: https://www.azuay.gob.ec/wp-content/uploads/2025/02/RESUMEN-EJECUTIVO-PDOT-2024_21022025_f.pdf (accessed on 15 July 2026).
- United Nations General Assembly. Transforming Our World: The 2030 Agenda for Sustainable Development; Resolution A/RES/70/1; United Nations: New York, NY, USA, 2015. [Google Scholar]
- GADM Database of Global Administrative Areas, Version 4.1. Available online: https://gadm.org/ (accessed on 4 August 2026).
- Fick, S.E.; Hijmans, R.J. WorldClim 2: New 1-km spatial resolution climate surfaces for global land areas. Int. J. Climatol. 2017, 37, 4302–4315. [Google Scholar] [CrossRef] [Scilit]
- Gobierno Autónomo Descentralizado Provincial del Azuay (GADPA). Ordenanza para la Implementación del Plan Provincial de Riego, Drenaje y Aguas Subterráneas; Registro Oficial, Edición Especial No. 1087; GADPA: Cuenca, Ecuador, 2026.
- Graham, J.W. Missing data analysis: Making it work in the real world. Annu. Rev. Psychol. 2009, 60, 549–576. [Google Scholar] [CrossRef] [Scilit] [PubMed]
- Rubin, D.B. Multiple Imputation for Nonresponse in Surveys; Wiley: New York, NY, USA, 1987. [Google Scholar] [CrossRef] [Scilit]
- Van Buuren, S.; Brand, J.P.L.; Groothuis-Oudshoorn, C.G.M.; Rubin, D.B. Fully conditional specification in multivariate imputation. J. Stat. Comput. Simul. 2006, 76, 1049–1064. [Google Scholar] [CrossRef] [Scilit]
- van Buuren, S.; Groothuis-Oudshoorn, K. mice: Multivariate Imputation by Chained Equations in R. J. Stat. Softw. 2011, 45, 1–67. [Google Scholar] [CrossRef] [Scilit]
- von Hippel, P.T. How many imputations do you need? A two-stage calculation using a quadratic rule. Sociol. Methods Res. 2020, 49, 699–718. [Google Scholar] [CrossRef] [Scilit] [PubMed]
- Bollen, K.A.; Lennox, R. Conventional wisdom on measurement: A structural equation perspective. Psychol. Bull. 1991, 110, 305–314. [Google Scholar] [CrossRef]
- Diamantopoulos, A.; Winklhofer, H.M. Index construction with formative indicators: An alternative to scale development. J. Mark. Res. 2001, 38, 269–277. [Google Scholar] [CrossRef] [Scilit]
- OECD; European Union; European Commission, Joint Research Centre. Handbook on Constructing Composite Indicators: Methodology and User Guide; OECD Publishing: Paris, France, 2008. [Google Scholar] [CrossRef] [Scilit]
- Greco, S.; Ishizaka, A.; Tasiou, M.; Torrisi, G. On the methodological framework of composite indices: A review of the issues of weighting, aggregation, and robustness. Soc. Indic. Res. 2019, 141, 61–94. [Google Scholar] [CrossRef] [Scilit]
- Hair, J.F.; Black, W.C.; Babin, B.J.; Anderson, R.E. Multivariate Data Analysis, 8th ed.; Cengage: Andover, UK, 2019. [Google Scholar]
- Lorenzo-Seva, U.; ten Berge, J.M.F. Tucker’s congruence coefficient as a meaningful index of factor similarity. Methodology 2006, 2, 57–64. [Google Scholar] [CrossRef] [Scilit]
- Long, J.S.; Ervin, L.H. Using heteroscedasticity consistent standard errors in the linear regression model. Am. Stat. 2000, 54, 217–224. [Google Scholar] [CrossRef] [Scilit]
- Benjamini, Y.; Hochberg, Y. Controlling the false discovery rate: A practical and powerful approach to multiple testing. J. R. Stat. Soc. Ser. B Methodol. 1995, 57, 289–300. [Google Scholar] [CrossRef] [Scilit]
- Nilsson, M.; Griggs, D.; Visbeck, M. Policy: Map the interactions between Sustainable Development Goals. Nature 2016, 534, 320–322. [Google Scholar] [CrossRef] [Scilit] [PubMed]
- Pradhan, P.; Costa, L.; Rybski, D.; Lucht, W.; Kropp, J.P. A systematic study of Sustainable Development Goal (SDG) interactions. Earth’s Future 2017, 5, 1169–1179. [Google Scholar] [CrossRef] [Scilit]
- Bandari, R.; Moallemi, E.A.; Szetey, K.; Flanagan-Smith, C.; Hadjikakou, M.; Marcos-Martinez, R.; Kharrazi, A.; Trogrlić, R.Š.; Bryan, B.A. Participatory modeling for analyzing interactions between high-priority Sustainable Development Goals to promote local sustainability. Earth’s Future 2023, 11, e2023EF003948. [Google Scholar] [CrossRef] [Scilit]
- Mwafuka, J.; Mabiza, C.; Madyiwa, S.; Kujinga, K.; Chitata, T. Institutional fragmentation and smallholder irrigation performance: A case of Mkoba and Silalatshani Irrigation Schemes, Zimbabwe. Water Int. 2024, 49, 823–845. [Google Scholar] [CrossRef] [Scilit]
- Matovelle, C.; Quinteros, M.; Quinteros, K.S.; Jaramillo, K. Water quality assessment methods of the highland Andean rivers: A scoping systematic review. Heliyon 2024, 10, e30552. [Google Scholar] [CrossRef] [Scilit] [PubMed]
- Ruiz-Ordóñez, D.M.; Solano-Correa, Y.T.; Maysels, R.; Figueroa-Casas, A. Land-use dynamics and water quality in Andean basins. Sustainability 2023, 15, 15965. [Google Scholar] [CrossRef] [Scilit]
- Rivera-Velásquez, M.F.; Cóndor-Simbaña, C.G.; Lapo-Alcivar, C.M.; Pambi-Lalangui, G.J.; Armijos-Oviedo, N.E.; Carrera Almendariz, L.S. Spatio-temporal variation in water quality in a high-Andean protected area: A multivariate analysis of the Diablo Sacha River, Ecuador. Water 2026, 18, 1330. [Google Scholar] [CrossRef] [Scilit]
- Muñoz, R.; Vaghefi, S.A.; Drenkhan, F.; Santos, M.J.; Viviroli, D.; Muccione, V.; Huggel, C. Assessing water management strategies in data-scarce mountain regions under uncertain climate and socio-economic changes. Water Resour. Manag. 2024, 38, 4083–4100. [Google Scholar] [CrossRef] [Scilit]
- Colombo, P.; Ribeiro Neto, G.G.; Costa, A.C.; Mamede, G.L.; Van Oel, P.R. Modeling the influence of small reservoirs on hydrological drought propagation in space and time. J. Hydrol. 2024, 629, 130640. [Google Scholar] [CrossRef] [Scilit]
- Mdoda, L.; Obi, A.; Gidi, L.; Kibirige, D. Market participation of irrigated smallholder vegetable farming in the Eastern Cape, South Africa. Cogent Soc. Sci. 2024, 10, 2359250. [Google Scholar] [CrossRef] [Scilit]
- Clapp, J.; Vriezen, R.; Laila, A.; Conti, C.; Gordon, L.; Hicks, C.; Rao, N. Corporate concentration and power matter for agency in food systems. Food Policy 2025, 134, 102897. [Google Scholar] [CrossRef] [Scilit]
- Podsakoff, P.M.; Podsakoff, N.P.; Williams, L.J.; Huang, C.; Yang, J. Common method bias: It’s bad, it’s complex, it’s widespread, and it’s not easy to fix. Annu. Rev. Organ. Psychol. Organ. Behav. 2024, 11, 17–61. [Google Scholar] [CrossRef] [Scilit]
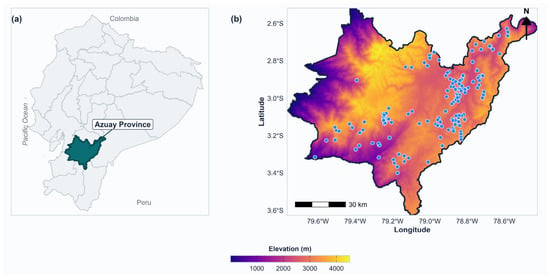
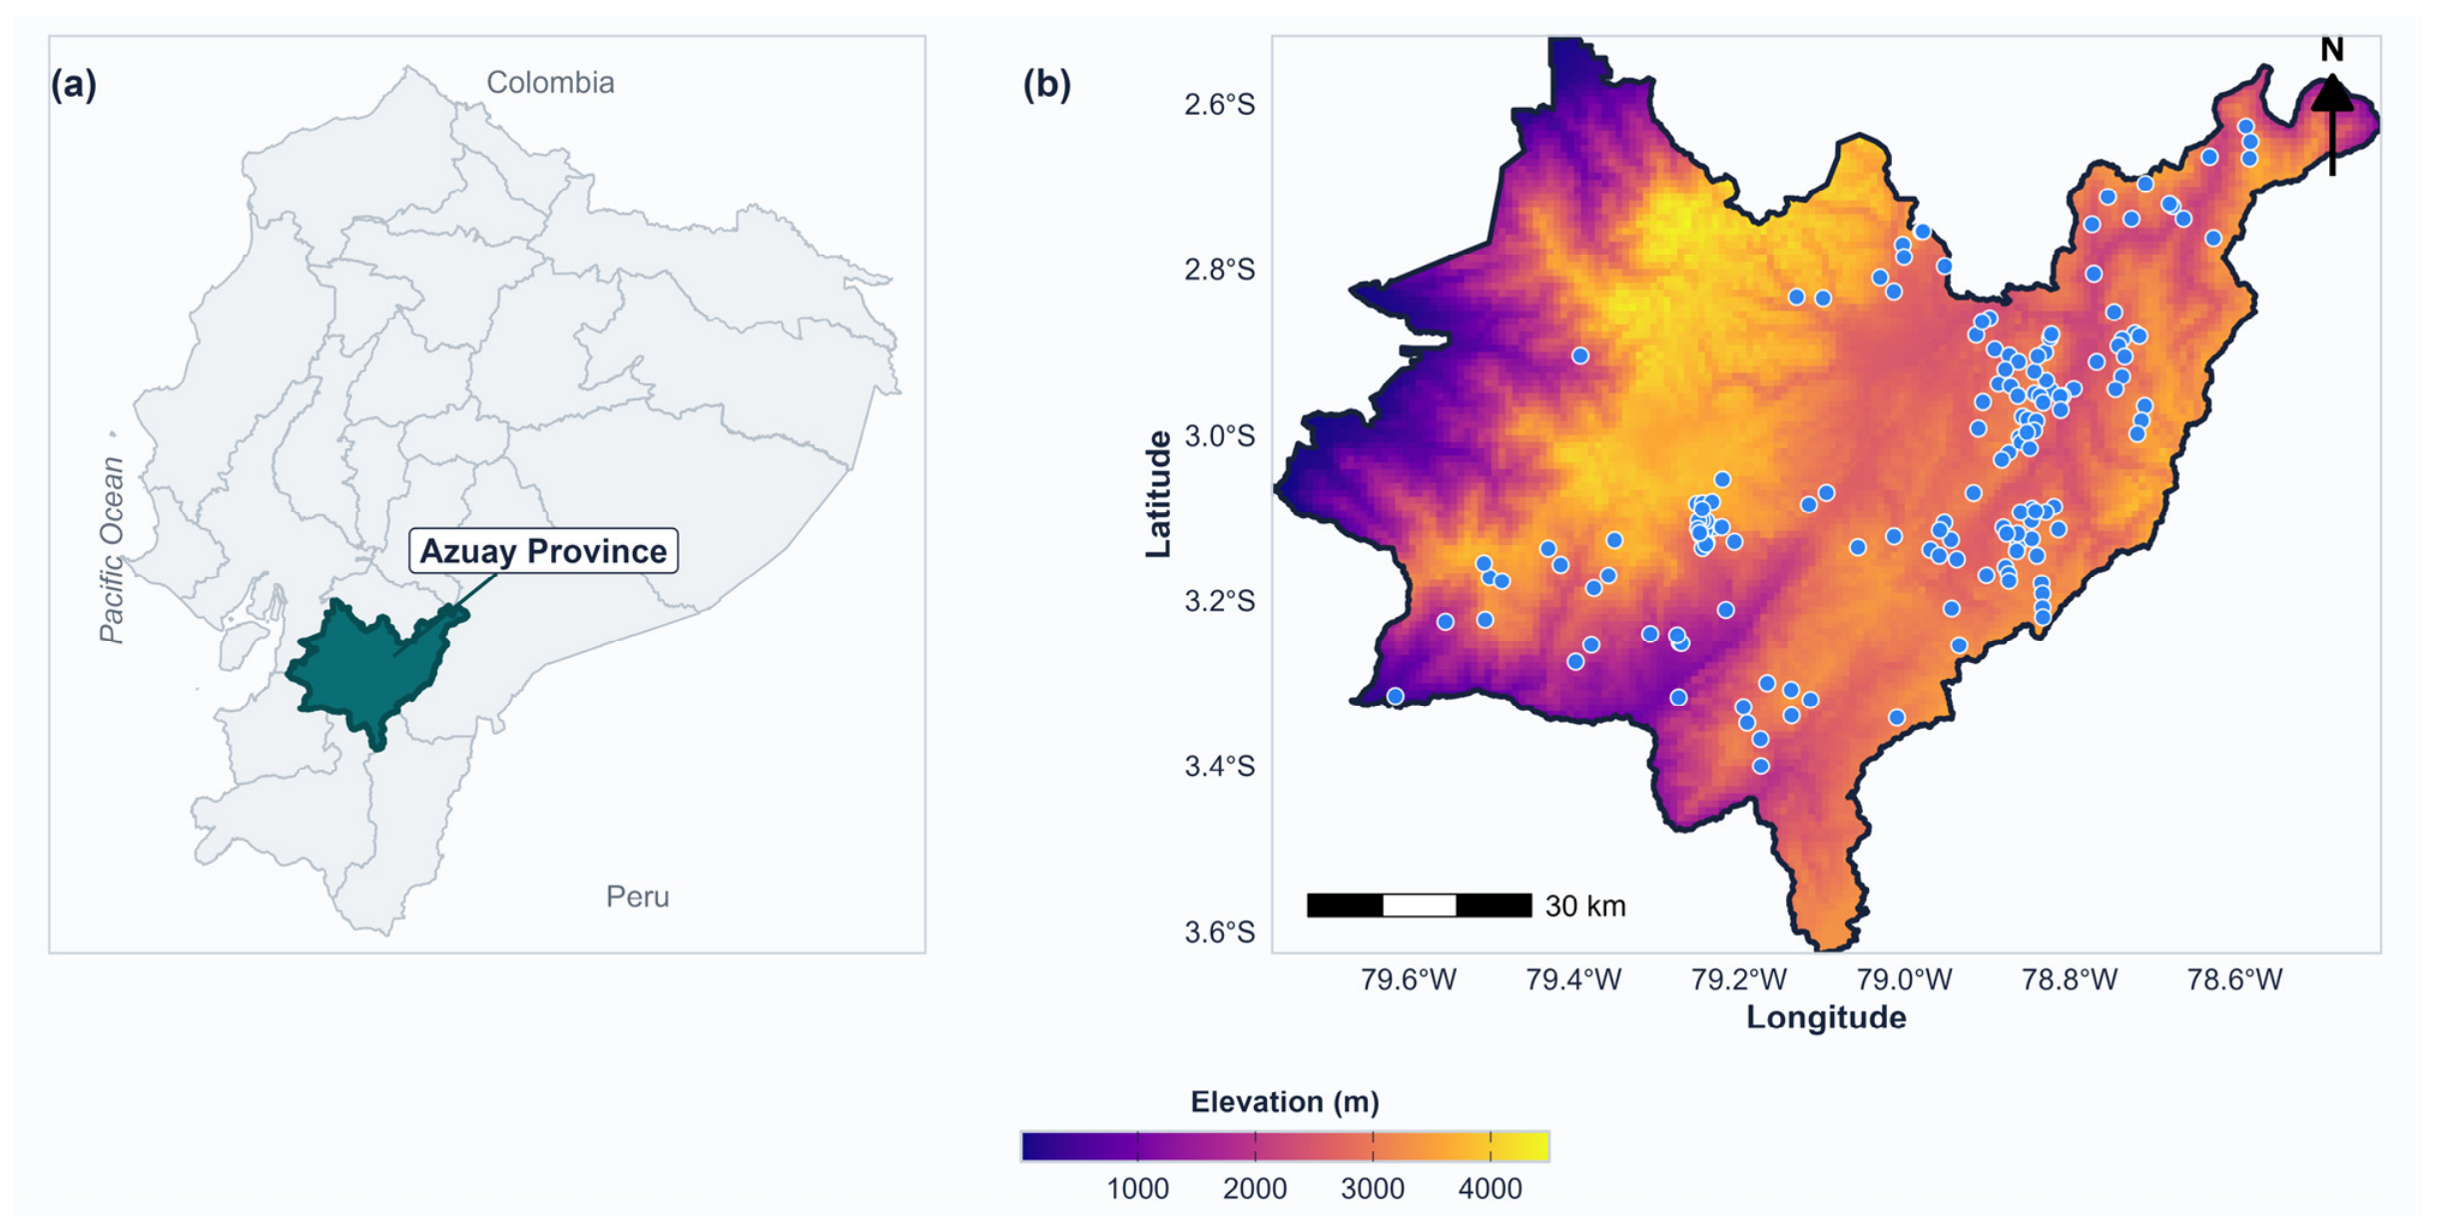
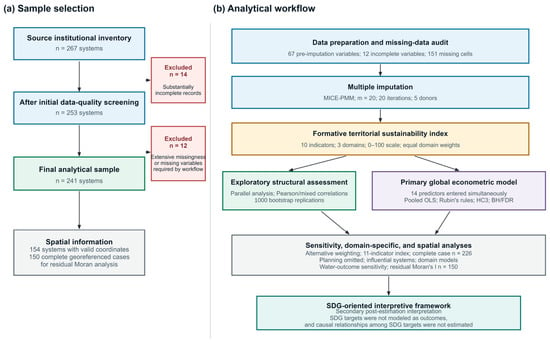
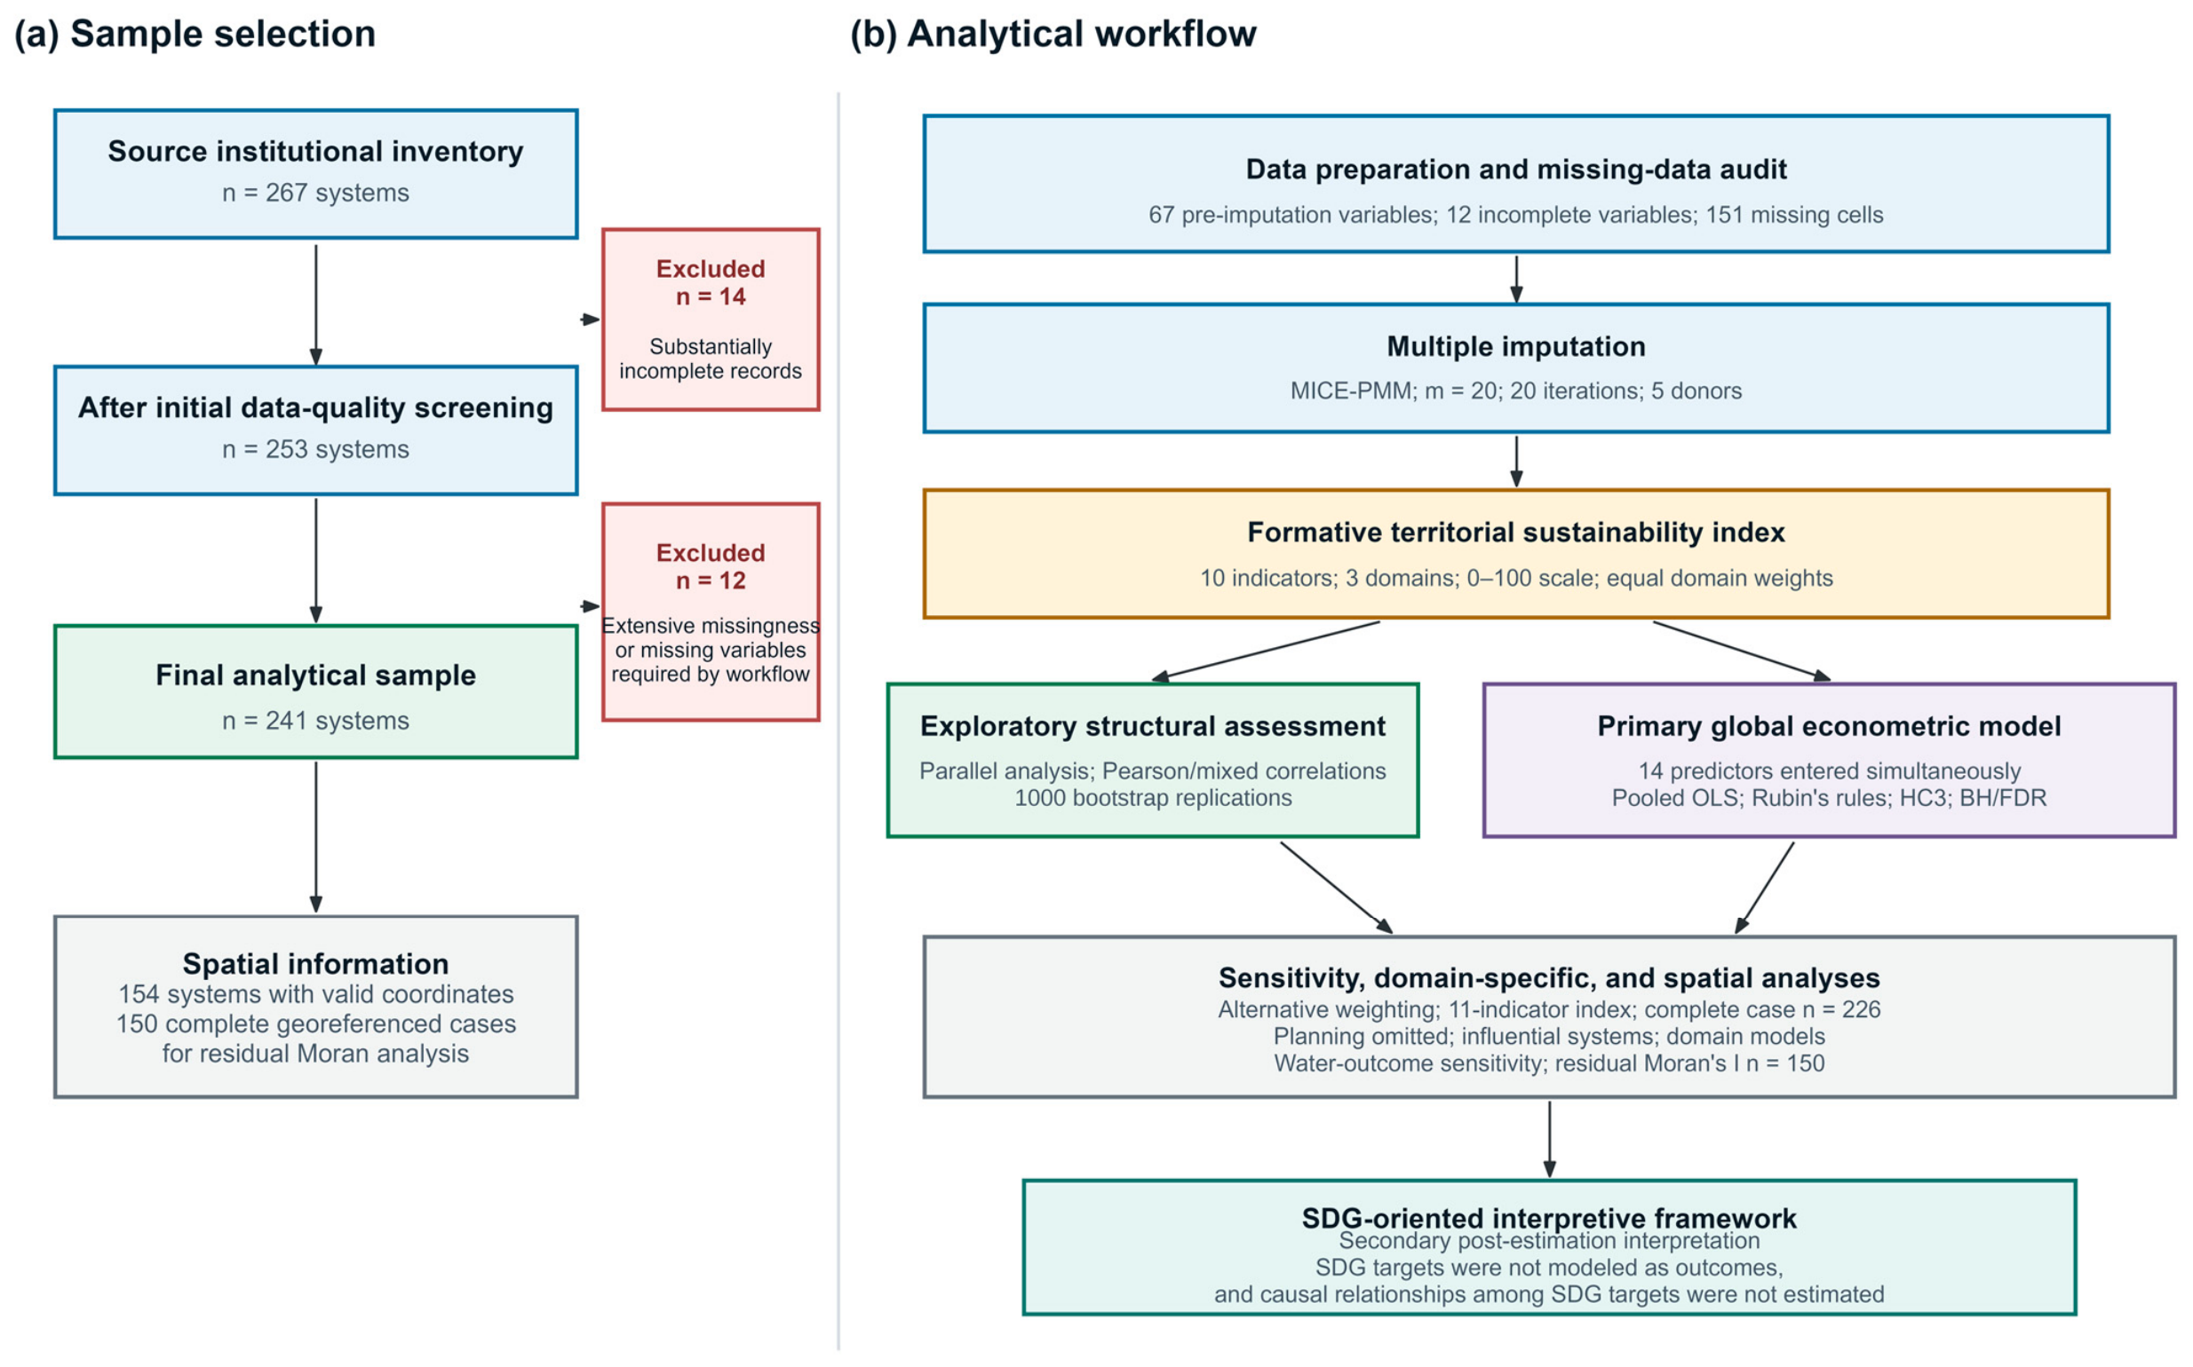
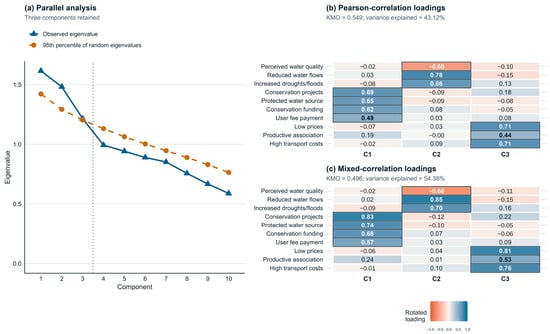
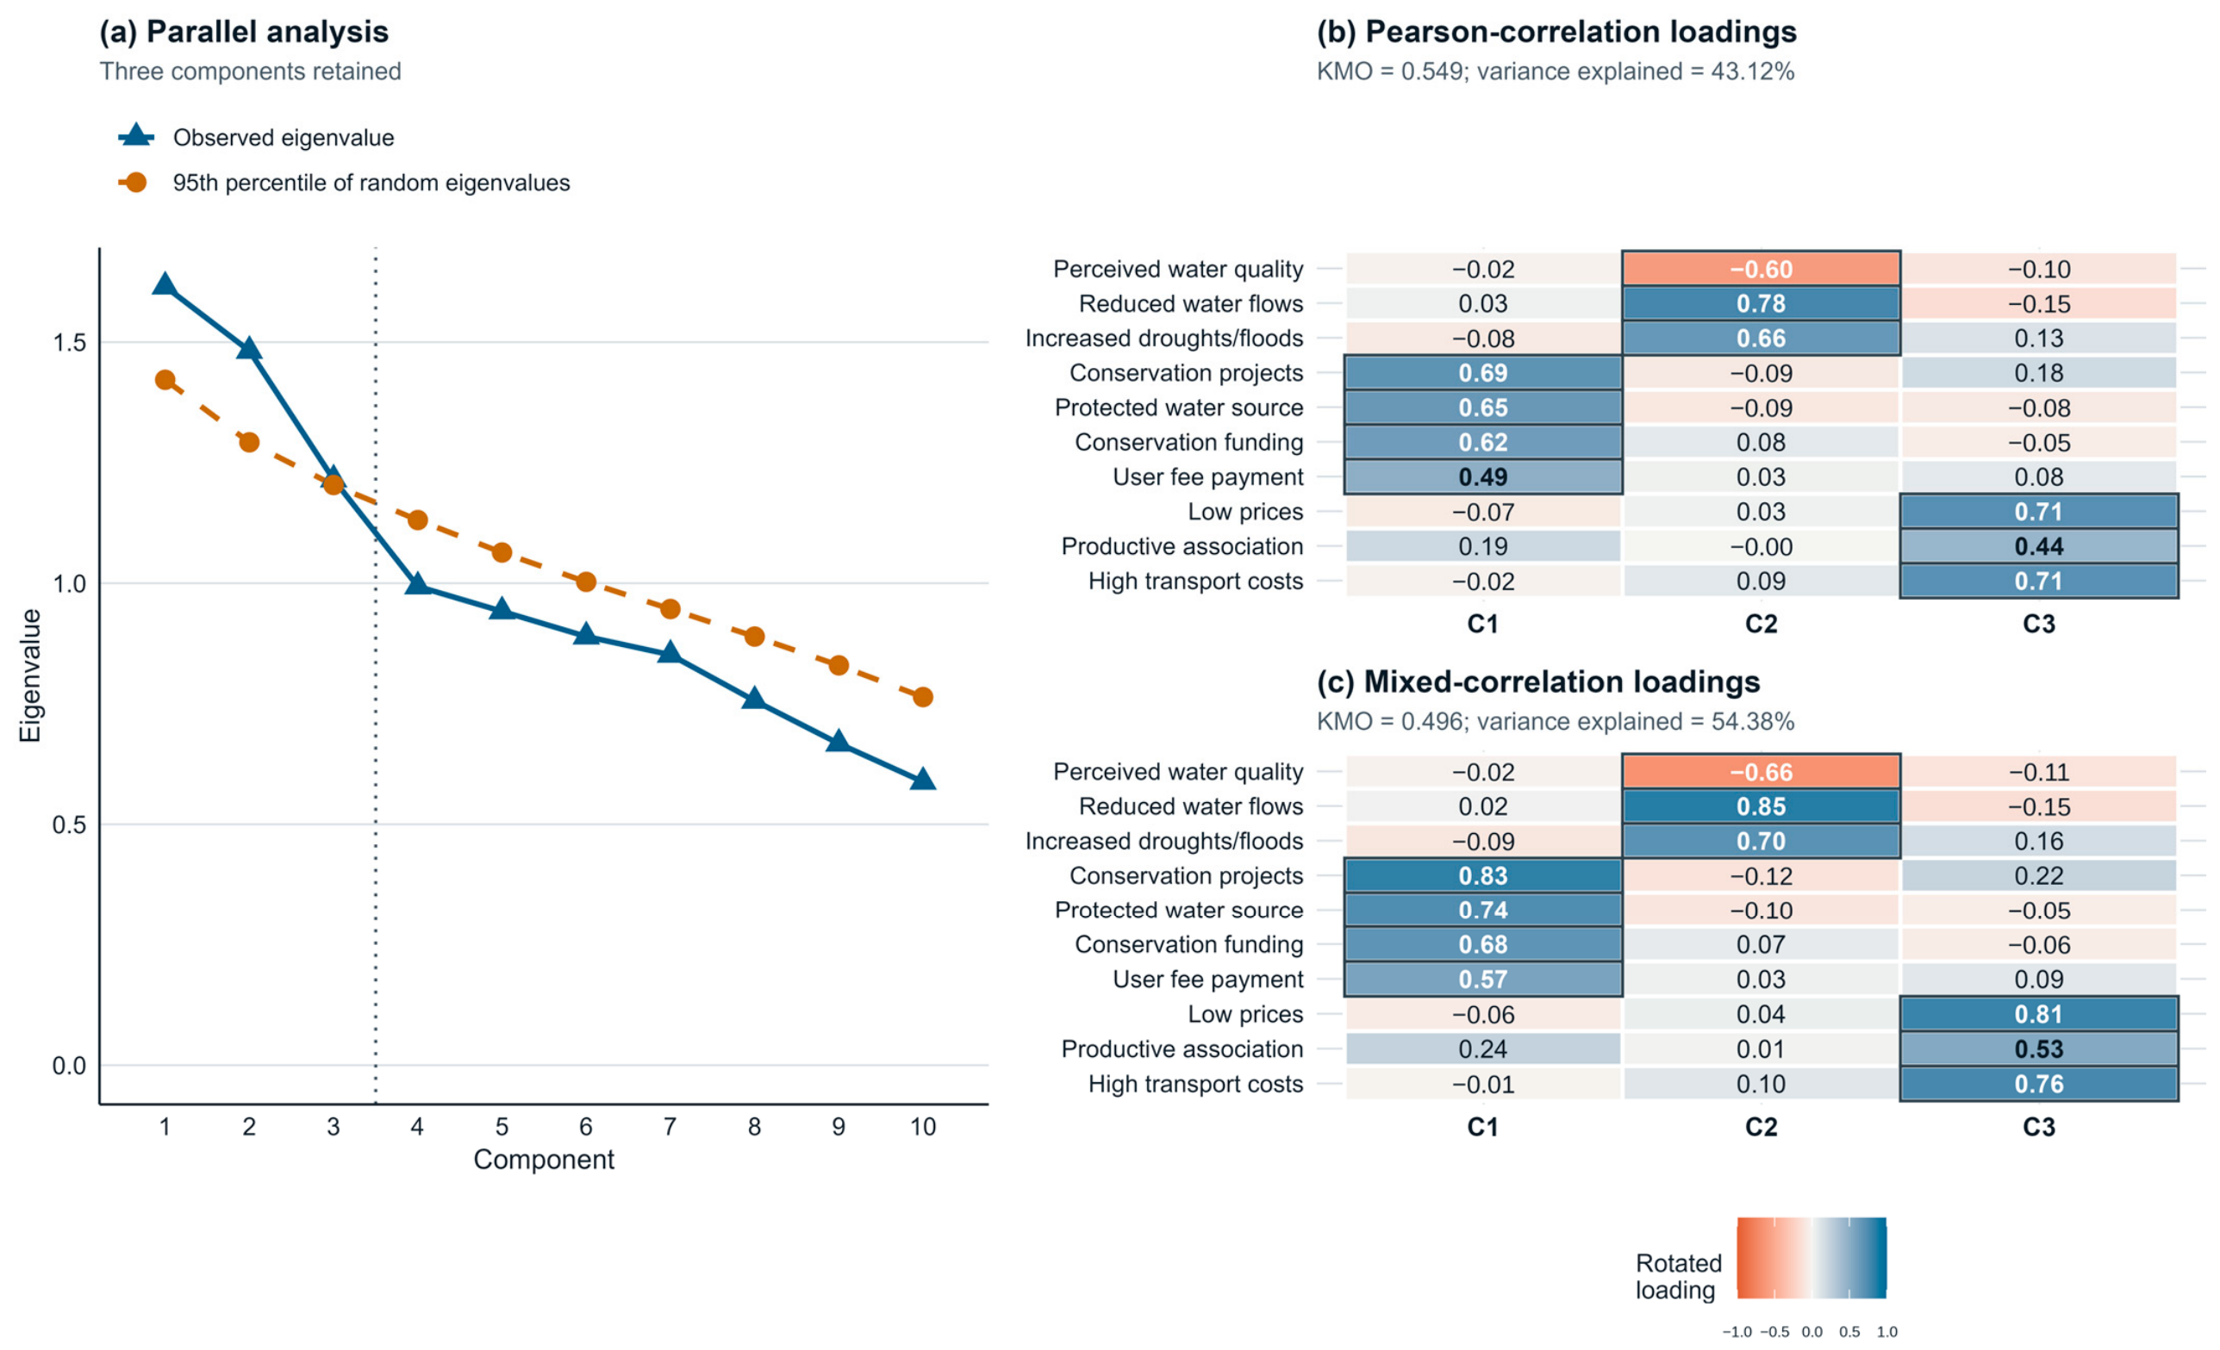
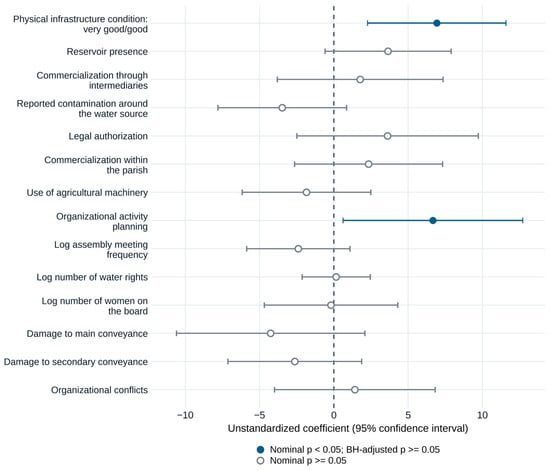
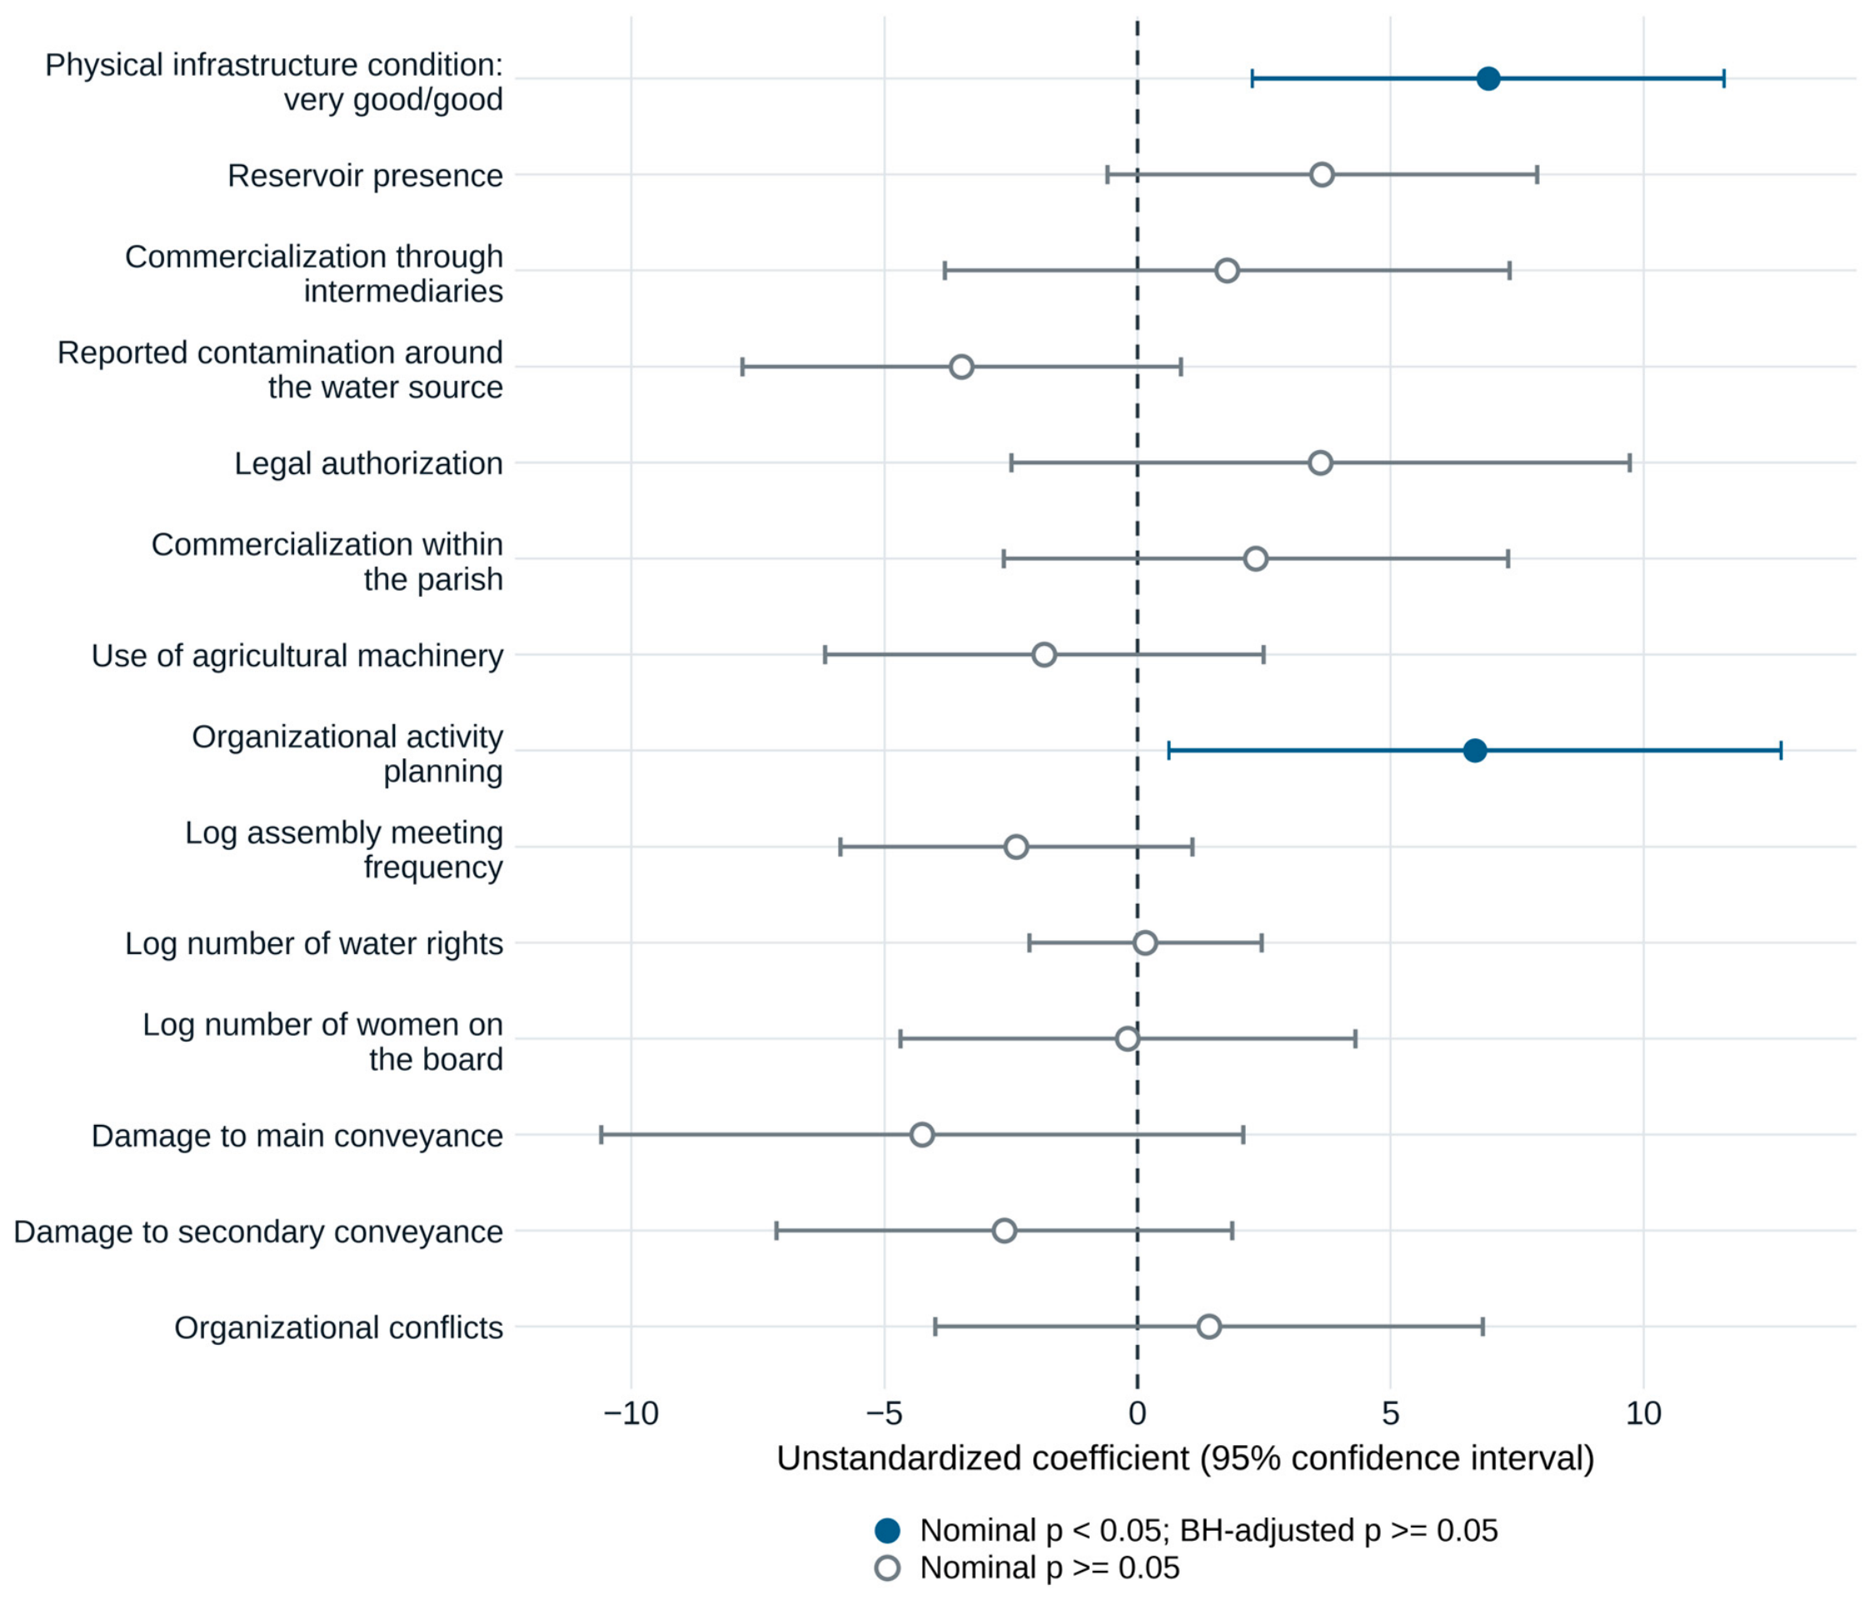
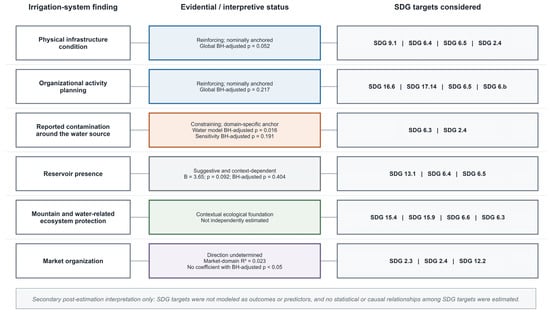
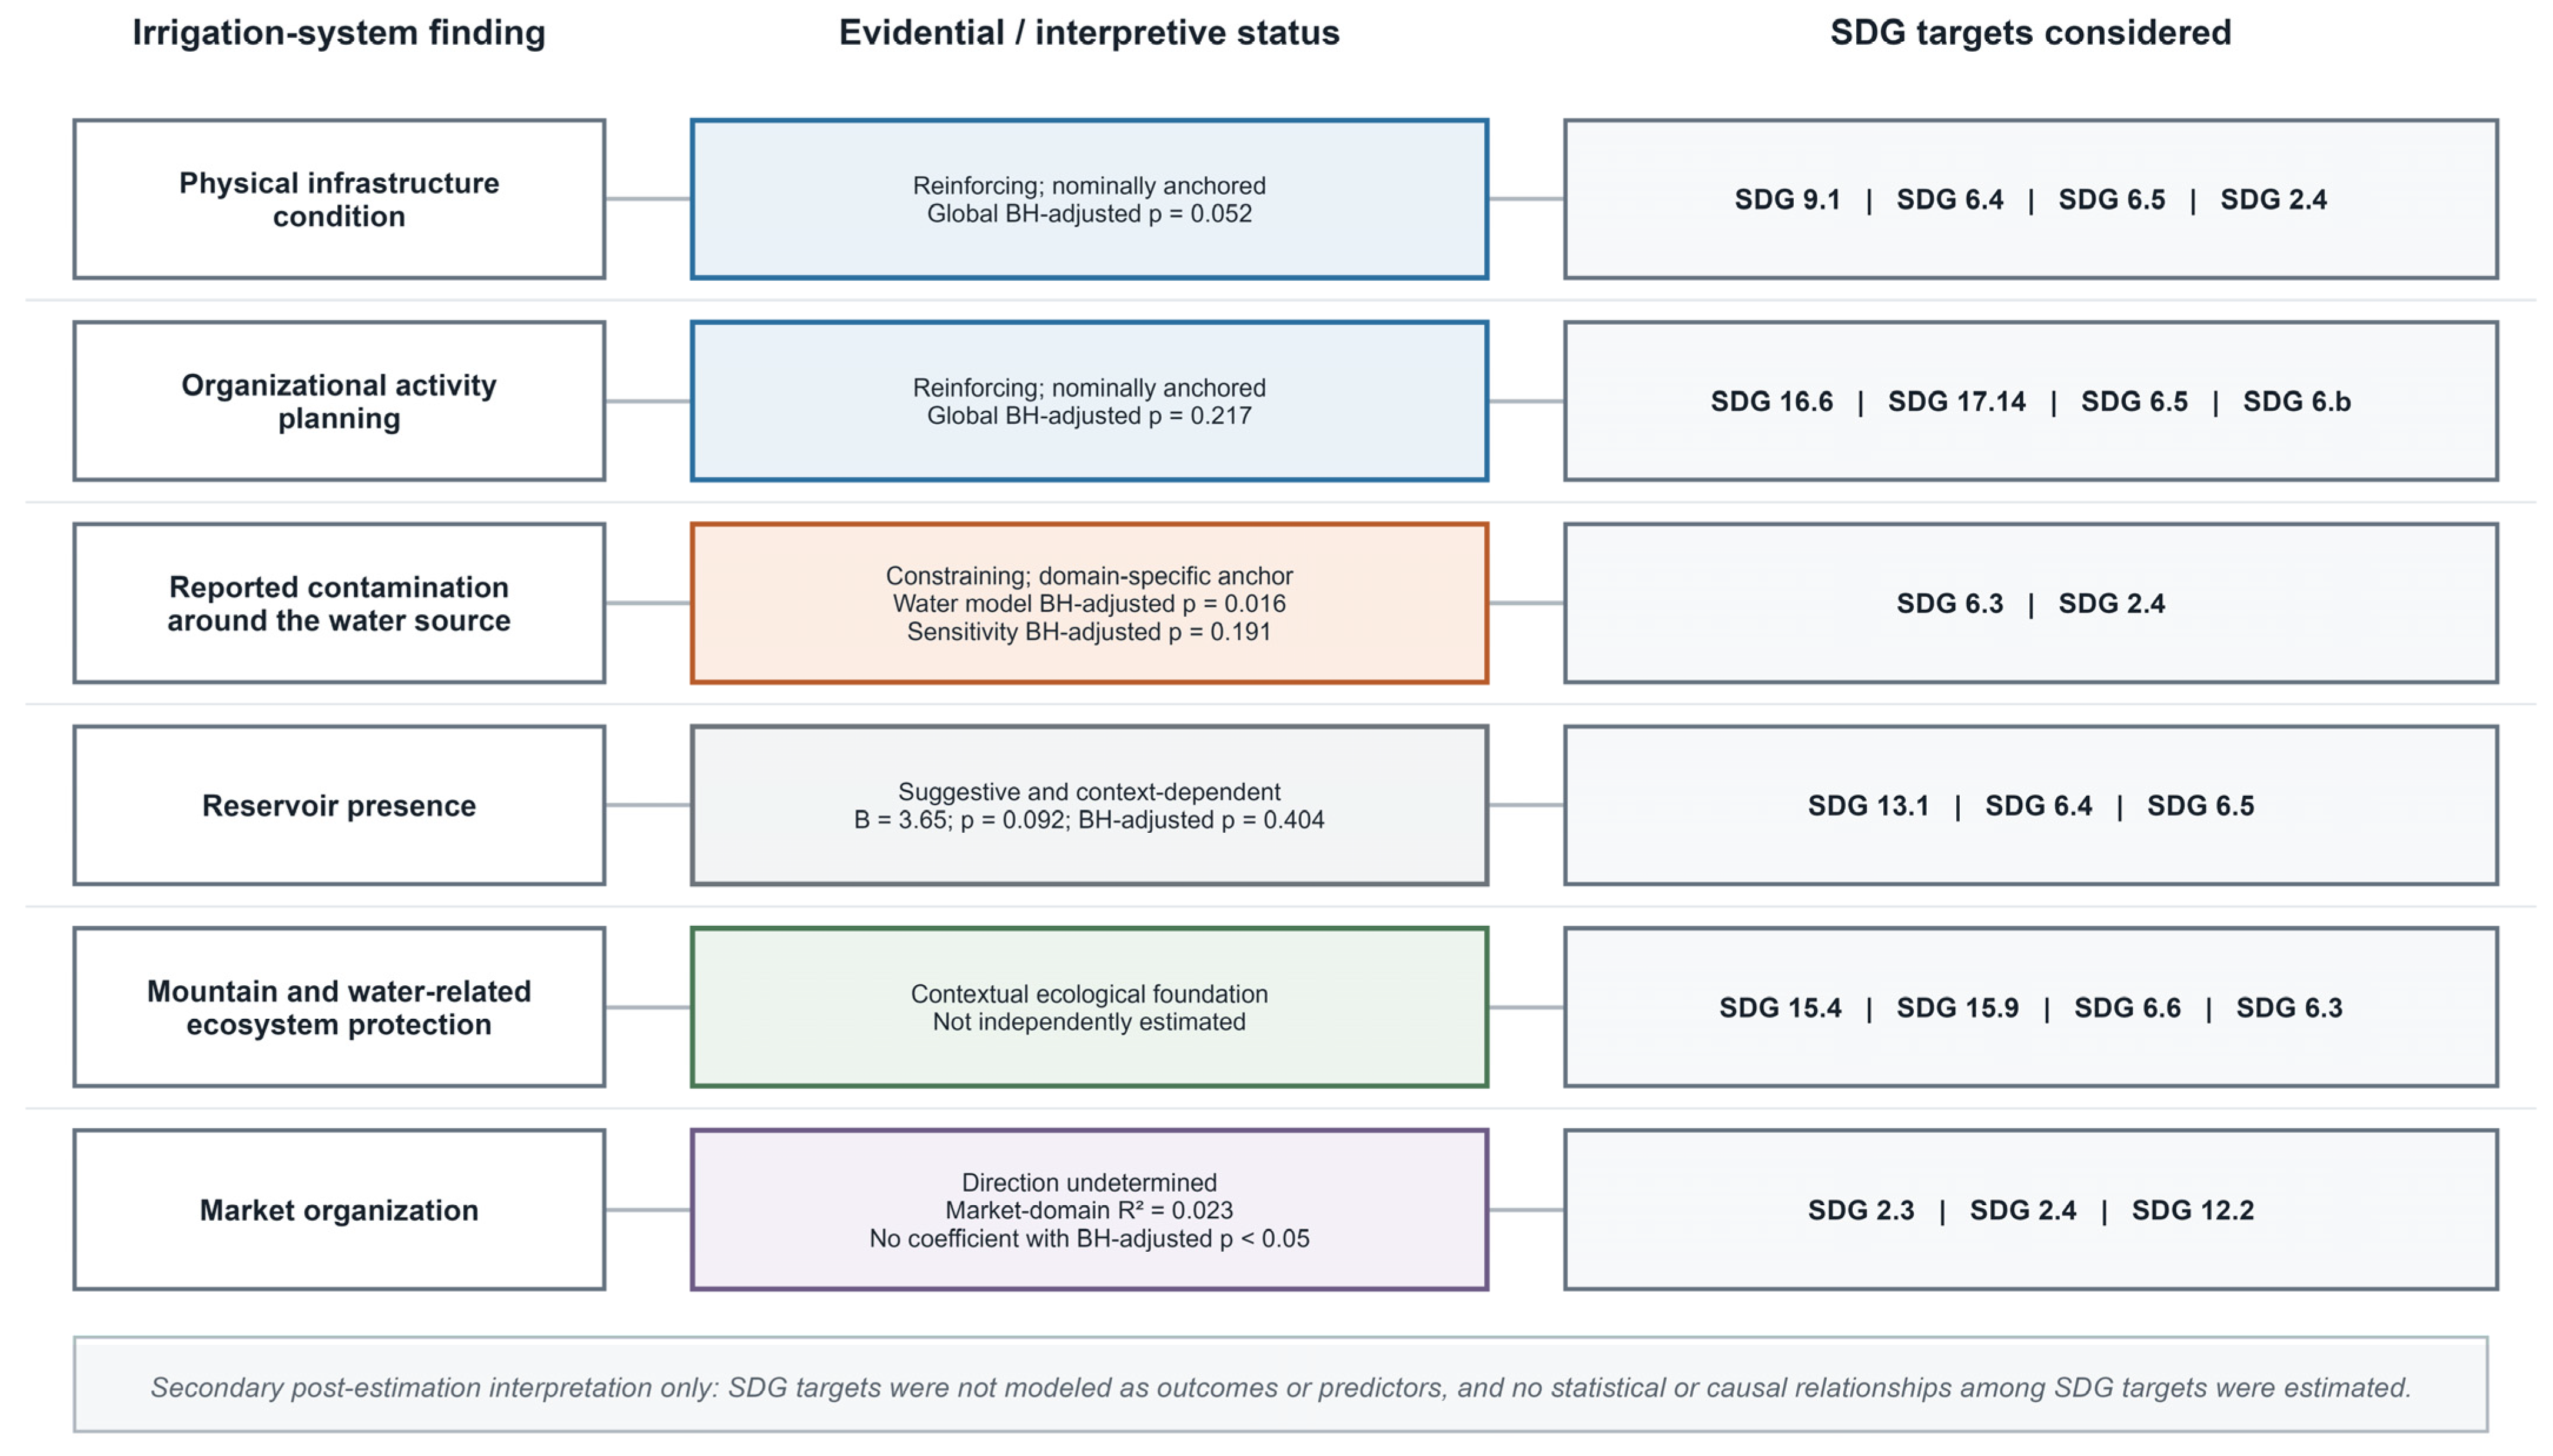

Disclaimer/Publisher’s Note: The statements, opinions and data contained in all publications are solely those of the individual author(s) and contributor(s) and not of MDPI and/or the editor(s). MDPI and/or the editor(s) disclaim responsibility for any injury to people or property resulting from any ideas, methods, instructions or products referred to in the content. |
© 2026 by the authors. Licensee MDPI, Basel, Switzerland. This article is an open access article distributed under the terms and conditions of the Creative Commons Attribution (CC BY) license.