


Abstract
Sustainable river basin management requires an integrated approach that considers interactions among hydrological resources, socioeconomic development, and ecological protection. Existing studies have mainly focused on evaluating system development and coupling coordination, with limited attention to optimization-based regulation. This study conducts optimal operation of coupling coordination for the integrated system considering water resources, socioeconomic, and ecological environment. Initially, an indicator framework integrating multiple dimensions is developed to characterize system performance, followed by the application of the coupling coordination degree model to assess subsystem evolution and overall coordination. The obstacle degree model is further employed to diagnose dominant limiting factors and determine adjustable variables with regulatory potential. Finally, an optimization model is formulated to maximize the coupling coordination degree under constraints related to total water consumption, green ecological development, and regional feasibility, and NSGA-II is applied to obtain optimal regulation schemes. The results showed that the coupling coordination degree increased from 0.72 to 0.83 (+15.2%). Under the proposed operation strategy, the coupling coordination degree was further improved across all seven league-level cities, with average increases of 0.007–0.012 during the operation period. Optimization further improved coordination in all cities, demonstrating the effectiveness of the proposed framework for sustainable basin management. The proposed framework supports coordinated development and sustainable resource management in the Yellow River Basin.
1. Introduction
Growing climate risks and resource constraints underscore the critical role of water availability in sustaining ecological resilience and socioeconomic progress [1,2]. Climate change has increasingly altered the temporal and spatial patterns of water availability, resulting in pronounced variability in water resources. These changes not only threaten regional ecological security but also pose severe challenges to human production and daily life [3]. The UN Sustainable Development Goals (SDGs) emphasize more efficient resource use and stronger environmental protection as essential components of global sustainability. Balancing rapid economic growth with resource conservation and ecological restoration has therefore become a critical challenge in environmental science and management [4,5].
The Inner Mongolia section of the Yellow River Basin provides a representative setting for examining these challenges. The Yellow River flows through seven prefecture-level administrative regions in Inner Mongolia, namely Alxa League, Wuhai, Ordos, Bayannur, Baotou, Hohhot, and Ulanqab. The main stream extends approximately 843.5 km within Inner Mongolia, and the corresponding basin area is approximately 151,900 km2 [6]. The region is characterized by limited water availability, substantial spatial heterogeneity in water-resource endowment, rapid socioeconomic development in some areas, and ecologically sensitive environments. The Yellow River supports agricultural irrigation, industrial production, urban development, and ecological functions across the region, resulting in strong interactions and potential trade-offs among water-resource utilization, socioeconomic development, and ecological protection. The combination of water scarcity, socioeconomic demands, and ecological protection makes this area well suited for examining how these three dimensions can be balanced under limited water availability. At the national level, increasing policy attention has been directed toward ecological protection and high-quality growth across the Yellow River Basin. The Yellow River Protection Law further establishes requirements for ecological protection, water conservation, efficient water use, and sustainable development within the basin [7]. Against this policy and resource context, assessing the interactions and coordination among the three subsystems in the study area can provide both theoretical insights and practical guidance.
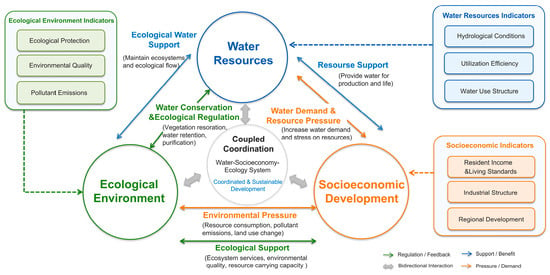
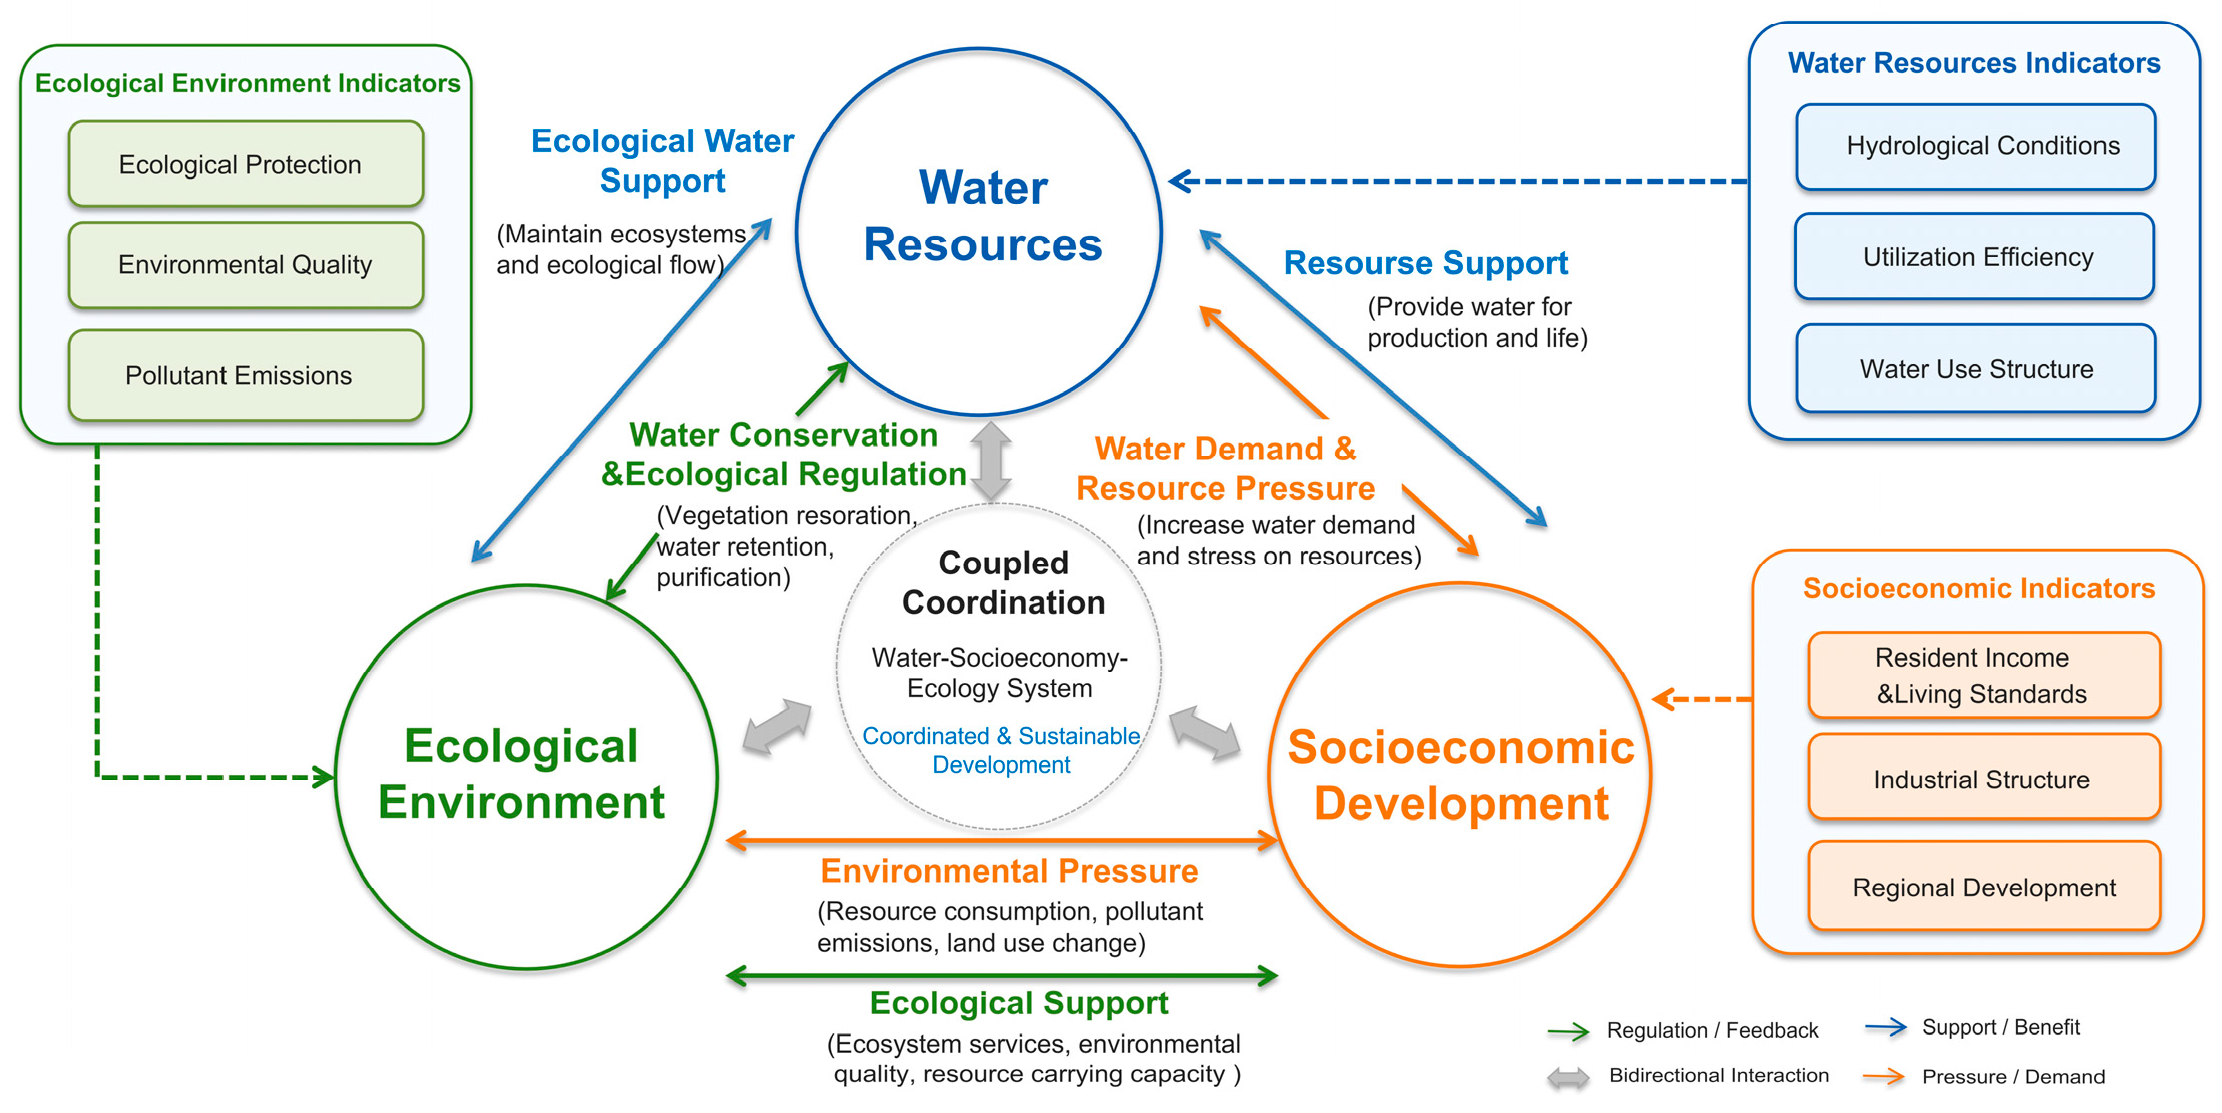
The integrated water–socioeconomic–ecological system exhibits complex adaptive characteristics arising from interactions among multiple components. Water availability, water-use efficiency, and resource endowment determine the capacity of a region to support agricultural production, industrial activities, and urban development. Meanwhile, socioeconomic growth, reflected in industrial expansion, urbanization, and economic productivity, continuously increases water demand and resource consumption, thereby exerting pressure on water systems. Ecological factors, including vegetation coverage, ecological water use, and environmental quality, regulate hydrological processes, enhance water conservation capacity, and maintain ecosystem stability. These elements are linked through multiple feedback mechanisms (Figure 1). Previous studies have shown that economic growth, resource consumption, and environmental quality are closely interconnected, and that sustainable development depends on balancing these interactions through technological progress, structural transformation, and resource-use efficiency improvements [8,9,10]. For example, improvements in water-use efficiency can support economic growth while alleviating resource pressure, whereas excessive resource exploitation may degrade ecological functions and ultimately threaten regional water security. Consequently, the composite system exhibits strong interdependence, nonlinearity, and dynamic evolutionary characteristics. To reveal the internal mechanisms and evolutionary processes of such complex systems, researchers have increasingly adopted simulation-based approaches, including scenario simulation and sustainable carrying-capacity assessment, to investigate interactions among system elements and explore potential development pathways under different scenarios [11,12]. Nevertheless, the intricate interactions and feedback mechanisms among subsystems ultimately make it difficult to accurately assess the coordination state of the integrated system. Consequently, coupling-oriented methods have gained growing attention for exploring interactions among subsystems and assessing the evolution of system coordination. The assessment of coupling relationships and coordination states in complex systems is commonly performed using the Coupling Coordination Degree Model (CCDM) [13,14].
Figure 1.
Interaction between social, economic, ecological and hydrological resources.
Existing studies have primarily focused on evaluating coordination levels among multiple subsystems through comprehensive evaluation index systems. The Coupling Coordination Degree Model (CCDM) has been widely adopted because of its effectiveness in characterizing interactions and coordinated development among complex systems [15,16]. Researchers have extensively applied CCDM to studies of water resources, socioeconomic development, ecological environments, urbanization, and regional sustainability, thereby providing an important analytical framework for understanding the overall long-term coordinated evolution of coupled systems. Diverse research contexts have demonstrated the applicability of CCDM. Fang et al. [17] quantitatively characterized the interactions linking human activities with environmental systems through CCDM, whereas Li et al. [18] assessed the coordination level among economic, resource, and environmental systems in Wuhan, China. Liu et al. [19] further extended the application of CCDM to evaluate the coordination level of the water–energy–food–carbon system. Collectively, these studies demonstrate the effectiveness of CCDM in revealing interaction intensity and coordinated development among multiple subsystems under different regional and thematic contexts.
Although CCDM effectively evaluates the coordination status among subsystems and helps reveal areas of weak coordinated development, it cannot explain which specific factors are responsible for these deficiencies. Further diagnostic analysis is therefore required to reveal the key constraints affecting system coordination. The Obstacle Degree Model (ODM) provides such a diagnostic function by quantifying the contribution of individual indicators to system imbalance and identifying the dominant obstacle factors restricting coordination improvement [20,21,22]. ODM diagnoses major bottlenecks and reveals the internal mechanisms restricting coordination improvement by quantifying the contribution of different indicators to system imbalance. Studies across different systems and regions have confirmed its broad applicability. Jiang et al. [23] comprehensively assessed water security conditions across Heilongjiang Province through a water footprint framework and further explored the key constraints affecting water security performance, whereas Qu et al. [24] examined the interactions and coordination characteristics among water resources, ecological conditions, and socioeconomic development in the water-receiving region of the Lower Yellow River, while also diagnosing the major constraints affecting system performance. Zhu et al. [25] further explored the coordination characteristics of the population–water–ecology–economy nexus in the Tianshan North Slope Urban Agglomeration, China, while also diagnosing the primary factors limiting system improvement. These studies demonstrate the effectiveness of ODM in identifying dominant constraints affecting coordinated development and provide an important basis for optimizing system operation. Obstacle factors identified through ODM can also serve as potential decision variables for subsequent operation optimization because they represent the key dimensions constraining system performance. Existing studies employing ODM, however, have largely remained at the stage of obstacle identification, while limited attention has been paid to incorporating the identified obstacle factors into optimization operation frameworks.
In recent years, increasing attention has been devoted to achieving greater synergy across these interconnected dimensions. Existing studies have increasingly examined their interactions and coupling coordination at different spatial scales, including river basins, provinces, and cities [26]. These studies indicate that socioeconomic development may increase water demand and environmental pressure, whereas improvements in water-use efficiency and ecological protection can enhance resource and environmental carrying capacity [27]. The Yellow River Basin has received particular attention because of its severe water-resource constraints, fragile ecological environment, and substantial regional heterogeneity. Existing studies have examined water-resource utilization, ecological protection, socioeconomic development, as well as the coupling coordination among these aspects in the basin [28]. Within the Inner Mongolia section, previous studies have primarily addressed issues related to water-resource management, ecological restoration, and the coordination between socioeconomic development and ecological protection, with some studies further evaluating the coupling relationships among these dimensions [29]. However, existing studies have mainly emphasized system evaluation and coordination assessment, while limited attention has been paid to identifying the specific obstacles to coordination and translating these obstacles into differentiated optimization strategies.
The limitations of previous research on the integrated management of water resources, socioeconomic systems, and ecological environments can be summarized from several perspectives: existing studies have primarily focused on assessing system development levels, coupling coordination relationships, and the identification of obstacle factors. However, limited attention has been paid to translating evaluation results into dynamic operation strategies. In particular, obstacle factors are rarely incorporated into operation optimization frameworks to explore effective adjustment pathways for enhancing coordination among water resources, socioeconomic systems, and ecological environments. Moreover, considering only the coordination state while neglecting obstacle identification and operation optimization may lead to inadequate policy support for regional sustainable development. Due to substantial regional differences in resource endowment, economic development, as well as ecological conditions, the effectiveness of coordinated operation across regions still requires further investigation.
Building on the identified gaps, we developed an optimization framework to evaluate and improve coordination within the integrated water–socioeconomic–ecological system across the Inner Mongolia portion of the Yellow River Basin over the period 2001–2025. This research establishes a comprehensive framework integrating system evaluation, coupling coordination analysis, obstacle factor identification, and operation optimization to reveal the mechanisms underlying coordination within the composite system.
The respective subsystems are interconnected through complex and bidirectional feedback mechanisms rather than operating independently. Water resources provide essential support for agricultural production, industrial activities, urban development, and ecological maintenance, thereby forming a fundamental resource basis for socioeconomic development. In turn, socioeconomic development increases water demand through industrial expansion, urbanization, and rising living standards, while inefficient resource use may intensify pressure on water resources. Socioeconomic activities also affect the ecological environment through resource consumption, land-use changes, and pollutant emissions, potentially generating environmental pressure. Meanwhile, a healthy ecological environment provides ecosystem services, improves environmental quality, and enhances resource carrying capacity, thereby supporting long-term socioeconomic development. Water resources and the ecological environment are likewise closely linked: adequate ecological water availability supports ecosystem functioning, while vegetation restoration, water conservation, and ecological regulation can improve water retention and contribute to water-resource sustainability. Consequently, changes in any one subsystem can propagate through the other two, generating cumulative effects and feedback loops. The coordinated development of the composite system therefore depends on balancing resource support, development demand, and ecological regulation rather than optimizing any single subsystem independently.
Several key contributions emerge from the methodological framework and empirical analysis presented in this study:
- (1)
- An integrated evaluation–diagnosis–regulation framework is developed to extend existing coordination assessment. Previous research concerning the integrated system of water resources, socioeconomic development, and ecological environment has mainly emphasized subsystem performance and coupling coordination, while subsequent efforts to translate evaluation results into practical regulation strategies remain relatively limited. This study integrates system evaluation, coupling coordination assessment, obstacle diagnosis, and operation optimization within a unified analytical framework, thereby broadening the research scope from describing the coordination status of the composite system toward identifying and addressing the constraints underlying coordination deficiencies.
- (2)
- A direct link between obstacle diagnosis and operation optimization is established. Existing applications of the Obstacle Degree Model have primarily been focused on identifying the factors restricting coordinated development, with limited attempts to further incorporate these factors into optimization processes. In this study, the dominant obstacle factors identified by the Obstacle Degree Model are further incorporated into the NSGA-II-based operation optimization framework. This provides a quantitative pathway for translating obstacle diagnosis into specific adjustment directions and thereby connects the identification of coordination constraints with subsequent regulation.
- (3)
- Regional heterogeneity and the effectiveness of differentiated regulation are quantitatively demonstrated. Across the Inner Mongolia portion of the Yellow River Basin, substantial spatial differences are observed in water-resource endowment, socioeconomic conditions, and ecological status. Rather than applying a uniform regulation strategy, this study identifies the dominant constraints of different regions and determines region-specific regulation pathways through multi-objective optimization. The resulting optimization outcomes quantitatively demonstrate the potential of differentiated regulation to enhance coordination within the composite system, providing more specific scientific guidance for regional water-resource management and long-term sustainability.
The proposed framework offers an integrated basis for assessing system performance, diagnosing key constraints, and formulating differentiated regulation strategies. Its application can also support more coordinated and sustainable management of the water–socioeconomic–ecological system in the Inner Mongolia portion of the Yellow River Basin. The remainder of this paper is structured as follows. Section 2 describes the methodological procedures, covering the evaluation indicators, coupling coordination analysis, obstacle diagnosis, and optimization scheme. Section 3 outlines the study area and data sources. Section 4 presents and discusses the empirical findings, while Section 5 summarizes the principal conclusions.
2. Methodology
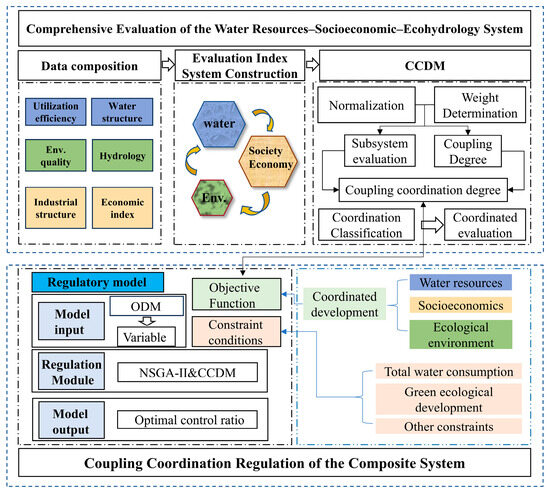
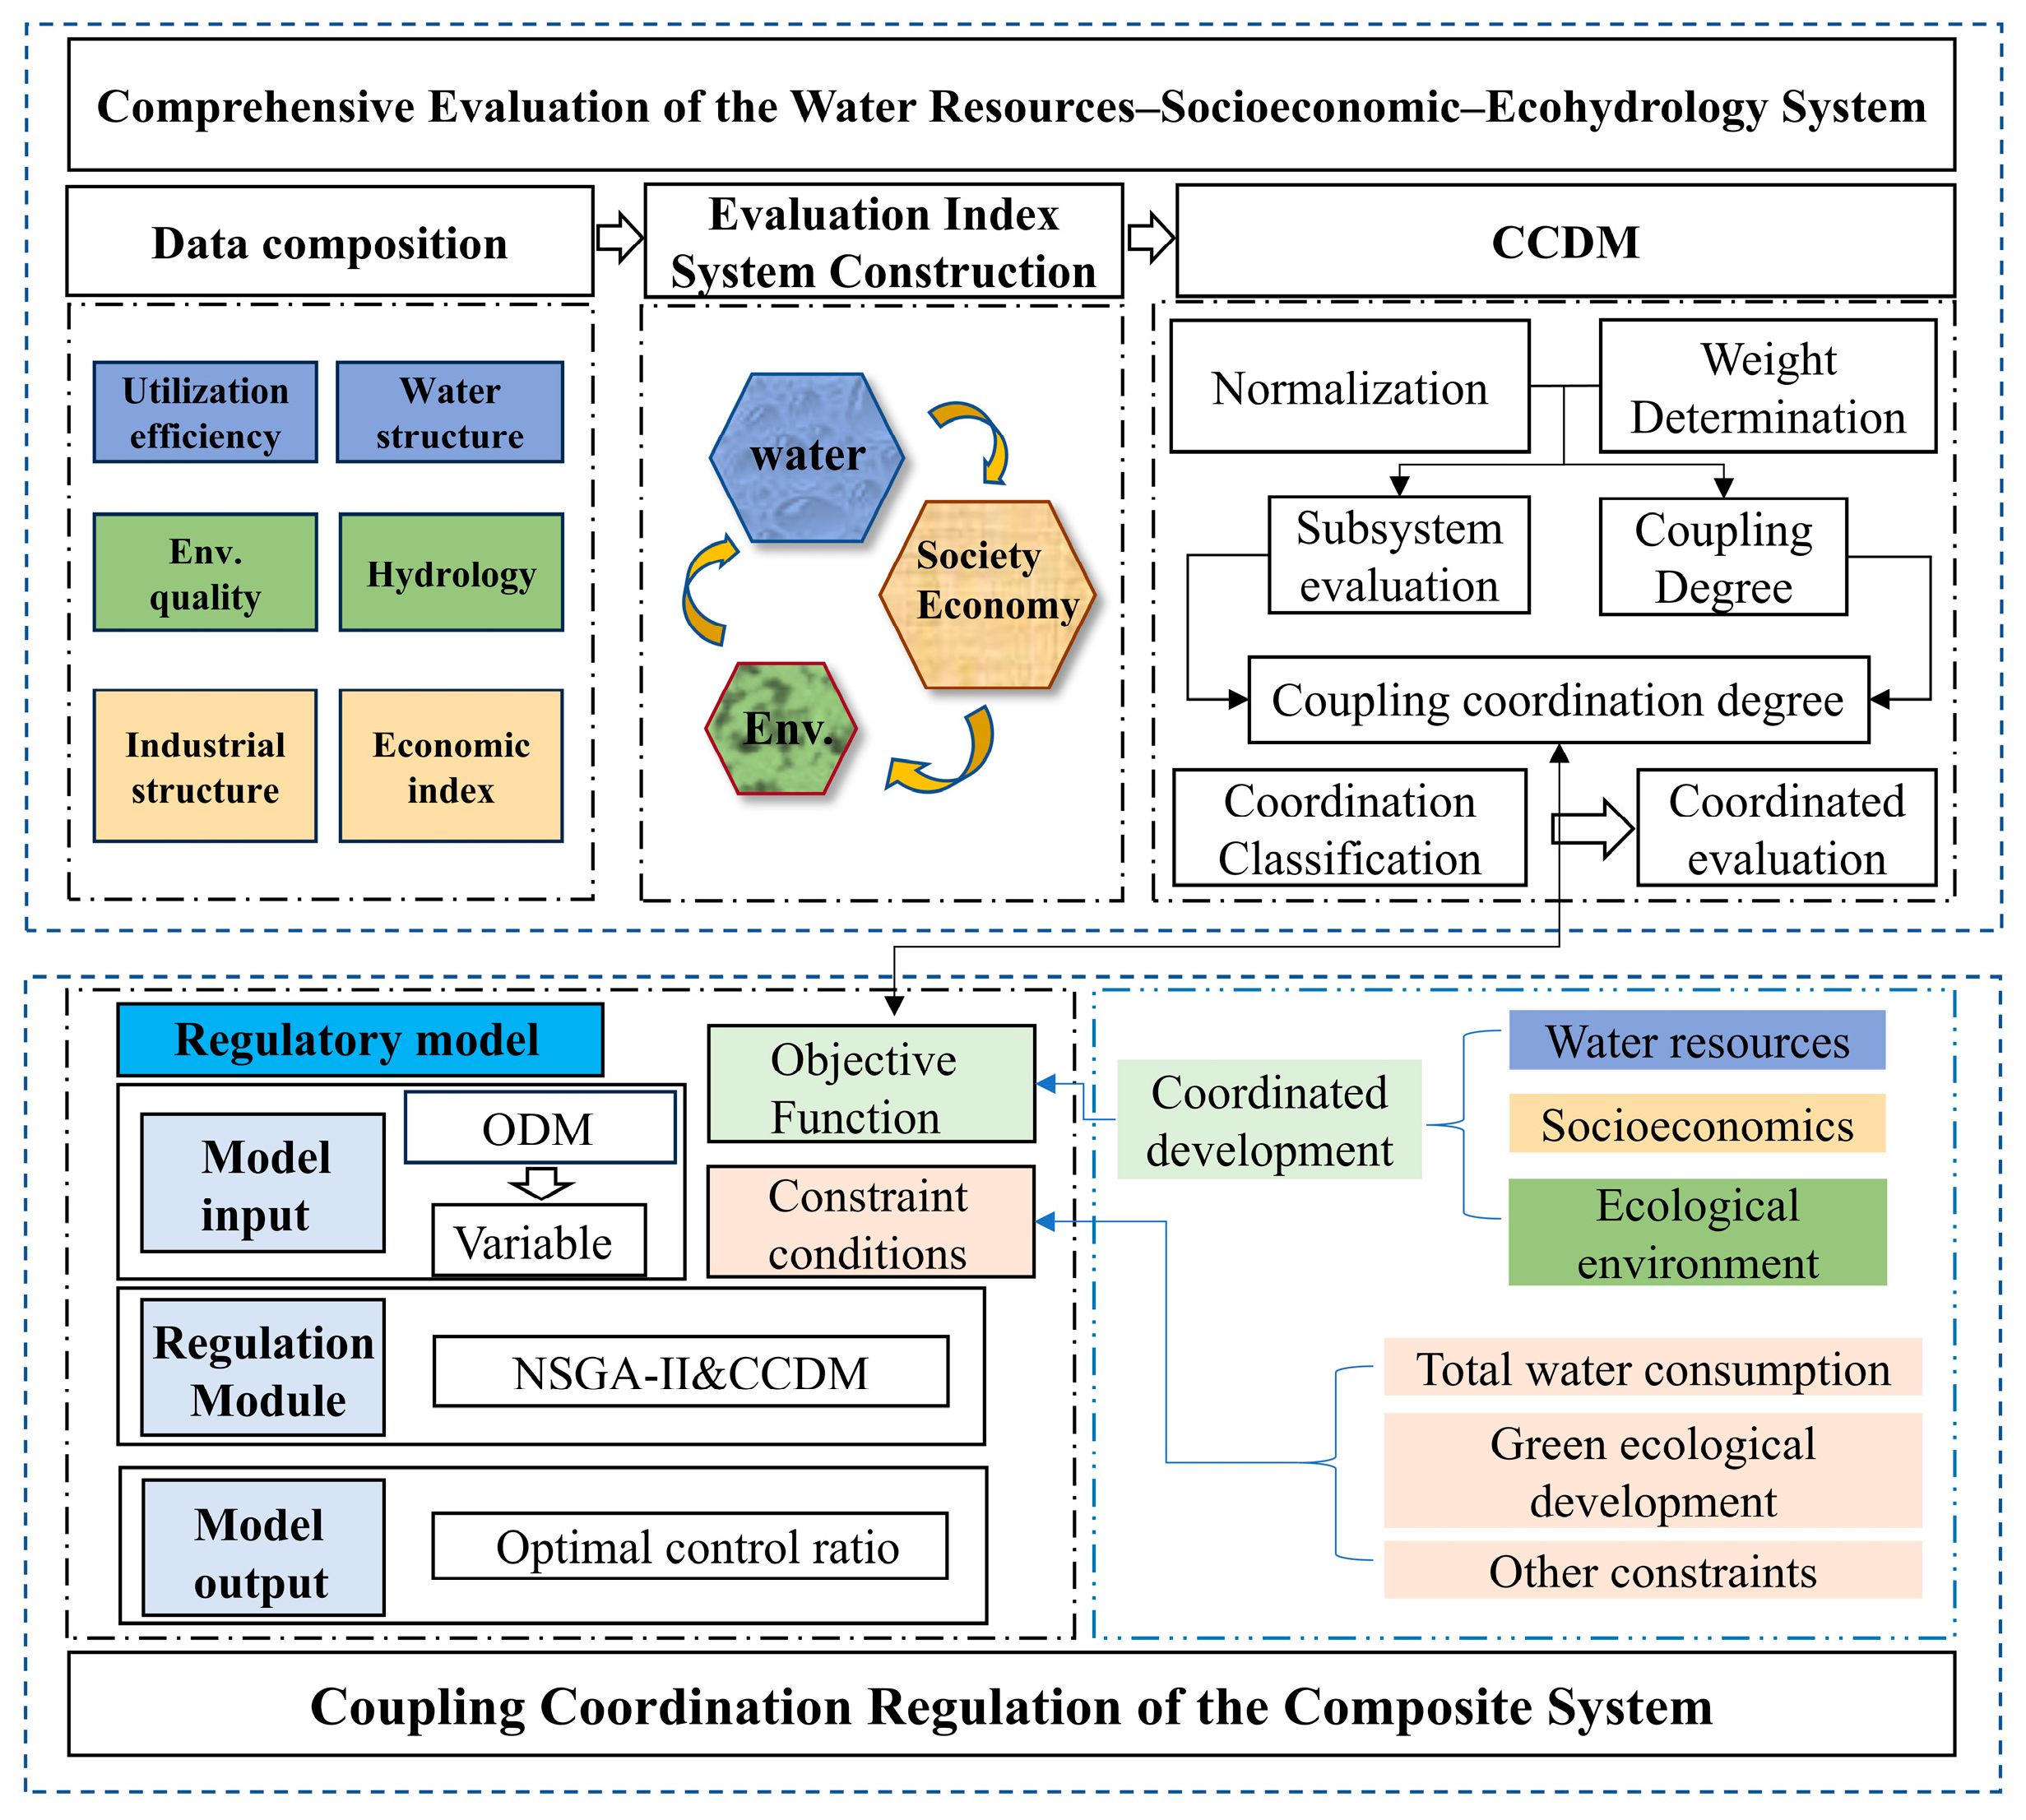
This study develops a multidimensional indicator framework to characterize the water–socioeconomic–ecological system (Figure 2). The CCDM is applied to quantify the performance of individual subsystems and assess the coordination status of the integrated system. Subsequently, the ODM is adopted to diagnose dominant barriers and determine adjustable variables with regulatory potential. Based on these analyses, an operation optimization framework is formulated, where the coupling coordination degree is set as the optimization target. By incorporating constraints related to water consumption, ecological sustainability, and other management requirements, the framework identifies suitable adjustment schemes for key variables and improves the coordination performance of the regional system.
Figure 2.
Technical route.
2.1. Construction of the Coupling Coordination Degree Model
2.1.1. Construction of the Evaluation Index System
Drawing on previous studies on indicator selection, this study developed a multidimensional framework to characterize the integrated water–socioeconomic–ecological system. Considering comprehensiveness, data availability, relevance, and scientific validity, the evaluation index system contains 23 indicators (Table 1). The framework comprises three dimensions, with 9 indicators describing water-related characteristics, 9 reflecting socioeconomic conditions, and 5 representing ecological performance [30,31,32,33,34].
Table 1.
Indicator framework for the WSE system in the Yellow River Basin of Inner Mongolia.
The water resources subsystem encompasses two main dimensions, namely the capacity and efficiency of regional water supply and utilization, while also reflecting key characteristics of the hydrological cycle [35]. The socioeconomic subsystem includes two dimensions—social water-use structure and patterns of economic development—which together capture the interactions between regional socioeconomic activities and water resources. Meanwhile, the ecological environment subsystem focuses on ecological protection and environmental pollution, providing an assessment of the health and sustainability of regional ecosystems [36]. The indicators were selected to capture the key characteristics and interactions within each subsystem. For the water-related subsystem, per capita water resources and water resources modulus represent regional water-resource endowment and carrying capacity, while the water yield coefficient, average annual rainfall, and average annual evaporation characterize hydrological conditions and water-resource availability. Total water consumption and the proportions of agricultural, industrial, and domestic water use reflect the intensity and structure of water-resource utilization. For the socioeconomic subsystem, urban and rural disposable income per capita, urbanization rate, and population density describe living standards, population distribution, and urban development, while the corresponding output from primary, secondary, and tertiary industries, respectively, is reflected in the industrial output modulus, and GDP per capita characterize economic structure, industrial development intensity, and overall economic performance. For the ecological environment subsystem, sewage treatment rate, ecological water-use proportion, and vegetation coverage rate reflect environmental management capacity and ecological support conditions, whereas industrial SO2 emissions and industrial wastewater discharge represent atmospheric and water pollution pressures. Together, these indicators provide a comprehensive representation of resource endowment, socioeconomic development, ecological conditions, and environmental pressures while maintaining the availability and comparability of long-term data across the seven league-level cities.
2.1.2. Indicator Weight Determination
The entropy weighting method was adopted because indicator weights are derived objectively from the information and variability embedded in the observed data, minimizing reliance on subjective judgment [37,38]. This approach is suitable for the present study, which involves multiple indicators across seven league-level cities over a 25-year period with substantial spatial and temporal heterogeneity. Compared with AHP, which relies on expert judgment and pairwise comparisons, entropy weighting provides a more objective weighting process. Although PCA is also data-driven, its emphasis on variance and correlation may reduce the interpretability of individual predefined indicators. Therefore, the entropy weighting method was introduced for retaining the complete indicator system while objectively reflecting the information provided by each indicator [39]. The specific calculation procedures are as follows:
- (1)
- An original data matrix comprising samples and evaluation indicators is constructed. After data normalization, a standardized decision matrix is obtained as follows:
- (2)
- Following normalization of the decision matrix, the entropy associated with each indicator is determined as follows:where is a constant defined as , which ensures that the entropy value is constrained within the range of [0, 1]. When , the term is defined as 0 to avoid numerical computation problems.
- (3)
- The weights assigned to individual indicators are determined according to their corresponding entropy values, as expressed below:where denotes the assigned weight of the -th indicator, and the sum of all indicator weights equals 1.
2.1.3. Coupling Coordination Degree Model
The CCDM provides a quantitative framework for assessing interactions and coordination performance among interconnected systems and subsystems [40]. It has been widely applied in integrated studies involving water resource management, socioeconomic development, and ecological environment protection [41,42]. This is particularly relevant when assessing the interrelationships among water resources, socioeconomic systems, and eco-hydrological systems. By applying CCDM, this study can effectively evaluate the interactions, interdependencies, and overall coordination among the three subsystems, while offering useful guidance for sustainable development [43,44]. The specific calculation procedure can be described in the following steps:
Calculation of Subsystem Evaluation Scores:
where and denote the integrated performance values of the three subsystems; , and indicate the corresponding indicator weights within each subsystem; , , and are the normalized dimensionless values of individual indicators; and , , and represent the numbers of indicators included in the respective subsystems.
The coupling degree characterizes the strength of linkages among multiple systems or subsystems and reflects the extent of their mutual dependence [45]. The value of ranges from 0 to 1. A higher value of indicates stronger interactions and greater interdependence among systems, whereas a lower value suggests weaker interactions and lower dependency. Based on the three subsystems considered in this study—water resources, socioeconomic development, and eco-hydrology—a ternary coupling degree model was constructed [46]. The calculation procedure can be described as follows:
The comprehensive evaluation index helps identify the interaction and coordination status among water resource management, socioeconomic development, and ecological environment protection within the system. The calculation procedure can be described by the following equation:
where represent the weighting coefficients of the respective subsystems, respectively. Since this study simultaneously investigates the three subsystems, they are assumed to be equally important; therefore, 1/3.
Although the coupling degree provides a quantitative measure of linkages among systems, it has limitations when assessing the quality, coordination, and contribution of inter-system relationships to overall development objectives. Therefore, a more comprehensive analysis requires incorporating the coupling coordination assessment [47,48].
Unlike the coupling degree, which primarily serves to reflect the interaction intensity among systems, the coupling coordination degree integrates both subsystem performance and interaction relationships to provide an overall measure of system coordination. Values of the coupling coordination degree fall within the 0–1 range. Higher values of (D) reflect stronger interactions accompanied by greater synergy and more balanced progress across the subsystems, whereas lower values indicate that interactions may persist despite limited coordination, potentially resulting from developmental lags or imbalances among individual subsystems. Ten grades are defined to characterize the degree of coordination, ranging from Extreme Disorder to Excellent Coordination, with the corresponding intervals and level divisions presented in Table 2. The calculation can be expressed using the following equation:
Table 2.
Criteria for Classifying Coordination Development Levels.
2.2. Screening of Regulatory Factors
Using the Obstacle Degree Model (ODM), the contribution of individual indicators to system limitations can be quantified within the assessment framework. The obstacle degree measures the extent to which indicator acts as a constraint on overall system coordination. The obstacle degree value is determined by combining the factor contribution with the deviation associated with each evaluation indicator [49,50]. Lower obstacle values suggest that the associated indicators impose fewer limitations on overall system coordination, whereas a larger obstacle degree suggests a stronger inhibiting effect.
where reflects the extent to which the obstacle factor limits system coordination, indicates the deviation level associated with the indicator, and represents the number of indicators included in the analysis.
For each indicator (), () quantifies its relative influence on the coordination performance of the integrated water–socioeconomic–ecological system, as reflected by the corresponding weight assigned to that indicator.
where denotes the weighting coefficient assigned to the -th subsystem within the integrated system, and represents the weighting coefficient corresponding to indicator in subsystem .
The indicator deviation degree quantifies the distance of indicator from its ideal state, calculated as the difference between its normalized value and the target value of 1.
where represents the standardized value of the -th indicator.
2.3. NSGA-II Model
Known as a population-based evolutionary optimization approach, the Non-dominated Sorting Genetic Algorithm II (NSGA-II) has been extensively applied to complex optimization problems [51,52,53]. The algorithm enhances optimization efficiency and solution quality by employing rapid ranking of non-dominated solutions, diversity maintenance based on crowding distance, and an elitist preservation strategy [52]. MATLAB 2022b was used to perform the optimization, with 300 individuals in the population and 100 generations specified as the maximum number of iterations. Six decision variables were optimized for each league-level city, with their adjustment ranges constrained to [−0.1, 0.1]. Binary tournament selection was used to select parent individuals. Crossover was applied to all selected parent pairs using a random arithmetic crossover coefficient uniformly distributed between −0.2 and 1.2. Mutation was performed on half of the population in each generation, with 10% of the decision variables randomly selected for Gaussian perturbation. Given the six decision variables, one variable was selected for mutation in each offspring, using a perturbation standard deviation of 0.02 while constraining the resulting values to the specified adjustment range.
NSGA-II provides an efficient search mechanism for exploring feasible solutions while preserving solution diversity during the optimization process, which enables decision-makers to balance trade-offs among multiple conflicting objectives. Strong global search capability and good convergence performance have contributed to the extensive application of NSGA-II in complex system optimization and operation studies [54].
- (1)
- Objective Function
The objective was to improve coordination within the integrated water–socioeconomic–ecological system of the Inner Mongolia section of the Yellow River Basin. For the study area, the optimization seeks to maximize the mean coordination score over the 25-year period, with the objective function formulated from the coupling assessment results:
where denotes the function for obtaining the corresponding coordination degree, and represents the operation interval of the decision variables, where = 1, 2, …, 6.
By maximizing the average coupling coordination degree D, the implementation of operational strategies can enhance the synergy among the water system, socioeconomic progress, and ecological protection, and ecological environment protection. This approach not only promotes economic development but also strengthens ecosystem conservation in the Yellow River Basin while enhancing water-use efficiency.
- (2)
- Constraints
- ①
- Total Water Consumption Constraint
To promote the rational allocation of water resources and achieve balance among multiple objectives, a total water consumption constraint is introduced. Specifically, the total water consumption is required to remain unchanged after operation.
- ②
- Green Ecological Development Constraint
To ensure the healthy and sustainable development of the regional ecological environment, the Ecological Quality Index () is introduced as a constraint for green ecological development. By calculating the , the ecological quality of a region can be intuitively evaluated. The calculation process is expressed as follows:
where represents the weight of the -th indicator, and denotes the dimensionless standardized value of the -th indicator.
In this study, the multi-year average value of the EQI is defined as the Ecological Red Line (). To ensure ecological sustainability, the Ecological Red Line after operation () is required to be no lower than that before operation ().
where represents the ecological red line after operation, and denotes the ecological red line before operation.
- ③
- Other Constraints
To ensure the physical meaning and feasibility of the solutions, a sewage treatment rate constraint and a non-negativity constraint are incorporated into the model.
where denotes the sewage treatment rate, and represents the decision variables, where = 1, 2, …, 6.
3. Study Area and Data
3.1. Study Area
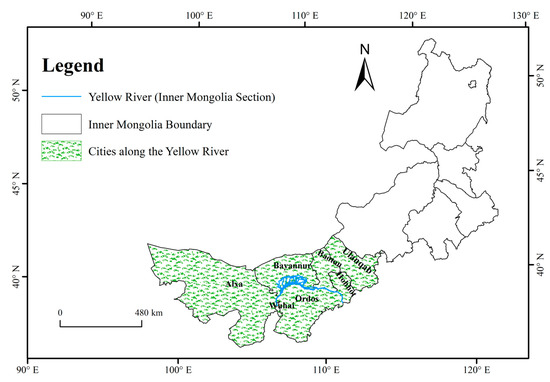
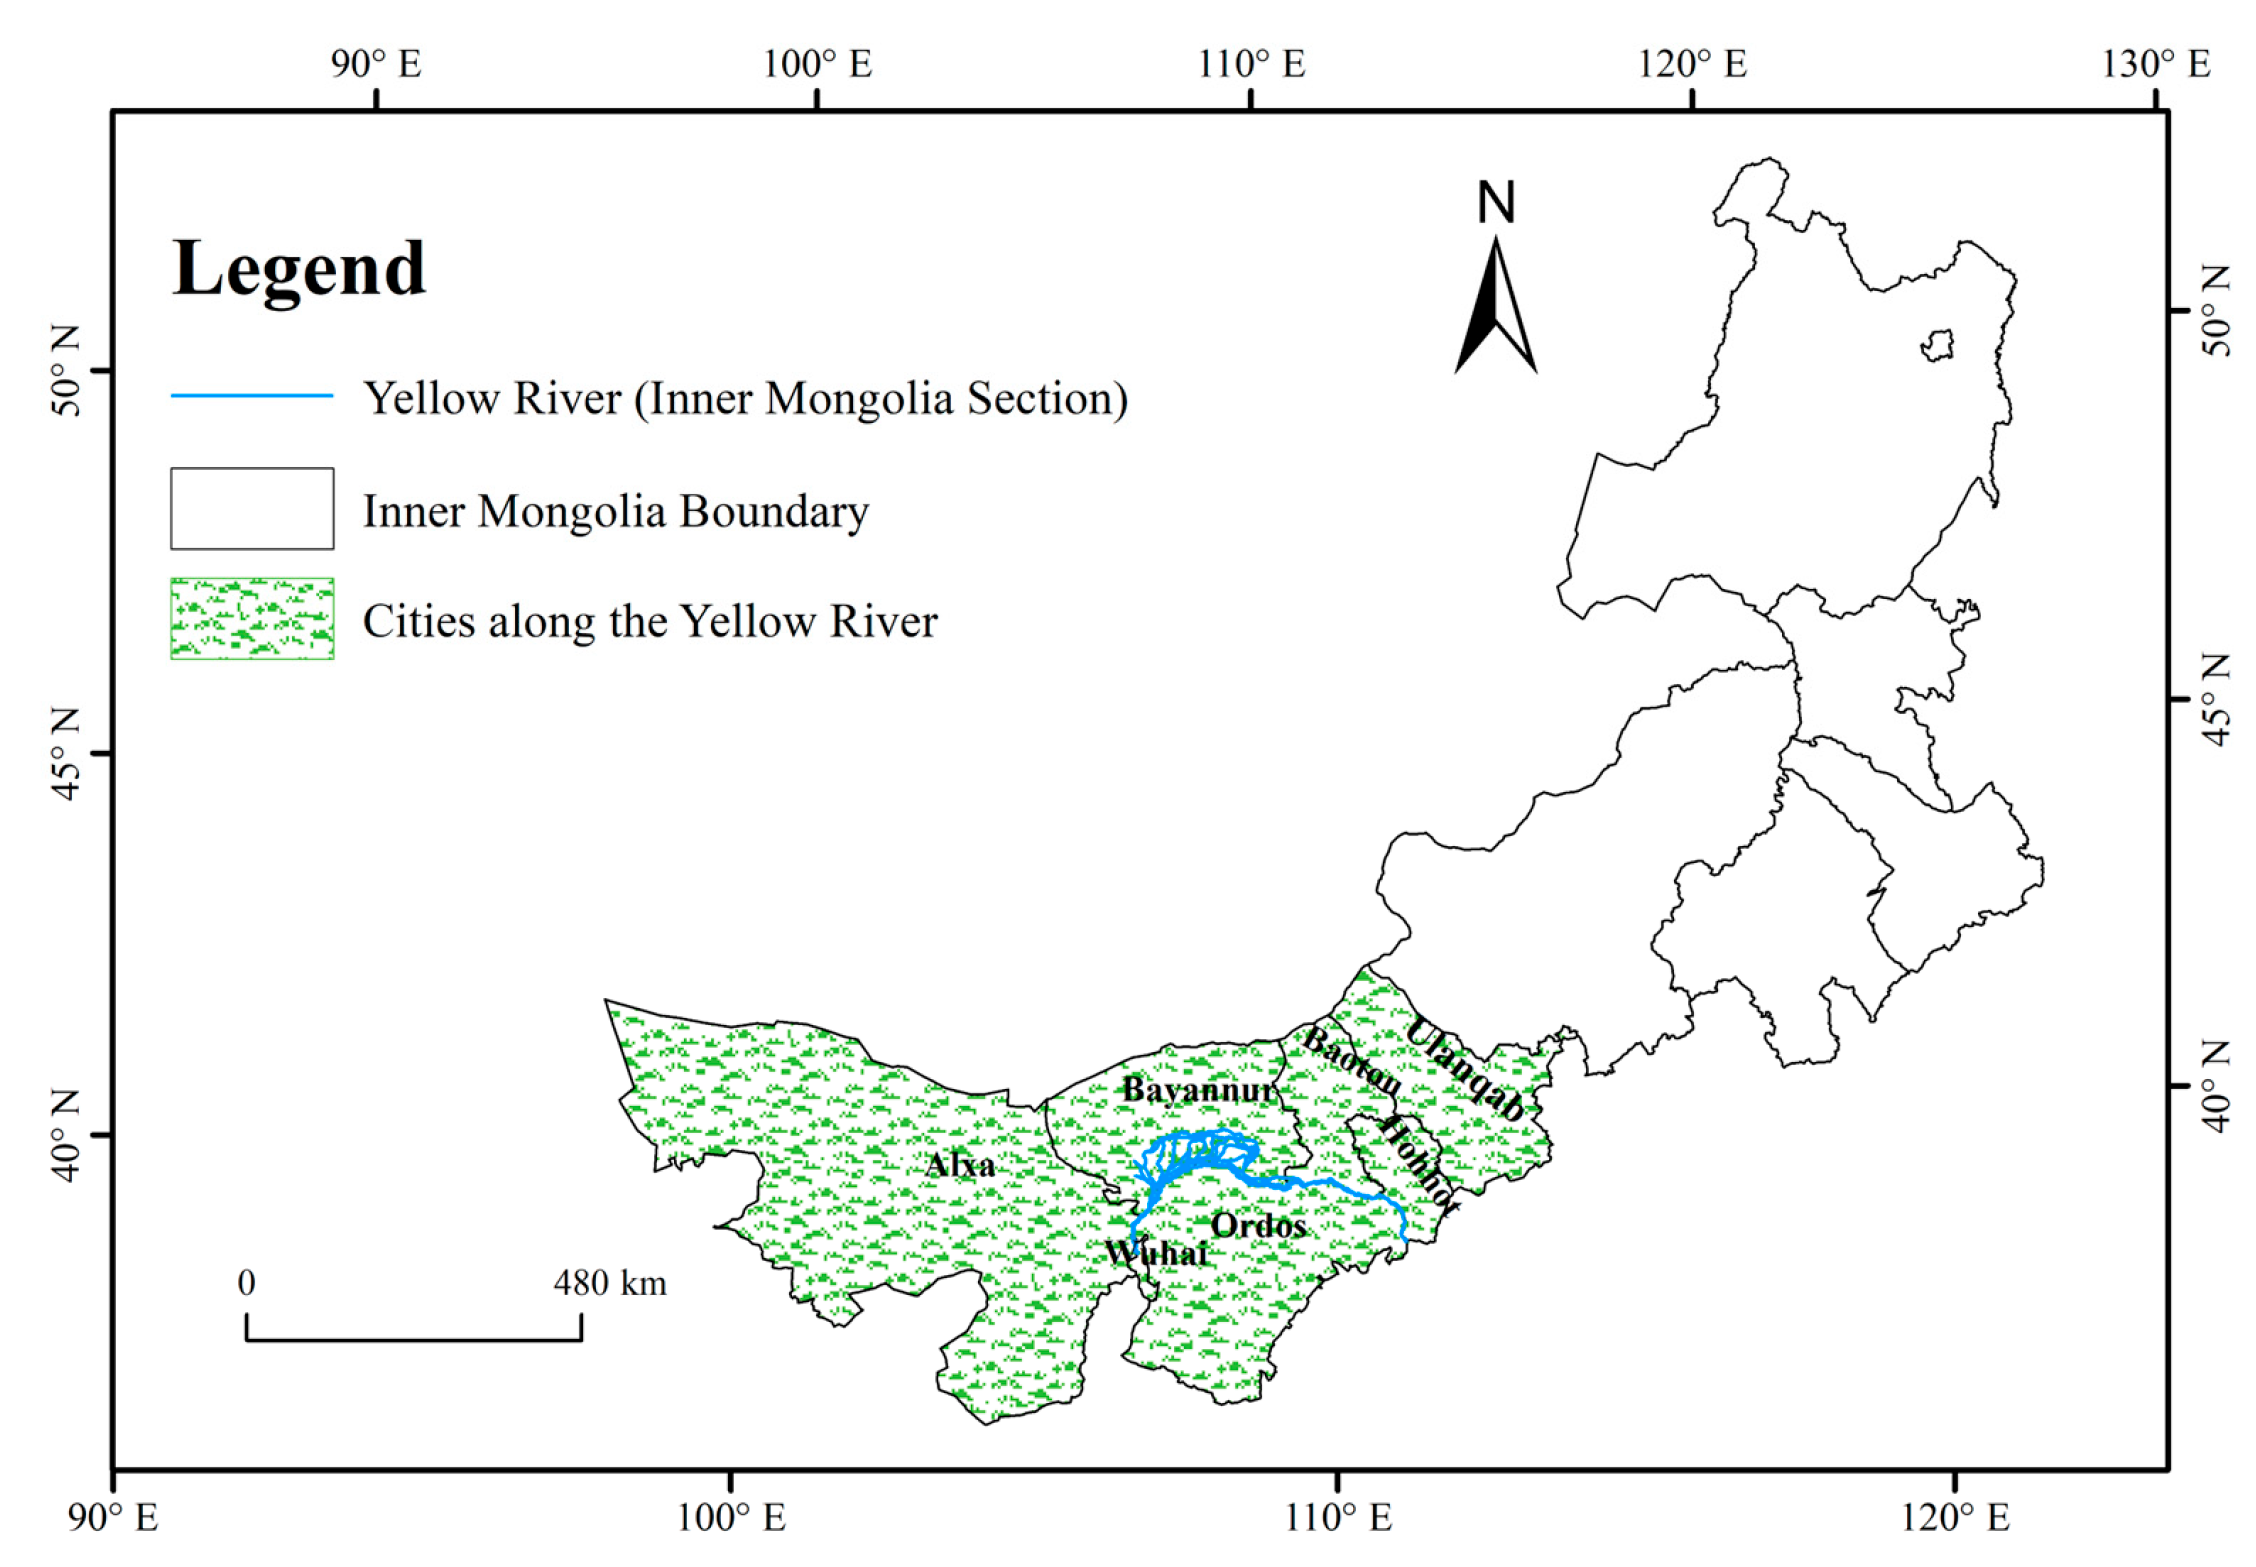
The Inner Mongolia section of the Yellow River Basin is located in the upper part of the “Ji-shaped Bend” of the Yellow River and includes seven league-level cities: Hohhot, Baotou, Wuhai, Ordos, Bayannur, Ulanqab, and Alxa League. The study area is geographically located between 97°13′ E–114°48′ E and 37°36′ N–43°21′ N (Figure 3). Most areas are arid or semi-arid, making water scarcity a major constraint on agricultural production, industrial development, and ecological restoration. Meanwhile, the region is an important agricultural and energy base in northern China, where intensive irrigation, energy- and resource-intensive industries, and urban development generate substantial water demand. The coexistence of water scarcity, socioeconomic development, and ecological protection creates strong interactions among the three subsystems examined in this study. In addition, the seven cities differ considerably in water-resource endowment, industrial structure, agricultural development, and ecological conditions, providing a representative setting for examining spatially differentiated coordination and regulation strategies. Therefore, the Inner Mongolia section represents a typical water-constrained and ecologically sensitive region where water resources, socioeconomic development, and ecological protection must be coordinated.
Figure 3.
Overview Map of the Study Area.
3.2. Data Description
The data used in this study were collected at the league-level city scale and encompass four categories: social, economic, hydrological, and ecological data. The data sources include the Inner Mongolia Water Resources Bulletin, the Inner Mongolia Environmental Status Bulletin, and statistical yearbooks of individual league-level cities from 2001 to 2025. Vegetation coverage data were derived using the Google Earth Engine platform based on NDVI data from the MOD13Q1 product of the MODIS dataset. The vegetation coverage rate was calculated through clipping and analysis using administrative boundary vector maps of each league-level city.
4. Results and Discussion
4.1. Assessment of Subsystem Development Status
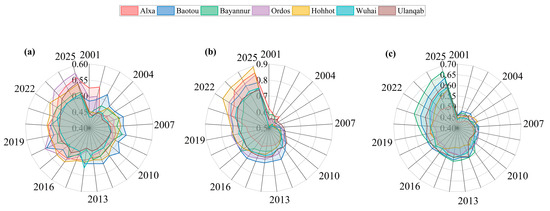
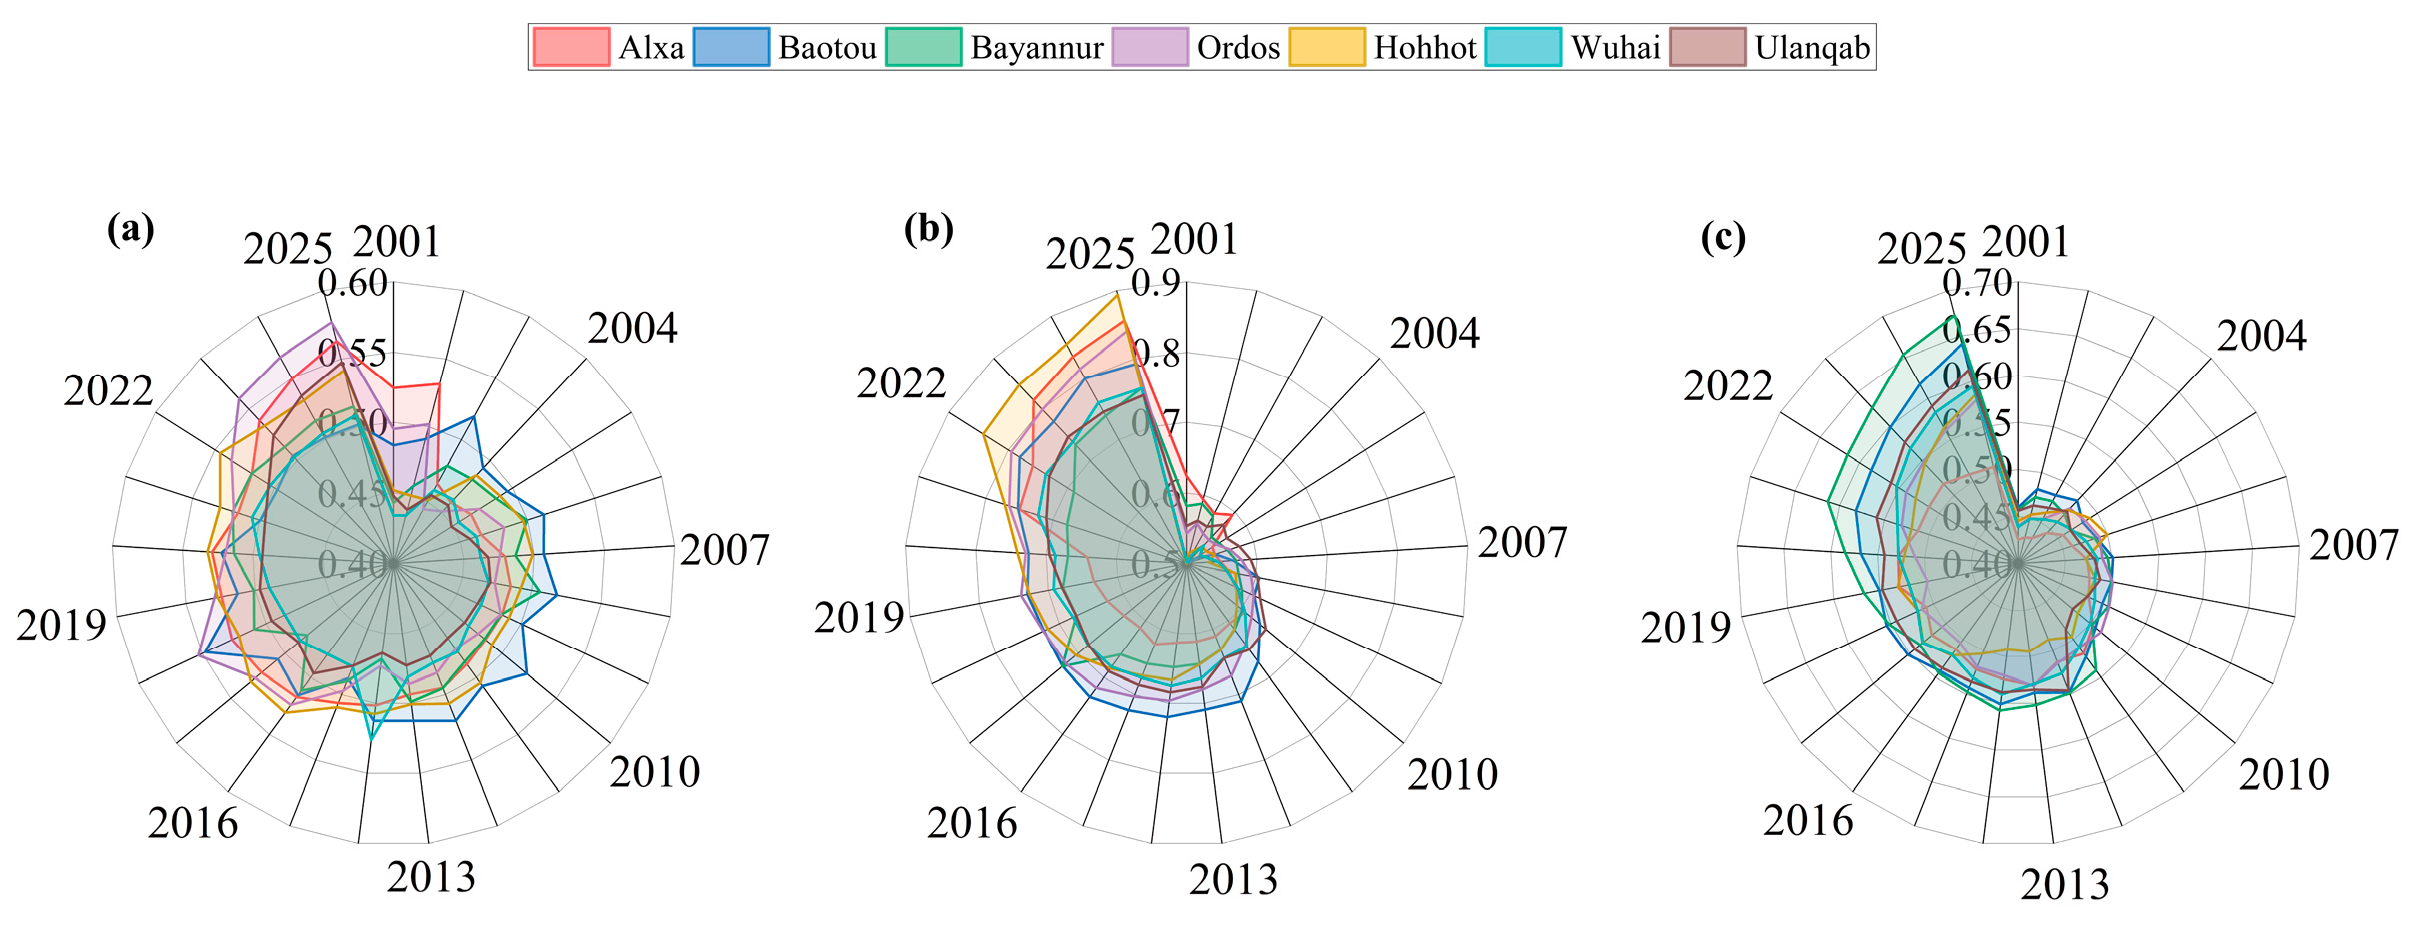
Overall performance across the water, socioeconomic, and ecological dimensions increased steadily in the seven league-level cities from 2001 to 2025, although development rates and spatial patterns differed considerably across locations (Figure 4). Among the three subsystems, socioeconomic development remained the most advanced, while ecological performance ranked second and the water resources dimension showed a comparatively slower pace of improvement. This difference may be attributed to the stronger growth momentum of socioeconomic development, while water resources remain constrained by natural resource endowment and ecological carrying capacity.
Figure 4.
Annual Variation in System Evaluation Indices Across League-Level Cities: (a) Water resources subsystem. (b) Social and economic subsystem. (c) Ecological environment subsystem. The outer edge of the circle represents the years.
The socioeconomic subsystem showed the greatest enhancement, with its composite scores rising from 0.47 to 0.62 in 2001 to 0.75–0.89 in 2025. Hohhot recorded the largest increase, rising from 0.49 to 0.89, which is likely related to its advantages in industrial agglomeration, infrastructure development, and population attraction. The concentration of economic activities and public services may have further promoted urbanization and economic productivity. Ordos and Baotou also maintained relatively high growth levels, reflecting the positive role of industrial upgrading and resource-based economic transformation.
The water resources subsystem improved comparatively slowly, with comprehensive evaluation indices generally ranging from 0.43 to 0.58. Ordos achieved a relatively larger increase, possibly benefiting from improvements in water-use efficiency and adjustments in water-use structure, whereas Wuhai exhibited limited improvement, indicating that intensive industrial water demand and regional water resource constraints continue to influence development. The ecological subsystem also experienced sustained improvement, with more pronounced growth observed in Bayannur and Baotou, where indices reached 0.67 and 0.64, respectively, by 2025. This improvement may be associated with strengthened ecological governance, pollution control, and ecological water use. However, ecological support capacity in some regions remains insufficient to fully offset the environmental pressure associated with rapid socioeconomic growth.
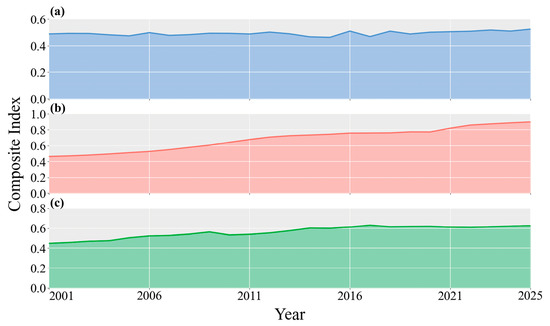
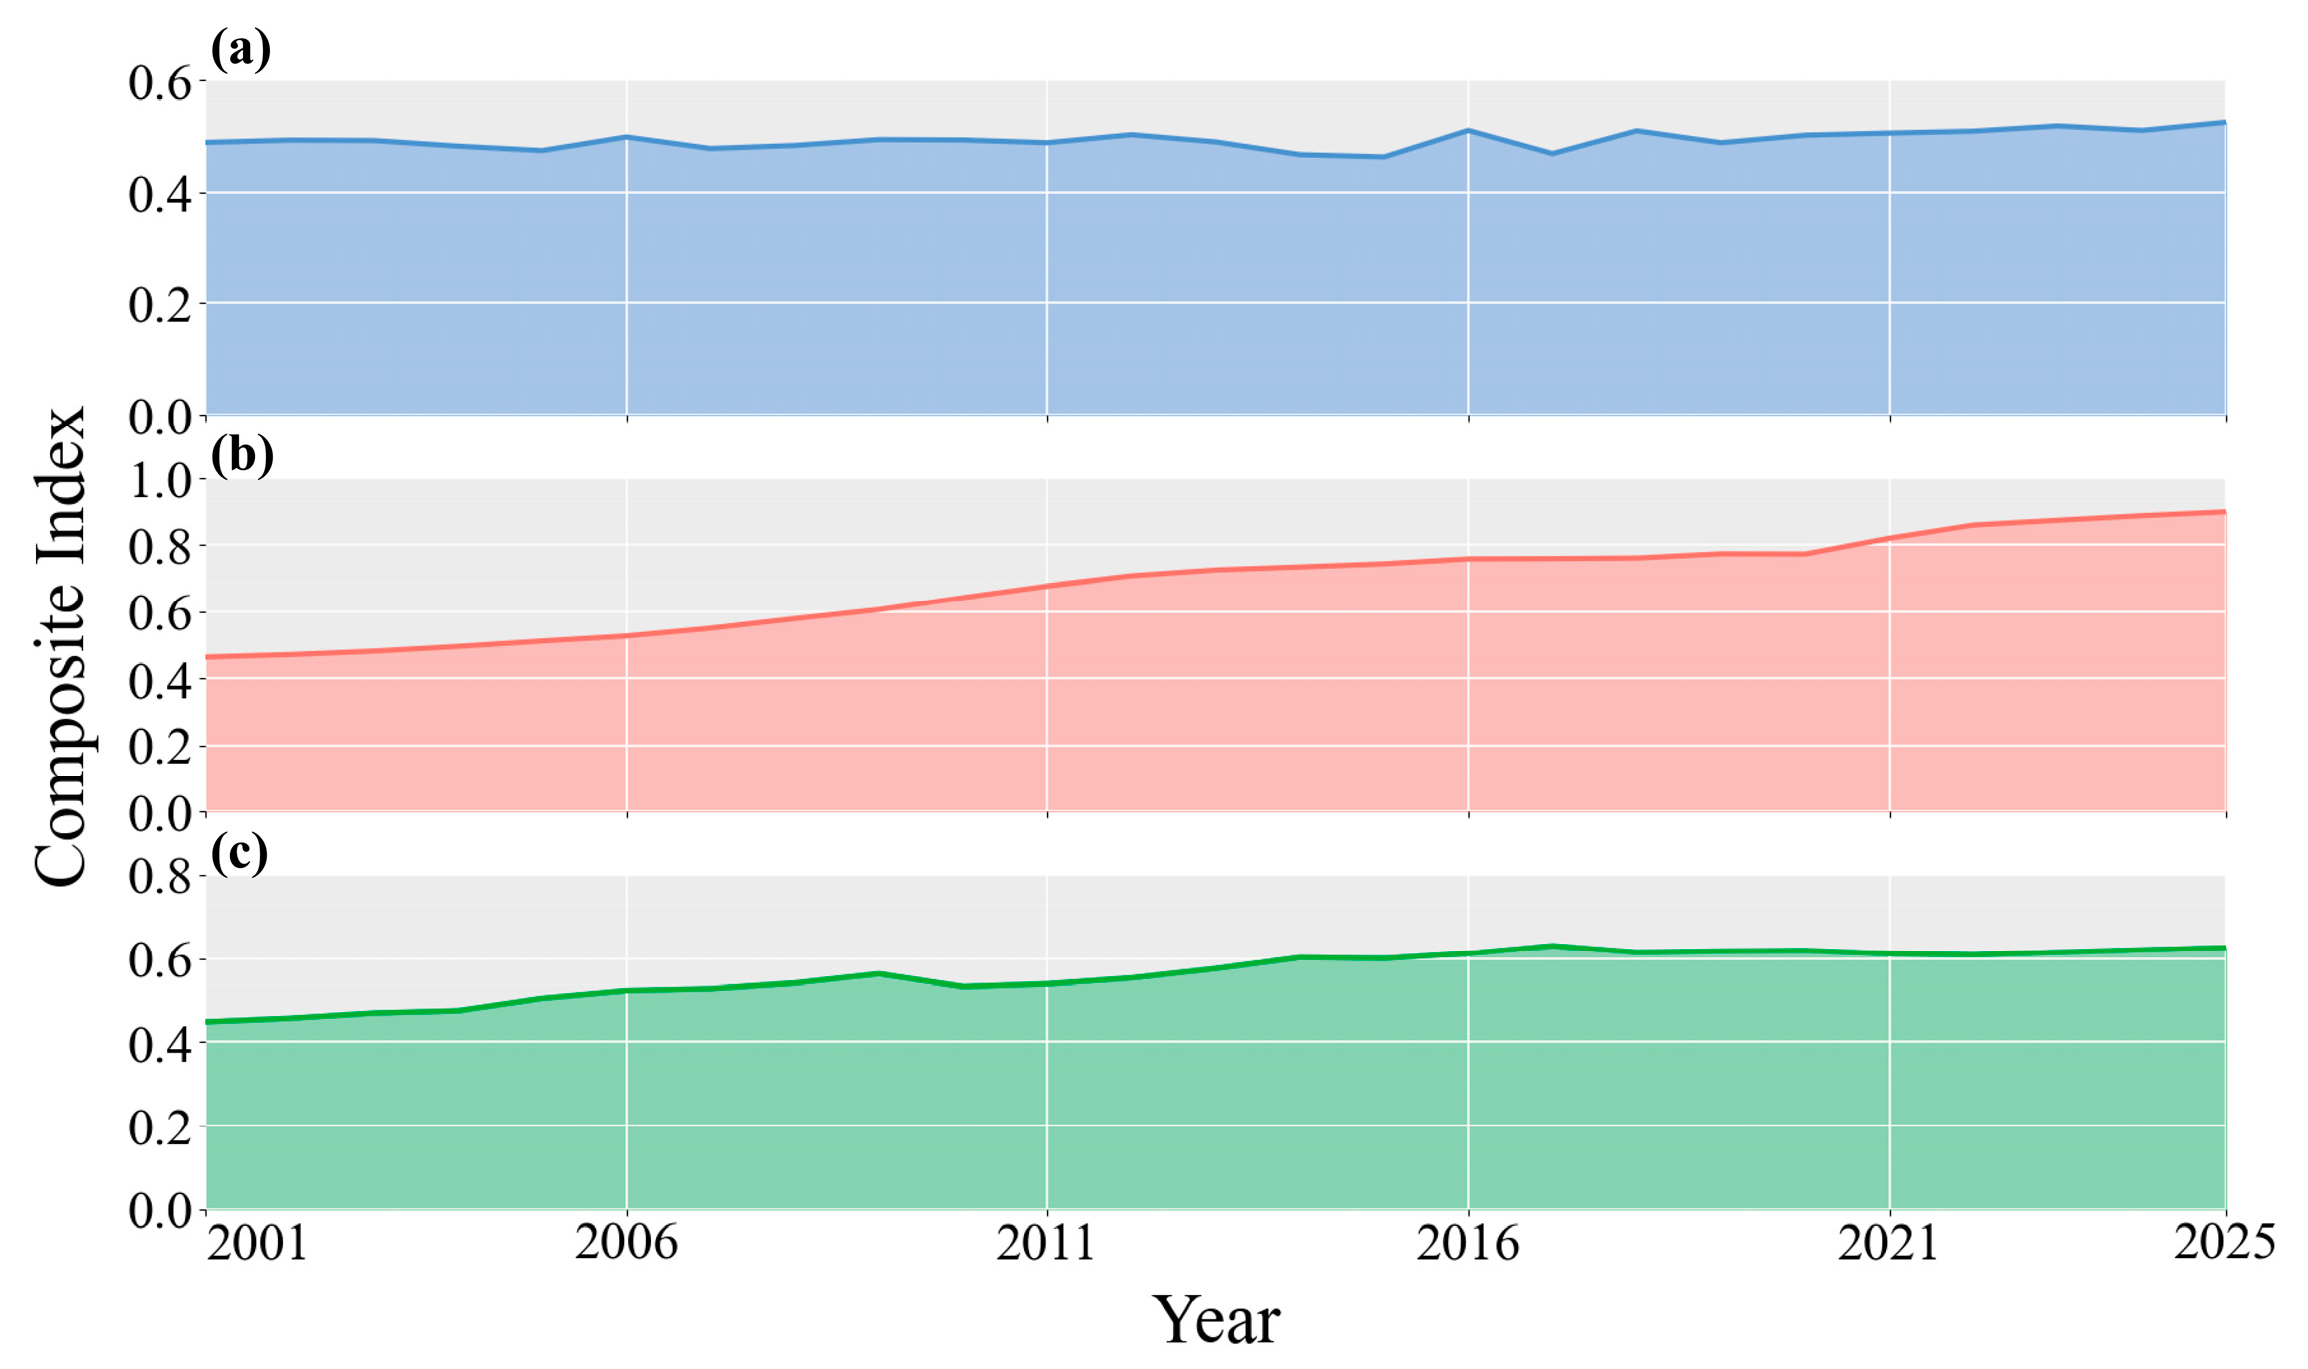
The temporal evolution of the three subsystem scores in the Inner Mongolia section of the Yellow River Basin revealed an overall increasing trend during 2001–2025, although differences in development rates are evident (Figure 5). The socioeconomic subsystem exhibited the largest improvement in both growth rate and overall level, with its composite score rising from 0.46 in 2001 to 0.90 in 2025, suggesting that socioeconomic advancement has played a dominant role in shaping regional development. This rapid improvement may be attributed to sustained economic growth, urbanization, and industrial development, which enhanced regional economic capacity and living conditions. The ecological environment subsystem increased steadily from 0.45 to 0.63, reflecting gradual improvements in ecological governance and environmental protection. The upward trend may also be related to increased investment in environmental management and the gradual implementation of ecological restoration measures. By contrast, the water resources subsystem fluctuated within a relatively narrow range and increased only slightly from 0.49 to 0.53. Although some improvement was observed, the relatively slow growth of this subsystem suggests that water resource endowment and utilization efficiency continue to constrain coordinated regional development. The limited improvement may be associated with the inherent constraints of regional water availability and the persistent water demand generated by agricultural, industrial, and domestic activities.
Figure 5.
Annual Variation in Overall Regional Subsystem Evaluation Indices: (a) Water resources subsystem. (b) Social and economic subsystem. (c) Ecological environment subsystem.
4.2. Analysis of Changes in Coupling Coordination Degree
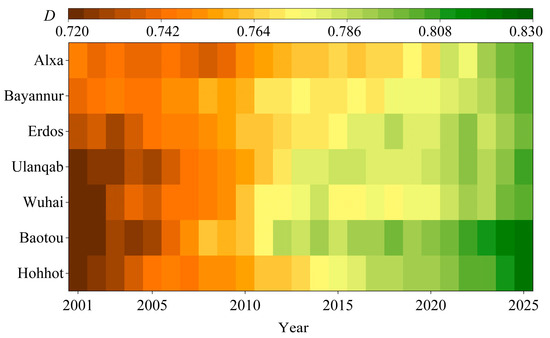
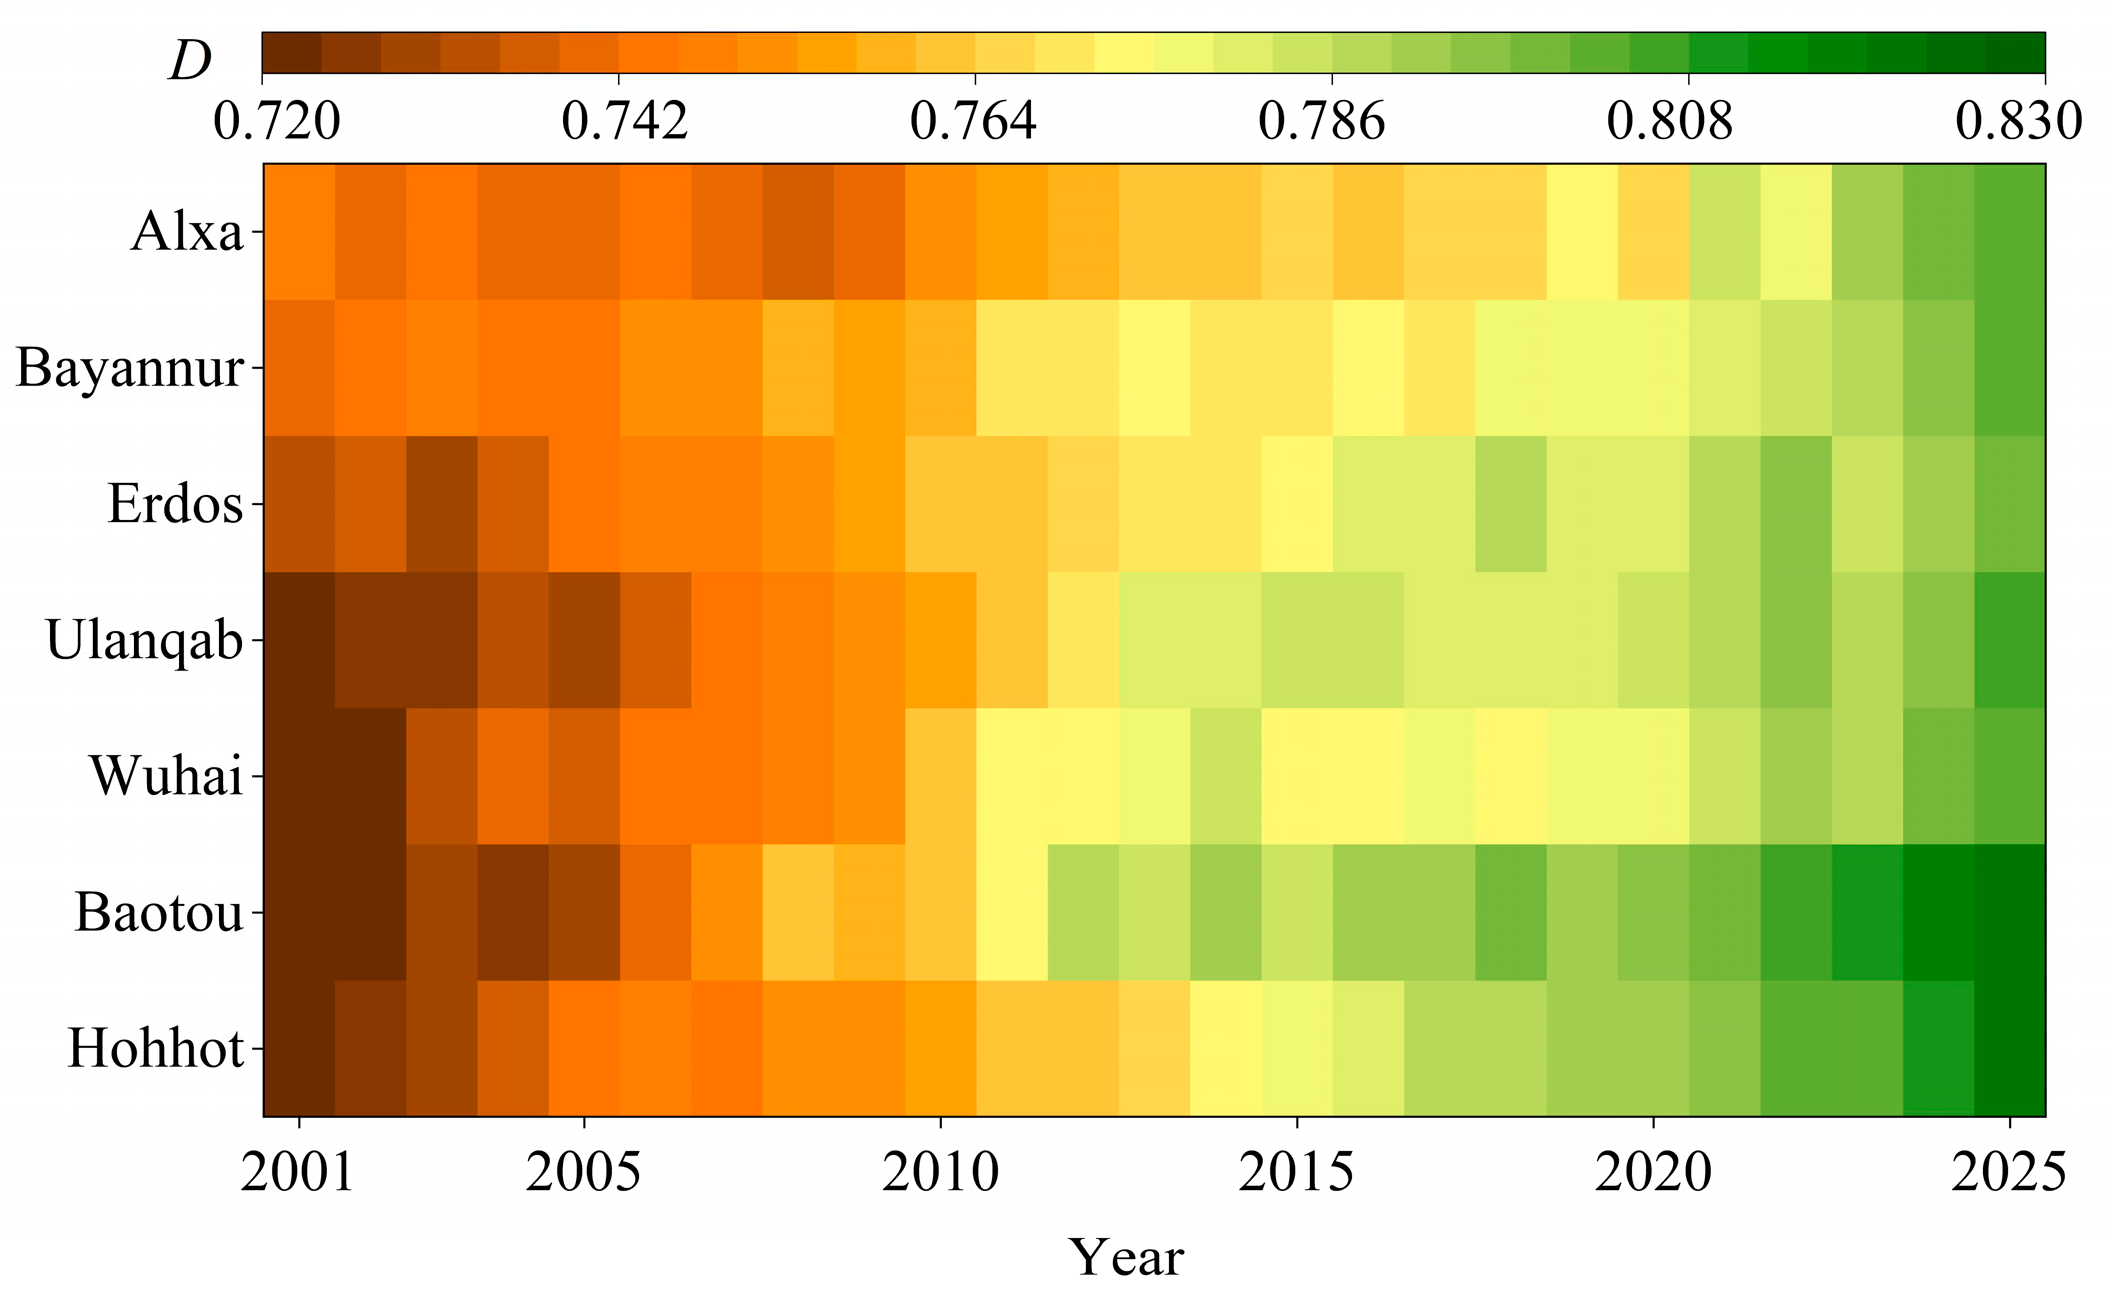
During 2001–2025, the seven league-level cities exhibited CCD values ranging between 0.72 and 0.83 for the integrated coupled water–socioeconomic–ecological system, with development rates varying considerably among cities (Figure 6). The overall coordination level exhibited a clear upward trend, gradually progressing from the primary coordination stage to the moderate coordination stage and eventually reaching the significant coordination stage. This improvement may be attributed to the simultaneous enhancement of socioeconomic development, water-resource management, and ecological protection, which gradually reduced the imbalance among the three subsystems. These findings indicate that the synergy between resource management, socioeconomic progress, and ecological protection has strengthened continuously, which may also be linked to recent efforts to advance ecological conservation and high-quality development across the Yellow River Basin. Nevertheless, the coordination level remains below the stage of high coordination. This may be because socioeconomic growth continues to generate water demand and environmental pressure, while uneven water-resource distribution and differences in regional capacity limit the simultaneous improvement of all three subsystems. Therefore, further improvements in water-use efficiency, resource allocation, and ecological protection are still required to promote more balanced and coordinated system development.
Figure 6.
Annual Variation in Coupling Coordination Degree of League-Level Cities. denotes the degree of coupling coordination.
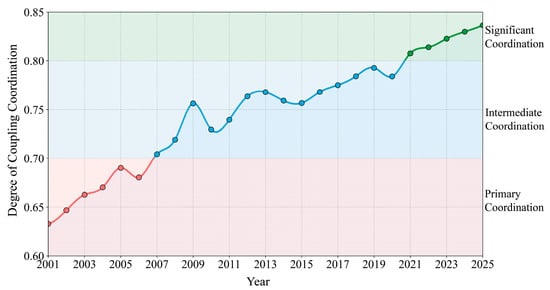
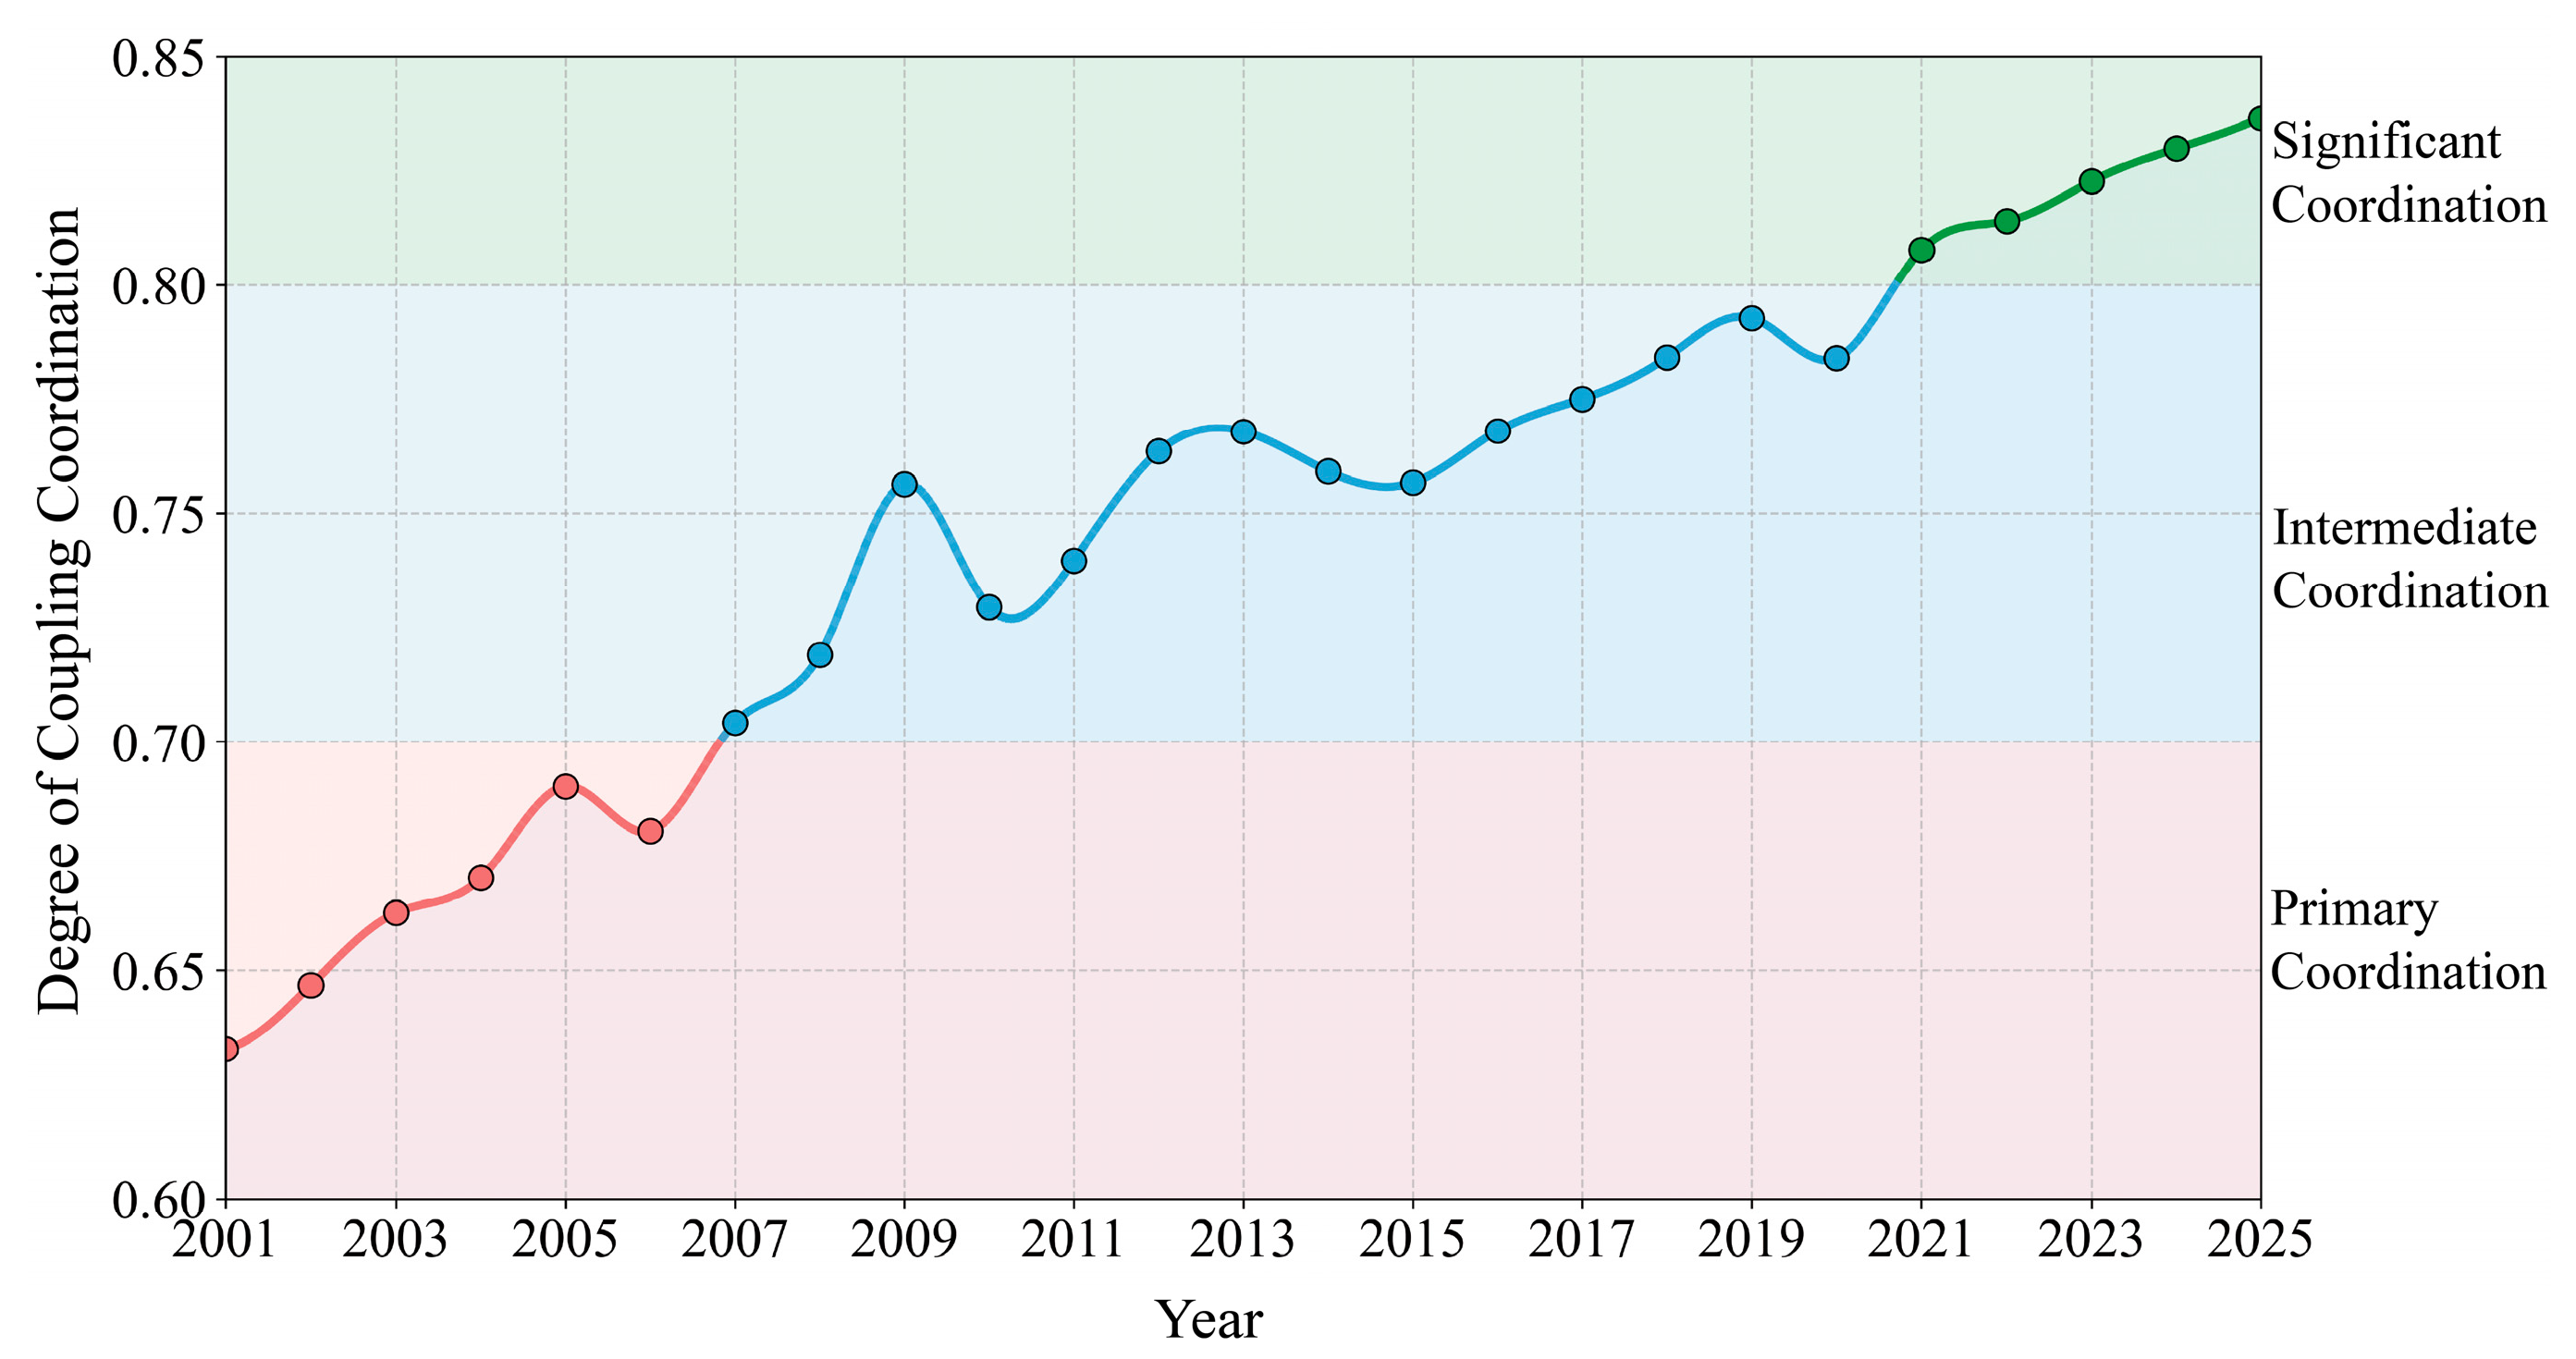
From 2001 to 2025, the Inner Mongolia portion of the Yellow River Basin experienced a general improvement in coordination among its water, socioeconomic, and ecological dimensions, despite minor interannual fluctuations (Figure 7). An increase in the coupling coordination degree was observed, rising from 0.63 in 2001 to 0.84 in 2025, indicating continuous improvement in coordinated regional development. The coordination stage gradually evolved from Primary Coordination to Intermediate Coordination and eventually reached Significant Coordination, reflecting strengthened synergy among water resource utilization, socioeconomic development, and ecological environment protection. The simultaneous improvement of socioeconomic development, water-resource management, and ecological protection gradually reduced the disparities among the three subsystems, thereby strengthening their overall coordination.
Figure 7.
Annual Variation in Overall Regional Coupling Coordination.
The temporal variation exhibited clear stage characteristics. The coupling coordination degree increased steadily, despite slight fluctuations, during 2001–2008, suggesting that coordinated development remained constrained by resource and environmental pressures under rapid socioeconomic growth. Rapid economic expansion increased water demand and environmental pressure, while water-resource management and ecological protection were still developing, limiting the pace of coordination improvement. The coordination degree fluctuated at a relatively high level between 2009 and 2015, indicating a transitional stage of coordinated development. During this period, differences in the improvement rates of economic development, water-resource utilization, and ecological conditions likely contributed to the observed fluctuations. A stable upward trend emerged after 2016, and the coordination degree exceeded 0.80 after 2020, suggesting that improvements in water-resource management, ecological governance, and the quality of regional development gradually strengthened the interactions among the three subsystems. Nevertheless, the system has not yet reached a highly coordinated state, as rapid socioeconomic development continues to exert pressure on water-resource supply and ecological carrying capacity, leaving room for further improvement in coordinated development.
4.3. Selection of Decision Variables
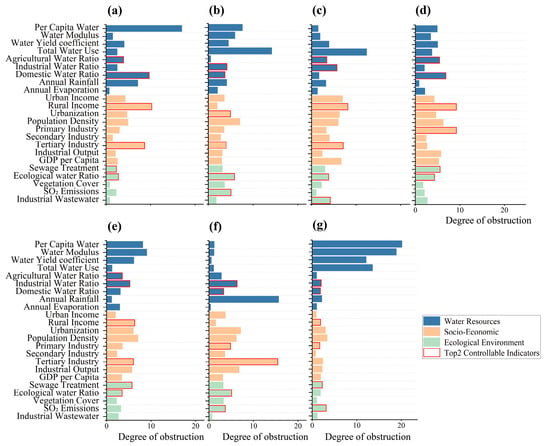
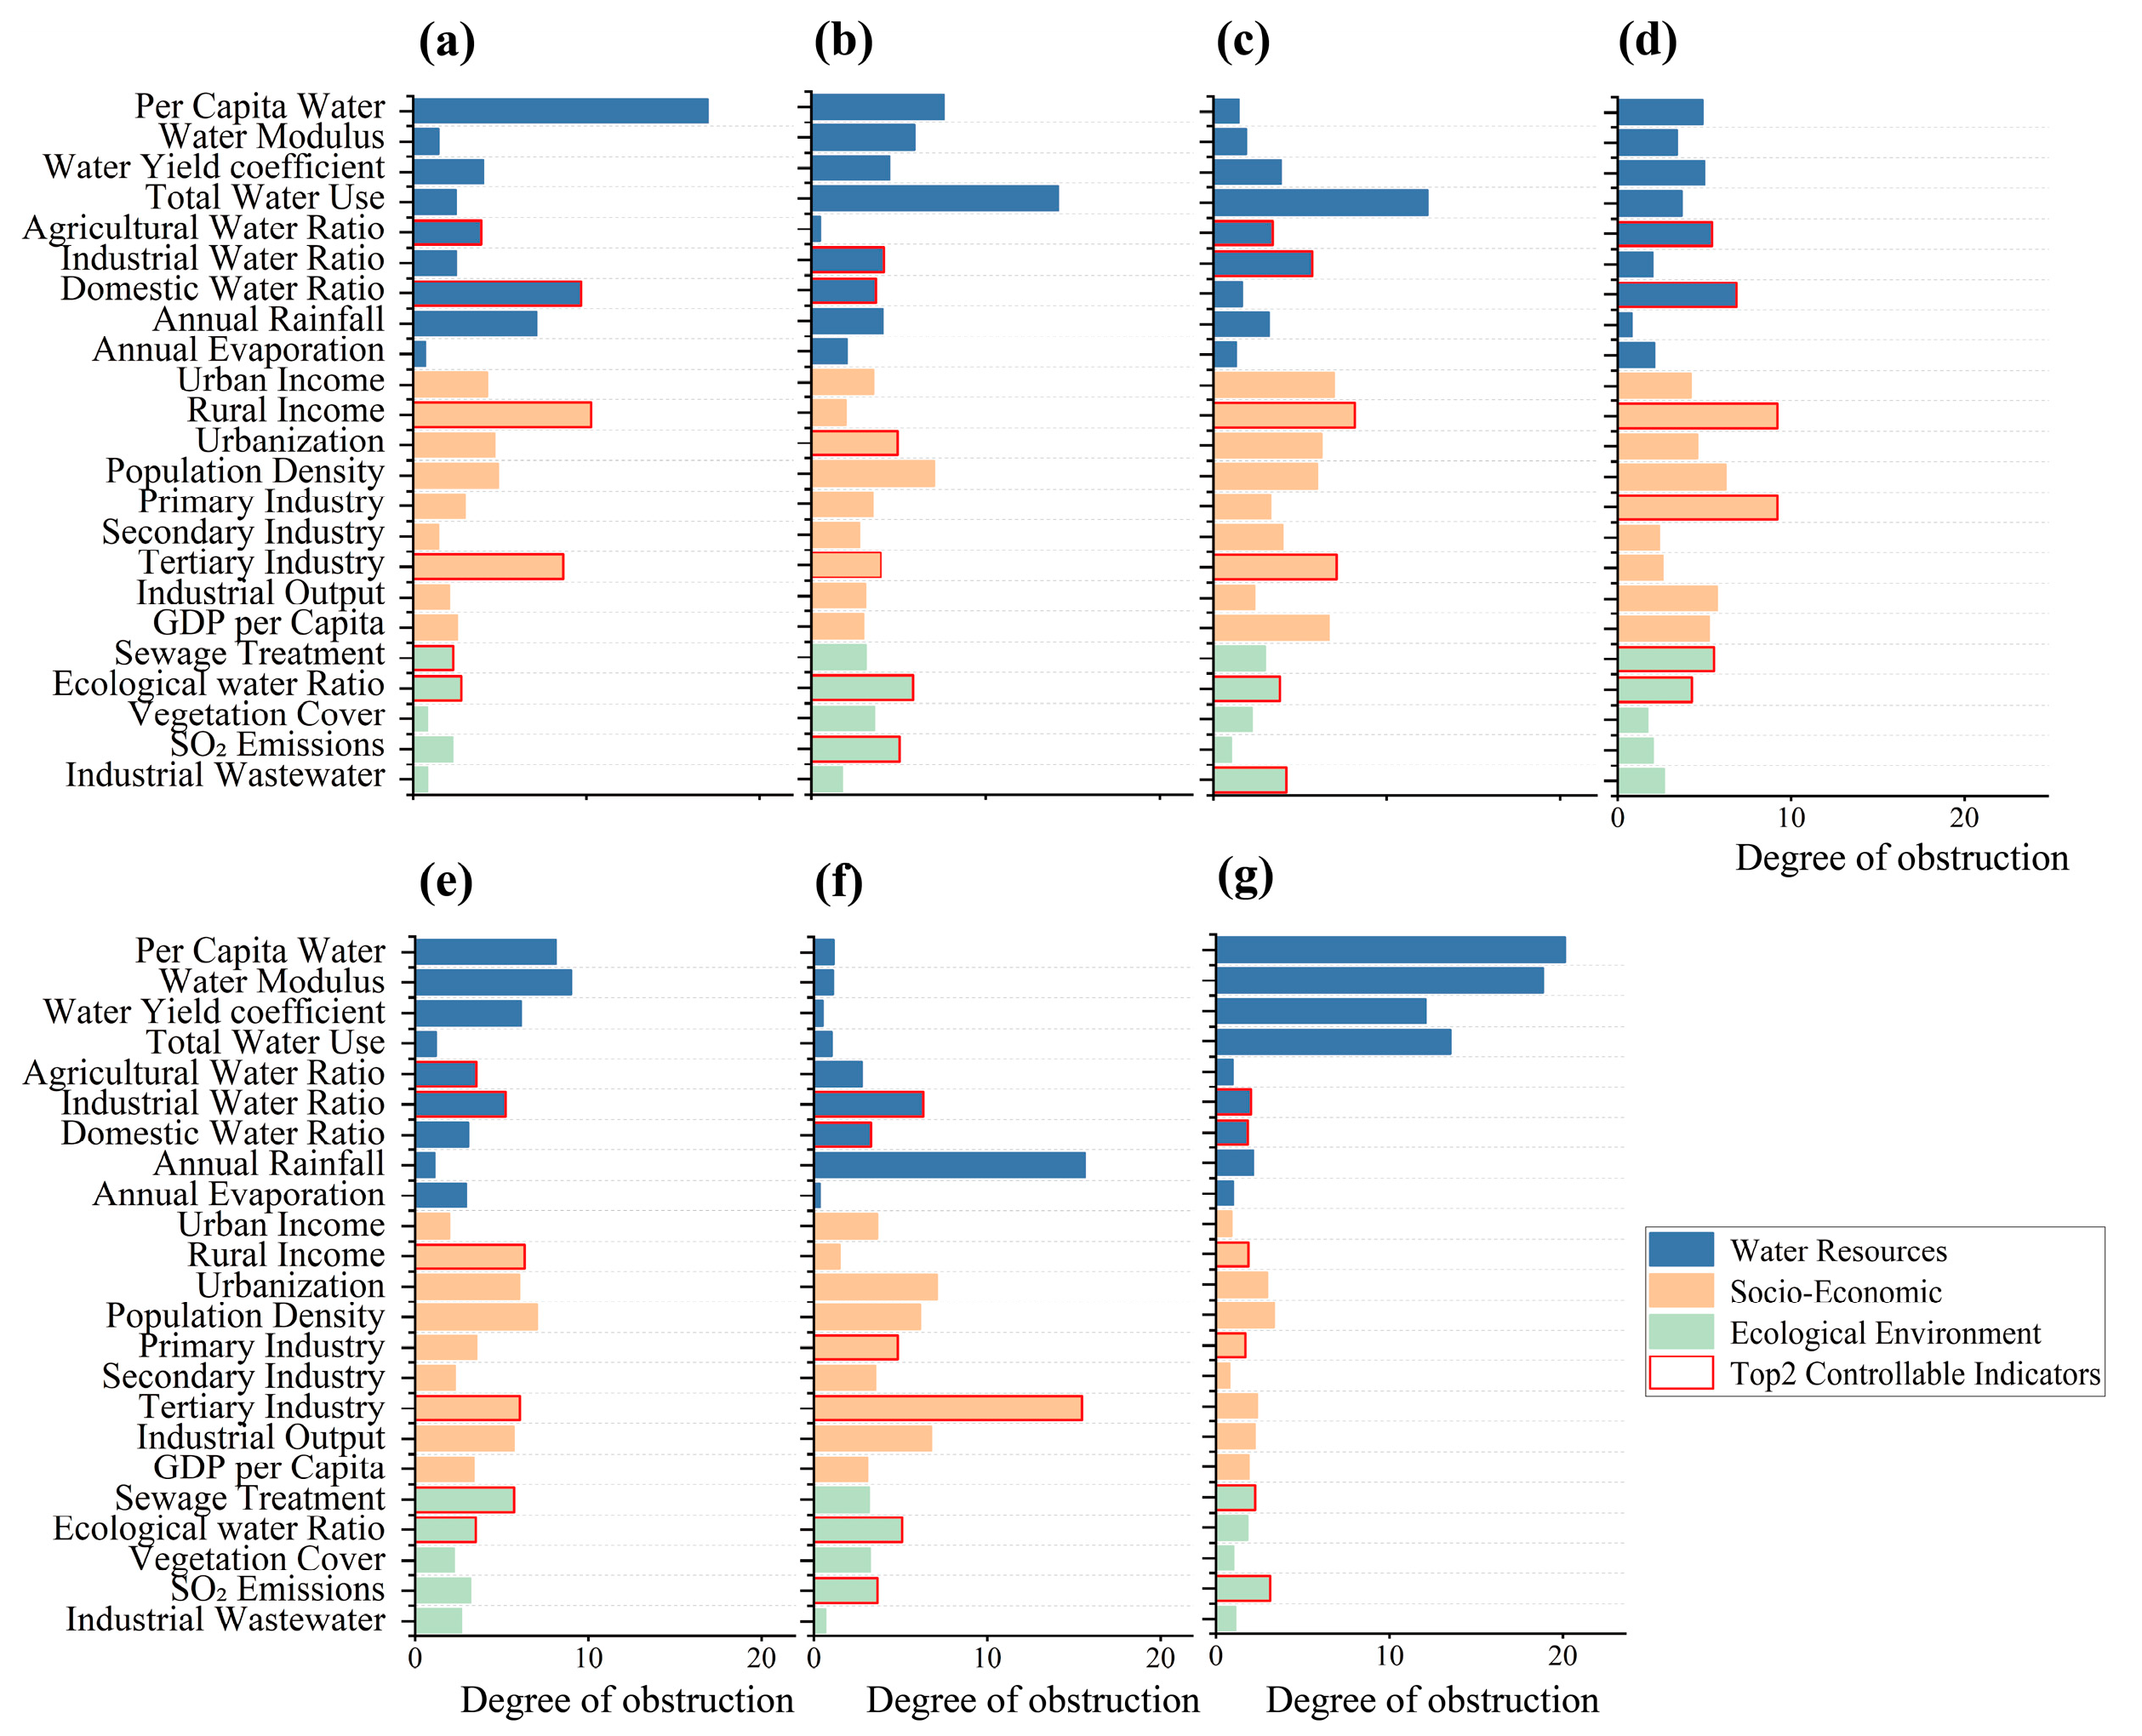
Using the ODM, this study identified the major constraints affecting the sustainable coordination of the water–socioeconomic–ecological system in the Inner Mongolia portion of the Yellow River Basin. To reduce bias caused by short-term fluctuations, obstacle degrees were calculated for all indicators during 2001–2025, and the 25-year average value was adopted to represent the overall obstacle level of each indicator. The results reveal the core bottlenecks constraining coordinated development over the long term (Figure 8). Indicators with higher obstacle degrees indicate greater mismatches between their current development levels and the requirements of coordinated development. These constraints can arise from persistent limitations in resource availability, economic structure, resource-use efficiency, or ecological protection, depending on the indicator. Indicators with higher obstacle degrees are considered to exert stronger constraints on system coordination, suggesting that targeted operation of these indicators can more effectively improve the overall coordination level. Meanwhile, selecting key obstacle indicators helped reduce the complexity of the operation model and enhanced the operability and precision of optimization strategies. This selection also allows the subsequent optimization to focus on the factors with both strong constraining effects and greater potential for adjustment, rather than attempting to regulate all indicators simultaneously. Therefore, the two indicators with the highest obstacle degrees and the greatest potential for human intervention are selected as key regulatory variables for subsequent optimization modeling.
Figure 8.
Identification results of index obstacles for each city: (a) Alxa, (b) Baotou, (c) Bayannur, (d) Ordos, (e) Hohhot, (f) Wuhai, and (g) Ulanqab.
Substantial regional differences in obstacle factors are observed among the league-level cities, indicating pronounced spatial heterogeneity in coordinated development challenges and management priorities across the Yellow River Basin of Inner Mongolia. The water resources subsystem constituted the primary constraint in Alxa League and Wuhai. Domestic water consumption (9.69%) and agricultural water consumption (3.93%) exhibited relatively high obstacle degrees in Alxa League, whereas Wuhai showed significantly higher obstacle degrees in per capita water resources (31.11%) and the water resource modulus (30.85%) than other regions. These differences reflect the distinct water-resource conditions and water-use structures of the two regions. In areas with limited water availability, relatively high domestic or agricultural water demand can intensify the imbalance between water supply and demand, while low water-resource endowment directly limits the capacity to support socioeconomic development. Greater emphasis on water-saving measures, optimized water allocation, and improved water-use efficiency therefore remains necessary.
Baotou, Bayannur, and Ordos exhibited a pronounced “industrial development–resource and environment” composite constraint pattern. Industrial and agricultural water consumption represented major constraints within the water resources subsystem, whereas relatively high obstacle degrees in the per capita disposable income of rural residents and tertiary industry output value reflected persistent challenges related to industrial transformation and urban–rural development imbalance. The strong dependence of economic activities on industrial and agricultural production increases water demand, while differences in economic opportunities between urban and rural areas may limit the balanced development of the socioeconomic subsystem. Ecological environment indicators, including sewage treatment rate and industrial wastewater discharge, also exerted relatively strong constraints in some regions, suggesting that pressures associated with economic growth and ecological governance remain difficult to balance. This pattern indicates that resource-intensive economic activities can generate environmental pressures faster than improvements in pollution control and ecological governance, creating a trade-off between economic expansion and environmental quality.
By contrast, the socioeconomic subsystem represented the dominant constraint in Hohhot and Ulanqab. The primary industry output value in Hohhot (9.21%) and the tertiary industry output value in Ulanqab (15.47%) exhibited particularly strong obstacle effects, indicating that some regions remain in a critical stage of industrial restructuring, where the dominance of traditional industries and insufficient tertiary sector development continue to constrain coordinated development. This suggests that differences in industrial structure and the pace of economic transformation have become important sources of regional heterogeneity, with an insufficiently diversified industrial structure limiting the ability of the socioeconomic subsystem to support balanced development.
4.4. Optimal Operation Results
The NSGA-II algorithm was integrated with the CCDM to derive the optimal operation proportions for each league-level city based on the controllable variables screened by the Obstacle Degree Model (Table 3). The optimized results during 2016–2025 were compared to assess the effectiveness of obstacle factor selection and the practical benefits of the regulation strategy.
Table 3.
The optimal control variables of each city.
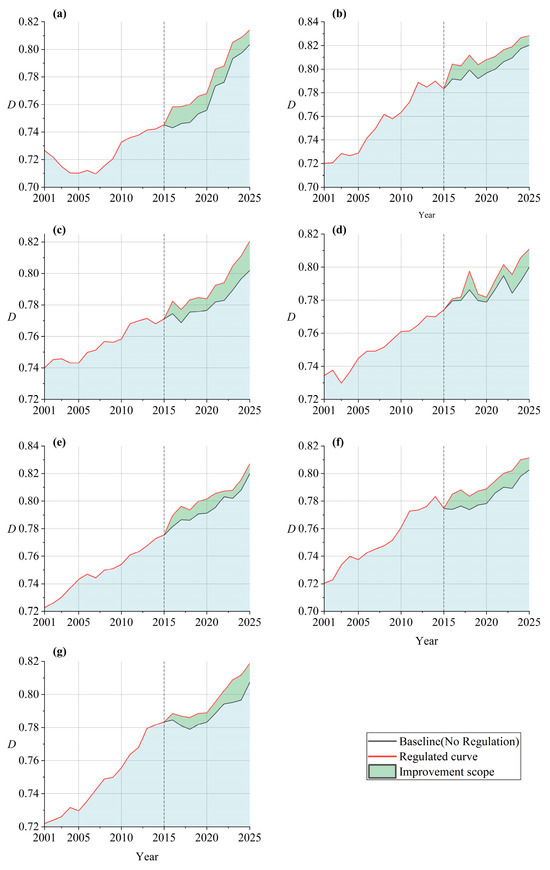
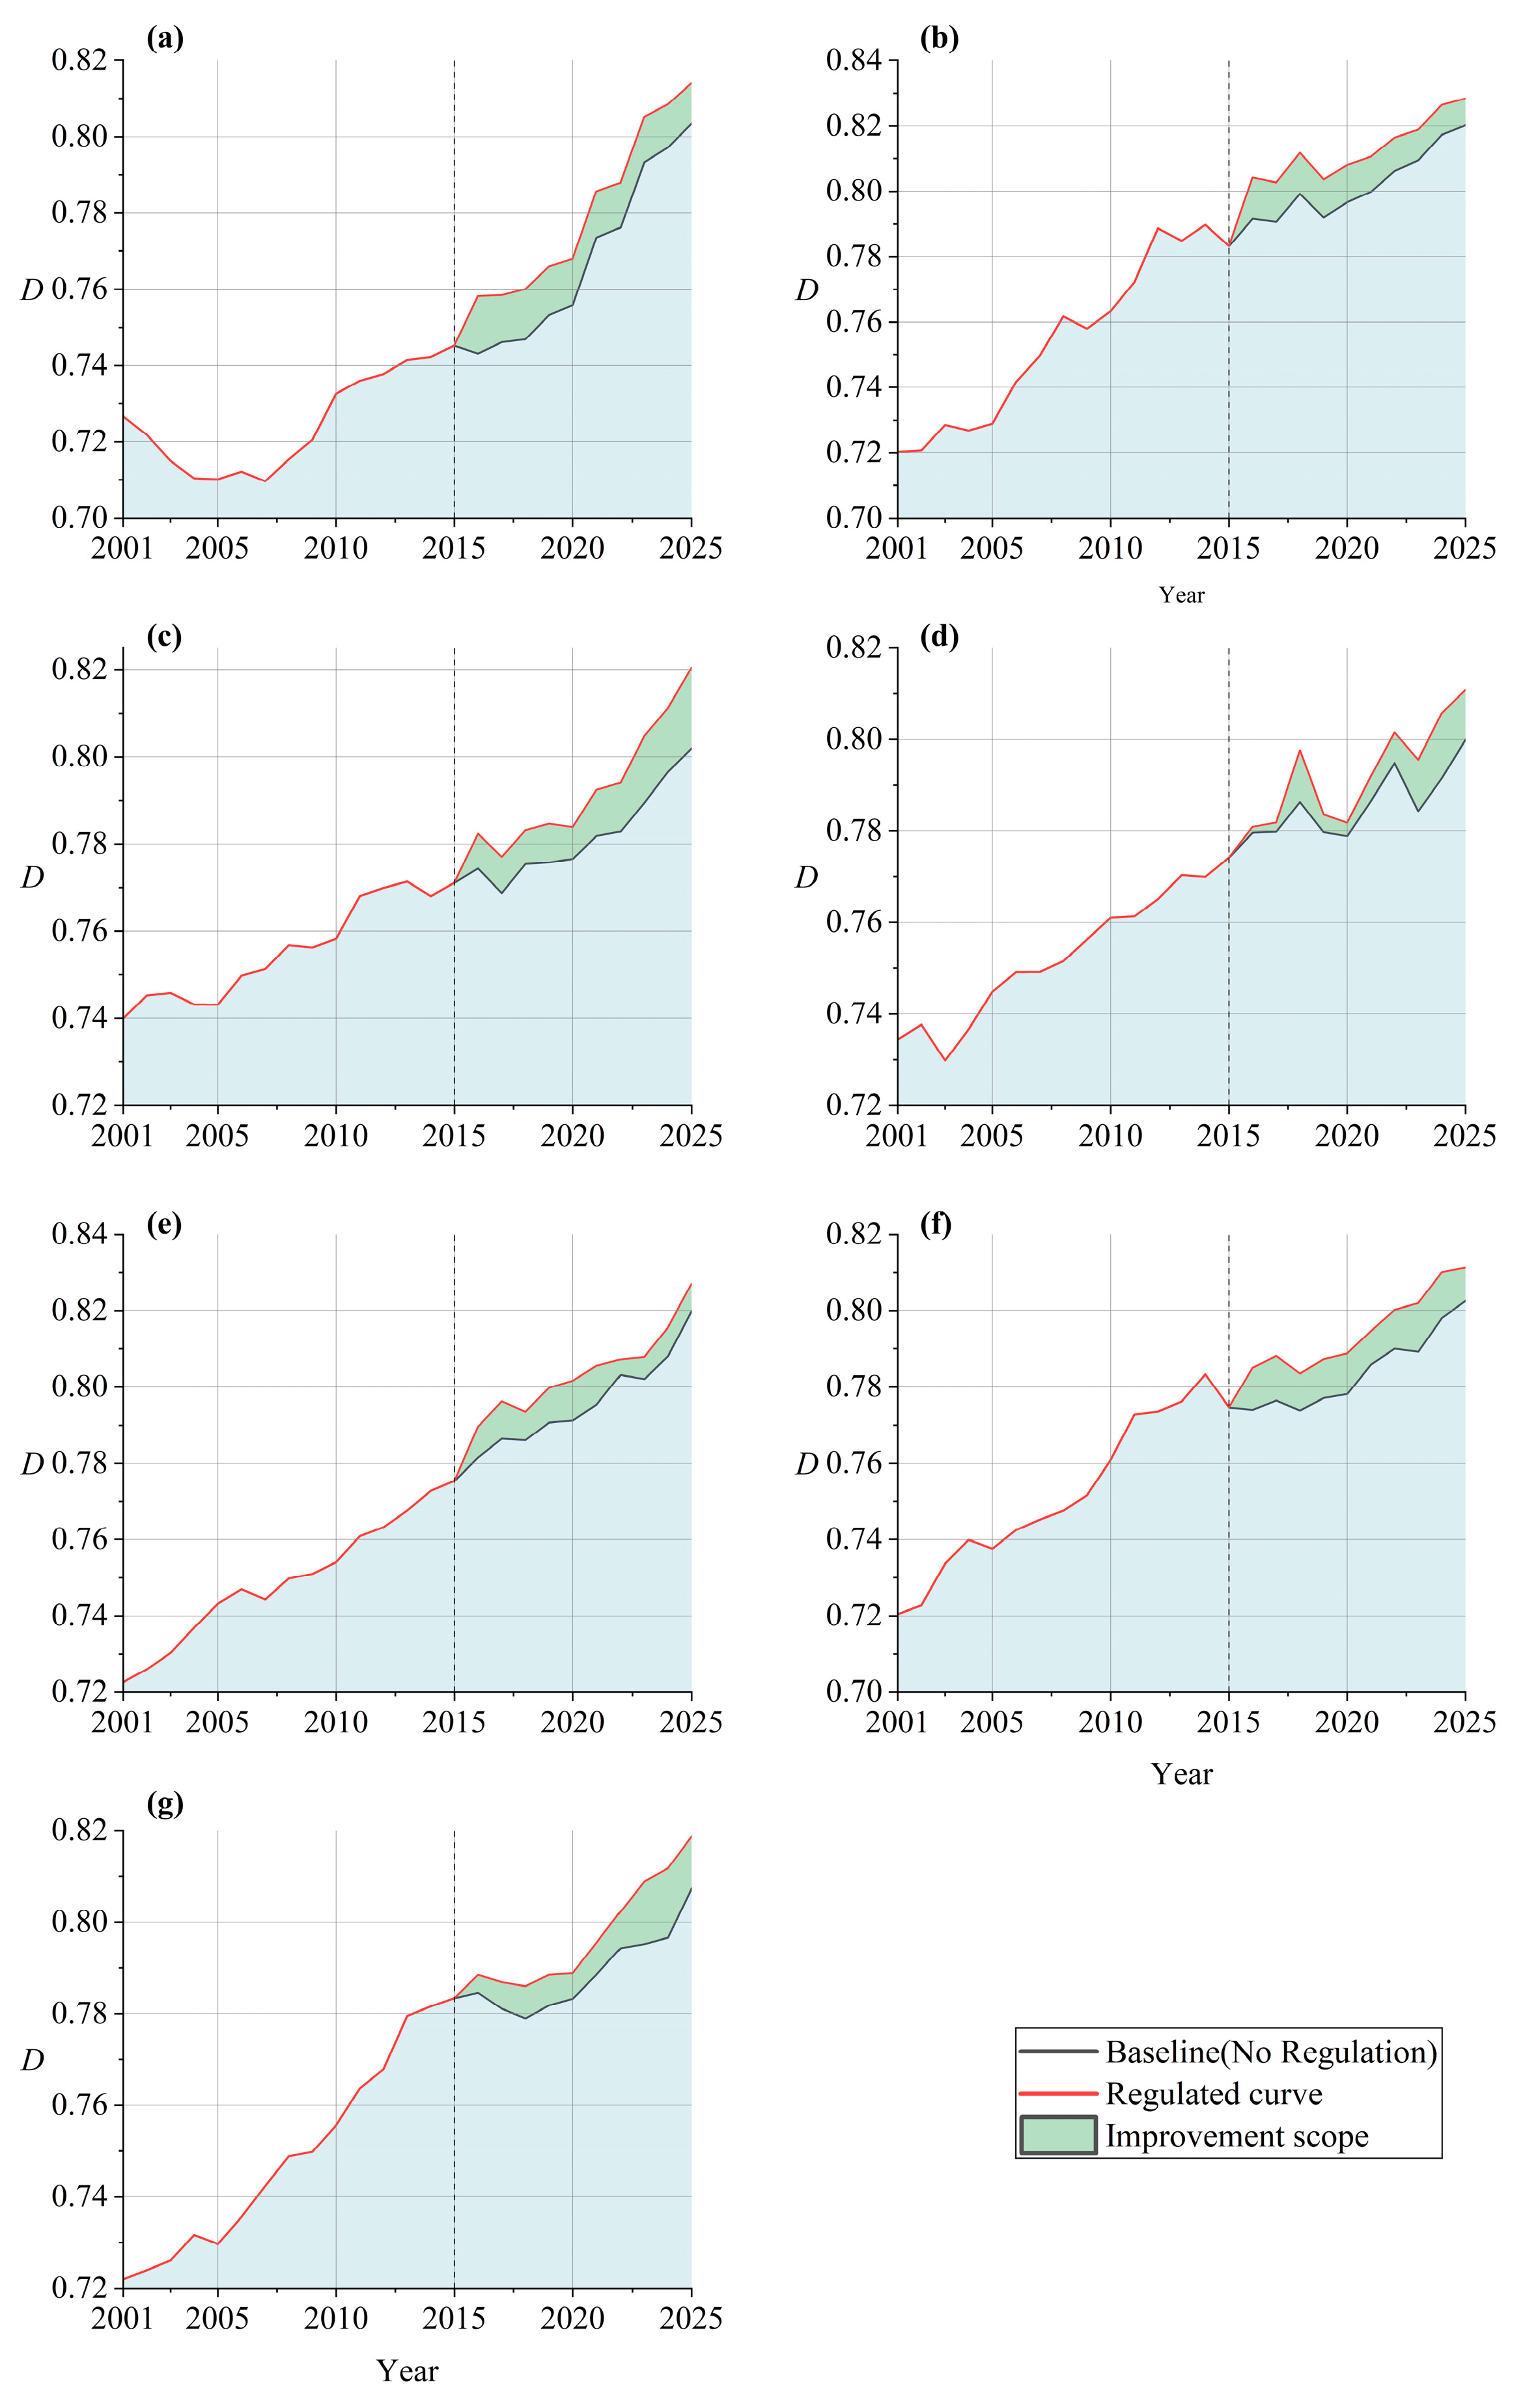
The coupling coordination degree increased across all league-level cities after optimization, indicating that the proposed strategy effectively strengthened synergy among the three subsystems (Figure 9). However, considerable variation in improvement was observed among cities. The average increase ranged from 0.007 to 0.012, with Alxa League exhibiting the greatest improvement (0.012), followed by Bayannur and Wuhai (both 0.011). The larger improvements in these regions are closely related to their relatively pronounced water-resource constraints and ecological pressures, which leave greater potential for coordination gains through targeted adjustment of water allocation, resource-use efficiency, and ecological management. In particular, Alxa League, as a typical arid and ecologically fragile region, appeared more responsive to resource optimization and ecological governance measures because improvements in water-use efficiency and ecological support can produce relatively noticeable changes in system coordination.
Figure 9.
The optimization effects of urban operation measures: (a) Alxa, (b) Baotou, (c) Bayannur, (d) Ordos, (e) Hohhot, (f) Wuhai, and (g) Ulanqab; denotes the degree of coupling coordination; the starting year for operation is 2015.
Baotou recorded an increase of 0.010, indicating that optimization strategies also played a positive role in industrial cities by improving resource-use efficiency and ecological governance. The moderate improvement suggests that reducing resource and environmental pressures associated with industrial activities can generate additional coordination benefits, although the relatively established socioeconomic system may limit the magnitude of short-term gains. Hohhot (0.008), Ulanqab (0.008), and Ordos (0.007) exhibited comparatively smaller improvements. Ordos showed the lowest increase, which is closely related to its high dependence on energy-intensive industries and the inertia of its economic structure. A relatively high initial development level also limits the potential for additional gains in coordination, while the adjustment of industrial structure and resource-use patterns generally requires a longer period to generate substantial effects. Therefore, the heterogeneous optimization effects across cities reflect differences in resource constraints, economic structure, ecological conditions, and the potential for further improvement.
The robustness of the optimization results is further supported by their consistent performance across the seven league-level cities. The proposed optimization framework was independently applied to each city under its respective regional conditions, and all seven cities achieved positive improvements in coupling coordination after optimization. Despite substantial differences in water-resource endowment, socioeconomic development, and ecological constraints among the cities, the optimization framework consistently produced favorable results. The consistent improvement across all regions indicates that the optimization effects are not dependent on the conditions of a specific city, thereby demonstrating the stability and adaptability of the proposed framework.
5. Conclusions
This study examines seven league-level cities within the Inner Mongolia section of the Yellow River Basin during 2001–2025 and develops a dynamic operation framework integrating system evaluation, obstacle diagnosis, and targeted operation for the water resources–socioeconomic–ecological environment composite system. First, system coordination was evaluated using the Coupling Coordination Degree Model (CCDM). Subsequently, the dominant limiting factors were identified using the Obstacle Degree Model (ODM), providing a basis for selecting regulatory variables. Finally, the NSGA-II optimization model was used to explore optimal operation pathways for improving system coordination. The major conclusions are as follows:
- (1)
- The composite system exhibited continuous improvement in its overall development and coordination performance across the seven league-level cities during 2001–2025. Quantitatively, from 2001 to 2025, the average coupling coordination degree increased substantially, reaching 0.84 from 0.63, with the coordination stage evolving from Primary Coordination to Significant Coordination. The socioeconomic subsystem showed the most substantial improvement, with its comprehensive evaluation index increasing from 0.46 to 0.90, while the ecological environment subsystem increased from 0.45 to 0.63. By contrast, the water resources subsystem increased only from 0.49 to 0.53, indicating a relatively limited improvement. The persistent disparity between water-related performance and the socioeconomic and ecological dimensions suggests that water resource endowment and utilization efficiency remain key constraints on achieving higher levels of coordinated regional development.
- (2)
- Dominant obstacle factors exhibited pronounced spatial heterogeneity across the seven league-level cities. Water resource factors constituted the primary constraints in Alxa League and Wuhai. In Alxa League, domestic and agricultural water consumption showed obstacle degrees of 9.69% and 3.93%, respectively, whereas Wuhai showed much higher obstacle degrees for per capita water resources (31.11%) and water resource modulus (30.85%). Baotou, Bayannur, and Ordos were mainly constrained by compound factors related to industrial development and resource–environment interactions, while Hohhot and Ulanqab were primarily restricted by socioeconomic factors. In particular, the obstacle degrees of primary industry output value in Hohhot and tertiary industry output value in Ulanqab reached 9.21% and 15.47%, respectively. The dominant constraints therefore differed across regions, reflecting differences in water resource conditions, water-use structures, and industrial development.
- (3)
- Optimization operation, based on key obstacle indicators, improved the coupling coordination degree in all seven league-level cities. The average increase ranged from 0.007 to 0.012, with Alxa League showing the largest improvement (0.012), followed by Bayannur and Wuhai (both 0.011). Baotou, Hohhot, Ulanqab, and Ordos increased by 0.010, 0.008, 0.008, and 0.007, respectively. The results indicate that regions facing stronger water resource and ecological constraints generally obtained greater improvements from operation, whereas Ordos showed the smallest increase, reflecting the relatively limited short-term response under its existing industrial and resource-use structure. These results support the need for differentiated operation strategies according to the dominant constraints and development characteristics of individual regions.
This study has several limitations that provide opportunities for further research. The analysis was conducted at the league-level city scale, which may not fully capture intra-regional differences in water resource conditions, industrial structure, and ecological characteristics. Future research could employ finer spatial units to improve the spatial precision of coordinated operation. In addition, the operation model considers a limited number of controllable indicators and does not fully capture the interactions among different regulatory variables. More controllable variables and their feedback relationships could therefore be incorporated into future optimization models. The current optimization is also based primarily on historical observations and fixed constraints, without explicitly considering uncertainties associated with future climate conditions, economic development, and resource availability. Scenario-based optimization and robustness analysis could be introduced to examine the adaptability of regulation strategies under different future conditions. Moreover, the present model focuses on maximizing coordination improvement without explicitly accounting for the economic and institutional costs of implementing regulation measures. Future studies could incorporate regulation costs as additional objectives to develop more practical multi-objective operation strategies.
Author Contributions
Q.M.: Conceptualization, Methodology, Writing—original draft, and Writing—review and editing. Y.G.: Supervision and Visualization. T.L.: Supervision and Visualization. L.L.: Data curation and Validation. All authors have read and agreed to the published version of the manuscript.
Funding
This research was funded by the National Key Research and Development Program of China (grant number 2023YFC3206503), the High-level Talent Research Initiation Project of Inner Mongolia Agricultural University (grant number. NDYB2022-33), the First-class Academic Subjects Special Research Project of the Education Department of Inner Mongolia Autonomous Region (grant number YLXKZX-NND-027), the Natural Science Foundation of Inner Mongolia Autonomous Region (grant number 2025MS05001), and the National Natural Science Foundation of China (grant number 52309020).
Data Availability Statement
The original contributions presented in this study are included in the article. Further inquiries can be directed to the corresponding author.
Conflicts of Interest
The authors declare no conflicts of interest.
References
- Peng, S.; Terrer, C.; Smith, B.; Ciais, P.; Han, Q.; Nan, J.; Fisher, J.B.; Chen, L.; Deng, L.; Yu, K. Carbon restoration potential on global land under water resource constraints. Nat. Water 2024, 2, 1071–1081. [Google Scholar] [CrossRef] [Scilit]
- Li, Y.; Lv, Y.; Zhang, Z.; Feng, X.; Chen, X. Coupling coordination evaluation of “Three Waters” system and impulse response analysis in the Yellow River Basin. Sustain. Cities Soc. 2024, 102, 105174. [Google Scholar] [CrossRef] [Scilit]
- Chen, S.; Zhang, L.; Liu, B.; Yi, H.; Su, H.; Kharrazi, A.; Jiang, F.; Lu, Z.; Crittenden, J.C.; Chen, B. Decoupling wastewater-related greenhouse gas emissions and water stress alleviation across 300 cities in China is challenging yet plausible by 2030. Nat. Water 2023, 1, 534–546. [Google Scholar] [CrossRef] [Scilit]
- Veldkamp, T.I.E.; Wada, Y.; Aerts, J.; Döll, P.; Gosling, S.N.; Liu, J.; Masaki, Y.; Oki, T.; Ostberg, S.; Pokhrel, Y.; et al. Water scarcity hotspots travel downstream due to human interventions in the 20th and 21st century. Nat. Commun. 2017, 8, 15697. [Google Scholar] [CrossRef] [Scilit] [PubMed]
- Niu, C.; Chang, J.; Wang, Y.; Shi, X.; Wang, X.; Guo, A.; Jin, W.; Zhou, S. A water resource equilibrium regulation model under water resource utilization conflict: A case study in the Yellow River Basin. Water Resour. Res. 2022, 58, e2021WR030779. [Google Scholar] [CrossRef] [Scilit]
- Hu, H.; Tian, G.; Wu, Z.; Xia, Q. Cross-regional ecological compensation under the composite index of water quality and quantity: A case study of the Yellow River Basin. Environ. Res. 2023, 238, 117152. [Google Scholar] [CrossRef] [Scilit] [PubMed]
- Zhao, Y.; Luo, P.; Zhang, J.; Yan, P.; Rijal, M.; Yang, Z.; Chen, J.; Elbeltagi, A. Coordinating socio-economic development and ecological protection in the Yellow River Basin: Pathways to new quality productivity. Environ. Sustain. Indic. 2025, 28, 100987. [Google Scholar] [CrossRef] [Scilit]
- Schandl, H.; Hatfield-Dodds, S.; Wiedmann, T.; Geschke, A.; Cai, Y.; West, J.; Newth, D.; Baynes, T.; Lenzen, M.; Owen, A. Decoupling global environmental pressure and economic growth: Scenarios for energy use, materials use and carbon emissions. J. Clean. Prod. 2016, 132, 45–56. [Google Scholar] [CrossRef] [Scilit]
- D’Odorico, P.; Rulli, M.C. Decoupling economic growth from water use intensification. Nat. Water 2026, 4, 423–430. [Google Scholar] [CrossRef] [Scilit]
- Aşıcı, A.A. Economic growth and its impact on environment: A panel data analysis. Ecol. Indic. 2013, 24, 324–333. [Google Scholar] [CrossRef] [Scilit]
- Fan, X. Research on the coupling of ecological environment and socio-economic development in resource-based cities: Based on scenario simulation method. Sustain. Cities Soc. 2024, 114, 105810. [Google Scholar] [CrossRef] [Scilit]
- Wang, W.; Yang, G. Sustainable carrying capacity: Integrating SDGs to assess evidence of sustainable development: A case study of the Yangtze River Economic Belt in China. J. Clean. Prod. 2025, 486, 144569. [Google Scholar] [CrossRef] [Scilit]
- Li, M.; Han, C.; Meng, L.; Liu, P.; Shao, Z. Spatiotemporal dynamics and driving factors of the coupling coordination between solar photovoltaic efficiency and installed capacity in China (2015–2023). Renew. Energy 2025, 247, 122991. [Google Scholar] [CrossRef] [Scilit]
- Cui, D.; Chen, X.; Xue, Y.; Li, R.; Zeng, W. An integrated approach to investigate the relationship of coupling coordination between social economy and water environment on urban scale: A case study of Kunming. J. Environ. Manag. 2019, 234, 189–199. [Google Scholar] [CrossRef] [Scilit] [PubMed]
- Wang, X.; Zhang, S.; Gao, C.; Tang, X. Coupling coordination and driving mechanisms of water resources carrying capacity under the dynamic interaction of the water-social-economic-ecological environment system. Sci. Total Environ. 2024, 920, 171011. [Google Scholar] [CrossRef] [Scilit] [PubMed]
- Ariken, M.; Zhang, F.; Chan, N.W.; Kung, H.-T. Coupling coordination analysis and spatio-temporal heterogeneity between urbanization and eco-environment along the Silk Road Economic Belt in China. Ecol. Indic. 2021, 121, 107014. [Google Scholar] [CrossRef] [Scilit]
- Fang, Y.; Meng, F.; Luo, M.; Sa, C.; Bao, Y.; Lei, J. Coupling coordination framework for assessing balanced development between potential ecosystem services and human activities. Earth’s Future 2025, 13, e2025EF006243. [Google Scholar] [CrossRef] [Scilit]
- Li, Y.; Li, Y.; Zhou, Y.; Shi, Y.; Zhu, X. Investigation of a coupling model of coordination between urbanization and the environment. J. Environ. Manag. 2012, 98, 127–133. [Google Scholar] [CrossRef] [Scilit] [PubMed]
- Liu, B.; Wang, Y.; Tan, Z.; Wang, Z.; Shao, Y. Beyond supply-driven paradigms: Diagnosing water supply saturation effects for efficiency-oriented management in the urban Water-Energy-Food-Carbon nexus. Water Res. X 2026, 31, 100541. [Google Scholar] [CrossRef] [Scilit]
- Bai, X.; Jin, J.; Zhou, R.; Wu, C.; Zhou, Y.; Zhang, L.; Cui, Y. Coordination evaluation and obstacle factors recognition analysis of water resource spatial equilibrium system. Environ. Res. 2022, 210, 112913. [Google Scholar] [CrossRef] [Scilit] [PubMed]
- Zhen, J.; Guo, Y.; Wang, Y.; Li, Y.; Shen, Y. Spatial-temporal evolution and driving factors of water-energy-food-ecology coordinated development in the Tarim River Basin. J. Hydrol. Reg. Stud. 2025, 58, 102288. [Google Scholar] [CrossRef] [Scilit]
- Yang, X.; Feng, Z.; Chen, Y. Evaluation and obstacle analysis of high-quality development in Yellow River Basin and Yangtze River Economic Belt, China. Humanit. Soc. Sci. Commun. 2023, 10, 757. [Google Scholar] [CrossRef] [Scilit]
- Jiang, L.; Du, C.; Tan, S.; Zhang, Z.; Nie, T.; Li, T.; Chen, P.; Dai, C. Comprehensive evaluation and obstacle factor analysis of water security in Heilongjiang Province based on water footprint. Water Res. 2026, 292, 125314. [Google Scholar] [CrossRef] [Scilit] [PubMed]
- Qu, B.; Jiang, E.; Li, J.; Liu, Y.; Liu, C. Coupling coordination relationship of water resources, eco-environment and socio-economy in the water-receiving area of the Lower Yellow River. Ecol. Indic. 2024, 160, 111766. [Google Scholar] [CrossRef] [Scilit]
- Zhu, C.; Fang, C.; Zhang, L. Analysis of the coupling coordinated development of the Population–Water–Ecology–Economy system in urban agglomerations and obstacle factors discrimination: A case study of the Tianshan North Slope Urban Agglomeration, China. Sustain. Cities Soc. 2023, 90, 104359. [Google Scholar] [CrossRef] [Scilit]
- Liu, H.; Zeng, Z.; Xu, J.; Ren, Y.; Ma, Y.; Wang, L. A coupling coordination-based framework for assessing urban resilience of water resources, eco-environment, and socio-economy. J. Environ. Manag. 2026, 401, 128882. [Google Scholar] [CrossRef] [Scilit] [PubMed]
- Zeng, Z.; Yang, Q.; Cao, H.; Ren, Y.; Ma, Y.; Wang, L. A coupled emergy-ecological footprint model for assessing water resource sustainability: Evidence from the Southern Sichuan Economic Zone. Ecol. Indic. 2025, 178, 113905. [Google Scholar] [CrossRef] [Scilit]
- Cui, Y.; Zhou, Y.; Jin, J.; Zhang, L.; Wu, C.; Ning, S. Coordinated development evaluation and diagnosis of regional water resources-social economy-ecological environment system based on mechanical model and risk matrix. J. Hydrol. 2024, 633, 131013. [Google Scholar] [CrossRef] [Scilit]
- Wei, W.; Zhang, Y.; Wei, X.; Xie, B.; Ma, Z.; Liu, C.; Yu, L.; Zhou, J.; Shi, W.; Liu, T.; et al. Construction and optimization of ecological security patterns based on ecosystem service function and ecosystem sensitivity in the important ecological functional area—A case study in the Yellow River Basin. Ecol. Eng. 2025, 215, 107609. [Google Scholar] [CrossRef] [Scilit]
- Yuan, F.; Qiu, L.; Zhang, F.; Liu, G. Water-food-ecology interactions in an arid irrigation region: Trade-offs, synergies, and drivers from an ecosystem service bundle perspective. J. Environ. Manag. 2025, 396, 128120. [Google Scholar] [CrossRef] [Scilit] [PubMed]
- Zhang, Y.; Khan, S.U.; Swallow, B.; Liu, W.; Zhao, M. Coupling coordination analysis of China’s water resources utilization efficiency and economic development level. J. Clean. Prod. 2022, 373, 133874. [Google Scholar] [CrossRef] [Scilit]
- Sun, X.; Shao, H.; Liang, S.; Zhou, Y.; Dai, X.; Liu, M.; Tao, R.; Guo, Z.; Xin, Q. Tracking sustainable development in mining towns: A novel framework integrating socioeconomic and eco-environmental perspectives through coupling coordination degree. Environ. Impact Assess. Rev. 2024, 109, 107641. [Google Scholar] [CrossRef] [Scilit]
- Ji, J.; Tang, Z.; Zhang, W.; Liu, W.; Jin, B.; Xi, X.; Wang, F.; Zhang, R.; Guo, B.; Xu, Z.; et al. Spatiotemporal and multiscale analysis of the coupling coordination degree between economic development equality and eco-environmental quality in China from 2001 to 2020. Remote Sens. 2022, 14, 737. [Google Scholar] [CrossRef] [Scilit]
- Geng, N.; Tian, G.; Zhang, H. The spatial-temporal evolution characteristics and influencing factors of coordinated development in the Yellow River Basin: Based on the perspective of flood-sediment transport, eco-environmental, and socio-economic subsystems. Ecol. Indic. 2025, 176, 113673. [Google Scholar] [CrossRef] [Scilit]
- Li, D.; Liu, Z.; Wang, D.; Liu, X. Rainfall temporal variability-oriented optimization of urban water resources allocation. J. Hydrol. Reg. Stud. 2025, 61, 102694. [Google Scholar] [CrossRef] [Scilit]
- Quan, Z.; Zuo, Q.; Zang, C.; Wu, Q. A multi-index comprehensive evaluation method for assessing the water use balance between economic society and ecology considering efficiency-development-health-harmony. Sci. Rep. 2024, 14, 25924. [Google Scholar] [CrossRef] [Scilit] [PubMed]
- Lv, Y.; Wang, Y.; Zhang, X.; Zhang, D. A Study on the Carrying Capacity of Water Resources Utilizing the Fuzzy Comprehensive Evaluation Model—Illustrated by a Case from Guantao County. Water 2023, 15, 4277. [Google Scholar] [CrossRef] [Scilit]
- Karagiannis, R.; Karagiannis, G. Constructing Composite Indicators with Shannon Entropy: The Case of Human Development Index. Socio-Econ. Plan. Sci. 2020, 70, 100701. [Google Scholar] [CrossRef] [Scilit]
- Li, Z.; Luo, Z.; Wang, Y.; Fan, G.; Zhang, J. Suitability evaluation system for the shallow geothermal energy implementation in region by Entropy Weight Method and TOPSIS method. Renew. Energy 2022, 184, 564–576. [Google Scholar] [CrossRef] [Scilit]
- Wang, T.; Jian, S.; Wang, J.; Yan, D. Dynamic interaction of water–economic–social–ecological environment complex system under the framework of water resources carrying capacity. J. Clean. Prod. 2022, 368, 133132. [Google Scholar] [CrossRef] [Scilit]
- He, L.; Du, X.; Zhao, J.; Chen, H. Exploring the coupling coordination relationship of water resources, socio-economy and eco-environment in China. Sci. Total Environ. 2024, 918, 170705. [Google Scholar] [CrossRef] [Scilit] [PubMed]
- Xing, L.; Xue, M.; Hu, M. Dynamic simulation and assessment of the coupling coordination degree of the economy–resource–environment system: Case of Wuhan City in China. J. Environ. Manag. 2019, 230, 474–487. [Google Scholar] [CrossRef] [Scilit] [PubMed]
- Li, L.; Fan, Z.; Feng, W.; Yuxin, C.; Keyu, Q. Coupling coordination degree spatial analysis and driving factor between socio-economic and eco-environment in northern China. Ecol. Indic. 2022, 135, 108555. [Google Scholar] [CrossRef] [Scilit]
- Zhang, Y.; Gao, T.; Sun, Y. Exploring the coupling coordination relationship and influencing factors between regional integration and urban land utilization green efficiency in the Yangtze River Delta, China. Humanit. Soc. Sci. Commun. 2025, 12, 1660. [Google Scholar] [CrossRef] [Scilit]
- Yuan, D.; Du, M.; Yan, C.; Wang, J.; Wang, C.; Zhu, Y.; Wang, H.; Kou, Y. Coupling coordination degree analysis and spatiotemporal heterogeneity between water ecosystem service value and water system in Yellow River Basin cities. Ecol. Inform. 2024, 79, 102440. [Google Scholar] [CrossRef] [Scilit]
- Cheng, M.; Li, Q.; Wen, Z. Coupling coordination degree analysis and driving factors of innovation network and eco-efficiency in China. Environ. Impact Assess. Rev. 2023, 99, 107008. [Google Scholar] [CrossRef] [Scilit]
- Han, S.; Wang, B.; Ao, Y.; Bahmani, H.; Chai, B. The coupling and coordination degree of urban resilience system: A case study of the Chengdu–Chongqing urban agglomeration. Environ. Impact Assess. Rev. 2023, 101, 107145. [Google Scholar] [CrossRef] [Scilit]
- Gan, L.; Shi, H.; Hu, Y.; Lev, B.; Lan, H. Coupling coordination degree for urbanization city-industry integration level: Sichuan case. Sustain. Cities Soc. 2020, 58, 102136. [Google Scholar] [CrossRef] [Scilit]
- Pang, B.; Li, X.; Fu, Y. Coupling coordination analysis and obstacle factors of water-energy-environment-economy in the Yellow River Basin. J. Clean. Prod. 2024, 468, 143108. [Google Scholar] [CrossRef] [Scilit]
- Lv, Y.; Li, Y.; Zhang, Z.; Luo, S.; Feng, X.; Chen, X. Spatio-temporal evolution pattern and obstacle factors of water-energy-food nexus coupling coordination in the Yangtze River Economic Belt. J. Clean. Prod. 2024, 444, 141229. [Google Scholar] [CrossRef] [Scilit]
- Ma, H.; Zhang, Y.; Sun, S.; Liu, T.; Shan, Y. A comprehensive survey on NSGA-II for multi-objective optimization and applications. Artif. Intell. Rev. 2023, 56, 15217–15270. [Google Scholar] [CrossRef] [Scilit]
- Liu, R.; Liu, Y.; Jiao, L.; Wang, L. Multi-objective optimization of reservoir group operation after inter-basin water transfer jointing SWAT model and NSGA-II. J. Hydrol. 2025, 660, 133431. [Google Scholar] [CrossRef] [Scilit]
- Makaremi, Y.; Haghighi, A.; Ghafouri, H.R. Optimization of pump scheduling program in water supply systems using a self-adaptive NSGA-II: A review of theory to real application. Water Resour. Manag. 2017, 31, 1283–1304. [Google Scholar] [CrossRef] [Scilit]
- Luan, C.; Liu, R.; Zhang, Q.; Sun, J.; Liu, J. Multi-objective land use optimization based on integrated NSGA-II-PLUS model: Comprehensive consideration of economic development and ecosystem services value enhancement. J. Clean. Prod. 2024, 434, 140306. [Google Scholar] [CrossRef] [Scilit]

Disclaimer/Publisher’s Note: The statements, opinions and data contained in all publications are solely those of the individual author(s) and contributor(s) and not of MDPI and/or the editor(s). MDPI and/or the editor(s) disclaim responsibility for any injury to people or property resulting from any ideas, methods, instructions or products referred to in the content. |
© 2026 by the authors. Licensee MDPI, Basel, Switzerland. This article is an open access article distributed under the terms and conditions of the Creative Commons Attribution (CC BY) license.