


Abstract
Leakage from water distribution networks (WDNs) are one of the most persistent inefficiencies in urban water management. Global non-revenue water (NRW) volumes have remained broadly stable over two decades despite major technical investment in detection, pressure management, and pipe deterioration modeling, implying a structural obstacle that technical solutions alone cannot resolve. This review argues that the underlying reason is conceptual. Leakage has been treated predominantly as an engineering problem. In reality, it is the visible outcome of three interacting failure domains: physical infrastructure deterioration, climate-driven stress amplification, and governance and institutional inadequacy. No existing review integrates all three domains into a unified diagnostic framework. This paper introduces the Three-Domain Systems Failure Framework (TDSFF) as a structured diagnostic approach to the root causes of WDN leakage. A structured literature review of 58 peer-reviewed and authoritative sources, including gray literature, is presented. Eight comparative tables and five original figures synthesize evidence across global contexts from high-income OECD networks to Sub-Saharan African utilities. An operational four-step classification protocol enables practitioners to apply the TDSFF directly to real utility contexts. The framework and the protocol are presented as proposals. Key findings are as follows. Infrastructure deterioration is necessary but insufficient as an explanation for observed leakage levels. Climate change is increasingly observed to accelerate pipe failure rates through soil movement, thermal cycling, and altered pressure dynamics, with impacts underrepresented in current engineering design practice. Governance failures, including deferred maintenance cycles, absent regulatory NRW targets, and chronic underinvestment, explain the persistence of leakage independent of physical deterioration. Technical solutions achieve limited system-level impact when governance preconditions for sustained management are absent. The TDSFF is offered as a practitioner-facing diagnostic aid to identify the dominant failure domain and direct investigation accordingly. Relationships between the domains rest on observational evidence and are reported as associations, not as estimated causal effects.
1. Introduction
Leakage from water distribution networks (WDNs) constitutes a global water management challenge with far-reaching economic, environmental, and public health consequences. Water networks, regardless of age or construction materials, commonly exhibit leakage that undermines the financial viability of water utilities and contributes to the depletion of already-stressed freshwater resources [1,2]. In an era of growing urban water demand and accelerating climate-induced scarcity, the failure to control leakage represents both a resource management failure and an infrastructure governance failure.
Non-revenue water (NRW) is defined as the difference between the volume of water introduced into a distribution system and the volume billed to consumers [2]. NRW encompasses physical losses (real leakage through pipes, joints, and fittings), apparent losses from meter inaccuracies and unauthorized consumption, and unbilled authorized consumption. Physical losses constitute the dominant share in most networks, accounting for 50 to 80% of total NRW [3,4].
Liemberger and Wyatt (2019) estimated global NRW volumes at 346 billion liters per day, with an associated financial cost of approximately USD 39 billion annually [5]. Longitudinal utility data indicate that global NRW volumes have remained broadly stable over two decades despite major technical investment, implying a structural obstacle that technical solutions alone cannot resolve [6,7]. Technical research on WDN leakage has been active for over four decades. Pipe failure modeling has advanced substantially [8]. Pressure-leakage mechanics are well characterized [9,10]. Detection technologies have improved markedly [11,12,13]. Pressure management strategies, including applications of pumps as turbines (PATs), have demonstrated leakage reductions of 20 to 40% in published case studies and optimization analyses [14,15,16]. Nevertheless, system-wide NRW rates have not declined commensurately [6].
This review argues that the persistent gap exists because the technical literature has framed leakage diagnosis as a materials and hydraulics problem. The dominant approach locates the cause of leakage in the pipe: its material, age, pressure environment, and failure mode. This framing is not incorrect, but it is incomplete. It neglects two additional failure domains that interact with infrastructure deterioration to determine observed leakage levels: climate-driven stress and governance failure.
The most recent comprehensive review in this field, by Serafeim et al. (2024), covers the three principal estimation methodologies, the structural, environmental, hydraulic, and maintenance factors influencing leakage, and engineering mitigation strategies [1]. Two domains are outside its scope: climate change as a structural accelerator of pipe deterioration, and governance, regulatory, and financing structures that determine whether technically available solutions are actually deployed. These omissions are systematic across the existing review literature. The present review introduces these domains as drivers that existing reviews under-represent, and synthesizes all three into the TDSFF. Domain C is not of the same kind as the other two, as Section 6 explains, and the framework treats it as an agent layer rather than as a third state variable. Climate change is imposing new and accelerated stress on buried pipe infrastructure [17,18]. Governance failure prevents the deployment of technically available solutions when institutional structures fail to incentivize investment or mandate accountability [19].
This paper makes four contributions to the literature. First, it introduces the TDSFF as a diagnostic tool for classifying leakage problems by dominant failure domain. Second, it synthesizes evidence across all three domains from verifiable sources. Third, it provides eight comparative tables and five original figures enabling cross-utility and cross-national comparison. Fourth, it proposes an operational classification protocol, demonstrates it on an illustrative case in Section 9.5, and sets out eleven research gaps as a catalog of themes.
2. Review Scope and Methodology
This review follows a structured literature review approach. Literature was identified through searches of Web of Science, Scopus, and Google Scholar using the terms: water distribution network leakage, non-revenue water, pipe failure, pressure-leakage, leakage detection, pipe deterioration, climate change, and water utility governance, covering the period 1979 to 2024. Gray literature from the World Bank, IWA, AWWA, ASCE, and national utility reports was included where it provided empirical data not available in peer-reviewed sources. Serafeim et al. (2024) and Puust et al. (2010) were used as baselines for positioning the novel contributions of the present work [1,6].
Inclusion criteria required that sources address at least one of the following: physical mechanisms of pipe failure and leakage generation; climate change impacts on buried infrastructure; governance, regulatory, or financial dimensions of leakage management; leakage detection technologies; or pressure management and control strategies. A total of 58 references met the inclusion criteria. The review is a structured narrative synthesis.
The paper is organized as follows. Section 3 presents global leakage scale data. Section 4 reviews Domain A (infrastructure deterioration). Section 5 reviews Domain B (climate stress). Section 6 reviews Domain C (governance and institutional gaps). Section 7 reviews leakage detection technologies. Section 8 reviews leakage control strategies. Section 9 presents the TDSFF, including framework structure, pairwise interaction zones, three primary failure configurations, and an operational classification protocol. Section 10 identifies eleven priority research gaps. Section 11 presents conclusions.
Search, Screening, Appraisal, and Reporting Standard
The search was executed on the Web of Science, Scopus, and Google Scholar. The search string combined the leakage terms listed above with the domain terms climate, governance, regulation, and financing. Boolean OR was used within each concept group and AND across groups. The coverage period was 1979 to 2024. Retrieval was limited to English-language sources. Screening proceeded in three stages. Titles and abstracts were screened against the inclusion criteria. Retained records were screened for full text to identify reported methods or data. A final relevance check assigned each retained source to one or more of the three domains.
Quality appraisal was applied at source level rather than by a formal instrument. Peer-reviewed journal articles and academic books were accepted based on the publication venue. Gray literature was accepted only where it reported primary utility data not available in peer-reviewed form. Sources were excluded where the treatment of leakage was incidental, where no method or data were reported, or where the same authors reported the same result in an earlier source already retained. Synthesis was thematic. Where sources disagree, the disagreement is reported in the text rather than resolved by averaging.
The review does not include a PRISMA flow diagram, as PRISMA is a reporting guideline for systematic reviews that answer a narrowly bounded question, and its scoping extension is designed for mapping exercises. Neither fits a synthesis that spans the physical, climatic, and institutional studies, given incompatible evidence types. More importantly, record counts at each screening stage were not logged prospectively. Reconstructing those counts after the fact would produce figures that cannot be verified against a search log. The authors judged it preferable to state the criteria and the process explicitly and to omit counts that were not recorded. The narrative synthesis is reported against the expectations of the SANRA scale for narrative review articles: justification of importance, statement of the specific aims, description of the literature search, referencing of claims, scientific reasoning, and appropriate presentation of data.
3. The Global Scale of Water Distribution Leakage
Table 1 presents documented NRW ranges across eight regional and income-group contexts, along with the dominant physical and governance drivers and the primary references. The data are drawn from World Bank, IWA, and peer-reviewed sources and represent ranges from multiple utility observations. NRW performance appears more strongly associated with governance stringency and investment levels than with income or infrastructure age alone.
Table 1.
Global NRW ranges by region and income group, with dominant drivers and primary references.
Several patterns emerge from Table 1. First, the Netherlands achieves one of the world’s lowest NRW rates through proactive pipe replacement, universal metering, and the Vewin voluntary benchmarking framework, not through an infrastructure-age advantage. Second, high-income countries such as the United States carry NRW rates of 10 to 30% in many utilities, demonstrating that governance and investment failures are not exclusively a developing-country phenomenon. Third, the physical loss share of NRW ranges from 40 to 85%, reflecting variation in both pipe stock condition and governance, as well as in metering intensity.
Lambert et al. (1999) proposed the Infrastructure Leakage Index (ILI) as a normalized performance measure expressing actual real losses as a multiple of the Unavoidable Annual Real Losses (UARL) [2]. The ILI is defined as:
where CARL is the Current Annual Real Losses (m3/yr) and UARL is the Unavoidable Annual Real Losses (m3/yr).
An ILI value of 1.0 represents best practice; values above 8.0 indicate severely failing systems [2,26]. Most developing-country utilities have ILI values in the range 4.0 to 15.0 [7]. UARL is computed as:
where Lm is the mains length (km); Nc is the number of service connections; Lp is the length of privately owned pipe (km); P is the average operating pressure (m); and UARL is in liters per day [2].
Colombo and Karney (2002) demonstrated that the total cost of leaky pipes (including energy dissipation) substantially exceeds the direct cost of lost water volume alone [27]. Liemberger and Wyatt (2019) estimated the associated global financial cost at approximately USD 39 billion annually [5].
4. Domain A: Infrastructure Deterioration
4.1. Pipe Materials and Aging Mechanisms
Table 2 presents a comparative summary of the seven principal pipe materials in service across global WDNs, reporting the dominant failure mode, N1 leakage exponents from the FAVAD equation, qualitative climate vulnerability, and acoustic detectability. The ratings are synthesized from the cited failure-mode references [1]. No single material performs well across all four dimensions.
Table 2.
Principal pipe materials in water distribution networks: failure modes, N1 values, climate vulnerability, and acoustic detectability. [a] PCCP is a large-diameter transmission main material.
Gray cast iron (GCI), the dominant legacy material in North American and European networks installed before 1960, is highly brittle. Circumferential fractures arise from bending stresses imposed by soil movement; longitudinal splits result from pressure surges or corrosion-induced wall thinning [28]. Statistical failure models consistently show an accelerating break rate with age, becoming marked after 60 to 80 years of service [8].
Asbestos-cement (AC) pipe is subject to calcium leaching that progressively reduces wall thickness. Longitudinal cracking is dominant in soils with sulfate concentrations above approximately 200 mg/L [29]. Most AC units installed during the 1950s to 1970s are now approaching or exceeding their design service life.
PVC does not corrode. Its failure modes are longitudinal splitting from pressure exceedance or joint pullout from soil movement [30]. Ferraiuolo et al. (2020) confirmed that N1 exponents reached 2.3 for PVC, indicating that moderate pressure reductions yield proportionally large leakage reductions in PVC-dominated networks [30].
Polyethylene (PE) exhibits excellent flexibility and fatigue resistance. Its dominant failure mode involves joint failures at electrofusion or butt-welded connections [31]. The very low acoustic transmission velocity of PE substantially impedes correlator-based leak detection [33], a limitation with direct implications for leak detection programs in networks undergoing material transition.
4.2. Soil–Pipe Interaction
Pipe failure is rarely due solely to pipe properties. Rajani and Kleiner (2001) developed comprehensive physically based deterioration models partitioning loading into mechanical, thermal, and corrosion components, demonstrating that soil properties, including stiffness, corrosivity, and moisture content, frequently exceed pipe material properties as determinants of failure timing [32]. Electrochemical corrosion of metallic mains in saturated or sulfate-rich soils can cause wall pitting, reducing pipe strength [29]. Male et al. (1990) demonstrated that pipe break clustering often follows seasonal soil moisture patterns rather than random deterioration processes, with break rate spikes in late summer following extended droughts and in late winter following freeze–thaw transitions [34].
4.3. Pressure–Leakage Mechanics
The FAVAD concept, developed by Lambert et al. (2017) [35] and Schwaller et al. (2015) [36], recognizes that different leak types exhibit different area–pressure relationships. Fixed-area leaks follow Torricellian flow; variable-area leaks in flexible pipes exhibit higher pressure sensitivity because the crack-opening area itself increases with pressure [35,36]. The N1 Power Law expresses the pressure–leakage relationship as:
where QL is the leakage flow rate (m3/s); c is the leak coefficient whose dimensions depend on N1; P is the pressure head (m); and N1 is the dimensionless leakage exponent. Formulation follows [1,2].
Lambert et al. (2017) found that field-measured N1 values range from 0.5 for rigid metallic pipes to 2.0 or more for flexible thermoplastic materials [35]. This material-specific pressure sensitivity is a key variable in optimizing PRV or PAT placement [36,37]. Pressure-driven simulation frameworks that treat leakage as a distributed network variable enable spatial mapping of leakage concentration and support the identification of optimal locations for pressure management devices [38,39].
4.4. Statistical Pipe Failure Models
Predicting pipe failure rates for proactive replacement planning requires statistical models relating break rates to explanatory variables. Shamir and Howard (1979) proposed an exponential model [40]:
where N(t) is the break rate at pipe age t (breaks/km/yr); N0 is the initial break rate at reference age t0; r is an empirical annual growth rate coefficient (yr−1). The coefficient r is fitted to historical break records for each pipe material and soil class.
This model remains in use in many asset management systems despite its inability to account for spatial variability in soil conditions. Rajani and Kleiner (2001) developed physically based deterioration models that partition loading into mechanical, thermal, and corrosion components, providing substantially more accurate failure timing predictions [32]. Boxall et al. (2007) applied a Bayesian hierarchical model to a UK utility, demonstrating that incorporating soil type alongside pipe age correctly identified high-risk segments substantially younger than the network mean [41].
Figure 1 presents all six failure trajectories on a single semi-logarithmic panel. Solid lines represent low-corrosivity (Class 1) conditions; dashed lines represent high-corrosivity (Class 3) conditions. Shaded envelopes show the range of corrosivity sensitivity for each material. GCI exhibits the highest absolute break rates and strongest corrosivity sensitivity. The annotated arrow shows that high corrosivity compresses the age at which GCI reaches 2 breaks per 100 km by approximately 29 years, consistent with the 15-to-30-year compression documented by Kleiner and Rajani (2001) and Rajani and Kleiner (2001). Vertical zone markers distinguish the design life zone (60–80 yr) from the beyond-design-life zone (>80 yr) [8,32]. Furthermore, the horizontal axis is pipe age in years. The vertical axis is the annual break rate per 100 km of main on a logarithmic scale, so a straight line corresponds to constant proportional growth in break rate with age. Solid lines are low-corrosivity Class 1 conditions and dashed lines are high-corrosivity Class 3 conditions for the same material. Shaded envelopes span the range of corrosivity sensitivity for each material. The annotated arrow marks the reduction in the age at which grey cast iron reaches 2 breaks per 100 km when corrosivity rises from Class 1 to Class 3. Vertical markers separate the design life zone of 60 to 80 years from the beyond-design-life zone. The curves illustrate the functional form reported in the cited sources and are not a joint fit to a single dataset.
Figure 1.
Pipe failure acceleration curves by material and soil corrosivity class on a semi-logarithmic scale. The horizontal axis is pipe age in years; the vertical axis is the annual break rate per 100 km of main on a logarithmic scale, so a straight line corresponds to constant proportional growth in break rate with age. Six trajectories are shown, one low-corrosivity (Class 1) and one high-corrosivity (Class 3) case for each of grey cast iron, asbestos cement and unplasticised PVC. Each material is drawn in a single hue: blue for grey cast iron, vermillion for asbestos cement, green for unplasticised PVC. Solid lines are Class 1 and dashed lines are Class 3, and the shaded envelope of the same hue spans the corrosivity range of each material. Unplasticised PVC trajectories begin at 25 years because no earlier service record is available. The horizontal double arrow marks the reduction in the age at which grey cast iron reaches 2 breaks per 100 km when corrosivity rises from Class 1 to Class 3, approximately 29 years, consistent with the 15-to-30-year compression documented by Kleiner and Rajani (2001) [8] and Rajani and Kleiner (2001) [32]. Vertical dotted markers separate the design life zone (60–80 yr) from the beyond-design-life zone (>80 yr). The curves illustrate the functional form reported in the cited sources and are not a joint fit to a single dataset.
5. Domain B: Climate Stress as an Accelerating Driver
The relationship between climate variability and water main failure has been documented operationally for decades. However, the systematic treatment of climate change as a structural accelerator of WDN deterioration remains underrepresented in engineering design standards and asset management frameworks [1,17]. Table 3 presents six climate stressors and their physical mechanisms of interaction with buried pipe infrastructure, together with projected trends under IPCC (2021) AR6 SSP scenarios [17].
Table 3.
Climate change stressors, mechanisms of pipe failure, most affected pipe materials, and projected trends under IPCC (2021) AR6 SSP scenarios [17].
5.1. Drought-Induced Soil Movement
Prolonged drought causes clay soils to shrink volumetrically, resulting in longitudinal differential settlement and loss of uniform bedding support [28]. The resulting bending stress can exceed the tensile capacity of GCI and AC. Wols and van Thienen (2014) modeled the impact of climate change on pipe failure in Dutch drinking water distribution systems [18]. In that work, temperature is the strongest single climatic predictor of failure rate, and soil moisture effects are present but weaker. The lag between a soil moisture deficit and a change in break rate is not resolved there, and no lag value is claimed here. Folkman (2018) reports break rate, age, and material data for water mains across a large sample of United States and Canadian utilities [20].
5.2. Freeze–Thaw and Thermal Cycling
Freeze–thaw cycling imposes two distinct stresses on buried pipes: external ice lens formation, which generates heave forces on the pipe barrel, and internal hydraulic pressure spikes from frozen plugs as thaw progresses. Rajani and Kleiner (2001) modeled thermal stress as a component of total pipe loading, demonstrating significant contribution to failure probability for shallow mains in continental climates [32]. A single extreme cold event preceded by a warm period is more damaging than a sustained cold winter, because the former allows ground frost to penetrate to depths exceeding the pipe burial depth, removing thermal protection. IPCC (2021) projects increased winter temperature variability in mid-latitude North America and Europe under SSP2-4.5 and higher scenarios, meaning freeze–thaw stress may intensify even as mean winter temperatures rise [17].
5.3. Extreme Precipitation and Public Health Implications
Extreme precipitation reduces lateral support for buried pipes through soil saturation and increases the risk of buoyancy uplift for low-density PE and PVC pipes. Boxall et al. (2007) found that burst rates in a UK utility showed a secondary peak following heavy rainfall, distinct from the primary drought-induced peak [41]. Beyond structural damage, Karim et al. (2003) demonstrated the potential for pathogen intrusion through pressure transients associated with main breaks and repairs, linking physical leakage directly to public health risk [42].
5.4. The Climate-Infrastructure Gap
Standards for pipe material selection, trench bedding specification, and pressure rating (including AWWA design manuals and ISO specifications for buried pipelines) were developed under historical climate conditions and have not been systematically updated to reflect projected changes in soil moisture regimes, temperature extremes, or precipitation intensity. Wols and van Thienen (2014) note that climate impacts on pipe failure are not yet reflected in standard asset management planning approaches, and IPCC (2021) underscores that infrastructure standards across sectors remain largely uncalibrated to AR6 projections [17,18]. Utilities planning asset renewal programs based on historical break-rate data will systematically underestimate future failure rates in climate-exposed regions, a compounding risk when combined with the governance failures documented in Section 6.
Figure 2 presents the three climate stress pathways as a structured process diagram, making visible the multi-step causal chain connecting global climate trends to individual pipe breaks [17,18,20,32,41].
Figure 2.
Climate-driven failure pathways to pipe failure and leakage generation in buried water pipes. Boxes are arranged in five tiers: driver, climate stressor, soil-pipe mechanism, failure mode and system outcome. Colour groups the three stress pathways, orange for drought and soil drying, blue for freeze-thaw and thermal cycling and green for extreme precipitation and ground movement, and carries no further meaning. Arrows show the direction of influence between tiers. No quantities are represented.
6. Domain C: Governance and Institutional Gaps
The governance domain encompasses the regulatory, financial, organizational, and political structures that determine whether physically available leakage management capabilities are deployed. Table 4 compares governance frameworks across seven regional contexts, showing the NRW target or observed performance range, metering coverage, the utility accountability mechanism, investment in pipe renewal, and the dominant TDSFF failure domain. A pattern immediately apparent in Table 4 is that the regions with the worst NRW outcomes have Domain C (governance) as the dominant failure domain, not infrastructure age [7,20,23,43]. In which domain A and B describe the states of a physical system and the environment in which it sits. Domain C does not. Governance is the layer of agents, human and institutional, that decides how the system is operated, maintained, and funded. It is organized in levels. Some governance actions are operational, such as the scheduling of leak repair crews. Some are economic, such as tariff setting and capital budgeting. Some are political, such as the statutory mandate under which a utility operates and the electoral horizon of the authority that appoints its board. These levels are not commensurable with one another, and none of them is of the same kind as pipe age or soil moisture content.
Table 4.
Governance frameworks for water distribution across selected regions.
Domain C is therefore not treated in this paper as a variable of the same type as Domain A and Domain B. It is treated as the layer through which the other two are managed. Where a numerical score is assigned to Domain C in Section 9.4, that score serves as a screening device to indicate whether the institutional preconditions for sustained leakage management are present. It is not a measurement of governance quality. It is not a claim that governance can be reduced to a single number on the same axis as physical condition. It is not proposed as a substitute for the analytical hierarchy and multi-criteria decision methods that utilities and regulators use when setting priorities formally, and Section 9.5 quantifies how much of the resulting score is determined by a single binary input.
6.1. Non-Revenue Water Tolerance Norms
Thornton et al. (2008) proposed the Economic Level of Leakage (ELL), defined as the NRW level at which the marginal cost of further reduction equals the marginal value of water saved [43]. In practice, ELL calculations frequently undervalue water by using current supply costs as a proxy for scarcity value rather than long-run marginal costs incorporating source development, energy, and environmental externalities. In water-scarce arid and semi-arid regions, the social scarcity value of water substantially exceeds current tariff levels, meaning utilities maintain leakage levels that are economically rational given their pricing structures but environmentally unsustainable [19,22].
6.2. Delayed Maintenance Cycles
Folkman (2018) reported that the average age of water mains failing in the United States was 47 years, with many utilities reporting failures in pipes over 100 years old [20]. The AWWA (2012) estimated the required capital investment in US drinking water infrastructure renewal at approximately USD 1 trillion over 25 years [44]. The ASCE (2021) gave US drinking water infrastructure a grade of C- in its national infrastructure report card and estimated a substantial annual funding gap between required and actual investment [45]. Bakker (2010) documented the tendency to defer maintenance across both publicly and privately operated utility systems, demonstrating that this pattern is institutional rather than ownership-specific [19]. Electoral cycles systematically favor deferral: the benefits of renewal are long-term and distributed across ratepayers while the costs are immediate.
6.3. Regulatory Frameworks and Accountability
Effective NRW regulation requires transparent performance reporting, binding improvement targets, and meaningful consequences for non-compliance. The UK Ofwat framework represents a well-documented case: utilities submit Asset Management Plans every five years, and NRW performance is incorporated into allowed revenue determinations [43]. By contrast, the United States has no federal NRW standard, no mandatory reporting framework for physical leakage, and voluntary AWWA benchmarking with highly variable uptake [20,44]. The consequence is that high-leakage utilities face no regulatory pressure to reduce losses.
6.4. Financing Structures and Investment Adequacy
Mutikanga et al. (2013) found that the primary constraint on leakage reduction in Sub-Saharan African utilities was financial inability to fund repair and replacement programs [23]. Utilities with tariff revenues insufficient to cover operational costs cannot accumulate reserves for capital renewal, creating a deterioration spiral: increasing leakage raises operating costs, which constrain capital investment, which in turn accelerates deterioration. Criminisi et al. (2009) noted that meter replacement is as important as pipe renewal for NRW reduction, yet meter replacement programs are similarly underfunded [21]. Figure 3 illustrates this as a six-node spiral diagram, with four external intervention pathways: tariff reform, regulatory mandate, grant financing, and institutional reform [7,19,20]. The six nodes in the figure are read clockwise as a reinforcing loop: underpriced water, revenue shortfall, deferred replacement, asset deterioration, breaks and leakage, and rising operation and maintenance cost, which returns to underpriced water. Each arrow denotes a same-direction influence, so an increase at one node increases the next, and the loop has no balancing link. The diagram is a qualitative causal loop representation and carries no parameter values or time constants.
Figure 3.
The deferred maintenance spiral: a six-node self-reinforcing governance failure cycle. Solid arrows mark same-direction influences and carry a plus sign. The loop has no balancing link, which is why it is labelled R for reinforcing. Dashed arrows mark the four external interventions that can break the loop and carry a minus sign at the node on which each acts. Node colour distinguishes positions in the loop and carries no further meaning. The diagram is qualitative and carries no parameter values or time constants.
7. Leakage Detection and Monitoring Technologies
Leakage detection bridges the physical occurrence of pipe failure and the management response. Table 5 presents eight principal detection methods, divided into hardware-based [H] and data-driven [D] categories [11,12,13,33]. The methods with the highest plastic pipe accuracy and the widest network coverage incur the highest implementation costs, a direct constraint for developing-country utilities, where Domain C (governance) is the dominant failure domain.
Table 5.
Leakage detection methods: hardware-based [H] and data-driven [D]. The GPR detection range reflects the depth of a subsurface cavity.
7.1. Acoustic and Vibro-Acoustic Methods
Acoustic correlators compute the leak location from the cross-correlation time delay between noise signals at two locations and the pipe acoustic propagation velocity [33]. The critical limitation is poor performance on plastic pipe: propagation velocities in PE are 10 to 30 times lower than in metallic pipe, progressively reducing the effectiveness of acoustic detection programs as plastic proportions grow. Serafeim et al. (2022) evaluated probabilistic minimum night flow (MNF) estimation as a zone-level alternative for plastic-dominated networks [46]. MNF analysis infers total real losses from nighttime flow measurements at DMA inlet meters and serves as a screening tool to identify zones warranting targeted investigation [47]. Serafeim et al. (2024) recommended the probabilistic MNF method as the most rigorous of the three principal estimation approaches [1].
7.2. Transient-Based Leak Detection
Transient-based leak detection (TBLD) exploits reflections from leak openings generated by deliberately induced hydraulic transients. It is particularly suited for transmission and trunk mains where acoustic methods are impractical [13]. Field validation under realistic operational noise conditions remains a limiting factor for wider adoption.
7.3. Smart Sensor Networks and Machine Learning
Dense IoT sensor networks continuously record pressure, flow, and acoustic noise data at multiple network points. Giudicianni et al. (2020) demonstrated that an adaptive management framework combining real-time sensors, hydraulic modeling, and automated DMA reconfiguration achieved leakage reductions of up to 16% and annual energy recovery of 19 MWh [48]. More recent ML applications have applied deep learning architectures, including graph neural networks, to multi-sensor datasets at network scale [49]. Performance depends directly on sensor network density and training data quality; utilities with sparse networks and limited failure records will achieve limited gains without prior monitoring investment.
8. Leakage Control Strategies
The control strategies reviewed in this section operate primarily within Domain A: they reduce leakage by managing pressure, restructuring network zones, recovering energy, and rehabilitating pipe assets. Their system-level effectiveness depends critically on the governance preconditions of Domain C (investment capacity, regulatory accountability, and monitoring infrastructure). Table 6 and Figure 4 provide comparative summaries [14,15,16,39,48,50].
Table 6.
Pressure management and leakage control strategies. Leakage-reduction ranges are from cited studies; capital costs are indicative.
Figure 4.
Effectiveness of leakage control strategy and relative capital cost. The left panel gives the typical leakage reduction achievable and the right panel the relative capital cost on a four-step ordinal scale from low to very high. Bar colour encodes strategy family, blue for pressure-reducing valve options, orange for monitoring, zoning and energy-recovery options and red for pipe replacement, and carries no further meaning. The italic band labels above the left panel mark low, moderate and high reduction ranges.
8.1. Pressure Management
Pressure management is the most consistently cost-effective leakage control strategy. The physical basis is the N1 power-law relationship in Equation (3): reducing average zone pressure reduces both background leakage and the flow rate through existing leak openings [51,52]. A consistent pattern in Table 6 is that strategies using PATs achieve leakage reductions comparable to those of equivalent PRV installations while generating a net energy benefit. Araujo et al. (2006) demonstrated a 20% reduction in leakage through PRV setting optimization alone [39]. Covelli et al. (2016) extended this to the optimal location and setting of multiple PRVs simultaneously across a network [38].
8.2. District Metered Areas
A DMA is a discrete zone of the distribution network bounded by closed boundary valves and metered at one or more inlet points, enabling continuous monitoring of real loss levels [54]. Karadirek et al. (2012) demonstrated that DMA implementation, combined with pressure management, achieved leakage reductions of up to 30% in a Turkish municipal network [50]. Farley and Trow (2003) established that DMA management must be coupled with active leakage control to deliver sustained results [3].
8.3. Pumps as Turbines and Energy Recovery
Replacing conventional PRVs with pumps operating as turbines (PATs) simultaneously reduces leakage and recovers energy from excess hydraulic pressure. Carravetta et al. (2012) proposed a PAT design methodology for WDN applications [14]. Ávila et al. (2022) demonstrated a leakage reduction of over 120,000 m3 annually and recovery of 34.5 MWh/yr in the Manta (Ecuador) WDN with a baseline NRW of 43% [16]. Giudicianni et al. (2020) integrated PAT operation with dynamic DMA management, achieving 19 MWh/yr of energy recovery and leakage reductions of up to 16% [48]. Nguyen et al. (2020) optimized PAT locations using a MINLP model, achieving daily energy recovery of approximately 1.96 MWh while reducing excess pressure by approximately 50% [55].
8.4. Pipe Rehabilitation and Replacement
Long-term leakage reduction ultimately requires addressing the physical deterioration of the pipe stock. Risk-prioritized replacement strategies consistently deliver higher returns than age-based programs, because age alone is a poor predictor of individual pipe failure when soil conditions vary spatially [8,34]. The PARMS model [31] and simulation in EPANET 2 [56,57] have been widely used to guide rehabilitation prioritization by mapping leakage concentration spatially.
Figure 4 presents a side-by-side comparison of the achievable leakage reduction and the relative capital cost for 10 strategies [14,15,16,39,48,50]. Fixed-outlet and time-modulated PRVs provide moderate reductions at low capital cost; full pipe replacement provides the highest reduction at very high cost. PAT plus DMA adaptive management represents a favorable intermediate option, achieving a 35% reduction at high (but not the highest) capital cost while recovering energy that partially offsets the investment.
9. The Three-Domain Systems Failure Framework (TDSFF)
9.1. Framework Structure
Three distinct bodies of evidence confirm that no single failure domain fully explains observed leakage levels. In Domain A, Folkman (2018) documents accelerating break rates well beyond design life, and Kleiner and Rajani (2001) demonstrate that physical deterioration is governed by the interaction of material, age, and soil environment, not age alone [8,20]. In Domain B, Wols and van Thienen (2014) model the effect of climatic variables on pipe failure rate in Dutch drinking water distribution systems and IPCC (2021) projects intensification of every stress pathway in Table 3 [17,18]. In Domain C, AWWA (2012) and ASCE (2021) document a capital renewal requirement of approximately USD 1 trillion over 25 years in the United States alone, while Bakker (2010) and Kingdom et al. (2006) show that governance failure produces deferred maintenance regardless of utility ownership model or income level [7,19,44,45]. No single domain alone accounts for the global pattern in Table 1; it is their interaction that the TDSFF captures.
The TDSFF posits that observed leakage in any WDN is a function of three interacting variables. Domain A (Infrastructure) represents the physical state of the pipe asset: material, age, condition, and pressure environment. Domain B (Climate) represents the external stress environment imposed by changing soil conditions, temperature variability, and precipitation patterns. Domain C (Governance) represents the institutional capacity and regulatory incentive structure that determines whether physical deterioration is detected, repaired, and prevented through renewal investment.
The three-part division used here is not new in itself. Technology, environment, and institutions form an organizing triad in socio-ecological systems research and the infrastructure resilience literature. The contribution claimed for the TDSFF is narrower and operational rather than ontological. It has three parts. First, the triad is instantiated for one specific failure outcome, leakage from water distribution networks, with the mechanisms of each domain specified at the level of pipe material, soil condition, and pressure regime rather than at the level of general system properties. Second, each domain is given a small indicator set drawn from data that utilities already hold, enabling classification without new data collection. Third, an explicit decision rule is supplied that returns exactly one classification for any input. General triadic frameworks describe interacting subsystems but do not supply a rule of this kind. A reader who already works with a technology-environment-institution framing should read the TDSFF as a leakage-specific operationalization of that framing, rather than a competing account of how infrastructure systems fail.
The boundary of the claim should also be stated. Because Domain C is an agent layer rather than a state variable, as set out in Section 6, placing it on a common axis with Domain A and Domain B is a simplification adopted for screening. The framework is presented as a proposal to be tested. Section 9.4 is a candidate protocol, not a validated instrument, and Section 9.5 reports how far its outputs depend on conventions rather than findings.
Figure 5 illustrates the TDSFF as a Venn diagram. The pairwise intersection zones are labeled with the compound failure conditions arising when two domains co-occur. The central red zone represents the compound failure condition in which all three domains are simultaneously active and mutually reinforcing. Furthermore, the dominant intervention priority for each zone is as follows. Domain A alone: risk-based pipe replacement and pressure management. Domain B alone: climate-adjusted design standards and revised material selection. Domain C alone: metering, reporting requirements, and tariff reform. Zone A + B: climate-adjusted service-life projections and advanced replacement scheduling. Zone A + C: risk-based replacement paired with tariff reform and regulatory accountability. Zone B + C: monitoring and institutional capacity built ahead of deterioration. Compound zone A + B + C: all three tracks in parallel, normally requiring external finance. Domain C is drawn as a circle of equal size for legibility only. As Section 6 explains, it is an agent layer rather than a third state variable, and the equal areas in this diagram should not be read as a claim of equivalence.
Figure 5.
The Three-Domain Systems Failure Framework (TDSFF). Domain A: Infrastructure Deterioration; Domain B: Climate Stress; Domain C: Governance Failure. Each domain is one circle, blue for Domain A, green for Domain B and orange for Domain C. Labelled boxes name the three pairwise intersection zones and the central red disc marks the compound zone in which all three domains are simultaneously active. Circle areas are equal for legibility only and are not a claim of equivalence between the domains.
9.2. Pairwise Interaction Zones
The interaction zones described below use the vocabulary of the sources reviewed in Section 4, Section 5 and Section 6. That evidence is almost entirely observational. It consists of utility break records, cross-sectional comparisons between utilities and between countries, and case descriptions. None of the studies cited employs a design capable of identifying a causal effect, such as a randomized intervention, a natural experiment arising from a regulatory change, or an instrumental variable strategy. Verbs such as ‘produces’, ‘drives’, and ‘accelerates’ should therefore be read as describing a documented association together with a physically plausible mechanism. They should not be read as claims that a causal effect has been estimated. Confounding by pipe age, material, burial depth, and operating pressure cannot be excluded from utility break records, and confounding by national income cannot be excluded from cross-country governance comparisons. Section 10 identifies the study designs required to convert these associations into effect estimates.
9.2.1. Zone A + B: Physical Stress Amplification
When both Domain A and Domain B are elevated, but Domain C is adequate, the dominant failure dynamic is accelerated physical deterioration. The combination produces nonlinear acceleration of the failure rate, as demonstrated by the diverging curves in Figure 1 for pipes in high-corrosivity soil environments. The governing intervention priority is to update asset management plans to incorporate climate-adjusted service-life projections and to advance replacement scheduling for the material-soil combinations most vulnerable to the dominant local climate stressor in Table 3.
9.2.2. Zone A + C: Deferred Maintenance Spiral
When both Domain A and Domain C are elevated, the system enters the deferred maintenance spiral illustrated in Figure 3. This is the most common documented pairwise failure configuration in middle-income country utilities [7,19]. Risk-based replacement prioritization must be paired with tariff reform and regulatory accountability; neither intervention alone is sufficient.
9.2.3. Zone B + C: Emerging Climate Vulnerability
When both Domain B and Domain C are elevated, but Domain A infrastructure has not yet severely deteriorated, the system is at risk of rapid future deterioration as climate stress outpaces institutional adaptive capacity. The governing intervention priority is building monitoring capacity and governance infrastructure before the infrastructure deteriorates, as the window for proactive management is narrower in this zone than in any other. This zone also contains feedback that the framework, as drawn, does not represent. Climate stress does not act only on the pipe. It acts on the institution as well. Drought raises the marginal cost of supply and the political salience of visible losses, while reducing billed volumes and, in turn, revenue for utilities that recover costs through volumetric tariffs. Repair demand rises during and after extreme events, diverting crews and the operating budget from planned renewal. Flooding and power interruption disrupt the metering and telemetry record on which leakage estimation depends, so the quality of the evidence available to managers falls at the moment it is most needed. Governance also moderates the climate-to-infrastructure pathway rather than simply sitting alongside it. Two utilities exposed to the same soil moisture deficit will not experience the same increase in leakage if one operates an active detection program with a funded renewal budget, while the other does not. Neither the feedback nor the moderation is represented in the additive scoring of Section 9.4, and this is a known limitation of that protocol.
9.2.4. Compound Zone A + B + C
The compound failure condition occurs when all three domains are simultaneously elevated [7]. Kingdom et al. document cases of severe and sustained utility performance failure in which all three domains were concurrently present. Without external intervention through international financing, emergency capital mobilization, or binding governance reform, compound failure systems tend to deteriorate progressively toward a state in which service delivery is no longer reliably maintained. Two conditions should be distinguished at this point. Performance failure means that a utility continues to operate while losing a large and increasing share of the water it supplies. Catastrophic breakdown means loss of supply continuity or structural failure of the network. The evidence reviewed in this paper concerns the first condition. The word collapse is not used here in the second sense.
9.3. Three Primary Failure Configurations
Infrastructure-dominant failure occurs when the pipe stock is old and deteriorating, climate exposure is moderate, and governance is adequate but cannot keep pace with the renewal investment gap. This configuration is common in US and Eastern European utilities with large legacy GCI or AC pipe inventories. The appropriate intervention is targeted pipe replacement guided by risk models, complemented by pressure management.
Climate-amplified failure occurs when the pipe stock is aging, climate stress is intensifying, and governance is moderate, but infrastructure design standards have not kept pace. This configuration is emerging in Mediterranean climates, Australian cities, and parts of the Middle East and North Africa. The appropriate intervention includes updating design standards and revising replacement prioritization to weight climate-exposed materials and soil types more heavily.
Governance-dominant failure occurs when the pipe stock condition is unknown or poorly characterized, monitoring is sparse, regulatory accountability is absent or weak, and financing for maintenance and renewal is chronically inadequate. This configuration is most common in Sub-Saharan African and South Asian utilities. However, elements of it are present in many mid-size utilities in the United States and Latin America. The primary intervention must be institutional: establishing reliable metering and data management, implementing NRW reporting requirements, and reforming tariff structures to generate investment-grade revenue.
9.4. Operational Classification Protocol
The following four-step protocol enables practitioners to classify a specific utility context within the TDSFF using data routinely available to utility operators.
9.4.1. Step 1: Collect Domain Indicators
Three indicators are collected for each domain (nine total). Domain A: I-A1, weighted mean pipe age (years); I-A2, annual break rate (breaks per 100 km per year); I-A3, the ILI. Domain B: I-B1, soil shrink-swell susceptibility index (0 to 1 from national soil survey data); I-B2, coefficient of variation in mean annual precipitation from the 30-year climate record; I-B3, projected percentage change in the 10-year return period extreme precipitation event by 2050 from downscaled IPCC (2021) AR6 projections [17]. Domain C: I-C1, binary indicator of whether a binding NRW regulatory target is enforced (score = 1 if absent, 0 if enforced); I-C2, inverse renewal pressure indicator, computed as 1 minus the annual pipe renewal rate as a percentage of total network length; I-C3, proportion of connections without functional meters (percentage). Two limits of the Domain C indicator set should be stated at the point of use. The three indicators are proxies for management performance. They record whether a target exists, whether assets are being renewed, and whether consumption is measured. They do not measure regulatory independence, public accountability, or stakeholder participation, which are the structural properties that determine whether those management behaviors persist across changes in government or in utility leadership. Two utilities with identical values on I-C1 to I-C3 can differ substantially on those properties. The three indicators were selected because they are available in comparable form across every regional context in Table 4.
In contrast, comparable cross-national measures of regulatory independence for water utilities are not. This is a compromise imposed by data availability. It is not a claim that governance reduces to these three quantities, and Section 10 identifies the construction of comparable structural governance indicators as a research priority.
9.4.2. Step 2: Normalize and Score
Each indicator is normalized to a 0–1 scale relative to defined reference values (1 = most severe; 0 = best practice). Reference values: I-A1 against 80 years [8]; I-A2 against 10 breaks per 100 km per year [20]; I-A3 against ILI = 8.0; I-B1 against susceptibility index of 0.8; I-B2 against coefficient of variation of 0.6; I-B3 against projected increase of 30% [17]; I-C1 scored 0 or 1 directly; I-C2 against reference annual renewal rate of 0.5% of total network length per year [44,45], with a utility replacing 1% per year scoring I-C2 = 0.50; I-C3 against 60% unmetered connections. Indicators exceeding their reference value are capped at 1.0. Each domain score (S-A, S-B, S-C) is the arithmetic mean of its three normalized indicators.
The reference values used in this step are conventions, and the basis for each is stated here so that a user can substitute local values. The value of 80 years for I-A1 corresponds to the upper end of the nominal service life assumed for grey cast iron and asbestos cement mains in the deterioration literature reviewed in Section 4. The value of 10 breaks per 100 km per year for I-A2 is an order of magnitude above the break rate at which utilities in the break rate literature are consistently described as facing a renewal problem rather than a maintenance problem. The value of 8.0 for I-A3 is the upper bound of the highest band in common Infrastructure Leakage Index banding practice, above which a network is treated as having severe real losses. The value of 0.5 percent per year for I-C2 is approximately the renewal rate implied by a 200-year replacement cycle, which is close to observed practice in several high-income systems and far below the rate implied by nominal asset life. None of these values is derived from an optimization, and none is claimed to be optimal. They are reported as defaults.
Equal weighting of indicators within a domain is also a convention, and it is not defended as correct. The point that shrink-swell risk may matter more than pipe age in some settings, and that break rate may matter more than the Infrastructure Leakage Index in others, is accepted. Unequal weights would be preferable wherever a utility holds local evidence on relative importance, and analytical hierarchy and other multi-criteria methods provide established procedures for eliciting such weights from expert or stakeholder judgment. Equal weighting is used here for two reasons. There is no published cross-utility evidence base from which a common weight vector could be estimated. Any weight vector chosen without such a base would embed an unstated judgment while appearing precise. In contrast, equal weighting states the judgment openly and leaves it visible for a user to override. The consequences of this choice are examined in Section 9.5.
9.4.3. Step 3: Classify
Classification proceeds through two sequential tests. Test 1 (Compound): if all three domain scores exceed 0.50, the context is classified as compound. This test takes precedence. Test 2 (Single-domain vs. Pairwise): if the compound condition is not met and the highest domain score exceeds the second-highest by more than 0.20, the classification is single-domain. In all remaining cases, the classification is pairwise, naming the two highest-scoring domains. This ordering is exhaustive and produces exactly one classification outcome. Utilities with longer local records may recalibrate thresholds.
The two thresholds in this step are conventions of the same kind. The compound threshold of 0.50 places the boundary at the midpoint of the normalized scale, so that a domain is considered active when its score is closer to the reference severe value than to the best practice value. The separation threshold of 0.20 requires a leading domain to exceed the next domain by one-fifth of the full scale before a single domain is named dominant. Neither value is derived from data on classification accuracy because no dataset exists linking TDSFF classifications to subsequent intervention outcomes. Section 9.5 reports how the distribution of classification outcomes changes when both thresholds are varied, and shows that the two thresholds control different parts of the decision and can be recalibrated independently.
9.4.4. Step 4: Direct Intervention
The classification determines the primary intervention priority as described in Section 9.2 and Section 9.3. The protocol provides a structured first-pass diagnostic to prioritize investigation and investment, followed by domain-specific technical assessment using the methods reviewed in Section 4, Section 5, Section 6, Section 7 and Section 8.
9.5. Illustrative Application and Threshold Sensitivity
This section applies the four steps to a single illustrative utility and then examines how far the outcome depends on the thresholds. The utility is not a named system. Its indicator values are indicative values chosen to be consistent with the ranges reported for arid Middle East and North Africa contexts in Table 1 and Table 4. The purpose is to demonstrate the protocol’s arithmetic and expose its behavior. It is not to diagnose a real network. Application of named utilities to verified data and comparison of the resulting classifications with subsequent intervention outcomes is the validation step the protocol has not yet undergone. It is listed in Section 10.
The illustrative utility is a mid-size network in an arid climate. It has an aging but not antique pipe stock, a break rate above the reference value, an Infrastructure Leakage Index in the upper band, high interannual rainfall variability, no binding regulatory target for non-revenue water, a renewal program running at more than twice the reference rate, and a quarter of connections unmetered. Step 1 collects the nine indicators, and Step 2 normalizes each indicator against its reference value. Table 7 reports both.
Step 3 applies the two tests in order. Test 1 asks whether all three domain scores exceed 0.50. Here S-A is 0.700, S-B is 0.683, and S-C is 0.611, so Test 1 is satisfied, and the classification is compound. Test 2 is not reached. Step 4 then directs the practitioner to the compound zone discussion in Section 9.2, which indicates that no single intervention track is sufficient and that renewal scheduling, climate-adjusted design review, and the establishment of a binding target must proceed together rather than in sequence.
The classification is not robust, and the example is retained partly because of that. S-C exceeds the compound threshold by 0.111, and 0.333 of that score comes from a single binary indicator. If the same utility raised its renewal rate to 2.0 percent of network length per year and reduced unmetered connections to 15 percent, I-C2 and I-C3 would each fall to 0.250, and S-C would fall to exactly 0.500. Test 1 would then fail, and the classification would move to Test 2. The two highest scores would be S-A at 0.700 and S-B at 0.683, a separation of 0.017, which is far below the 0.20 threshold. The classification would become the pairwise combination of infrastructure and climate, which is the dominant domain pairing recorded for the corresponding regional row in Table 4. The example therefore reaches two different conclusions based on two governance quantities, while all physical and climatic indicators remain unchanged.
Three structural properties of the protocol follow from its definitions and hold independently of any dataset. First, I-C1 is binary and enters a three-indicator mean, so a utility without a binding target cannot score S-C below 0.333 however well it renews and meters. A utility with a binding target cannot score above 0.667 however badly it performs. One binary variable therefore fixes a third of the governance score in both directions. Second, I-A2 is capped at a break rate of 10 per 100 km per year. Hence, the indicator saturates across much of the range of utilities the framework is intended to serve, and above that rate S-A cannot distinguish a struggling network from a failing one. Third, each domain score is the mean of three bounded indicators, so domain scores are compressed toward the middle of the scale relative to the indicators themselves. This makes the separation test harder to satisfy, and pairwise classification is the most frequent outcome.
The third property was examined numerically. Nine indicators were independently drawn from a uniform distribution on the unit interval; the three domain scores were computed as their within-domain means; and the classification rule was applied. Two million draws were used. The simulation was implemented in Python 3.12.3. This reference model is not an empirical distribution of utility characteristics. Real indicators are correlated within and across domains, and no dataset exists from which the joint distribution can be estimated. The model serves only to show how the decision rule partitions the space of possible inputs, a property of the rule rather than of any utility population. Under the thresholds specified in Step 3, the protocol returns compound in 12.5 percent of cases, single-domain in 25.1 percent, and pairwise in 62.4 percent of cases. Table 8 reports the same shares across a grid of threshold values.
Table 8.
Classification shares under the reference model as both thresholds are varied. Nine indicators drawn independently from a uniform distribution on the unit interval, two million draws. The bold row is the threshold pair specified in Step 3.
Two features of Table 8 are relevant to practice. The compound share is governed almost entirely by the compound threshold and is unaffected by the separation threshold, as the definition of Test 1 requires. Moving the compound threshold from 0.50 to 0.40 raises the compound share from 12.5 percent to 36.7 percent, and moving it to 0.60 lowers it to 2.3 percent. A change of one tenth of the scale therefore changes the frequency of a compound diagnosis by roughly a factor of three in one direction and a factor of five in the other. The separation threshold governs only the division of the remainder between single-domain and pairwise outcomes, where moving from 0.20 to 0.10 raises the single-domain share from 25.1 percent to 51.4 percent. A utility that recalibrates the protocol is therefore making two independent choices: how readily compound failure is declared, and how readily a single dominant domain is named. The two can be set separately.
The influence of the binary governance indicator was examined in the same way. Holding the other eight indicators uniform, the probability that S-C exceeds 0.50 is 0.876 when no binding non-revenue water target is in force and 0.125 when one is. The share of cases classified as compound rises from 3.1 percent to 21.9 percent on that variable alone. Whether a utility operates under a binding target therefore has more influence on its TDSFF classification than any other single input. This is defensible if the presence of a binding target is genuinely the strongest available signal of institutional capacity, and it is a defect if it is not. The question is empirical and is unresolved. Until it is resolved, users of the protocol should report the three Domain C indicator values alongside the classification rather than reporting the classification alone.
The sensitivity results also bear on the equal weighting question raised in Step 2. Because I-C1 is binary while I-C2 and I-C3 are continuous, equal nominal weighting does not deliver equal influence. The binary indicator has disproportionate leverage precisely because it takes only its extreme values. Any utility applying the protocol with local weights should therefore consider the range each indicator actually spans in its own data, not only the weight assigned to it.
10. A Research Agenda
The synthesis identifies eleven research gaps. They are presented as a catalog of themes, not as a ranked list. The order below reflects the literature set out in Section 4, Section 5, Section 6, Section 7 and Section 8. It is not a validated prioritization and should not be treated as one. Prioritization among research or investment options is itself a multi-criteria problem, and utilities, regulators, and funding bodies that undertake it formally use analytical hierarchy and multi-criteria decision methods with explicit and elicited stakeholder weights. No such procedure was applied here, and the documented deficiencies in current practice reported in Section 4, Section 5, Section 6, Section 7 and Section 8 are not by themselves sufficient to establish a ranking. One item applies to all the others and is stated separately for that reason. Validation of the classification protocol proposed in Section 9.4 through application to utilities with verified indicator data and comparison of the resulting classifications with subsequent intervention outcomes is a precondition for operational use of that protocol. Section 9.5 shows that its outputs shift with threshold values that are conventions rather than findings, and that a single binary governance indicator carries disproportionate leverage.
- Climate-adjusted pipe failure rate models. No widely adopted model incorporates projected changes in soil moisture regimes or temperature extremes as forward-looking inputs [18,32]. Developing and validating climate-adjusted failure rate models is the highest technical priority for utilities in drought-exposed and thermally variable regions.
- Acoustic detection for plastic pipe materials. The acoustic detection gap for PE and uPVC [33] (Table 5) remains unresolved. Distributed fiber optic sensing and enhanced correlator algorithms for low-velocity media require field validation in operational networks.
- Governance-technical interface research. Comparative longitudinal studies of utility reform trajectories across TDSFF Domain C classifications are needed to identify transferable institutional interventions.
- Quantitative causal modeling of governance failure and NRW outcomes. Quantitative causal models (using panel data, natural experiments from regulatory reforms, or instrumental variable approaches) are needed to establish the magnitude of governance failure as an independent driver of NRW persistence, distinct from infrastructure-age effects.
- Scarcity-adjusted leakage thresholds. The Economic Level of Leakage [43] requires reformulation to incorporate full social scarcity costs of water, particularly in arid regions where current ELL calculations systematically undervalue leaked water.
- Stochastic optimization of PATs under variable demand. Existing PAT siting models [55,58] optimize under average-demand conditions; stochastic approaches are needed to maximize performance across the full demand distribution.
- Digital twin integration for real-time leakage management. Digital twin frameworks hold substantial promise for integrating hydraulic simulation, sensor data, and machine learning [48,49], but city-scale computational and data requirements require further research.
- Detection protocols for developing-country contexts. While AL-Washali et al. (2018) have provided foundational MNF analysis for intermittent supply, operational field-deployable detection protocols for sparse-instrumentation networks remain unavailable [47]. This is a priority for governance-dominant failure contexts in Table 4.
- Spatial soil corrosivity mapping for asset management. Integration of soil electrochemical databases with utility asset management systems and the Domain A indicator framework would substantially improve the accuracy of failure prediction models.
- Public health consequences of leakage events. Karim et al. (2003) indicated the potential for pathogen intrusion through negative pressure transients during burst events [42]. The public health dimension of leakage warrants systematic reassessment using modern microbial monitoring methods.
- Long-term evaluation of leakage reduction interventions. Most published case studies report performance over periods of 12 months or less. Long-term NRW trajectory studies over 5 to 10 years across different TDSFF failure configurations are needed to assess durability and identify factors associated with regression.
11. Conclusions
This review sets out to answer a specific question: why does leakage from water distribution networks persist at high levels globally despite decades of technical progress? The answer, supported by 58 sources reviewed across infrastructure, climate, and governance studies, is that the dominant framing of leakage as an engineering problem is structurally inadequate. Leakage is not principally a pipe problem. It is the visible outcome of three interacting failure systems that existing technical reviews address only in part.
By explicitly naming governance failure (Domain C) as a driver alongside infrastructure deterioration (Domain A) and climate stress (Domain B), the TDSFF provides a diagnostic language for explaining why technically successful interventions do not translate into system-level NRW reduction in many utility contexts. These interventions are deployed into governance systems that lack the institutional capacity to sustain them.
The climate stress domain represents the most underappreciated finding of this review. IPCC (2021) projections point consistently to soil moisture changes, increased temperature variability, and intensified extreme precipitation in regions where WDN infrastructure is both oldest and most heavily relied upon. Engineering design standards have not incorporated these projections [17]. Utilities planning 20-year asset renewal programs based on historical break-rate data systematically underestimate future maintenance needs, and this underestimation compounds governance failure.
The operational classification protocol in Section 9.4 is intended to make the TDSFF actionable. Practitioners can apply the nine-indicator protocol to classify their context and direct resources to the highest-leverage intervention domain. Future research should validate and refine this protocol through systematic application across diverse utility contexts. Advancing global leakage reduction requires addressing all three domains simultaneously, with collaboration between engineers, institutional economists, regulatory specialists, and climate scientists.
Four limits of this contribution should be stated plainly. First, the TDSFF is proposed rather than validated. No dataset yet links a TDSFF classification to a subsequent intervention outcome, so the diagnostic value of the framework is argued based on the coherence of the evidence reviewed rather than demonstrated by results. Second, the classification protocol in Section 9.4 is a candidate instrument. Section 9.5 shows that its outputs move with threshold values that are conventions, and that one binary governance indicator carries more influence on the outcome than any other input. Third, Domain C is not a variable of the same kind as Domain A and Domain B. It is the agent layer through which the other two are managed; it operates across operational, economic, and political levels that are not commensurable with one another, and scoring them on a common scale is a screening simplification adopted here for operational convenience rather than a claim about their nature. Fourth, the relationships described between the domains rest on observational evidence and are reported as associations. The agenda in Section 10 sets out the study designs needed to establish effects, and the validation of the protocol itself is a precondition for its use in practice.
Funding
This research received no external funding.
Data Availability Statement
This is a structured literature review. No primary datasets were generated. All data are drawn from published sources cited in the reference list.
Conflicts of Interest
The author declares no conflict of interest.
References
- Serafeim, A.V.; Fourniotis, N.T.; Deidda, R.; Kokosalakis, G.; Langousis, A. Leakages in water distribution networks: Estimation methods, influential factors, and mitigation strategies—A comprehensive review. Water 2024, 16, 1534. [Google Scholar] [CrossRef] [Scilit]
- Lambert, A.; Brown, T.G.; Takizawa, M.; Weimer, D. A review of performance indicators for real losses from water supply systems. J. Water Supply Res. Technol. AQUA 1999, 48, 227–237. [Google Scholar] [CrossRef] [Scilit]
- Farley, M.; Trow, S. Losses in Water Distribution Networks; IWA Publishing: London, UK, 2003. [Google Scholar]
- Alegre, H.; Baptista, J.M.; Cabrera, E., Jr.; Cubillo, F.; Duarte, P.; Hirner, W.; Merkel, W.; Parena, R. Performance Indicators for Water Supply Services, 3rd ed.; IWA Publishing: London, UK, 2016. [Google Scholar]
- Liemberger, R.; Wyatt, A. Quantifying the global non-revenue water problem. Water Supply 2019, 19, 831–837. [Google Scholar] [CrossRef] [Scilit]
- Puust, R.; Kapelan, Z.; Savic, D.; Koppel, T. A review of methods for leakage management in pipe networks. Urban Water J. 2010, 7, 25–45. [Google Scholar] [CrossRef] [Scilit]
- Kingdom, B.; Liemberger, R.; Marin, P. The Challenge of Reducing Non-Revenue Water in Developing Countries—How the Private Sector Can Help: A Look at Performance-Based Service Contracting; Water Supply and Sanitation Sector Board Discussion Paper Series, Paper No. 8; World Bank: Washington, DC, USA, 2006. [Google Scholar]
- Kleiner, Y.; Rajani, B. Comprehensive review of structural deterioration of water mains: Statistical models. Urban Water 2001, 3, 131–150. [Google Scholar] [CrossRef] [Scilit]
- Germanopoulos, G. A technical note on the inclusion of pressure dependent demand and leakage terms in water supply network models. Civ. Eng. Syst. 1985, 2, 171–179. [Google Scholar] [CrossRef] [Scilit]
- van Zyl, J.E.; Clayton, C.R.I. The Effect of Pressure on Leakage in Water Distribution Systems. In Proceedings of the Institution of Civil Engineers-Water Management; Thomas Telford Ltd.: London, UK, 2007; Volume 160, pp. 109–114. [Google Scholar]
- Mounce, S.R.; Khan, A.; Wood, A.S.; Day, A.J.; Widdop, P.D.; Machell, J. Sensor-fusion of hydraulic data for burst detection and location in a treated water distribution system. Inf. Fusion 2003, 4, 217–229. [Google Scholar] [CrossRef] [Scilit]
- Li, R.; Huang, H.; Xin, K.; Tao, T. A review of methods for burst/leakage detection and location in water distribution systems. Water Sci. Technol. Water Supply 2015, 15, 429–441. [Google Scholar] [CrossRef] [Scilit]
- Colombo, A.F.; Lee, P.; Karney, B.W. A selective literature review of transient-based leak detection methods. J. Hydro-Environ. Res. 2009, 2, 212–227. [Google Scholar] [CrossRef] [Scilit]
- Carravetta, A.; Del Giudice, G.; Fecarotta, O.; Ramos, H.M. Energy production in water distribution networks: A PAT design strategy. Water Resour. Manag. 2012, 26, 3947–3959. [Google Scholar] [CrossRef] [Scilit]
- Patelis, M.; Kanakoudis, V.; Gonelas, K. Combining pressure management and energy recovery benefits in a water distribution system installing PATs. J. Water Supply Res. Technol. AQUA 2017, 66, 520–527. [Google Scholar] [CrossRef] [Scilit]
- Ávila, C.A.M.; Sánchez-Romero, F.-J.; López-Jiménez, P.A.; Pérez-Sánchez, M. Improve leakage management to reach sustainable water supply networks through by green energy systems. Optimized case study. Sustain. Cities Soc. 2022, 83, 103994. [Google Scholar] [CrossRef] [Scilit]
- Intergovernmental Panel on Climate Change (IPCC). Climate Change 2021: The Physical Science Basis, Contribution of Working Group I to the Sixth Assessment Report of the Intergovernmental Panel on Climate Change; Cambridge University Press: Cambridge, UK; New York, NY, USA, 2021. [Google Scholar]
- Wols, B.; van Thienen, P. Predicting the Impact of Climate Change on Pipe Failure in Drinking Water Distribution Systems. In Proceedings of the International Conference on Hydroinformatics, New York, NY, USA, 17–21 August 2014. [Google Scholar]
- Bakker, K. Privatizing Water: Governance Failure and the World’s Urban Water Crisis; Cornell University Press: Ithaca, NY, USA, 2010. [Google Scholar]
- Folkman, S. Water Main Break Rates in the USA and Canada: A Comprehensive Study. Mechanical and Aerospace Engineering Faculty Publications. 2018. Available online: https://digitalcommons.usu.edu/mae_facpub/174 (accessed on 11 May 2026).
- Criminisi, A.; Fontanazza, C.M.; Freni, G.; Loggia, G.L. Evaluation of the apparent losses caused by water meter under-registration in intermittent water supply. Water Sci. Technol. 2009, 60, 2373–2382. [Google Scholar] [CrossRef] [Scilit]
- Islam, M.S.; Babel, M.S. Economic analysis of leakage in the Bangkok water distribution system. J. Water Resour. Plan. Manag. 2013, 139, 209–216. [Google Scholar] [CrossRef] [Scilit]
- Mutikanga, H.E.; Sharma, S.K.; Vairavamoorthy, K. Methods and tools for managing losses in water distribution systems. J. Water Resour. Plan. Manag. 2013, 139, 166–174. [Google Scholar] [CrossRef] [Scilit]
- Lambert, A.O. International report: Water losses management and techniques. Water Sci. Technol. Water Supply 2002, 2, 1–20. [Google Scholar] [CrossRef] [Scilit]
- Beuken, R.; Lavooij, C.; Bosch, A.; Schaap, P. Low Leakage in the Netherlands Confirmed. In Proceedings of the Water Distribution Systems Analysis Symposium 2006, Cincinnati, OH, USA, 27–30 August 2006; pp. 1–8. [Google Scholar]
- Winarni, W. Infrastructure Leakage Index (ILI) as water losses indicator. Civ. Eng. Dimens. 2009, 11, 126–134. [Google Scholar]
- Colombo, A.F.; Karney, B.W. Energy and costs of leaky pipes: Toward comprehensive picture. J. Water Resour. Plan. Manag. 2002, 128, 441–450. [Google Scholar] [CrossRef] [Scilit]
- Rajani, B.; Makar, J. A methodology to estimate remaining service life of grey cast iron water mains. Can. J. Civ. Eng. 2000, 27, 1259–1272. [Google Scholar] [CrossRef] [Scilit]
- Hu, Y.; Hubble, D. Factors contributing to the failure of asbestos cement water mains. Can. J. Civ. Eng. 2007, 34, 608–621. [Google Scholar] [CrossRef] [Scilit]
- Ferraiuolo, R.; De Paola, F.; Fiorillo, D.; Caroppi, G.; Pugliese, F. Experimental and numerical assessment of water leakages in a PVC-A pipe. Water 2020, 12, 1804. [Google Scholar] [CrossRef] [Scilit]
- Burn, S.; Tucker, S.; Rahilly, M.; Davis, P.; Jarrett, R.; Po, M. Asset planning for water reticulation systems-the PARMS model. Water Sci. Technol. Water Supply 2003, 3, 55–62. [Google Scholar] [CrossRef] [Scilit]
- Rajani, B.; Kleiner, Y. Comprehensive review of structural deterioration of water mains: Physically based models. Urban Water 2001, 3, 151–164. [Google Scholar] [CrossRef] [Scilit]
- Hunaidi, O.; Chu, W.T. Acoustical characteristics of leak signals in plastic water distribution pipes. Appl. Acoust. 1999, 58, 235–254. [Google Scholar] [CrossRef] [Scilit]
- Male, J.W.; Walski, T.M.; Slutsky, A.H. Analyzing water main replacement policies. J. Water Resour. Plan. Manag. 1990, 116, 362–374. [Google Scholar] [CrossRef] [Scilit]
- Lambert, A.; Fantozzi, M.; Shepherd, M. CCWi2017: F100‘Pressure: Leak Flow Rates Using FAVAD: An Improved Fast-Track Practitioner’s Approach’; The University of Sheffield: Sheffield, UK, 2017. [Google Scholar]
- Schwaller, J.; Van Zyl, J.; Kabaasha, A. Characterising the pressure-leakage response of pipe networks using the FAVAD equation. Water Sci. Technol. Water Supply 2015, 15, 1373–1382. [Google Scholar] [CrossRef] [Scilit]
- Cimorelli, L.; D’Aniello, A.; Cozzolino, L.; Pianese, D. Leakage reduction in WDNs through optimal setting of PATs with a derivative-free optimizer. J. Hydroinform. 2020, 22, 713–724. [Google Scholar] [CrossRef] [Scilit]
- Covelli, C.; Cozzolino, L.; Cimorelli, L.; Della Morte, R.; Pianese, D. Optimal location and setting of PRVs in WDS for leakage minimization. Water Resour. Manag. 2016, 30, 1803–1817. [Google Scholar] [CrossRef] [Scilit]
- Araujo, L.; Ramos, H.; Coelho, S. Pressure control for leakage minimisation in water distribution systems management. Water Resour. Manag. 2006, 20, 133–149. [Google Scholar] [CrossRef] [Scilit]
- Shamir, U.; Howard, C.D. An analytic approach to scheduling pipe replacement. J. Am. Water Work. Assoc. 1979, 71, 248–258. [Google Scholar] [CrossRef] [Scilit]
- Boxall, J.; O’Hagan, A.; Pooladsaz, S.; Saul, A.; Unwin, D. Estimation of Burst Rates in Water Distribution Mains. In Proceedings of the Institution of Civil Engineers—Water Management; Thomas Telford Ltd.: London, UK, 2007; Volume 160, pp. 73–82. [Google Scholar]
- Karim, M.R.; Abbaszadegan, M.; LeChevallier, M. Potential for pathogen intrusion during pressure transients. J. Am. Water Work. Assoc. 2003, 95, 134–146. [Google Scholar] [CrossRef] [Scilit]
- Thornton, J.; Sturm, R.; Kunkel, G. Water Loss Control, 2nd ed.; McGraw-Hill: New York, NY, USA, 2008. [Google Scholar]
- WUC. Buried No Longer: Confronting America’s Water Infrastructure Challenge; AWWA: Denver, CO, USA, 2012. [Google Scholar]
- American Society of Civil Engineers. 2021 Report Card for America’s Infrastructure: Drinking Water; ASCE: Reston, VA, USA, 2021; Available online: https://infrastructurereportcard.org/cat-item/drinking-water/ (accessed on 9 May 2026).
- Serafeim, A.V.; Kokosalakis, G.; Deidda, R.; Karathanasi, I.; Langousis, A. Probabilistic minimum night flow estimation in water distribution networks and comparison with the water balance approach: Large-scale application to the City Center of Patras in Western Greece. Water 2022, 14, 98. [Google Scholar] [CrossRef] [Scilit]
- Al-Washali, T.; Sharma, S.; AL-Nozaily, F.; Haidera, M.; Kennedy, M. Modelling the leakage rate and reduction using minimum night flow analysis in an intermittent supply system. Water 2018, 11, 48. [Google Scholar] [CrossRef] [Scilit]
- Giudicianni, C.; Herrera, M.; Di Nardo, A.; Carravetta, A.; Ramos, H.M.; Adeyeye, K. Zero-net energy management for the monitoring and control of dynamically-partitioned smart water systems. J. Clean. Prod. 2020, 252, 119745. [Google Scholar] [CrossRef] [Scilit]
- Zanfei, A.; Menapace, A.; Brentan, B.M.; Righetti, M.; Herrera, M. Novel approach for burst detection in water distribution systems based on graph neural networks. Sustain. Cities Soc. 2022, 86, 104090. [Google Scholar] [CrossRef] [Scilit]
- Karadirek, I.E.; Kara, S.; Yilmaz, G.; Muhammetoglu, A.; Muhammetoglu, H. Implementation of hydraulic modelling for water-loss reduction through pressure management. Water Resour. Manag. 2012, 26, 2555–2568. [Google Scholar] [CrossRef] [Scilit]
- Vairavamoorthy, K.; Lumbers, J. Leakage reduction in water distribution systems: Optimal valve control. J. Hydraul. Eng. 1998, 124, 1146–1154. [Google Scholar] [CrossRef] [Scilit]
- Samir, N.; Kansoh, R.; Elbarki, W.; Fleifle, A. Pressure control for minimizing leakage in water distribution systems. Alex. Eng. J. 2017, 56, 601–612. [Google Scholar] [CrossRef] [Scilit]
- Nicolini, M.; Zovatto, L. Optimal location and control of pressure reducing valves in water networks. J. Water Resour. Plan. Manag. 2009, 135, 178–187. [Google Scholar] [CrossRef] [Scilit]
- Morrison, J.; Tooms, S.; Rogers, D. District Metered Areas, Guidance Notes. International Water Association (IWA), Specialist group on Efficient Operation and Management of Urban Water Distribution Systems; IWA Publishing: London, UK, 2007. [Google Scholar]
- Nguyen, K.D.; Dai, P.D.; Vu, D.Q.; Cuong, B.M.; Tuyen, V.P.; Li, P. A MINLP model for optimal localization of pumps as turbines in water distribution systems considering power generation constraints. Water 2020, 12, 1979. [Google Scholar] [CrossRef] [Scilit]
- Rossman, L.A. EPANET 2, Users Manual; US Environmental Protection Agency (EPA): Washington, DC, USA, 2000. [Google Scholar]
- Almandoz, J.; Cabrera, E.; Arregui, F.; Cabrera, E., Jr.; Cobacho, R. Leakage assessment through water distribution network simulation. J. Water Resour. Plan. Manag. 2005, 131, 458–466. [Google Scholar] [CrossRef] [Scilit]
- Fecarotta, O.; McNabola, A. Optimal location of pump as turbines (PATs) in water distribution networks to recover energy and reduce leakage. Water Resour. Manag. 2017, 31, 5043–5059. [Google Scholar] [CrossRef] [Scilit]
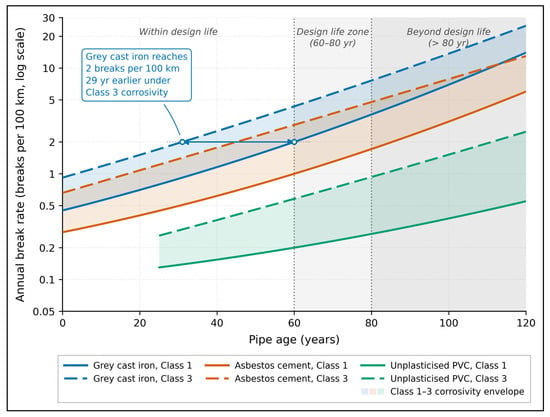
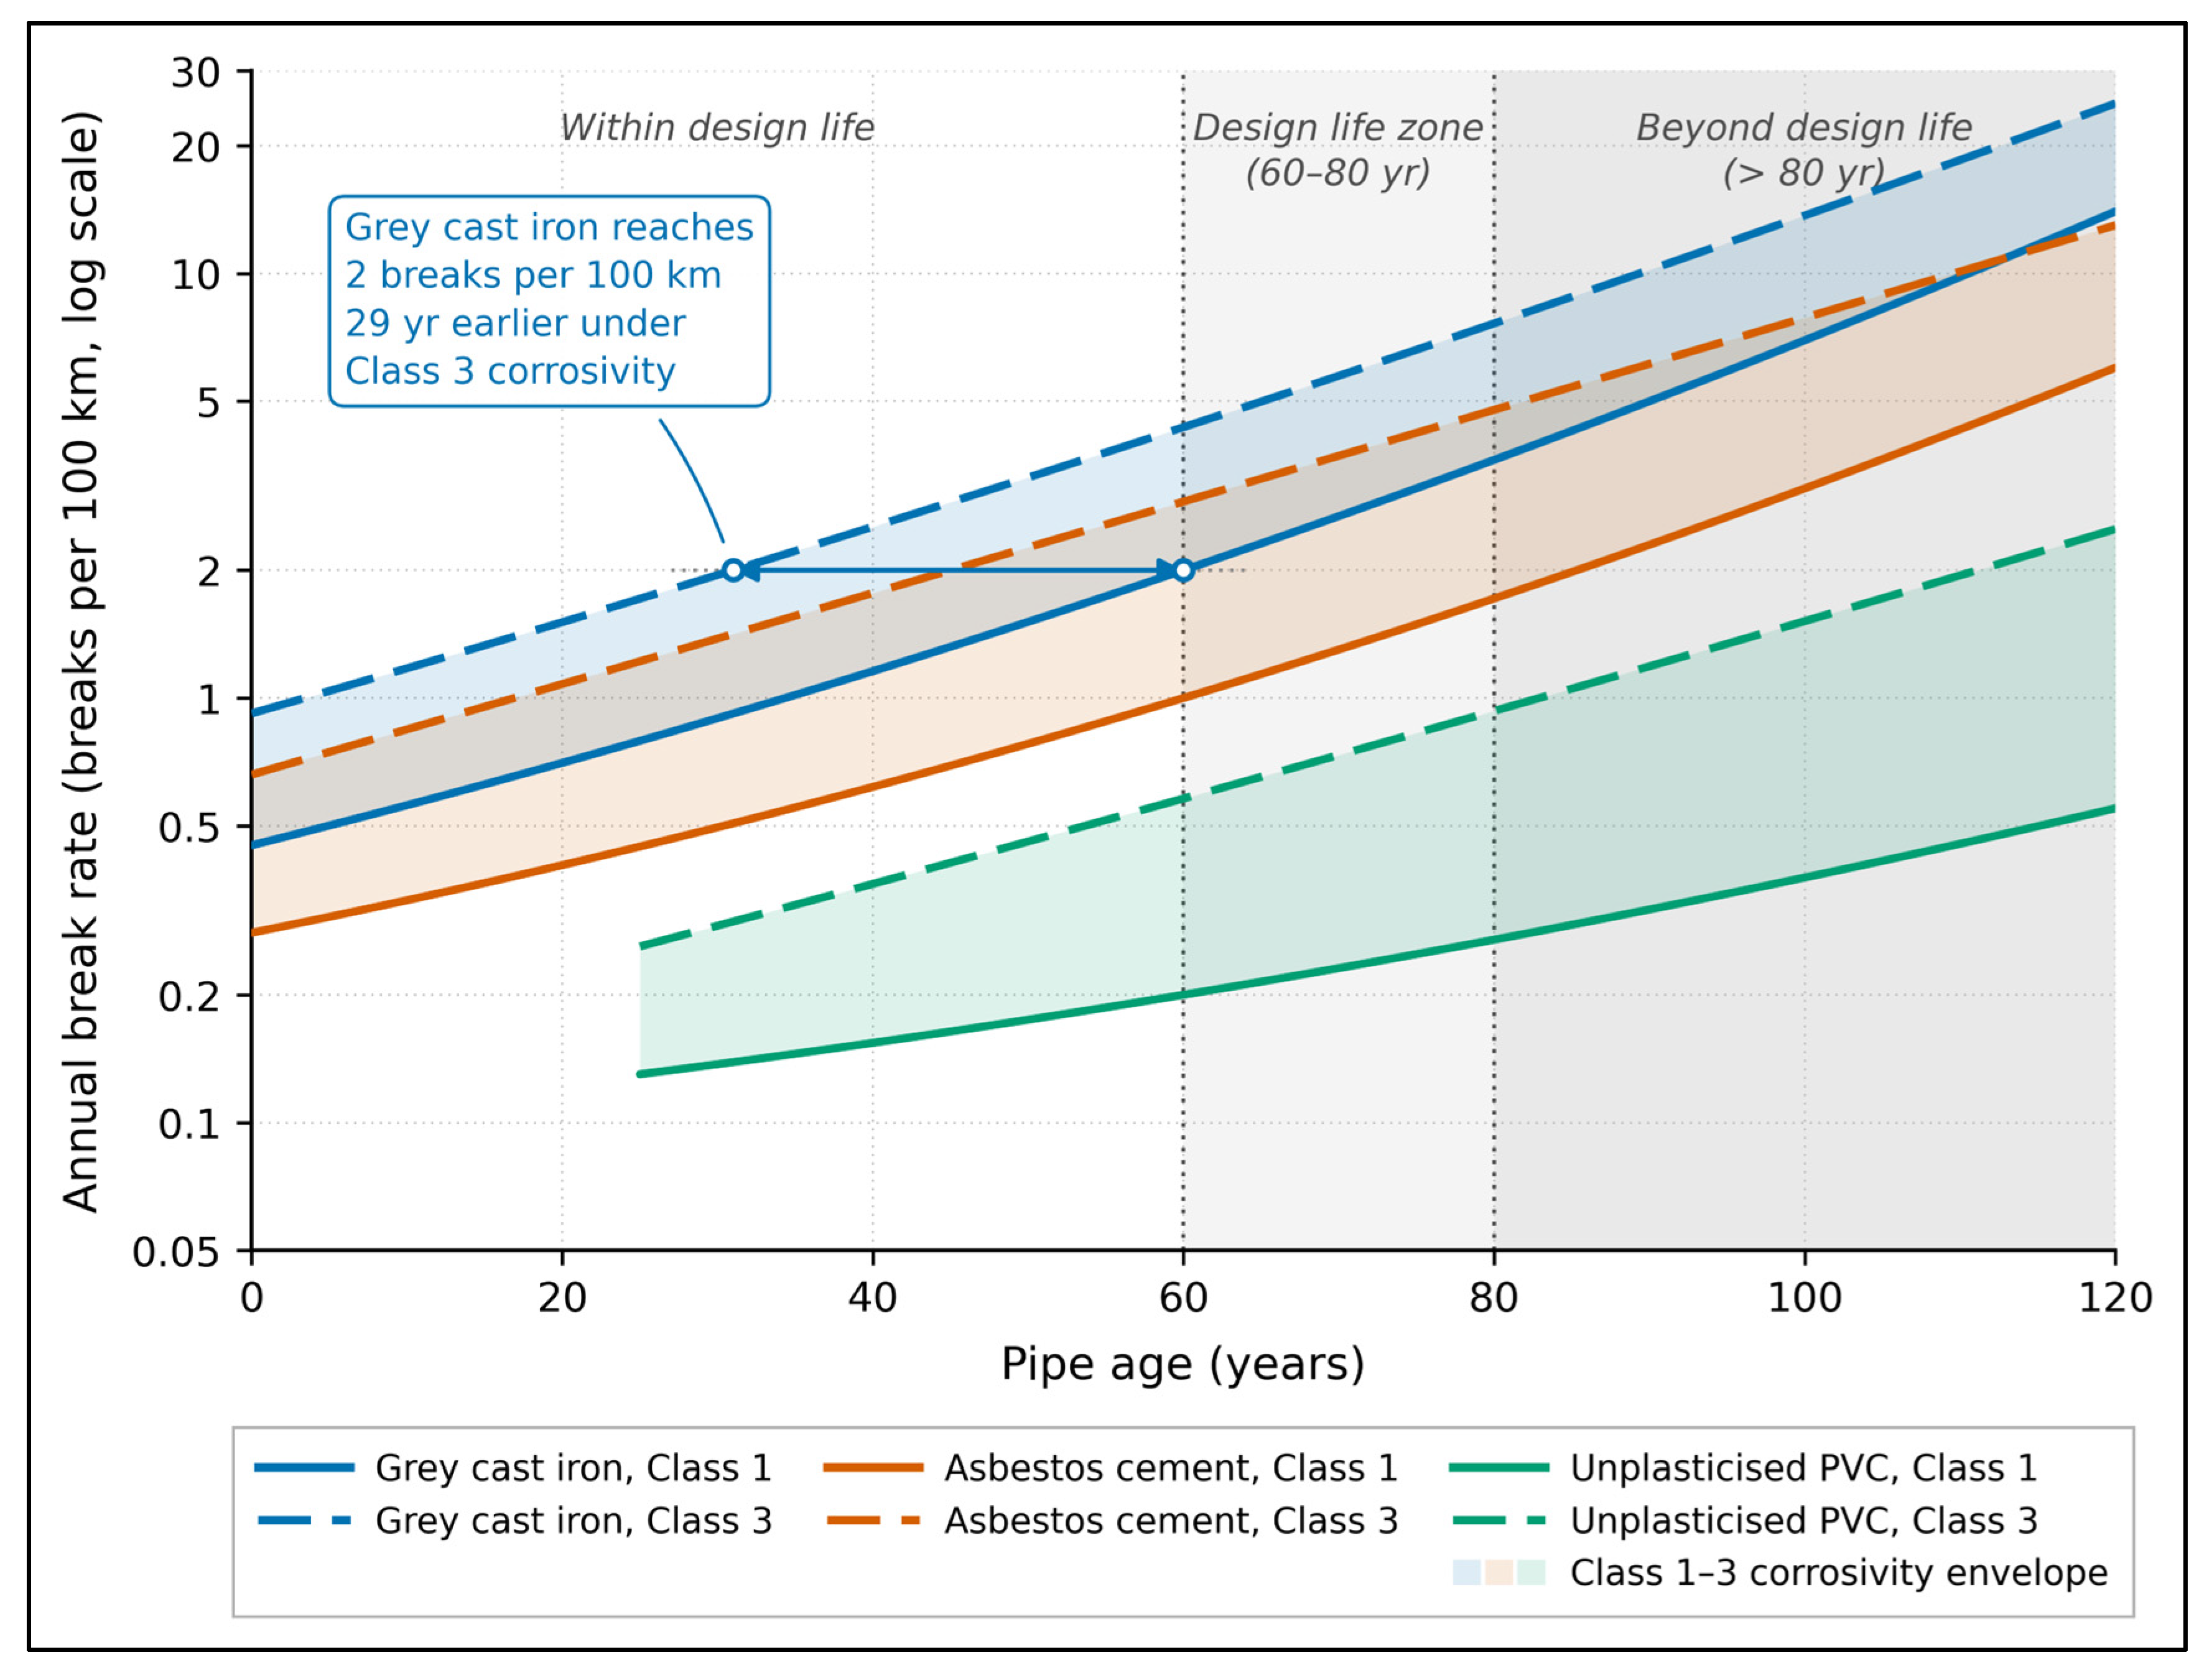
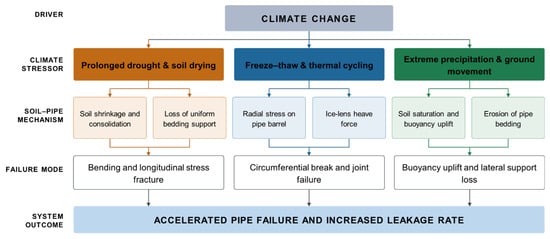
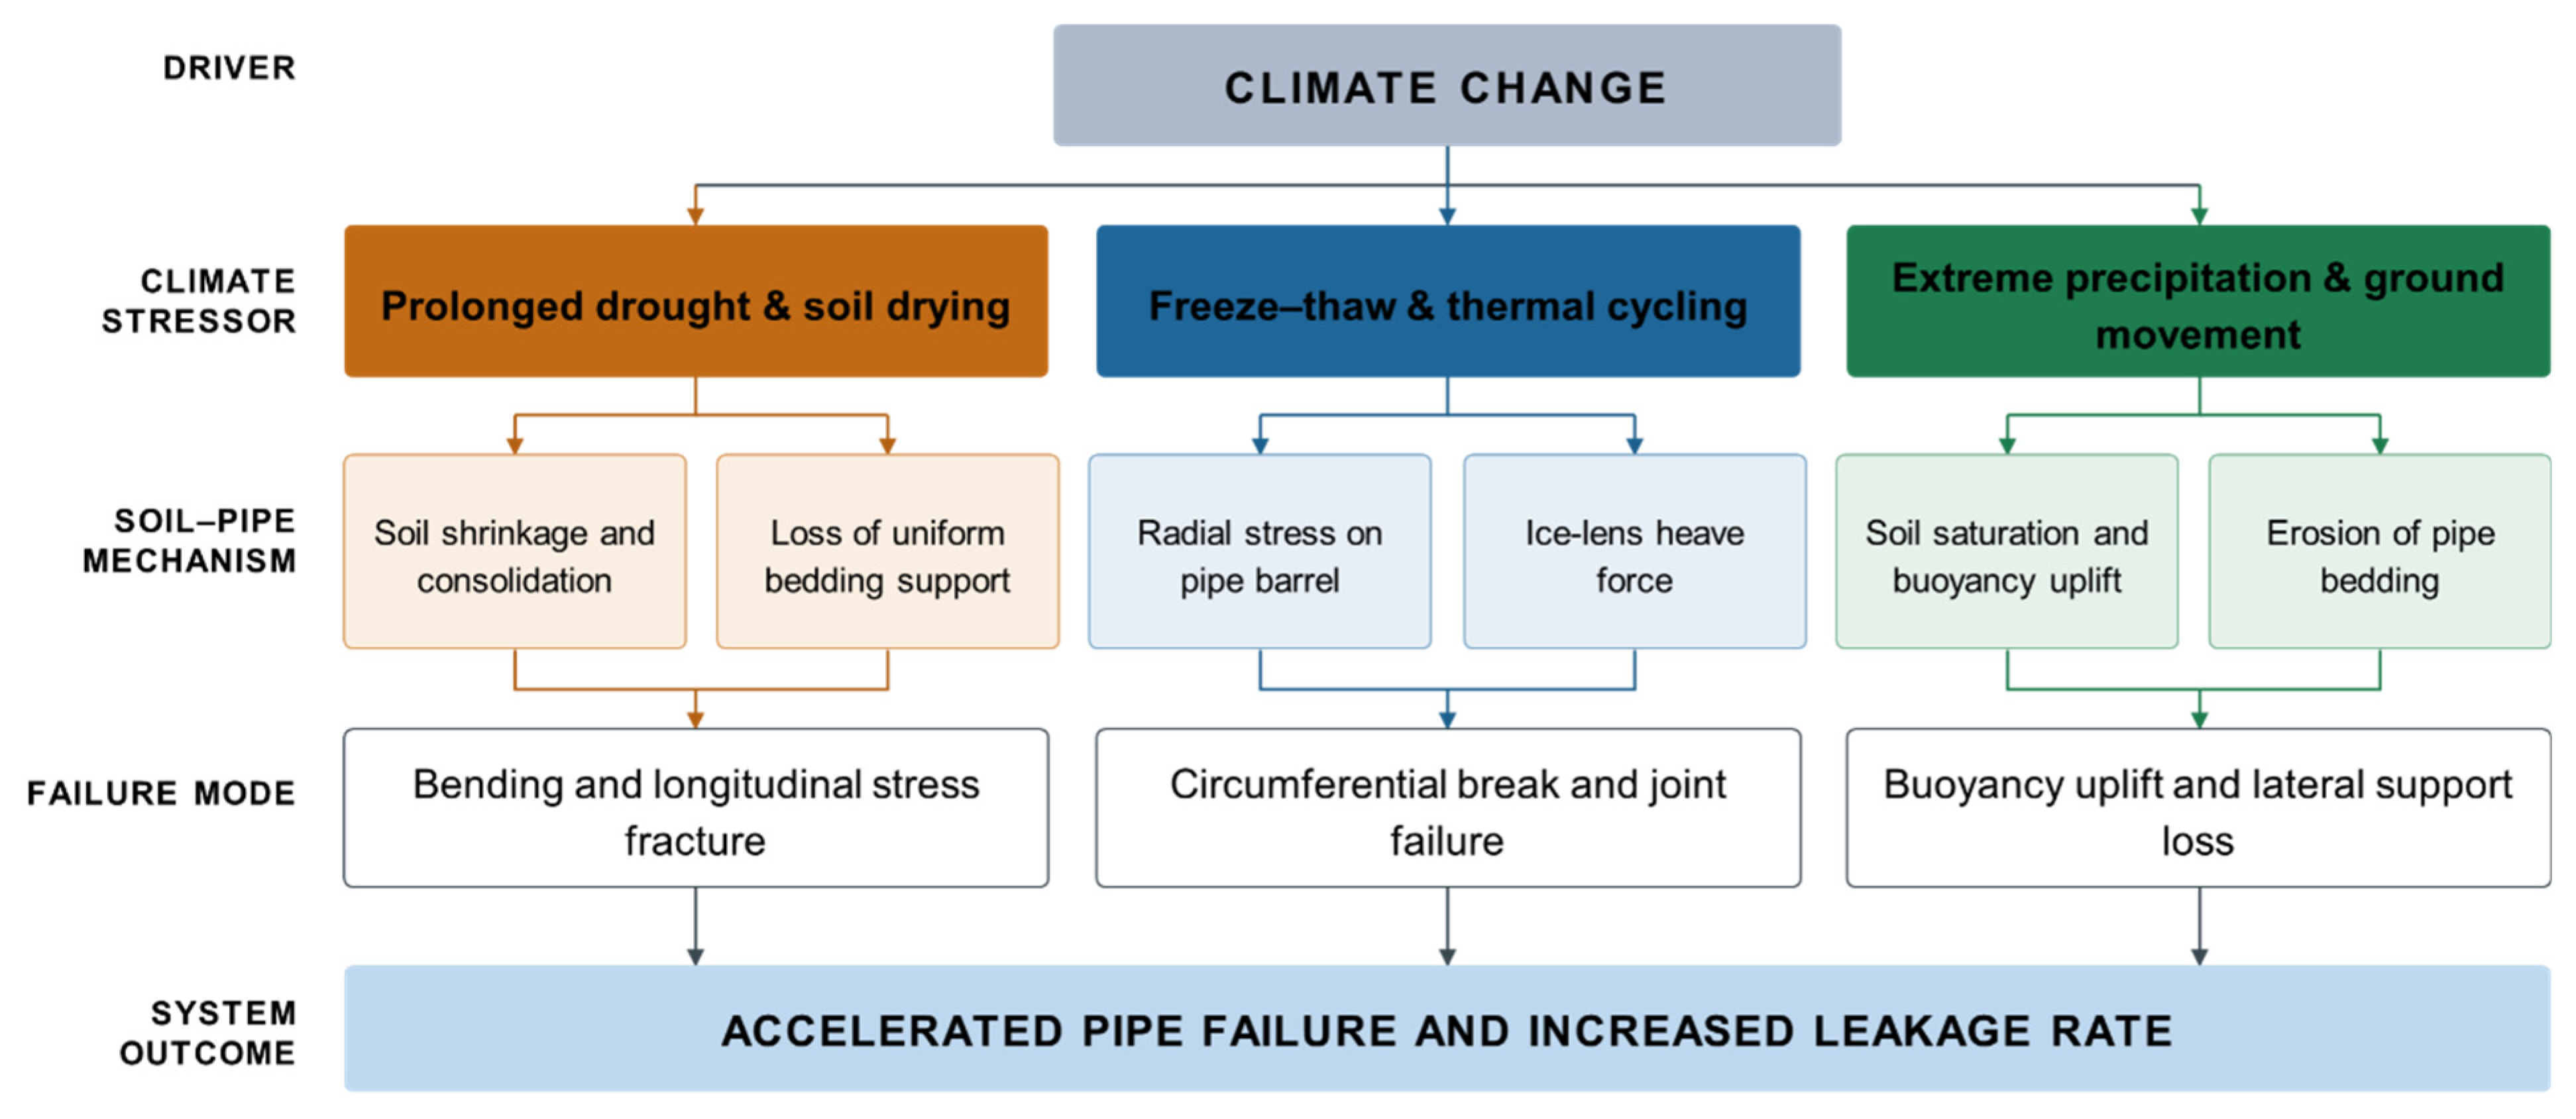
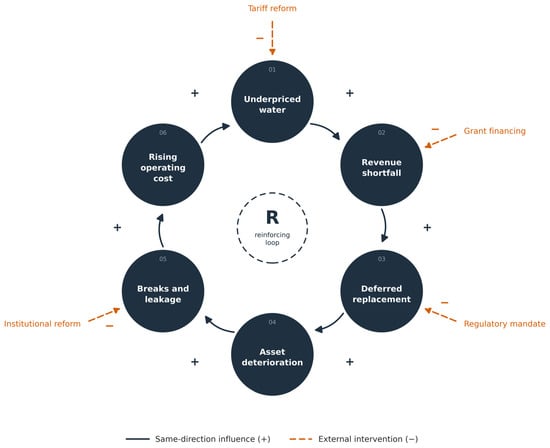
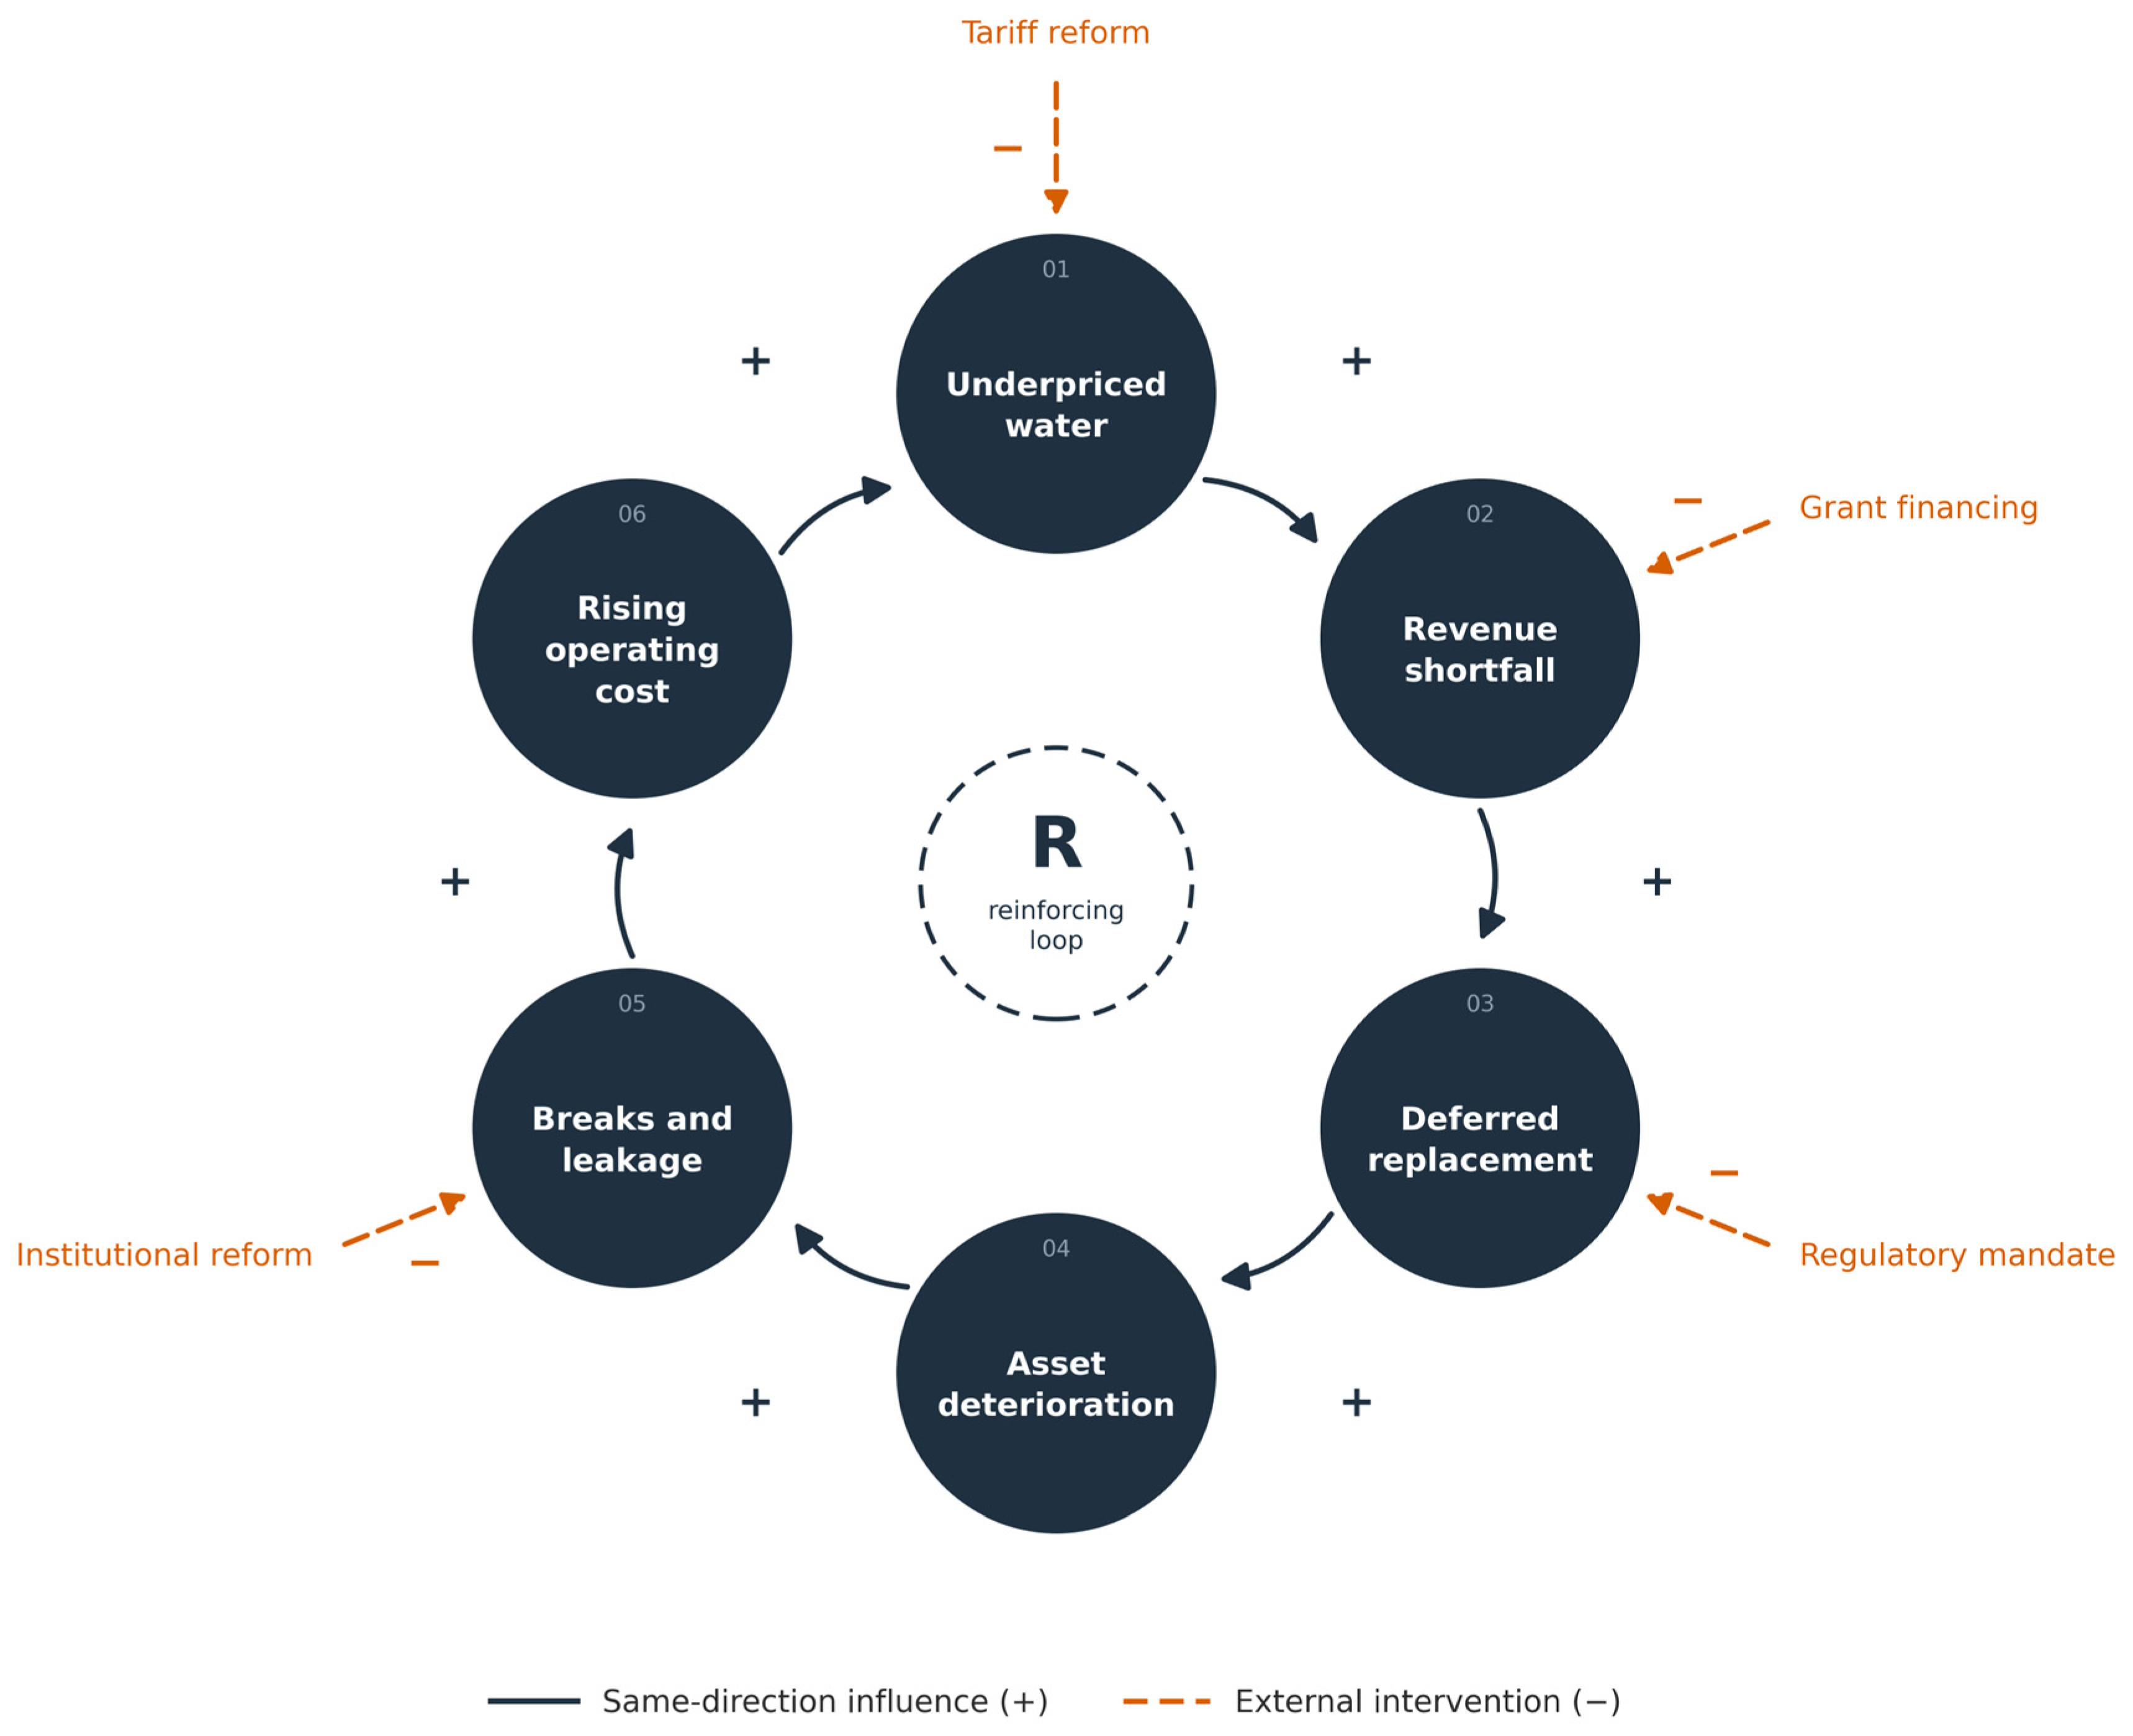
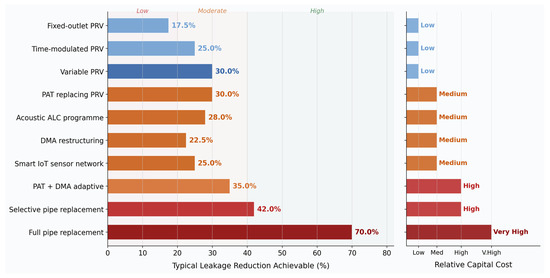
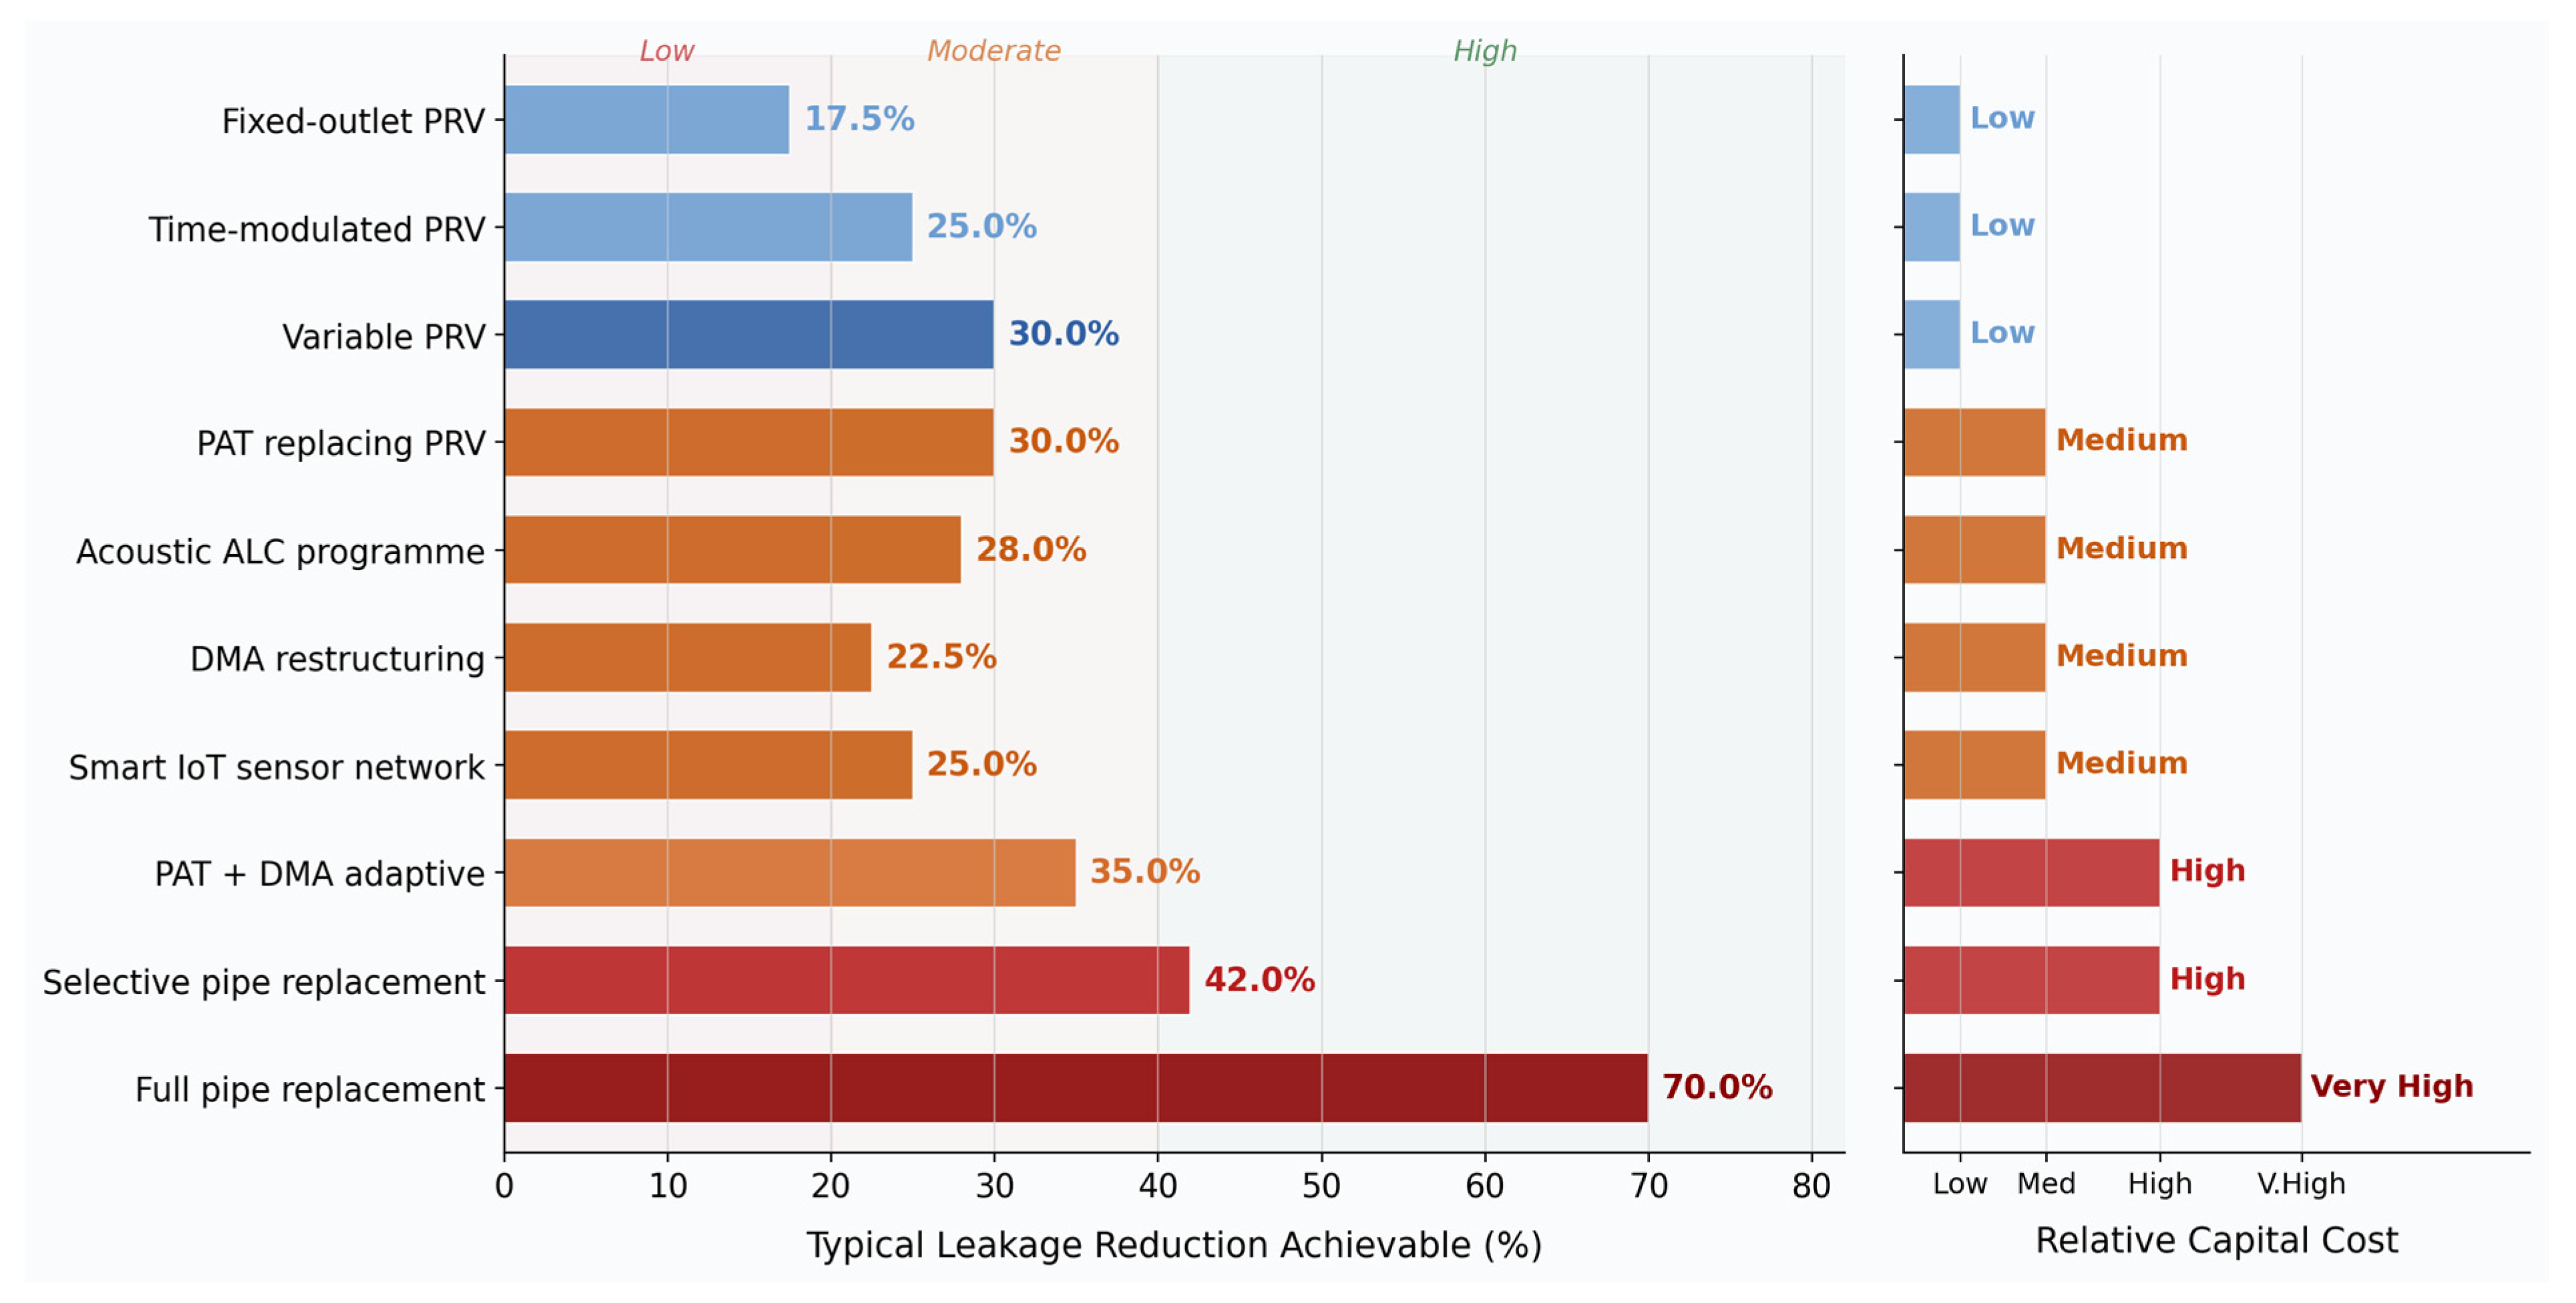
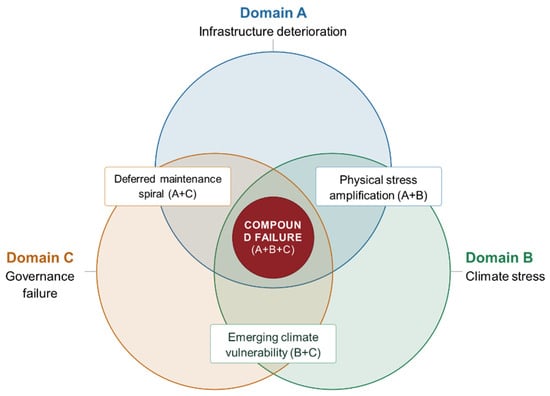

Disclaimer/Publisher’s Note: The statements, opinions and data contained in all publications are solely those of the individual author(s) and contributor(s) and not of MDPI and/or the editor(s). MDPI and/or the editor(s) disclaim responsibility for any injury to people or property resulting from any ideas, methods, instructions or products referred to in the content. |
© 2026 by the author. Licensee MDPI, Basel, Switzerland. This article is an open access article distributed under the terms and conditions of the Creative Commons Attribution (CC BY) license.