


Abstract
The service gates of high-head water release structures are mostly radial gates with sudden lateral enlargement and vertical drop. As the control transition section from pressurized flow to open-channel flow, this flow passage not only meets the layout requirements for gate sealing, but also possesses the function of aerating high-velocity flow to protect the baseplate and side walls of the open-channel section. However, as application conditions become increasingly complex, several projects have experienced cavitation erosion damage on the side walls after prolonged operation under high water levels and partial-opening conditions. To address this problem, this study takes the sediment discharge tunnel of a hydroproject as the research object, using a combination of physical model tests and numerical simulation. The hydraulic and cavitation characteristics of the open-channel section under various gate openings are analyzed, and the cavitation mechanism on the side walls is revealed. The shape of the sudden lateral enlargement and vertical drop is proposed according to the requirements of the gate sealing arrangement. Meanwhile, for existing and planned similar projects with partial opening operation requirements, recommendations for cavitation-reduction measures and operational methods are also presented, with the aim of providing reference for similar projects.
1. Introduction
Cavitation erosion is a common form of damage in hydraulic water release structures subjected to high-velocity flow. When the local pressure decreases to near the saturated vapor pressure of water, cavitation bubbles may form in the flow. The collapse of cavitation bubbles near solid boundaries generates shock waves and microjets, whose repeated action can damage the flow passage surfaces [1,2]. Relevant studies and engineering experience have shown that the risk of cavitation erosion generally increases significantly when the flow velocity in water release structures exceeds 20–30 m/s [3]. Flow velocities in high-dam water release structures often reach or exceed this range, making cavitation and cavitation erosion problems more prominent. Introducing an appropriate amount of air into the near-wall region of high-velocity flow can cushion the impact generated by cavitation bubble collapse and is an important measure for mitigating cavitation erosion damage [4].
Flood discharge tunnels, bottom outlets, and sediment discharge tunnels in high-dam projects commonly adopt a layout in which pressurized flow is followed by open-channel flow [5,6]. Radial gates can withstand relatively high operating heads and flexibly regulate discharge and are therefore often selected as service gates at pressurized outlets. As the control transition section from pressurized flow to open-channel flow, the flow passage structure of sudden lateral enlargement and vertical drop not only meets the layout requirements for the waterstop of the radial service gate, but also, due to the interconnected bottom and side cavities formed by the sudden lateral enlargement of the side walls and the sudden vertical drop of the baseplate, possesses the function of aerating the high-velocity flow at the pressurized outlet to protect the baseplate and side walls of the open-channel section [7,8]. Air enters the cavities through the ventilation facilities and is entrained into the near-wall flow through turbulent mixing at the jet surface, thereby providing aeration protection for the baseplate and side walls of the open-channel section [9,10]. The effectiveness of this aeration protection is related to cavity stability, air supply capacity, and near-wall aeration concentration [11,12].
With increasing operating water levels and increasingly complex gate operation modes, several projects have experienced relatively severe damage on the side walls of the outlet open-channel section after prolonged operation of radial gates under high water levels and partial-opening conditions [6,13]. When the radial gate is fully open, the outlet flow is discharged along its original streamlines and spreads naturally toward the sudden lateral enlargement of the side walls, generally forming relatively long side cavities. When the radial gate is partially open, the gate obstructs the upper flow and compresses and deflects the middle and lower flow downward, causing the outlet jet to spread markedly downward and laterally. Previous studies have shown that the gate opening, side wall divergence angle, and geometric parameters of the sudden lateral enlargement and vertical drop significantly affect the cavity length, jet impact location, side wall pressure, and local cavitation number [14,15]. After boundary separation and shear-layer diffusion, the expanded jet impacts the side walls and forms a local high-pressure zone at the impact location. The flow is subsequently reflected and develops downstream as wall-attached flow, causing the pressure to decrease rapidly downstream of the high-pressure zone and even producing local negative pressure. Along the flow direction, the side wall can be divided into the side cavity zone, abrupt pressure change zone, low-pressure zone, and pressure recovery zone [16,17]. Meanwhile, an increase in the lateral incident angle of the flow rapidly shortens the side cavity and weakens aeration protection in the near-wall region of the side walls. The splashing water wings formed after the flow impacts the side walls may also adversely affect the side cavities from the sudden lateral enlargement and the bottom cavities from the sudden vertical drop, further affecting the ventilation and stability of the cavities [6,14]. In the present tests, a strip-shaped region with markedly fewer bubbles was observed downstream of the side wall impact zone; this region is referred to herein as the “clear-water zone.” Previous model studies have shown that a clear-water core or a local nonaerated region may form in flows aerated from the bottom or side, and the deaeration occurring during jet impact and wall attachment may cause the local aeration concentration to decrease rapidly [18,19,20,21]. It should be noted that the presence of high flow velocity or a clear-water zone only indicates that the local hydraulic and aeration conditions may be unfavorable and cannot be used to directly determine whether cavitation or cavitation erosion has occurred. The wall pressure and flow velocity conditions in the corresponding region should also be considered comprehensively [4,22].
Regarding the measures for reducing cavitation erosion in the outlet open-channel section of the radial gate with sudden lateral enlargement and vertical drop, commonly used measures include installing flow deflectors at the outlet section [23], setting a gradual expansion section downstream of the sudden lateral enlargement on the side walls or adjusting the shape of the sudden lateral enlargement and vertical drop [24,25], controlling the unevenness of the clear-water zone on the side walls and adopting erosion-resistant and wear-resistant materials [26], and installing aeration facilities downstream [27,28,29,30]. However, for existing projects, outlet flow deflectors may occupy part of the flow passage and affect the discharge capacity. Setting a gradual expansion section on the side walls may require additional tunnel excavation, thereby causing issues related to the stability of the surrounding rock, structural safety, and increased project investment. Controlling wall unevenness and adopting erosion-resistant and wear-resistant materials are mainly passive protection measures and cannot directly improve the hydraulic conditions in the clear-water and low-pressure regions. Therefore, how to restore near-wall aeration protection on the side walls through local shape adjustment without significantly affecting the discharge capacity and structural safety remains a problem that needs to be solved in the renovation of existing projects.
During the operation of the sediment discharge tunnel of a hydroproject, the radial service gate remained partially open for a prolonged period. Inspection revealed severe concrete damage on the side walls downstream of the gate. The damaged area exhibited irregular pits and a honeycomb-like surface, showing distinct characteristics of cavitation erosion damage [31,32]. Considering that the tunnel also undertakes sediment discharge, sediment abrasion and its combined action with cavitation cannot be completely excluded [26]. To address the cavitation erosion damage problem observed on the side walls, this paper, by taking the sediment discharge tunnel of a hydroproject as the study object and using a combination of physical model test and numerical simulation, analyzes the hydraulic and cavitation characteristics of the open-channel section under various openings of the radial service gate, reveals the cavitation mechanism on the side walls, and proposes that the shape of the sudden lateral enlargement and vertical drop, set up to meet the requirements of the gate’s waterstop arrangement, is insufficient to satisfy the need for cavitation erosion reduction by aeration on the side walls during high-head, large-opening, partial-opening conditions of the radial service gate. Additional aeration facilities need to be installed separately in the open-channel section downstream of the radial service gate. Simultaneously, for existing and planned projects involving radial gates with sudden lateral enlargement and vertical drop that have requirements for partial opening operation, this paper also presents recommendations for measures for reducing cavitation and operational methods in the open-channel section, with the aim of providing reference for similar projects.
2. Research Methods and Hydraulic Conditions
2.1. Physical Model Test
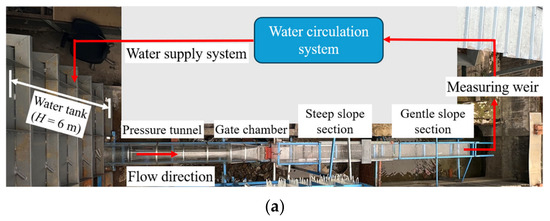
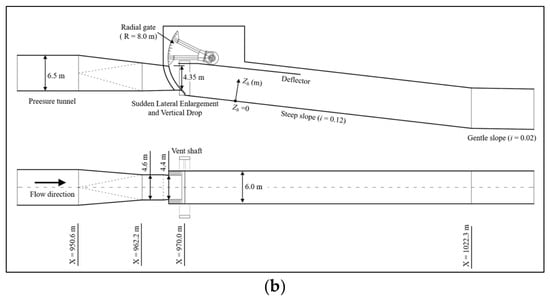
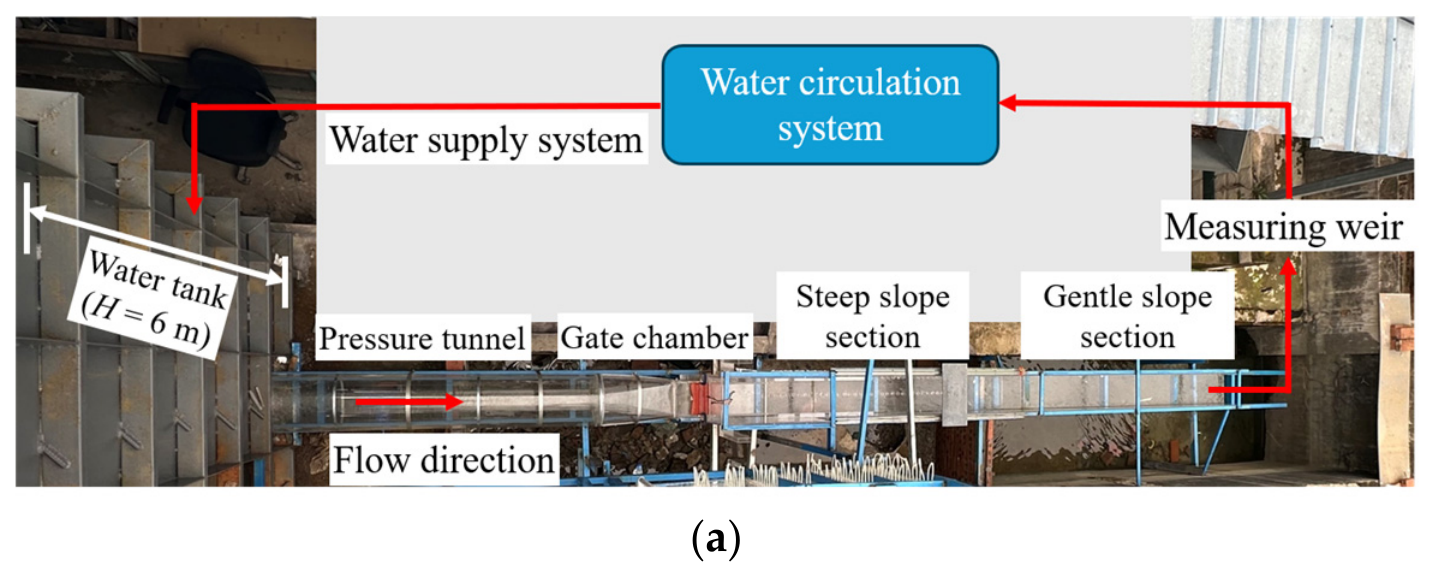
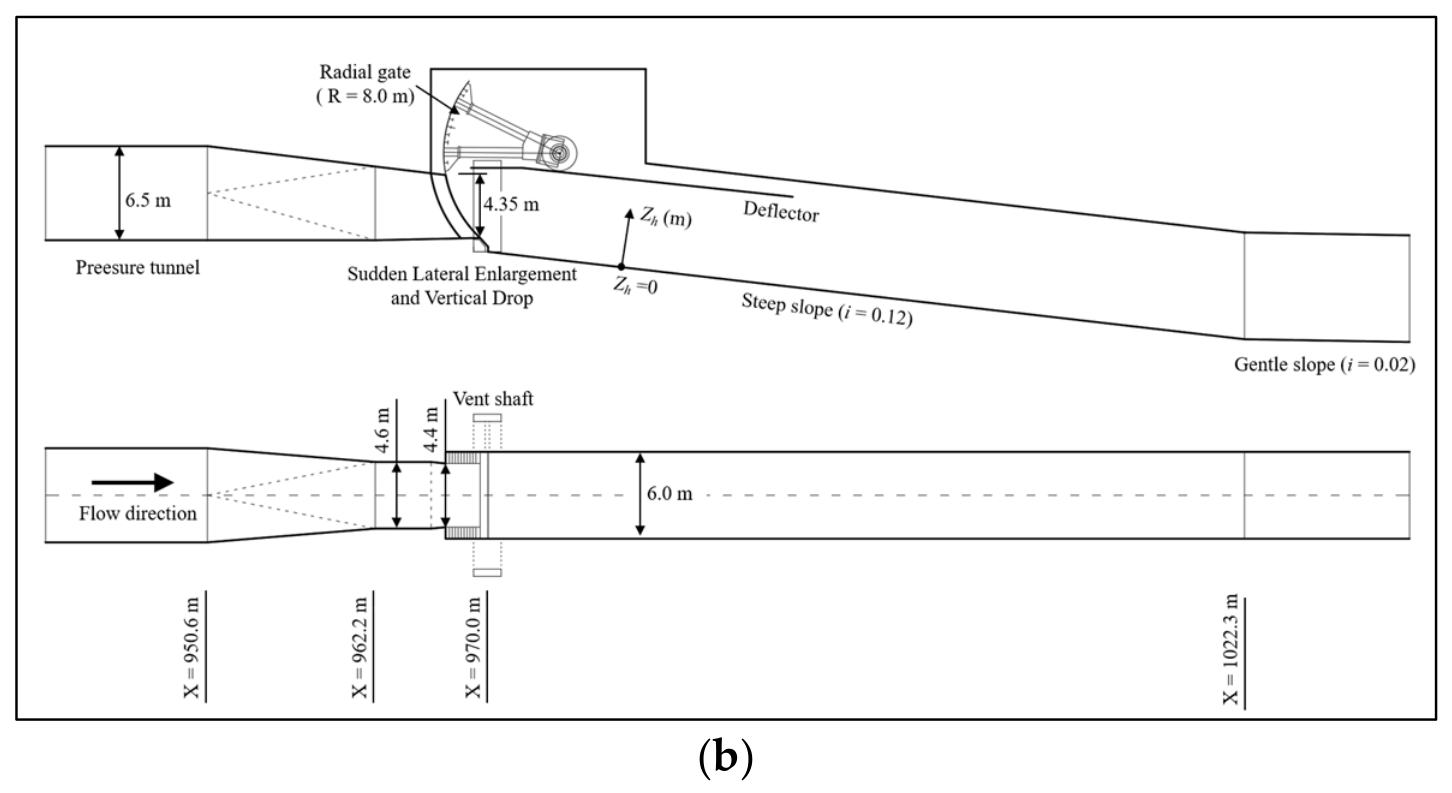
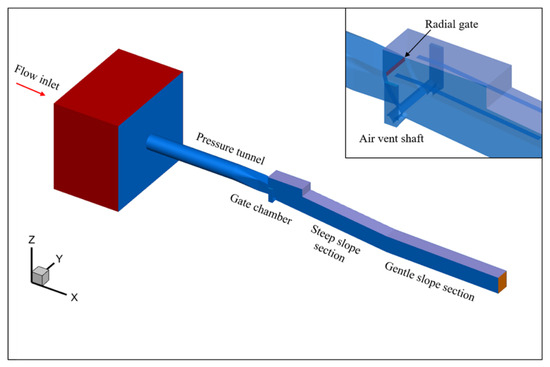
The experimental study is based on a sediment discharge tunnel of a hydroproject. The sediment discharge tunnel adopts a pressurized-to-free-flow discharge tunnel type, consisting of an intake, a pressurized section, a service gate chamber section, an open-channel section and a flip bucket, as shown in Figure 1. The pressurized section has a circular cross-section with an inner diameter of 6.5 m. The pressurized section outlet has a width of b = 4.40 m and a height of h = 4.35 m and is controlled by a radial service gate with a radius of 8.0 m. In this study, the gate opening E (m) is defined as the vertical distance between the bottom of the radial gate and the bottom of the pressurized section outlet, and the relative gate opening e is defined as the ratio of the gate opening E to the height h of the pressurized section outlet, i.e., e = E/h. To improve aeration protection in the downstream open-channel section and meet the waterstop layout requirements, a 0.8 m sudden lateral enlargement is set on both sides of the radial gate, and a 0.95 m sudden vertical drop is set at the sill of the radial gate. Downstream of the service gate chamber section is a 6.0 m-wide open-channel section, consisting of a steep-slope section with a slope of 0.12 and a gentle-slope section with a slope of 0.02. In the prototype project, the gentle-slope section is followed by a flip bucket section, which was not reproduced in the present model test. The hydraulic model test employed a 1:20 normal model, designed according to the gravity similarity criterion. The X-axis is oriented in the downstream direction, and its coordinate values denote the prototype chainage. The Z-axis represents elevation. In addition, Zh denotes the distance measured normal to the channel bottom, with Zh = 0 m corresponding to the baseplate.
Figure 1.
Physical model test system and model layout: (a) layout of the physical model test system; (b) model layout and geometric parameters.
The experimental observations and measurements included the flow pattern, water surface profile, cavity length, side wall and bottom pressures, flow velocity, and aeration concentration. The flow pattern was recorded using a high-definition camera, while the water surface profile and cavity length were measured using rulers. Pressure was measured using a fluctuating pressure measurement system developed by Chengdu Test Electronic Information Co., Ltd. The system consisted of piezoresistive fluctuating pressure probes, a digital sensor hub, and a computer-based analysis system. The measurement range of the pressure probes was 50 kPa. The sampling duration and sampling frequency of the pressure probes were verified before the tests, and a sampling duration of 60 s and a sampling frequency of 1 kHz were ultimately selected. The bottom pressure measurement points were uniformly arranged along the flow direction within the range of X = 975–1010 m. The side wall pressure measurement sections were arranged within the range of X = 970–1010 m, with the measurement points at each section uniformly distributed in the vertical direction.
Aeration concentration and flow velocity were measured intrusively using a dual-tip phase-detection needle probe (developed by Sichuan University, Chengdu, China). The probe consisted of a probe stem and two needle sensors with identical structures but different lengths. Changes in the electrical signal caused by the difference in electrical conductivity between the air and water phases were used to identify the phase present at the sensor tips. The aeration concentration and flow velocity at each measurement point were then obtained through phase-signal statistics and cross-correlation analysis of the signals from the two sensors, respectively. During the tests, each sensor was sampled at a frequency of 80 kHz for a duration of 30 s. The aeration concentration measurement sections were arranged along the flow direction, and their locations were represented by the prototype chainages corresponding to their intersections with the baseplate. The measurement points were distributed in the direction normal to the baseplate.
The experimental conditions are listed in Table 1, and all parameters in the table are given as prototype values. The upstream head H0 (m) is represented by the reservoir water level. The discharge Q (m3/s) is the discharge under the corresponding operating condition, which was measured using a rectangular measuring weir and converted to the prototype value according to the similarity relationship. The mean velocity at the pressurized outlet is defined as V0 = Q/(Eb), and the corresponding characteristic Froude number is defined as Fr0 = V0/(gE)0.5, where g is the gravitational acceleration.
Table 1.
Hydraulic conditions and characteristic parameters.
2.2. Numerical Simulation
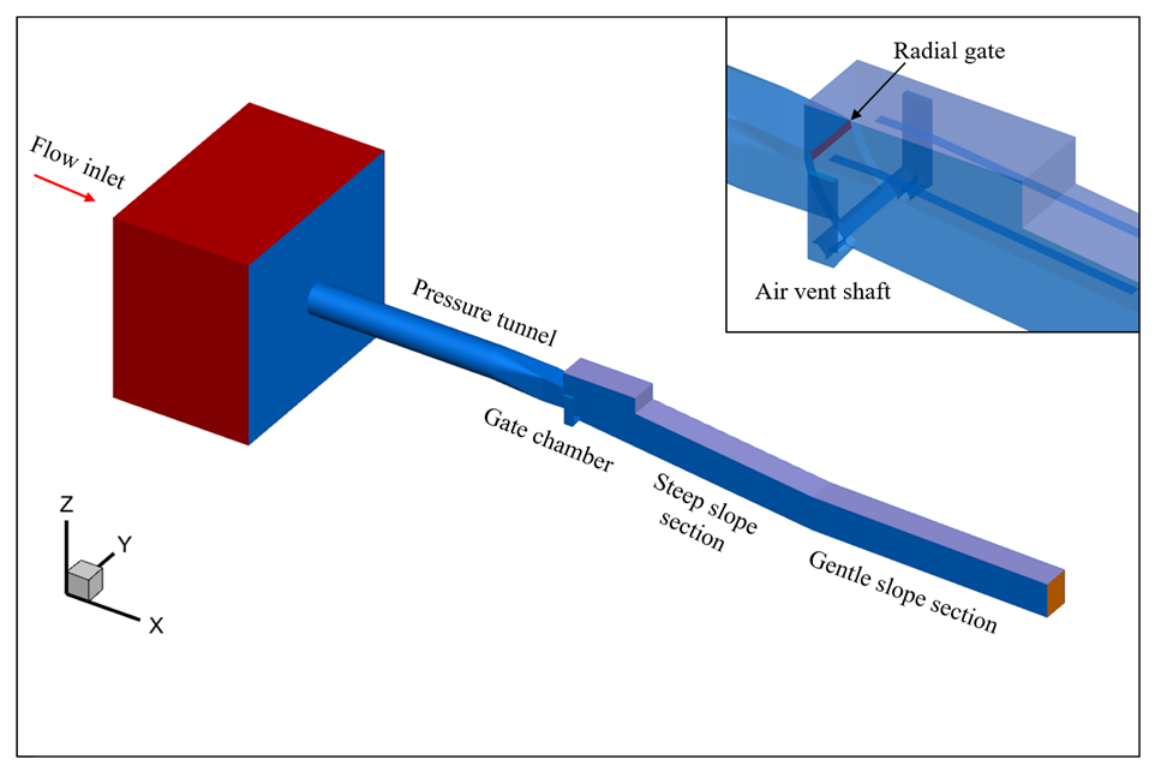
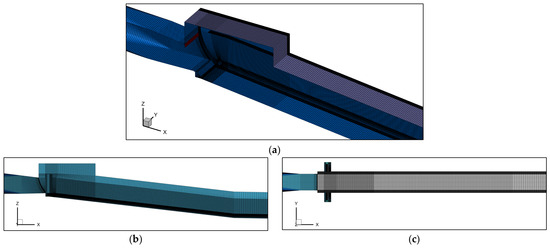
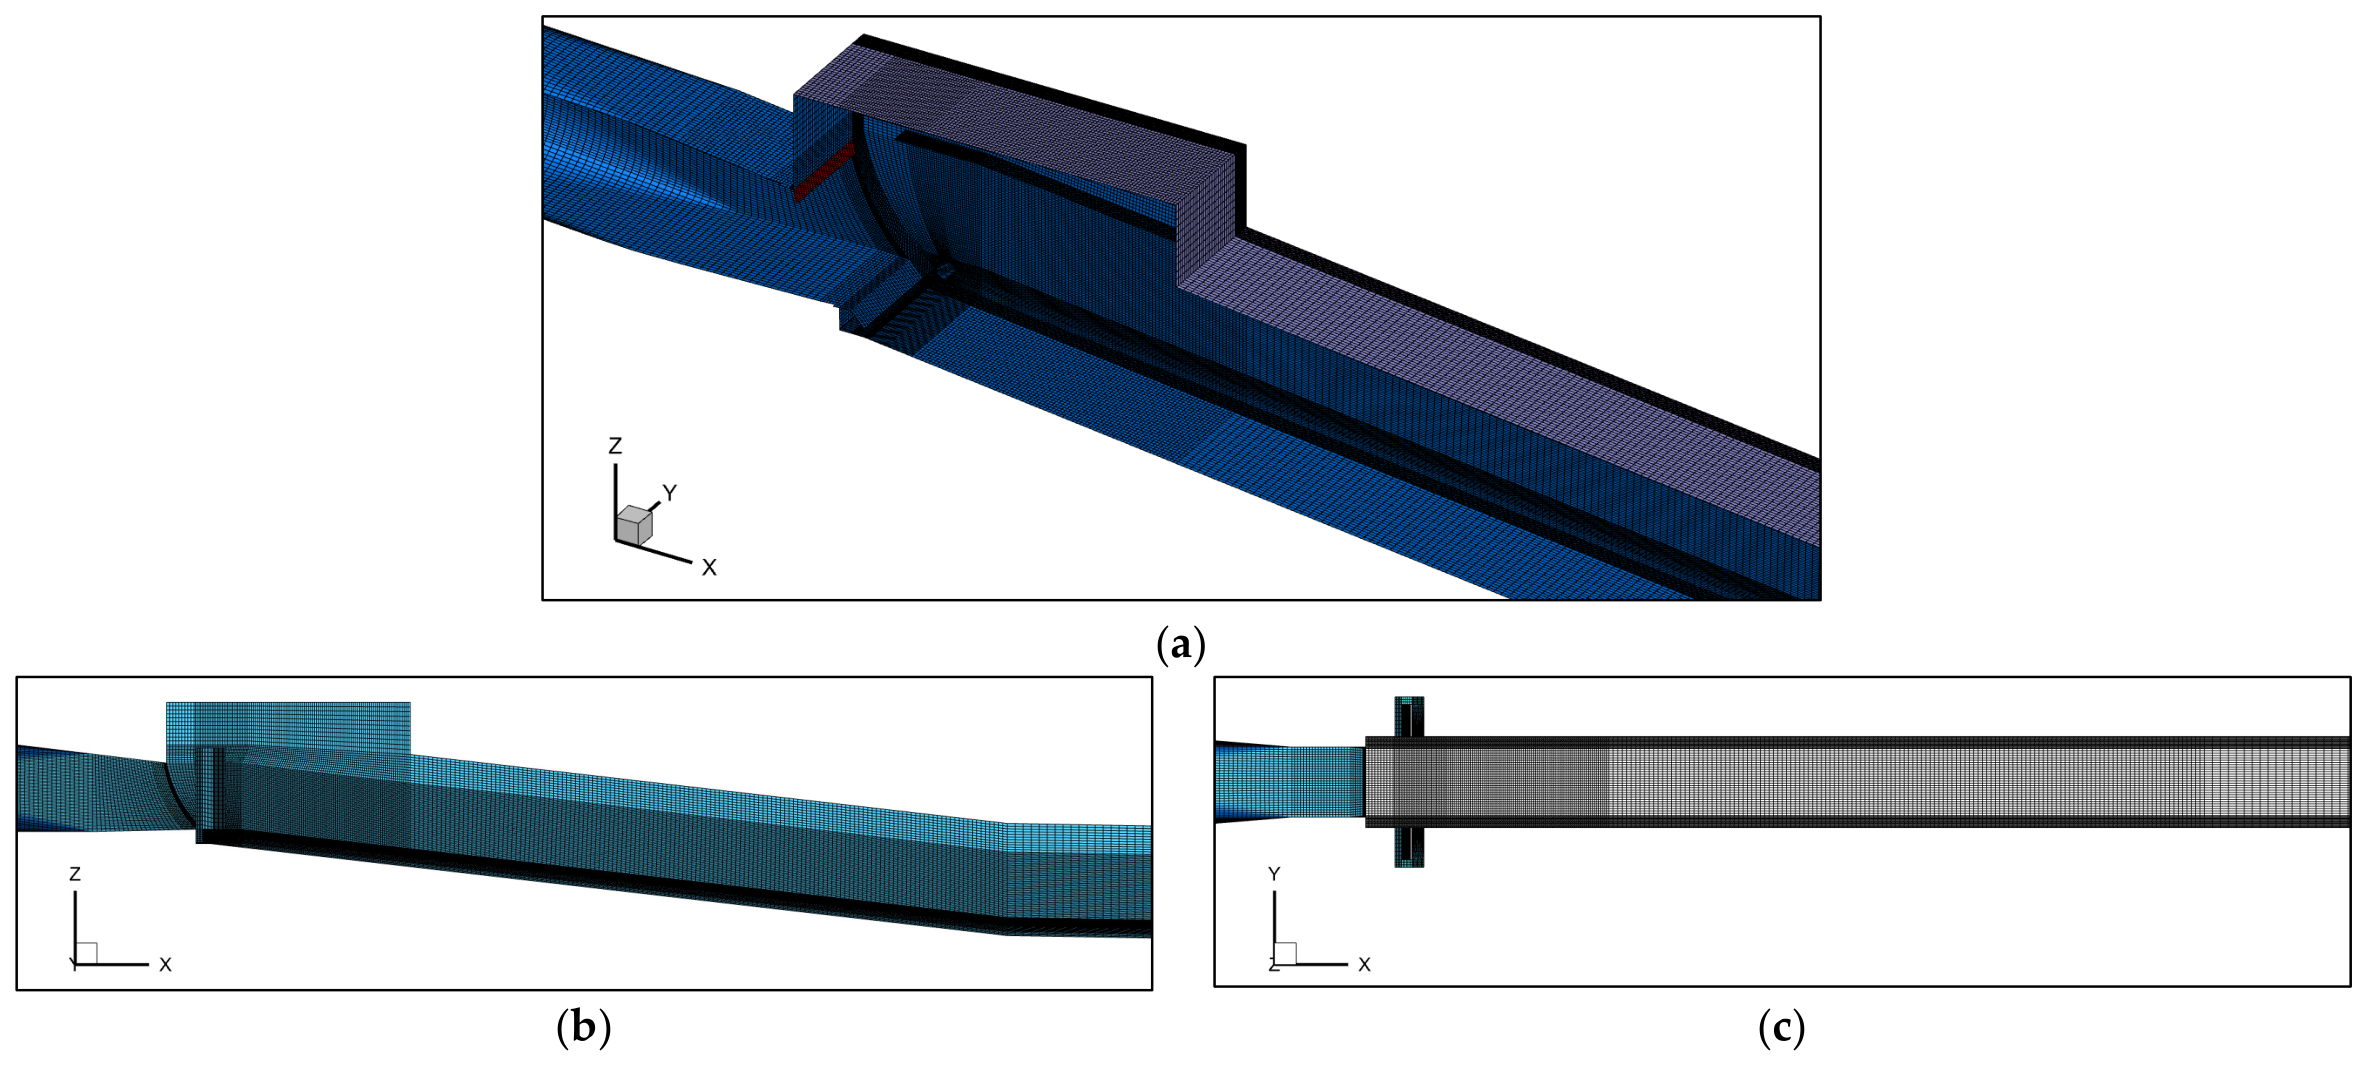
A three-dimensional numerical model was established at the prototype scale, covering the same range as the physical model. The computational domain included the pressurized section, gate chamber section, radial service gate, sudden lateral enlargement and vertical drop structure, steep-slope section, and gentle-slope section, as shown in Figure 2. The numerical model adopted the same coordinate system as the physical model. The X-axis points downstream along the chainage direction, the Z-axis represents elevation, and the Y-axis is perpendicular to the XZ plane, with the left side in the flow direction defined as positive and the right side as negative. The computational domain was discretized using a structured mesh, with local refinement applied near the flow passage walls, radial service gate, and sudden lateral enlargement and vertical drop structure. In the key regions near the gate chamber and outlet, the maximum grid sizes in the X, Y, and Z directions were all less than 0.1 m. The computational domain contained approximately three million cells, and the mesh arrangement is shown in Figure 3.
Figure 2.
Numerical analysis model of the sediment discharge tunnel of a hydroproject.
Figure 3.
Computational mesh of the numerical model: (a) three-dimensional view; (b) longitudinal view; (c) plan view.
Typical operating conditions listed in Table 1 were selected for the numerical simulations. ANSYS Fluent (Version 2022) was used to solve the unsteady three-dimensional air–water two-phase flow. Turbulence closure was achieved using the standard k–ε two-equation model, while the air–water interface was tracked on a fixed Eulerian grid using the volume of fluid (VOF) method. The computational time step was set to 0.0001 s. Several monitoring cross-sections and points were arranged downstream to continuously monitor the variations in water level, pressure, and flow velocity with computational time. The calculation was considered to have reached a stable state when these hydraulic parameters no longer exhibited noticeable trends and fluctuated within stable ranges. The results during the stable period were then extracted for the subsequent analyses of the flow pattern, wall pressure, flow velocity, cavitation number, and other hydraulic characteristics.
Different turbulence models may affect the numerical results for local flow separation, flow impingement on the walls, and details of the air–water interface. The numerical simulations in this study mainly focus on the macroscopic flow patterns, cavity morphology, and time-averaged pressure and velocity distributions downstream of the radial service gate, rather than instantaneous pressure and detailed turbulent structures. Previous studies have employed the standard k–ε model and the volume of fluid (VOF) method to simulate the hydraulic characteristics of pressurized outlets and their downstream aeration facilities, and the numerical results generally agreed well with the physical model test data [33,34,35]. These findings indicate that this combination of models can reasonably reproduce the principal macroscopic time-averaged hydraulic characteristics of such high-velocity flows. Therefore, the standard k–ε model and the VOF method were adopted in this study, and their reliability was verified against the physical model test results.
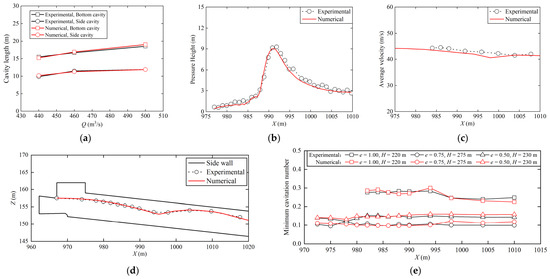
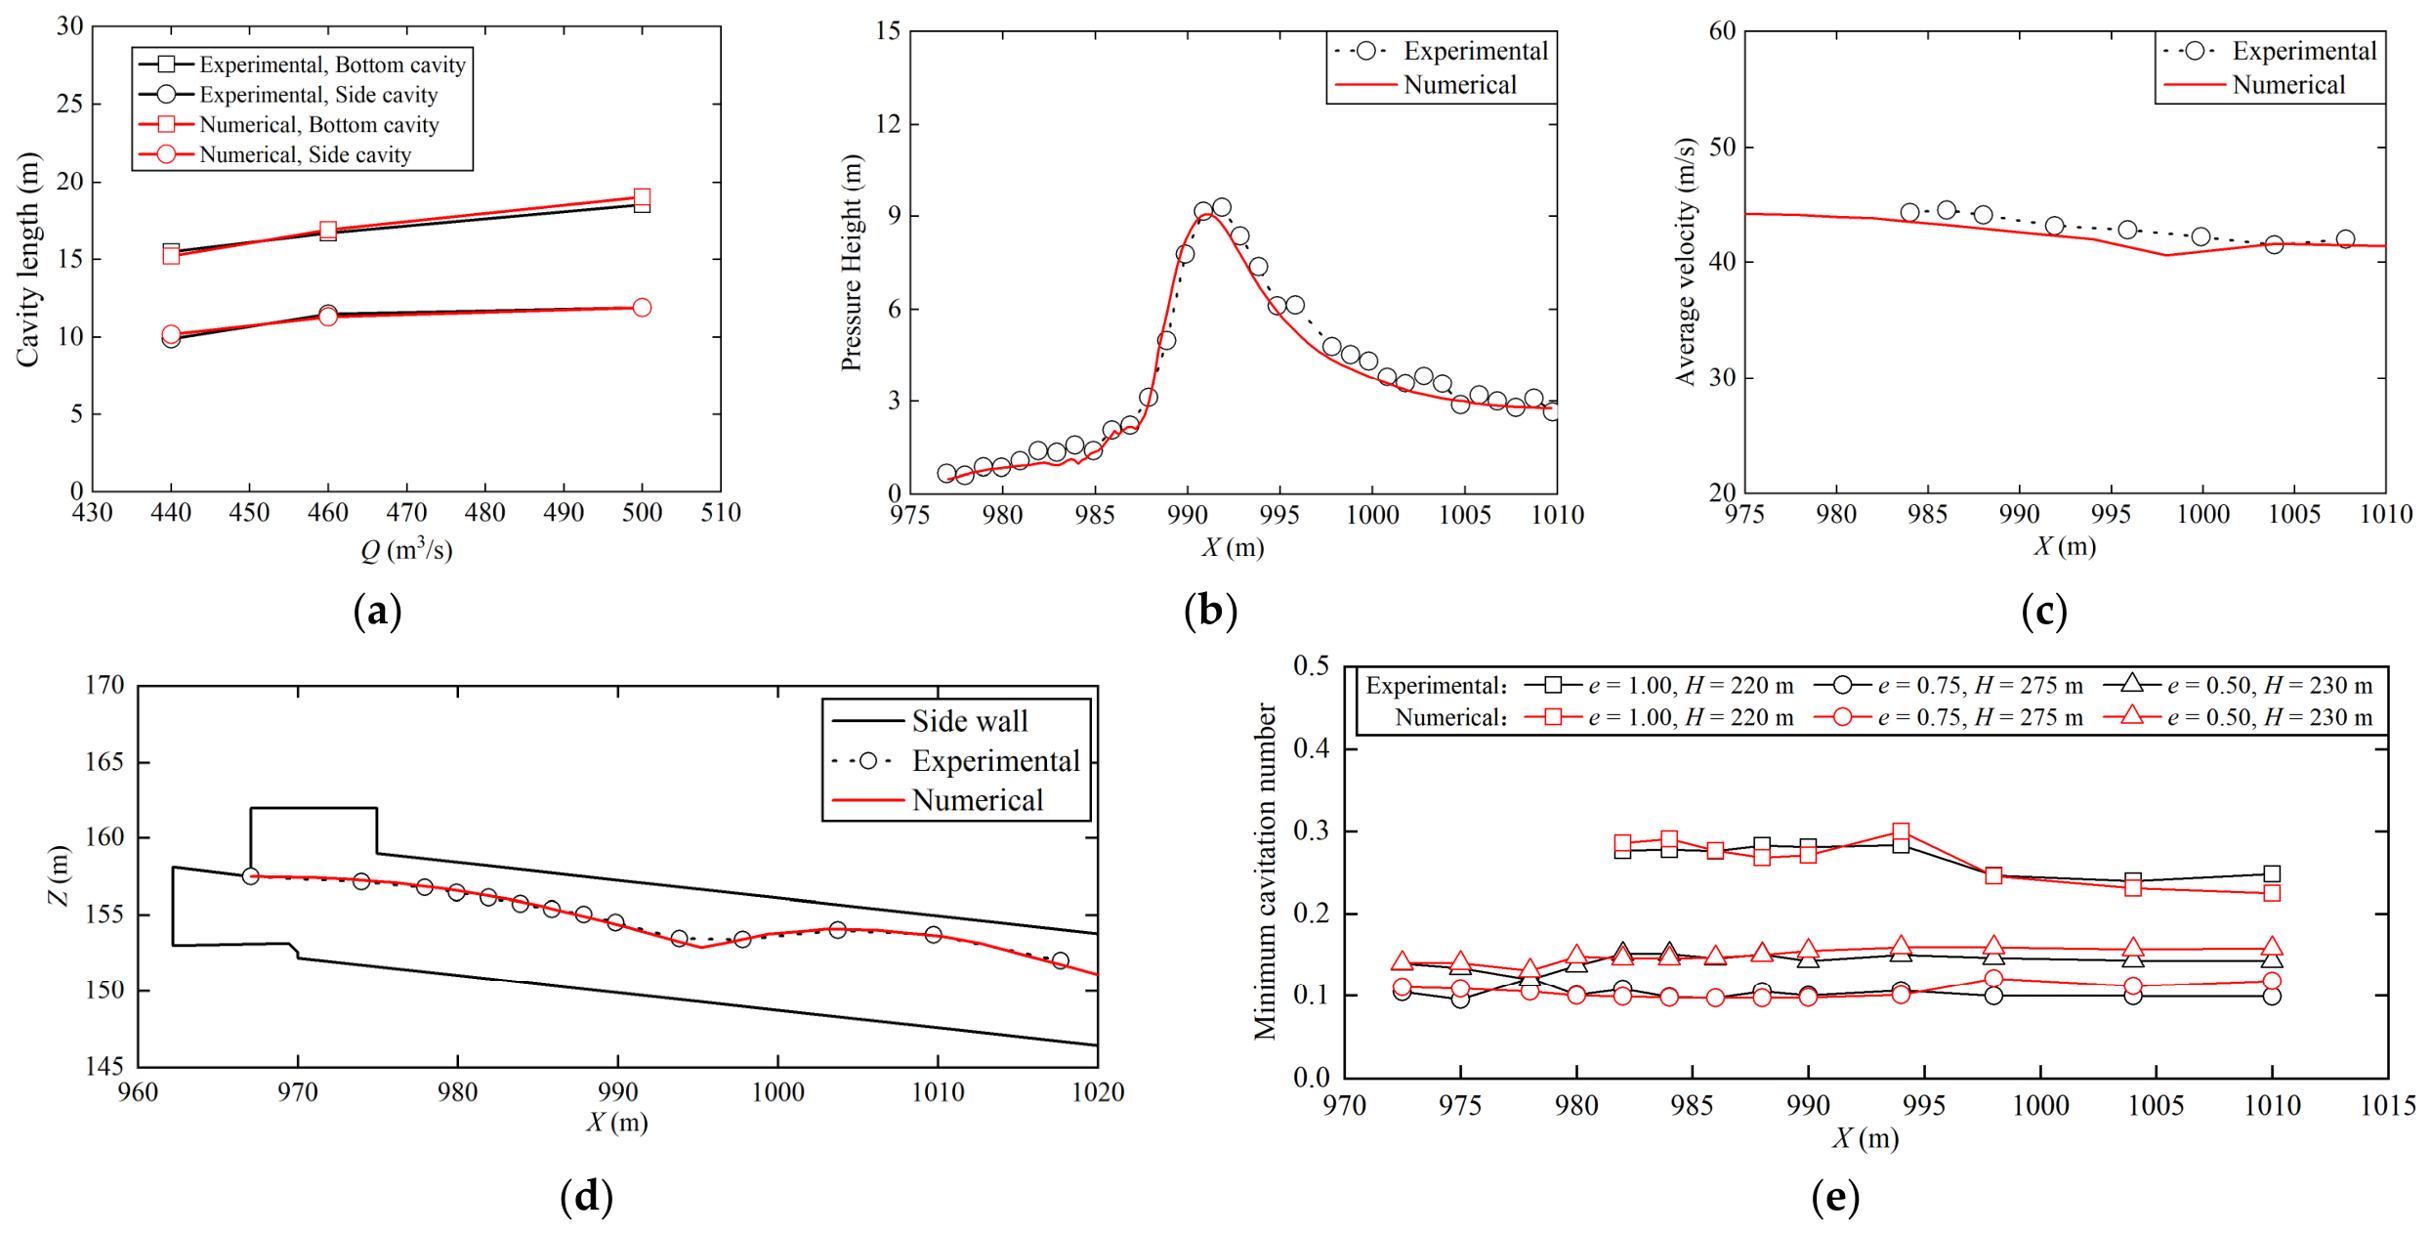
The quantitative comparisons between the numerical simulation and physical model test results are presented in Figure 4, and the coefficient of determination, R2, was used to evaluate their agreement. The results show that the numerical simulations reproduced the variation in cavity length with discharge, as well as the streamwise distributions of the water-surface profile, bottom pressure, cross-sectional mean velocity, and minimum cavitation number, all of which were generally consistent with the experimental results. The R2 values for cavity length, water-surface profile, bottom pressure, cross-sectional mean velocity, and minimum cavitation number at the selected cross-sections were 0.982, 0.997, 0.982, 0.923, and 0.973, respectively, indicating good agreement between the numerical simulation and physical model test results. Overall, the established numerical model can reasonably reproduce the principal hydraulic characteristics, including the free surface, pressure, velocity, cavity morphology, and cavitation number, and can therefore be used for subsequent hydraulic analysis and comparative evaluation of different geometries.
Figure 4.
Comparison between numerical and physical model test results: (a) cavity length; (b) bottom pressure; (c) cross-sectional mean velocity; (d) water-surface profile; (e) minimum cavitation number.
2.3. Side Wall Cavitation Erosion Damage Condition
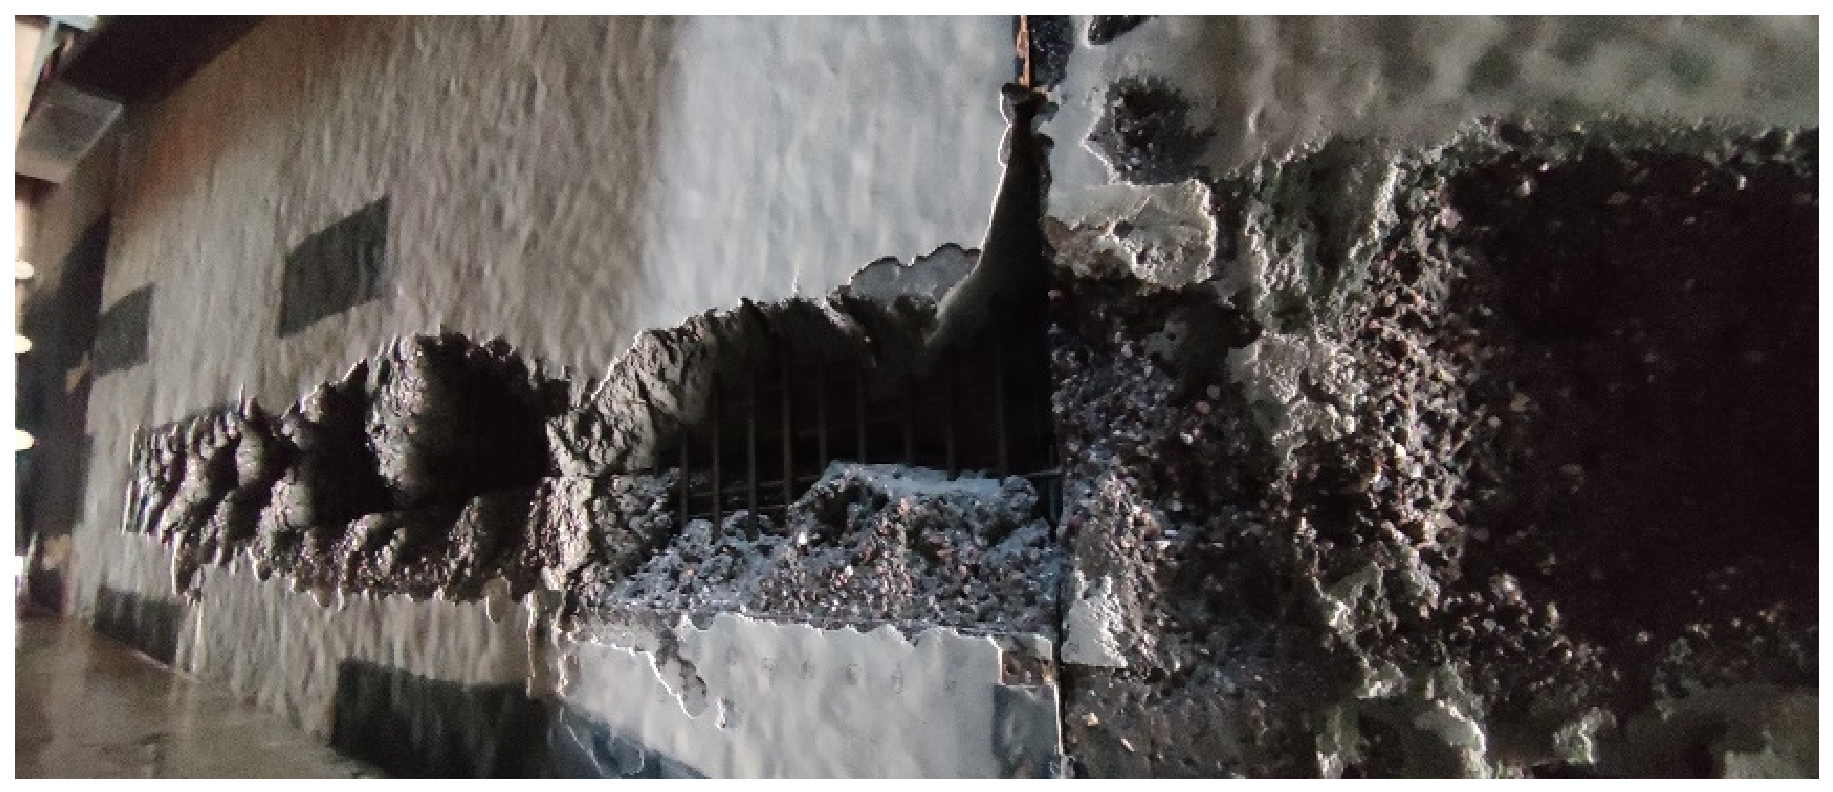
The sediment discharge tunnel of the hydropower project operated for a total of 8346 h from 2018 to 2023. Operating conditions involving high reservoir levels and large gate openings (relative gate opening e = 0.625–1.000) accounted for 53.70% of the total operating time. Post-operation inspections revealed severe damage to the left side wall downstream of the radial service gate. The damaged area began approximately 4 m downstream of the gate and extended approximately 12 m in the streamwise direction, with a maximum width of approximately 2 m and a maximum damage depth of approximately 0.6 m.
As shown in the photographs of the prototype damage (Figure 5), the concrete in the damaged area exhibited honeycomb-like spalling and exposure of the internal reinforcement, which are generally consistent with the typical morphology of cavitation erosion damage [31,32]. Because the structure also serves as a sediment discharge tunnel, the continuous impact and cutting action of sediment particles on the flow-passage surfaces may increase the wall roughness and produce local defects, thereby further aggravating cavitation erosion damage [36]. Based on a comprehensive assessment of the damage morphology and operating conditions, the prototype side-wall damage was considered to be predominantly caused by cavitation erosion, while sediment abrasion and its interaction with cavitation erosion may have contributed to the development of the damage.
Figure 5.
Cavitation erosion damage condition on the left side wall downstream of the radial service gate.
3. Study on Hydraulic Characteristics of the Outlet Open Channel Section of the Radial Gate with Sudden Lateral Enlargement and Vertical Drop
3.1. Flow Pattern
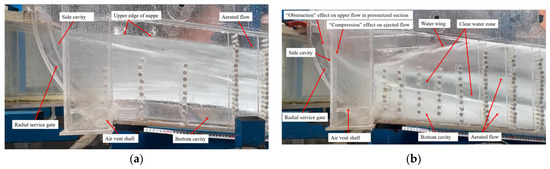
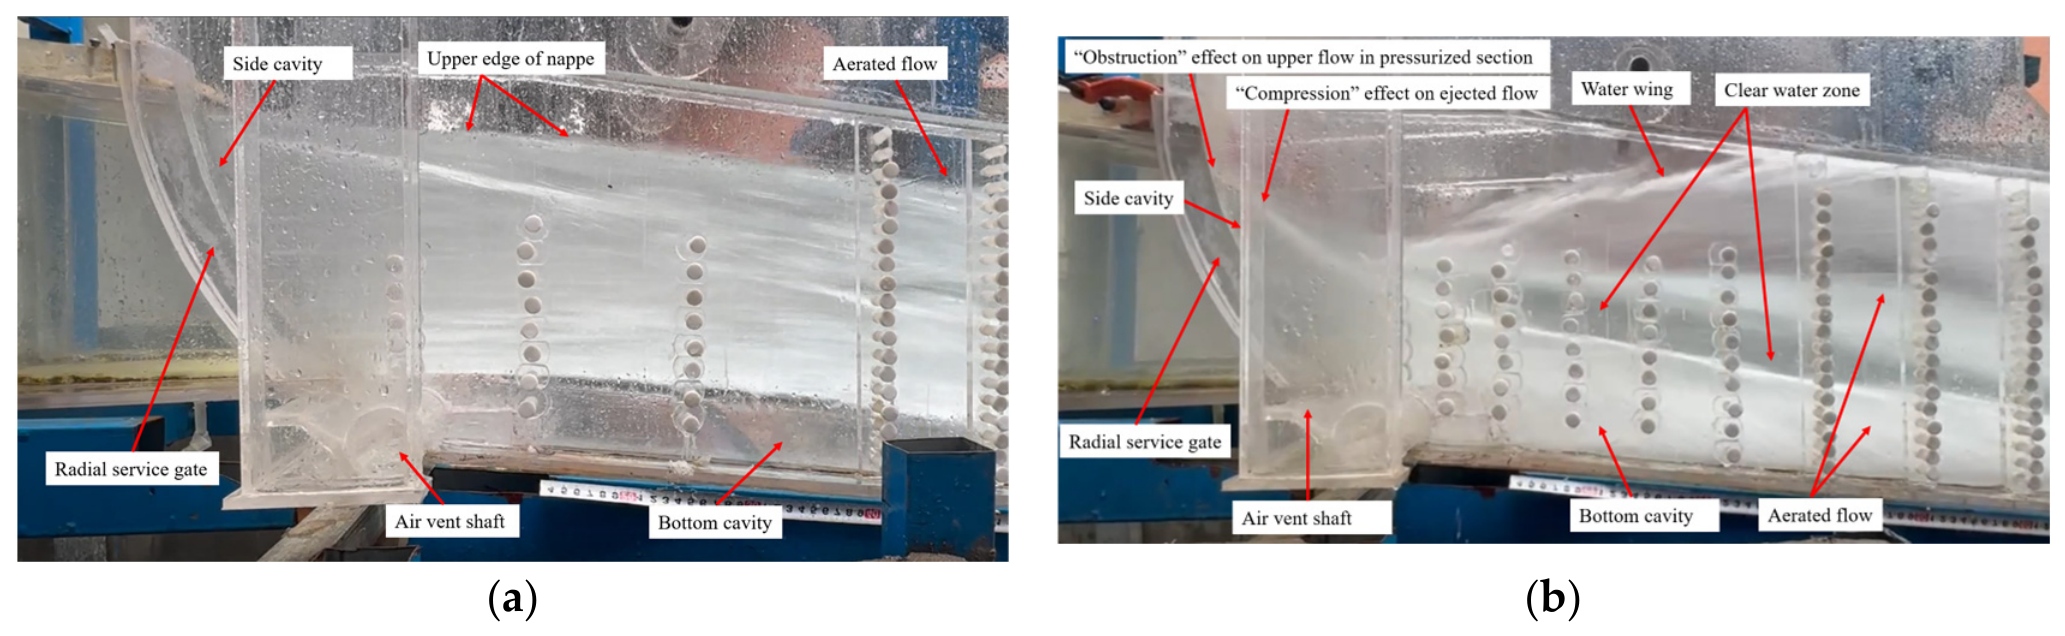
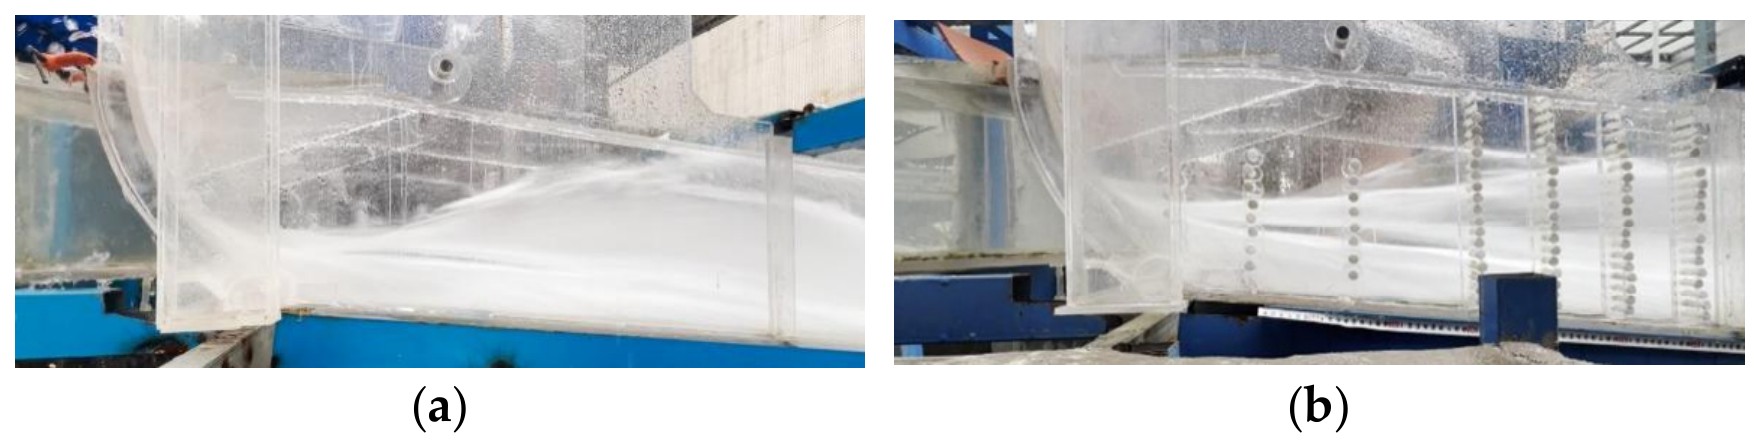
Under the full-opening condition of the radial service gate, the top flow shoots out along the slope line at the outlet of the pressurized section, without significant upward water wings. The flow on both sides naturally diffuses along the sudden lateral enlargement of the side wall, forming a relatively long side cavity. The impact zone on the side wall is large, flow aeration is sufficient, and there is no obvious clear-water zone on the side wall (as shown in Figure 6a). Under the partial-opening condition of the radial service gate, the upper flow in the pressurized section is obstructed by the gate, which in turn compresses the middle and lower flow and forces the water to shoot out downward and sideways at the pressurized outlet. The flow lines of the upper water change significantly compared to those under the full-opening condition of the radial service gate (as shown in Figure 6b), and the impact angle of the side flows on the side walls also increases noticeably compared to that under the full-opening condition.
Figure 6.
Comparison of typical flow patterns between the full opening and partial opening of radial service gate: (a) full opening of radial service gate; (b) partial opening of radial service gate.
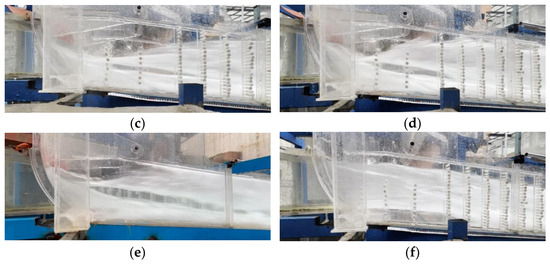
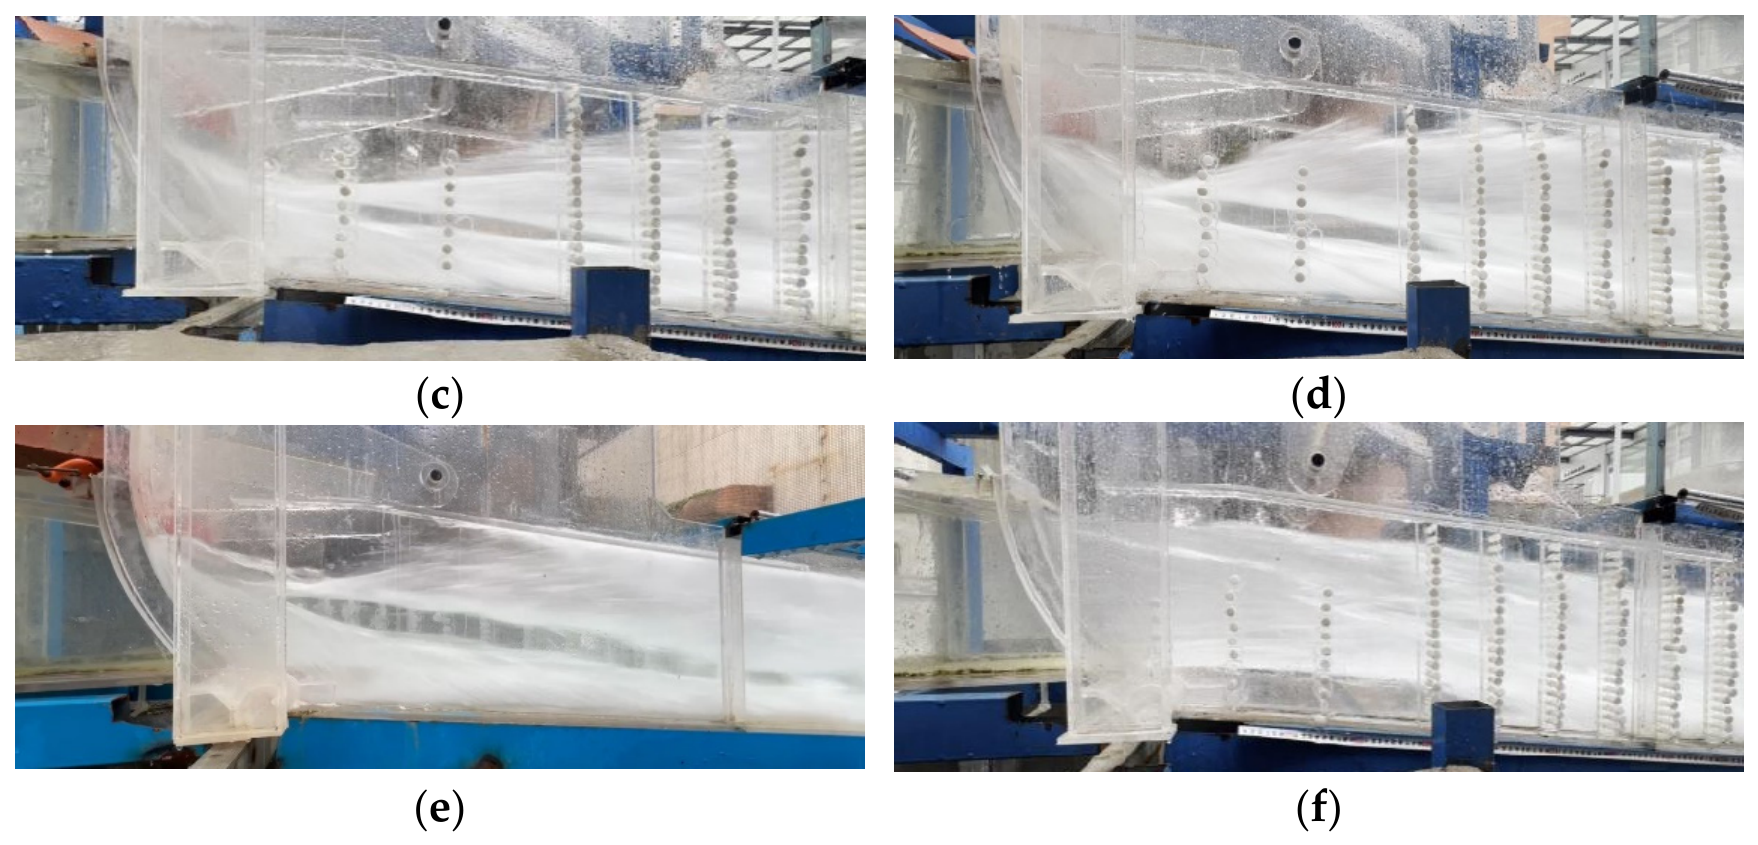
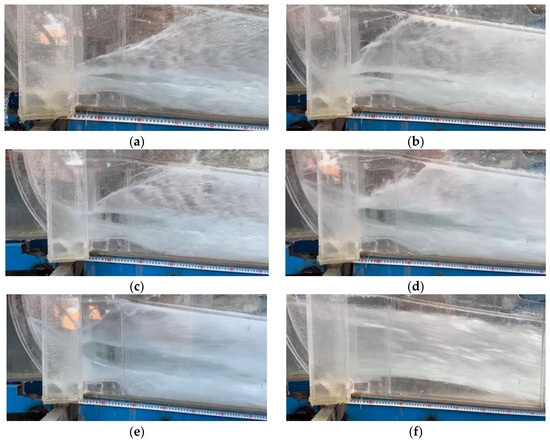
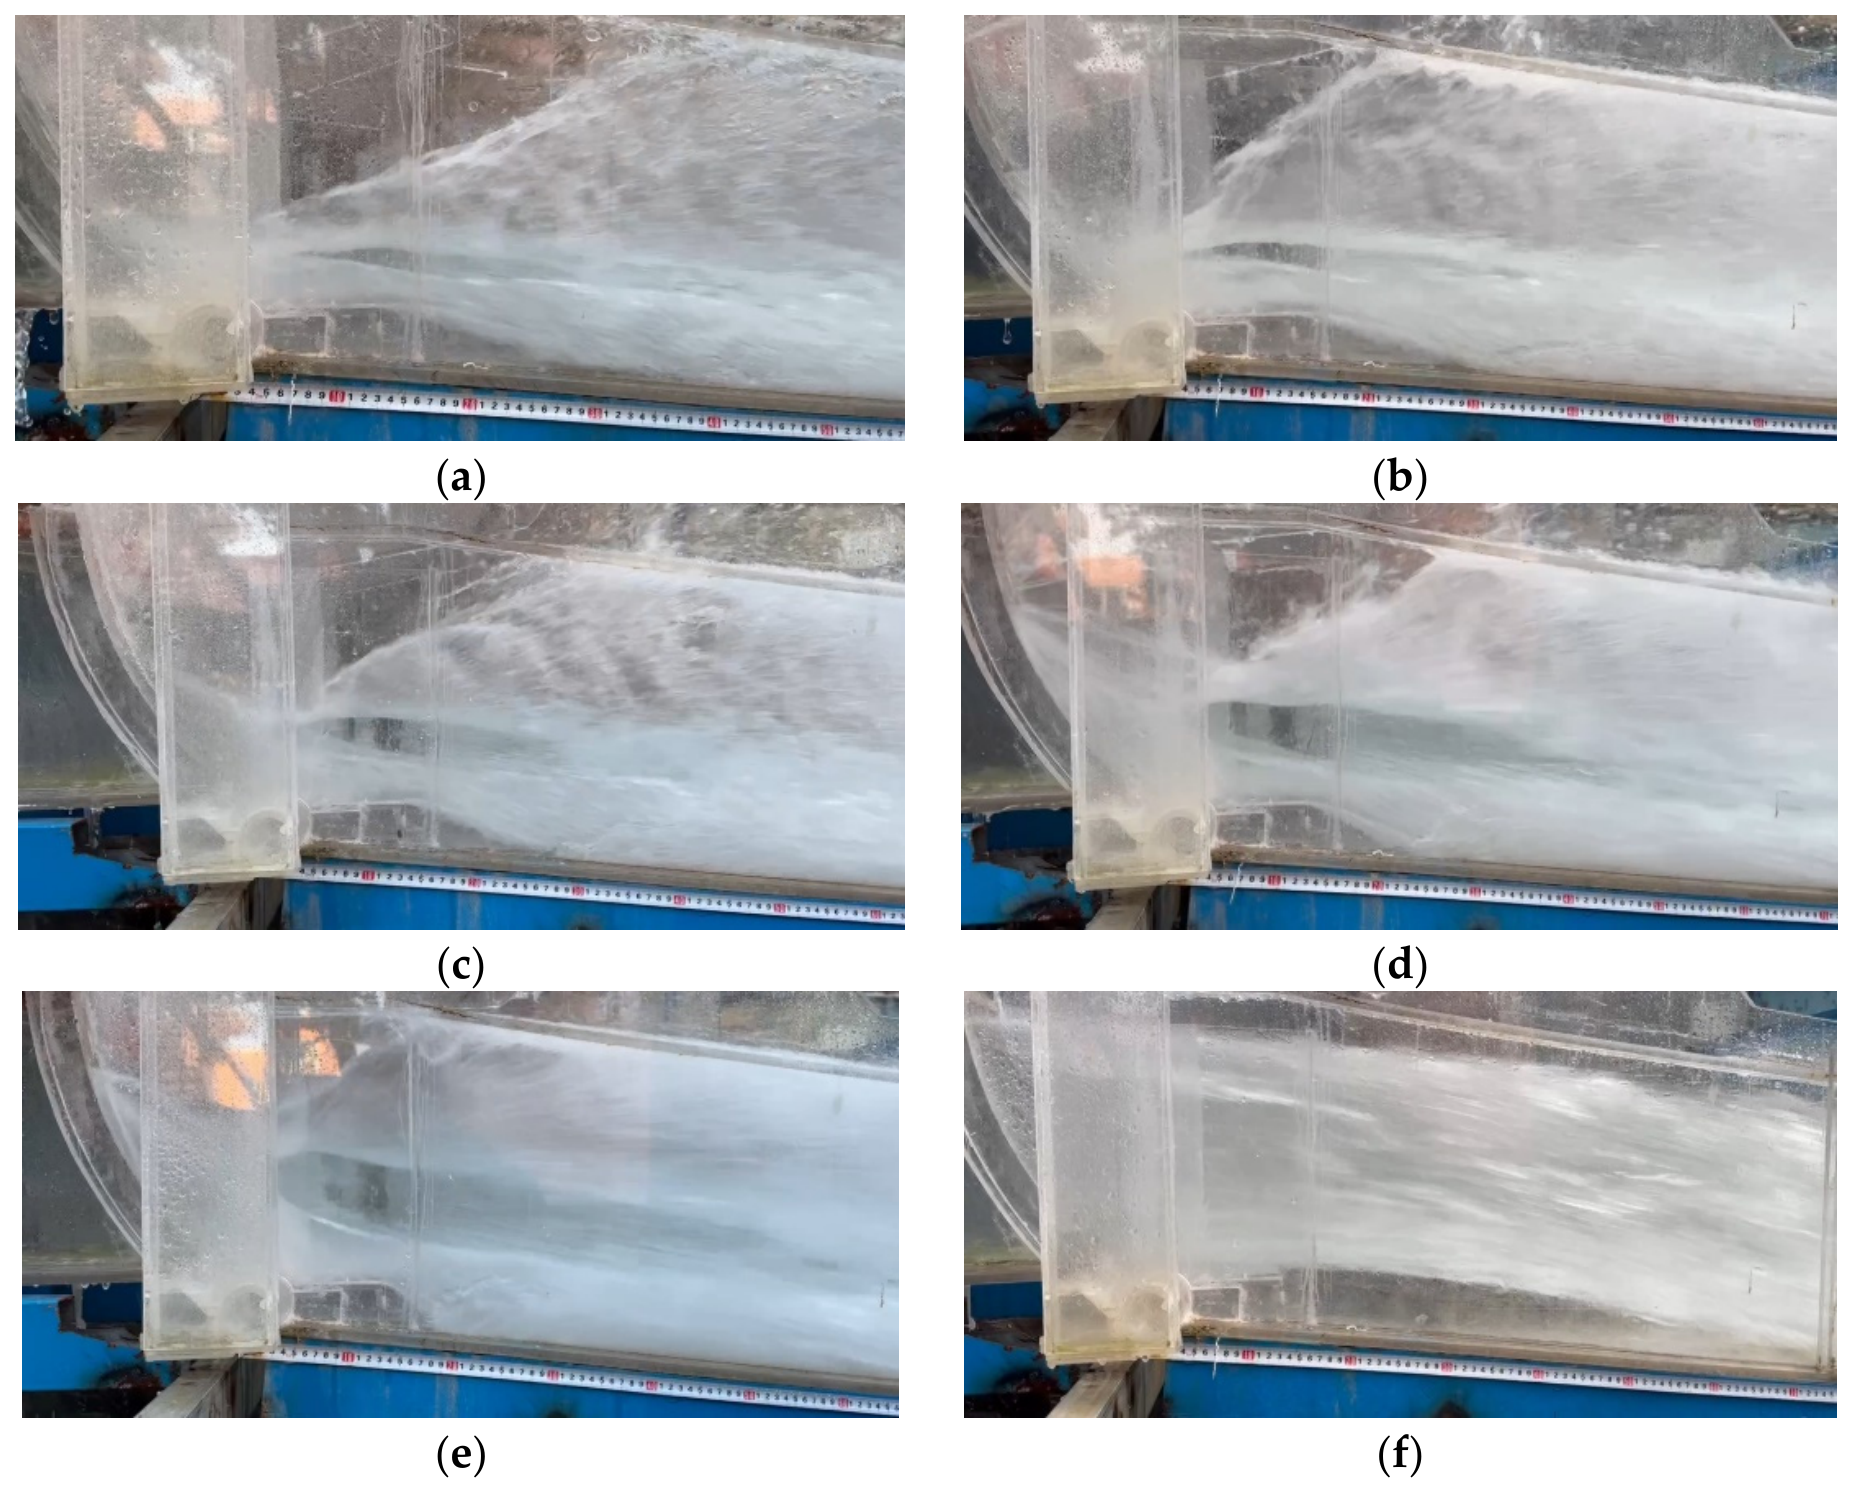
When the radial service gate is fully open, the side cavity is relatively long and provides good aeration protection, with essentially no distinct clear-water zone on the side walls, as shown in Figure 7f. When the radial service gate is partially open, the “obstruction-compression” effect of the gate causes the outlet jet to spread downward and laterally, increasing the angle at which the flow impinges on the side walls. Consequently, the side cavity shortens rapidly, weakening the aeration protection of the side walls. After the flow impinges on and attaches to the side walls, a distinct clear-water zone forms downstream. Within the partial-opening range, the clear-water zone gradually expands as the relative gate opening increases, as shown in Figure 7a–e.
Figure 7.
Flow pattern on side wall of outlet open-channel section when the radial service gate is at different opening degrees: (a) e = 0.375, H0 = 275.00 m; (b) e = 0.500, H0 = 275.00 m; (c) e = 0.625, H0 = 275.00 m; (d) e = 0.750, H0 = 275.00 m; (e) e = 0.875, H0 = 275.00 m; (f) e = 1.000, H0 = 220.00 m.
At a relative gate opening of e = 0.375, the water tongue is relatively thin. Owing to self-aeration from its upper and lower surfaces, the clear-water zone above the bottom cavity remains relatively limited. At e = 0.500, the clear-water zone near the side walls expands slightly, but its height and streamwise extent remain small. At e = 0.625, the clear-water zone expands further and extends a certain distance downstream. At e = 0.750–0.875, an extensive clear-water zone develops on the side walls, and the aeration protection of the side walls becomes essentially ineffective.
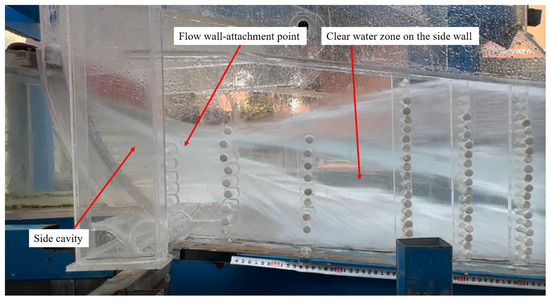
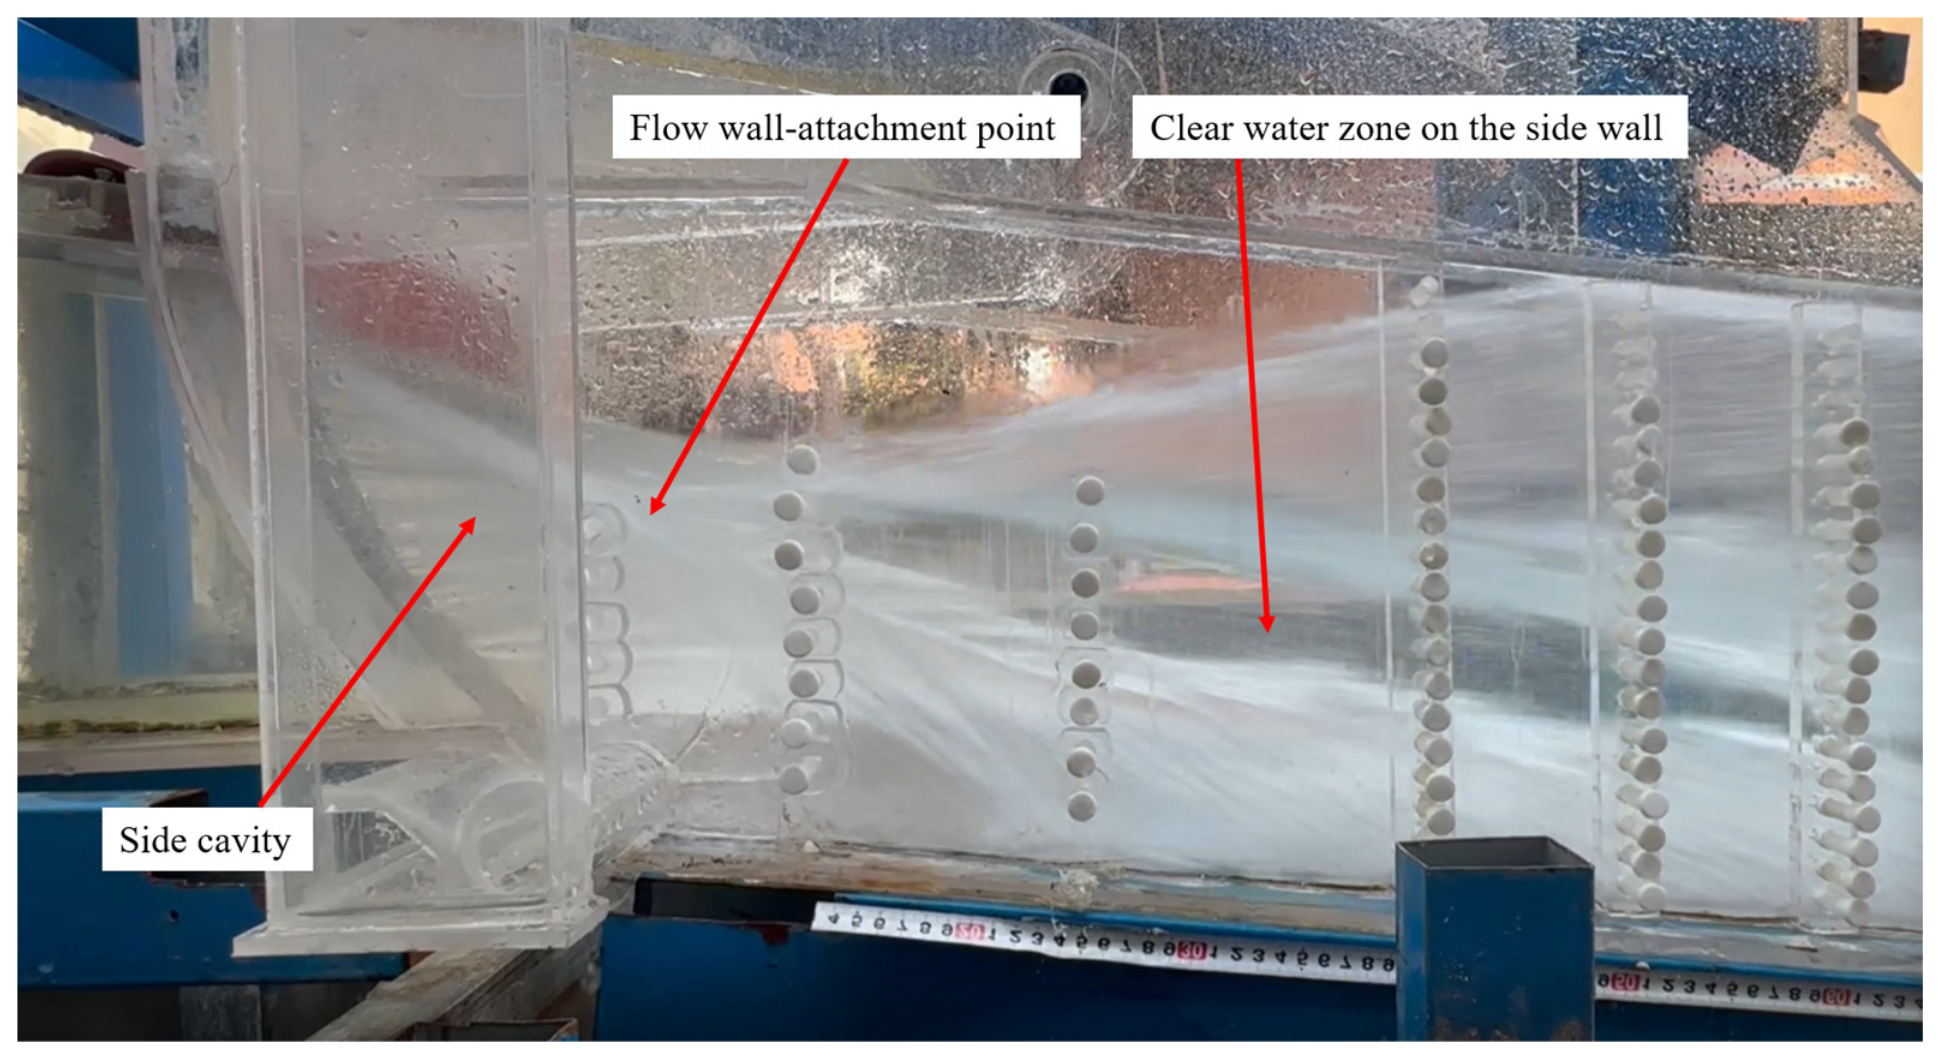
In this study, the clear-water zone refers to a near-wall aeration blind zone formed after flow attachment, which is characterized by a low bubble content and low aeration concentration. Similar phenomena, including clear-water cores, low-air-concentration zones, and locally unaerated zones in flows downstream of bottom or lateral aerators, have also been reported in previous studies [18,19,20,21]. For the original design geometry under partial gate-opening conditions, the clear-water zone observed in this study was mainly located between the side-cavity attachment zone and the bottom-cavity attachment zone and was concentrated within 20 m downstream of the outlet. Measurements using a dual-tip phase-detection needle probe showed that the local aeration concentration in this zone was close to zero, making it difficult to provide effective aeration protection against cavitation erosion. If high near-wall velocity, low wall pressure, and a low local cavitation number occur simultaneously in this zone, the risk of cavitation and cavitation erosion will increase further.
3.2. Cavity Length
The measured cavity lengths for the original design plan are summarized in Table 2. Under the same upstream water level, the smaller the opening of the radial service gate, the longer the bottom cavity. The variation range of the bottom cavity is relatively small, providing sufficient length to ensure an aeration effect. When the radial service gate is fully open, the side cavity length exceeds 10 m, resulting in good flow aeration effect for the side wall. When the radial service gate is partially opened, influenced by the “obstruction-compression” effect of the gate, the incident angle of the flow onto the side wall increases significantly. Coupled with the influence of the upstream water wings formed by the flow impacting the side wall, the side cavity shortens drastically to about 1.0–2.0 m. The aeration effect on the side wall is poor, and the problem of a clear-water zone becomes prominent.
Table 2.
The length of bottom cavity and side cavity from physical model tests.
3.3. Pressure Characteristics
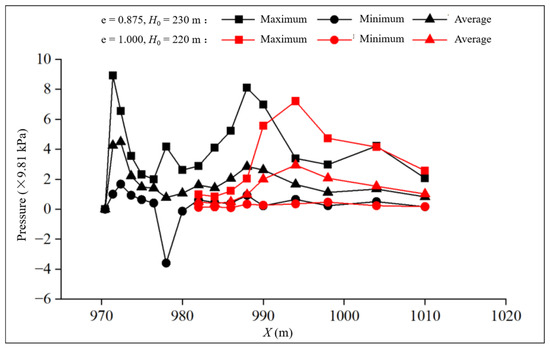
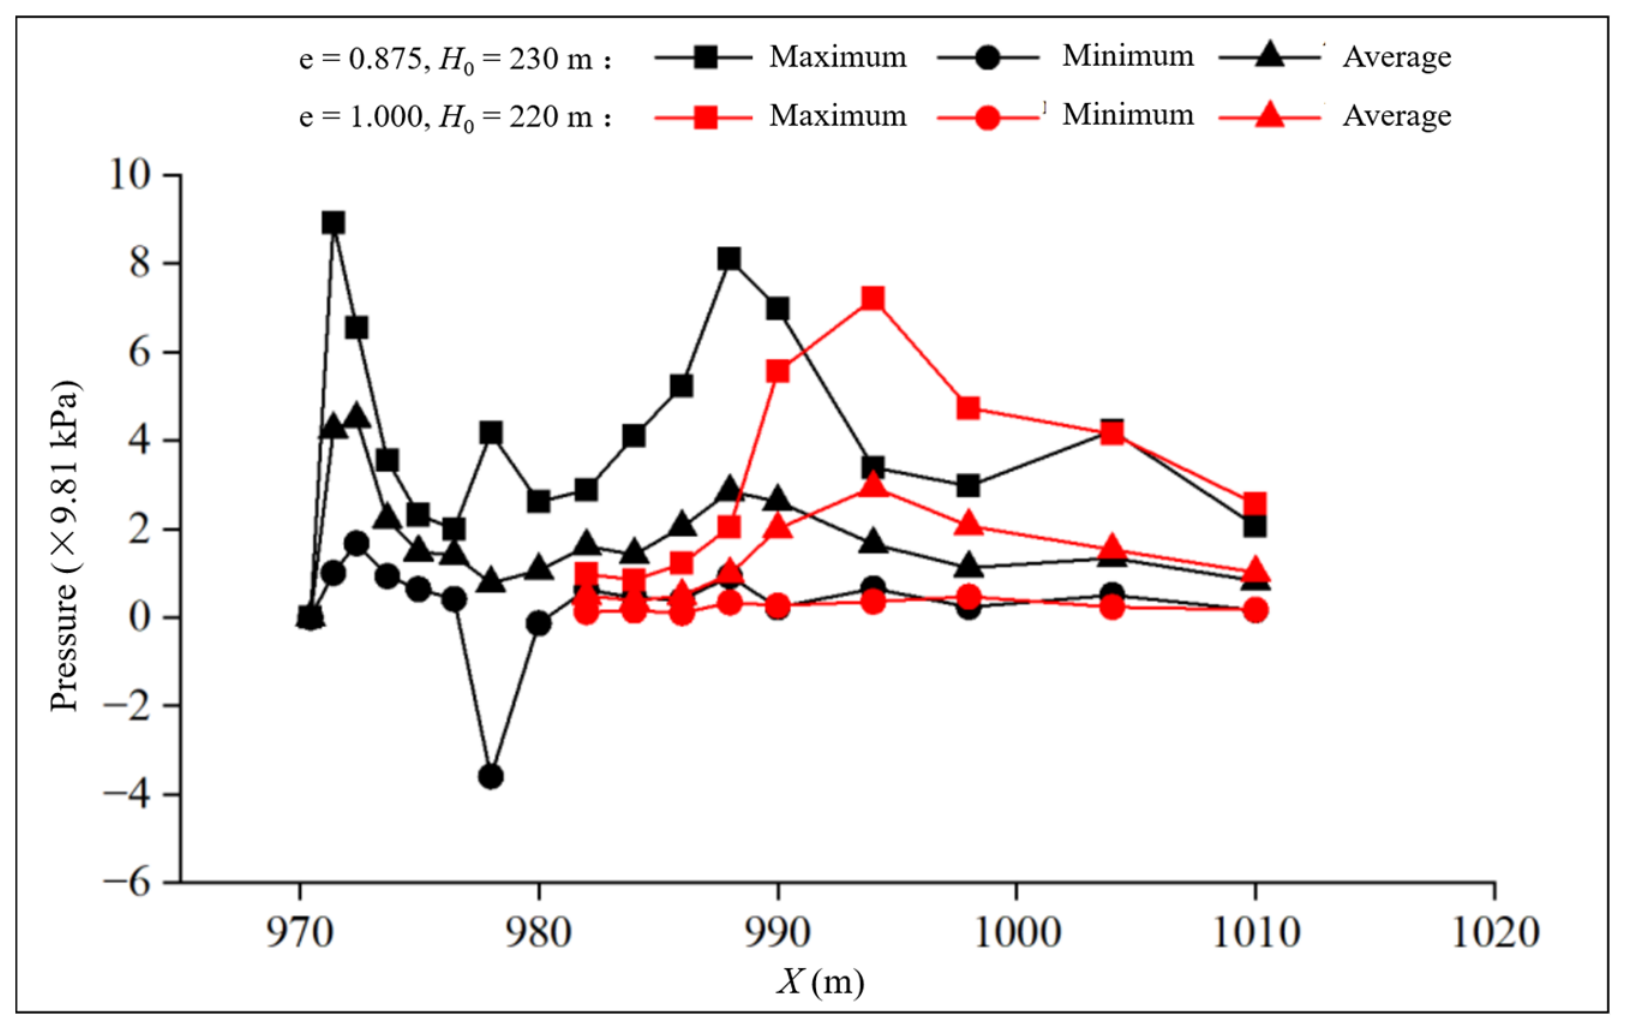
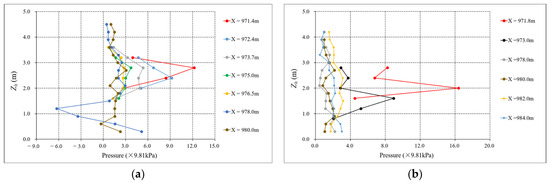
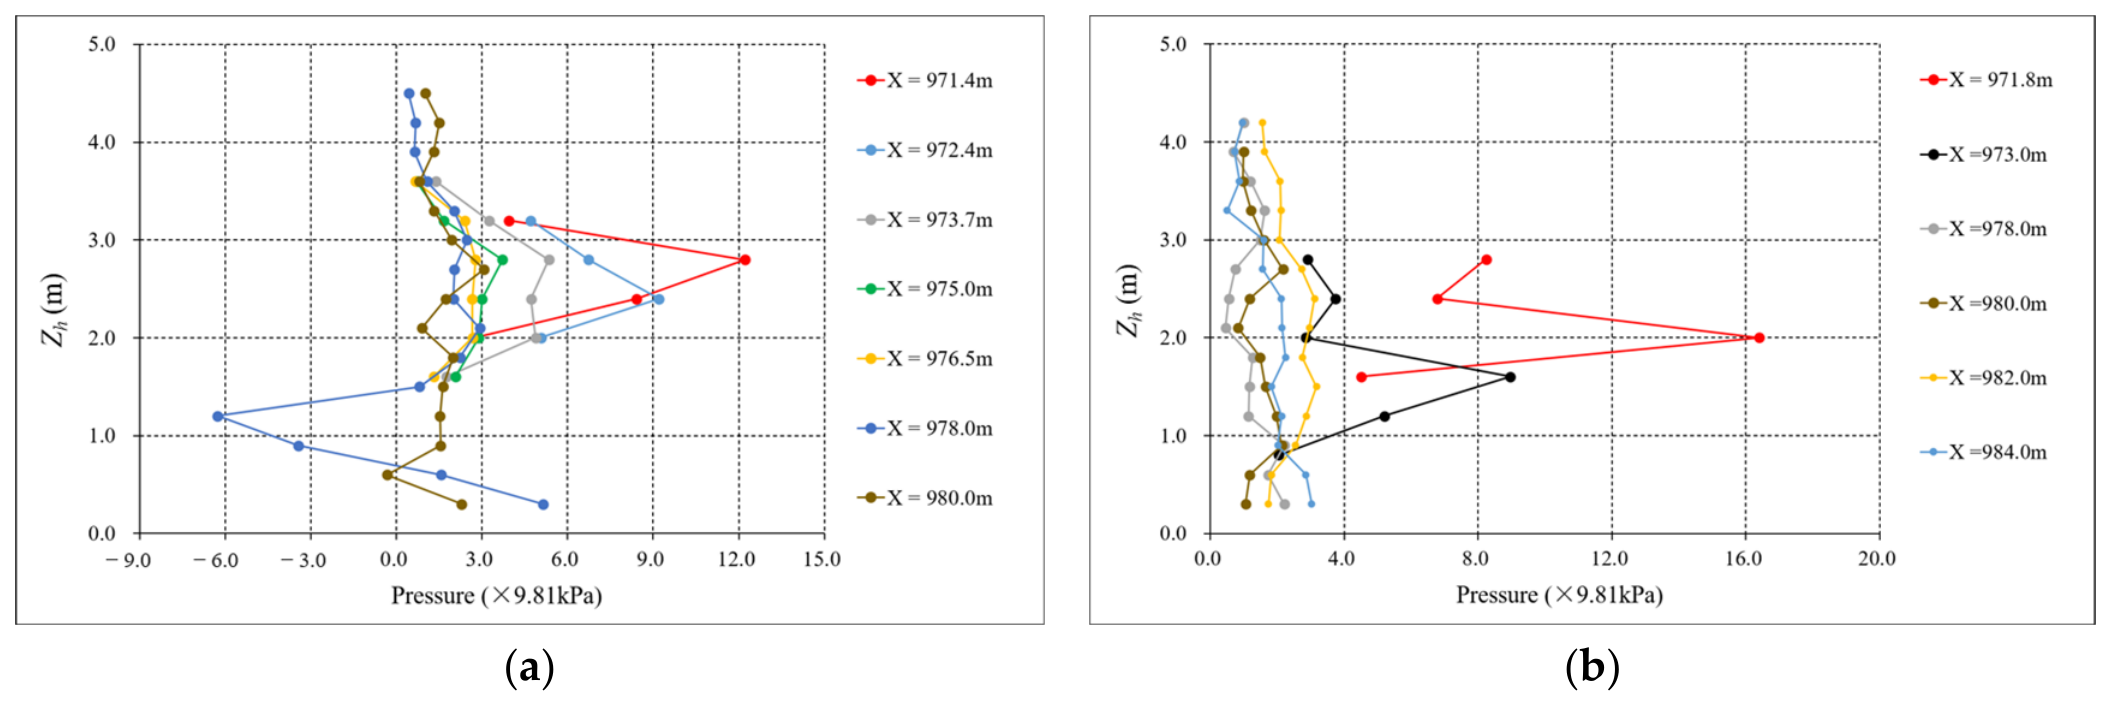
Under the full-opening condition of the radial service gate, after the flow impacts the side walls, there is basically no negative pressure generated, there is no abrupt pressure-change area on the side walls, and the fluctuating pressure is small (as shown in Figure 8a). Under the partial-opening condition of the radial service gate, the pressure in the wall-attached area after the flow impacts the side walls changes drastically. Two distinct pressure peaks appear on the side walls. The upstream impact zone near the gate is caused by the flow directly impacting the side wall, while the downstream impact zone is caused by the bottom cavity flow impacting the baseplate. Near the downstream area of the side wall impact zone, the side wall pressure decreases significantly, and obvious negative pressure is generated (as shown in Figure 8b). Overall, under partial-opening conditions of the radial service gate, whether at small or large openings, the pressure near the area where the flow impacts the side wall increases sharply and then decreases rapidly. Pressure changes violently near the collision area, with significant negative pressure generated. It is speculated that due to the “obstruction-compression” effect of the radial service gate, the incident angle of the flow onto the side wall and the dynamic water impact pressure increase. After impact, rebound occurs, leading to the formation of a distinct high-pressure impact zone and a low-pressure rebound zone, and resulting in a large pressure gradient over a short range.
Figure 8.
The variation in characteristic values of pressure along the side wall under typical working conditions: (a) e = 1.000, H0 = 220 m; (b) e = 0.875, H0 = 275 m.
4. Study on Cavitation Characteristics of the Outlet Open Channel Section of the Radial Gate with Sudden Lateral Enlargement and Vertical Drop
4.1. Flow Velocity and Aeration Characteristics
Regarding the distribution pattern of flow velocity on the side wall, the physical model test and numerical simulation results show good consistency. That is, under an upstream level of 275.00 m and partial-opening condition of the radial service gate, the flow velocities in the flow core region of the side wall reach 43–45 m/s (physical model test results) and 46–48 m/s (numerical simulation results), indicating relatively high flow velocities and a potential risk of cavitation erosion under unfavorable local pressure and aeration conditions.
The physical model test results indicate: Under the full-opening condition of the radial service gate, a good side cavity exists with sufficient aeration, and no aeration blind zone is observed (as shown in Figure 7f). Under small-opening partial-opening conditions of the radial service gate, the side cavity is short, and its aeration function is reduced. The aeration concentration near the side wall cross-section is small. However, due to the small thickness of the flow core region, bubbles entrained by the bottom cavity can quickly rise to achieve full-section aeration effect, and a certain aeration concentration can be maintained along the entire cross-section (as shown in Figure 7a,b). Under large-opening partial-opening conditions of the radial service gate, a distinct clear-water zone appears on the side wall downstream of the impact attachment zone (as shown in Figure 7c–e), posing a risk of cavitation erosion damage. The extent of this clear-water zone is basically consistent with the location where cavitation erosion damage occurred in the prototype.
4.2. Flow Cavitation Number
The flow cavitation number was calculated using the local wall pressure and the corresponding local flow velocity, as follows:
where is the wall gauge-pressure head, ha is the local atmospheric pressure head, hv is the saturated vapor pressure head at the water temperature during the test, v is the local flow velocity at the corresponding position, and g is the gravitational acceleration. The local atmospheric pressure head can be approximately calculated as follows:
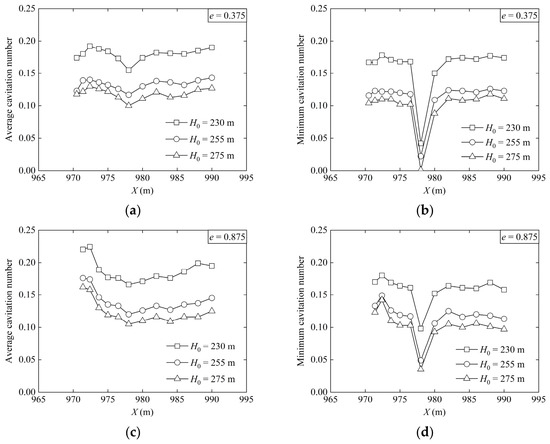
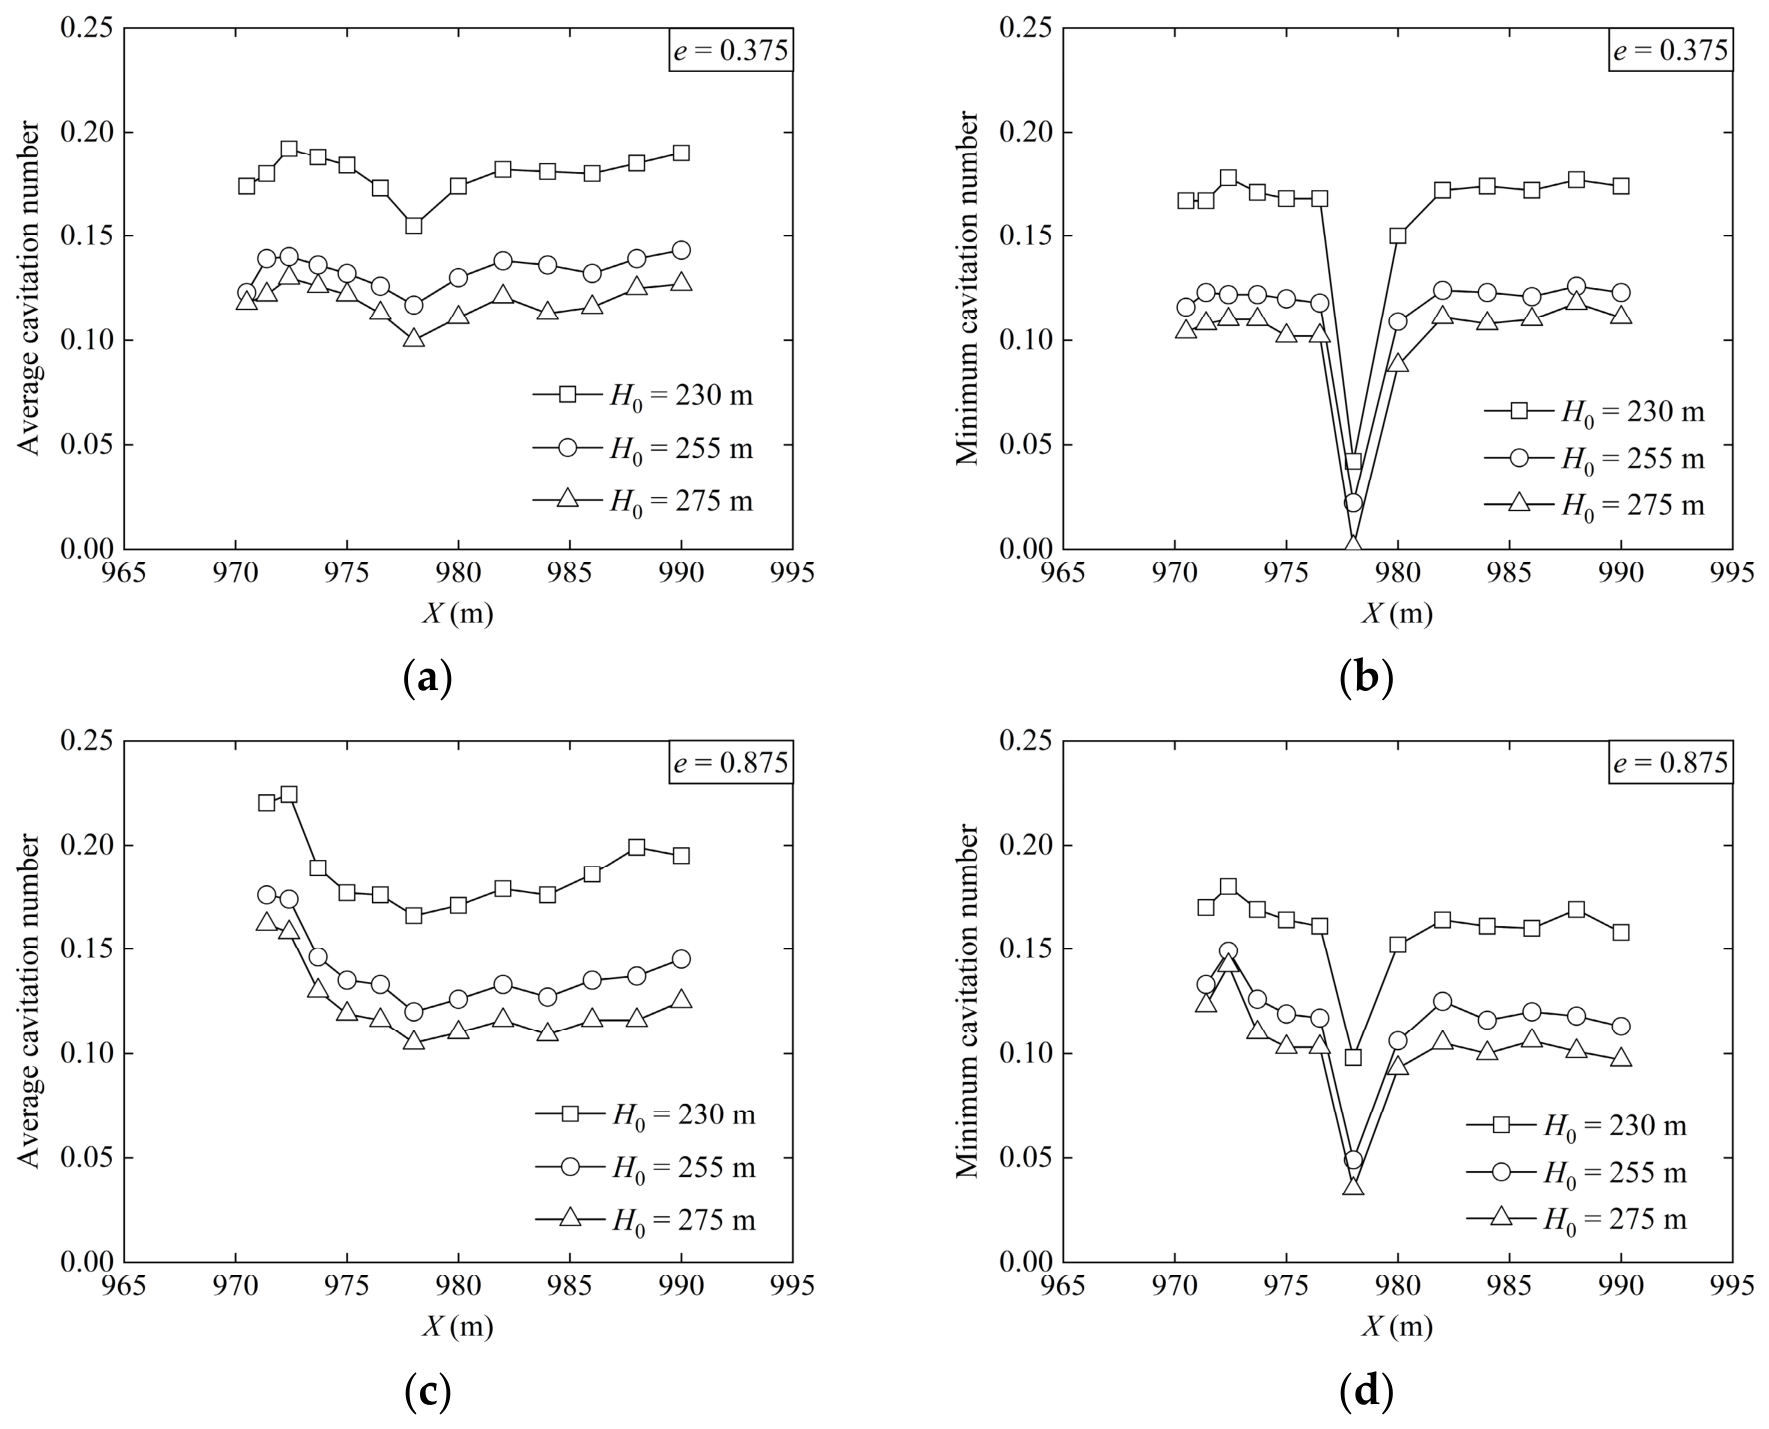
where is the elevation of the sediment discharge tunnel outlet, in m. Based on the side wall pressures and corresponding local flow velocities obtained from the physical model tests, the cavitation number at each position on the side wall was calculated, and the cross-sectional average cavitation number was then obtained. Typical operating conditions are shown in Figure 9.
Figure 9.
The variation in characteristic values of flow cavitation number along the side wall under typical working conditions: (a) e = 0.375, average cavitation number; (b) e = 0.375, minimum cavitation number; (c) e = 0.875, average cavitation number; (d) e = 0.875, minimum cavitation number.
During partial opening of the radial service gate, the streamwise distributions of the average cavitation number are generally consistent under different water levels and gate openings. From the radial service gate to X = 978 m, the average cavitation number gradually decreases and then drops abruptly at X = 978 m, where it reaches the minimum value along the side wall and is significantly lower than those at the adjacent cross-sections. This phenomenon occurs because partial opening of the radial service gate increases the impact of the flow on the side wall in the attachment zone, resulting in a low-pressure rebound zone downstream of the impact zone. As shown in Figure 8b, significant negative pressure is generated near X = 978 m, causing a pronounced decrease in the average cavitation number and a corresponding increase in cavitation risk.
5. Cavitation Mechanism in the Outlet Open-Channel Section of the Radial Gate with Sudden Lateral Enlargement and Vertical Drop
When the radial service gate is fully open, the top flow shoots out along the slope line at the outlet of the pressurized section. The flow on both sides naturally diffuses along the sudden lateral enlargement of the side walls, forming a relatively long side cavity. The impact zone on the side wall is large, flow aeration is sufficient, there is no obvious clear-water zone on the side wall, and the pressure gradient in the impact attachment zone is small, with no obvious abrupt change area.
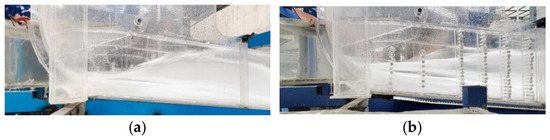
When the radial service gate is partially open, influenced by the “obstruction-compression” effect of the gate, the flow shoots downward and sideways at the pressurized outlet, forming a larger incident angle on the side walls, which causes the side cavity to shorten rapidly, resulting in insufficient aeration on the side walls. After the flow impacts and attaches to the side walls, a distinct clear-water zone forms downstream (as shown in Figure 10), lacking necessary aeration protection. After the flow impacts the side walls at a larger angle, it forms a “ high-pressure impact–low-pressure reflection zone “ on the side walls. The pressure changes drastically, and obvious negative pressure is generated (as shown in Figure 11), leading to a decrease in the flow cavitation number of the wall-attached area and forming a cavitation erosion risk zone. The dual effect of the above factors ultimately results in cavitation erosion damage in the “clear water–low-pressure zone” on the side walls of the outlet open-channel section of the radial gate with sudden lateral enlargement and vertical drop.
Figure 10.
Typical flow patterns on side wall of outlet open-channel section when the radial service gate is partially opened.
Figure 11.
The variation in characteristic values of pressure along the side wall.
It should be noted that the location of the “clear-water–low-pressure zone” on the side wall obtained from the physical model test and numerical simulation is basically consistent with the location of the side wall cavitation erosion damage in the prototype.
6. Research on Measures for Reducing Cavitation on the Side Walls of the Outlet Open-Channel Section of the Radial Gate with Sudden Lateral Enlargement and Vertical Drop
6.1. Problem Clarification
Under the geometry and operating conditions investigated in this study, the “high-pressure impact–low-pressure reflection zone” and the “clear-water zone” were observed on the side walls under partial-opening conditions. To avoid cavitation erosion damage on the side walls, the primary problem to be addressed is insufficient aeration protection in the “clear water–low-pressure zone” on the side walls of the open-channel section of the radial gate with sudden lateral enlargement and vertical drop. The two secondary problems that need to be solved are the impact of the upper water wing on the operational safety of the side walls and tunnel crown when the radial service gate is partially opened, and the formation of swirling flow near the side wall vent by the lower water wing, which affects the aeration effectiveness.
6.2. Formulation of Measures for Reducing Cavitation on the Side Walls
Based on the cavitation mechanism on the side walls of the open-channel section under partial opening of the radial gate with sudden lateral enlargement and vertical drop, and focusing on the clarified primary and secondary problems, the following improvement measures are formulated:
- (a)
- Implementation methods for the secondary sudden lateral enlargement. The main implementation methods for setting up a secondary sudden lateral enlargement on the side walls of the open-channel section include two schemes: (i) “Sudden lateral enlargement of radial gate + gradual enlargement of open-channel section (straight wall) + secondary sudden lateral enlargement”. This scheme can form a secondary sudden lateral enlargement by adjusting the width of the open-channel section, causing the flow to separate from the side walls again after the primary attachment and form a secondary side cavity. However, this method requires increasing the width of the free-flow tunnel section and is more suitable for new projects. If applied to renovation projects, it would lead to secondary expanded excavation, thereby causing issues such as the stability of the tunnel surrounding rock, structural safety, and increased project investment. (ii) “Sudden lateral enlargement of radial gate + open-channel section contraction + secondary sudden lateral enlargement”. In this scheme, the side walls are locally contracted within the existing open-channel section, and a secondary sudden lateral enlargement is formed at the downstream end of the side wall contraction section. This causes the flow to separate from the side walls again after the primary attachment and form a secondary side cavity, thereby improving the aeration conditions of the downstream side walls. This method can adapt to the structural characteristic where the gate chamber section after the sudden lateral enlargement of the radial service gate is of the same width as the free-flow tunnel section. It does not require expanded excavation of the existing tunnel and only requires local modification of the existing side walls, resulting in a relatively small amount of renovation work. Therefore, it is more suitable for the renovation of existing projects. Considering the requirements for forming a secondary side cavity, the structural conditions of the existing tunnel, and the amount of renovation work, the second scheme was adopted in this study.
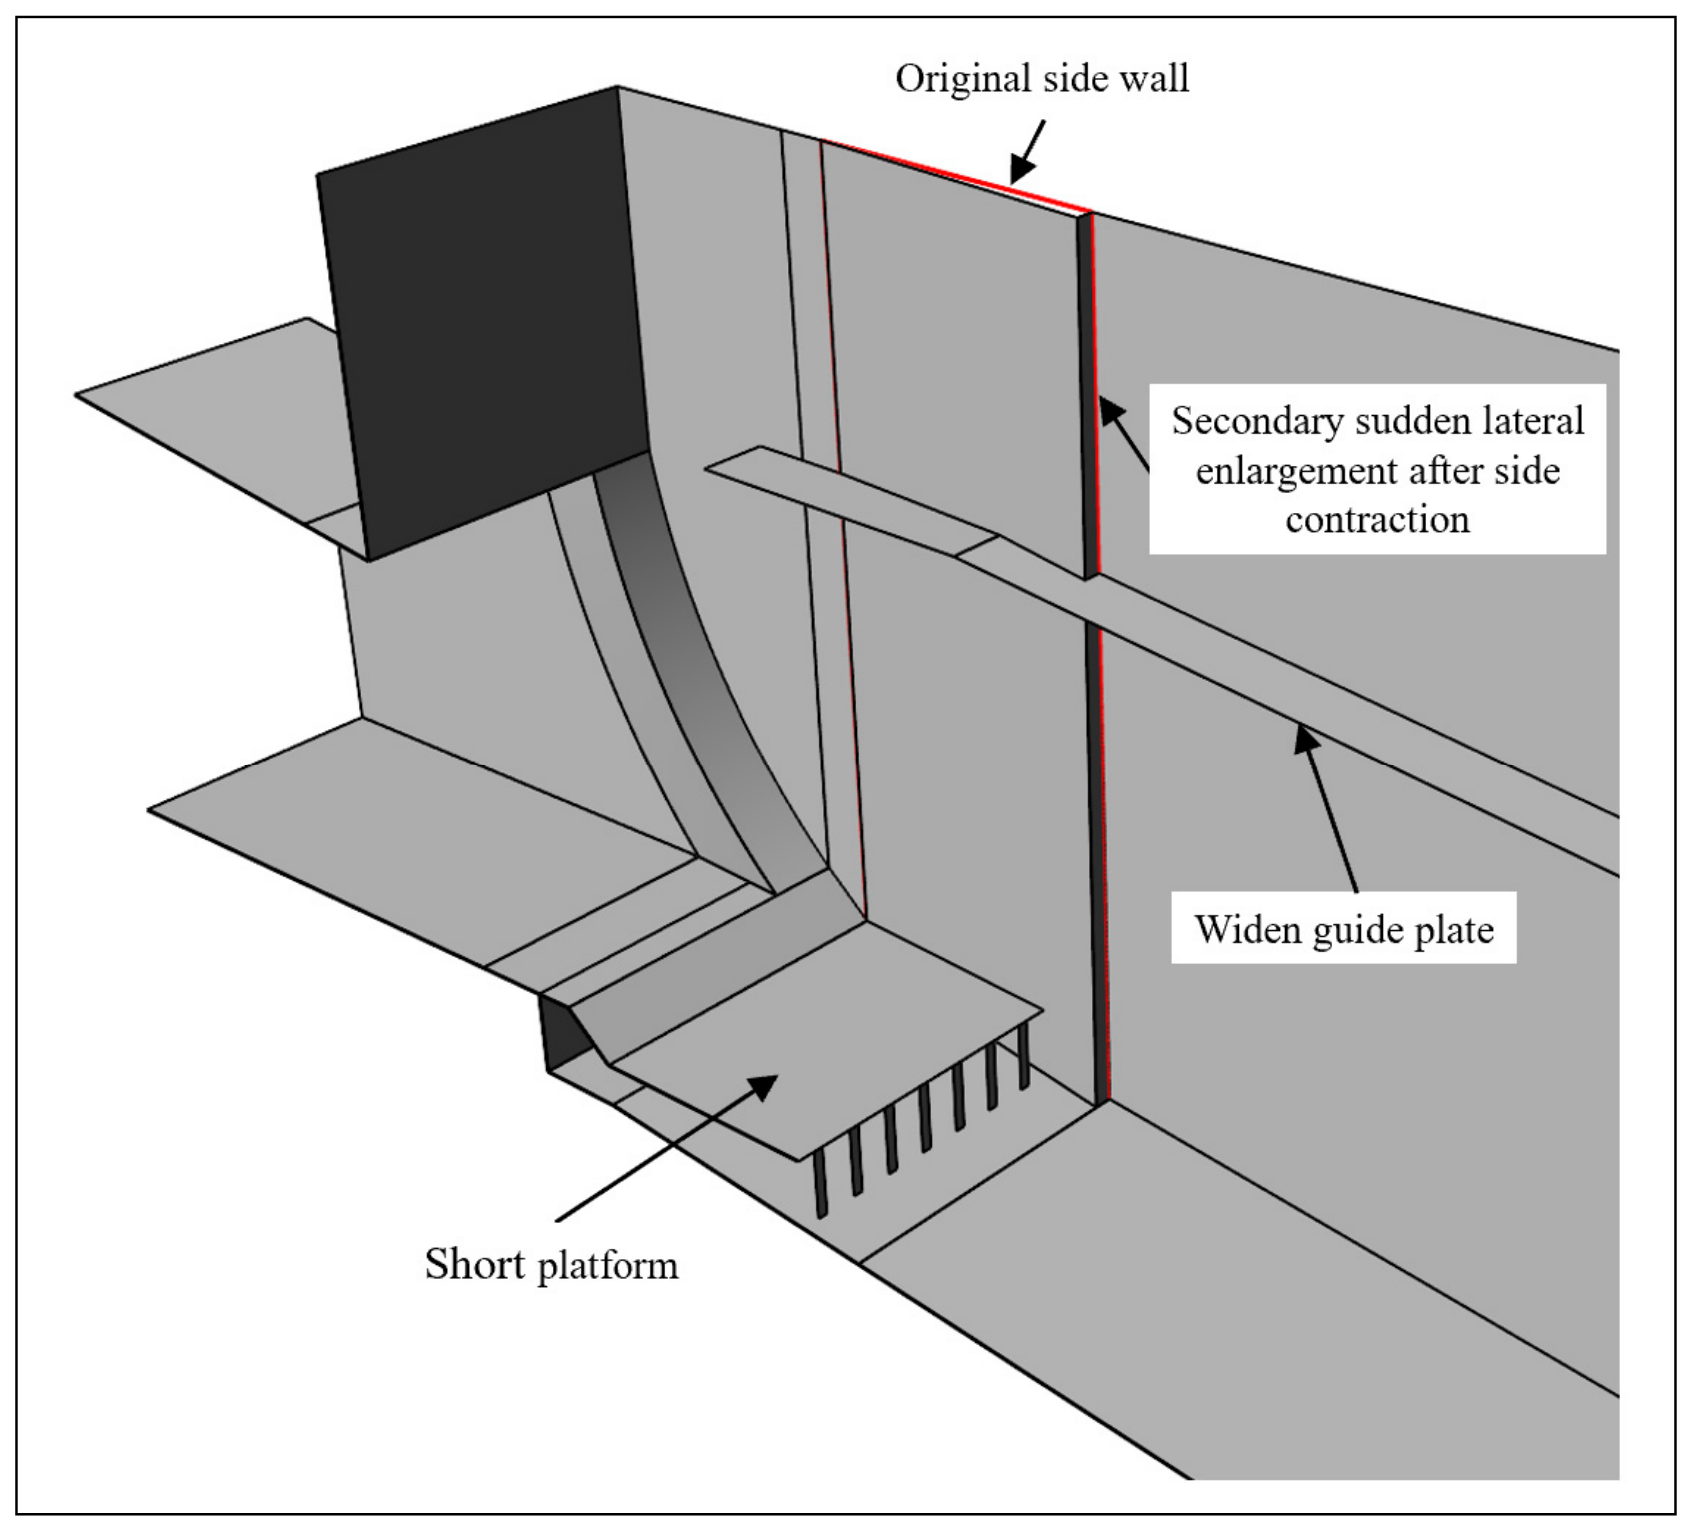
The location and dimensions of the side wall contraction section were determined mainly according to the attachment location of the primary side cavity under the original design plan, the extent of the downstream clear-water zone, the flow impact trajectory, and the arrangement of the existing side walls and side wall vents. The side wall contraction section was arranged within the original clear-water zone on the side walls, with a length of 3.5 m from chainage 970.00 to 973.50 m. The contraction dimension on each side was 0.21 m, forming a secondary sudden lateral enlargement at the downstream end of the side wall contraction section and generating a secondary side cavity while minimizing the influence on the flow cross-section of the open-channel section.
- (b)
- Adverse effects of the upper water wing under partial opening of the radial service gate. When the radial service gate is partially open, part of the flow develops upward after impacting the side walls and forms an upper water wing. To restrict the development of the upper water wing, a 1.2 m-wide guide plate was installed at the top of the side walls based on experience from similar projects. The guide plate is mainly used to restrict the spreading of the flow toward the upper part of the side walls and reduce the adverse effects of the upper water wing and splashing flow. This measure can be installed directly on the top of the existing side walls without changing the main tunnel structure, resulting in a relatively small amount of renovation work.
- (c)
- Adverse effects of the lower water wing under partial opening of the radial service gate. Observation shows that when the radial service gate is partially opened at a small opening, the flow impact point is relatively close to the side wall vent. The lower water wing (or water curtain) formed after the flow impacts the side walls may shield the vent, thereby reducing its ventilation and aeration effectiveness. To address this problem, a 2.75 m-long horizontal baffle (short platform) was installed above the side wall vent. The main function of the platform is to block the development of the lower water wing toward the vent and separate the water curtain from the vent inlet, thereby reducing the shielding effect of the lower water wing and maintaining an unobstructed ventilation passage. The platform length was determined according to the flow impact location under small-opening conditions, the influence range of the lower water wing, and the arrangement of the side wall vent. This measure only requires the local installation of a platform above the existing side wall vent and involves relatively minor modification of the original structure.
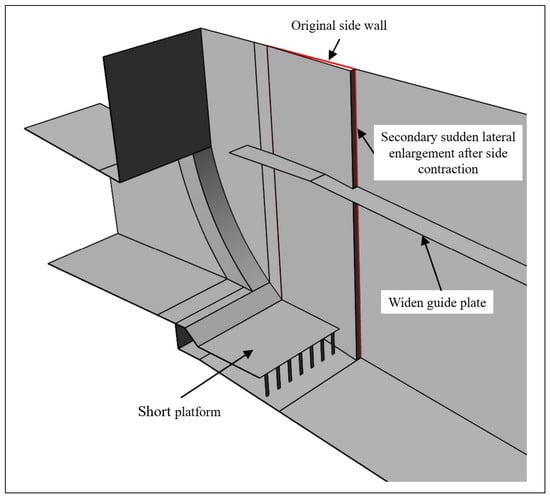
Based on the above improvement concepts, the improvement measures for the structural shape modification of the open-channel section of the radial gate with sudden lateral enlargement and vertical drop of the sediment discharge tunnel of a hydroproject include: (i) carrying out “contraction of open-channel section side wall + secondary sudden lateral enlargement” in the original clear-water zone on the side walls of the open-channel section, with a contraction length of 3.5 m from chainage 970.00 to 973.50 m and a secondary sudden lateral enlargement dimension of 0.21 m on each side; (ii) adding a 2.75 m-long short platform downstream of the sudden vertical drop of the radial service gate; and (iii) installing a 1.2 m-wide guide plate at the top of the side walls. The resultant improved plan for the open-channel section of the radial gate with sudden lateral enlargement and vertical drop is shown in Figure 12. Physical model tests and numerical simulations were conducted for the final combined improved plan, and the results were compared with those of the original design plan under the same operating conditions. It should be noted that individual measures, such as the guide plate and short platform, were not separately evaluated through independent physical model tests or numerical simulations. Therefore, this study mainly evaluates the overall improvement effect of the combined improved plan, and the individual contribution of each measure has not been quantitatively distinguished.
Figure 12.
Three-dimensional schematic diagram of the improved plan for the open-channel section of the radial gate with sudden lateral enlargement and vertical drop.
6.3. Verification of Measures for Reducing Cavitation on the Side Walls
6.3.1. Flow Pattern
When the radial service gate is fully open, measures such as the “short platform after the sudden vertical drop” and the “contraction of open-channel section side wall + secondary sudden lateral enlargement” do not affect the flow pattern. The flow pattern remains consistent with the original design plan, the side cavity is long, the aeration protection effect is good, and there is essentially no clear-water zone on the side walls (as shown in Figure 13f). During partial opening of the radial service gate, the flow impacts the side wall contraction section after passing the outlet sudden lateral enlargement. It then develops downstream under the constraint of the side wall contraction, forming a clear-water zone in the side wall contraction section. After the secondary sudden lateral enlargement, a secondary side cavity forms, forcibly aerating the flow. The clear-water zone downstream of the secondary sudden lateral enlargement essentially disappears (as shown in Figure 13a–e). Due to the side wall contraction, the intensity of the upper water wing is significantly increased compared to the designed shape, but the guide plate at the top of the side wall effectively restricts its upward development. Due to the setting of the short platform after the sudden vertical drop, the lower water wing first shoots obliquely onto the short platform and then flows out horizontally, increasing the distance between the impact zone of the water wing and the vent and reducing the influence of the lower water wing on the vent.
Figure 13.
Flow pattern on side wall of outlet open-channel section when the radial service gate is at different opening degrees (improved plan): (a) e = 0.375, H0 = 275.00 m; (b) e = 0.500, H0 = 275.00 m; (c) e = 0.625, H0 = 275.00 m; (d) e = 0.750, H0 = 275.00 m; (e) e = 0.875, H0 = 275.00 m; (f) e = 1.000, H0 = 220.00 m.
6.3.2. Cavity Length
The measured cavity lengths for the improved plan are summarized in Table 3. Under the same upstream water level, the smaller the opening of the radial service gate, the longer the bottom cavity. The variation range of the bottom cavity is relatively small, providing sufficient length to ensure aeration effect. When the radial service gate is fully open, the side cavity length exceeds 10 m, resulting in good flow aeration effect for the side wall. When the radial service gate is partially opened, influenced by the “obstruction-compression” effect of the gate, the incident angle of the flow onto the side wall increases significantly. Coupled with the influence of the upstream water wings formed by the flow impacting the side wall, the primary side cavity shortens sharply to 1.5 m–2.5 m. After the flow passes through the secondary sudden lateral enlargement, a secondary side cavity with a length of 4.5 m–7.5 m is formed. The attachment zone of the secondary side cavity is between chainage 978.00 m and 981.00 m (the original side wall damage area). After the flow fully aerated by the two-stage side cavities contacts the original side wall, it is already heavily aerated, significantly reducing the risk of cavitation erosion damage on the side walls.
Table 3.
The length of bottom cavity and side cavity from physical model tests (improved plan).
6.3.3. Pressure Characteristics
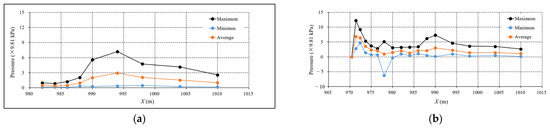
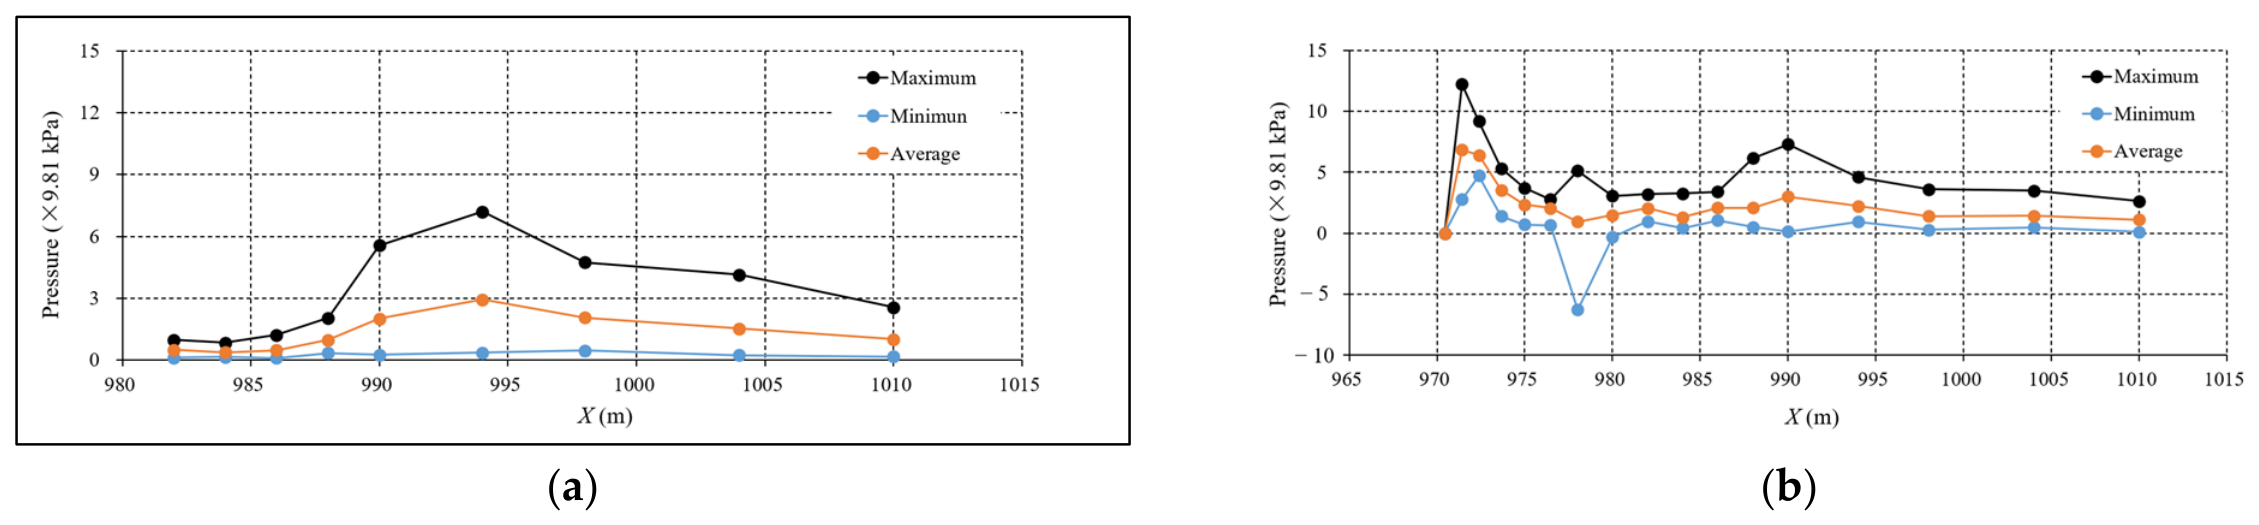
Under the full-opening condition of the radial service gate, there is essentially no negative pressure generated after the flow impacts the side walls. There is no abrupt change area in side wall pressure, and the fluctuating pressure is small. Under the partial-opening condition of the radial service gate, the contraction section before the secondary sudden lateral enlargement is located near the flow impact zone, the time-averaged pressure and fluctuating pressure are relatively large, and the pressure variation within the contraction section is relatively intense. After the flow passes through the secondary side cavity formed by the secondary sudden lateral enlargement and reattaches to the wall, pressure impact and drop occur near the attachment zone. However, no significant low-pressure rebound zone appears downstream of the second pressure impact zone. No negative pressure is generated after the flow reattaches to the wall for the second time, and the pressure variation is relatively stable, having a smaller impact on the side walls. Overall, compared to the original design plan, which exhibited obvious “high-pressure impact–low-pressure reflection zone”, intense pressure changes, and clear negative pressure generation (as shown in Figure 14a), the improved plan (as shown in Figure 14b) shows that under various openings of the radial service gate, no negative pressure is generated on the side walls within the flow core region.
Figure 14.
Pressure distribution diagram of side wall under typical working conditions (e = 0.875, H0 = 275 m) in original design plan and improved plan: (a) original design plan; (b) improved plan.
6.3.4. Flow Velocity and Aeration Characteristics
Regarding the flow velocity on the side walls, the physical model test and numerical simulation results show good consistency. That is, under an upstream level of 275.00 m and a partial-opening condition of the radial service gate, the flow velocities in the flow core region of the side wall reach 43–45 m/s (physical model test result) and 46–48 m/s (numerical simulation result). The physical model test results indicate:
- (a)
- Under the full-opening condition of the radial service gate, a good side cavity exists, the side cavity aeration is sufficient, and no aeration blind zone occurs.
- (b)
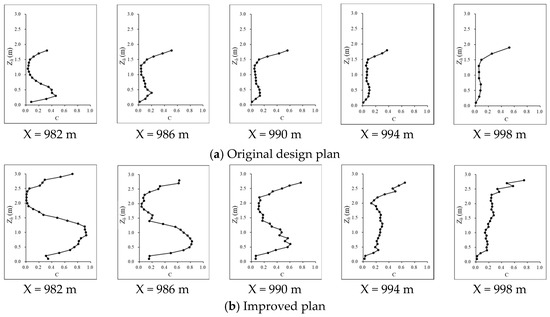
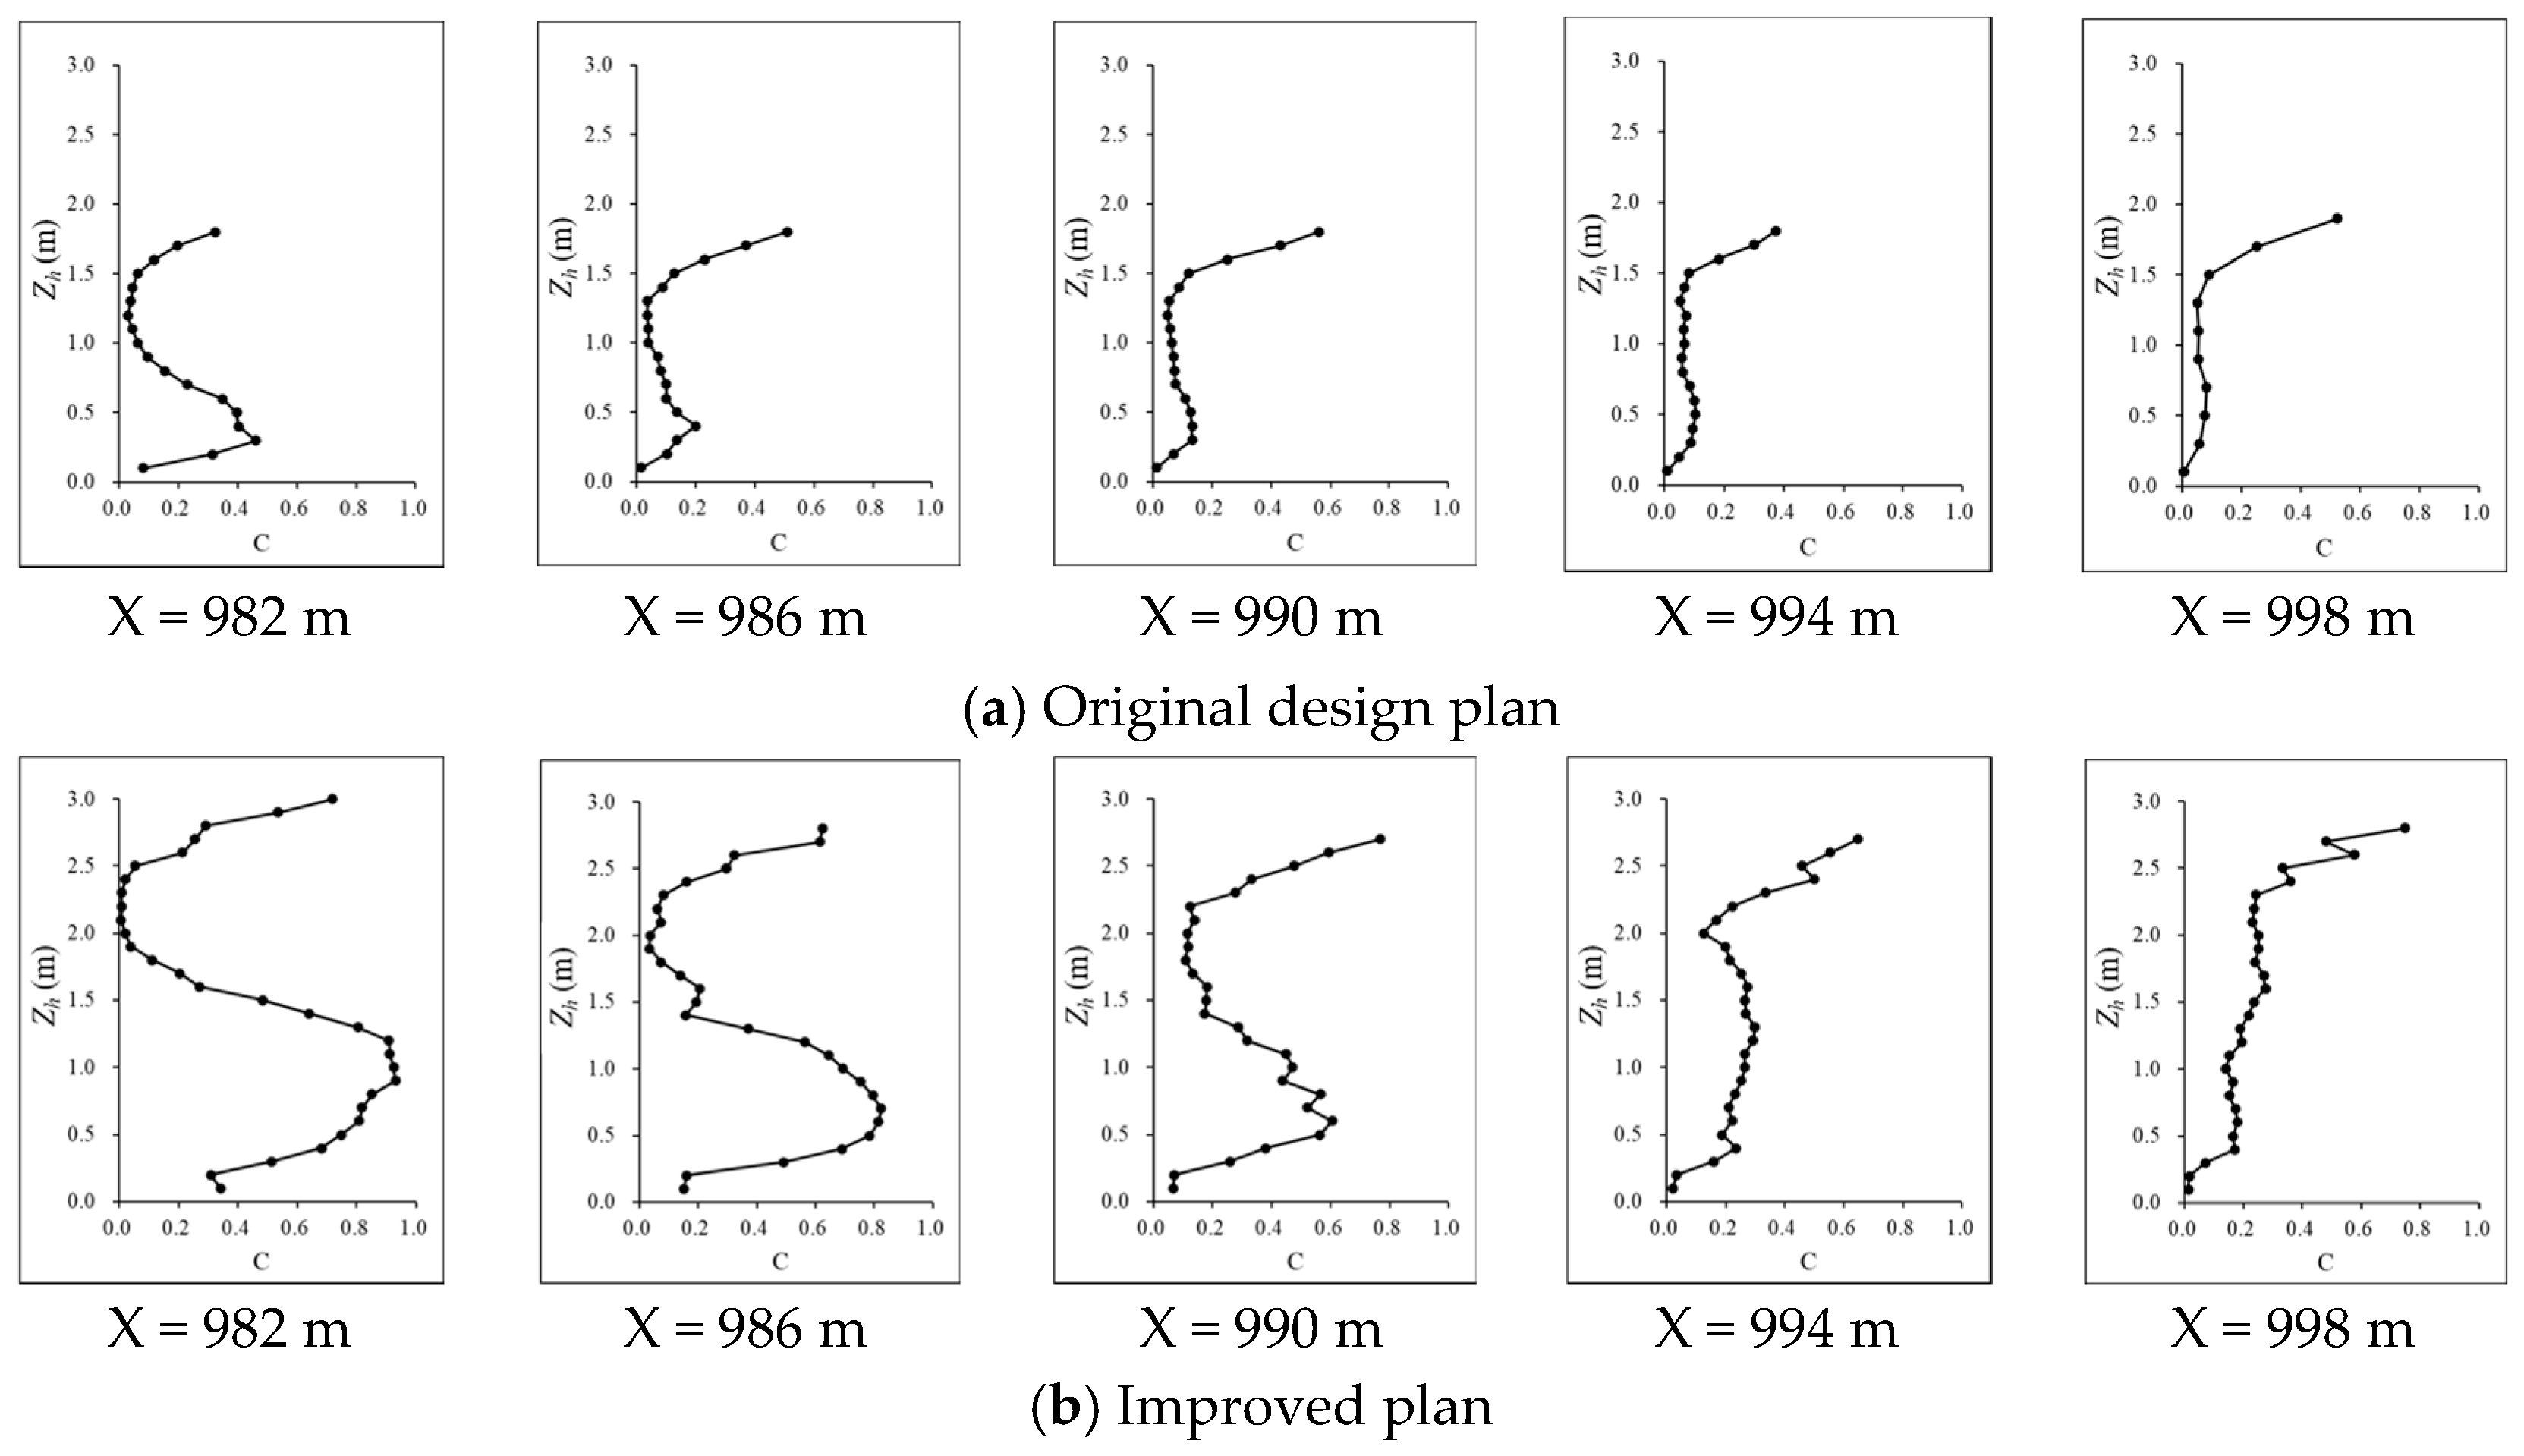
- Under the partial-opening condition of the radial service gate, when the gate opening is relatively small, the aeration concentration formed along the side walls is relatively high. When the gate opening is relatively large, at the chainage 982.00 section, a phenomenon of relatively low aeration concentration occurs at a certain elevation above the baseplate, but no aeration blind zone appears (as shown in Figure 15b). As the flow develops downstream, the aeration concentration at this location rapidly increases, soon achieving full-section aeration effect. After the flow passes through the secondary sudden lateral enlargement, the clear-water zone on the side walls has basically disappeared, indicating that the secondary sudden lateral enlargement has a good aeration effect. The aerated flow near the wall can greatly reduce the risk of cavitation erosion damage on the side walls of the open-channel section.Figure 15. Aeration concentration of side wall under typical working conditions (e = 0.750, H0 = 275 m) in original design plan and improved plan: (a) original design plan; (b) improved plan.
6.3.5. Comparison of Numerical Simulation Results
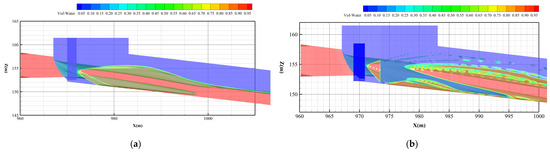
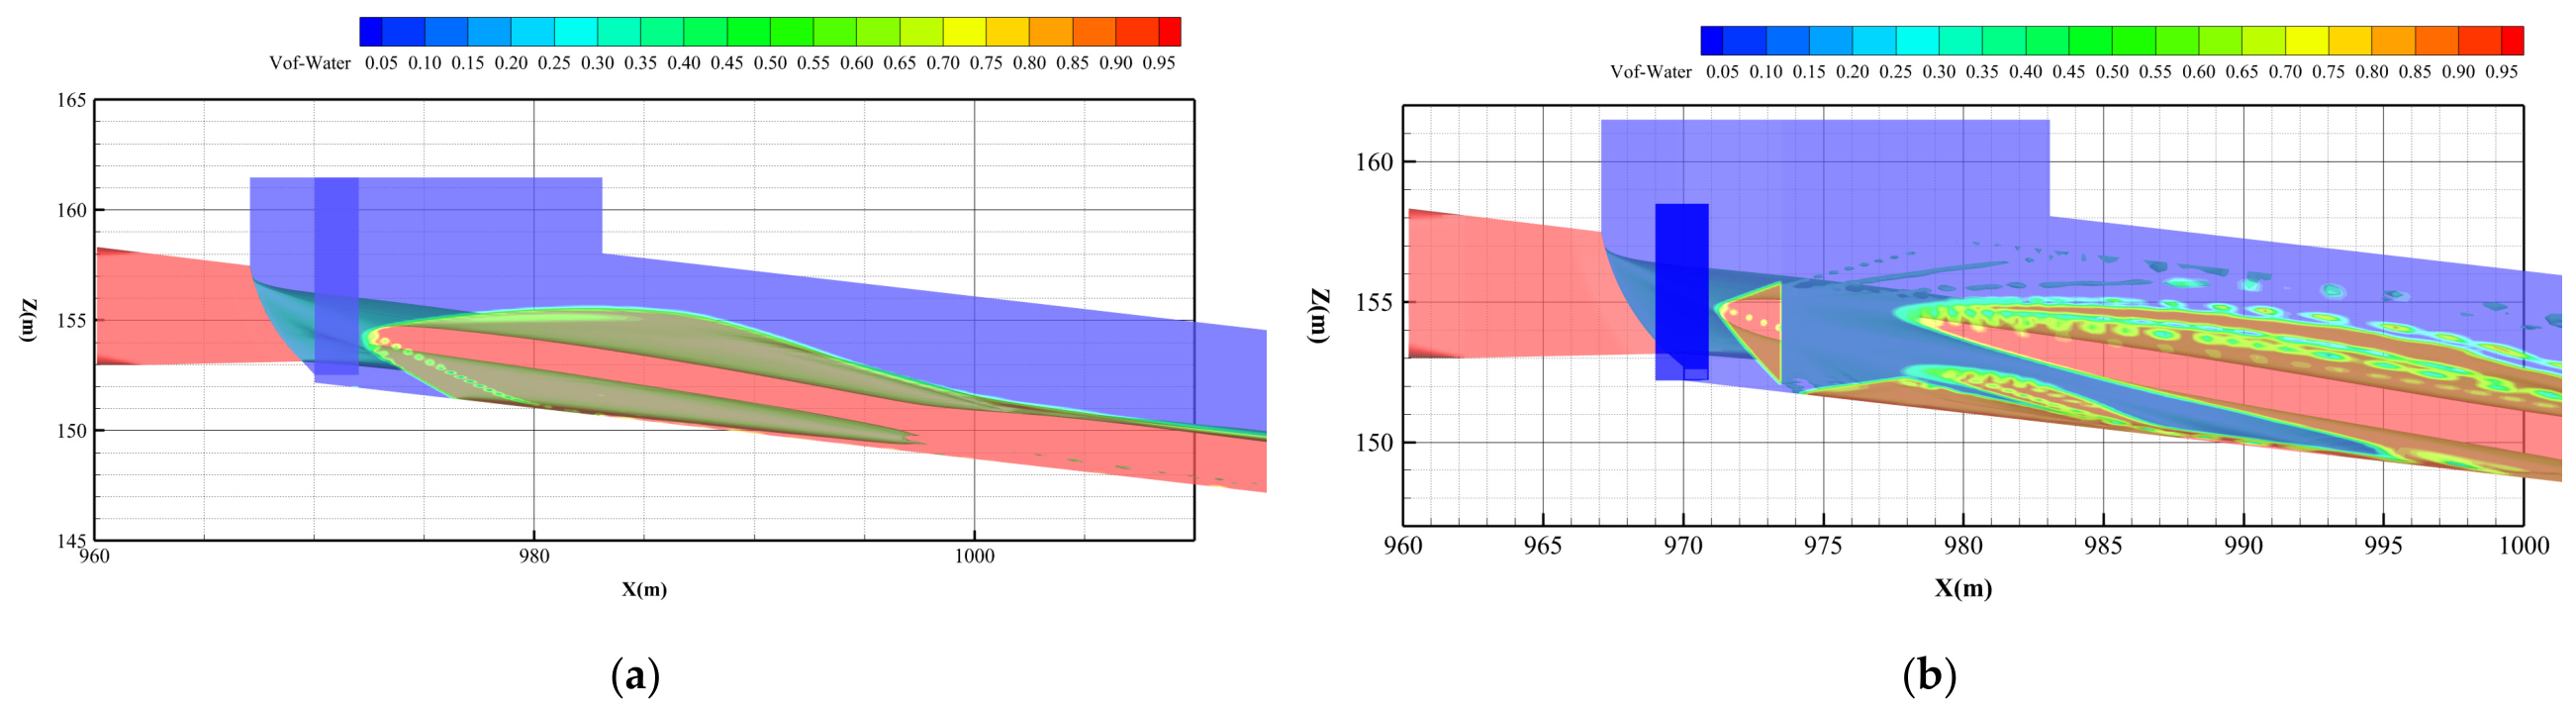
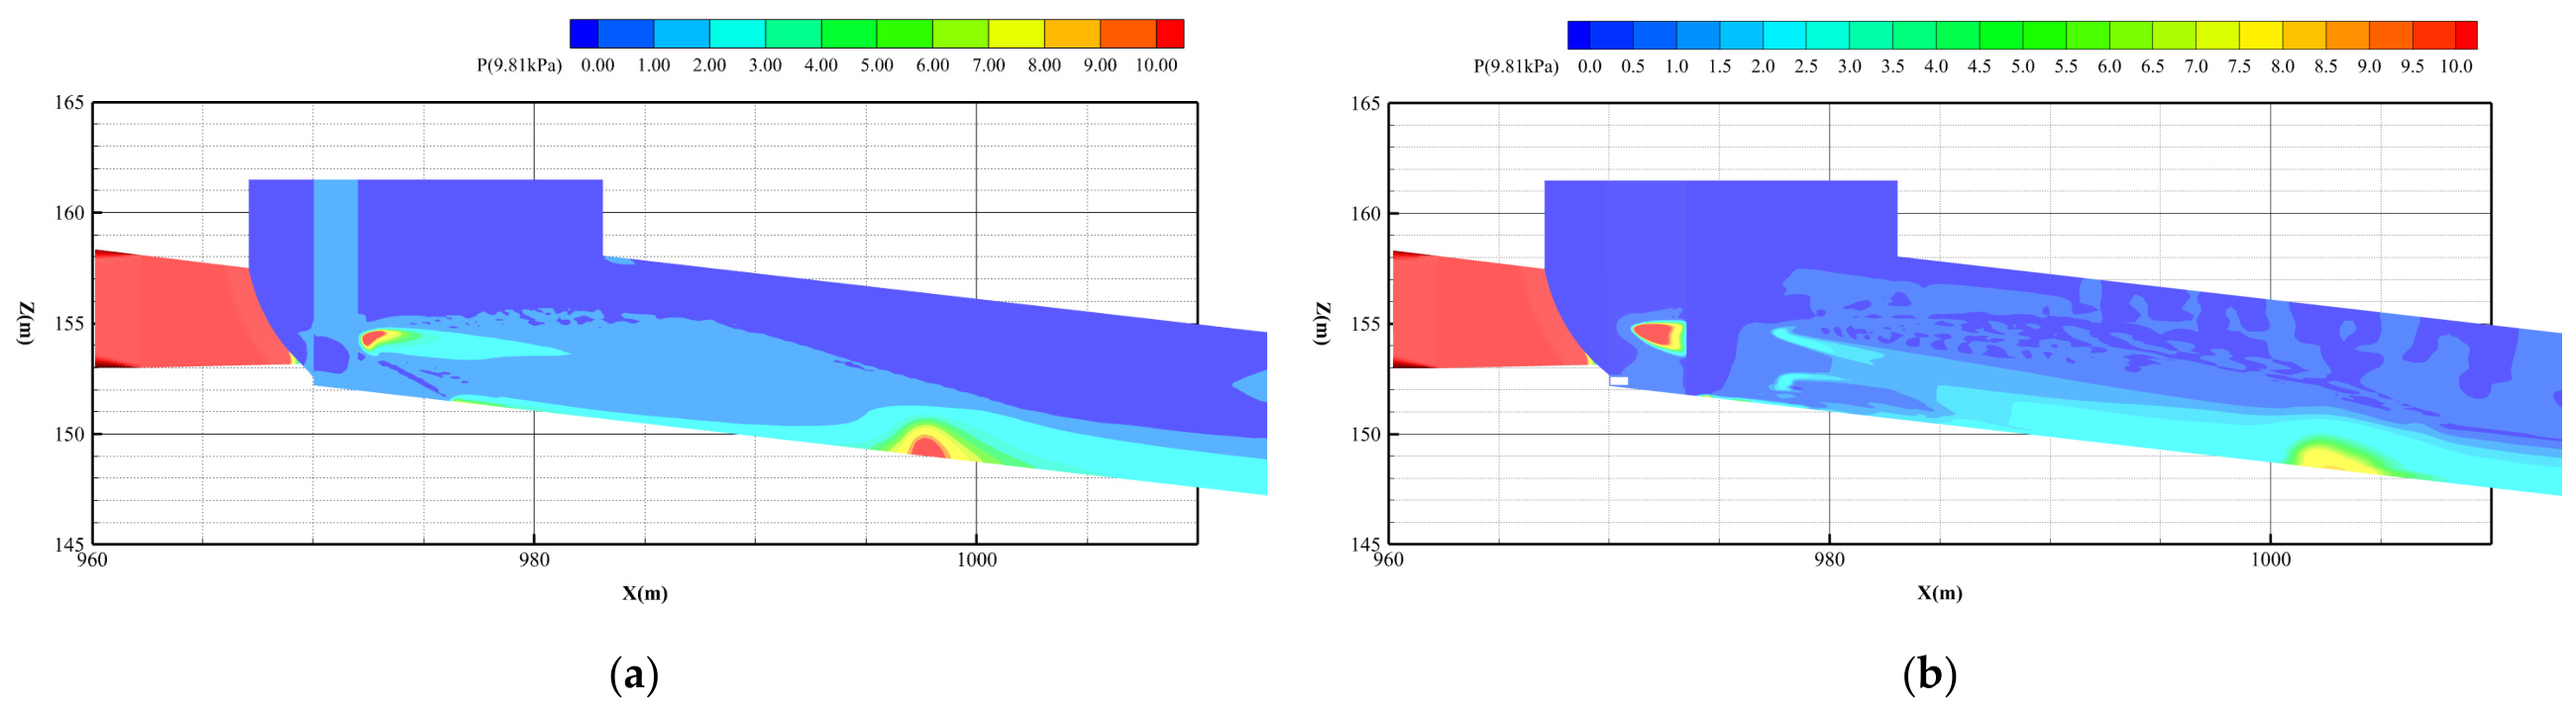
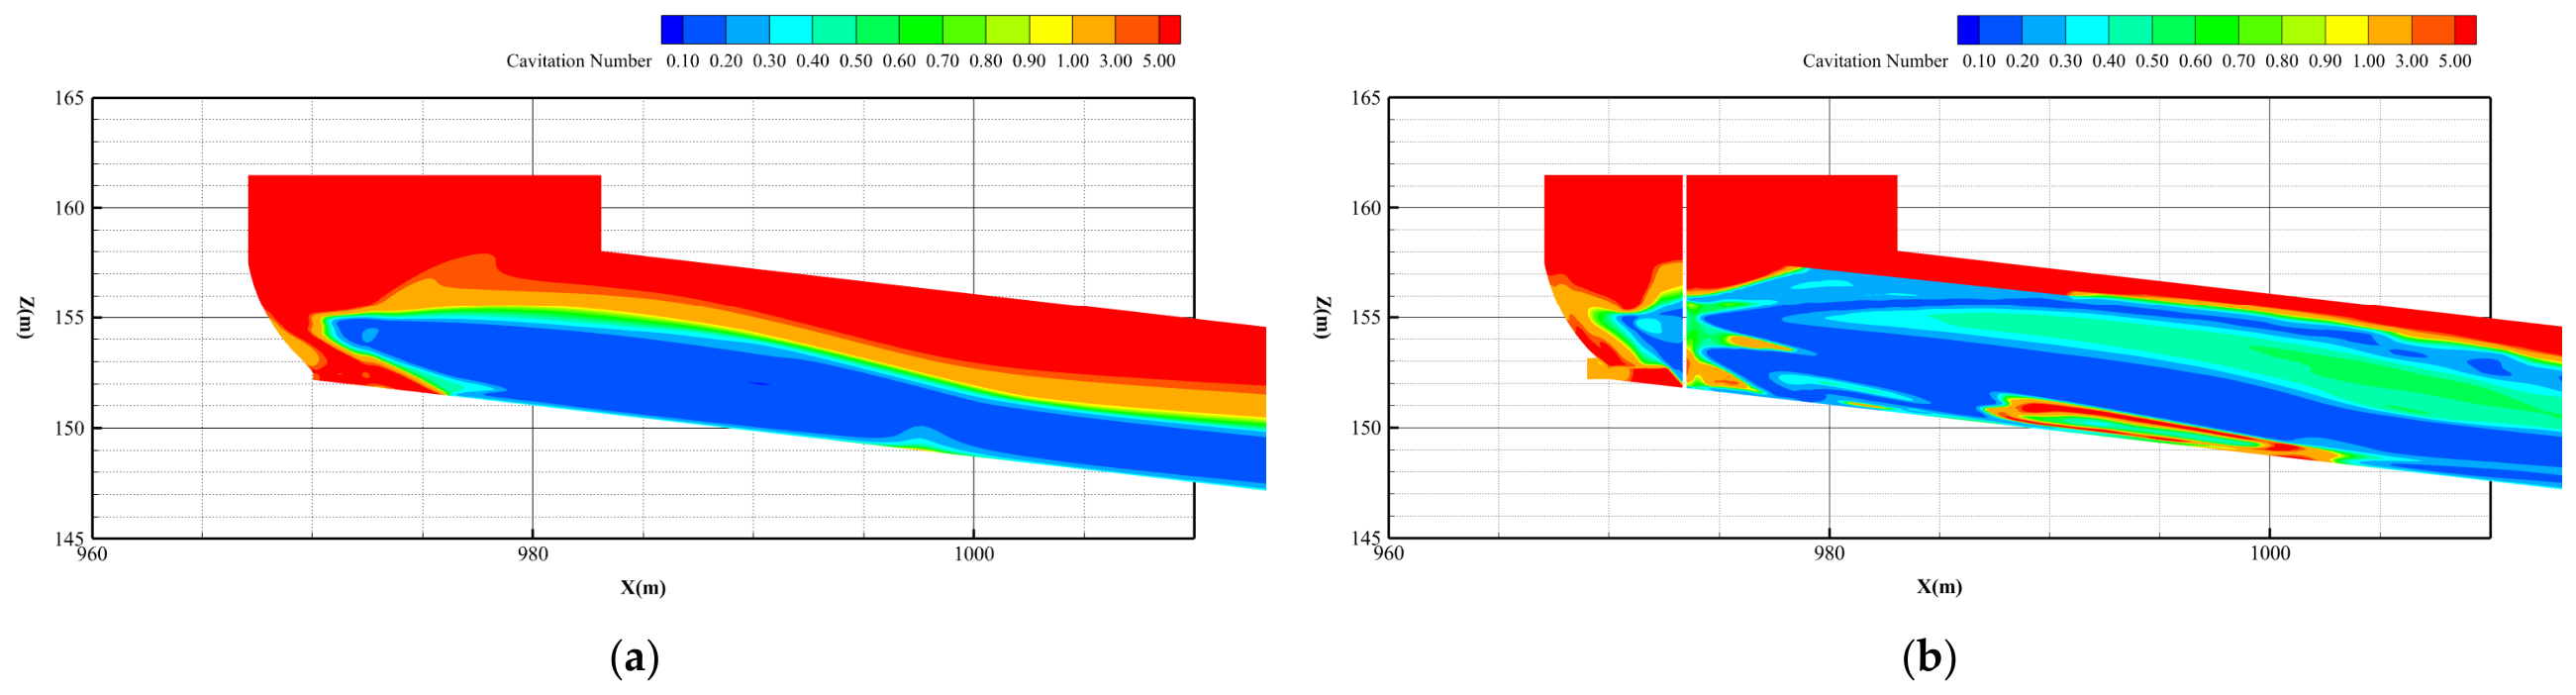
To compare the hydraulic characteristics of the original design plan and the improved plan, Figure 16, Figure 17 and Figure 18 show the flow patterns, wall pressure distributions, and side wall cavitation number distributions of the two plans, respectively, under a relative opening of the radial service gate of e = 0.875 and an upstream water level of 275 m. Table 4 summarizes the numerical results of the cross-sectional average cavitation numbers at the characteristic cross-sections of the side walls for the original design plan and the improved plan under different gate openings at an upstream water level of 275 m. Based on a comprehensive comparison, the following conclusions can be drawn:
Figure 16.
Numerically simulated flow patterns: (a) original design plan; (b) improved plan.
Figure 17.
Numerically simulated wall pressure contours: (a) original design plan; (b) improved plan.
Figure 18.
Numerically simulated cavitation number contours: (a) original design plan; (b) improved plan.
Table 4.
Numerically calculated cross-sectional average cavitation numbers along the side wall for the original design and improved plans.
- (1)
- The flow patterns obtained from the numerical simulation are generally consistent with the physical model test results. The flow profile, side cavity morphology, and flow attachment location are all well reproduced, indicating that the established numerical model can reasonably simulate the main flow characteristics downstream of the radial service gate. Under partial opening of the radial service gate, the side cavity of the original design plan is relatively short. After the flow attaches to the side wall at the end of the side cavity, it continues to develop downstream along the side wall, resulting in a relatively large clear-water zone downstream of the attachment zone. For the improved plan, the primary attachment location changes little compared with that of the original design plan. However, after attaching to the side wall for a short distance within the side wall contraction section, the flow separates from the side wall again at the end of the contraction section, forming a secondary side cavity, and then reattaches to the side wall downstream. Thus, the improved plan transforms the continuously developing single-attachment process in the original design plan into an “attachment–separation–reattachment” process, creating favorable conditions for improving the aeration of the downstream side walls.
- (2)
- The calculated wall pressure distributions show that a distinct local high-pressure zone forms when the flow attaches to the side wall at the end of the side cavity in the original design plan. The wall pressure then decreases rapidly in the downstream direction, forming a low-pressure rebound zone downstream of the impact zone. In the improved plan, the wall pressure also increases abruptly and then decreases rapidly during the primary attachment within the side wall contraction section. However, because the flow develops along the side wall for only a short distance before separating again at the end of the contraction section, the pressure abrupt-change zone caused by the primary attachment is relatively limited. After the flow passes through the secondary side cavity and reattaches to the side wall, the streamwise variation in wall pressure becomes more gradual, and the pressure distribution is relatively stable. Therefore, the side wall contraction can shorten the distance over which the primary wall-attached flow continuously develops along the side wall and restrict the development of the continuous low-pressure zone downstream.
- (3)
- The side wall cavitation number distributions show that, compared with the original design plan, the improved plan reduces the extent of the large and continuously distributed regions with cavitation numbers below 0.20. The statistical results for the cross-sectional average cavitation numbers at the characteristic cross-sections show that, downstream of X = 980.0 m, the differences between the two plans are generally small. Within the side wall contraction section from X = 970.00 to 973.50 m, the cavitation numbers of the improved plan are generally slightly higher than those of the original design plan, mainly because the side wall contraction increases the wall pressure in this region.
A comprehensive analysis of the aeration concentration, wall pressure, and cavitation number indicates that a large near-wall aeration blind zone exists downstream of the side cavity in the original design plan, where the local aeration concentration is close to zero. Meanwhile, this region is characterized by a relatively high near-wall flow velocity, low wall pressure, and cavitation numbers generally below 0.30, with values below 0.20 in some areas. The spatial overlap between the low-cavitation-number zone and the region with insufficient aeration protection results in a relatively high risk of cavitation and cavitation erosion and represents the main hydraulic cause of cavitation erosion damage on the downstream side walls of the original design plan. In the improved plan, the side wall contraction causes the primary wall-attached flow to separate from the side wall again and form a secondary side cavity. The near-wall aeration condition after the secondary attachment is significantly improved, and the original large clear-water zone basically disappears, providing effective aeration protection against cavitation erosion in the downstream low-cavitation-number region. It should be noted that, after the primary side cavity attaches to the wall, the cavitation number in some areas within the side wall contraction section remains below 0.30. However, the prototype cavitation erosion damage mainly occurred downstream of the proposed side wall contraction section, whereas no obvious cavitation erosion damage occurred on the original side wall corresponding to the contraction section during long-term operation. In addition, the side wall contraction increases the wall pressure in this region, resulting in slightly higher cavitation numbers than those of the original design plan and further reducing the risk of cavitation erosion in this region.
The above results indicate that the identification of cavitation and cavitation erosion risk zones on the side walls should comprehensively consider the near-wall aeration concentration, wall pressure, local cavitation number, and other relevant parameters. It should be noted that, under the partial-opening conditions investigated in this study, the cavitation number remains relatively low in some areas within the side wall contraction section, where a small clear-water zone also remains. The risk of cavitation erosion in this region therefore requires further investigation. Future studies should focus on the formation and variation in the clear-water zone within the side wall contraction section and further clarify its relationship with the wall pressure and cavitation number. In addition, the streamwise development of the downstream aeration concentration, time-averaged pressure, fluctuating pressure, and minimum instantaneous pressure after the secondary attachment should be systematically investigated to further evaluate the extent of aeration protection and the cavitation and cavitation erosion safety of the improved plan.
7. Conclusions
- (1)
- Under the geometry and test conditions investigated in this study, partial opening of the radial service gate causes the flow to spread downward and sideways at the pressurized outlet, resulting in a rapid shortening of the side cavity. After the flow attaches to the side walls, a distinct clear-water zone forms downstream, where the measured near-wall aeration concentration is close to zero. The flow impacts the side walls at a relatively large angle, forming a “high-pressure impact–low-pressure reflection zone” with significant negative pressure and reduced cavitation numbers in the wall-attached zone. The cavitation number is below 0.30 in most areas and below 0.20 locally. The spatial overlap between the low-cavitation-number zone and the near-wall aeration blind zone is the main hydraulic cause of the high cavitation and cavitation erosion risk on the downstream side walls of the original design plan.
- (2)
- Within the ranges of geometry parameters, water levels, and gate openings investigated in this study, the high-pressure impact–low-pressure reflection zone and the clear-water zone were observed under all partial-opening conditions. Their extents vary with the gate opening, indicating that the gate opening is an important factor affecting the distribution of cavitation and cavitation erosion risk on the side walls.
- (3)
- After adopting the “side wall contraction + secondary sudden lateral enlargement” geometry, the flow attaches to the side walls for a short distance within the contraction section and then separates again at its downstream end, forming a secondary side cavity. The physical model test and numerical simulation results show good consistency in the flow patterns, cavity morphology, and side wall cavitation number distributions. Forced aeration through the secondary side cavity essentially eliminates the large clear-water zone in the original cavitation erosion damage area. Meanwhile, the side wall contraction increases the wall pressure and cavitation number within the contraction section, reducing the cavitation and cavitation erosion risk in this section and along the downstream side walls. However, under some partial-opening conditions, local areas with cavitation numbers below 0.30 and a small clear-water zone remain within the contraction section. Their risk requires further evaluation based on the local aeration concentration, fluctuating pressure, and minimum instantaneous pressure.
- (4)
- Considering the requirements for forming a secondary side cavity, the structural conditions of the existing tunnel, and the amount of renovation work, the “open-channel section contraction + secondary sudden lateral enlargement” scheme was adopted. This scheme avoids the potential problems of tunnel surrounding rock stability, structural safety, and increased project investment caused by expanded excavation of the open-channel section. The short platform blocks the lower water wing under small-opening conditions, whereas the guide plate at the top of the side walls restricts the development of the upper water wing. These measures require only local modifications to the existing structure and involve relatively little renovation work. The physical model test and numerical simulation results show that the final combined improved plan significantly improves the aeration conditions of the downstream side walls and provides good protection against cavitation and cavitation erosion.
Author Contributions
Conceptualization, G.Z. and J.D.; methodology, G.Z., J.D. and W.W.; formal analysis, G.Z.; investigation, G.Z., W.W. and T.S.; resources, J.D.; data curation, G.Z.; writing—original draft preparation, G.Z. and T.S.; writing—review and editing, J.D. and W.W.; visualization, G.Z.; supervision, J.D.; project administration, J.D.; funding acquisition, J.D. All authors have read and agreed to the published version of the manuscript.
Funding
This research was funded by the National Natural Science Foundation of China, grant numbers U23A20668 and 52521005.
Data Availability Statement
The data presented in this study are available on request from the corresponding author due to privacy reasons.
Conflicts of Interest
Author Gongping Zhang was employed by the company PowerChina Chengdu Engineering Corporation Limited. The remaining authors declare that the research was conducted in the absence of any commercial or financial relationships that could be construed as a potential conflict of interest.
References
- Arndt, R.E.A. Cavitation in fluid machinery and hydraulic structures. Annu. Rev. Fluid Mech. 1981, 13, 273–326. [Google Scholar] [CrossRef] [Scilit]
- Philipp, A.; Lauterborn, W. Cavitation erosion by single laser-produced bubbles. J. Fluid Mech. 1998, 361, 75–116. [Google Scholar] [CrossRef] [Scilit]
- Pfister, M.; Hager, W.H. Chute aerators. I: Air transport characteristics. J. Hydraul. Eng. 2010, 136, 352–359. [Google Scholar] [CrossRef] [Scilit]
- Russell, S.O.; Sheehan, G.J. Effect of entrained air on cavitation damage. Can. J. Civ. Eng. 1974, 1, 97–107. [Google Scholar] [CrossRef] [Scilit]
- Mohaghegh, A.; Wu, J. Hydraulics of discharge tunnel service gate: The flow regimes. J. Hydrodyn. 2010, 22, 726–732. [Google Scholar] [CrossRef] [Scilit]
- Wang, W.; Deng, J.; Wei, W. Cavitation characteristics and aeration mitigation for the sidewall of a radial gate in a high-head tunnel. Adv. Eng. Sci. 2025, 57, 84–92. (In Chinese) [Google Scholar] [CrossRef]
- Ma, X.; Dai, G.; Yang, Q.; Li, G.; Zhao, L. Analysis of influence factors of cavity length in the spillway tunnel downstream of middle gate chamber outlet with sudden lateral enlargement and vertical drop aerator. J. Hydrodyn. 2010, 22, 680–686. [Google Scholar] [CrossRef] [Scilit]
- Li, S.; Zhang, J.; Chen, X.; Zhou, G.G.D.; Chen, J. Characteristics of aeration flow downstream the radial gate with sudden fall-expansion aerator in discharge tunnel. Water Sci. Technol. Water Supply 2018, 18, 790–798. [Google Scholar] [CrossRef] [Scilit]
- Zhang, J.; Chen, J.; Xu, W.; Wang, Y.; Li, G. Three-dimensional numerical simulation of aerated flows downstream sudden fall aerator expansion-in a tunnel. J. Hydrodyn. 2011, 23, 71–80. [Google Scholar] [CrossRef] [Scilit]
- Bai, R.; Liu, S.; Tian, Z.; Wang, W.; Zhang, F. Experimental investigation of air–water flow properties of offset aerators. J. Hydraul. Eng. 2018, 144, 04017059. [Google Scholar] [CrossRef] [Scilit]
- Chanson, H. Flow downstream of an aerator—aerator spacing. J. Hydraul. Res. 1989, 27, 519–536. [Google Scholar] [CrossRef] [Scilit]
- Pfister, M.; Hager, W.H. Chute aerators. II: Hydraulic design. J. Hydraul. Eng. 2010, 136, 360–367. [Google Scholar] [CrossRef] [Scilit]
- Zhang, J.; Xu, W.; Wang, W.; Liu, S. Cavitation damage to sidewalls in a sand flushing tunnel under high head. J. Hydroelectr. Eng. 2010, 29, 197–201. (In Chinese) [Google Scholar]
- Li, S.; Zhang, J.; Xu, W.; Chen, J.; Peng, Y. Evolution of pressure and cavitation on side walls affected by lateral divergence angle and opening of radial gate. J. Hydraul. Eng. 2016, 142, 05016003. [Google Scholar] [CrossRef] [Scilit]
- Wu, J.; Feng, S.; Wu, W.; Ruan, S. Hydraulic characteristics of partial opening of the working gate for a discharge tunnel. J. Hydrodyn. 2007, 19, 488–493. [Google Scholar] [CrossRef] [Scilit]
- Beltaos, S.; Rajaratnam, N. Plane turbulent impinging jets. J. Hydraul. Res. 1973, 11, 29–59. [Google Scholar] [CrossRef] [Scilit]
- Nie, M.; Duan, B.; Li, L. Evolvement characteristics of zones of negative pressure along sidewall of discharge structure with a shape of sudden lateral enlargement and vertical drop. Adv. Sci. Technol. Water Resour. 2006, 26, 34–36. (In Chinese) [Google Scholar]
- Chanson, H. Aeration and deaeration at bottom aeration devices on spillways. Can. J. Civ. Eng. 1994, 21, 404–409. [Google Scholar] [CrossRef] [Scilit]
- Bhosekar, V.V.; Jothiprakash, V.; Deolalikar, P.B. Orifice spillway aerator: Hydraulic design. J. Hydraul. Eng. 2012, 138, 563–572. [Google Scholar] [CrossRef] [Scilit]
- Bai, R.; Zhang, F.; Liu, S.; Wang, W. Air concentration and bubble characteristics downstream of a chute aerator. Int. J. Multiph. Flow 2016, 87, 156–166. [Google Scholar] [CrossRef] [Scilit]
- Ye, F.; Xu, W.; Wei, W. Experimental study of the air concentration diffusion in aerated chute flows downstream of lateral and bottom aerators. AIP Adv. 2022, 12, 025221. [Google Scholar] [CrossRef] [Scilit]
- Matos, J.; Novakoski, C.K.; Ferla, R.; Marques, M.G.; Dai Prá, M.; Canellas, A.V.B.; Teixeira, E.D. Extreme pressures and risk of cavitation in steeply sloping stepped spillways of large dams. Water 2022, 14, 306. [Google Scholar] [CrossRef] [Scilit]
- Da, J.; Wang, J.; Dong, Z.; Du, S. Hydraulic characteristics of lateral deflectors with different geometries in gentle-slope free-surface tunnels. Water 2022, 14, 2689. [Google Scholar] [CrossRef] [Scilit]
- Li, G.; Dai, G.; Yang, Q.; Ma, X. Detached eddy simulation of hydraulic characteristics along the side-wall after a new arrangement-scheme of the sudden lateral enlargement and the vertical drop. J. Hydrodyn. 2011, 23, 669–675. [Google Scholar] [CrossRef] [Scilit]
- Gao, J.; Wang, Z. Feedback analysis on the causes of cavitation erosion on the side walls of the spillway tunnel and research on the optimization of the renovation shape. Water Resour. Hydropower Eng. 2024, 55, 508–515. (In Chinese) [Google Scholar] [CrossRef]
- Wang, L.; Zhang, J.; Ba, T.; Ben, X. Abrasion and cavitation resistance of desilting tunnel in high-speed water flow zone of Xiaolangdi Project. China Water Resour. 2015, 10, 22–24+33. (In Chinese) [Google Scholar] [CrossRef]
- Zhang, P.; Song, K.; Chen, C.; Yang, Z. The influence of a combined aerator on aeration characteristics. AIP Adv. 2023, 13, 085206. [Google Scholar] [CrossRef] [Scilit]
- Ruan, S.; Wu, J.; Wu, W.; Xi, R. Hydraulic research of aerators on tunnel spillways. J. Hydrodyn. 2007, 19, 330–334. [Google Scholar] [CrossRef] [Scilit]
- Su, P.; Liao, H.; Qiu, Y.; Li, C. Experimental study on a new type of aerator in spillway with low Froude number and mild slope flow. J. Hydrodyn. 2009, 21, 415–422. [Google Scholar] [CrossRef] [Scilit]
- Lian, J.; Qi, C.; Liu, F.; Gou, W.; Pan, S.; Ouyang, Q. Air entrainment and air demand in the spillway tunnel at the Jinping-I Dam. Appl. Sci. 2017, 7, 930. [Google Scholar] [CrossRef] [Scilit]
- Wang, X.; Hu, Y.A.; Li, Z.H. Experimental study on the mechanism of the combined action of cavitation erosion and abrasion at high speed flow. Int. J. Concr. Struct. Mater. 2019, 13, 58. [Google Scholar] [CrossRef] [Scilit]
- Luo, X.; Guo, Z.; Dong, Z.; Xu, H. Sediment mineral grain gradations on cavitation erosion of concrete material in high-velocity sediment-laden flow. Phys. Fluids 2025, 37, 023398. [Google Scholar] [CrossRef] [Scilit]
- Nikseresht, A.H.; Talebbeydokhti, N.; Khorshidi, H. Three-dimensional numerical modeling of cavitation and aeration system in dam outlets. J. Fluids Eng. 2012, 134, 091302. [Google Scholar] [CrossRef] [Scilit]
- Lei, G.; Huang, H.; Fan, X.; Su, J.; Wang, Q.; Wang, X.; Peng, K.; Zhang, J. Influence of the transition section shape on the cavitation characteristics at the bottom outlet. Water Supply 2023, 23, 3061–3077. [Google Scholar] [CrossRef] [Scilit]
- Wang, J.; Chen, G.; Wang, W. Numerical simulation of 3D flow field at plane gate region with suddenly lateral enlargement and bottom drop. Eng. J. Wuhan Univ. 2010, 43, 325–329. (In Chinese) [Google Scholar]
- Lian, J.; Gou, W.; Li, H.; Zhang, H. Effect of sediment size on damage caused by cavitation erosion and abrasive wear in sediment–water mixture. Wear 2018, 398–399, 201–208. [Google Scholar] [CrossRef] [Scilit]

Disclaimer/Publisher’s Note: The statements, opinions and data contained in all publications are solely those of the individual author(s) and contributor(s) and not of MDPI and/or the editor(s). MDPI and/or the editor(s) disclaim responsibility for any injury to people or property resulting from any ideas, methods, instructions or products referred to in the content. |
© 2026 by the authors. Licensee MDPI, Basel, Switzerland. This article is an open access article distributed under the terms and conditions of the Creative Commons Attribution (CC BY) license.