


Abstract
With the growing risks posed by extreme weather, such as cold waves, to the secure operation of power systems integrated with large-scale wind and PV power, conventional multi-energy complementary modes fail to cope with the drastic output fluctuations in renewable resources. In this study, a hydro–wind–PV joint-optimized scheduling model is established to quantify the compensation requirement of wind–PV power output fluctuations and to optimize the hydropower compensatory regulation, aiming to clarify the actual effects and inherent limitations of hydropower under cold-wave scenarios. Based on 86-year hourly operational simulation data of a practical virtual case in northwest China, the main simulation results, limited to a daily time horizon with five statistically extracted scenarios, are as follows: First, cold-wave events significantly raise the peak shaving and compensation pressure of hydropower, with the maximum fluctuation amplitude of new energy output reaching 86.76%. Second, compared with conventional operating conditions, hydropower can satisfy the above compensation demand, whereas the reservoir water level deviates from the normal range by −2.2–3.0 m after scheduling, which leads to water consumption or effective storage occupation of reservoirs. Third, restricted by the hydropower installed capacity and reservoir regulation constraints, the power deficit of 1962 MWh and water spillage of 10.59 million m3 cannot be completely resolved. This study can provide theoretical support for analyzing wind–PV fluctuation risks and revealing the multi-energy coupling operation mechanism in cold-wave environments.
1. Introduction
As climate change intensifies, extreme weather events such as cold waves are showing a trend of high incidence [1] and strong occurrence [2], exacerbating the impact on wind and photovoltaic (PV) new energy grid integration, which is highly constrained by meteorological conditions. This poses a greater threat to the safe and stable operation of new-type power systems, which are characterized by a high proportion of new energy. In recent years, several cold waves have occurred globally, causing a sharp decline in wind and PV power, which has led to abnormal local grid frequencies and even large-scale regional power outages and cascaded power outages [3], including in the developed regions of North America with robust power grids [4]. Conventional multi-energy complementary integration measures cannot fully deal with these extreme shocks, and there is an urgent need to explore effective countermeasures for the coordinated integration of wind and PV power in cold-wave conditions [5].
The impact of cold waves on wind and PV power generation is mainly reflected in equipment damage and power surges, among others. For wind power, cold waves, often accompanied by low temperatures and snowfall, cause blade icing. On the one hand, this leads to a decline in blade aerodynamic performance, resulting in reduced power generation efficiency or even unit shutdown [6]; on the other hand, it increases mechanical wear and maintenance costs [7]. In addition, during a cold wave, wind speeds change sharply, leading to wind turbines starting up and shutting down frequently and, thus, further increasing the uncertainty of power generation [8].
For PV power, low temperatures and snowfall can affect the efficiency of PV modules and light conditions. While the former can slightly improve the performance of PV modules, the latter will directly block solar radiation, resulting in a significant reduction in power generation [9]. Case studies suggest that the output power of large-area PV panels may drop by 30% to 60% during cold waves, especially in northern regions [10]. In addition, the high wind speeds associated with cold waves may cause problems such as increased mechanical stress and reduced support performance of PV brackets and modules, posing safety risks [11].
Overall, cold waves cause problems such as increased wear and tear, failure of wind and PV power equipment, and reduced availability, which further leads to shocks such as sudden changes in power output and a decline in power supply quality (e.g., decreased stability and reliability). From a spatial perspective, the impact of cold waves on wind and PV power exhibits distinct regional characteristics. Wind turbine blade icing and snow accumulation on PV panels are more severe in northern regions in winter [12]. Although there is less snowfall in southern regions, low temperatures and strong winds caused by cold waves can still lead to power fluctuations and abnormal operation of power generation facilities [13]. Regarding duration, cold waves can last for several days or even weeks [14] and have distinct seasonal characteristics.
Existing research has explored how to deal with the impact of wind and PV power grid connection caused by extreme weather such as cold waves. Studies have shown that the aforementioned shocks significantly reduce the resilience of power systems [15], and multi-energy complementarity is one of the effective approaches to enhancing these systems’ resilience. At the power-system level, exploring regulating power sources, such as hydropower, and integrating these power sources to create a “buffer zone” can increase the grid-connected shares of energy storage when there is an excess of wind and PV power, and the stored energy can be released when the power output drops due to extreme weather, effectively buffering system instability [16]. Furthermore, at the integrated energy-system level, by rationally combining different power sources, such as wind, PV, combined heat and power (CHP), or gas turbines, and complementing power, thermal, and energy storage equipment through load forecasting and optimized control, power systems can cope with sudden load surges or resource output fluctuations during cold waves [17]. Multi-energy complementarity can cross the boundary of disturbances through flexible scheduling of various energy resources (e.g., using adjustable resources like hydropower to compensate for the shortage or excess output of wind and PV power), enhance the ability to withstand extreme weather such as cold waves, and shorten the recovery time after a disturbance, thereby improving the resilience of power systems [18].
However, while significant progress has been made on multi-energy complementarity, most of the existing studies focused on the operation of multi-energy power systems under normal conditions. Early studies on hydro–wind–PV complementarity took a single power source as representative of a certain type of power source to explore the impact of wind and PV grid connection shocks [19] and the function of compensation and regulation by hydropower [20].
Subsequent studies considered different timeframes, including multi-time-scale nesting (long-/mid-/short-term) [21], real-time operation [22], and long-term planning [23]. From the spatial perspective, studies explored the coordinated integration of power station clusters [24] and cross-regional cooperation [25]. In terms of power source composition, studies considered the types of power sources, such as pumped storage power stations [26], re-regulation hydropower stations [27], and energy storage systems [28]. As for operation tasks, existing studies covered tasks such as power generation, water supply [29], and ecological regulation [30]. Concerning complementary performance, studies explored benefits such as system stability [31] and electricity price economy [32].
To the best of the authors’ knowledge, there are few studies looking into mitigating the grid connection impact of wind and PV power under extreme weather conditions (e.g., cold waves) through hydropower-led multi-energy complementarity. This study explores the optimization of short-term coordinated hydro–wind–PV power operation under cold-wave conditions, and the coordinated operation requirements of wind and PV power as well as the compensation and regulation response of hydropower, with the aim of providing a reference for the multi-energy complementarity of hydro–wind–PV power systems. The novelty of this study lies in the analysis of the mechanism underlying the multi-energy complementarity of a hydro–wind–PV power system under cold-wave conditions, i.e., the demand for hydropower to complement wind and PV power, and the positive effect and insufficiency of hydropower to respond to this demand.
2. Integrated Hydro–Wind–PV Power System Optimization Model
In this study, the integrated hydro–wind–PV power system optimization model consists of two parts: a demand model for hydropower to complement wind and PV power and a model of hydropower compensation regulation. The former determines the net load that hydropower should bear—that is, the wind and PV power complementary demand—based on the deviation between the power system load and the output of wind and PV power in accordance with the principle of multi-energy complementarity. The latter determines the optimal dispatch process for the hydroelectric generating units based on the aforementioned load in accordance with the principle of minimum water consumption, i.e., the most economical compensation and regulation operation process for hydroelectric generating units.
2.1. Demand Model for Hydropower to Complement Wind and PV Power
Objective:
where represents the power demanded to complement wind and PV power in period t (MW); t is the period number, with t = 1, 2, … T; T is the total number of periods in the simulation horizon (commonly, 1 day), typically 24 or 96; is the load of the power system in period t (MW); is the wind power output in period t (MW); and is the PV power output in period t (MW).
2.2. Model of Hydropower Compensation Regulation
Hydropower compensation regulation is related to the economic operation of a hydropower plant, and research on such a model is relatively mature. This paper only lists the objective function and the main constraints of the model. For specific details, e.g., the unit dispatch criteria, see reference [33].
Objective:
where is the optimal generation flow of the hydropower load for the bearing load in period t (m3/s); is the generation flow of hydropower plant i in period t (m3/s); i is the hydropower plant number, with i = 1, 2, … N; and N is the total number of hydropower plants.
Constraints:
The model typically considers equality constraints such as power balance and reservoir water balance, inequality constraints such as upper and lower limits, and variations in parameters such as unit output, reservoir water level, tailwater level, generation flow, and discharge flow; see reference [34] for details. In addition, a classic and mature method to solve this model is to employ dynamic programming, but this method was omitted in this study. For details, see reference [35].
3. Case Study
The case study is a virtual hydro–wind–PV power system including the Lijiaxia hydropower station and one virtual wind farm and one virtual PV power station in Northwest China. Meteorological data such as wind speed, solar radiation, and temperature provided by the fifth-generation European Reanalysis dataset (ERA5) (coordinates: E82°44′, N45°09′; range: 1 January 1940~31 December 2025; resolution: 1 h; data download method: see reference [36]) were used to simulate the long series of wind and PV power output process (virtual installed capacity wind/PV power: 1000 MW; simulation method: see references [37,38]). The minimum, average and maximum of the temperature data are −33.6, 6.46 and 38.9 °C respectively. The average power output of wind and PV are 627.8 and 153.5 MW, respectively.
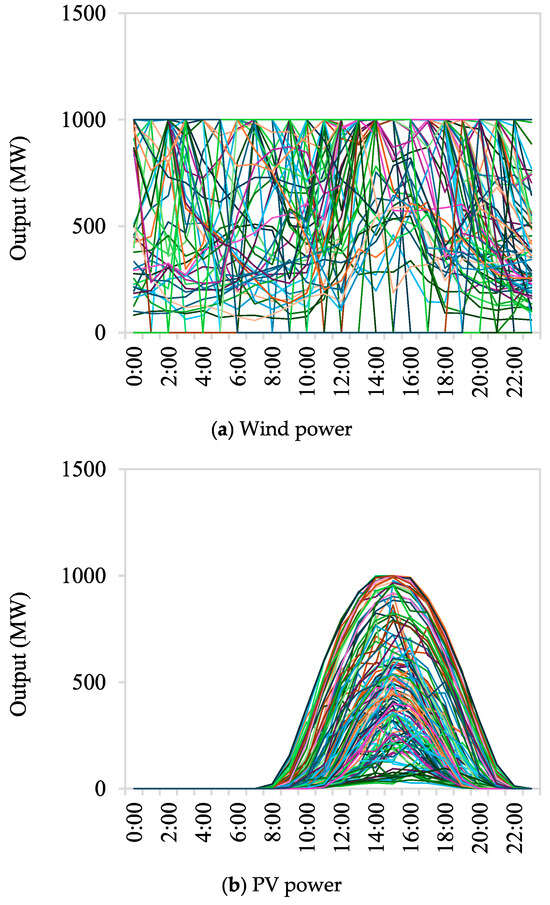
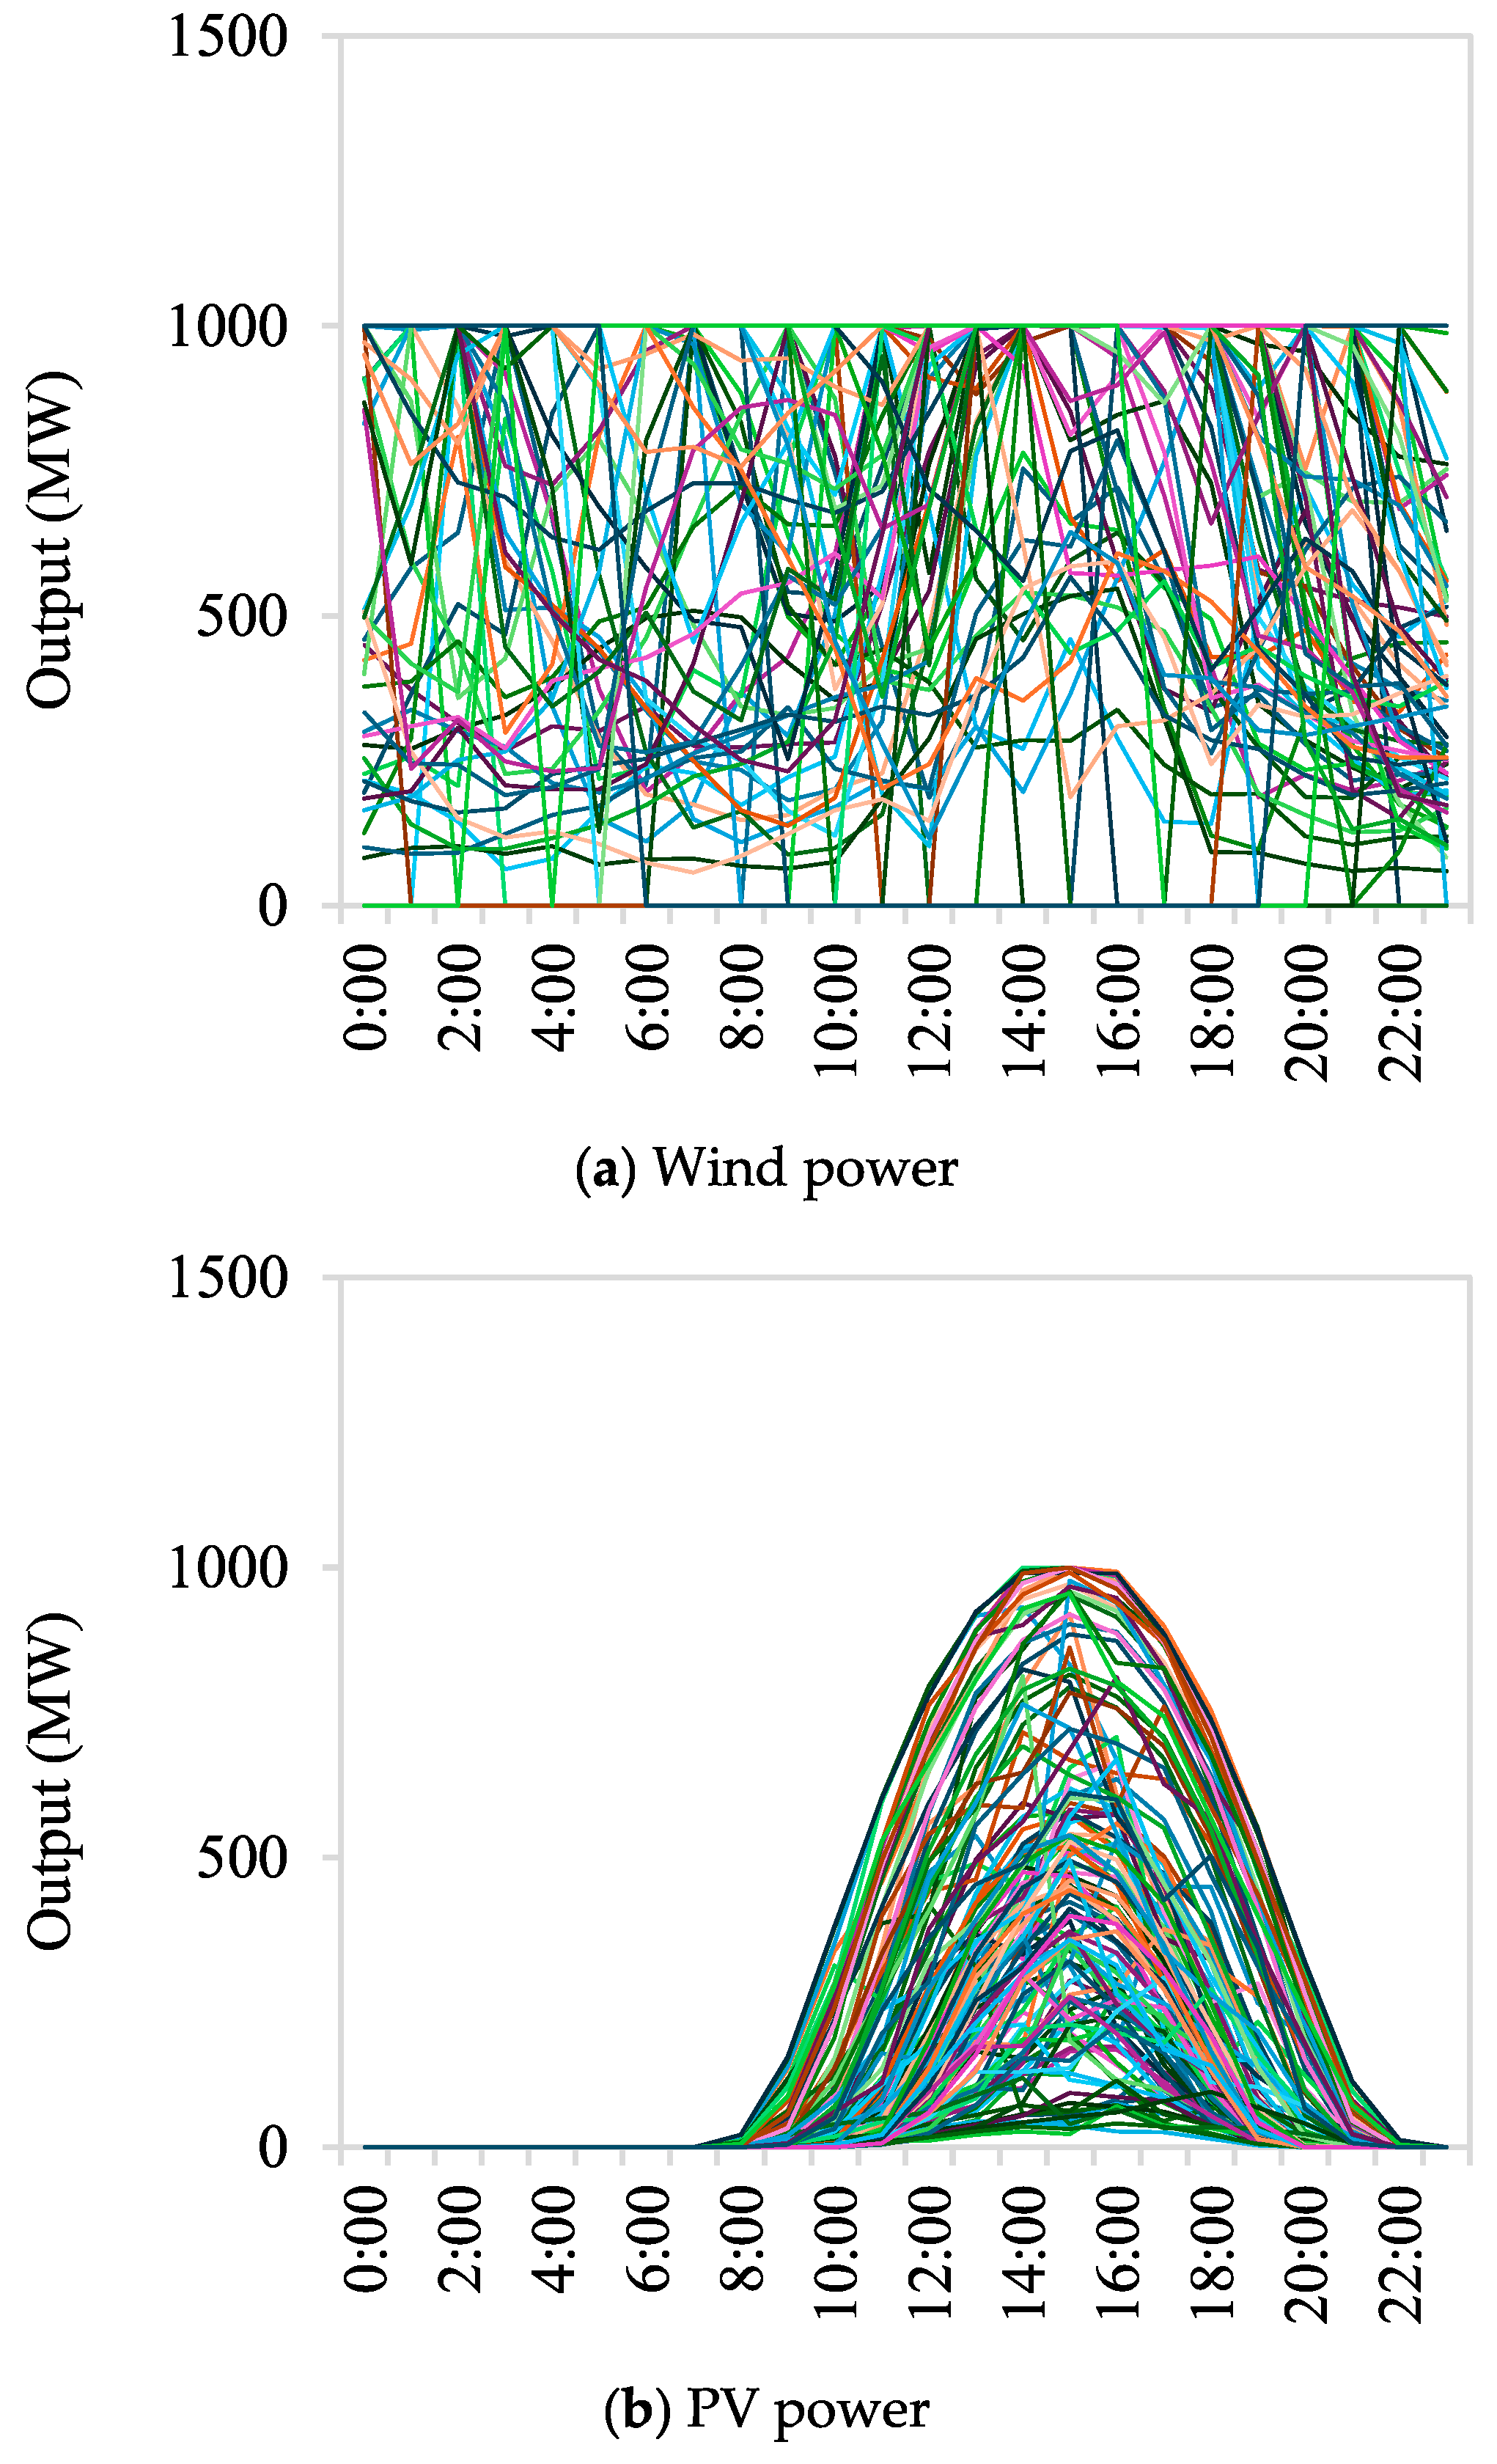
According to the cold-wave weather standard [39] (i.e., (1) the daily minimum temperature drops by 8 °C or more within 24 h, 10 °C or more within 48 h, or 12 °C or more within 72 h; (2) the daily minimum temperature falls to 4 °C or below over a 48 h or 72 h period; and (3) the daily minimum temperature must show a continuous decline), the wind and PV power output processes under cold-wave conditions (127 days, as shown in Figure 1) were identified from the 86-year hourly data. The average power outputs of wind and PV are 740.2 and 129.2 MW. Compared with the results of all these 86 years, the wind power is 112.4 MW higher, while the PV power is 24.3 MW lower.
Figure 1.
Output processes of (a) wind and (b) PV power under cold-wave conditions.
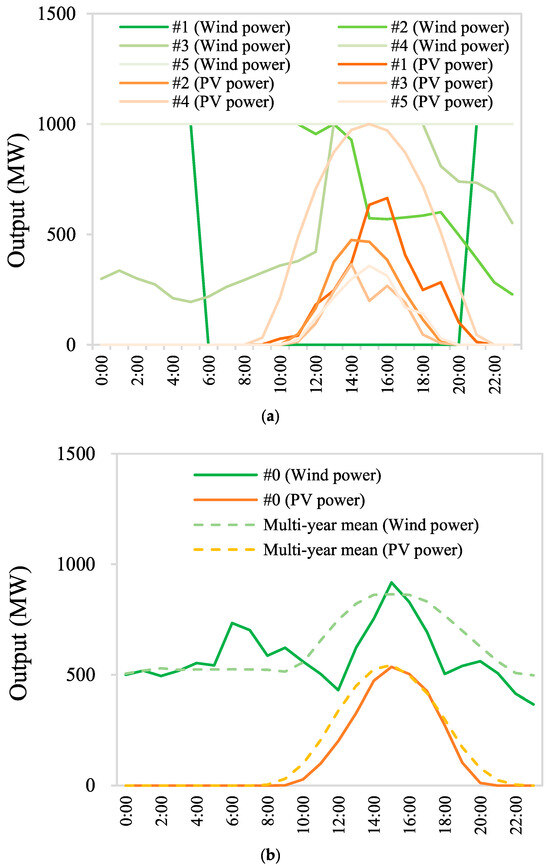
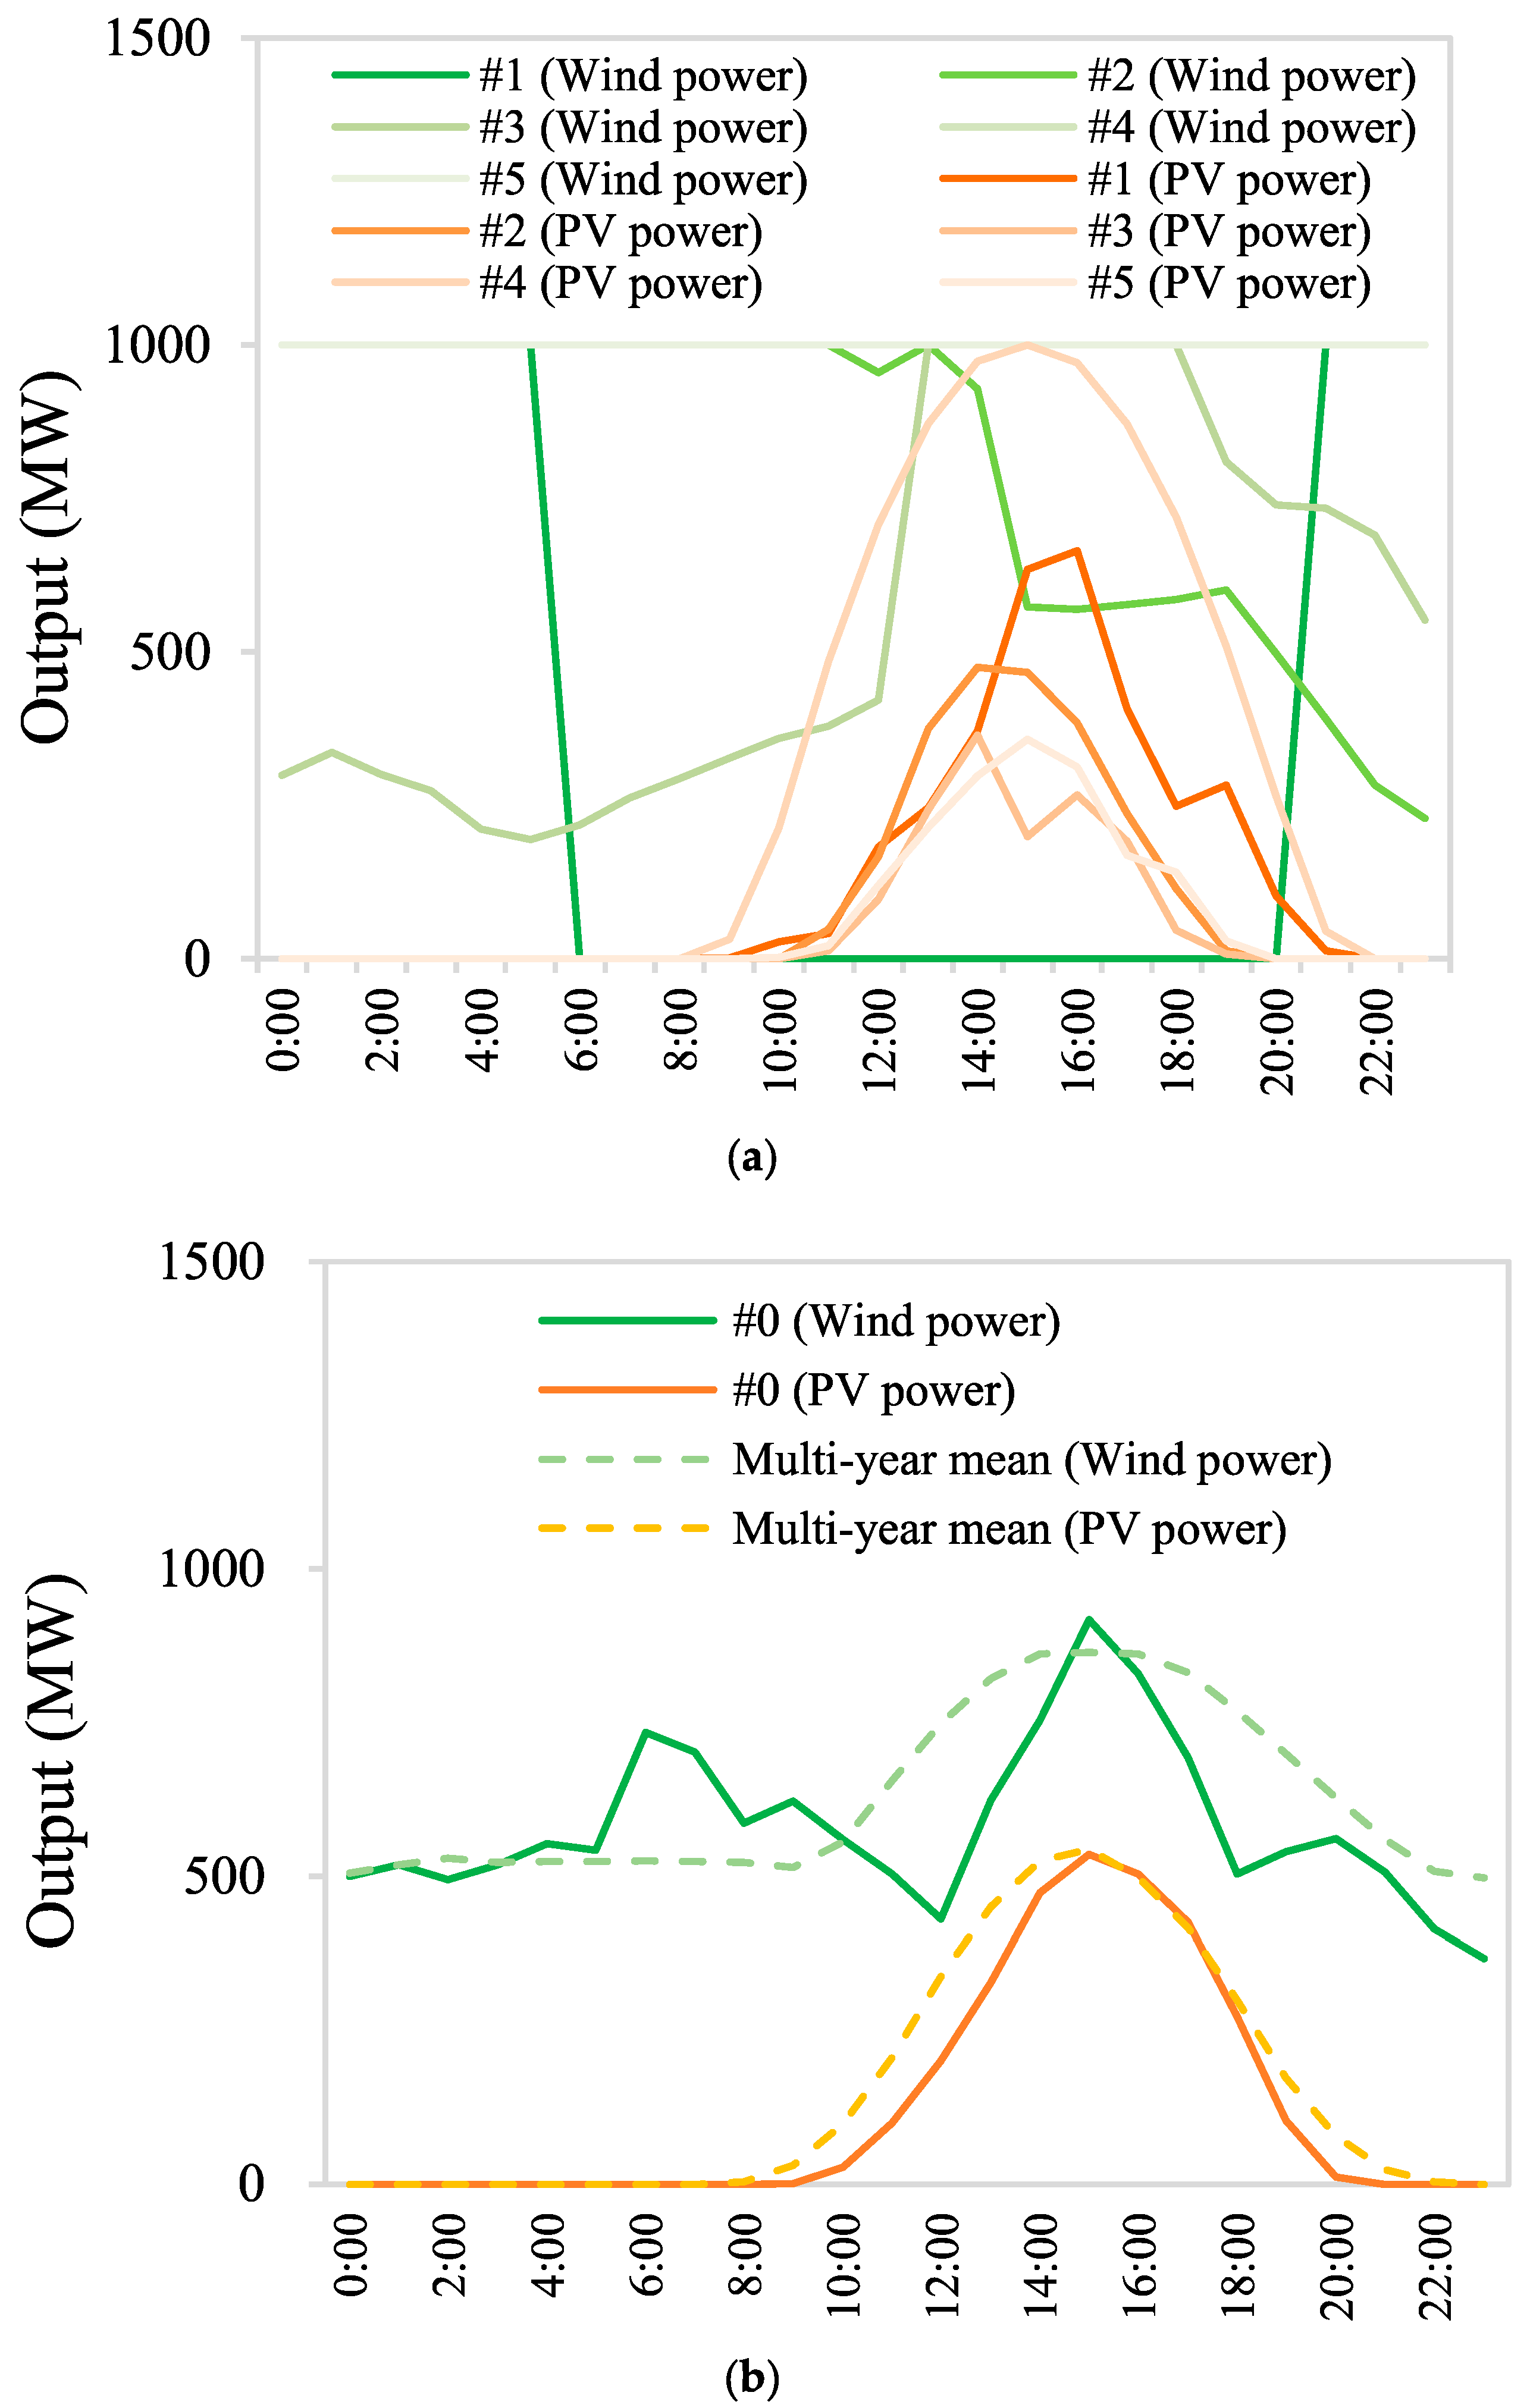
The typical scenarios of wind and PV output under cold-wave conditions (#1~5, as shown in Figure 2) were extracted using the Simultaneous Backward Reduction Method [40]. It can be seen from Figure 1 that under cold-wave conditions, the output of wind or PV power fluctuates sharply when the temperature abruptly drops. For wind and PV power output under non-cold-wave conditions, the process closest to the multi-year average was taken as the typical scenario under such conditions (#0, as shown in Figure 2).
Figure 2.
Output processes of wind and PV power in (a) Scenario 0 and (b) Scenario 1.
Subsequently, based on these scenarios, a simulation of the integrated hydro–wind–PV power system (the main parameters are shown in Table 1) under cold-wave conditions was carried out. It should be noted that the following discussion of the results is based on these scenarios, which limits the generalization of the conclusions of this study.
Table 1.
The main parameters of the hydro–wind–PV power system.
4. Results and Discussion
Taking the typical scenarios of wind and PV power output as input for the integrated hydro–wind–PV power system model constructed in this study, the operation process of hydropower in each scenario (including the output of the hydropower plant, the water level, and the flow) was obtained. It should be noted that the five scenarios represent statistical profiles. The differences observed among the scenarios cannot be directly attributed to individual meteorological variables, and the analyzed system is partly virtual and concerns a single representative case, which means the results cannot be directly generalized to other hydro–wind–PV systems or geographical areas without further verification.
4.1. Demand for Hydropower to Complement Wind and PV Power
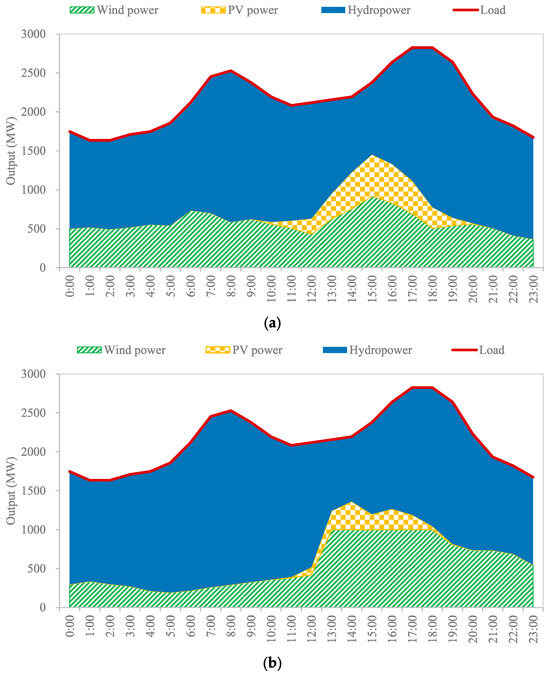
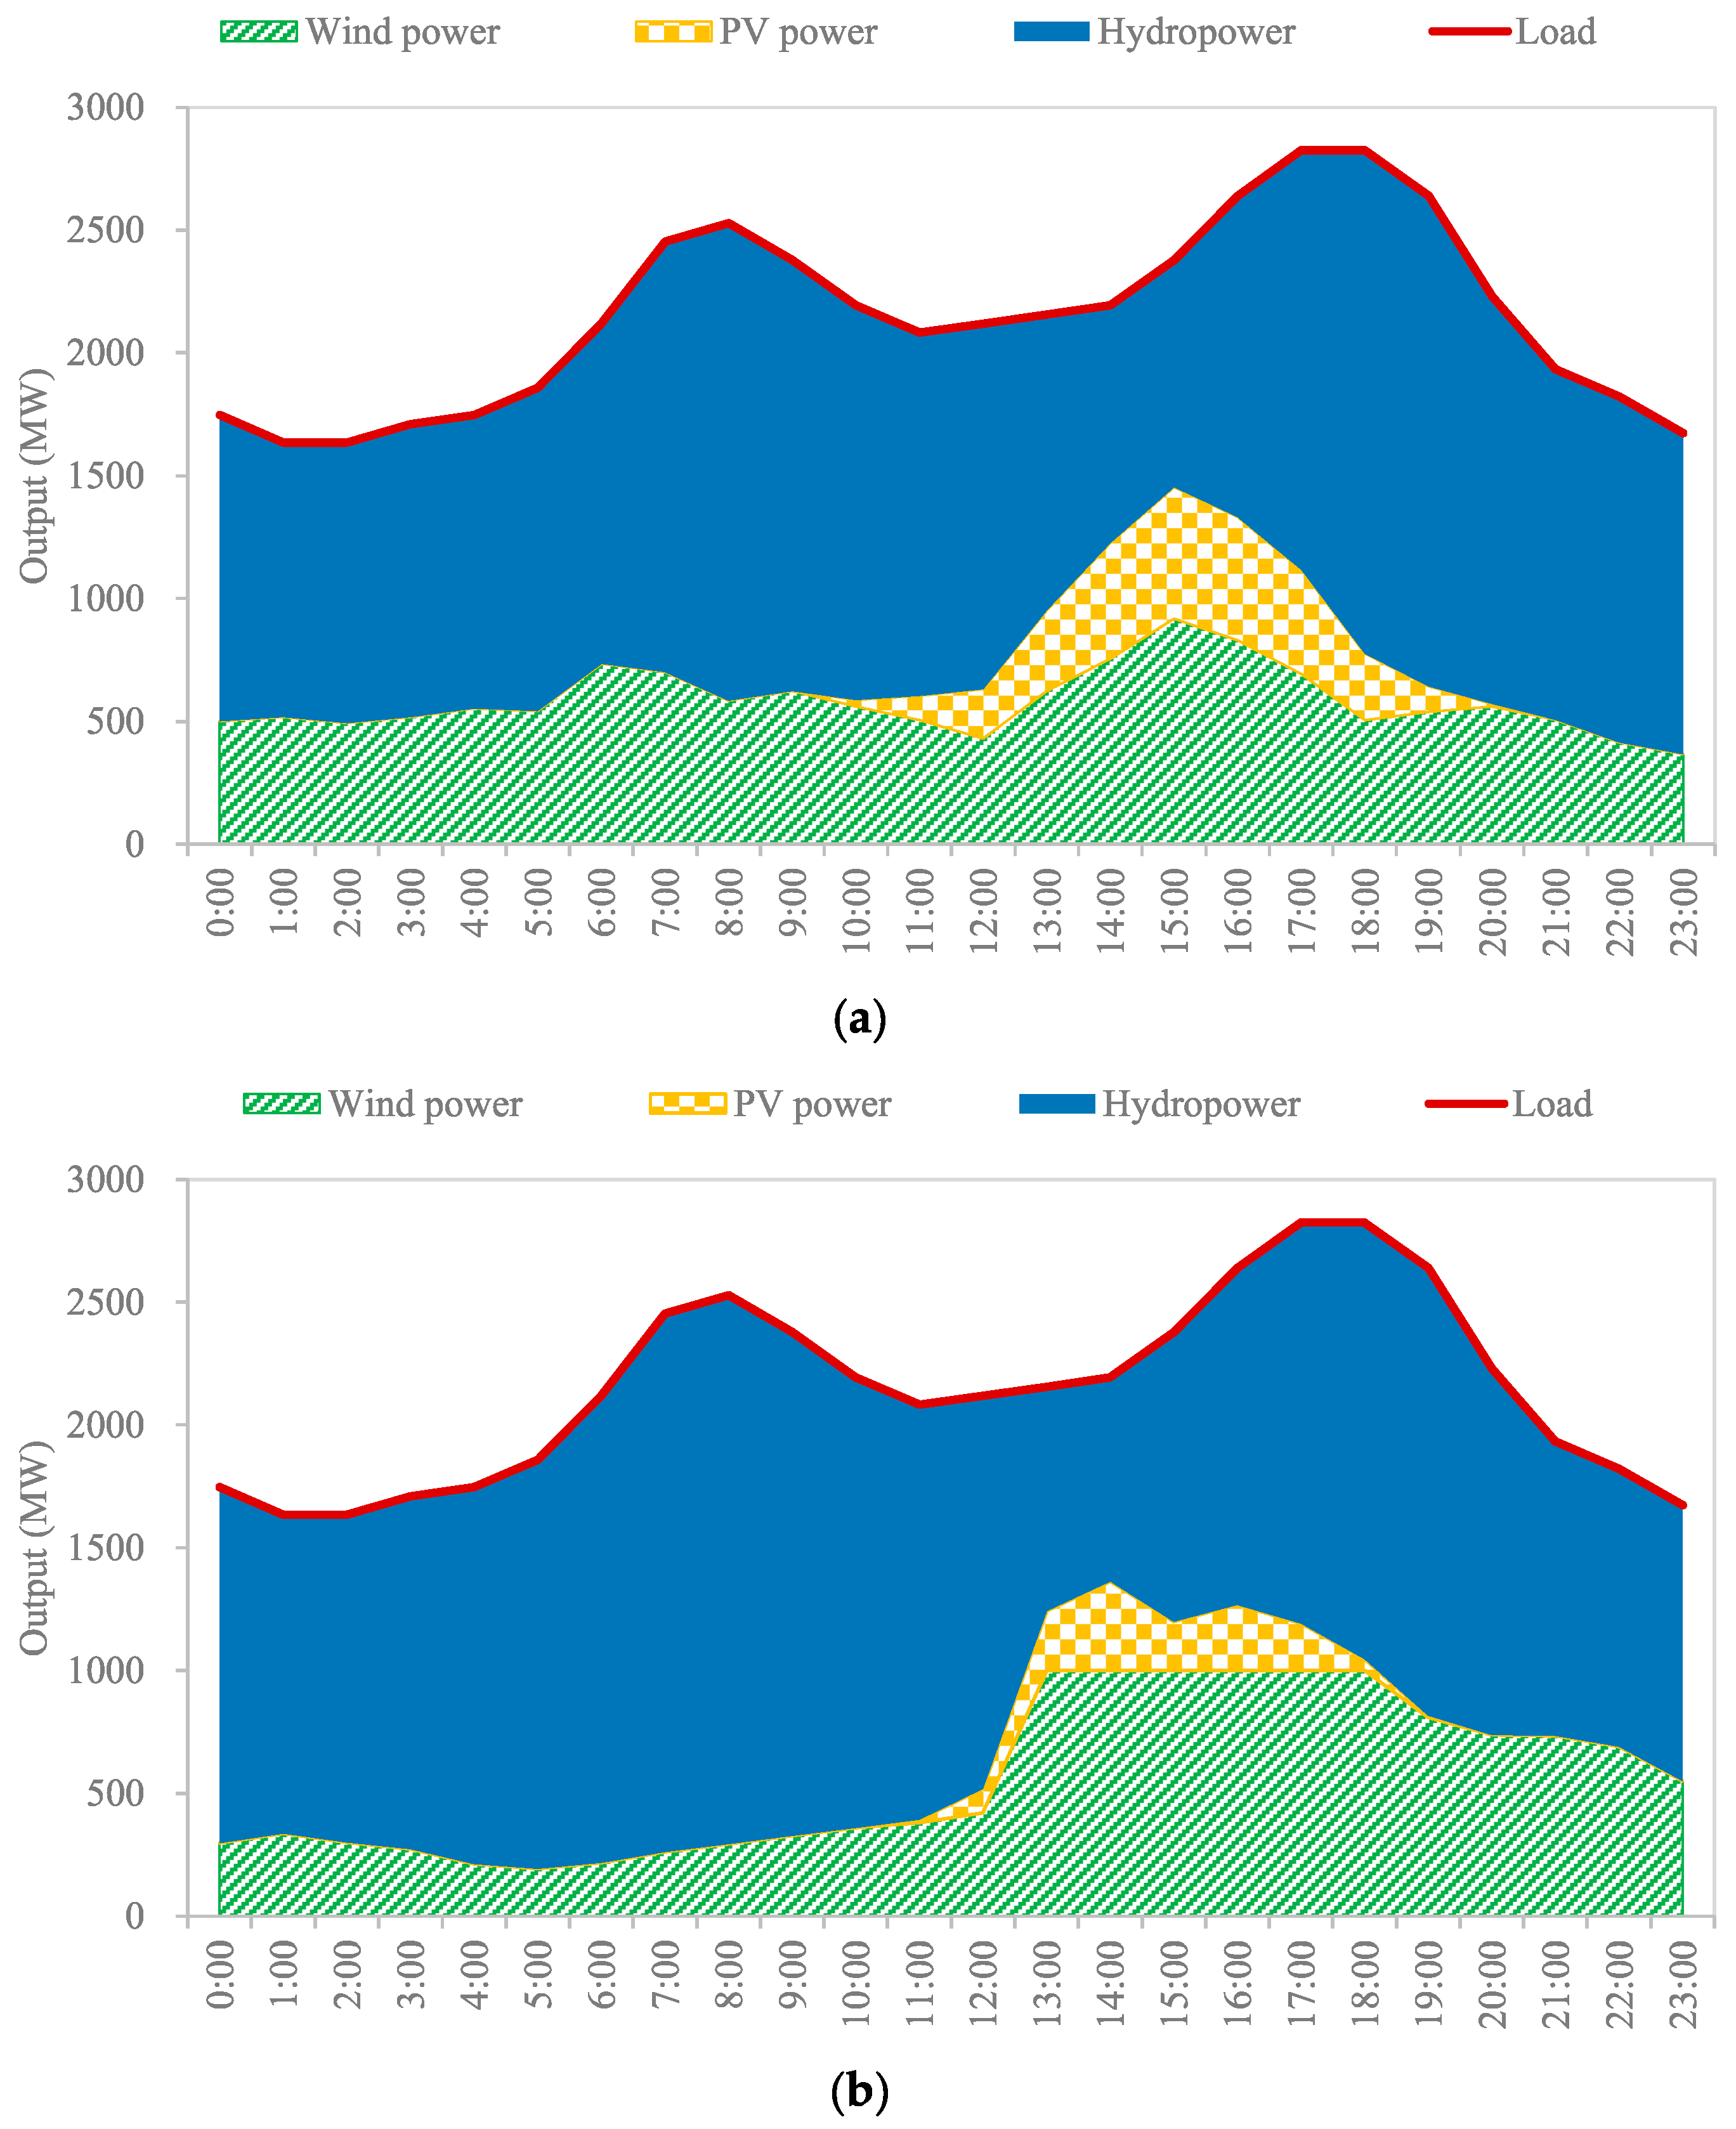
The operational processes of hydro, wind, and PV power in Scenarios 0 and 1 are shown in Figure 3. It can be seen that the wind and PV power generation in Scenario 1 under cold-wave conditions (14.84 GWh) is 12.49% (2.12 GWh) less than that in Scenario 0 under non-cold-wave conditions (16.95 GWh). The minimum output of wind and PV power in Scenario 1 (194 MW) is reduced by 47.20% (173 MW) compared with Scenario 0 (367 MW), and the maximum output of wind and PV power in Scenario 1 (1171 MW) is increased by 7.82% (85 MW) compared with Scenario 0 (1086 MW). These results suggest that the wind and PV power generation processes under cold-wave conditions are significantly different from those under the multi-year average conditions, and the demand for power generation compensation and regulation of hydropower is more prominent.
Figure 3.
Operational processes of hydro–wind–PV power integration: (a) Scenario 0 and (b) Scenario 1. The load curve reflects a virtual process based on the ratio of the local load in Northwest China.
Furthermore, the results of the comparison of differences in minimum and maximum output in wind and PV power generation and the total power production in Scenarios 0 to 5 are shown in Table 2.
Table 2.
Comparison of wind and PV power output in Scenarios 0 to 5.
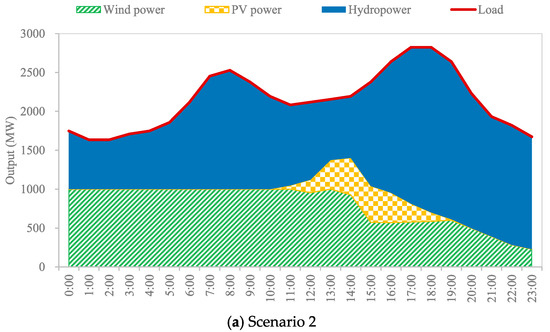
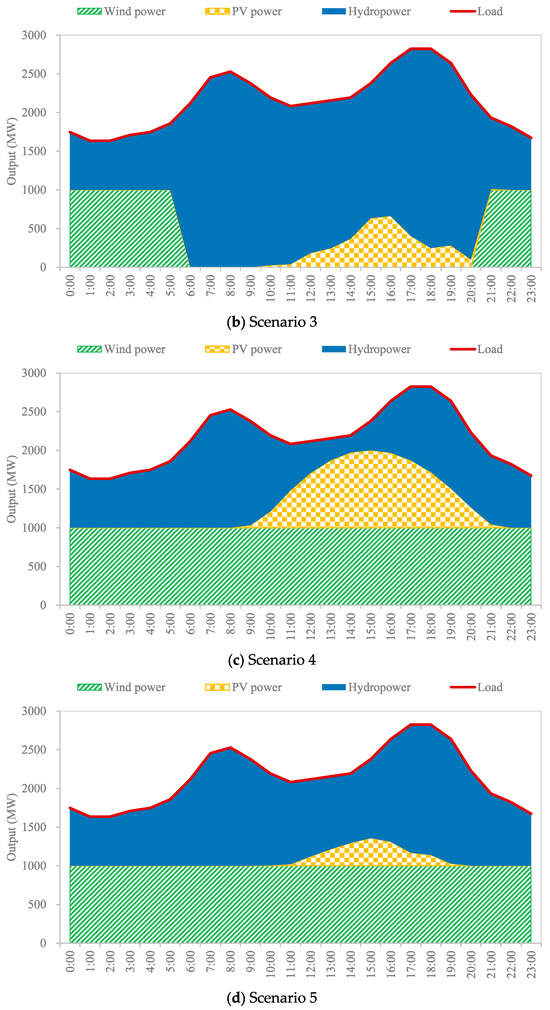
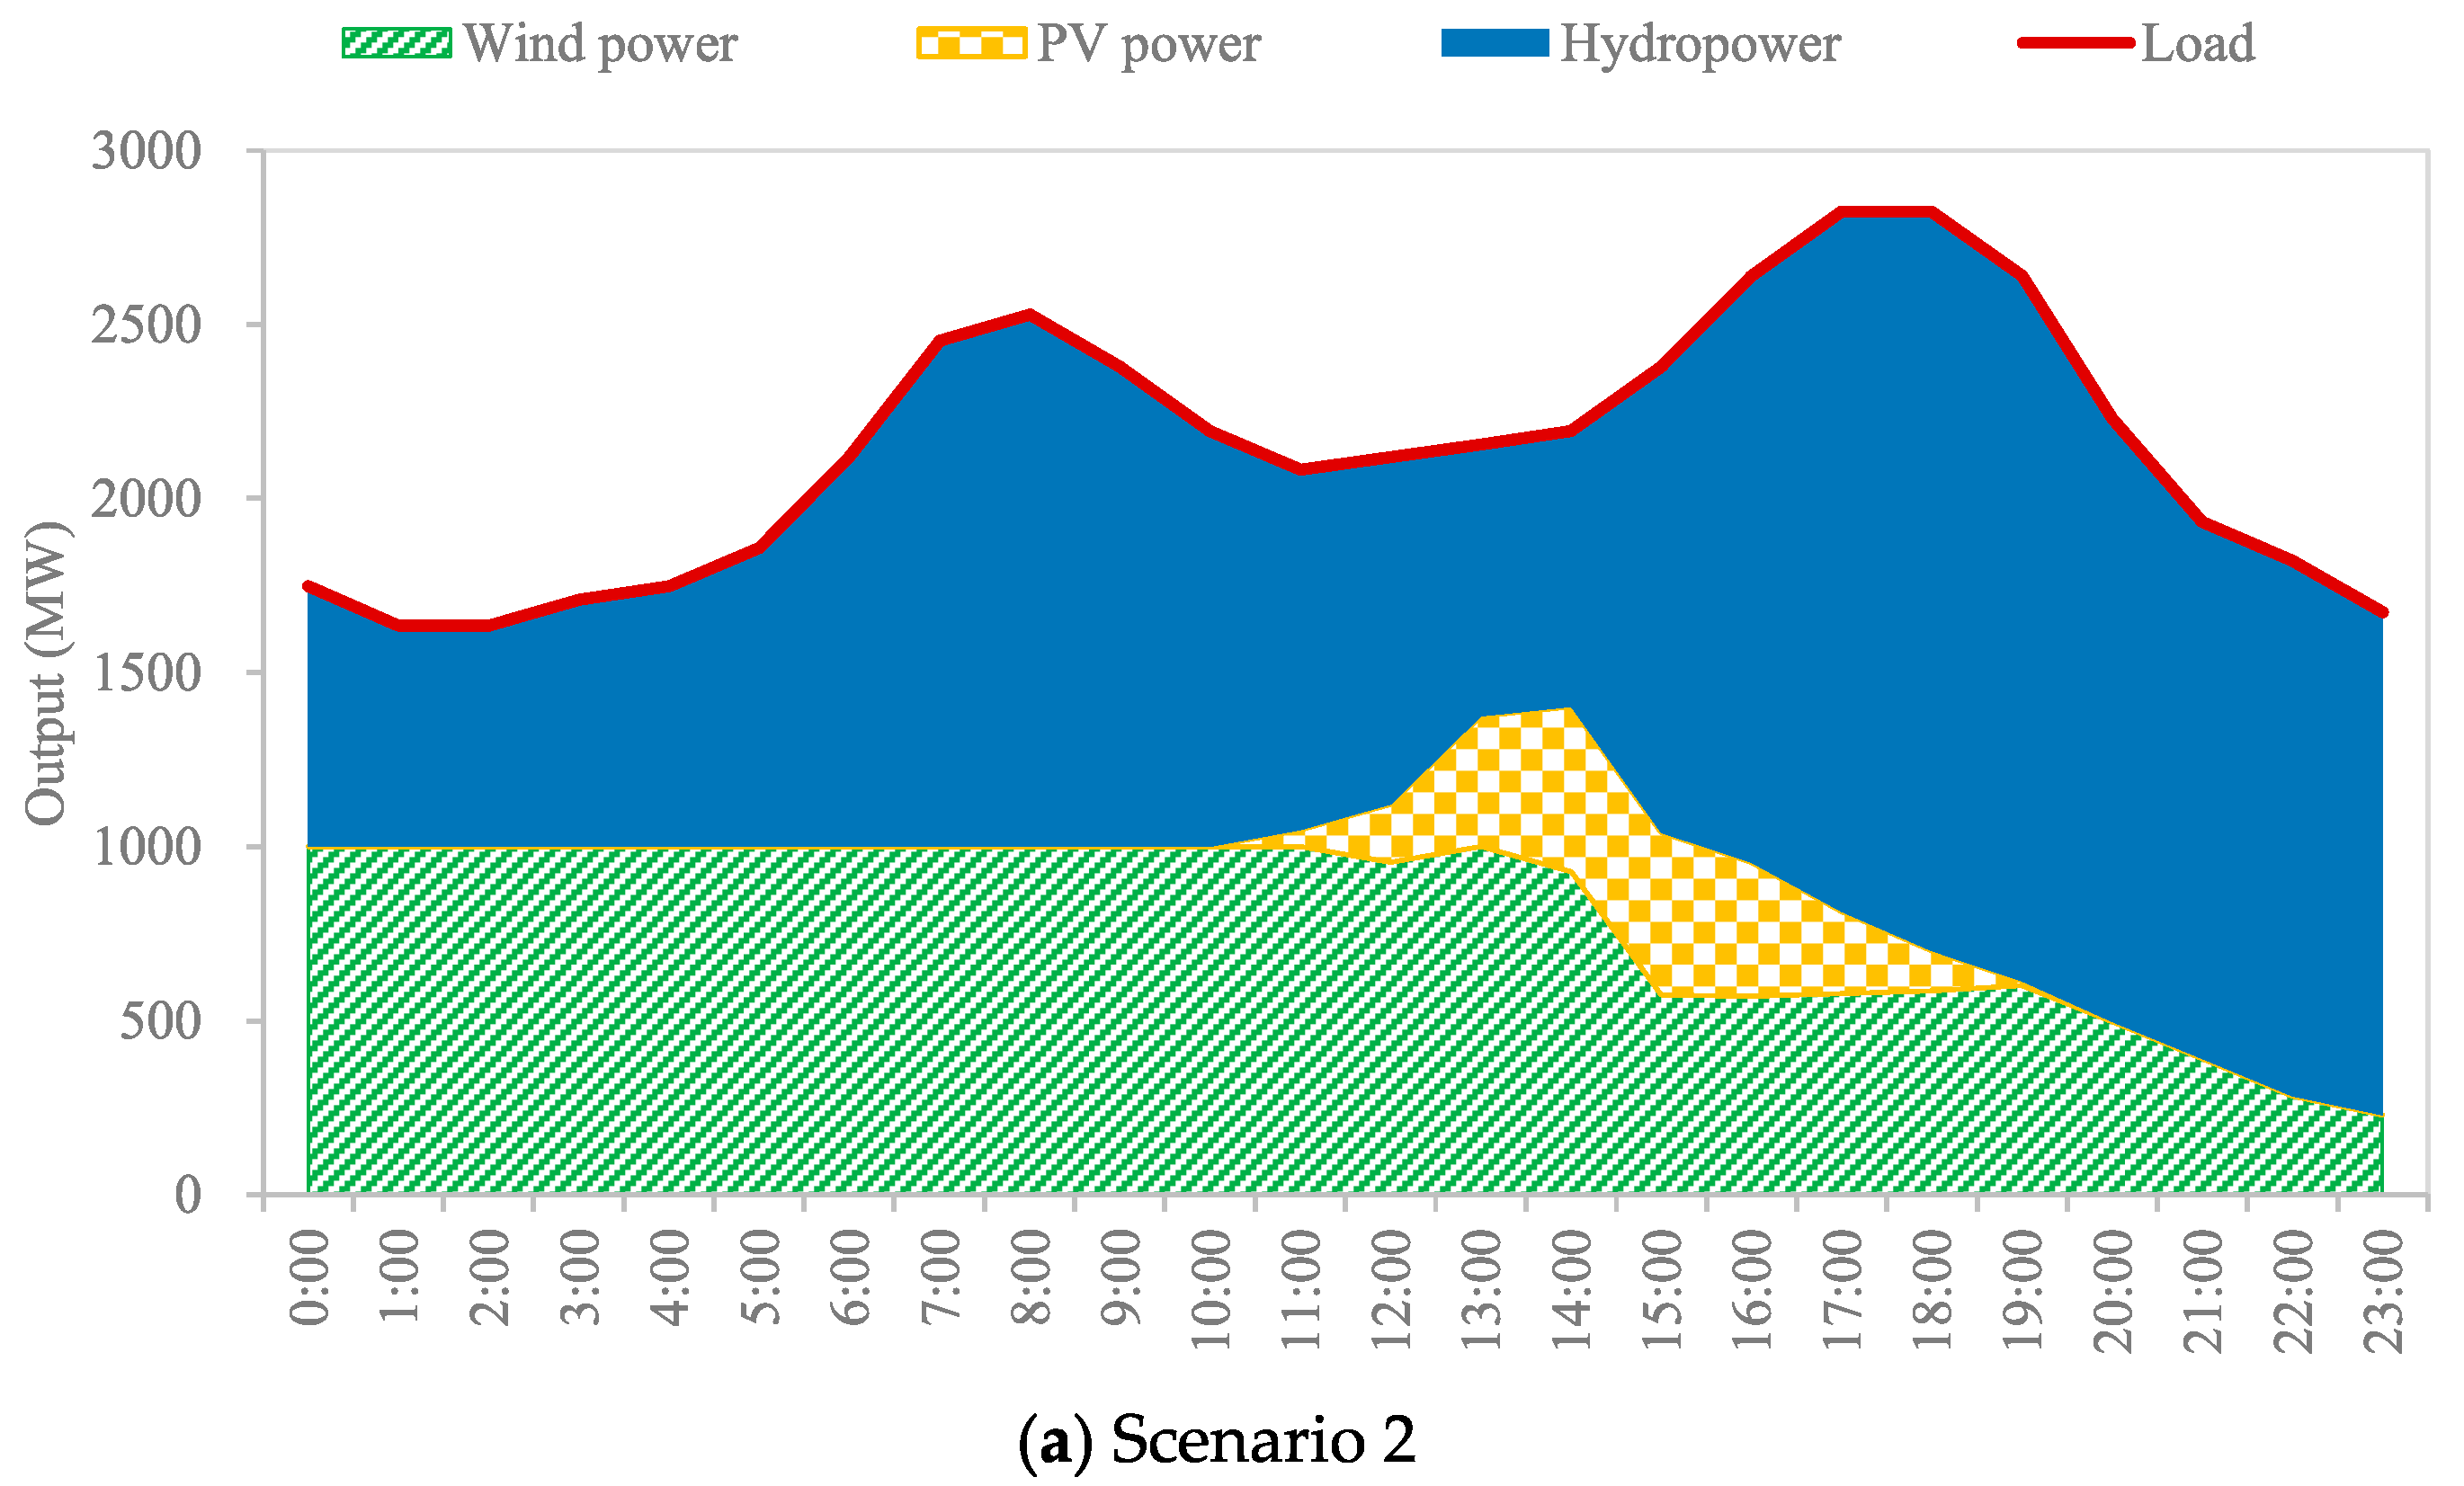
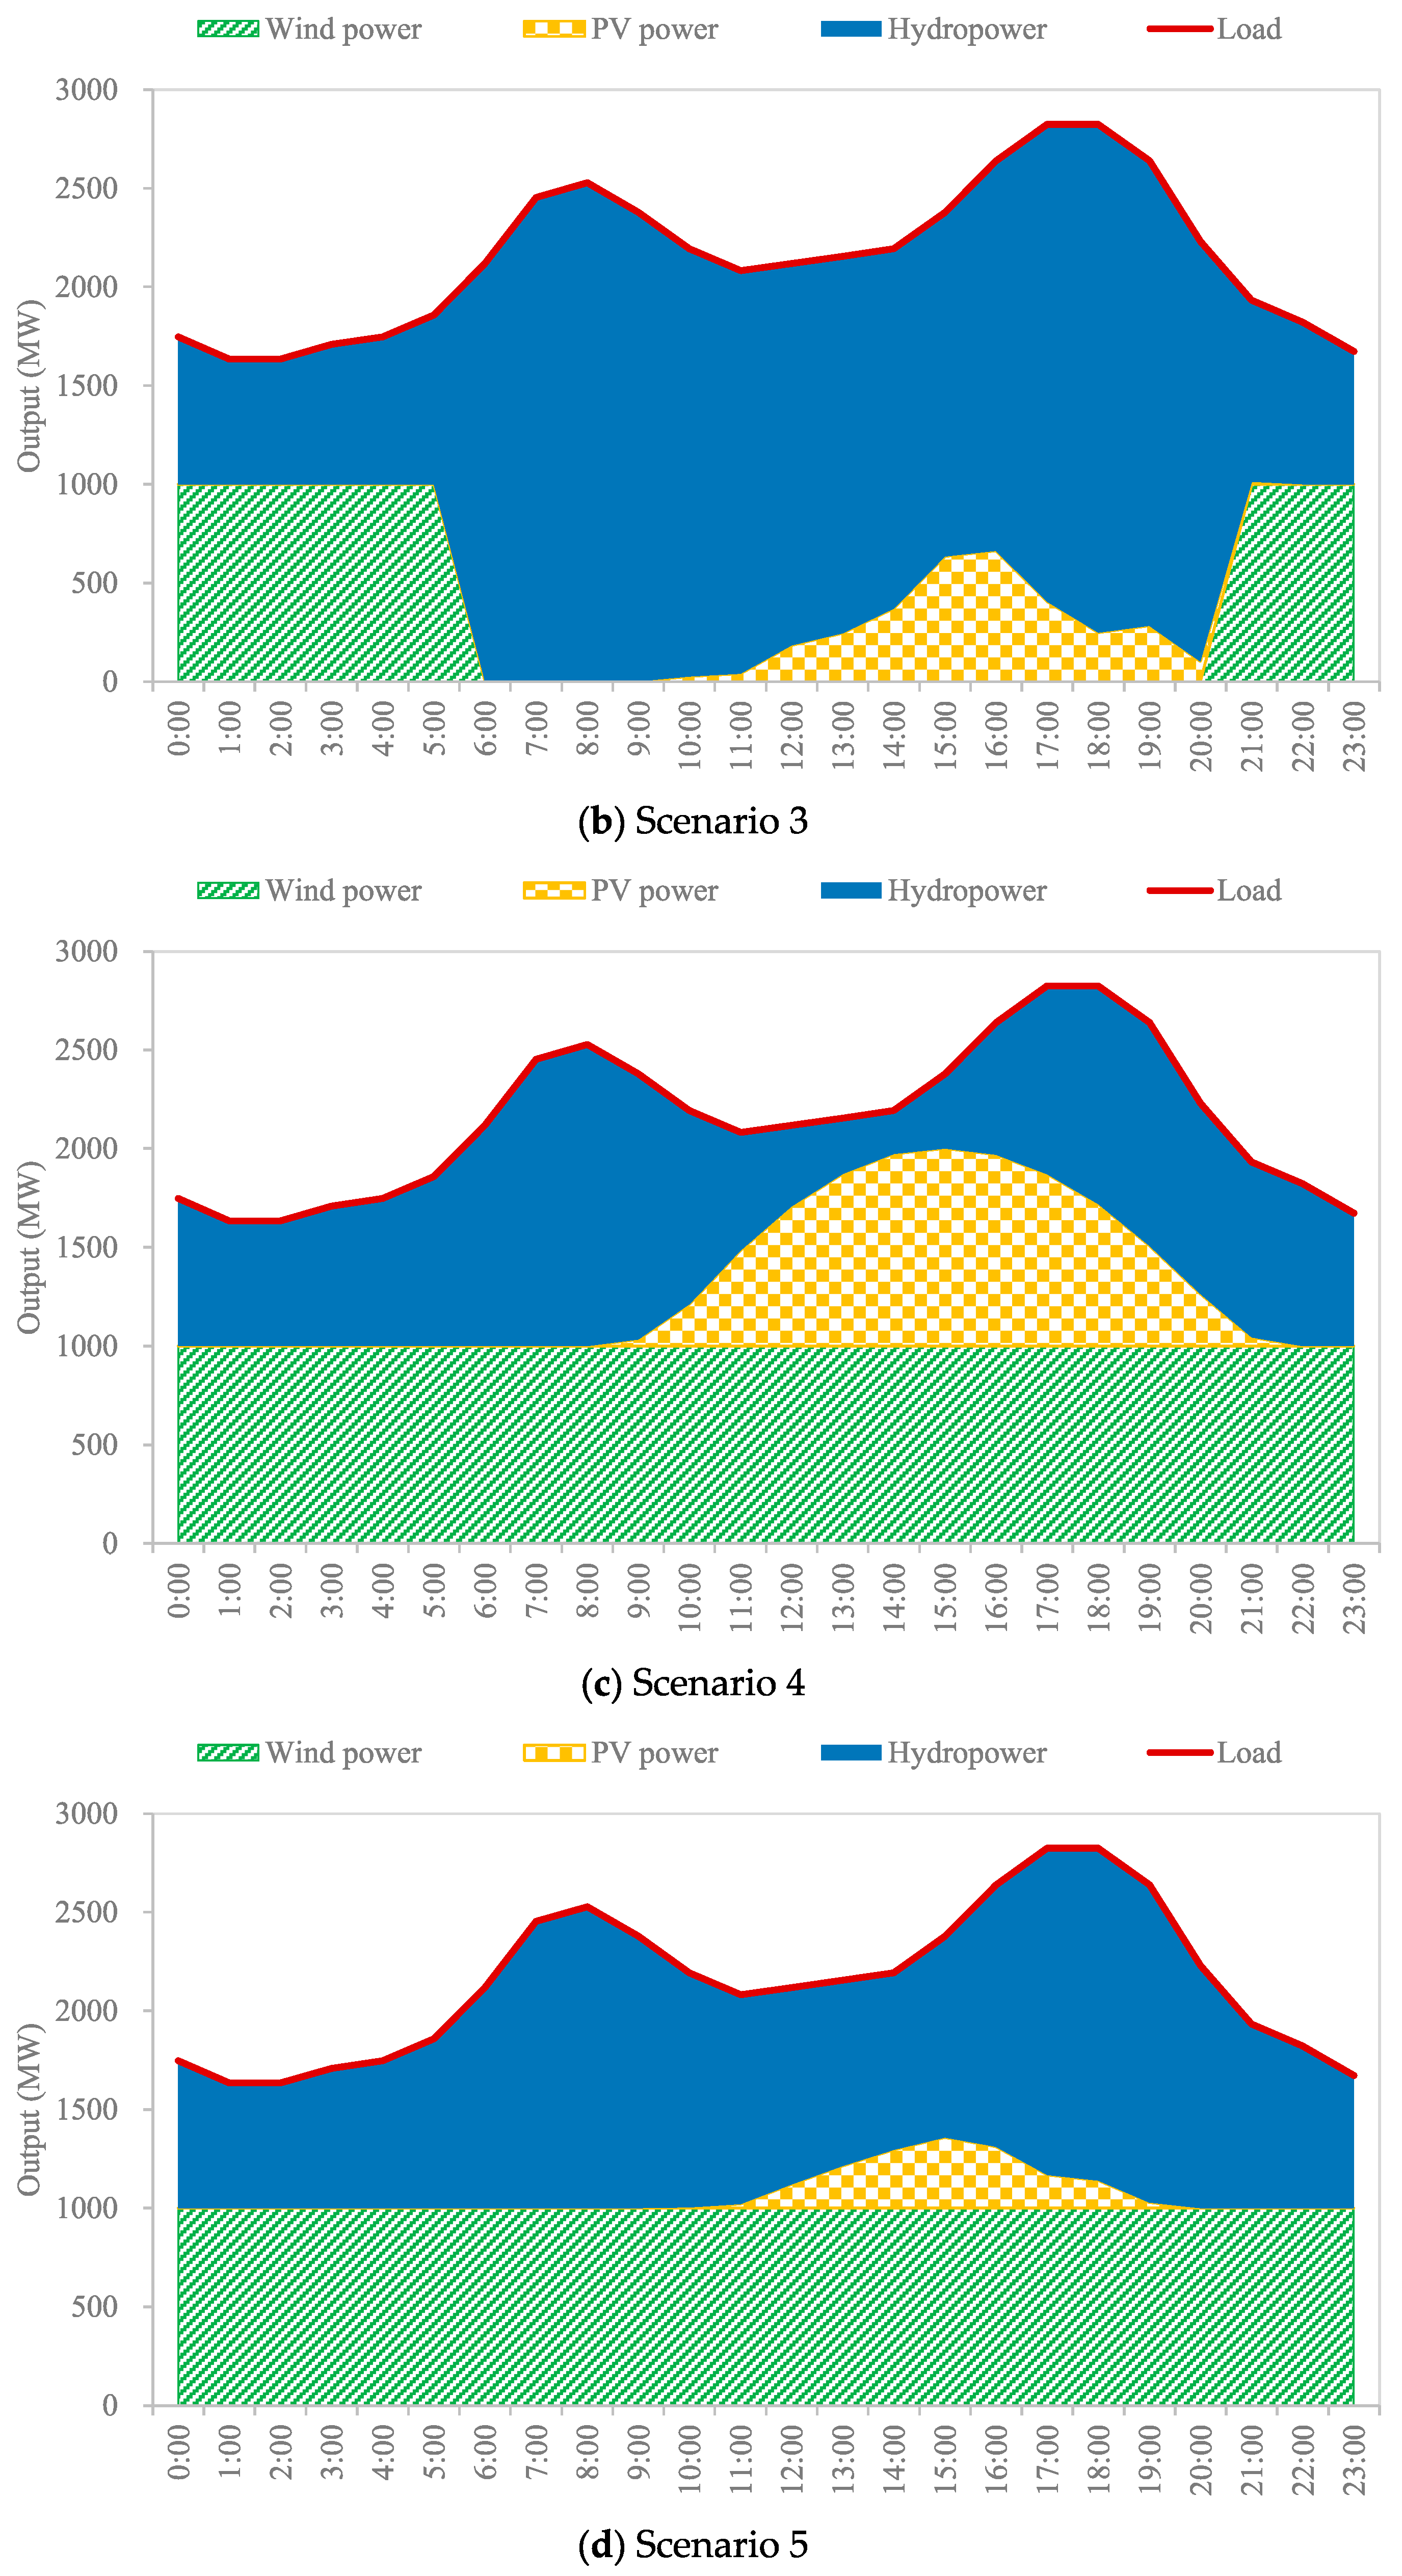
From Table 2, it can be seen that in this case study, the wind and PV power generation processes under cold-wave conditions (Scenarios 1 to 5) are significantly different from the process under the multi-year average conditions (Scenario 0), with the power production increasing from −4.73 to 14.71 GWh, corresponding to a percentage range from −12.49 to 86.76%. The minimum output ranges from −367 to 633 MW, corresponding to a percentage range from −100 to 172.48%, and the maximum output difference ranges from −728 to 88 MW, corresponding to a percentage range from −67.04 to 8.17%. Since the total load requirements are the same across all scenarios, hydropower needs to compensate for the fluctuations in wind and PV power (as shown in Figure 4). In addition to the increase in the minimum output and the decrease in the maximum output, other fluctuations, such as increased power generation, need to be compensated and regulated by hydropower, further indicating that the demand for multi-energy complementarity of wind and PV power is larger under cold-wave conditions. It should be noted that the analysis and results are based on different simple representative renewable generation profiles obtained using the scenario reduction procedure, rather than different meteorological configurations actually observed during extreme weather events.
Figure 4.
Operational processes of hydro–wind–PV power integration in Scenarios 2 to 5.
4.2. Response of Hydroelectric Compensation Regulation
4.2.1. Positive Effect
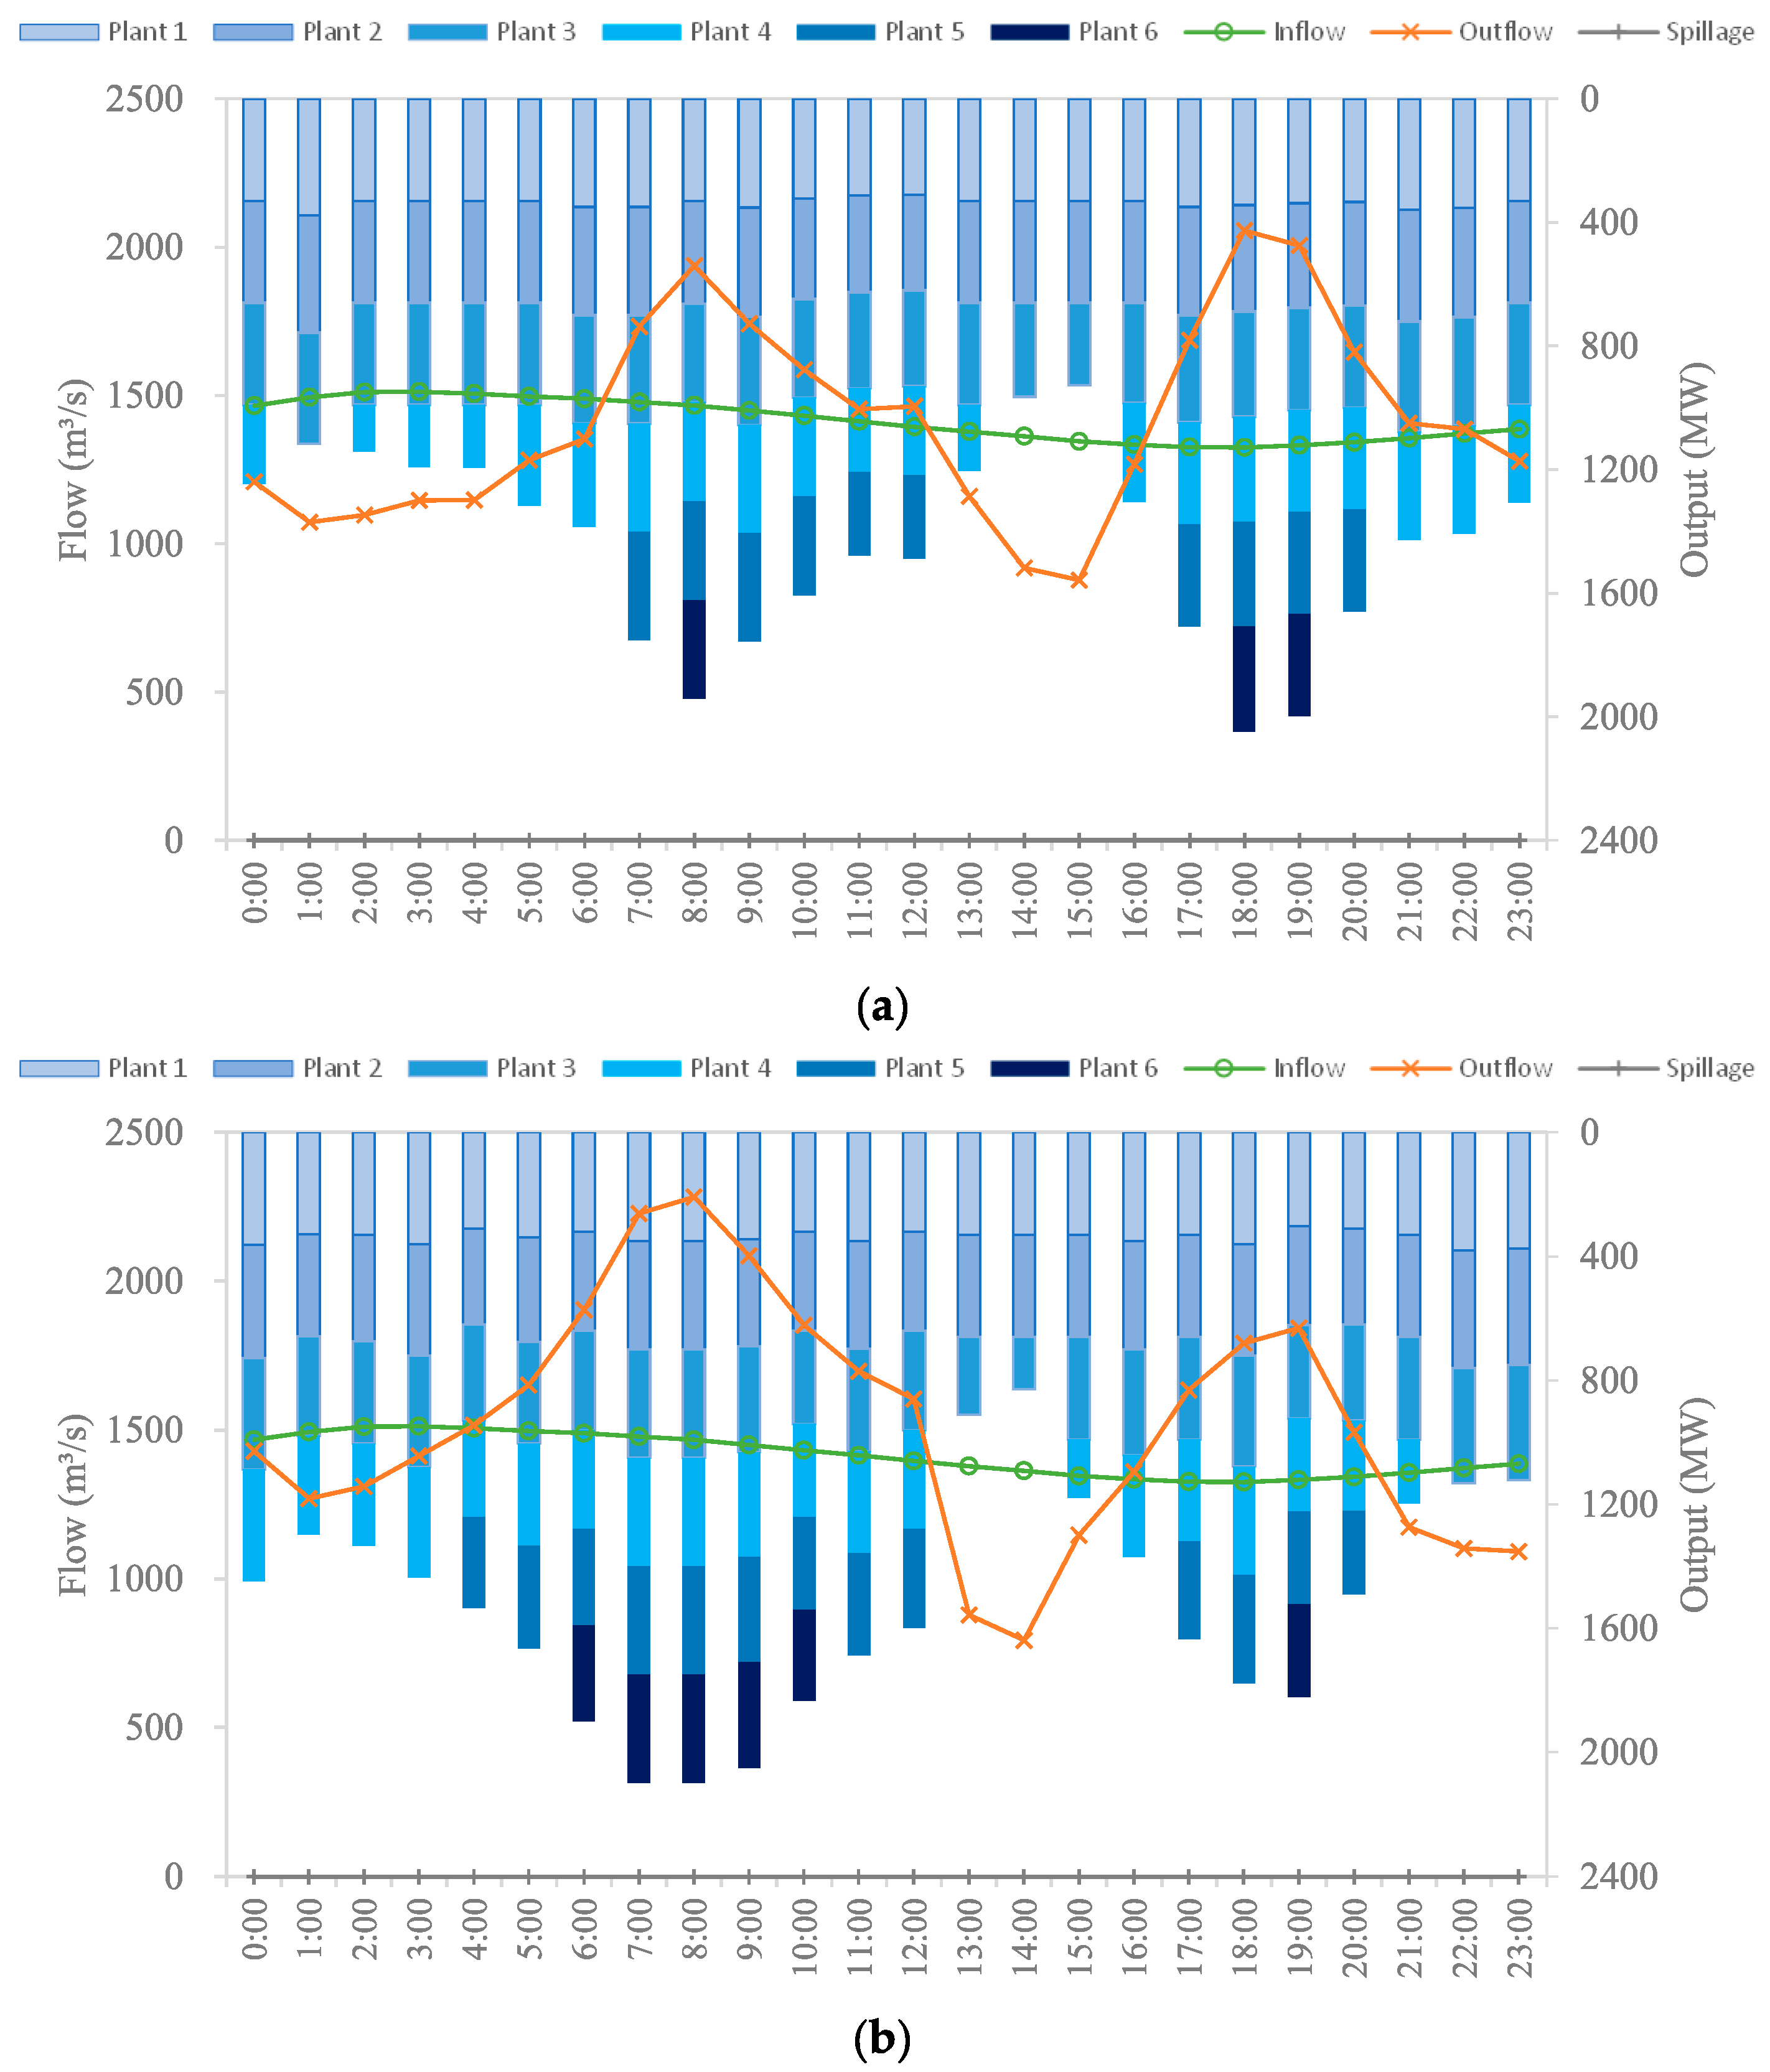
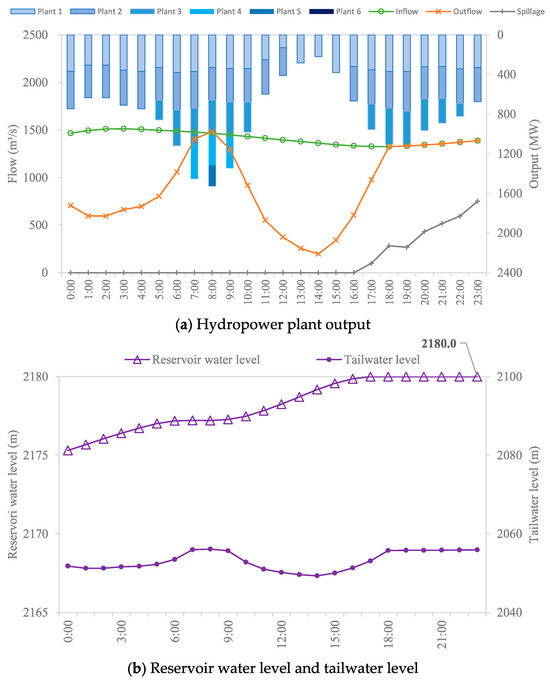
Due to the flexible power dispatch ability of the hydropower plants and the reliable runoff regulation capacity of the reservoir, hydropower responds quickly to the compensation demand to smooth the wind and PV power fluctuations. The power output processes and the inflow, outflow, and water level in Scenarios 0 and 1 are displayed in Figure 5 and Figure 6. Considering the analysis is limited to a daily time horizon, it does not allow the progressive variation in the reservoir water level or the ability of the hydropower system to sustain regulation during multi-day cold-wave events to be assessed.
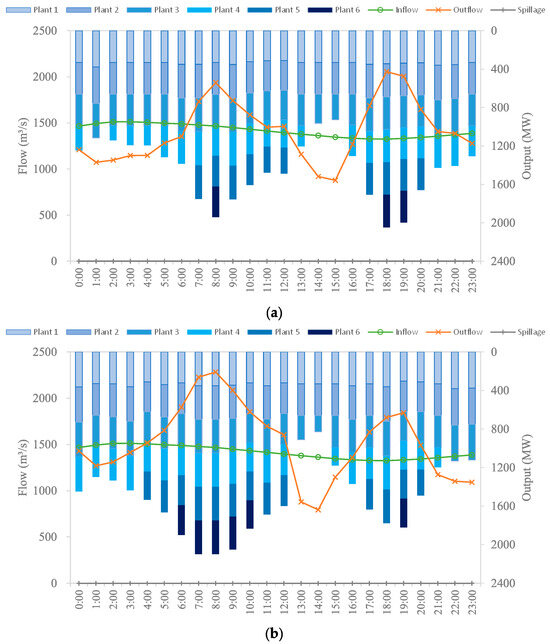
Figure 5.
The power output processes of the hydropower plants and the inflow and outflow of the reservoir in (a) Scenario 0 and (b) Scenario 1.
Figure 6.
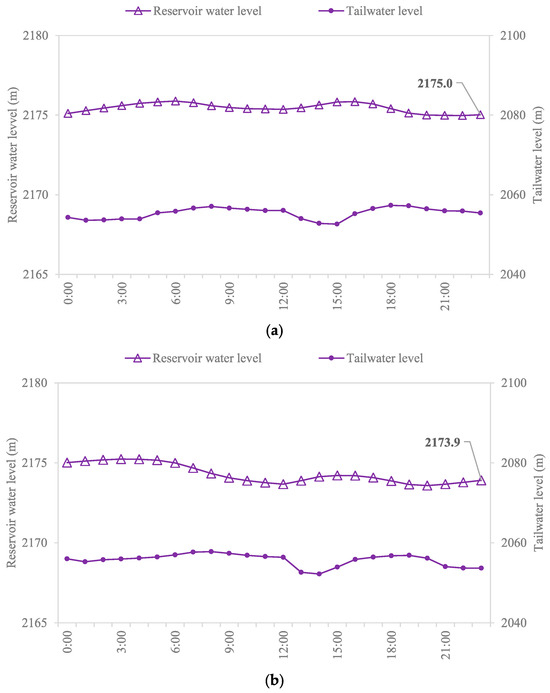
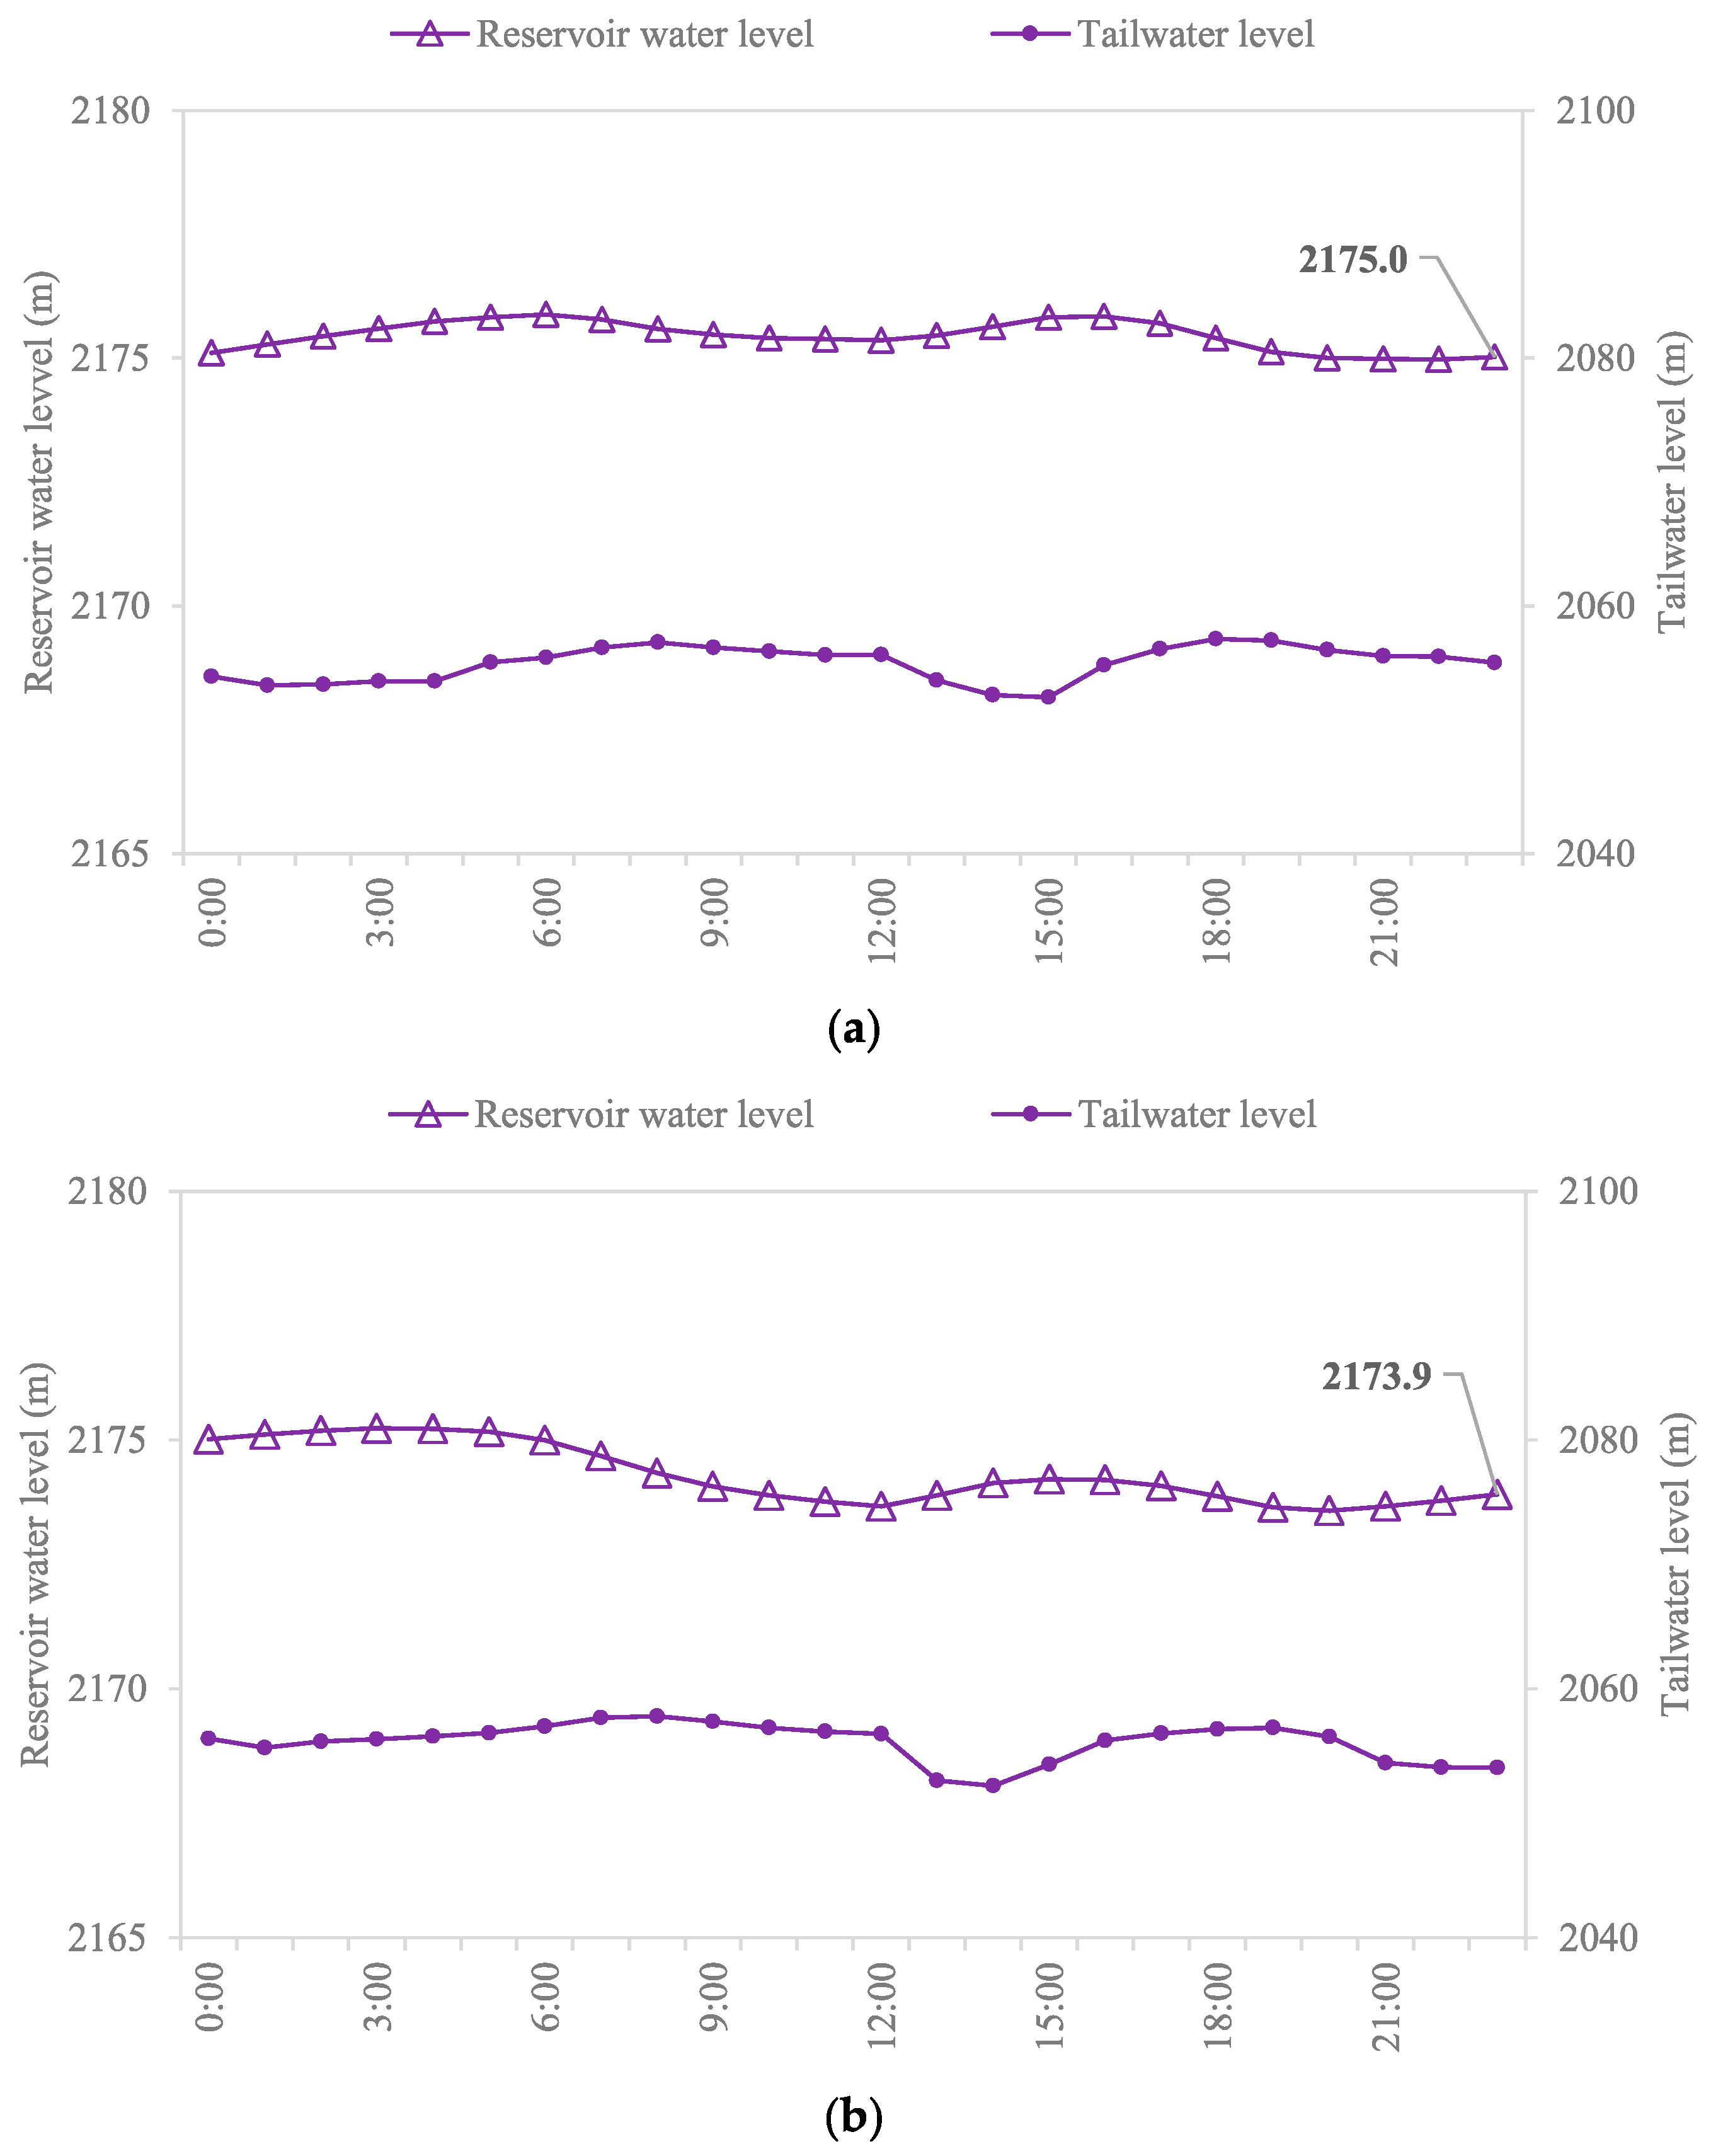
The reservoir water level and tailwater level in (a) Scenario 0 and (b) Scenario 1.
As shown in Figure 5, similarly to the multi-year average conditions (Scenario 0), under cold-wave conditions (Scenario 1), hydropower can be operated by flexibly starting and stopping the plants (with six plants employed, starting five times and stopping six times in Scenario 1) and adjusting the unit output (the minimum/maximum output of a single plant is 168/380 MW in Scenario 1), in response to the compensation demand to smooth the fluctuating wind and PV power output (as shown in Figure 3), thus meeting the requirement that the load is fulfilled jointly by hydro, wind, and PV power.
As shown in Figure 6, the reservoir water level at the end of the operation horizon under cold-wave conditions (Scenario 1) is 2173.9 m, which is 1.1 m lower than that under the multi-year average conditions (Scenario 0; 2175.0 m), and the fluctuation range of the reservoir water level also increases noticeably. This is because the daily wind and PV power production in Scenario 1 is lower (2.12 GWh, as shown in Table 2) than that in Scenario 0, and hydropower needs to make up for this shortfall to meet the daily load, leading to the consumption of the stored water energy in the reservoir and subsequently causing the reservoir water level to drop. Although the electricity load is met in the current operation horizon, the reduced water head of hydropower and the lowered reservoir storage will exacerbate the water consumption rate for the following operation and increase the risk of running out of usable water in the hydropower reservoir.
For the hydropower operation processes in Scenarios 0 to 5, the comparison of the plant start-up and shut-down times, maximum and minimum outputs of a single plant, and reservoir water levels at the end of the operation horizon are shown in Table 3.
Table 3.
Comparison of hydropower plant start-up and shut-down times, maximum and minimum outputs of a single plant, and reservoir water levels in Scenarios 0 to 5.
According to Table 3, in this case study, compared with the multi-year average conditions (Scenario 0), there are no significant differences in the parameters of the number of employed plants, start-up/shut-down times, and maximum/minimum outputs of a single hydro plant under cold-wave conditions (Scenarios 1–5). This reflects the potential for flexible operation of hydro plants and illustrates that hydropower can accomplish the peaking requirements of smoothing wind and PV output fluctuations (as shown in Table 2) under cold-wave conditions. Regarding the reservoir water level at the end of the operation horizon, Scenarios 1 to 5 show significant deviations from Scenario 0, with the highest value being 2180.0 m and the lowest being 2172.8 m, showing a deviation of −2.2 to 3.0 m from the multi-year average of 2175.0 m (a return to the reservoir water level at the beginning of the operation horizon). This deviation either uses the water energy stored in the reservoir or occupies the capacity of the reservoir to regulate runoff. The results further denote that hydropower can cope with sudden changes in wind and PV power generation during cold-wave conditions. Furthermore, the complementarity of hydropower influences the reservoir’s other operation tasks [41], such as water supply, shipping, and ecological regulation, and induces unstable issues [42], including discharge fluctuation, water-level alteration, ecological system turbulence, and power production variation and consumption. Under cold-wave conditions, these disturbances will be exacerbated.
4.2.2. Insufficiency
Due to limitations related to the installed capacity of the hydroelectric plants and the regulating capacity of the reservoir, hydropower cannot fully respond to the coordinated operation demand to complement wind and PV power.
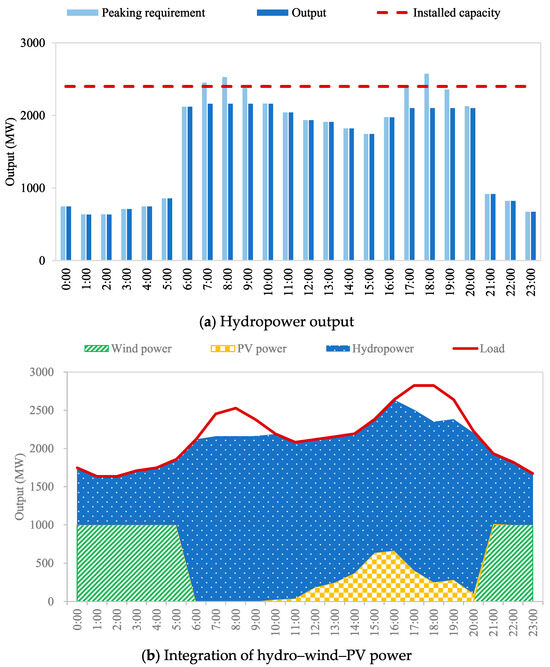
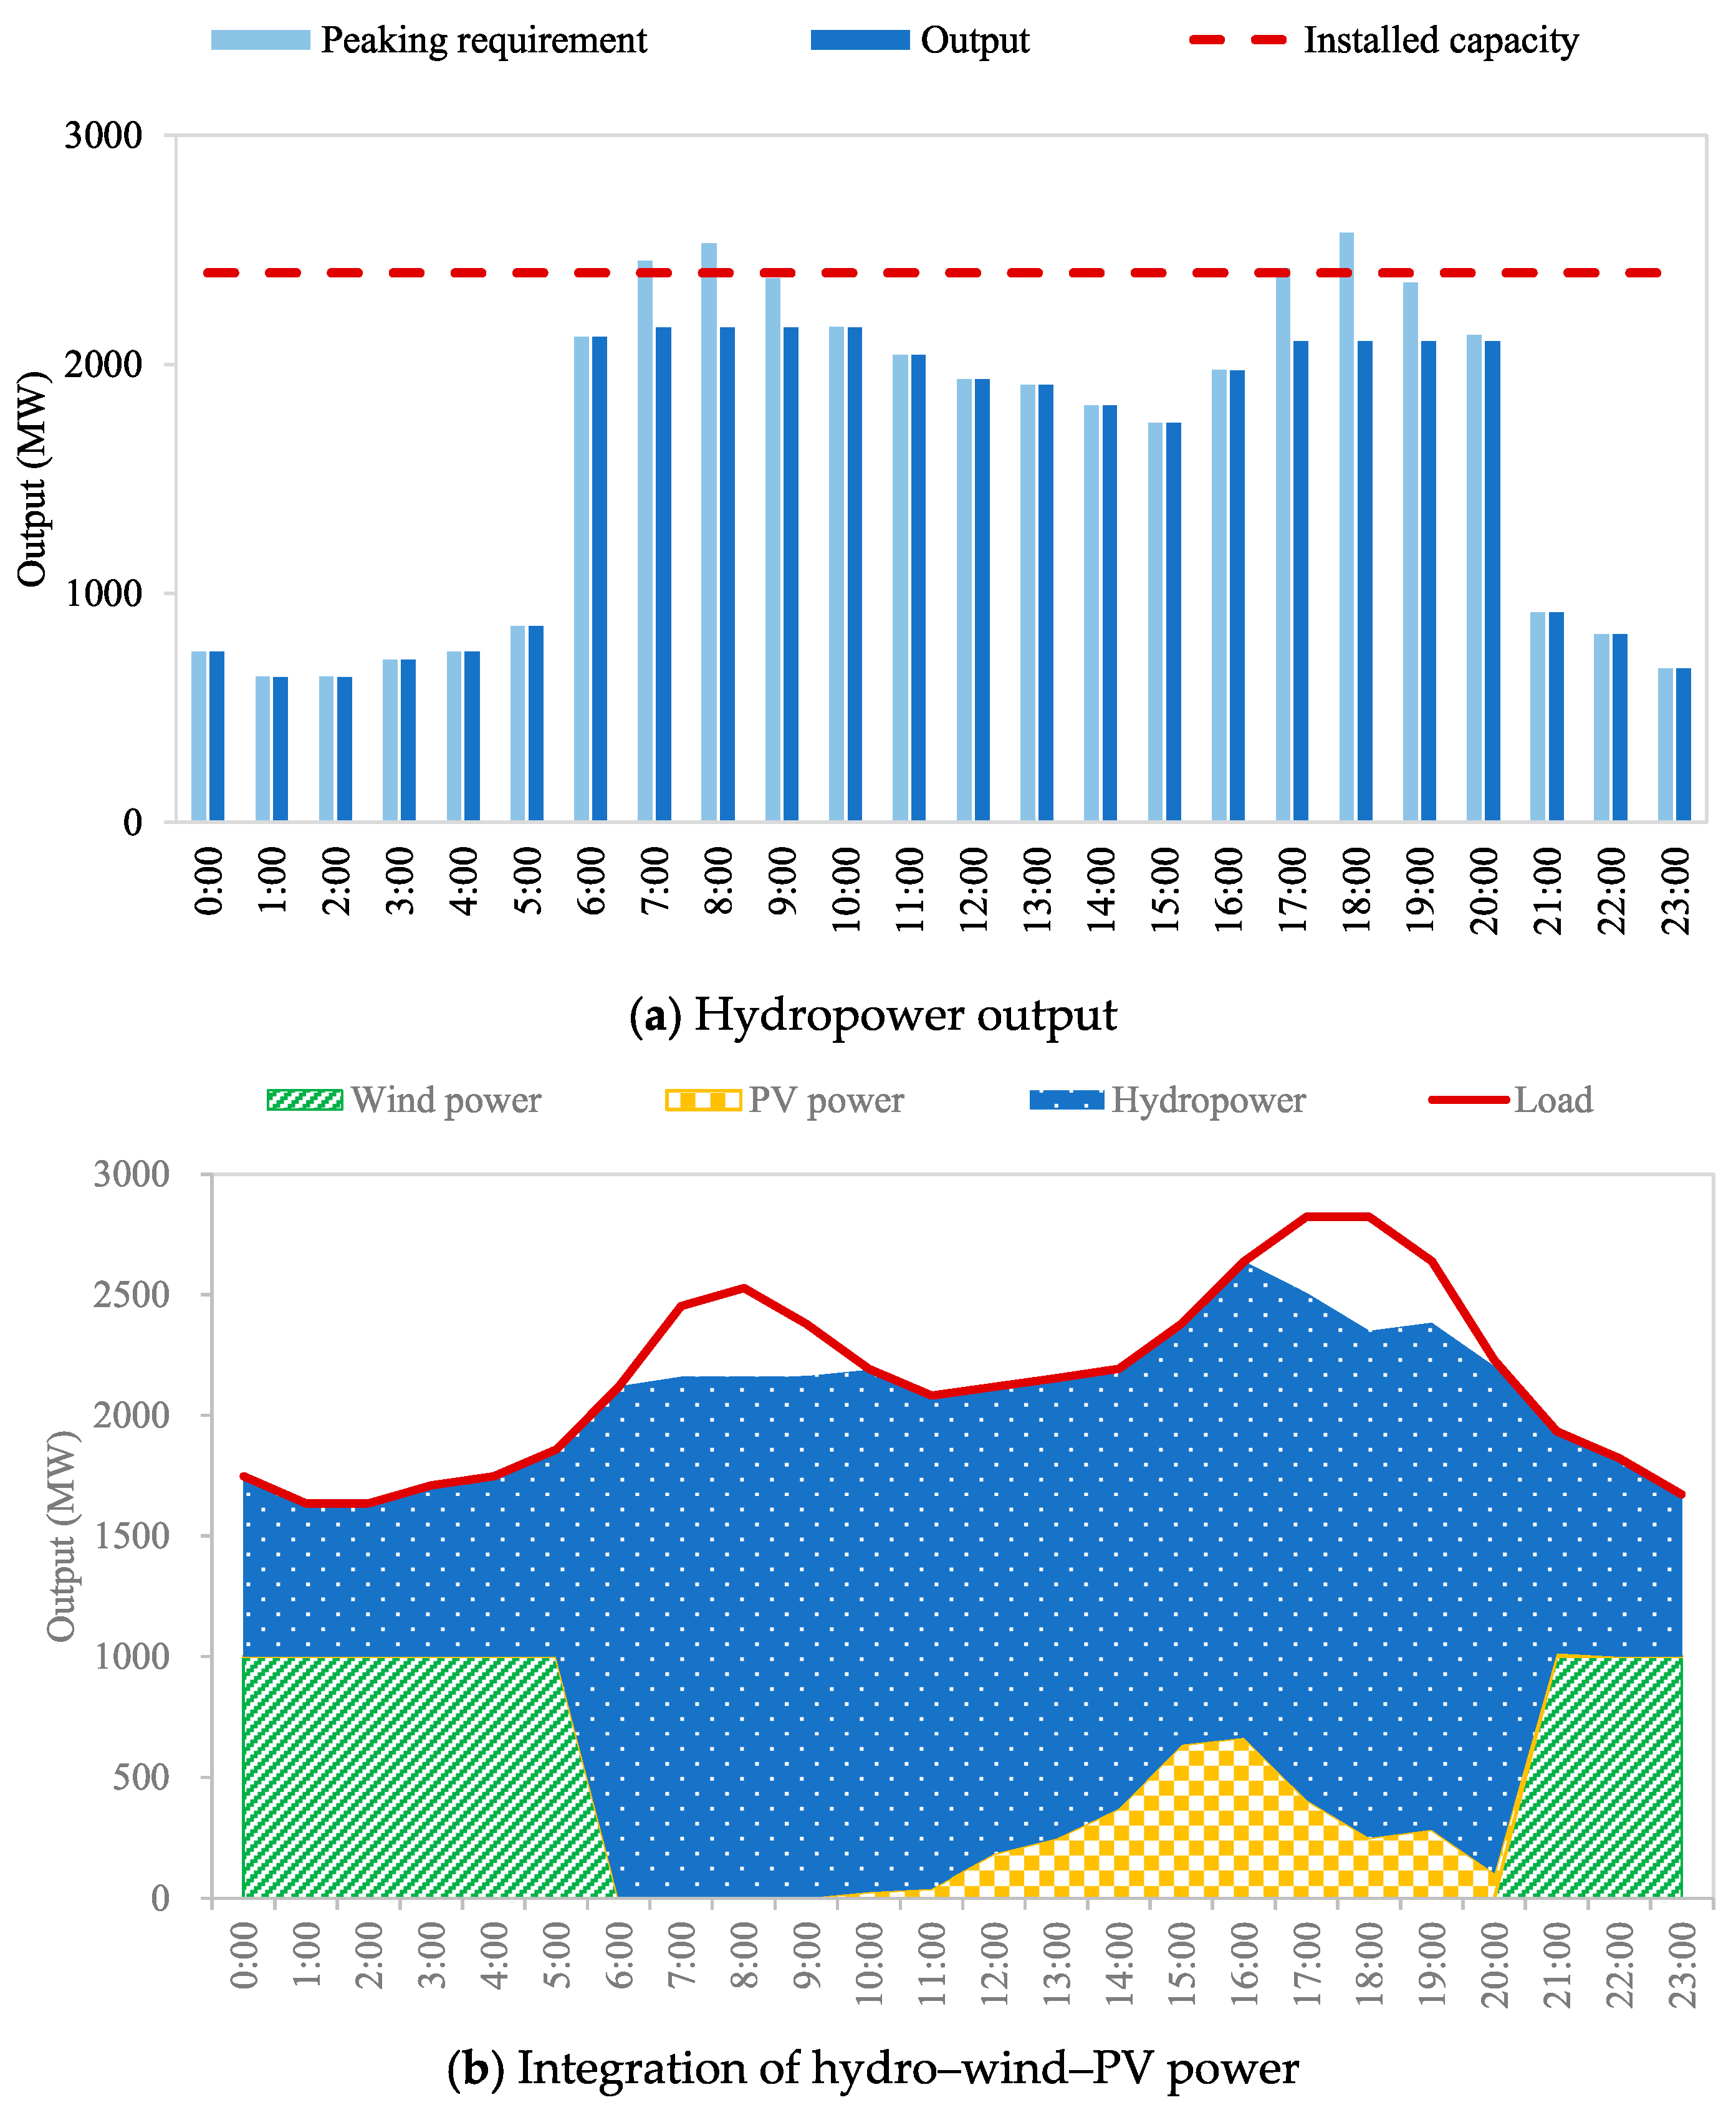
In Scenario 3 (as shown in Figure 7), where the installed capacity is exceeded (2400 MW), hydropower cannot fully offset the power shortage (2453 to 2527 MW) caused by the reduced wind and PV output (such as from 7:00 to 8:00, when the output is 0 MW). In addition, due to the expected output limit of the hydro plants, it is also impossible to generate electricity at the designated output (such as during 19:00–20:00, when the output is 2128–2356 MW, which is lower than the installed capacity but higher than the expected output) in the low-efficiency operation area of the units, resulting in some periods with a shortage of power production supply (1962 MWh) even after the integration of hydro, wind, and PV power. To fill the power shortage, the power system will have to either cut down the load or import another power supply.
Figure 7.
Hydropower demand to complement wind and PV power and processes of hydropower operation in Scenario 3.
Regarding reservoir regulation capacity, in Scenario 4 (as shown in Figure 8), where the reservoir is full (17:00–23:00), but the hydropower plants still need to compensate for the high wind and PV power outputs under cold-wave conditions, the hydropower output has to be reduced, thus resulting in water spillage (spilled discharge of 98–751 m3/s from 17:00 to 23:00, with a total spilled volume of 10.59 million m3). Hydropower resources are wasted in this scenario. Further statistics show that this waste of water does not occur in other scenarios, where hydropower can still convert all of its water energy into electricity without water spillage, but this would cause the power system to generate more electricity than it needs, requiring the excess electricity to be stored or discarded.
Figure 8.
Processes of hydropower plant output, water level, and discharge in Scenario 4.
5. Conclusions
This study examined the optimization of short-term integration of a hydro–wind–PV power system under cold-wave conditions; an optimization model was constructed, which includes a model of demand for hydropower to complement wind and PV power and a model of hydropower compensation regulation, and the integration processes were simulated using a case study situated in Northwest China as the subject. The complementary requirements of wind and PV power, and the positive effect and insufficiency of hydropower during the multi-energy integration under cold-wave conditions, were investigated. The following conclusions are drawn:
- (1)
- Under cold-wave conditions, as shown in this case study, the demand for multi-energy complementarity of wind and PV power is more prominent; e.g., the variation in daily wind and PV power generation is greater, and the demand for power compensation and peak shaving from hydropower is higher.
- (2)
- Hydropower can also respond to the demand for compensation and peak shaving for managing wind and PV power fluctuations under cold-wave conditions. Compared with non-cold-wave conditions [31], there are no significant differences in the parameters of number of employed plants, start-up/shut-down times, and maximum/minimum outputs of a single hydro plant, and the main difference lies in the variation in reservoir water level at the end of the operation horizon, with the water stored in the reservoir being consumed or the available storage capacity in the reservoir being occupied to regulate the runoff.
- (3)
- Limited by the installed capacity of the hydroelectric plants and the regulating capacity of the reservoir in this case study, hydropower cannot fully respond to the complementary requirements of wind and PV power and, thus, cannot absolutely prevent power production supply shortages and water spillage.
These conclusions are based only on an individual representative case, and their generalization is limited. Please note that
- (1)
- The analysis is limited to a daily time horizon and, therefore, does not allow the progressive variation in the reservoir water level or the ability of the hydropower system to sustain regulation during multi-day cold-wave events to be assessed.
- (2)
- The five scenarios represent statistical wind and photovoltaic generation profiles obtained through the scenario reduction procedure and not specific meteorological events characterized in terms of temperature, wind speed, solar radiation, snowfall, or ice formation.
- (3)
- The differences observed among the scenarios cannot be directly attributed to individual meteorological variables, nor can they be used to establish specific causal relationships between the physical characteristics of cold waves and renewable energy generation.
- (4)
- The analyzed system is partly virtual and concerns a single representative case; therefore, the results cannot be directly generalized to other hydro–wind–PV systems or geographical areas without further verification.
The findings of this study provide a reference for optimizing the multi-energy complementary integration of hydro–wind–PV power systems under extreme weather conditions. Given that cold waves vary significantly across different regions, such as in their duration, the spatial scope of the study area and the length of the integration horizon will be expanded in future research to further explore the integration mode of the multi-energy power system under cold-wave conditions in more complex environments.
Author Contributions
Conceptualization, J.L. and X.W.; methodology, J.L. and X.W.; resources, J.L. and X.W.; data curation, Z.S.; writing—original draft preparation, Z.S. and J.L.; writing—review and editing, J.L. and X.W.; visualization, Z.S. and X.W. All authors have read and agreed to the published version of the manuscript.
Funding
This work was supported by the Hubei Provincial Science and Technology Program Project (no. 2025EIA056).
Data Availability Statement
The original contributions presented in this study are included in this article. Further inquiries can be directed to the corresponding author.
Conflicts of Interest
The authors declare no conflicts of interest.
References
- Tonkin, J.D.; Siqueira, T.; Merder, J.; Datry, T.; Poff, N.L.; Talbot-Jones, J.; Olden, J.D. Extreme Events and River Biodiversity under Climate Change. Nat. Rev. Biodivers. 2026, 2, 150–169. [Google Scholar] [CrossRef] [Scilit]
- Zhang, W.; Yang, X. Extreme Weather and Climate Events: Physical Drivers, Modeling and Impact Assessment. J. Mar. Sci. Eng. 2020, 8, 448–450. [Google Scholar] [CrossRef] [Scilit]
- Haes Alhelou, H.; Hamedani-Golshan, M.E.; Njenda, T.C.; Siano, P. A Survey on Power System Blackout and Cascading Events: Research Motivations and Challenges. Energies 2019, 12, 682–709. [Google Scholar] [CrossRef] [Scilit]
- Lee, C.; Maron, M.; Mostafavi, A. Community-Scale Big Data Reveals Disparate Impacts of the Texas Winter Storm of 2021 and Its Managed Power Outage. Humanit. Soc. Sci. Commun. 2022, 9, 335–346. [Google Scholar] [CrossRef] [Scilit] [PubMed]
- Cavus, M. Advancing Power Systems with Renewable Energy and Intelligent Technologies: A Comprehensive Review on Grid Transformation and Integration. Electronics 2025, 14, 1159. [Google Scholar] [CrossRef] [Scilit]
- Mu, Z.; Tian, G.; Feng, X.; Mu, S.; Kong, F.; Zhang, B.; Meng, X. Aerodynamic Performance Degradation of Offshore Wind Turbine Blades under Icing with Varying Angles of Attack. Ocean Eng. 2025, 341, 122776. [Google Scholar] [CrossRef] [Scilit]
- Shohag, M.A.S.; Hammel, E.C.; Olawale, D.O.; Okoli, O.I. Damage Mitigation Techniques in Wind Turbine Blades: A Review. Wind Eng. 2017, 41, 185–210. [Google Scholar] [CrossRef] [Scilit]
- Ma, H.; Li, G.; Zeng, C.; Wang, F.; Jin, S.; Fu, S. Evolutionary Mechanisms of the Strong Winds Associated with an Intense Cold Wave Event and Their Effects on the Wind Power Production. Front. Earth Sci. 2023, 10, 1054037. [Google Scholar] [CrossRef] [Scilit]
- Andrews, R.W.; Pollard, A.; Pearce, J.M. The Effects of Snowfall on Solar PV Performance. Sol. Energy 2013, 92, 84–97. [Google Scholar] [CrossRef] [Scilit]
- Añel, J.; Fernández-González, M.; Labandeira, X.; López-Otero, X.; De La Torre, L. Impact of Cold Waves and Heat Waves on the Energy Production Sector. Atmosphere 2017, 8, 209–221. [Google Scholar] [CrossRef] [Scilit]
- Lindig, S.; Kaaya, I.; Weiss, K.A.; Moser, D.; Topic, M. Review of Statistical and Analytical Degradation Models for PV Modules and Systems as well as Related Improvements. IEEE J. PVs 2018, 8, 1773–1786. [Google Scholar] [CrossRef] [Scilit]
- Pawluk, R.E.; Chen, Y.; She, Y. PV Electricity Generation Loss Due to Snow—A Literature Review on Influence Factors, Estimation, and Mitigation. Renew. Sustain. Energy Rev. 2019, 107, 171–182. [Google Scholar] [CrossRef] [Scilit]
- Ward, D.M. The Effect of Weather on Grid Systems and the Reliability of Electricity Supply. Clim. Change 2013, 121, 103–113. [Google Scholar] [CrossRef] [Scilit]
- Radinović, D.; Ćurić, M. Criteria for Heat and Cold Wave Duration Indexes. Theor. Appl. Climatol. 2012, 107, 505–510. [Google Scholar] [CrossRef] [Scilit]
- Watson, E.B.; Etemadi, A.H. Modeling Electrical Grid Resilience under Hurricane Wind Conditions with Increased Solar and Wind Power Generation. IEEE Trans. Power Syst. 2020, 35, 929–937. [Google Scholar] [CrossRef] [Scilit]
- Panteli, M.; Mancarella, P. Influence of Extreme Weather and Climate Change on the Resilience of Power Systems: Impacts and Possible Mitigation Strategies. Electr. Power Syst. Res. 2015, 127, 259–270. [Google Scholar] [CrossRef] [Scilit]
- Gonçalves, A.C.R.; Costoya, X.; Nieto, R.; Liberato, M.L.R. Extreme Weather Events on Energy Systems: A Comprehensive Review on Impacts, Mitigation, and Adaptation Measures. Sustain. Energy Res. 2024, 11, 4–31. [Google Scholar] [CrossRef] [Scilit]
- Li, X.; Du, X.; Jiang, T.; Zhang, R.; Chen, H. Coordinating Multi-Energy to Improve Urban Integrated Energy System Resilience against Extreme Weather Events. Appl. Energy 2022, 309, 118455. [Google Scholar] [CrossRef] [Scilit]
- Feilat, E.A.; Azzam, S.; Al-Salaymeh, A. Impact of Large PV and Wind Power Plants on Voltage and Frequency Stability of Jordan’s National Grid. Sustain. Cities Soc. 2018, 36, 257–271. [Google Scholar] [CrossRef] [Scilit]
- Wang, Y.; Zhao, M.; Chang, J.; Wang, X.; Tian, Y. Study on the Combined Operation of a Hydro-Thermal-Wind Hybrid Power System Based on Hydro-Wind Power Compensating Principles. Energy Convers. Manag. 2019, 194, 94–111. [Google Scholar] [CrossRef] [Scilit]
- Yuan, N.; Xoplaki, E.; Zhu, C.; Luterbacher, J. A Novel Way to Detect Correlations on Multi-Time Scales, with Temporal Evolution and for Multi-Variables. Sci. Rep. 2016, 6, 27707. [Google Scholar] [CrossRef] [Scilit] [PubMed]
- Li, P.; Wang, Z.; Wang, J.; Guo, T.; Yin, Y. A Multi-Time-Space Scale Optimal Operation Strategy for a Distributed Integrated Energy System. Appl. Energy 2021, 289, 116698. [Google Scholar] [CrossRef] [Scilit]
- Li, F.; Wang, H.; Wang, D.; Liu, D.; Sun, K. A Review of Wind Power Prediction Methods Based on Multi-Time Scales. Energies 2025, 18, 1713. [Google Scholar] [CrossRef] [Scilit]
- Zhou, H.; Lu, L.; Shen, L.; Zhang, H.; Jiang, L.; Liao, K. Integrated Location and Capacity Coordination Planning Scheme for Multi-Power Complementary Generation System. Energy Rep. 2022, 8, 10–18. [Google Scholar] [CrossRef] [Scilit]
- Nie, Y.; Zhang, G.; Duan, H. An Interconnected Panorama of Future Cross-Regional Power Grid: A Complex Network Approach. Resour. Policy 2020, 67, 101692. [Google Scholar] [CrossRef] [Scilit]
- Mahfoud, R.J.; Alkayem, N.F.; Zhang, Y.; Zheng, Y.; Sun, Y.; Alhelou, H.H. Optimal Operation of Pumped Hydro Storage-Based Energy Systems: A Compendium of Current Challenges and Future Perspectives. Renew. Sustain. Energy Rev. 2023, 178, 113267. [Google Scholar] [CrossRef] [Scilit]
- Pérez-Díaz, J.I.; Millán, R.; García, D.; Guisández, I.; Wilhelmi, J.R. Contribution of Re-Regulation Reservoirs Considering Pumping Capability to Environmentally Friendly Hydropower Operation. Energy 2012, 48, 144–152. [Google Scholar] [CrossRef] [Scilit]
- Caro-Ruiz, C.; Lombardi, P.; Richter, M.; Pelzer, A.; Komarnicki, P.; Pavas, A.; Mojica-Nava, E. Coordination of Optimal Sizing of Energy Storage Systems and Production Buffer Stocks in a Net Zero Energy Factory. Appl. Energy 2019, 238, 851–862. [Google Scholar] [CrossRef] [Scilit]
- Qiu, H.; Chen, L.; Zhou, J.; He, Z.; Zhang, H. Risk Analysis of Water Supply-Hydropower Generation-Environment Nexus in the Cascade Reservoir Operation. J. Clean. Prod. 2021, 283, 124239. [Google Scholar] [CrossRef] [Scilit]
- Yang, Y.; Chen, S.; Zhou, Y.; Ma, G.; Huang, W.; Zhu, Y. Method for Quantitatively Assessing the Impact of an Inter-Basin Water Transfer Project on Ecological Environment-Power Generation in a Water Supply Region. J. Hydrol. 2023, 618, 129250. [Google Scholar] [CrossRef] [Scilit]
- Liu, Z.; Cui, Y.; Wang, J.; Yue, C.; Agbodjan, Y.S.; Yang, Y. Multi-Objective Optimization of Multi-Energy Complementary Integrated Energy Systems Considering Load Prediction and Renewable Energy Production Uncertainties. Energy 2022, 254, 124399. [Google Scholar] [CrossRef] [Scilit]
- Zheng, J. Integrated Renewable-Based Multi-Generation System with Environmental and Economic Optimization. Energy 2024, 294, 130762. [Google Scholar] [CrossRef] [Scilit]
- Yao, Q.; Zhang, S.; Jiang, C.; Quan, X. The Application of DP Method in the Hydropower Station’s In-House Economical Operation. Int. J. Hydroelectr. Energy 1999, 17, 46–49. [Google Scholar] [CrossRef]
- Liu, B.; Liao, S.; Cheng, C.; Chen, F.; Li, W. Hydropower Curtailment in Yunnan Province, Southwestern China: Constraint Analysis and Suggestions. Renew. Energy 2018, 121, 700–711. [Google Scholar] [CrossRef] [Scilit]
- Li, J.; Zhang, Y.; Ji, C.; Wang, A.; Lund, J. Large-Scale Hydropower System Optimization Using Dynamic Programming and Object-Oriented Programming: The Case of the Northeast China Power Grid. Water Sci. Technol. 2013, 68, 2458–2467. [Google Scholar] [CrossRef] [Scilit] [PubMed]
- Lindas, E.; Goude, Y.; Ciais, P. Toward Accurate Forecasting of Renewable Energy: Building Datasets and Benchmarking Machine Learning Models for Solar and Wind Power in France. Environ. Data Sci. 2025, 4, E45. [Google Scholar] [CrossRef] [Scilit]
- Wei, F.; Yang, C.; Liu, D.; Huang, Q.; Ming, B.; Cheng, L.; Wang, L.; Feng, G.; Shang, J. Assessment of Wind and Solar Power Potential and Their Temporal Complementarity in China’s Northwestern Provinces: Insights from ERA5 Reanalysis. Energies 2023, 16, 7109. [Google Scholar] [CrossRef] [Scilit]
- Rakhshani, E.; Rouzbehi, K.; Sánchez, A.J.; Cabrera Tobar, A.; Pouresmaeil, E. Integration of Large Scale PV-Based Generation into Power Systems: A Survey. Energies 2019, 12, 1425. [Google Scholar] [CrossRef] [Scilit]
- GB/T 20484-2017; Grade of Cold Air. National Standards of People’s Republic of China: Beijing, China, 2017.
- Heitsch, H.; Römisch, W. Scenario Reduction Algorithms in Stochastic Programming. Comput. Optim. Appl. 2003, 24, 187–206. [Google Scholar] [CrossRef] [Scilit]
- Zeng, Z.; Tian, W. A Multi-Objective Optimization and Evaluation Framework for Sustainable Cascade Reservoir Operation: Evidence from the Lower Jinsha River. Systems 2025, 13, 1053. [Google Scholar] [CrossRef] [Scilit]
- Merl, K.; Zeiringer, B.; Hayes, D.; Auhser, A.; Schmutz, S.; Greimel, F. Lower Abundance of Young-of-the-Year Fish in Alpine Rivers Affected by Hydropeaking: An Austrian Field Study. Ecohydrology 2026, 19, E70216. [Google Scholar] [CrossRef] [Scilit]

Disclaimer/Publisher’s Note: The statements, opinions and data contained in all publications are solely those of the individual author(s) and contributor(s) and not of MDPI and/or the editor(s). MDPI and/or the editor(s) disclaim responsibility for any injury to people or property resulting from any ideas, methods, instructions or products referred to in the content. |
© 2026 by the authors. Licensee MDPI, Basel, Switzerland. This article is an open access article distributed under the terms and conditions of the Creative Commons Attribution (CC BY) license.