Article

Multi-Year Variation Characteristics and Driving Forces of Groundwater Levels in the Yibin Area, Southern Sichuan, China


1
School of Mechanical and Electrical Engineering, Yibin University, Yibin 644000, China
2
Geological Environment Monitoring Department of Jiangxi Geological Survey and Exploration Institute, Nanchang 330006, China
3
Jiangxi Coalfield Geological Exploration and Research Institute, Nanchang 330006, China
4
Research Center of Geotechnical Engineering Technology, Department of Civil Engineering, Yibin Research Institute, Chengdu Technological University, Yibin 644000, China
5
Zhongyan Technology Co., Ltd., Beijing 101100, China
6
College of Environment and Civil Engineering, Chengdu University of Technology, Chengdu 610059, China
*
Author to whom correspondence should be addressed.
Water 2026, 18(16), 1982; https://doi.org/10.3390/w18161982
Submission received: 20 July 2026 / Revised: 6 August 2026 / Accepted: 11 August 2026 / Published: 13 August 2026
(This article belongs to the Section Hydrogeology)

Abstract

To support groundwater protection and sustainable utilization in southern Sichuan, this study aims to clarify the multi-year variation characteristics of groundwater levels (GWLs) and identify their main driving factors in the Yibin region. In this paper, 2019–2024 GWL monitoring records, hydrometeorological data, and multi-source geospatial datasets were integrated. Trend analysis, centroid migration modeling, continuous wavelet transform, Geodetector, and Fast Fourier Transform-based cross-correlation analysis were used to examine GWL dynamics and their controlling factors. The results show that GWL depth exhibits a distinct “shallow-northwest to deep-southeast” pattern, which is closely associated with regional aquifer lithology and hydrogeological conditions, with the most pronounced fluctuations occurring in the northwest. From 2019 to 2024, GWLs showed multi-scale periodic oscillations, with dominant periods of 50–64 months. GWLs in the red-bed region showed a continuous and slow decline, whereas those in the carbonate rock region remained relatively stable with a slight decreasing trend. Among the 13 hydrometeorological, geographic, and human activity factors, cropland area and precipitation had the strongest individual explanatory power. Their interactions with other factors produced nonlinear or bi-factor enhancement effects. The sustained expansion of cropland, together with declining precipitation, suggests that the observed phased and gradual decline in GWLs during 2019–2024 may be associated with a combined climate–human activity forcing mechanism. Annual GWL peaks were weakly and positively correlated with rainfall and temperature, while the lag between rainfall infiltration and GWL response varied with lithology.

1. Introduction

Groundwater level (GWL) dynamics are shaped by climatic, anthropogenic, and geo-topographical factors, showing complex nonlinear, seasonal, trending, and stochastic behaviors [1]. These latent and delayed variations inherently reflect intricate hydro-geological processes [2]. A systematic understanding of these long-term temporal patterns not only clarifies the multi-driving mechanisms of GWLs but also provides key scientific evidence to quantify regional carrying capacity, optimize water utilization, and develop a management system prioritizing both resilience and sustainability.
Numerous studies have investigated the variation patterns and driving factors of GWLs. Climate change is widely considered the primary driver, directly affecting groundwater recharge and discharge by altering precipitation, evaporation, and temperature [1,2,3,4,5,6,7,8]. In regions like the North China Plain, climatic factors account for over 85% of GWL fluctuations [4]. Specifically, precipitation patterns show a clear periodic relationship with groundwater recharge [2,6,7,9]. Previous studies using spatiotemporal analysis (e.g., stICA) and Geodetector models have identified precipitation as the main cause of periodic and lagged GWL variations. Furthermore, its interactions with soil type, aquifer media, potential evapotranspiration, and topography exert a nonlinearly enhanced effect on GWLs [1]. Driven by global climate extremes, rising annual precipitation has shifted the timing of recharge, concentrating it primarily during or shortly after extreme weather events [1,10,11,12,13]. Other factors, including freeze–thaw processes, soil hydrothermal variations, and soil moisture, also positively affect GWL [6,14,15]. Beyond climate, anthropogenic impacts are significant. By combining long-term GWL monitoring with remote sensing data, researchers have utilized spatial interpolation and numerical simulations to link human engineering activities to land subsidence and stratified GWL declines [16,17,18,19]. For example, using a hybrid autoregressive and Copula model, forecasts indicate that the South-to-North Water Diversion Project could help Beijing’s GWL recover to 7.50 m by 2035 [20]. Conversely, spatial and trend analyses reveal that policies like water source protection and the ‘Grain for Green’ project have occasionally reduced local vegetation, indirectly exacerbating regional GWL declines [21,22]. Vegetation cover also plays a dual role. It optimizes precipitation infiltration and dictates the recharge duration, thereby regulating the broader hydrological cycle [23]. Recently, machine learning models (e.g., LSTM, ANN [24]) combined with digital elevation models (DEM) have been widely used to predict short- and long-term GWLs based on indices like VCI [23], NDVI [25], and MTVDI [26]. Additionally, geological structures inherently dictate aquifer permeability and specific yield [16,27], while reverse particle tracking models have successfully quantified groundwater-surface water interactions, such as baseflow discharge into rivers [28]. Despite these extensive global and regional studies, localized gaps remain. As a core hub in China’s Chengdu-Chongqing Economic Circle, southern Sichuan is vital for regional development. However, Yibin, located in the upper Yangtze River basin, suffers from severe water imbalances. Both natural and engineering-related water shortages severely hamper its high-quality economic growth [27,29]. Rapid urban expansion, intense human interventions, ongoing ecological governance of the Yangtze River, and climate extremes have collectively triggered pronounced spatio-temporal GWL fluctuations in this area. Despite these compounding pressures, long-term dynamic evaluations of groundwater in Yibin are exceptionally rare, leaving its driving mechanisms and attribution largely unexplored.
To clarify the multi-year spatiotemporal variation characteristics of GWLs and identify the dominant driving factors and their interaction mechanisms in the Yibin region, this research integrates GWL observations (2019–2024), hydrometeorological records, and multi-source geospatial datasets. Trend analysis, centroid migration modelling, and wavelet analysis are used to characterize the spatiotemporal evolution of GWLs. The Geodetector method is then applied to quantify the contributions of individual factors and their interactions to GWL variations, thereby identifying the dominant drivers and interactive effects controlling GWL changes. Finally, based on data from representative groundwater monitoring wells, Pearson correlation analysis and Fast Fourier Transform-based cross-correlation analysis are employed to reveal the driving mechanisms of key factors. The findings provide scientific support for regional groundwater protection and sustainable utilization, and offer a theoretical basis for groundwater monitoring, early warning, and refined management.

2. Study Area and Data

2.1. Study Area

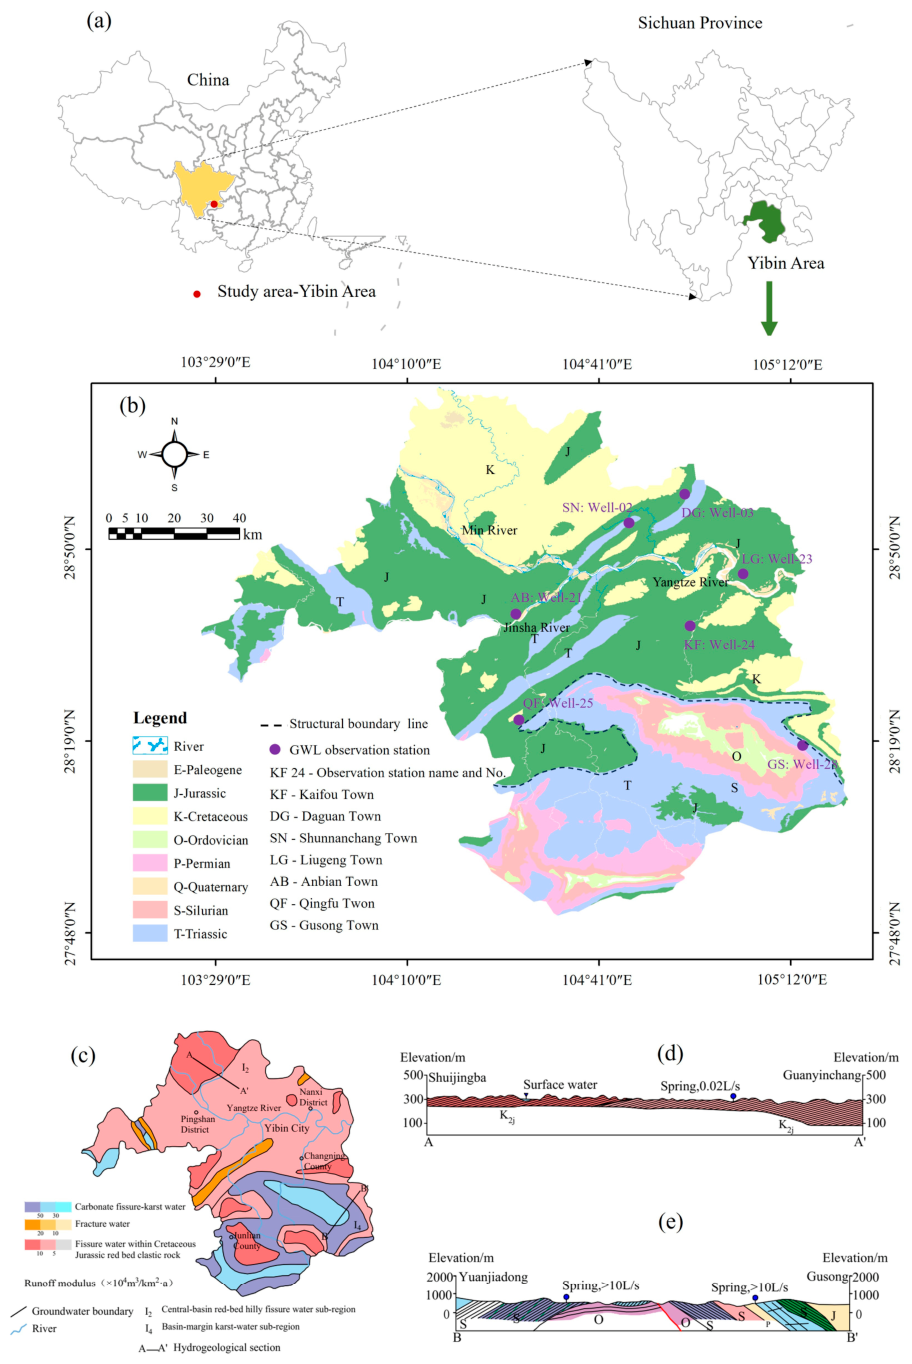
The study area is situated in the southwestern Sichuan Basin, with elevation ranging from 200 m to 2600 m (Figure 1a). It has a humid subtropical monsoon climate, with annual precipitation of 1050–1618 mm. Located at the confluence of the Jinsha, Min, and Yangtze Rivers, the area is rich in water resources, hosting over 600 tributaries with an average annual runoff of 93–132.1 billion m3.
Multi-stage tectonic movements led to heterogeneous stratigraphic distribution in Yibin (Figure 1b). A structural boundary extends from Haiying in Junlian County through Didong in Gong County, Huangshuikou in Gaoxian County, Jinshawan in Gong County, Hongqiao in Jiang’an County, to Gusong in Xingwen County, dividing the area into two distinct geological zones [27], as seen in Figure 1b.
The structural boundary divides the region into two geological units: north of the boundary, wide valleys and gentle hills are dominant, underlain by Cretaceous–Jurassic red-bed deposits (interbedded sandstone and mudstone), with well-developed weathered fractures; south of the boundary, Triassic and Paleozoic strata outcrop, forming a non-red-bed zone dominated by carbonate rocks (dolomite and limestone) [27].
Groundwater in the study area can be divided into two main types according to occurrence, burial depth, hydraulic properties and hydrodynamic characteristics: bedrock fissure water and carbonate karst water [29,30]. The spatial distribution of groundwater types is highly consistent with the local stratigraphic division defined by the above boundary line, yellow line in Figure 1c. To the north of the boundary, groundwater mainly exists as fissure water in Cretaceous–Jurassic red-bed clastic rocks. The groundwater depth ranges from 1 to 6 m, belonging to the red-bed hilly fissure water sub-region (I2) in the central basin. Due to the lithological and structural characteristics of these aquifers, groundwater recharge zones are basically consistent with their spatial distribution. Atmospheric precipitation infiltrates through Quaternary overburden or bedrock fractures, serving as the main recharge source. The single-well water yield of red-bed fissure water is generally less than 100 m3/d, and the spring discharge ranges from 0.01 to 0.5 L/s. In valley-hill zones such as the synclinal axis, gentle anticlinal limbs and plunging ends with well-developed fissures, the single-well water yield can reach 100–500 m3/d. The representative section is shown in Figure 1d. To the south of the boundary, the non-red-bed area corresponds to the karst water sub-region (I4) at the basin margin. Groundwater in this area is dominated by carbonate fissure-karst water, which can be further subdivided into karst unconfined water and confined karst groundwater. In karst valleys, the depth of karst unconfined water is generally less than 10 m, while it is generally larger in mountainous areas. Recharge mainly comes from atmospheric precipitation in outcrop areas, surface water bodies and fissure water in overlying and underlying non-karst strata. In areas with well-developed karst, large-scale underground pipelines are common, while in areas with weak karst development, groundwater mainly exists in expanded fractures [31]. The single-well water yield of fracture-karst water in carbonate rocks is greater than 1000 m3/d, the spring discharge ranges from 1 to 50 L/s, and the underground river discharge is generally 100–1500 L/s. The representative section is shown in Figure 1e.
Figure 1. (a) Location of the Yibin Region and Sichuan Province; (b) Geological Map of the Yibin Region (modified based on the 1:200,000 geological map); (c) Hydrological Map of the Yibin Region, measuring scale 1:200,000 (modified based on Reference [31]); (d) Section A-A’ (modified based on the Hydrological geological map), horizontal scale 1:50,000, vertical scale 1:200,000; (e) Section B-B’ (modified based on the Hydrological geological map), horizontal scale 1:50,000, vertical scale 1:25,000.
Water 18 01982 g001

2.2. Data

2.2.1. Groundwater Level Data (2019–2024)

The GWL dataset (2019–2024) is sourced from seven national monitoring wells via the China Geological Survey Geocloud System (National Groundwater Monitoring Project, https://geocloud.cgs.gov.cn, accessed on 30 July 2025). Each well is equipped with an automatic water-level sensor with centimeter-level accuracy, acquiring measurements at a frequency of approximately one record every five days [32]. To mitigate temporal discontinuities and ensure data completeness, two auxiliary datasets were integrated. Initially, a 0.01° resolution national GWL raster dataset (2005–2022) was spatially subset using ArcGIS 10.8 to match the study area [33], while the 2023–2024 raster data were reconstructed through spatial interpolation of in situ observations. Furthermore, statistical data from the Yibin Water Resources Bulletin [34], encompassing groundwater supply, water consumption, and primary usage indices, were utilized to facilitate cross-validation and contextualize the findings.
The spatial distribution of the seven observation wells is illustrated in Figure 1b, while their detailed attributes are summarized in Table 1. Note that the full names corresponding to the location abbreviations used in Table 1 are detailed in the legend of Figure 1b.

2.2.2. Hydrometerological Data (2019–2024, 0.01° Resolution)

The hydrometeorological dataset utilized in this study encompasses precipitation, temperature, potential evapotranspiration (ET), and a soil moisture index, all spanning the 2019–2024 period with a uniform spatial resolution of 0.01°. Specifically, monthly precipitation data for China were obtained from the Zenodo platform (https://zenodo.org/), while daily precipitation data were sourced from the National Centers for Environmental Information (NCEI). Both monthly and daily ET and mean temperature (T) records were acquired from the National Tibetan Plateau Data Center (https://www.tpdc.ac.cn/). Additionally, the Available Water Capacity (AWC) for shallow soil units was extracted from the Harmonized World Soil Database (HWSD) v2.0 [35].

2.2.3. Supplementary Data Sources

Digital elevation model (DEM) data with a spatial resolution of 90 m were retrieved from the Geospatial Data Cloud (http://www.gscloud.cn/) and utilized to derive key topographic variables, including slope, aspect, and elevation. Stratigraphic lithology data were sourced from the public version of China’s 1:200,000 National Digital Geological Map to delineate the spatial distribution and attribute characteristics of the geological formations. Furthermore, annual socioeconomic statistics for 2019–2024, namely population and Gross Domestic Product (GDP), build-up area were compiled from the Yibin Statistical Yearbook [36]. Annual land use data were downloaded from the China Land Cover Dataset hosted on Zenodo (https://zenodo.org/), which categorizes land cover into cropland, forest, water bodies, and other types.
Notably, the intra-annual variability of these yearly reported datasets was considered negligible relative to the monthly GWL fluctuations; thus, their application in monthly-scale analyses was justified without introducing substantial bias.

3. Methods

3.1. Linear Trend (Slope) Analysis

To quantify the interannual evolution of GWL in the Yibin region, linear trend (slope) analysis is combined with the centroid model. These methods are used to characterize the spatial variability of pixel-scale GWL values from 2019 to 2024 and evaluate the significance of their interannual changes. The corresponding analytical formulas are shown in Equations (1)–(4) [37].
G W L S l o p e = n · i = 1 n i · G W L i i = 1 n G W L i i = 1 n i n · i = 1 n i 2 ( i = 1 n i ) 2
x t = i = 1 n G W L i x i i = 1 n G W L i ,   y t = i = 1 n G W L i y i i = 1 n G W L i
θ = a r c t a n y t + m y t x t + m x t t + m
d m = ( x t + m x t ) 2 + ( y t + m y t ) 2
where n is the number of years in the GWL time series. GWLi is the GWL in year i. GWLslope is the slope of the linear regression fitted to the GWL time series for each pixel during the observation period. A positive GWLslope indicates a rising GWL over time, whereas a negative value indicates a declining trend [37]. xi, yi are the spatial coordinates of feature i, while (x, y)t and (x, y)t+m denote the centroid coordinates of the spatial phenomenon at times t and t + m, respectively. θ and dm are the direction and distance of centroid migration.

3.2. Continuous Wavelet Transform (CWT)

The Continuous wavelet transform (CWT) uses a set of continuous wavelet basis functions to decompose and reconstruct a signal, thereby obtaining its frequency information at different time scales [38]. In this study, the Morlet continuous complex wavelet function was selected as the wavelet basis function. The formula for the continuous wavelet transform is as follows:
W f a , b = a 1 2 + f t ψ t b a d t ,   a R + , b R
where Wf (a,b) denotes the continuous wavelet transform coefficient at scale a and position b; f(t) is the signal to be analyzed; ψ t is the wavelet basis function; and * represents the complex conjugate operation. a (>0) is the scale of the wavelet, b represents the position.
The selection of a mother wavelet is a prerequisite for wavelet analysis. In related studies, commonly used wavelets, such as the Mexican hat wavelet, Haar wavelet, Morlet wavelet, and Meyer wavelet, can all be adopted as mother wavelet functions [39]. In this study, the Morlet wavelet was selected as the mother wavelet because it provides a good balance in localized time–frequency analysis [39]. Moreover, as a complex wavelet, the Morlet wavelet can simultaneously capture phase and amplitude information from time-series data.
ψ 0 η = π 1 / 4 e i w 0 η e η 2 / 2
where w 0 is the nondimensional frequency, and η is the nondimensional time.

3.3. The GeoDetector Method

To determine the objective weights of the indicators affecting GWL changes, the GeoDetector method is applied to the corresponding geospatial datasets. This method integrates GIS-based spatial overlay technology and set theory modeling to detect spatial stratified heterogeneity and reveal the internal mechanism driving geographic differentiation [1,37]. The factor detector model is expressed as:
q = 1 h = 1 L N h σ h 2 N σ 2
where L is the number of strata (classification or zoning) applied to the dependent variable GWL or the influencing factor X; N h and σ h are the sample size and variance within stratum h, respectively; N and σ2 are the total sample size and overall variance of the study area. The statistic q ranges from 0 to 1; higher values of q indicate stronger explanatory power of the factor for the spatial variability of GWL, and lower values indicate weaker explanatory ability [1,37,40].
Specifically, if the combined explanatory power satisfies q (X1∩X2) > q(X1) + q(X2), the interaction is defined as nonlinear enhancement, meaning the joint effect exceeds the sum of individual contributions. If q(X1∩X2) > max [q(X1), q(X2)] but does not exceed their sum, it is bivariate enhancement, indicating the two factors reinforce each other without super additive effect. Conversely, if the combined explanatory power is weaker than both individual factors, it is nonlinear weakening; if the combined effect is between the explanatory powers of the two individual factors, it is uni-factor weakening. When q(X1∩X2) = q(X1) + q(X2), the two factors act independently.

3.4. Correlation Analysis

3.4.1. Pearson Correlation Analysis

Pearson correlation analysis characterizes the linear correlation between paired variables by normalizing the covariance relative to the product of their standard deviations, thereby quantifying both the magnitude and direction of the linear association [41]. The Pearson correlation coefficient is defined as:
r   =   c o v ( X , Y ) ( σ X · σ Y )
where c o v ( X , Y ) is the covariance between variables X and Y, σ X and σ Y are their respective standard deviations. The coefficient r ranges from −1 to 1. Values of |r| ≥ 0.7 indicate strong correlation, 0.4 ≤ |r| < 0.7 indicate moderate correlation, and 0 < |r| < 0.4 is considered a weak correlation.

3.4.2. Fast Fourier Transform, FFT

Time series data can be viewed as a special type of signal. By applying the Fast Fourier Transform (FFT), signals in the time domain are converted into the frequency domain, enabling the calculation of the amplitude and phase characteristics that reflect the various frequency components of the signal. The FFT is a fast algorithm for the Discrete Fourier Transform (DFT) [42]. For a sequence f(n) with a length of N = 2m, the FFT of f(n), denoted as F(K), can be represented as:
F K = m = 0 N 2 1 f 2 m W N 2 m K + m = 0 N 2 1 f 2 m + 1 W N 2 m K
where F(K) is the FFT function of f(n), referred to as the frequency spectrum; f(n) is the original time-series function; W is the new function generated by the transformation of the odd and even subsequences; K takes value of 0, 1, …, N 2 1 .
Cross-correlation is a mathematical tool used to quantify the similarity between two time-series signals. Cross-correlation analysis can determine whether one signal is ‘leading’ or ‘lagging’ the other in time. The Wiener-Khinchin theorem [43] states that the autocorrelation function of a random signal and its power spectral density are a Fourier transform pair. Therefore, convolution in the time domain is equivalent to multiplication in the frequency domain. As a result, to calculate the cross-correlation of time-domain signals transformed by FFT, one simply needs to multiply them directly in the frequency domain, can be represented as:
f g = + f ¯ τ g t + τ d τ = + F ¯ τ G t + τ e 2 π i τ t d τ
where ⨂ denotes the cross-correlation operation; F ¯ represents the complex conjugate of F; f and g are any two time-domain or frequency-domain sequences; τ is the time lag.
The lead-lag temporal relationship between the sequences can be determined based on the cross-correlation function curve. Specifically, if the time lag is positive (i.e., the first peak occurs at a positive value), it indicates that variations in sequence g exert an influence on sequence k. Conversely, if the time lag is negative (i.e., the first peak occurs at a negative value), it signifies that variations in sequence k drive changes in sequence g.

4. Results

4.1. Years Spatiotemporal Patterns of GWL

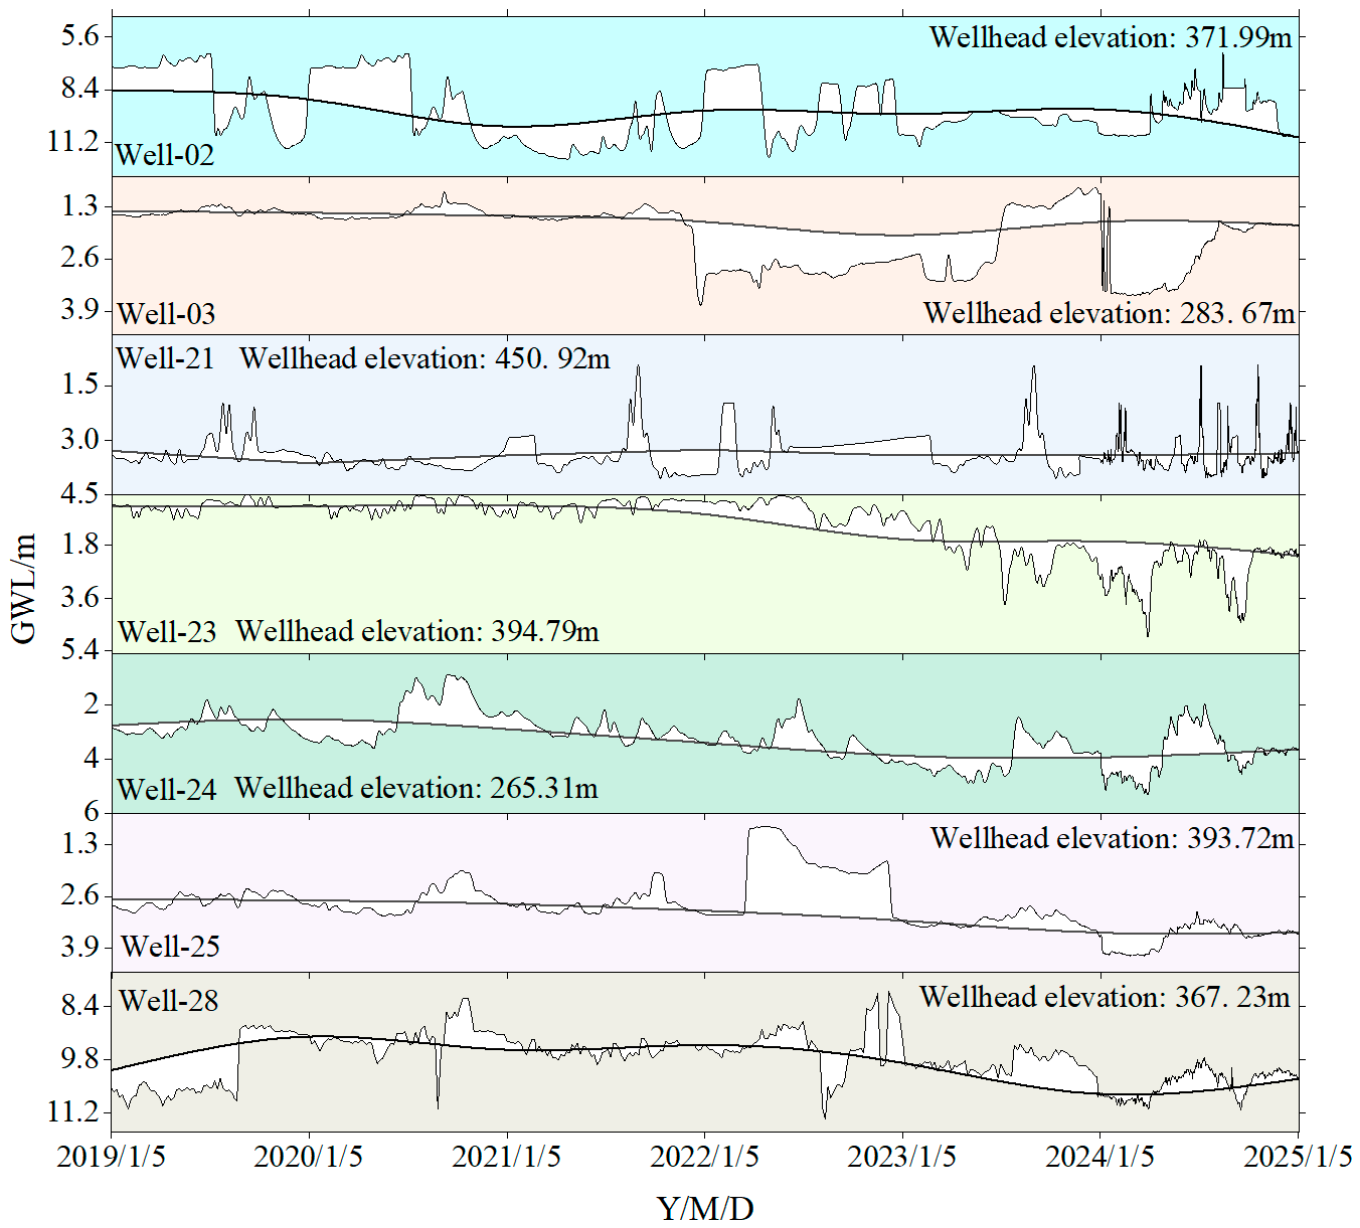
During the observation period (2019–2024), the depth of GWL in the study area exhibits significant spatial and seasonal variability (Figure 2). Seasonally, all monitoring wells display regular annual cyclic oscillations, with GWL rising substantially during the concentrated-rainfall season (June–September) and declining noticeably from October to March of the following year; the most pronounced fluctuations occur during the main flood months (July–September), closely corresponding to periods of concentrated precipitation. Spatially, comparison of the curves from the seven wells with their geographic positions (Figure 1b) reveals systematic differences in mean depth, fluctuation amplitude, and long-term trend between the two geological units. Monitoring wells Well-03, Well-21, Well-23, Well-24, and Well-25, situated within the red-bed region, exhibit groundwater depths generally ranging from 1.2 to 5.0 m, following a spatial pattern that gradually increases from the northwest to the southeast. In contrast, within the locally distributed Triassic carbonate strata (Well-02, Well-28), distinct groundwater drawdown zones are identified, where depths are considerably greater (9.0–11.0 m) and exhibit a patchy, spatially discontinuous distribution. Notably, Well-02, although geographically located within the red-bed zone, is situated on an isolated Triassic carbonate outcrop (purple area in Figure 1b).
As seen in Figure 2, the interannual groundwater dynamics in the red-bed areas exhibit a distinct phase shift, delineated by a critical transition between 2021 and 2022. Specifically, GWLs maintained a slow upward trend prior to this turning point, followed by a continuous and gradual decline. These evolutionary characteristics are highly consistent with the temporal variations in regional total groundwater storage. Spatially, the northwestern and central parts of the study area (exemplified by Well-03 and Well-23) exhibit average GWLs fluctuating between 1.2 and 2.8 m. The long-term GWL change rate in this region varies between 0.1 m/yr and 0.5 m/yr; this parameter is defined as the ratio of the difference between the maximum and minimum water-table elevations to the length of the study period. In contrast, the southeastern zone, encompassing Xuzhou District and Gaoxian County, presents relatively stable groundwater conditions alongside a subtle long-term declining tendency. Notably, since 2023, this downward trend has moderated slightly; regional groundwater depths average 2.8–4.2 m, and the long-term GWL change rate have narrowed to 0.04–0.5 m/yr. These findings align with previous research by Bao et al. [21], which indicated that the red-bed region typically experiences a long-term GWL change rate of 0.1–0.5 m/yr, characteristic of a slow depletion regime. Furthermore, the rate of GWL reduction tends to attenuate as groundwater depth increases. Ultimately, owing to the significant spatial heterogeneity across monitoring sites, the amplitude of GWL fluctuations varies substantially among individual wells.
Two monitoring sites, namely Well-02 at the SN station in Cuiping District and Well-28 at the GS station in Xingwen County, are situated in non-red-bed zones. Geologically, these areas are dominated by Triassic carbonate rock formations. The groundwater depth across this region generally ranges from 9 to 11 m, with fractured-karst aquifers serving as the primary groundwater reservoirs. The subsurface is characterized by extensively developed dissolution fissures and micro-karst pores, which constitute highly favorable seepage pathways for groundwater migration and circulation. Consequently, precipitation infiltration and river recharge can rapidly permeate into the aquifer systems via these karst conduits. These features align with the typical evolutionary properties of carbonate fractured-karst water, which exhibits highly sensitive hydrological responses to recharge events, drastic short-term fluctuations, and yet stable long-term trends. As illustrated in Figure 2, the long-term GWL change rates at these two stations are extremely narrow, varying between −0.1 and 0.1 m/yr. This indicates a groundwater dynamic regime of overall stability accompanied by a subtle, slow declining tendency [21]. Nevertheless, carbonate karst formations possess strong intrinsic heterogeneity and anisotropy, leading to pronounced discrepancies in GWL dynamics even among closely located monitoring wells. The sparse distribution of monitoring boreholes in this study area restricts the capture of continuous spatial variation patterns, thereby hindering a comprehensive comparative analysis with the hydrological characteristics of the red-bed regions.

4.2. Periodic Characteristics of GWL Variations

4.2.1. Interannual Trend Analysis

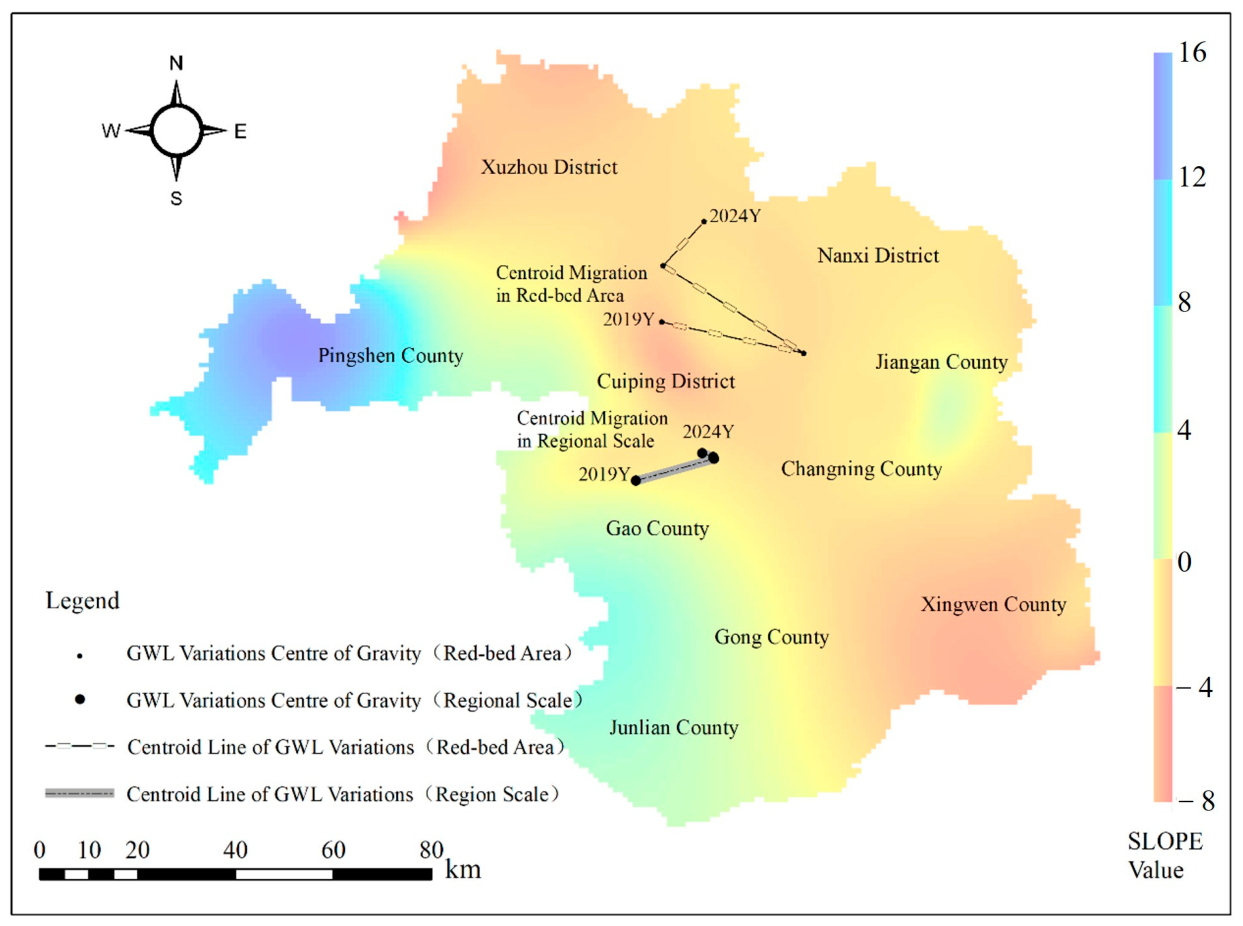
Monthly monitoring datasets were utilized in ArcGIS to generate a spatial trend map of GWLs spanning 2019–2024, facilitating the evaluation of the spatial evolutionary characteristics of groundwater dynamics. The spatial distribution of the GWL trend slope (Figure 3) is highly consistent with the interannual variations observed in the in situ monitoring records. Slope magnitudes are visualized using a continuous color gradient, where blue-purple areas indicate rising trends and red-orange regions signify declining groundwater levels. Notably, over 60% of the study area (approximately 8453 km2) exhibits an overall fluctuating yet declining trend in GWLs.
Centroid analysis results (Figure 3) reveal that the interannual standard deviation of the regional GWL centroid remains relatively low. From 2019 to 2024, the migration of the GWL centroid was predominantly concentrated in the vicinity of the Cuiping-Gaoxian area. This phenomenon signifies a high degree of centroid clustering and a narrow spatial variability in the annual mean GWL across the study region, with spatial heterogeneity primarily localized within Gaoxian County. In the polar coordinate system, the regional GWL centroid is mainly distributed in the second quadrant, indicating a predominantly northwestward orientation. In contrast, the red-bed area, which features a denser monitoring network, exhibits a substantially broader scope of centroid migration. Between 2019 and 2024, its centroid trajectory extended northeastward—originating from Xuzhou District and advancing toward the vicinity of Nanxi District—displaying a much more scattered positional distribution. Correspondingly, its footprint in the polar coordinate system spans both the second and fourth quadrants, reflecting a broader directional shift from the northwest to the southwest.
Only a single monitoring well was deployed in Xingwen County, a highly karstified area located in the southern part of the study basin. Consequently, due to this lack of sufficient spatial monitoring data, an independent centroid calculation was not performed for this administrative unit. Nevertheless, the relatively low magnitudes of GWL trend slopes in this area suggest that the interannual variations in karst groundwater remain quite stable, exhibiting narrower fluctuation ranges compared to those detected in the red-bed region. This hydrological behavior is well-aligned with the inherent recharge–discharge dynamic balance characteristic of karst aquifers. Furthermore, it corroborates the ‘stable and gradual decline’ pattern previously observed specifically at Well-28.

4.2.2. Periodic Characteristics

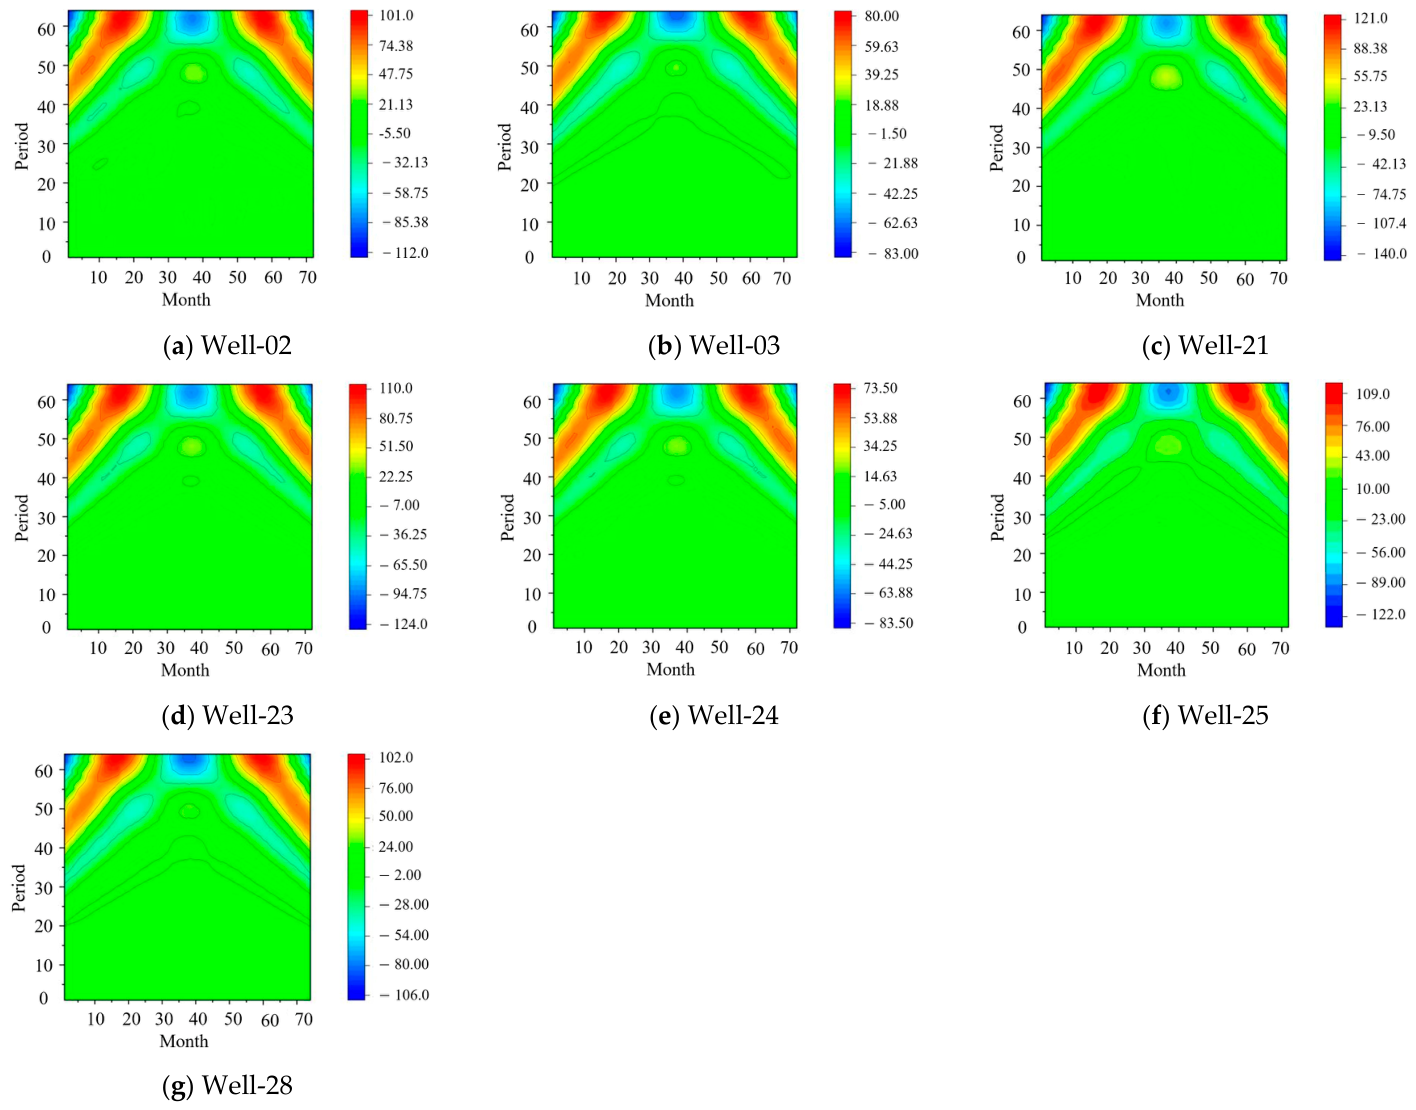
Based on the monthly groundwater level (GWL) data from seven monitoring stations between January 2019 and December 2024, the continuous wavelet transform was applied. The extracted wavelet coefficients were then used to plot the contour maps of the real part of the wavelet coefficients for the different observation wells, as illustrated in Figure 4.
As illustrated in Figure 4, the GWL sequences across all monitoring wells in the study area exhibit significant interannual periodic oscillations. The primary dominant periods are mainly concentrated between 50 and 64 months, indicating a generally convergent periodic evolution pattern of GWLs across the entire region. Additionally, a consistent secondary oscillation with a period of approximately 21 months is observed across all stations, reflecting the GWLs at these monitoring points undergo regular rises and declines roughly every 1.75 years. However, spatial heterogeneity exists in the oscillation amplitudes, energy distributions, and phase evolution characteristics among different stations. These spatial variations are to some extent associated with local topography, geological structures, and the spatial layout of river networks. Notably, AB station (Well-21) and LG station (Well-23) demonstrate prominent oscillation peaks, reflecting a more stable alternation process between hydrological wet and dry phases. Geologically, both monitoring sites are underlain by thick sandy-gravel aquifers characterized by well-developed porosity and excellent water storage capacity, which can effectively buffer GWL fluctuations. In addition to the dominant period, all stations exhibit low-energy wet-dry periodic fluctuations within the 45–50 months band.
Because the national groundwater monitoring network in the Yibin area was established in 2019, the present study is based on a relatively short continuous observation period of 72 months (2019–2024). The 50–64 month dominant periodicity identified through wavelet analysis should be regarded as a preliminary result derived from the available records. Constrained by the limited length of the time-series samples in the current study, the statistical significance of this specific periodicity warrants further validation using extended observation records.

4.3. Driving Factors of Groundwater Level Variations

4.3.1. Indicator Framework for Driving Factors

An integrated indicator system was constructed to identify the key driving factors influencing GWL variations. This system was developed by integrating existing international and domestic indicator frameworks, and then adjusting and optimizing them in accordance with the engineering geological and hydrogeological characteristics of the study area, the local urbanization process, as well as relevant Chinese regulatory criteria [1,22,44,45,46,47,48,49]. Based on factor attributes and data availability, a total of 13 influencing factors were selected and categorized into three major dimensions: Hydrometeorology-X1, Geographic-X2, and Human activities-X3. The selected influencing factors for GWLs in the Yibin area, along with their corresponding discrete classification criteria, are detailed in Table 2.

4.3.2. Driving Contributions of Individual Factors

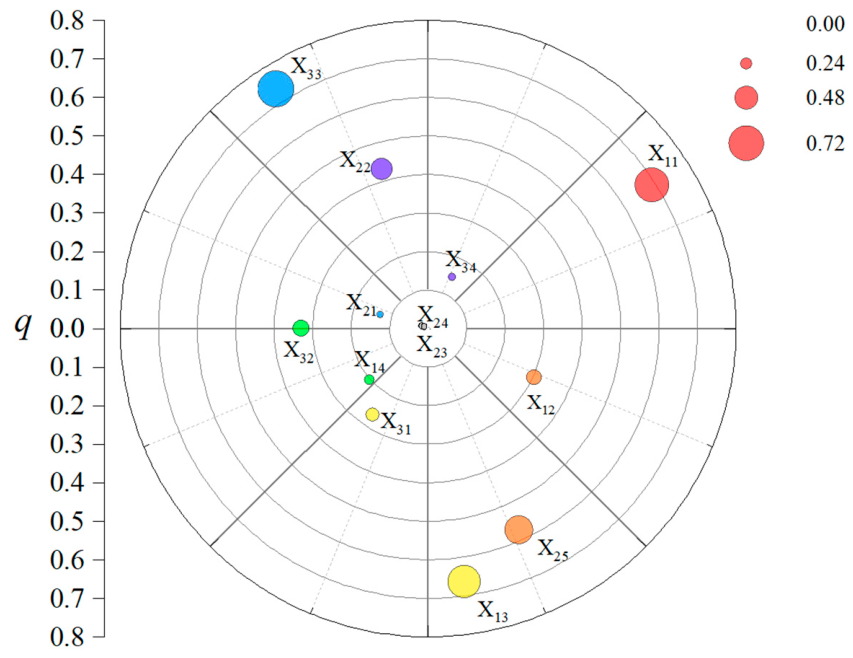
Based on the Geodetector analysis, the individual influence (q-statistic) of each factor on GWL variations was quantified, as illustrated in Figure 5.
As illustrated in Figure 5, Factor-X1 (hydrometeorology) exhibits the highest cumulative weight of 0.464, indicating that it is the dominant controlling dimension affecting GWL variations. Factor-X3 (human activities) ranks second with a weight of 0.37, exerting a significant secondary regulatory effect. In contrast, Factor-X2 (geographic factors) exerts a relatively weak overall impact (weight = 0.227).
When examining the individual variables within these dimensions, the explanatory powers (q-values) vary notably. Within the hydrometeorological dimension (Factor-X1), precipitation (RT) and temperature (T) demonstrate the most pronounced and comparable influences on GWLs, yielding q-values of 0.690 and 0.663, respectively, followed by ET (q = 0.302) and AWC (q = 0.202). Among the geographic factors (Factor-X2), aquifer lithology (q = 0.572) and river influence width (q = 0.432) serve as the primary controllers, whereas basic topographical and geomorphological parameters possess negligible explanatory power. Regarding human activities (Factor-X3), land-use transitions severely alter GWL dynamics. Notably, although the overall weight of Factor-X3 ranks second, the specific conversion of cultivated land yields the highest single-factor explanatory power across all variables examined (q = 0.737). Other anthropogenic factors show minor impacts, with q-values ranging from 0.20 to 0.30. The overall ranking of driving factors is:
q = CLA(0.737) > RT(0.690) > T(0.663) > L(0.572) > RW(0.432) > F(0.330) > ET(0.302) > IS(0.265) > AWC(0.202) > PD(0.148) > S(0.130) > E(0.005) > A(0.004)
Consequently, under the single-factor effect analysis, it is evident that land-use conversion within anthropogenic factors serves as the dominant driver of GWL variations, while precipitation within hydrometeorology factors acts as the primary auxiliary driver.

4.3.3. Interaction Effects of Multiple Factors

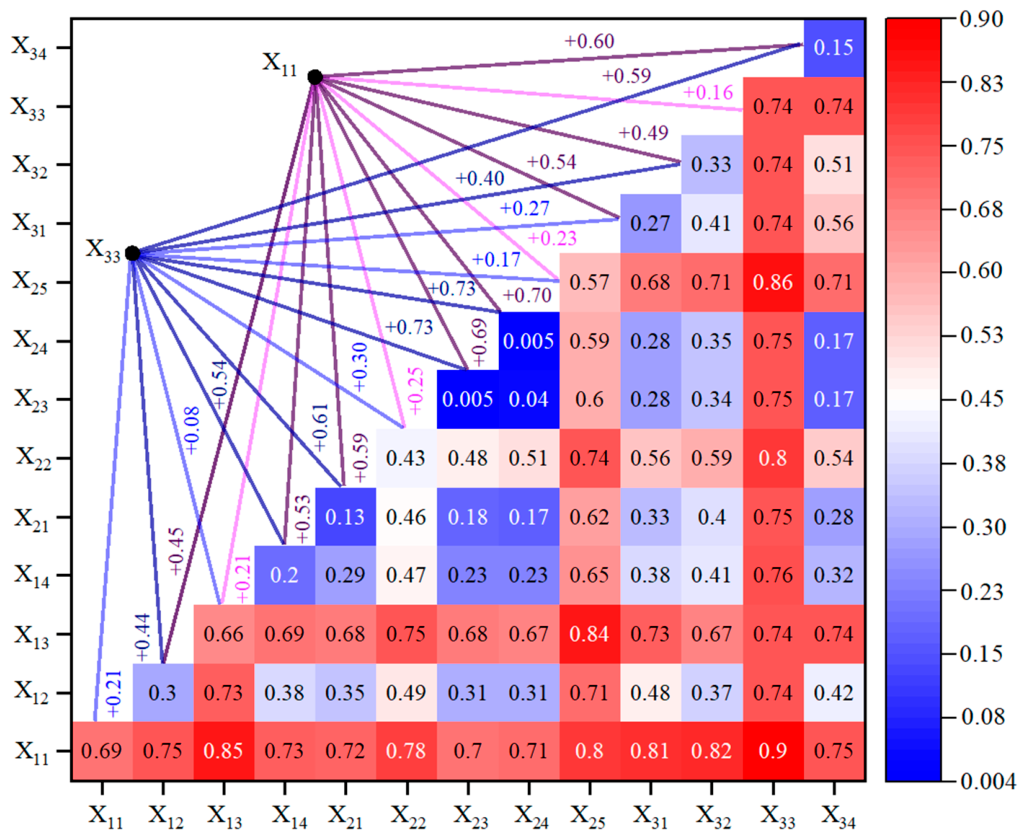
The interaction between driving factors produces distinct influence patterns on GWL variations, as illustrated in Figure 6. The type of interaction is determined by comparing the explanatory power of individual factors with that of their combined effect.
As illustrated in Figure 6, the q values derived from pairwise factor interactions are universally higher than those of individual factors. All interaction relationships present either bivariate enhancement or nonlinear enhancement effects. However, the intensity of such synergistic interactions differs substantially across diverse factor combinations. Overall, RT and CLA show the strongest interactive relationships with other driving variables, RT and CLA interaction q values generally exceeding 0.9, which constitutes a highly synergistic factor pair.
Specifically, the interactions between RT and T, L, IS, F, and CLA yield q values close to 0.80. In nearly 70% of the interactive pairs, the inclusion of precipitation (RT) and temperature (T) enhances the explanatory power by q ≥ 0.5, highlighting their amplifier effect within the multifactorial system. Specifically, interactions involving temperature (T) generally yield q-values above 0.60, with more than half exceeding 0.70. This demonstrates that climatic elements, such as precipitation and temperature, when operating synergistically, are propelled to become the dominant drivers of the spatial differentiation of regional GWLs. Furthermore, river influence width (RW) and aquifer lithology (L) also exhibit robust synergistic coupling in multifactor interactions (q ≥ 0.40). However, constrained by the limited availability of temporal data on river runoff and stage fluctuations, the exact capacity of rivers to recharge groundwater warrants further investigation.
Temporal evolution analysis of the dataset further demonstrates that the spatial differentiation of GWLs in the Yibin region is fundamentally driven by multi-factor interactions between climate conditions and land-use changes, rather than the independent influence of any single driving factor. Before 2021, GWL variations in the study area were governed by a compound pattern, where climatic factors played a leading role and human activities served as auxiliary drivers. Since 2021, the dominant control mechanism has transitioned to human activities dominated regime, with climatic conditions exerting regulatory and modulating effects. Despite the shift in dominant driving mechanisms, hydrometeorological conditions act as a fundamental background constraint for groundwater evolution, and climate-driven shifts such as aridization can amplify or intensify anthropogenic impacts on the GWL regime. Even under human-dominated conditions, climatic factors still modulate the overall trends and spatial patterns of groundwater level variations through coupled interactions with human activities.

5. Discussion

5.1. Impacts of Land-Use Change on Groundwater Levels

Based on data extracted from the Yibin Statistical Yearbook [36], this section evaluates the land-use transitions in the Yibin region from 2019 to 2024, including cropland, forest land, water bodies, and water conservancy facilities (Table 3). Throughout the study period, cropland and forest land persistently dominated the landscape, collectively accounting for over 90% of the total area. In contrast, other land-use categories constituted only a marginal proportion with negligible interannual variations. These observational statistics are well-aligned with the Geodetector interaction analysis, which confirms that variations in forest cover exert exceptionally strong explanatory power over GWL fluctuations. This underscores their dominant role in regulating the spatiotemporal dynamics of regional groundwater.
As presented in Table 3, cropland has undergone the most rapid expansion since 2020, achieving a net increase of 2.46%. Particularly after 2021, the cropland proportion rose from 35.7 × 10⁴ ha to 36.59 × 10⁴ ha, corresponding to an absolute increase of nearly 10,000 ha. In contrast, driven by urban sprawl and farmland reclamation, forest land experienced a continuous decline, with its coverage rate dropping from 49.42% to 46.75%. Overall, within the regional land-use transition matrix, forest land serves as the dominant net contributor. Consequently, the long-term stability of vegetation coverage in Yibin remains fragile, particularly in the southeastern, southern, and northwestern mountainous zones [50]. Such profound structural shifts and instability not only impair the region’s vegetation water conservation capacity but also substantially escalate agricultural irrigation demands. Notably, the temporal trajectory of these land-use changes aligns closely with the implementation cycles of regional land governance policies post-2019, including high-standard farmland development, large-scale land consolidation, and forest-lake ecological restoration initiatives. This temporal correspondence substantiates the regulatory impacts of these policy-driven projects. However, constrained by stringent water resource regulations, diverted surface water volumes have gradually diminished. As a result, agricultural irrigation has become increasingly reliant on groundwater extraction.
According to the Yibin Water Resources Bulletin [34], the study area has long suffered from a profound imbalance between groundwater recharge and extraction. Between 2019 and 2024, the built-up area expanded from 152.57 to 189.69 km2, total annual water consumption swelled from 1.098 to 1.26 billion m3, whereas available groundwater resources plummeted from 2.102 to 1.20 billion m3. Specifically post-2021, regional water demand has grown at an average annual rate of roughly 4%, accompanied by the rapid expansion of built-up area at a rate of 8.5 km2/yr, while available groundwater has shrunk by approximately 10% annually. Ultimately, the intense conversions among cropland, forest, and other land-use types, coupled with subsequent alterations in regional groundwater circulation, have further magnified the driving impact of land-use dynamics on GWL variations. Therefore, these changes are regarded as important anthropogenic factors associated with the observed increase in groundwater depth during the study period.
It is noteworthy that the Yibin region is located at the confluence of three major rivers and is characterized by abundant water resources and a well-developed river network. As a result, surface water bodies play an important role in groundwater recharge and hydrological regulation. This hydrological setting helps explain why water bodies and land for hydraulic infrastructure, despite showing only minor changes in area, still rank among the high-weight factors influencing GWL. It also reflects the well-structured ecological system shaped by the Yangtze River Basin. However, attention should be paid to the fact that, during rapid urbanization, substantial areas of high-quality cropland and wetlands have been encroached upon, which may cause potentially irreversible damage to the regional groundwater environment.

5.2. Impacts of Climate Change on Groundwater Levels

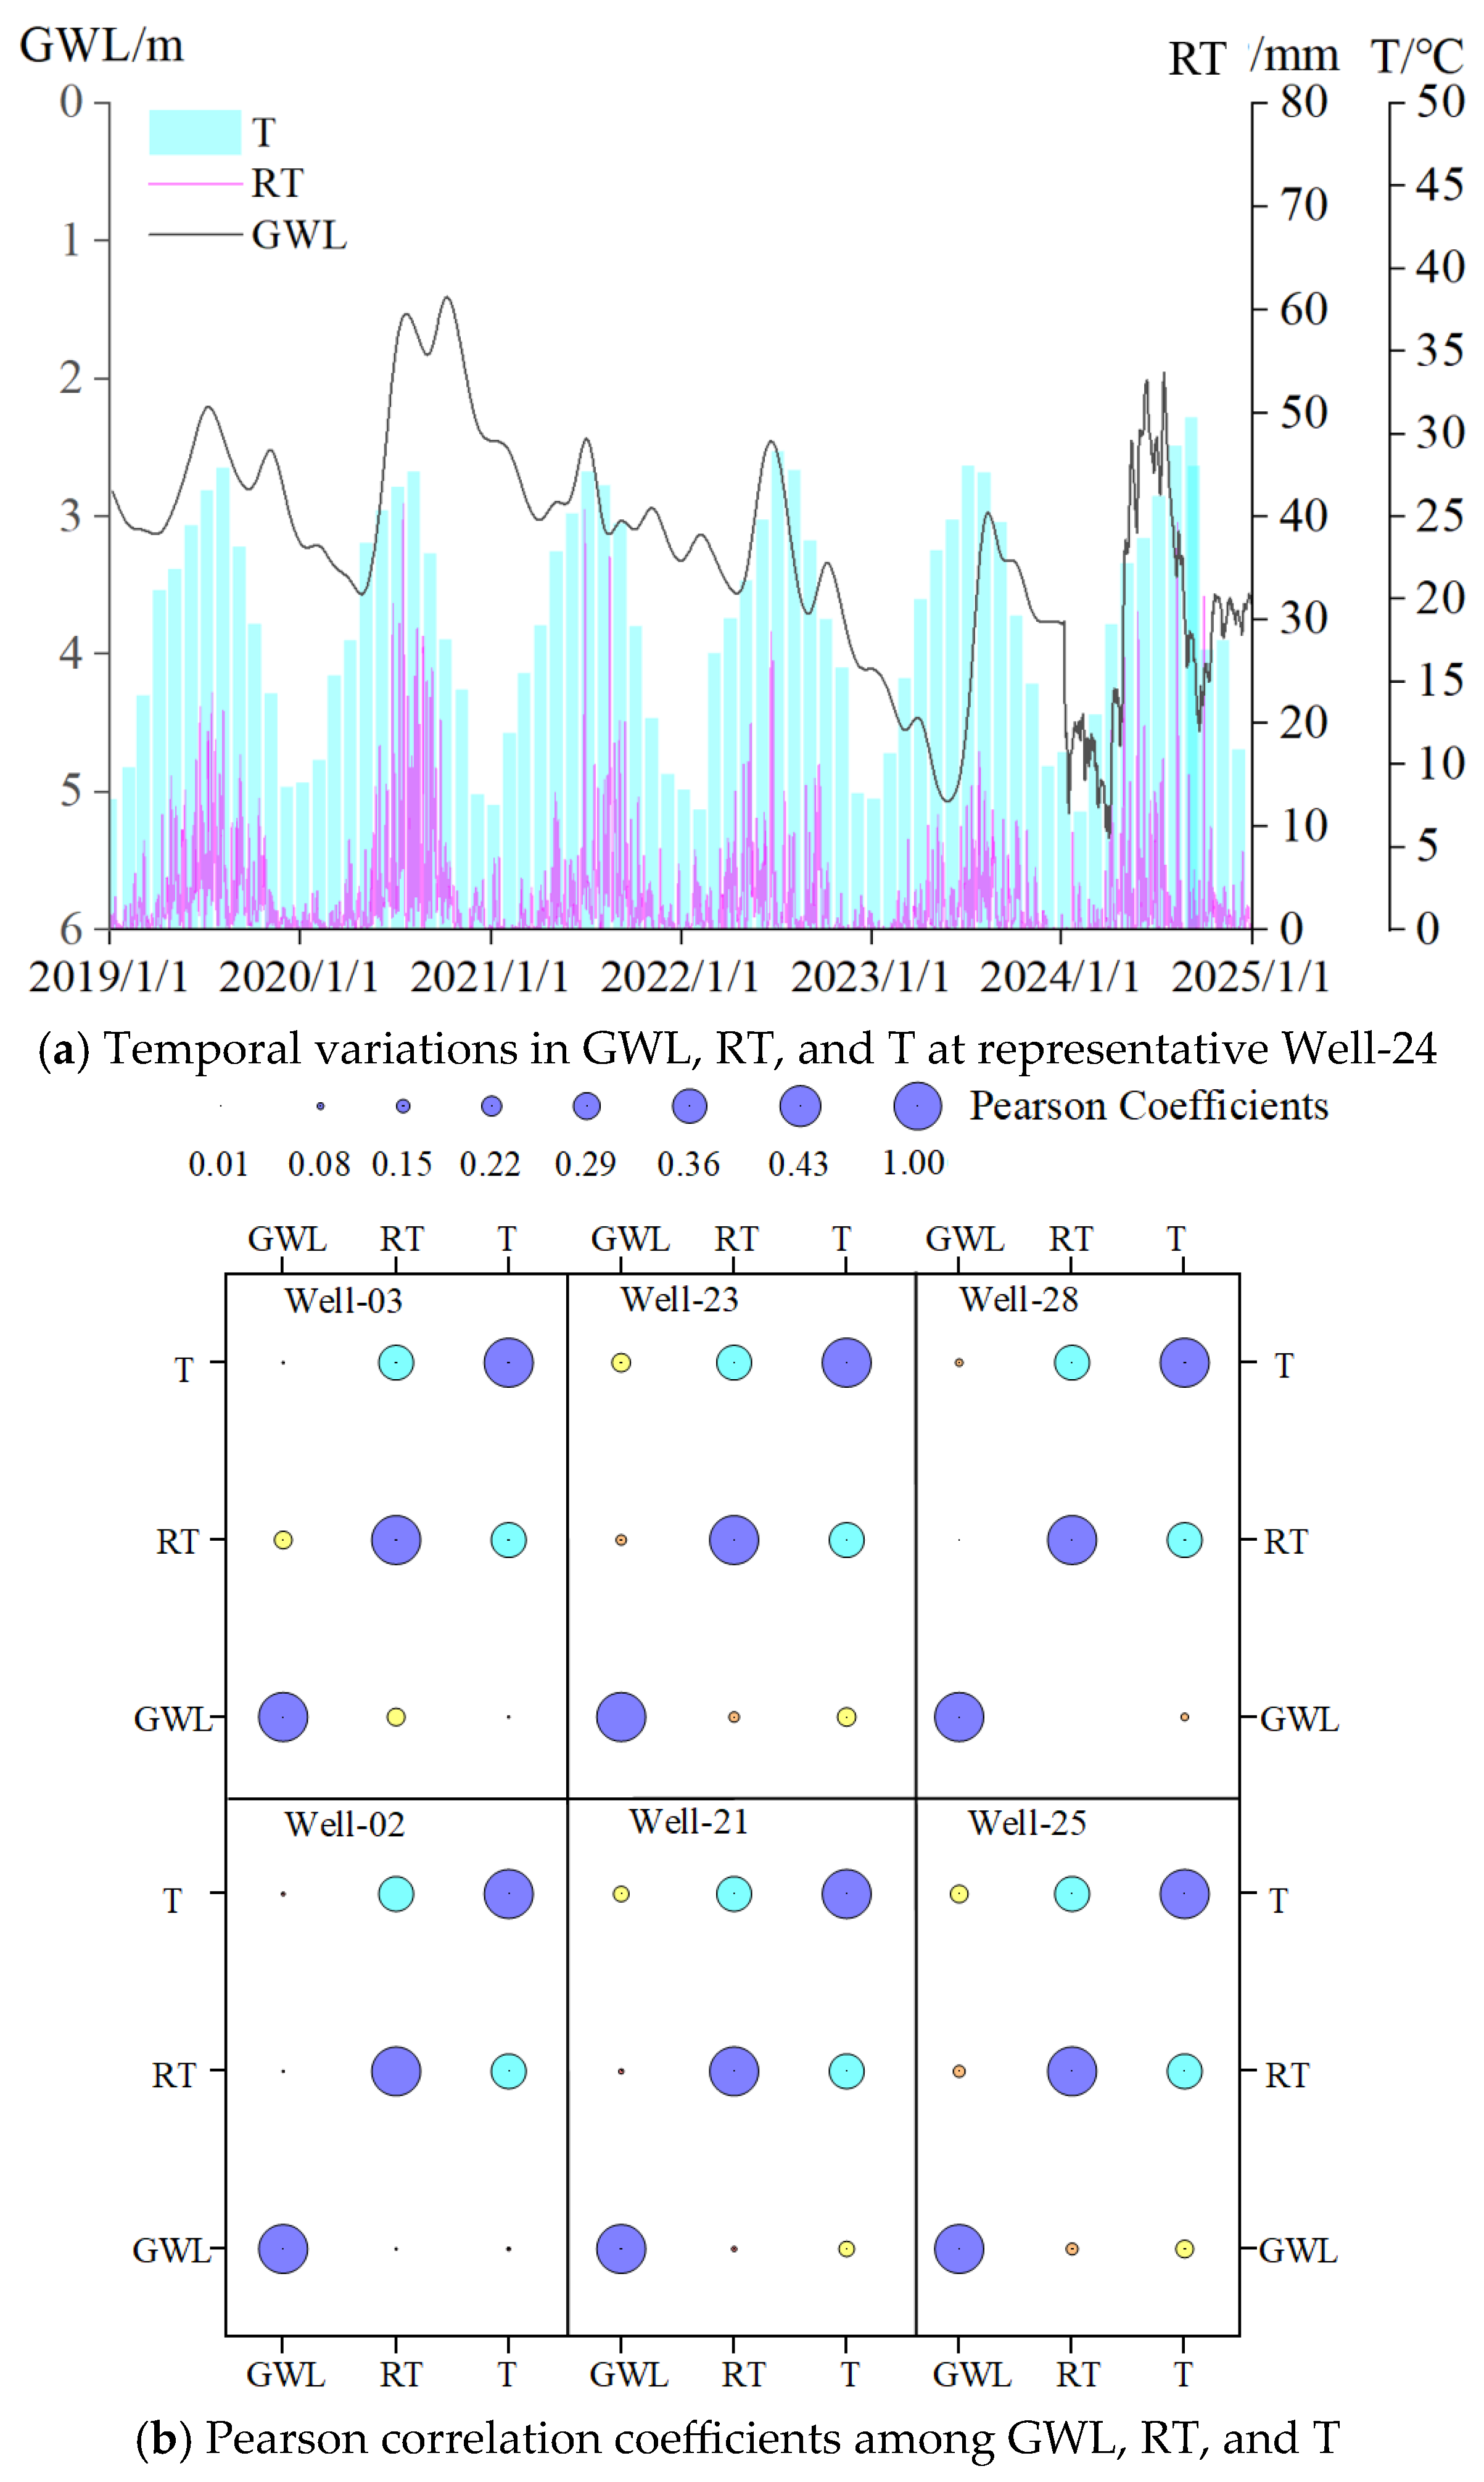
GWL presents distinct seasonal fluctuations, which generally synchronize with monthly precipitation peaks, especially during the rainy season from June to September with concentrated rainfall, as seen in Figure 7a. During 2019–2024, total annual precipitation displayed an overall declining trend, with annual values of 962.4, 1310.2, 1038.0, 974.3, 896.1, and 1030.1 mm, respectively. Annual precipitation was below the long-term mean in all years except 2020, with deficits of 13.9% (2019), 7.2% (2021), 11.9% (2022), 19.0% (2023), and 6.8% (2024). According to GB/T 50,095 [50], these conditions correspond predominantly to dry years. The gradual weakening of intra-annual precipitation peaks is likely a key factor driving the sustained decline in GWLs throughout the study period.
The Pearson correlation coefficients range from 0.1 to 0.3 for GWL-RT and from 0.1 to 0.2 for GWL-T, indicating very weak positive correlations (Figure 7b). However, the relatively low absolute values of these coefficients suggest that climatic factors alone are insufficient to fully explain GWL variations across the Yibin region. The observed GWL variability is shaped by the combined effects of climatic inputs and human activity. As the first city along the Yangtze River, Yibin has experienced continuous interannual land-use adjustments, particularly in cultivated land, along with intensive groundwater extraction. The region contains 72,802 water conservancy facilities, including 401 reservoirs, of which 5 are medium-sized and 396 are small-sized. These infrastructures facilitate frequent seasonal exchanges between surface water and groundwater. Anthropogenic water extraction and artificial regulation, together with precipitation recharge, jointly shape the spatiotemporal distribution of groundwater depth. Therefore, the current correlation analysis mainly reflects the direct contribution of climatic factors to GWL variations and provides a quantitative basis for further distinguishing anthropogenic impacts and identifying the dominant driving forces.

5.3. The Relationship Between Precipitation and Groundwater Level Variations

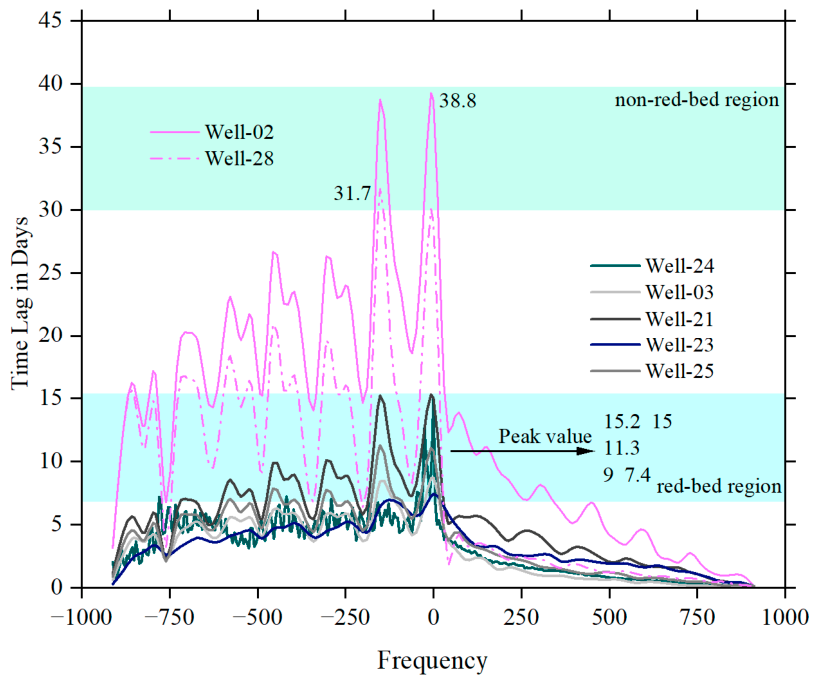
Because both precipitation infiltration recharge and groundwater seepage discharge exhibit temporal inertia, the peaks of groundwater level generally lag behind precipitation events [1,2]. The relationship between GWL and precipitation in the study area, as shown in Figure 7a, confirms this behavior. To characterize the lead–lag relationship between the two time series, this study further combined fast Fourier transform (FFT) with cross-correlation analysis, to analyze the relationship between GWL and RT. During the FFT analysis, GWL data used were selected from observations on the 5th, 15th, and 25th day of each month. RT data were based on daily monitoring records and were correspondingly selected according to the dates of the GWL observations. Following the algorithm described in Section 3.4, frequency-domain correlation plots for each monitoring site were obtained, as seen in Figure 8.
Figure 8 present the GWL-RT frequency domain relationship for monitoring wells located in both red-bed and non-red-bed regions, respectively. The results indicate that during 2019–2024, the first in-phase peaks of both GWL and RT are positive, indicating that variations in RT exert a significant precursor effect on GWL. Overall, the dynamic response of GWL lags behind RT. Notably, this lag time is shorter in the bedrock fissure water of red-bed strata compared to that in carbonate strata. Such a consistency suggests an intrinsic linkage between intra-annual RT variability and GWL dynamics. In the red-bed region, GWL exhibits a delayed response to R within 0–1 month, with the 7–15 day lag identified. Conversely, the coherence between RT and GWL in the non-red-bed zone remains highly complex. Due to the limited deployment of monitoring wells in this region, the specific temporal response patterns between precipitation and groundwater could not be robustly characterized in this study. In future research, it is necessary to deeply explore the time scales and control mechanisms of precipitation responses, as well as the interaction mechanisms between precipitation, stratigraphic lithology, and groundwater types during the transport process from the surface to underground.

6. Conclusions and Limitations

The depth of GWL in the Yibin region presents a spatial pattern of being shallow in the northwest and deep in the southeast, generally consistent with the spatial distribution of red-bed fissure aquifers and carbonate karst aquifers, while also being affected by recharge–discharge conditions and other environmental factors. During 2019–2024, the depth of GWL exhibited an overall slow declining trend at a rate of 0.1–0.5 m per year. Specifically, the red-bed area experienced a sustained gentle GWL decline, whereas the non-red-bed karst area underwent steady drawdown with minor fluctuations. Region-wide groundwater levels exhibit highly synchronized periodic evolution, featuring dominant oscillations concentrated at 50–64 months.
GWL variations are significantly driven by a multidimensional set of hydrometeorology, geographic, and human activity factors. Among these, cultivated land, precipitation, temperature, and lithology serve as the primary independent drivers. Furthermore, interaction analyses reveal ubiquitous ‘nonlinear’ or ‘bi-factor’ enhancements across all variable pairs, wherein precipitation functions as a profound synergistic amplifier. These findings confirm that regional GWL dynamics operate under a ‘climate-human activities‘ composite driving mode, synergistically regulated by complex multidimensional interactions during the observation period under study.
Since 2021, cropland has expanded continuously, while regional precipitation has generally decreased and drought years occurred frequently. These changes, together with increasing build-up area and water demand, declining available groundwater resources, suggest that land-use transition and climatic drying may have contributed to the phased and gradual decline in GWLs during 2019–2024.
Several limitations in this study warrant acknowledgment. First, the inherent hydrogeological heterogeneity across the study area, coupled with the sparse distribution of monitoring wells and incomplete long-term observation records, inevitably introduces uncertainty into the spatial characterization of GWL dynamics. Second, although the interactive effects among the driving factors were quantitatively evaluated, constraints regarding multiscale data availability necessitated feature simplification, which may in turn compromise the generalizability of the models. To overcome these challenges, future studies should further integrate heterogeneous multi-source data, including hydrometeorological, topographic–geological, and human activity information, to systematically analyze the spatiotemporal heterogeneity of driving mechanisms, improve the robustness and transferability of the results, and clarify the relationships between multi-timescale GWL variations and their responses to driving factors.

Author Contributions

X.L.: Writing—Original Draft, Writing—Review and Editing, Methodology, Data Curation, Formal analysis; B.L.: Writing—Review and Editing, Formal analysis, Investigation; J.C.: Writing—Review and Editing, Formal analysis, Investigation, Funding acquisition; K.W.: Investigation, Data Curation; J.K.: Supervision. All authors have read and agreed to the published version of the manuscript.

Funding

This research is supported by the National Natural Science Foundation of China (No. 52504044) and the Key Research and Development Program of Yibin City, Sichuan Province, China (No. 2024SF014).

Data Availability Statement

All data, models, and code generated or used during the study appear in the submitted article.

Acknowledgments

The authors wish to acknowledge China Geological Survey, Yibin Water Resources Bureau for contributions to some data for the research. AI (specify the Deepseek-V4.0, Gemini 3.0) was used only to improve grammar, general editing.

Conflicts of Interest

Authors Jibin Chen and Jingwen Kang were employed by the company Zhongyan Technology Co., Ltd. The remaining authors declare that the research was conducted in the absence of any commercial or financial relationships that could be construed as a potential conflict of interest.

References

  1. Yin, X.; Shu, L.; Wang, Z.; Li, Y.; Zhou, L.; Lv, C.; Li, S.; Liu, B.; Lu, C. Quantifying the time-varying period and time lag features of groundwater response: Dynamic impacts of precipitation-fed groundwater recharge. Ecol. Indic. 2025, 175, 113648. [Google Scholar] [CrossRef] [Scilit]
  2. Kuang, X.; Liu, J.; Scanlon, B.; Jiao, J.; Jasechko, S.; Lancia, M.; Biskaborn, B.; Wada, Y.; Li, H.; Zeng, Z.; et al. The changing nature of groundwater in the global water cycle. Science 2024, 383, 6686. [Google Scholar] [CrossRef] [Scilit] [PubMed]
  3. Chen, Z.; Liu, W.; Feng, Q.; Yin, Z.; Zhu, M.; Xue, Y.; Wang, L.; Fang, C.; Zhu, R. Groundwater anomaly variation and its response to environment change in an inland river basin, China. J. Hydrol. 2025, 661, 133812. [Google Scholar] [CrossRef] [Scilit]
  4. Zhang, H.; Wang, L.; Peng, Z.; Hu, L. Spatiotemporal differences of groundwater recovery in North China Plain using GRACE and well data. Groundwater 2025, 11, 13497. [Google Scholar] [CrossRef] [Scilit] [PubMed]
  5. Yang, J.; Guo, B. Analysis of spatial and temporal variation patterns of long-term precipitation in China from 1901 to 2022. Acta Ecol. Sin. 2025, 45, 5853–5870. [Google Scholar] [CrossRef]
  6. Taylor, R.; Scanlon, B.; Doll, P.; Rodell, M.; Beek, R.; Wada, Y.; Longuevergne, L.; Leblanc, M.; Famiglietti, J.; Edmunds, M.; et al. Groundwater and climate change. Nat. Clim. Change 2023, 3, 322–329. [Google Scholar] [CrossRef] [Scilit]
  7. Zhao, Z.; Luo, Z.; Huang, L.; Xing, L.; Sun, H.; Chen, H.; Sun, B. Analysis of precipitation and groundwater variation based on STL and Mann-Kendall methods in Jinan City. J. China Hydrol. 2022, 42, 73–77. [Google Scholar] [CrossRef]
  8. Feng, K.; Tian, J.; Hong, Y.; Tang, G.; Kan, G.; Luo, X. Hydrological simulation and evaluation of multi-source precipitation products in different climatic zones. J. Irrig. Drain. Eng. 2021, 39, 1146–1153. [Google Scholar] [CrossRef]
  9. Ding, B.; Yu, X.; Jia, G. Exploring the controlling factors of watershed streamflow variability using hydrological and machine learning models. Water Resour. Res. 2025, 61, 039734. [Google Scholar] [CrossRef] [Scilit]
  10. Chen, J.; Liu, G.; Liu, B.; Liu, J.; Tang, J.; Kang, J. Drainage-pressure relief for anti-uplift performance in expansive clay: A low-carbon alternative to conventional anchors. Ann. N. Y. Acad. Sci. 2026, 1556, e70206. [Google Scholar] [CrossRef] [Scilit] [PubMed]
  11. Boo, K.; El-Shafie, A.; Othman, F.; Khan, M.; Birima, A.; Ahmed, A. Groundwater level forecasting with machine learning models: A review. Water Res. 2024, 252, 121249. [Google Scholar] [CrossRef] [Scilit] [PubMed]
  12. Geris, J.; Comte, J.; Franchi, F.; Petros, A.; Tirivarombo, S.; Selepeng, A.; Villholth, K. Surface water-groundwater interactions and local land use control water quality impacts of extreme rainfall and flooding in a vulnerable semi-arid region of Sub-Saharan Africa. J. Hydrol. 2022, 609, 127834. [Google Scholar] [CrossRef] [Scilit]
  13. Bhattarai, N.; Lobell, D.; Singh, B.; Fishman, R.; Kustas, W.; Pokhrel, Y.; Jain, M. Warming temperatures exacerbate groundwater depletion rates in India. Sci. Adv. 2023, 9, 10. [Google Scholar] [CrossRef] [Scilit] [PubMed]
  14. Xu, P.; Weng, B.; Yang, D.; Bian, J.; Wang, H. The driving effect of Freeze-Thaw action on the shallow groundwater level fluctuation by altering the hydraulic conductivity of surface soil. J. Hydrol. 2025, 656, 133004. [Google Scholar] [CrossRef] [Scilit]
  15. Jiang, T. Spatio-Temporal Evolution Characteristics of Ecological Drought in Northwestern China and Its Response to Meteorological Drought and Groundwater Drought. Ph.D. Thesis, Northwest A&F University, Yangling, China, 2022. [Google Scholar]
  16. Guan, N.; Bi, H.; Zhang, Q.; Li, S.; Jiao, Z. Spatial and temporal dynamic characteristics of groundwater burial depth at different levels and its response to precipitation in Changping District, Beijing. J. Irrig. Drain. Eng. 2023, 42, 103–108. [Google Scholar] [CrossRef]
  17. Hu, L.; Guo, J.; Zhang, S.; Sun, K.; Yang, Z. Response of groundwater regime to ecological water replenishment of the Yongding River. Hydrogeol. Eng. Geol. 2020, 47, 5–11. [Google Scholar] [CrossRef]
  18. Yuan, F.; Qian, J.; Renyang, Q.; Li, W.; Li, X.; Zheng, Y.; Wang, J.; Wang, L. Spatiotemporal Groundwater Dynamics and Relative Risk Assessment in the West Liao River Basin, China (2019–2024). Water 2026, 18, 1684. [Google Scholar] [CrossRef] [Scilit]
  19. Ju, X.; Gao, Z.; Li, W. Unveiling evolutionary patterns, differentiation mechanisms, and driving pathways of groundwater storage anomalies in China’s Yellow River Basin. J. Hydrol.-Reg. Stud. 2025, 61, 102655. [Google Scholar] [CrossRef] [Scilit]
  20. Han, Y.; Zhang, X.; Lv, A.; Zhu, W. Prediction of the annual variation of groundwater depth and Its probability based on MCAR model and copula functions: A case study in Beijing, China. Water Resour. Res. 2025, 61, 38238. [Google Scholar] [CrossRef] [Scilit]
  21. Bao, Z.; Wu, B.; Wang, C.; Du, M.L.; Ban, J. Dynamic change and attribution analysis of groundwater level in the plain area of Aksu River Basin. Environ. Sci. Technol. 2025, 48, 128–140. [Google Scholar] [CrossRef]
  22. Li, R.; Zhang, G.; Li, L.; Guo, Y.; Zhang, Q.; Zhu, Z. Relationships Among Groundwater Depth, Vegetation Dynamics, and Evapotranspiration in an Arid Basin: Identification of Groundwater-Dependent Vegetation Ecosystems and Ecological Reference Thresholds. Water 2026, 18, 1440. [Google Scholar] [CrossRef] [Scilit]
  23. Wang, Y.; Li, J.; Tong, X.J.; Wang, Y.; Yang, M.G. Regulation of climatic variables and drought on vegetation dynamics in China from 2001 to 2020. Ecol. Indic. 2024, 165, 112094. [Google Scholar] [CrossRef] [Scilit]
  24. Jia, R.; Ma, S.; Wei, S.; Ma, Z.; Ji, S.; Zhang, D. Integrating Numerical Simulation and Machine Learning for Groundwater Level Prediction: A Case Study of Eastern Beijing, China. Water 2026, 18, 1486. [Google Scholar] [CrossRef] [Scilit]
  25. Chen, Z. Research on the Response of Groundwater Depth Change and the Vegetation Ecosystem in the West Liao River Plain Based on RS/GIS. Ph.D. Thesis, Jilin University, Changchun, China, 2012. [Google Scholar]
  26. Jiang, H.; Yu, S.; Adilai, W. Landsat data-based monitoring of groundwater depth and its influencing factors in oasis areas on both sides of the Kaidu River. J. Nat. Disasters 2017, 26, 205–214. [Google Scholar]
  27. Wei, L.; Kong, D.; Luo, Y.; Jia, Y.; Shu, Q. Groundwater occurrence environment in the red beds of southern Sichuan and the hydrochemical characteristics: A case study in Pingshan County, Yibin City. Explor. Eng. Rock Soil Drill. Tunneling 2018, 45, 145–150. [Google Scholar]
  28. Jasechko, S.; Seybold, H.; Perrone, D.; Fan, Y.; Shamsudduha, M.; Taylor, R.; Fallatah, O.; Kirchner, J. Rapid groundwater decline and some cases of recovery in aquifers globally. Nature 2024, 625, 715–721. [Google Scholar] [CrossRef] [Scilit] [PubMed]
  29. Wu, X.; Yu, J.; Yang, S.; Zhang, Y.; Hu, Q.; Xu, X.; Wang, Y.; Wang, Y.; Luo, H.; Xie, Z. Hydrogeochemistry, Water Quality, and Health Risk Analysis of Phreatic Groundwater in the Urban Area of Yibin City, Southwestern China. Water 2024, 16, 3599. [Google Scholar] [CrossRef] [Scilit]
  30. Zhu, Z.; Liu, Z.; Zhong, J.; Zhou, J.; Li, C. Analysis on the differences of groundwater quality indexes under different geological conditions: A case study of Yibin and Luzhou cities. Sichuan Environ. 2016, 35, 46–50. [Google Scholar] [CrossRef]
  31. China Geological Survey. Atlas of Geological Environment of Major Economic Zones and City Groups in China: Chengdu-Chongqing City Group; China University of Geosciences Press: Beijing, China, 2018.
  32. China Institute for Geo-Environmental Monitoring. The China Geological Environment Monitoring Groundwater Level Yearbook: 2005–2023; China Land Press: Beijing, China, 2023. [Google Scholar]
  33. Wang, M.; Yao, J.; Chang, H.; Liu, R.; Xu, N.; Liu, Z.; Gong, H.; Zheng, H.; Wang, J.; Guo, X.; et al. Underground well water level observation grid dataset from 2005 to 2022. Sci. Data 2025, 12, 728. [Google Scholar] [CrossRef] [Scilit] [PubMed]
  34. Yibin Water Affairs Bureau. Water Resources Bulletin of Yibin City: 2010–2023; Yibin Water Affairs Bureau: Yibin, China, 2023. [Google Scholar]
  35. FAO; IIASA. Harmonized World Soil Database Version 2.0; FAO: Rome, Italy; IIASA: Laxenburg, 2023. [Google Scholar]
  36. Department of Urban Social and Economic Survey of Yibin. Yibin Statistics Yearbook; Yibin Bureau of Statistics: Yibin, China, 2024.
  37. Tao, S.; Kuang, T.; Peng, W.; Wang, G. Spatiotemporal variations and driving forces of NDVI in the upper reaches of the Yangtze River from 2000 to 2015: A case study of Yibin City. Acta Ecol. Sin. 2020, 40, 5029–5043. [Google Scholar] [CrossRef]
  38. Kirby, J. The Continuous Wavelet Transform. In Spectral Methods for the Estimation of the Effective Elastic Thickness of the Lithosphere; Advances in Geophysical and Environmental Mechanics and Mathematics; Springer: Cham, Switzerland, 2022. [Google Scholar]
  39. Cai, Y.; Huang, R.; Xu, J.; Xing, J.; Yi, D. Dynamic Response Characteristics of Shallow Groundwater Level to Hydro-Meteorological Factors and Well Irrigation Water Withdrawals under Different Conditions of Groundwater Buried Depth. Water 2022, 14, 3937. [Google Scholar] [CrossRef] [Scilit]
  40. Guo, Y.; Chen, L.; Cheng, L.; Chen, X. Revealing driving factors of groundwater level depth changes in China using interpretable machine learning and the optimal GeoDetector model. J. Hydrol.-Reg. Stud. 2026, 64, 103248. [Google Scholar] [CrossRef] [Scilit]
  41. Su, X.; Chu, J.; Zhang, T.; Jiang, T. patio-temporal evolution trend of groundwater drought and its dynamic response to meteorological drought in Northwest China. Water Resour. Prot. 2022, 38, 34–42. [Google Scholar] [CrossRef]
  42. Acworth, R.; Rau, G.; McCallum, A.; Andersen, M.; Cuthbert, M. Understanding connected surface-water/groundwater systems using Fourier analysis of daily and sub-daily head fluctuations. Hydrogeol. J. 2015, 23, 143–159. [Google Scholar] [CrossRef] [Scilit]
  43. Krzysztof, I. Wireless Technologies: Circuits, Systems, and Devices; CRC Press: Boca Raton, FL, USA, 2007. [Google Scholar]
  44. GB/T 50095; Standard for Essential Terminology and Symbol in Hydrology. China Planning Press: Beijing, China, 2014.
  45. T/CHES 103.2023; Technical Guide for Groundwater Regime Analysis and Evaluation. Chinese Hydraulic Engineering Society (CHES): Beijing, China, 2023.
  46. Shi, Z.; Zhu, X.; Tang, Y. Changes and influencing factors of terrestrial water storage in China based on GRACE satellite data. Arid Land Geogr. 2023, 46, 1397–1406. [Google Scholar] [CrossRef]
  47. Mo, Y.; Xu, J.; Zhu, S.; Xu, B.; Wu, J.; Jin, G.; Wang, Y.; Li, L. Spatial heterogeneity of groundwater depths in coastal cities and their responses to multiple factors interactions by interpretable machine learning models. Geosci. Front. 2025, 3, 102033. [Google Scholar] [CrossRef] [Scilit]
  48. Wu, P.; Shu, L.; Comte, J.; Zuo, Q.; Wang, M.; Li, F.; Chen, H.W. The effect of typical geological heterogeneities on the performance of managed aquifer recharge: Physical experiments and numerical simulations. Hydrogeol. J. 2021, 29, 2107–2125. [Google Scholar] [CrossRef] [Scilit]
  49. Zhou, L.; Shu, L.C.; Yin, X.; Zhou, T.; Li, Y.; Lu, C.; Yang, P. Nonstationary groundwater level responses to coupled human–natural drivers in the Baiyangdian Watershed. J. Hydrol. 2026, 664, 134623. [Google Scholar] [CrossRef] [Scilit]
  50. GB/T 50095—2014; Standard for Basic Terms and Symbols of Hydrology. China Planning Press: Beijing, China, 2014.
Figure 2. Variations in Groundwater Level in the Yibin Region (2019–2024).
Water 18 01982 g002
Figure 3. Spatial Distribution of Groundwater Level Trends in the Yibin Region.
Water 18 01982 g003
Figure 4. Contour maps of the real part of the wavelet coefficients for groundwater levels. Note: the vertical axis in the left panel represents the corresponding time scale, while the horizontal axis represents the study period. The right panel indicates the energy intensity at different scales.
Water 18 01982 g004
Figure 5. Effects of single factors on GWL.
Water 18 01982 g005
Figure 6. Interaction Effects of Driving Factor q on Groundwater Level.
Water 18 01982 g006
Figure 7. Climatic responses of groundwater levels.
Water 18 01982 g007
Figure 8. Frequency domain relationship analysis diagram.
Water 18 01982 g008
Table 1. Basic information on GWL monitoring wells in the Yibin area.
Well No.Short No.Site NameLongitude
/°E
Latitude
/°N
Elevation
/m
Wellhead Elevation
/m
Well Depth
/m
Aquifer
Medium
511502210001Well-02Shunnan (SN)104.80147928.850019371.99372.4979.3carbonate fissure-karst water
511528210001Well-28Gusong (GS)105.25671528.329877367.23367.73100
511503210001Well-03Daguan (DG)104.91881328.968899283.67284.1779.5red-bed fissure water
511521210001Well-21Anbian (AB)104.47440828.652462450.92451.42100
511523210001Well-23Liugeng (LG)105.08850928.759720394.79395.2976.4
511524210001Well-24Kaifou (KF)104.93528128.631496265.31265.8180
511525210001Well-25Qingfu (QF)104.46765228.367123393.72394.2280
Table 2. The influence factors table of GWL and their discrete data.
CategoryFactorCodeClassification Categories Based on the Jenks MethodUnit
Hydrometeorology Factor-X1Precipitation-RTX11Monthly mean values: 80-93-98-102-107-116mm
Potential Evapotranspiration-ETX12Change rate: 0.3-0.35-0.4-0.45-0.5-0.55mm/month
Temperature-TX13Monthly mean values: 10-15-20-25-30-35°C
Soil Moisture Index-AWCX1440-100-130-140-150-165mm/m
Geographic
Factor-X2
Slope-SX210-8-15-24-34-73Degree
River Influence Width-RWX22Average basin area (2019–2024): 0-50-100-500-750-1000km2
Slope Aspect-AX23Flat
North-facing (315°-45°), East-facing (45°-135°), South-facing (135°-225°), West-facing (225°-315°)
Degree
Elevation-EX24200-438-632-865-1151-2006m
Aquifer lithology-LX25Fissure water in clastic rocks, Karst fissure water in clastic–carbonate rocks, Pore water in unconsolidated sediments, Fractured-karst water in carbonate rocks, Fractured-karst water in soluble clastic rocks, Fractured water in igneous rocks
Human Actives Factor-X3Urban Impervious Surface-ISX31Change rate: 0-2-4-6-8-10%
Forest Area-FX32Change rate: 0-0.5-1.5-3-3.5-5
Cropland Area-CLAX33Change rate: 0-0.5-1.5-2.5-3-3.5
Population Density-PDX34Change rate: -0.04-0-0.02-0.03-0.05-0.08person/
km2·month
Table 3. Temporal Variations in Land Use and Groundwater Resources in Yibin (2019–2024).
YearsCroplandForest LandWater Bodies & Conservancy FacilitiesGroundwater Resources (108 m3)Change Rate (%)Total Water Use (108 m3)Change Rate (%)Built-Up Area (km2)
Area (104 ha)Change Rate (%)Area (104 ha)Forest Coverage (%)Change Rate (%)Area (104 ha)Change Rate (%)
201936.35↓1.8
↑0.06
↑0.4
↑0.8
↑1.2
65.5849.42↑0.5
↓0.0
↓3.0
↓0.01
↓0.13
-↓0.7
↑0.2
↓2.2
9.185↑128
↓14
↓23
↓10
↓3
12.79↓14
↑2.5
↑2.8
↑4.0
↑4.7
152.47
202035.7066.2449.924.2021.0210.98167.55
202135.7266.2449.924.1718.0711.25180.05
202235.8662.2346.894.1813.8311.57189.40
202336.1662.2146.884.0912.3912.03189.67
202436.5962.0446.75-12.0112.6189.69
Note: ↓ indicates a decreasing trend; ↑ indicates an increasing trend.
Disclaimer/Publisher’s Note: The statements, opinions and data contained in all publications are solely those of the individual author(s) and contributor(s) and not of MDPI and/or the editor(s). MDPI and/or the editor(s) disclaim responsibility for any injury to people or property resulting from any ideas, methods, instructions or products referred to in the content.