


Abstract
Understanding how desert riparian vegetation responds to managed flow releases is essential for ecological restoration in arid inland river basins. This study examines vegetation dynamics and hydrological responses in the desert reach of the Hotan River, a seasonal river crossing the Taklimakan Desert. To avoid temporal inconsistency, two data windows were explicitly separated: Landsat-derived vegetation information was used to describe long-term vegetation changes from 1985 to 2020, while environmental flow release, river-section water consumption, and groundwater-depth analyses were limited to the period with available hydrological observations, 2006–2020. NDVI and vegetation-cover classes were derived from cloud-screened and atmospherically corrected Landsat imagery, and the response of vegetation indicators to cumulative environmental flow release and groundwater depth was evaluated using transparent regression models with diagnostic statistics. Results indicate that vegetation cover improved overall during the study period, although the response was spatially heterogeneous. Vegetation conditions were generally better near the upper and terminal parts of the desert reach, whereas a relatively vulnerable zone occurred approximately 15–115 km downstream of the river confluence. During 2006–2020, NDVI and grassland area generally increased with cumulative environmental flow release, whereas annual grassland-area change showed large interannual fluctuations and was not significantly explained by cumulative release alone. The revised analysis clarifies that the study contributes a reach-scale synthesis linking long-term vegetation mapping with monitored environmental flow releases and groundwater response in the Hotan River desert reach, rather than a full 40-year ecohydrological attribution. These findings provide a basis for improving environmental flow scheduling and monitoring design in arid desert rivers.
1. Introduction
Water scarcity and ecosystem degradation are major constraints on ecological sustainability in arid inland river basins, where climate change, water-use intensification, and land-use change jointly reshape hydrological and ecological processes [1,2,3,4]. In these regions, riparian vegetation often depends on episodic river flow, shallow groundwater, and short periods of favorable soil moisture. Human regulation of river flow can therefore modify ecohydrological connectivity by changing groundwater recharge, soil moisture availability, and vegetation water access [5,6,7].
In China’s Tarim River Basin, ecological water conveyance and environmental-flow projects have been implemented to support vegetation recovery and groundwater restoration in degraded desert river corridors. Previous studies have shown that managed releases can raise groundwater levels, increase vegetation cover, and improve ecosystem services in arid inland basins [8,9,10,11,12,13]. However, the magnitude and persistence of vegetation response vary with river-section losses, groundwater conditions, landscape position, and cumulative engineering effects [14,15,16].
Ecological water conveyance volume (EWCV) is defined here as the annual volume of ecological water released or allocated to the Hotan River desert section for maintaining riparian vegetation and groundwater-dependent ecosystems. Although EWCV is a term commonly used in regional water management, it is conceptually comparable to environmental flow release or ecological water release in the international literature [8,10,12,13].
Several studies have already evaluated ecohydrological responses to ecological water conveyance in the Tarim River system and related arid basins [8,9,10,12,15]. Compared with these earlier studies, the revised contribution of this study is narrowed and clarified. First, it focuses on the Hotan River desert reach, which has received less attention than the mainstream lower Tarim River. Second, it explicitly separates the long-term Landsat-derived vegetation record from the shorter hydrological and groundwater monitoring period. Third, it evaluates whether cumulative environmental flow indicators are associated with vegetation responses using transparent regression models, while acknowledging the limitations caused by data availability and sample size. This framing avoids overstating a 40-year ecohydrological attribution and clarifies the new knowledge provided by the present study.
The objectives of this study are to: (1) map long-term vegetation-cover changes in the Hotan River desert reach using Landsat imagery from 1985 to 2020; (2) quantify environmental flow release, river-section water consumption, and groundwater-depth changes during 2006–2020; (3) evaluate the statistical associations between vegetation indicators and cumulative hydrological inputs using transparent regression models and model diagnostics; and (4) identify spatial sections where vegetation remains vulnerable despite managed flow releases. The central interpretation is limited to the period for which hydrological and groundwater observations are available.
2. Materials and Methods
2.1. Study Area and Spatial Definition
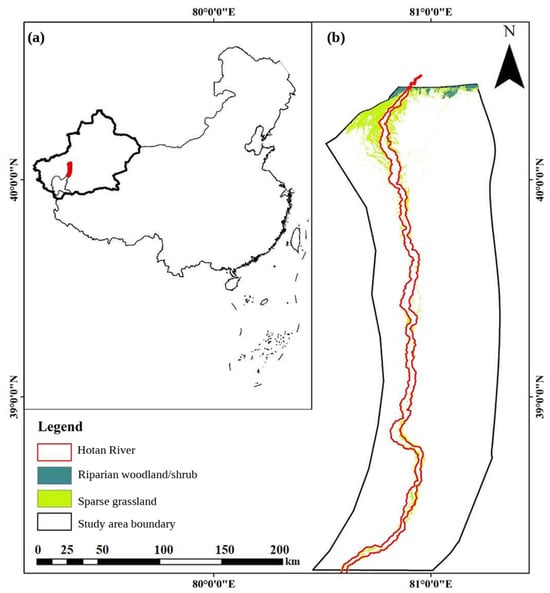
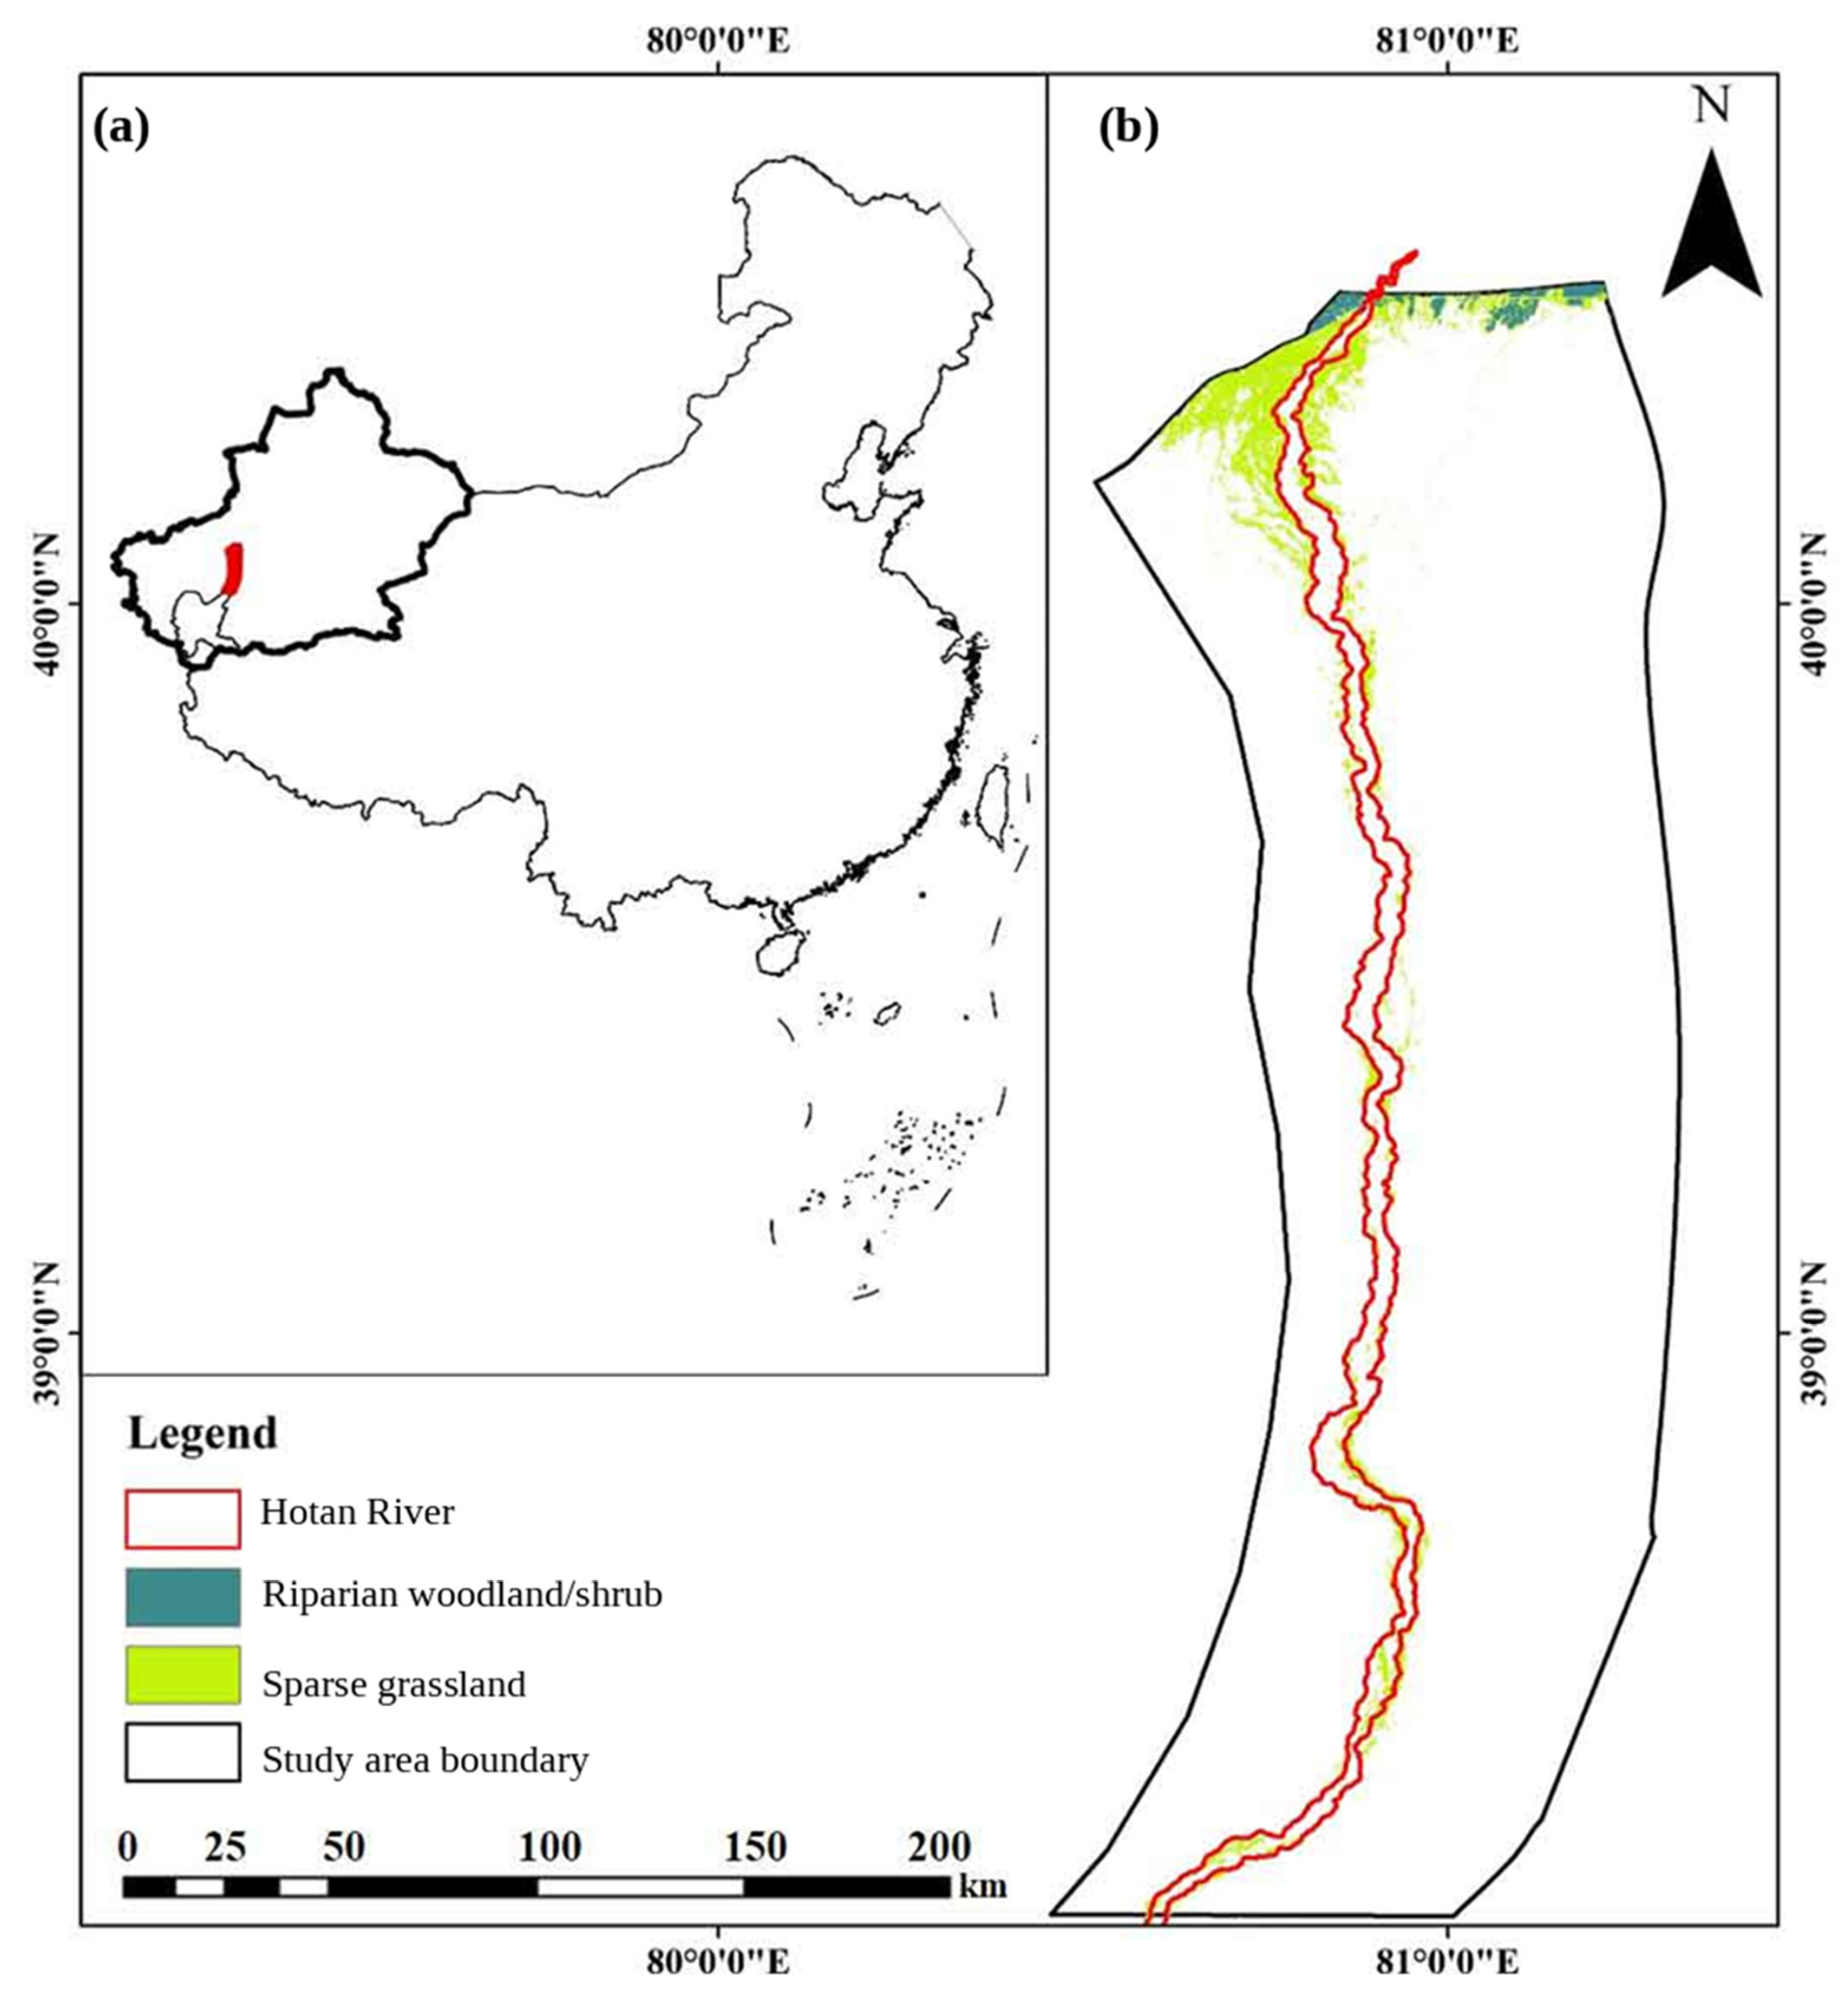
The Hotan River is formed by the confluence of the Karakash and Yurungkash rivers and flows northward across the Taklimakan Desert before joining the Tarim River. The Tarim Basin is a typical arid inland river system with strong human-water-ecosystem interactions and high ecological sensitivity [16,17,18]. The desert reach considered in this study refers to the mainstream corridor from the confluence of the two tributaries to the downstream connection with the Tarim River system. This reach is characterized by extremely low precipitation, high evaporation, seasonal channel desiccation outside the flood season, and groundwater-dependent desert riparian vegetation (Figure 1).
Figure 1.
Location of the Hotan River desert reach and the study area. Panel (a) shows the location of the study area in China, and panel (b) shows the Hotan River channel, study area boundary, and NDVI-derived riparian vegetation classes. The original “Forest” category was revised to “Riparian woodland/shrub” to better reflect the vegetation type in the desert riparian zone and to avoid overinterpretation of land-cover classes.
For reproducibility, the study boundary was defined using a GIS-based river centerline-buffer method. In this revision, the spatial unit is defined as the desert river corridor within a 0–2.75 km buffer from both riverbanks, further divided into distance bands of 0.25–0.75 km, 0.75–2.00 km, and 2.00–2.75 km for NDVI comparison. Monitoring sections are defined as cross-river transects perpendicular to the mainstream and numbered from the confluence downstream.
2.2. Data Sources and Temporal Coverage
The revised analysis separates the data periods of vegetation and hydrological variables. Landsat imagery was used to reconstruct vegetation-cover change from 1985 to 2020. Hydrological variables, including environmental flow release, upstream inflow, river-section water consumption, and groundwater depth, were only available for 2006–2020 and were therefore analyzed only for this shorter period. The manuscript no longer states that a 40-year hydrological response analysis was conducted (Table 1).
Table 1.
Data sources and descriptions used in this study.
2.3. Landsat Preprocessing and NDVI Calculation
Landsat images were selected for the growing season to reduce phenological inconsistency. Images were first subjected to radiometric calibration, atmospheric correction, cloud and cloud-shadow masking, geometric registration, and mosaicking, following common preprocessing requirements for optical remote-sensing analysis of vegetation and water-resource systems [19,20,21]. All images were projected to a common coordinate system and resampled to the same spatial resolution before classification. Remote sensing was used because it provides consistent long-term spatial observations in data-scarce arid regions and is widely applied in restoration ecology and biodiversity monitoring [22,23].
NDVI was calculated as:
where ρNIR and ρRED are the surface reflectance values of the near-infrared and red bands, respectively. For Landsat 8 OLI, these correspond to bands 5 and 4. For earlier Landsat sensors, the corresponding near-infrared and red bands were used consistently after cross-sensor preprocessing.
Vegetation extraction was performed using an NDVI-based threshold combined with visual interpretation and field-survey verification. Considering the sparse vegetation conditions in the Hotan River desert reach, pixels with NDVI greater than 0.10 were first identified as vegetation candidates. Woodland and grassland classes were then separated using NDVI magnitude, spatial distribution along the river corridor, image texture, and visual interpretation of Landsat false-color composites and high-resolution reference images. The classification results were evaluated using a confusion matrix based on independent validation samples. The vegetation classification achieved a Kappa coefficient of 0.89, indicating acceptable classification reliability for long-term vegetation-cover analysis in the study area [24].
2.4. Environmental Flow Release and Water-Consumption Terminology
To align the terminology with international ecohydrological literature, this manuscript uses environmental flow release or managed pulse flow instead of using water conveyance as a generic technical term. Environmental flow release refers to managed water delivered for ecological purposes under the broader framework of river restoration and adaptive water management [6,25,26]. This terminology also improves comparability with studies of river restoration, water-cycle management, and sustainable water-resource allocation [27,28,29].
Annual ecological water conveyance volume (EWCV) refers to the ecological water volume allocated to the Hotan River desert reach in each year, with units of 108 m3 yr−1. CEWCV was calculated as the cumulative sum of annual ecological water conveyance volume from 2006 to each year t, with units of 108 m3. Grassland-area change was calculated as the difference in grassland area between year t and year t−1, with units of 102 km2.
If Qup,t is the flow volume entering the desert reach during period t and Qdown,t is the downstream measured outflow, the river-section water consumption or transmission loss is calculated as:
Wloss,t = Qup,t − Qdown,t
The cumulative ecological water conveyance volume used in the response analysis is calculated as:
where Ri represents the annual ecological water conveyance volume allocated to the Hotan River desert reach. If part of the released water was lost during channel transmission, this variable represents allocated environmental flow rather than the actual water received by vegetation.
CEWCVt = ΣRi, i = 1, 2, …, t
2.5. Groundwater Monitoring Data
The accumulated groundwater-depth change index was calculated as the cumulative annual change in groundwater depth relative to the initial monitoring year. This variable is an accumulated change index and does not imply that groundwater depth itself is physically cumulative. Positive values indicate accumulated groundwater-related change along the monitored river corridor. Groundwater-depth data were obtained from monitoring wells distributed along the Hotan River desert reach. Groundwater depth was summarized by transect or river-distance section to evaluate the response of shallow groundwater to managed flow releases. Because detailed well metadata were limited, groundwater results were interpreted at the transect or river-distance scale rather than as point-scale vegetation responses [30,31]. Groundwater-depth change was analyzed only for 2006–2020. No groundwater response is inferred for 1985–2005 because corresponding monitoring data are not available. This restriction is essential for avoiding overstatement of the ecohydrological attribution.
2.6. Statistical Analysis and Model Transparency
All statistical analyses were conducted separately according to data availability. Long-term vegetation-cover change was analyzed for 1985–2020 using Landsat-derived vegetation maps, whereas hydrological-response analyses involving environmental flow release, river-section water consumption, groundwater depth, and vegetation indicators were restricted to 2006–2020, when monitored hydrological and groundwater data were available. Therefore, no hydrological attribution was made for the period before 2006.
Given the limited annual sample size for the hydrological-response analysis (n = 15, 2006–2020), regression models were used mainly to identify exploratory associations rather than to establish a predictive or causal dose–response relationship. To improve model transparency, linear regression was first used as a baseline model to test whether vegetation indicators changed monotonically with cumulative environmental flow release or groundwater-related indicators:
where Yt represents the vegetation indicator in year t, including mean NDVI, grassland area, or annual grassland-area change; Xt represents the hydrological explanatory variable, including cumulative environmental flow release, river-section water consumption, or accumulated groundwater-depth change index; β0 and β1 are regression coefficients; and εt is the residual error term.
Because vegetation recovery in arid riparian corridors may show diminishing marginal response after groundwater or soil-moisture conditions become favorable, a saturating nonlinear model was also tested for NDVI response:
where Y is the vegetation indicator; X is the accumulated groundwater-depth change index or another cumulative hydrological indicator; A is the lower asymptote; D is the upper asymptote; C is the inflection-related parameter; and B controls the curve steepness. The fitted parameters of this descriptive nonlinear response model are reported in the Results Section 3 rather than in the Methods Section 2.
For the nonlinear NDVI response curve, the two vertical reference lines were defined as response-transition reference points rather than fixed ecological thresholds. They were visually and analytically derived from changes in the fitted response curve and were used only to describe the approximate ranges where NDVI response appeared to accelerate or approach saturation. Because of the limited sample size, these values were not used for extrapolation or as fixed management thresholds.
In the previous version, a high-order polynomial model was used to describe the response of grassland area to cumulative environmental flow release. However, because high-degree polynomials can produce artificially high goodness-of-fit values under small sample sizes, the revised analysis does not use the polynomial model as the main basis for interpretation or management inference. Instead, the polynomial curve, if retained, is treated only as a descriptive smoother within the observed data range. The main interpretation is based on the comparison between the linear baseline model and the ecologically interpretable saturating model.
For each regression model, we reported the sample size, parameter estimates, standard errors, 95% confidence intervals, R2, adjusted R2, RMSE, p values, and information criteria where applicable. Model residuals were examined to assess whether the fitted relationships were dominated by individual years or by systematic deviations. Because of the short observation period, no model was used for extrapolation beyond the observed range of environmental flow release or groundwater variation.
Threshold-like values derived from fitted curves were interpreted cautiously. In this study, the vertical reference points identified from nonlinear response curves are referred to as “response-transition points” rather than fixed ecological thresholds unless they are supported by formal segmented regression or breakpoint tests. These transition points indicate approximate ranges where the vegetation response begins to increase or tends toward saturation, but they should be interpreted as adaptive reference ranges rather than fixed management targets (Table 2).
Table 2.
Statistical models and diagnostic metrics used for ecohydrological response analysis.
3. Results
3.1. Long-Term Vegetation-Cover Changes from Landsat Imagery
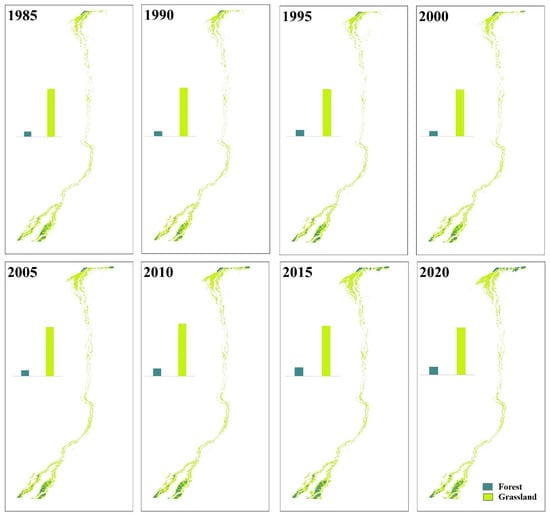
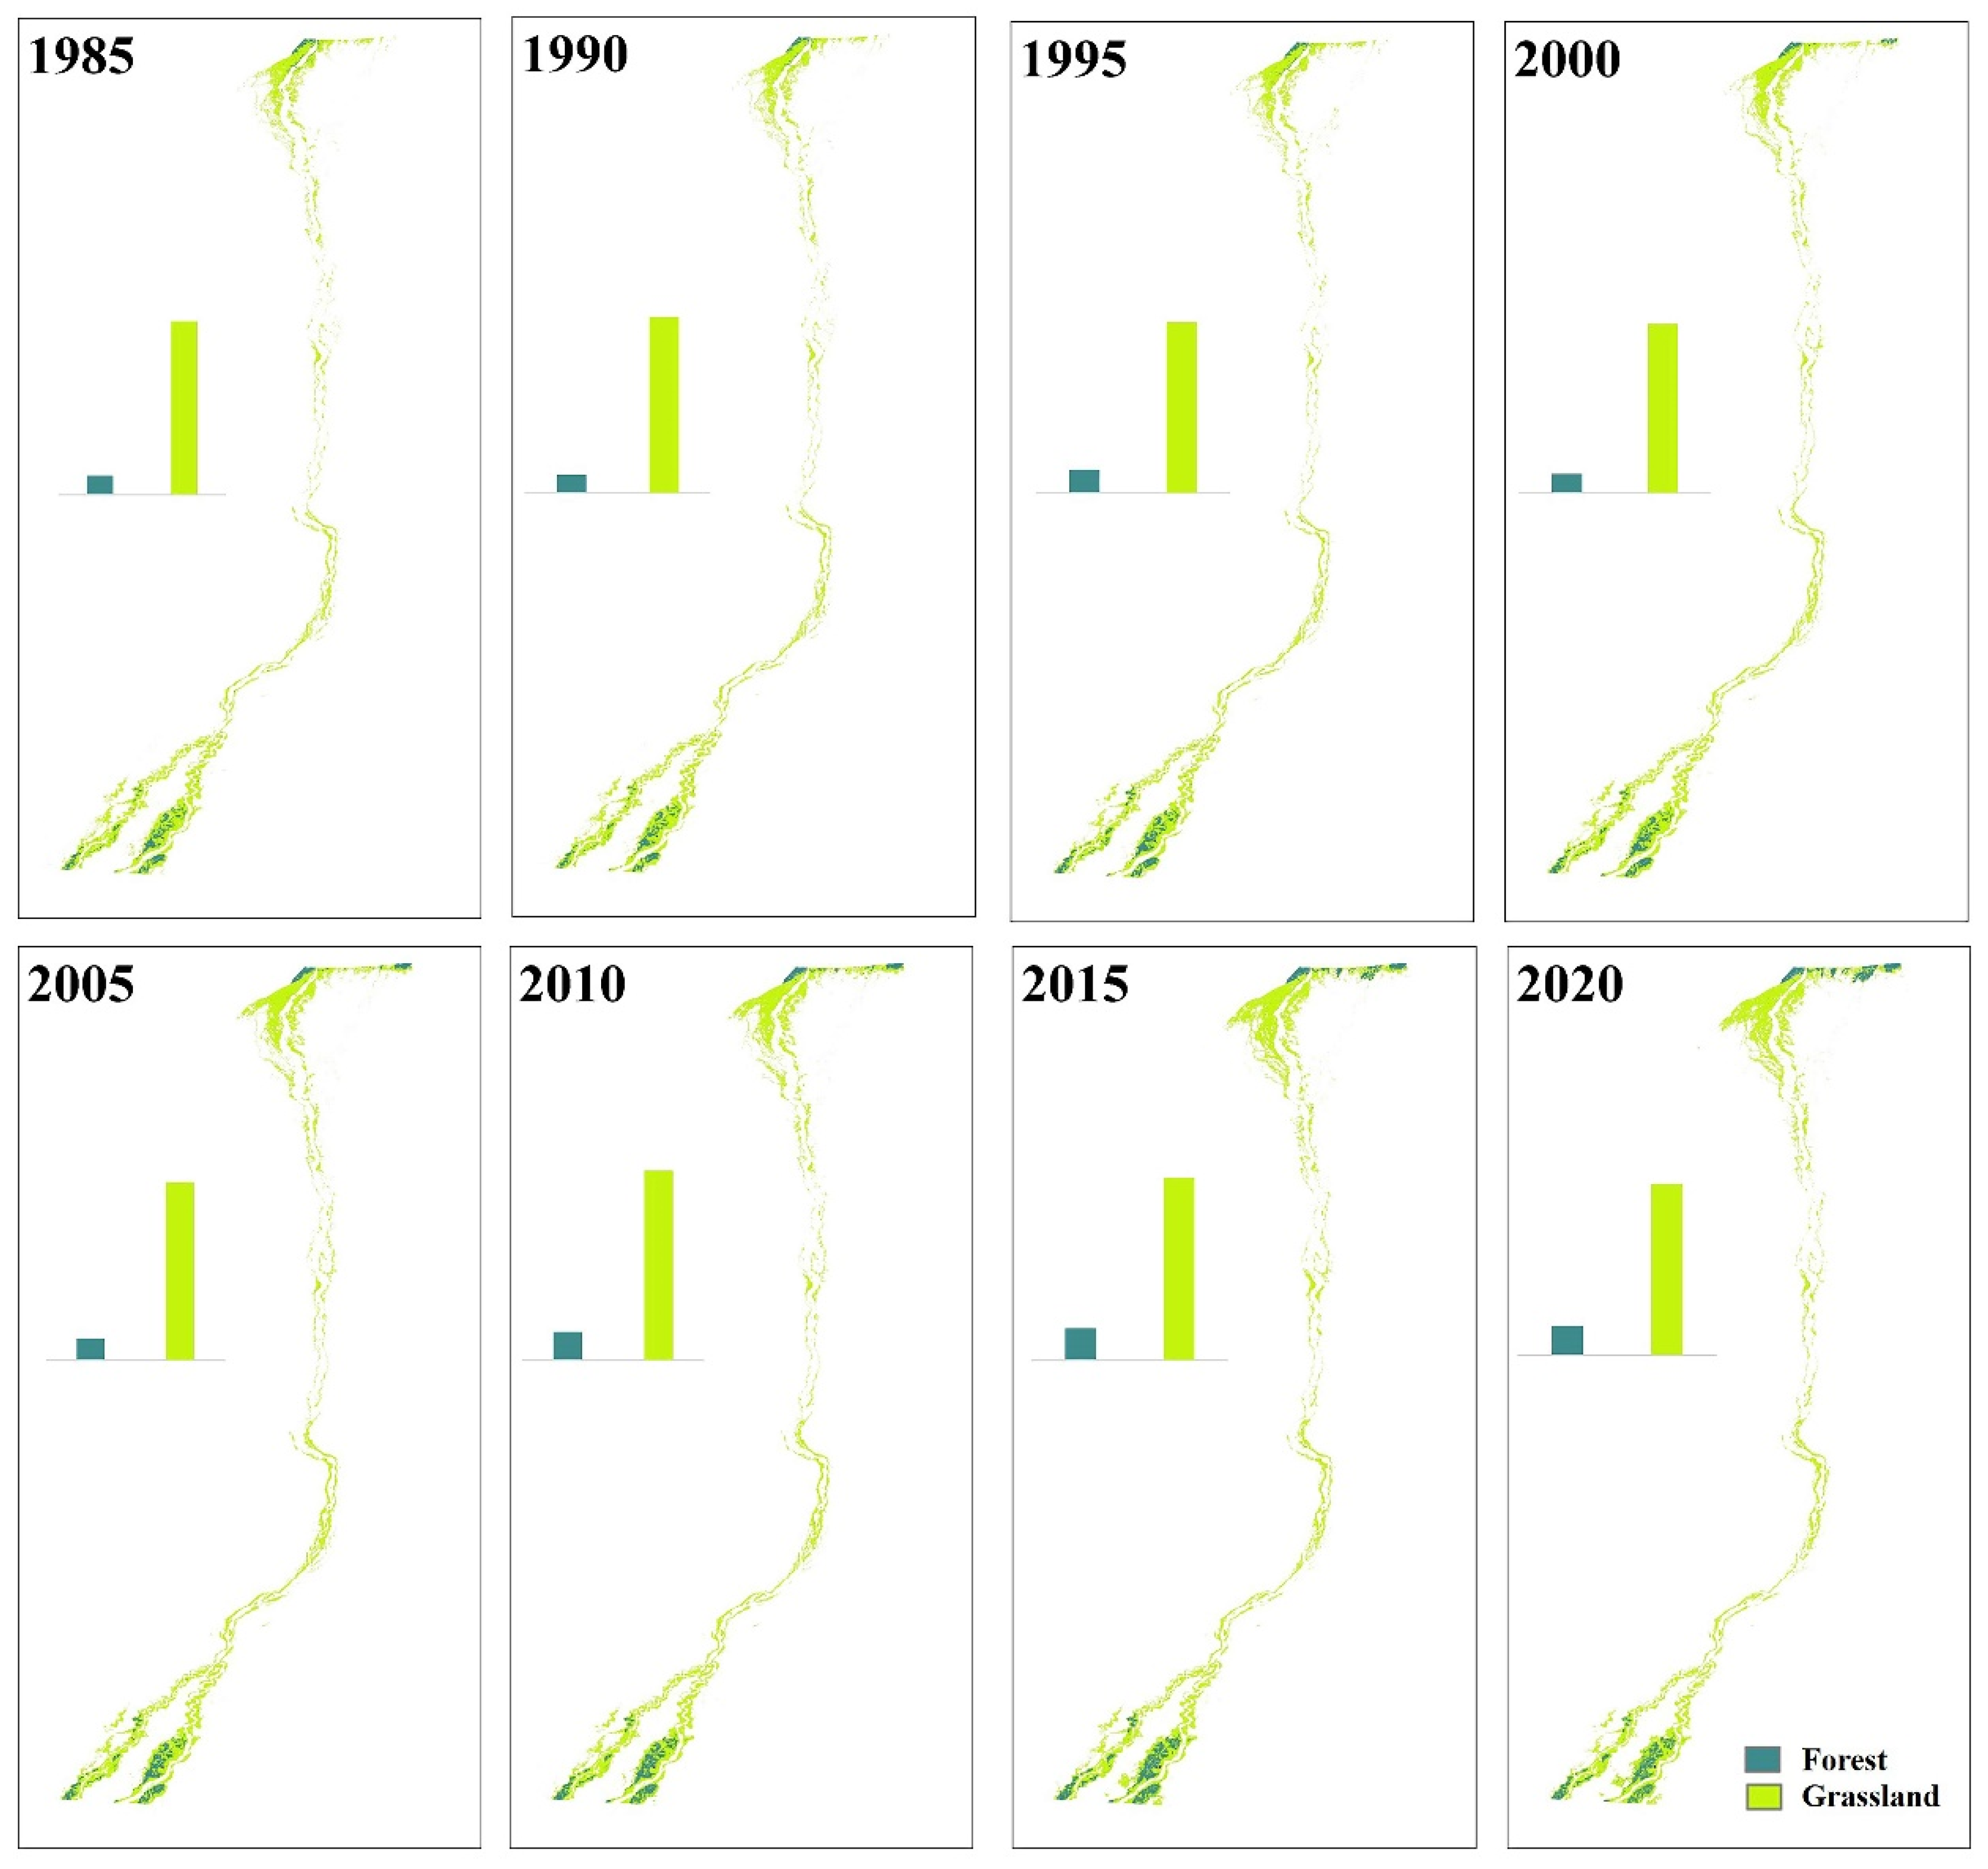
Long-term Landsat interpretation showed that vegetation cover in the Hotan River desert reach changed substantially between 1985 and 2020. The forest and grassland patches were concentrated along the river corridor and showed clear spatial heterogeneity. Overall, vegetation cover increased compared with the early period, although the trend was not monotonic. Similar vegetation recovery and fluctuation patterns have been reported in the lower Tarim River and other arid restoration contexts after ecological water conveyance or restoration interventions (Figure 2).
Figure 2.
Changes in woodland and grassland areas in the Hotan River desert reach from 1985 to 2020. The scale bar and legend are shown consistently for each panel.
Three temporal stages were identified from the NDVI and vegetation-cover sequence: slow growth during 1995–2005, decline or fluctuation during 2005–2015, and recovery during 2015–2020. Taking 1996 as a reference year, the 2020 vegetation condition showed an overall improvement in most monitoring sections, but spatial differences remained evident.
3.2. Environmental Flow Release and River-Section Water Consumption
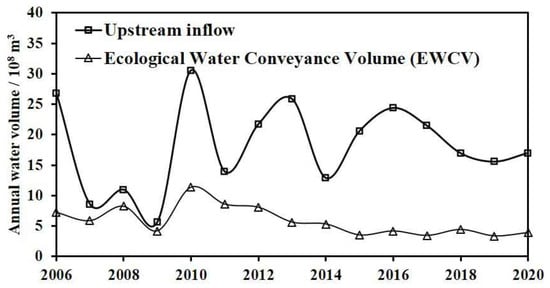
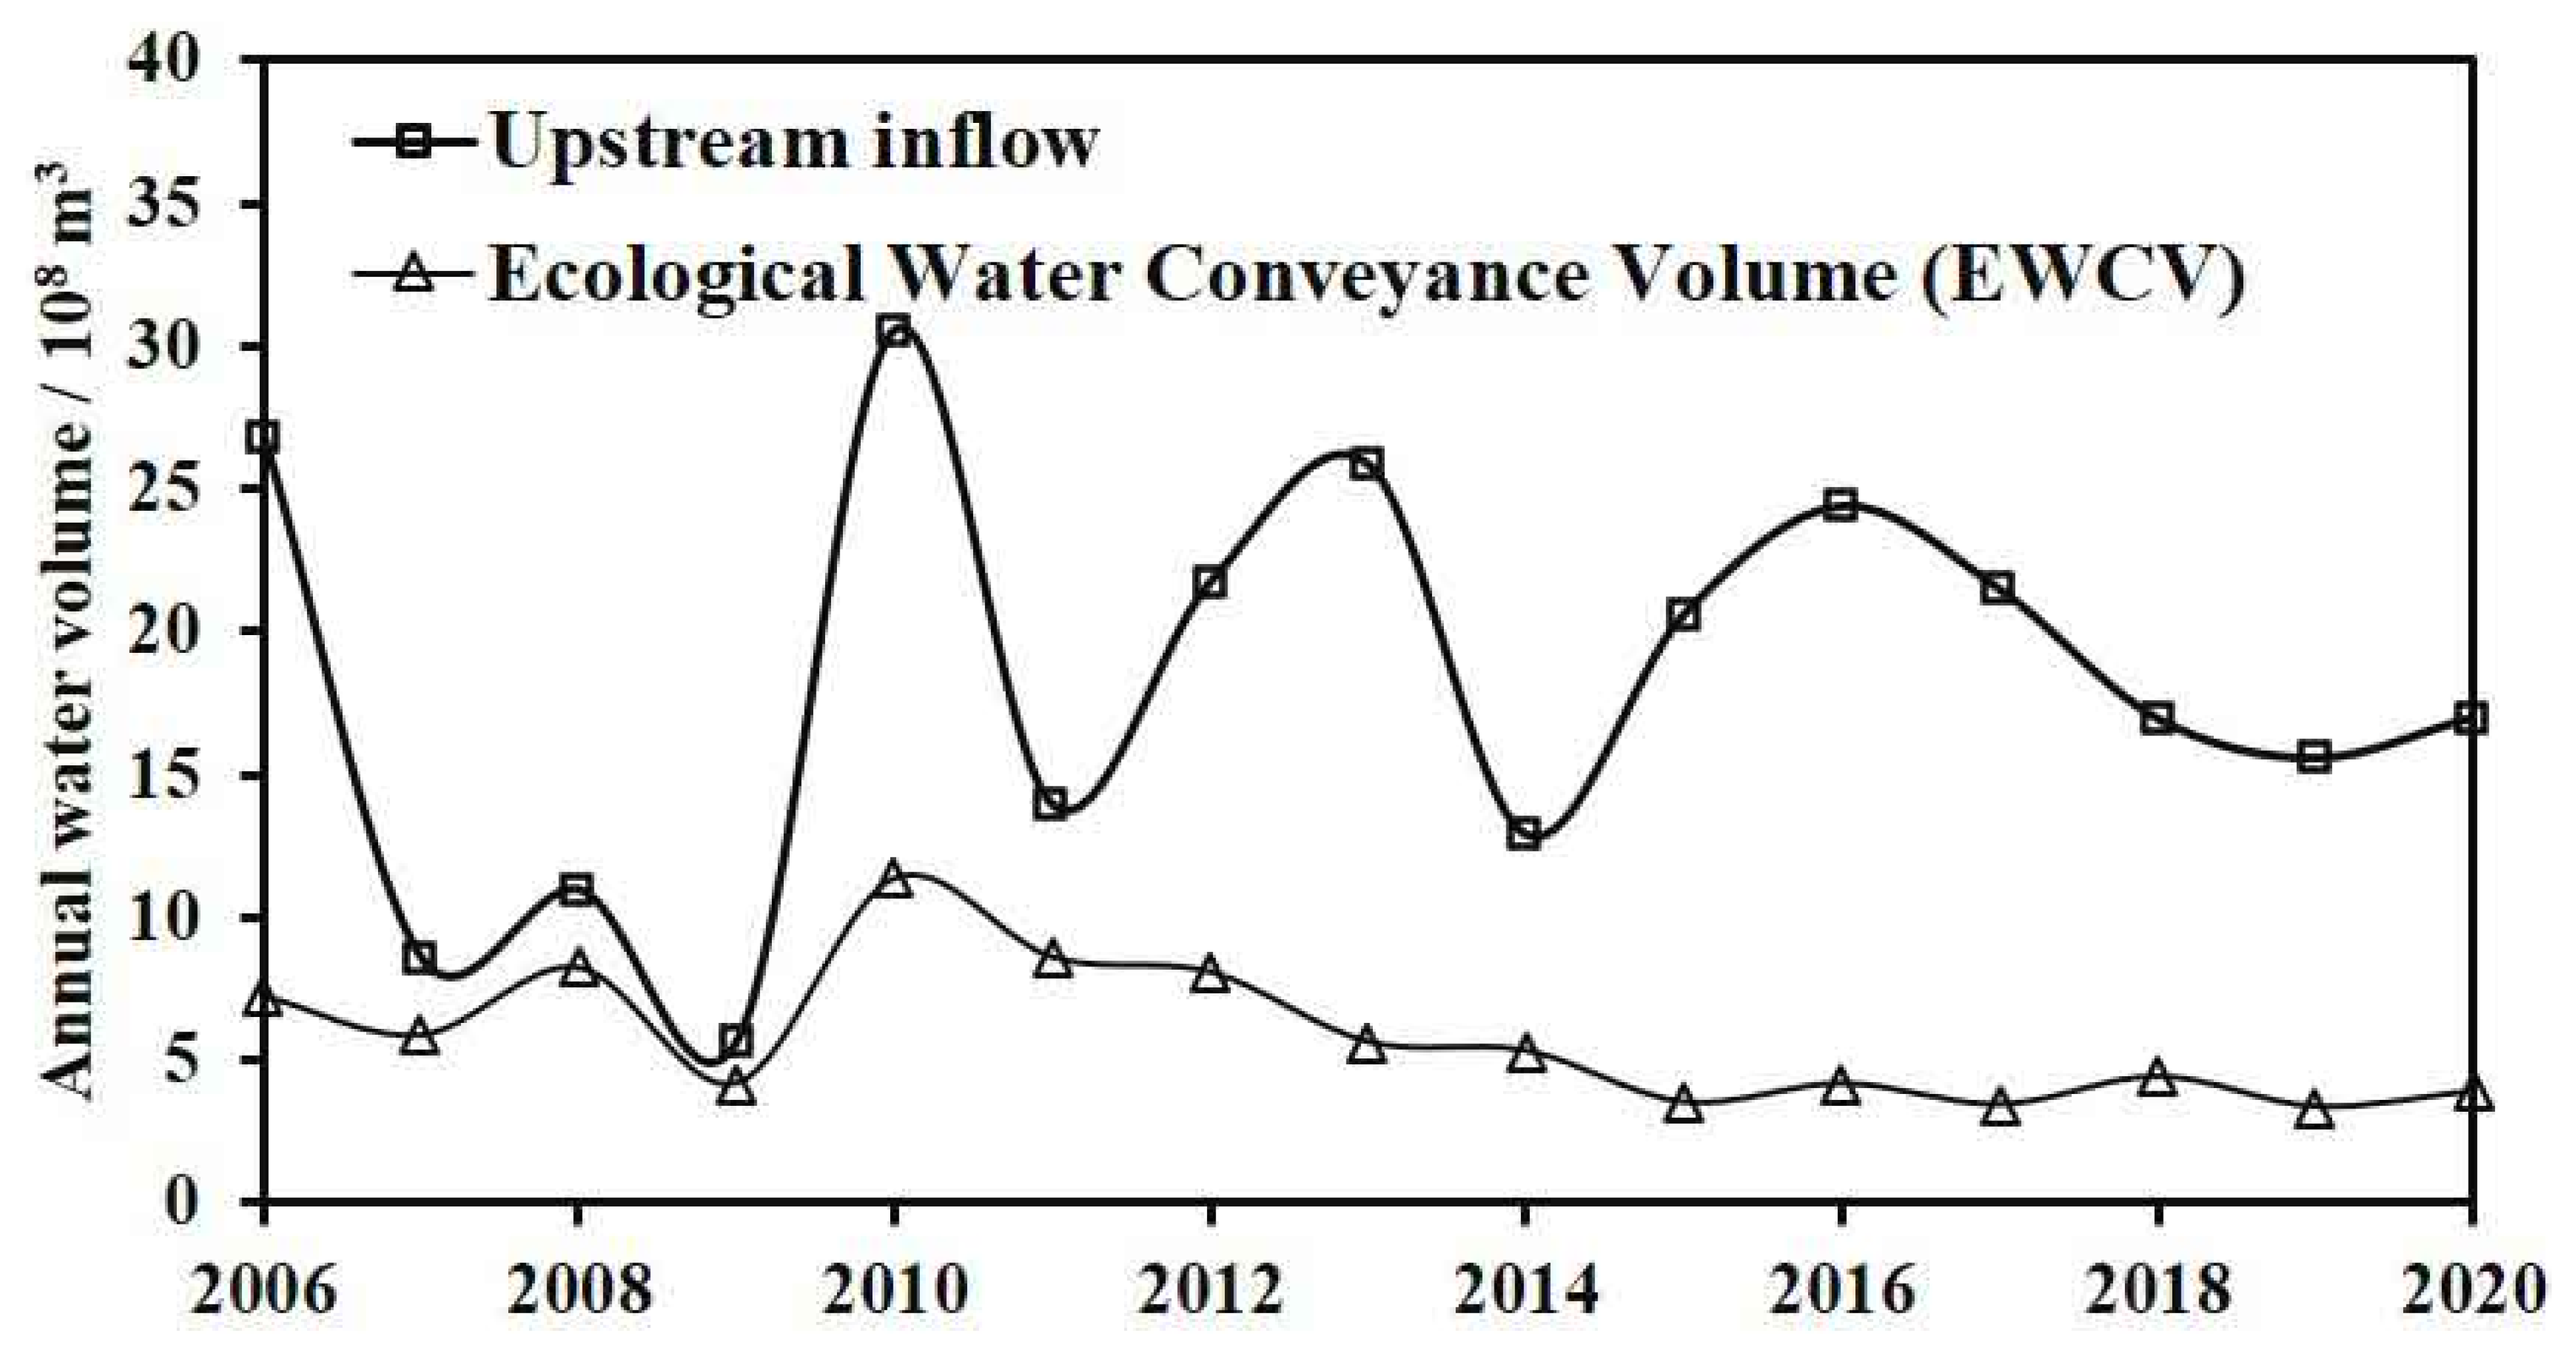
Hydrological analysis was restricted to 2006–2020. During this period, upstream inflow, environmental flow release, and river-section water consumption varied considerably among years. During 2006–2020, the cumulative upstream inflow was 27.417 × 10⁹ m3, and the cumulative river-section water consumption or transmission loss was 8.894 × 10⁹ m3. River-section water consumption was calculated as the difference between upstream inflow and downstream outflow and therefore represents in-reach transmission loss and water consumption rather than direct vegetation water use. These values were checked against the original hydrological records and are reported with consistent units and definitions. Distinguishing these hydrological quantities is necessary because water accounting and allocation efficiency strongly affect environmental-flow outcomes in arid basins [5,11,27].
The annual water-consumption series showed a decreasing tendency from 2010 to 2015 and a more stable pattern from 2015 to 2020. This pattern suggests that the hydrological efficiency of environmental flow release may have changed over time, possibly due to channel conditions, groundwater storage, antecedent moisture, or flow-routing losses (Figure 3).
Figure 3.
Annual upstream inflow, environmental flow release, and river-section water consumption in the Hotan River desert reach during 2006–2020. Upstream inflow refers to the annual water volume entering the upper boundary of the desert section, whereas environmental flow release refers to the ecological water volume allocated to maintain riparian vegetation and groundwater-dependent ecosystems in the study reach. Hydrological analysis was restricted to 2006–2020 because flow and groundwater records were only available for this period. Annual upstream inflow and EWCV are expressed in 108 m3 yr−1. Data were obtained from hydrological monitoring records for 2006–2020.
3.3. Groundwater-Depth Response and Vegetation Linkage
Groundwater response was evaluated using monitoring-well data for 2006–2020. Based on the original analysis, average groundwater depth along the downstream channel showed an overall trend coefficient of approximately 0.2106. Because the groundwater monitoring record was limited, the trend coefficient was interpreted as a descriptive indicator of groundwater change rather than as a spatially complete estimate. Previous studies indicate that groundwater-dependent vegetation in arid inland basins is sensitive to groundwater depth and recharge conditions, but response thresholds are often scale-dependent and site-specific [8,10,14].
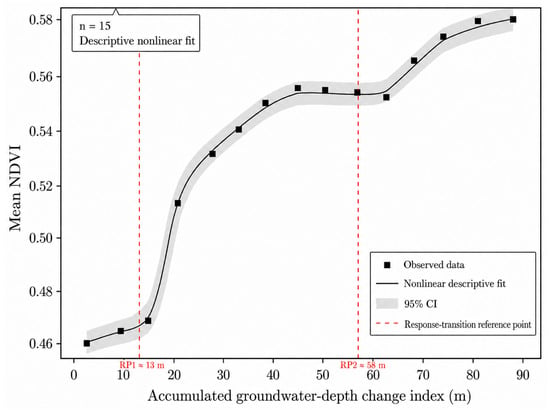
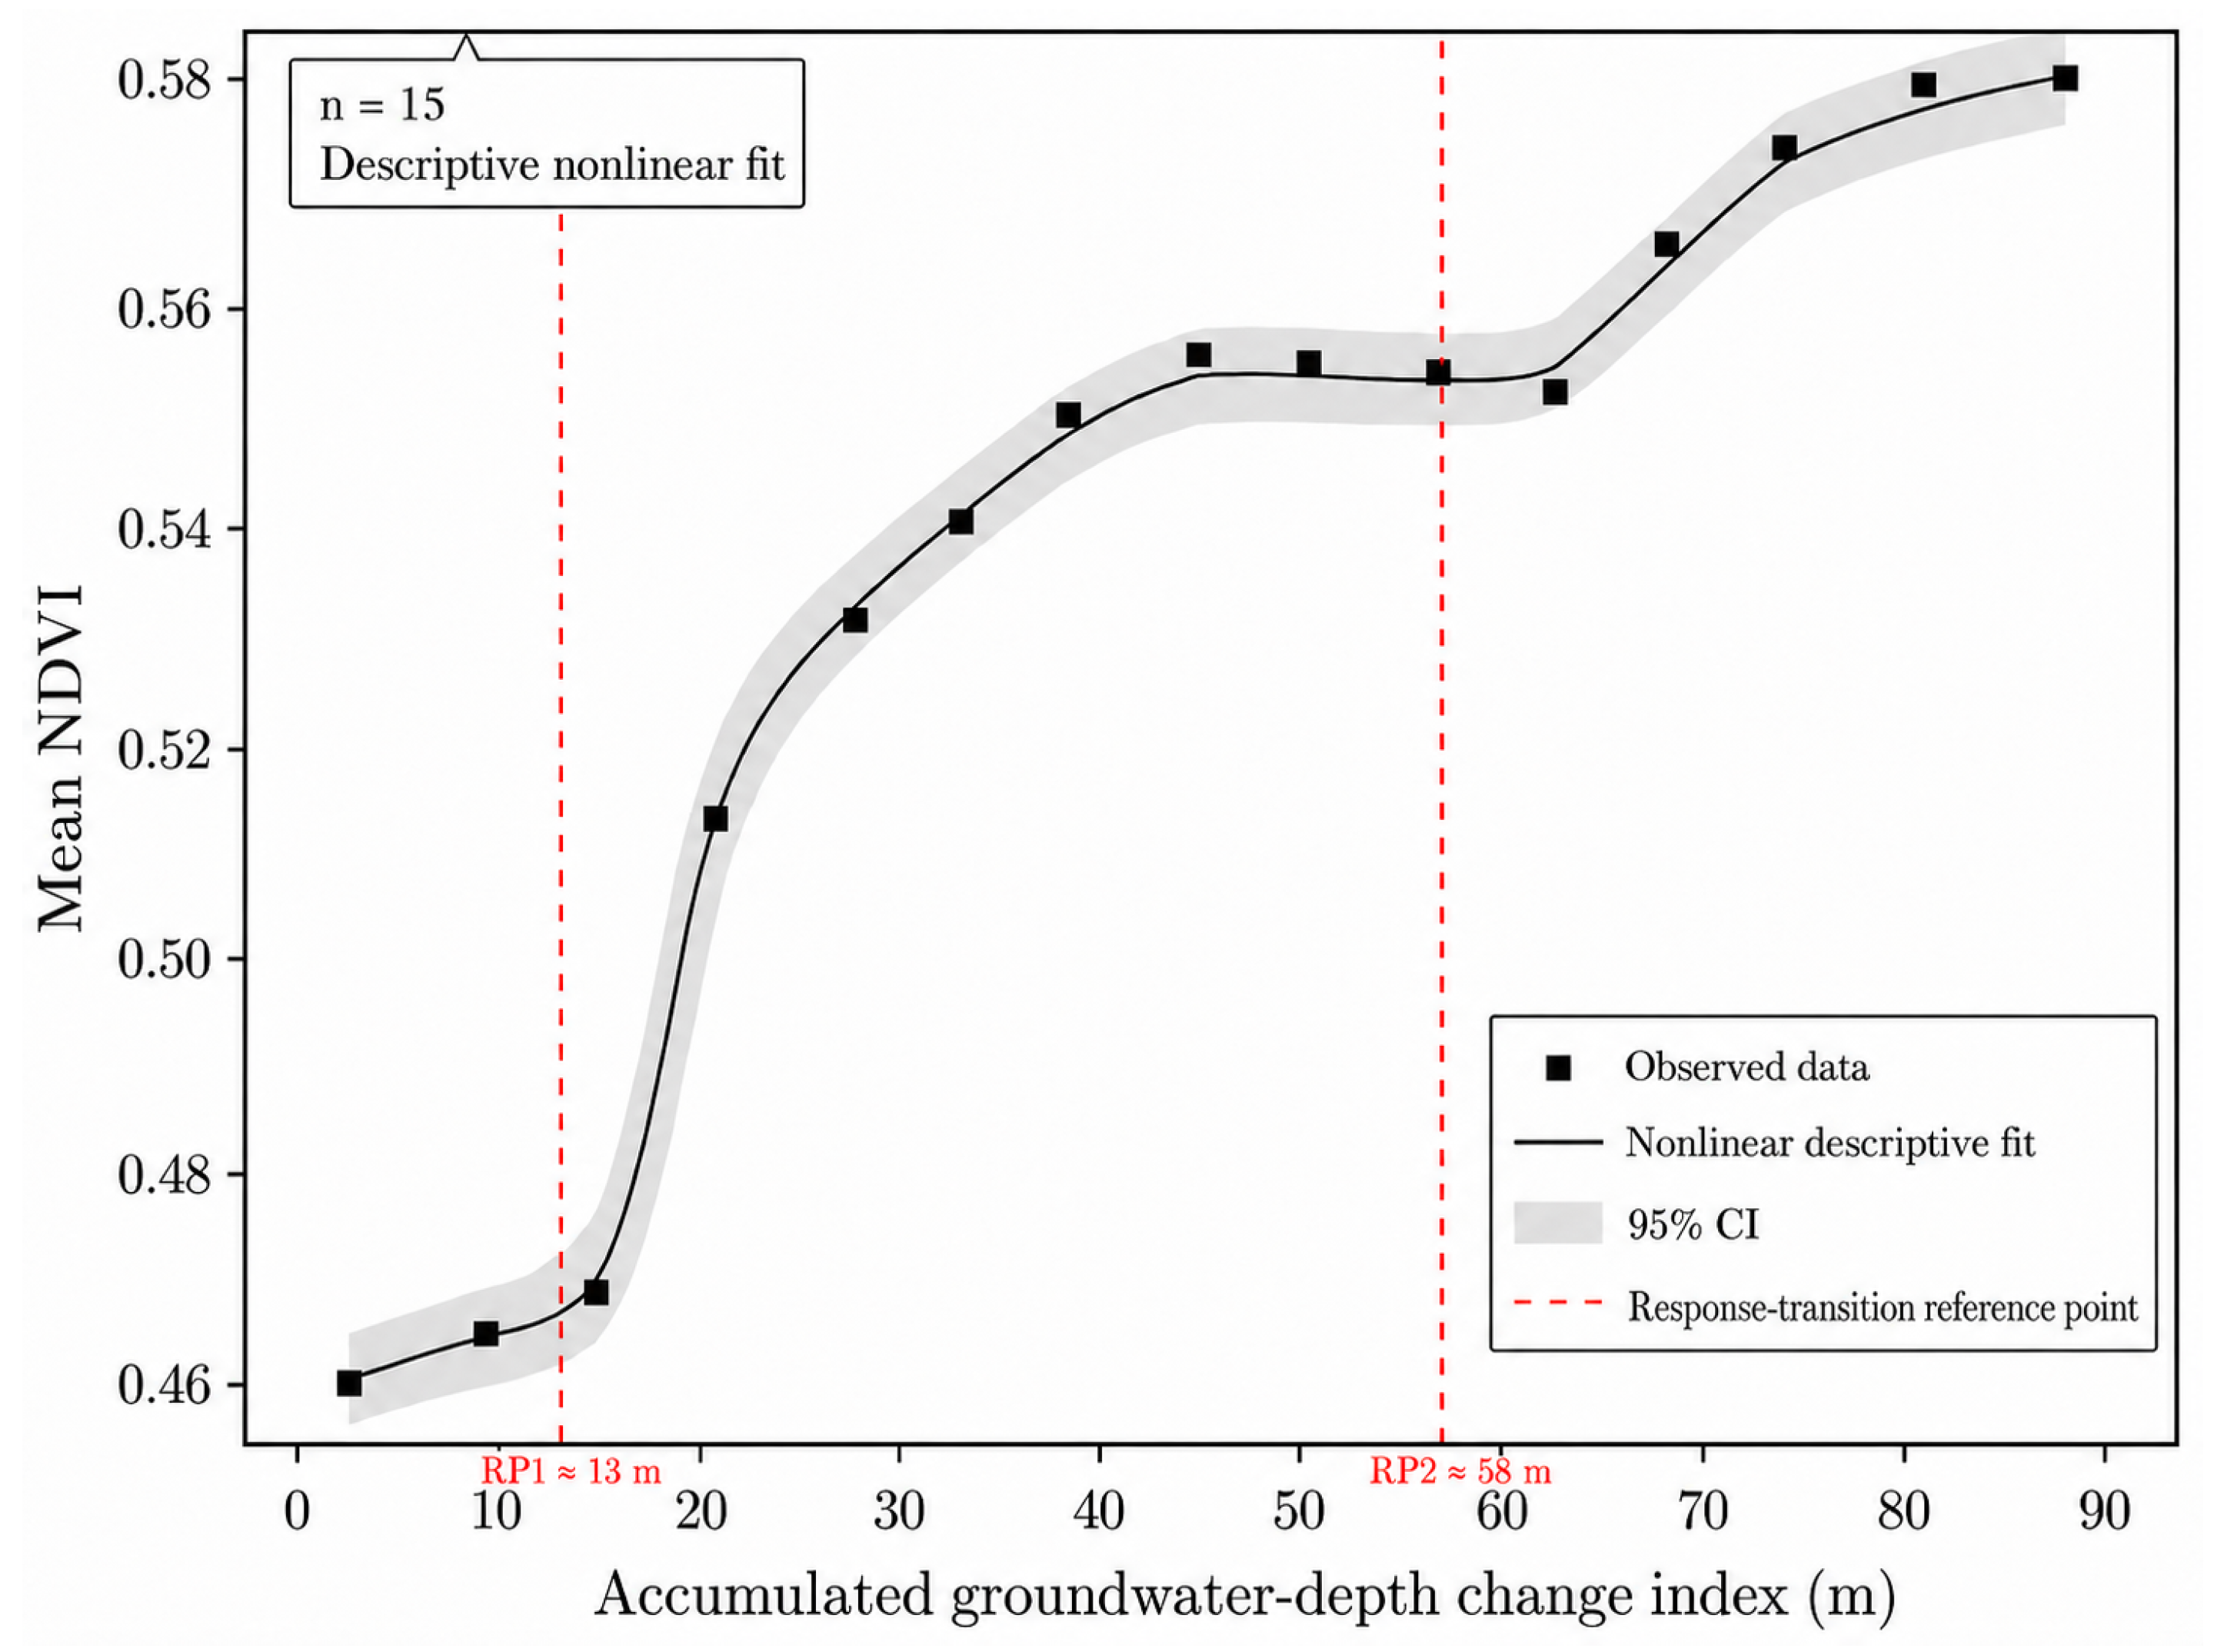
The fitted parameters of the descriptive nonlinear NDVI response model were A = 0.455, B = 3.015, C = 27.128, and D = 0.572. These parameters were used only to describe the shape of the observed NDVI response curve. Because the model was fitted using only 15 annual observations, the parameters were not used for prediction or extrapolation beyond the observed data range. The relationship between mean NDVI and accumulated groundwater-depth change index showed a descriptive nonlinear pattern during 2006–2020 (Figure 4). Mean NDVI increased slowly at low accumulated groundwater-depth change index, rose more rapidly after approximately 13 m, and then showed a tendency toward saturation after approximately 58 m. These two values were therefore identified as response-transition reference points rather than fixed ecological thresholds. The first reference point (RP1 ≈ 13 m) indicates the approximate range where NDVI began to increase more rapidly, whereas the second reference point (RP2 ≈ 58 m) indicates the range where the marginal increase in NDVI weakened. Because these points were derived from a fitted response curve and the analysis was based on only 15 annual observations, they should be interpreted as descriptive reference ranges within the observed data rather than as statistically fixed management thresholds.
Figure 4.
Descriptive nonlinear response of mean NDVI to the accumulated groundwater-depth change index in the Hotan River desert reach during 2006–2020.
3.4. Vegetation-Area Response to Cumulative Environmental Flow Release
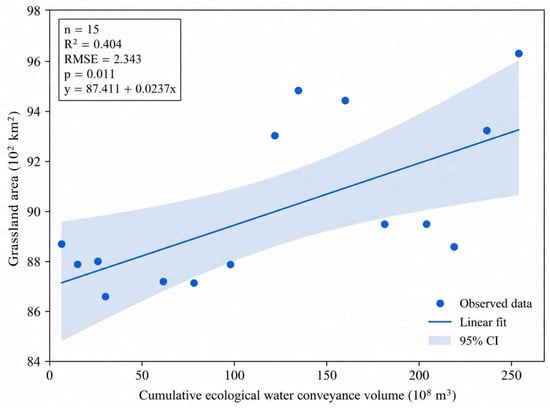
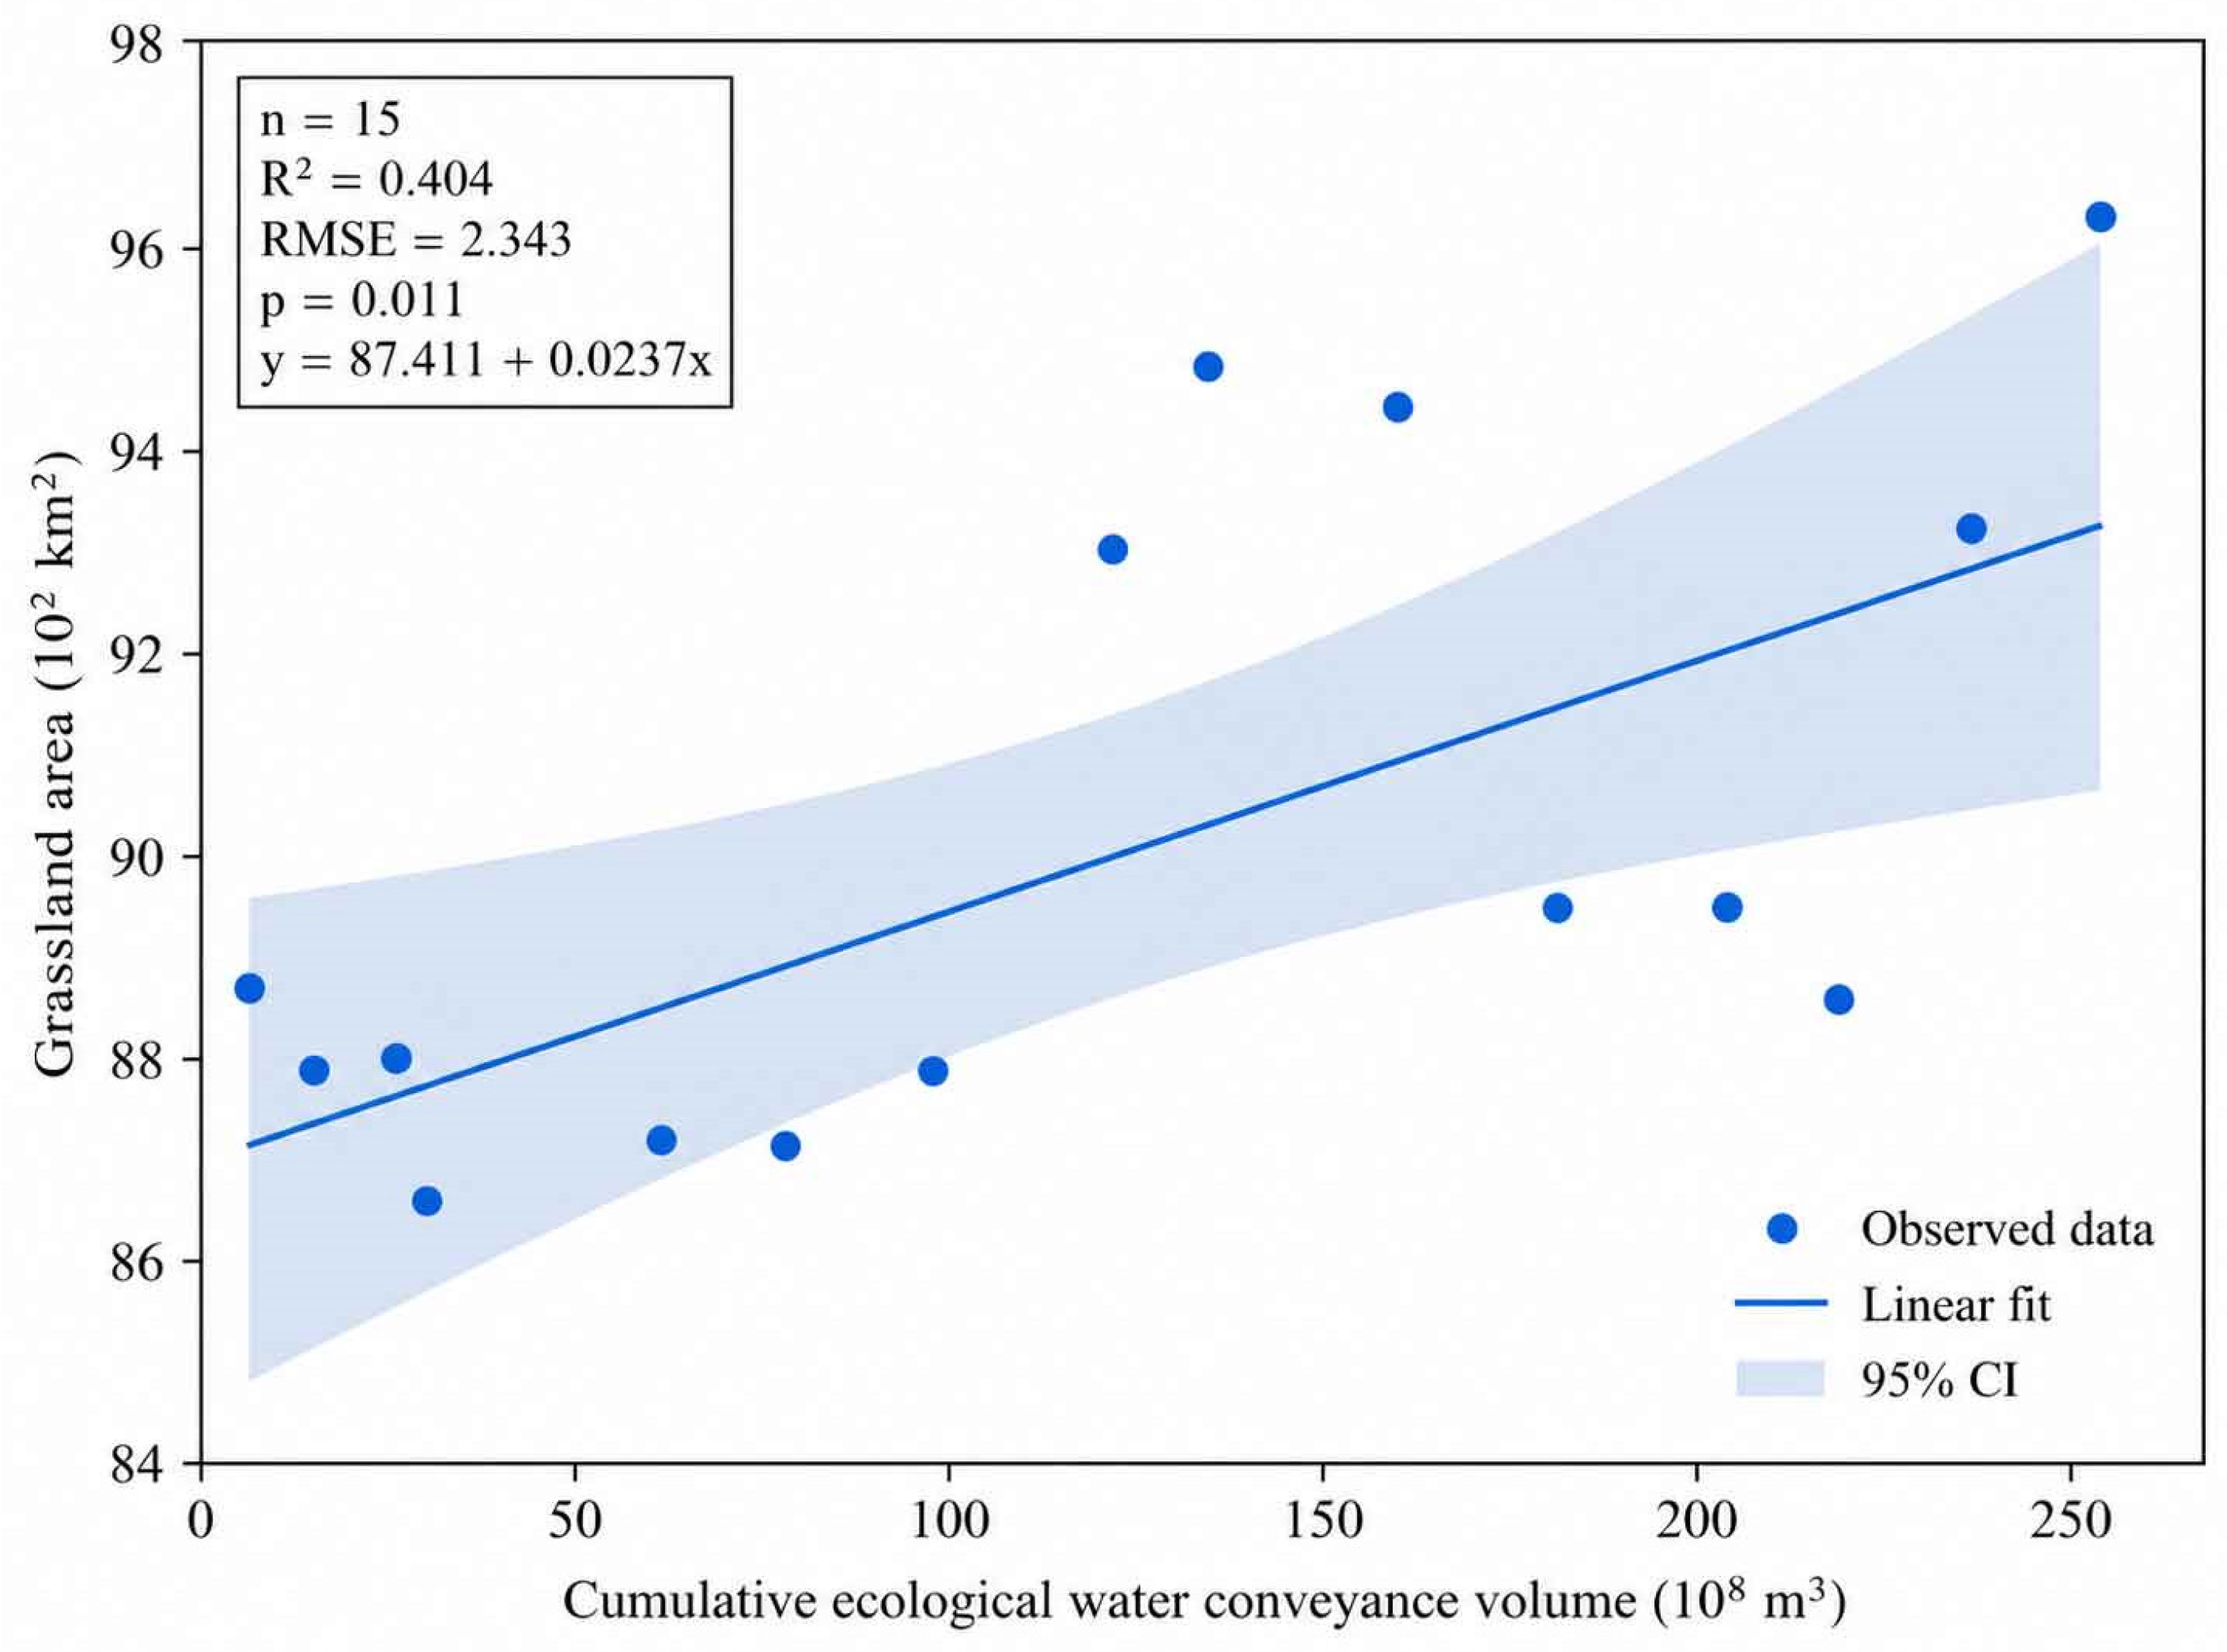
To directly address the uncertainty associated with nonlinear fitting under a limited sample size, linear regression was added as the baseline analysis for vegetation response to CEWCV during 2006–2020. Grassland area increased significantly with CEWCV (Figure 5), with R2 = 0.404, RMSE = 2.343, p = 0.011, and the fitted equation y = 87.411 + 0.0237x. This result indicates a positive but moderate association between cumulative environmental flow release and grassland-area expansion.
Figure 5.
Linear relationship between cumulative ecological water conveyance volume (CEWCV) and grassland area in the Hotan River desert reach during 2006–2020. Points represent annual observations, the solid line represents the fitted linear regression, and the shaded band indicates the 95% confidence interval.
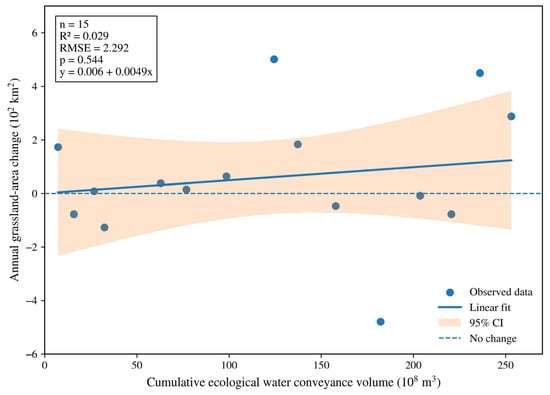
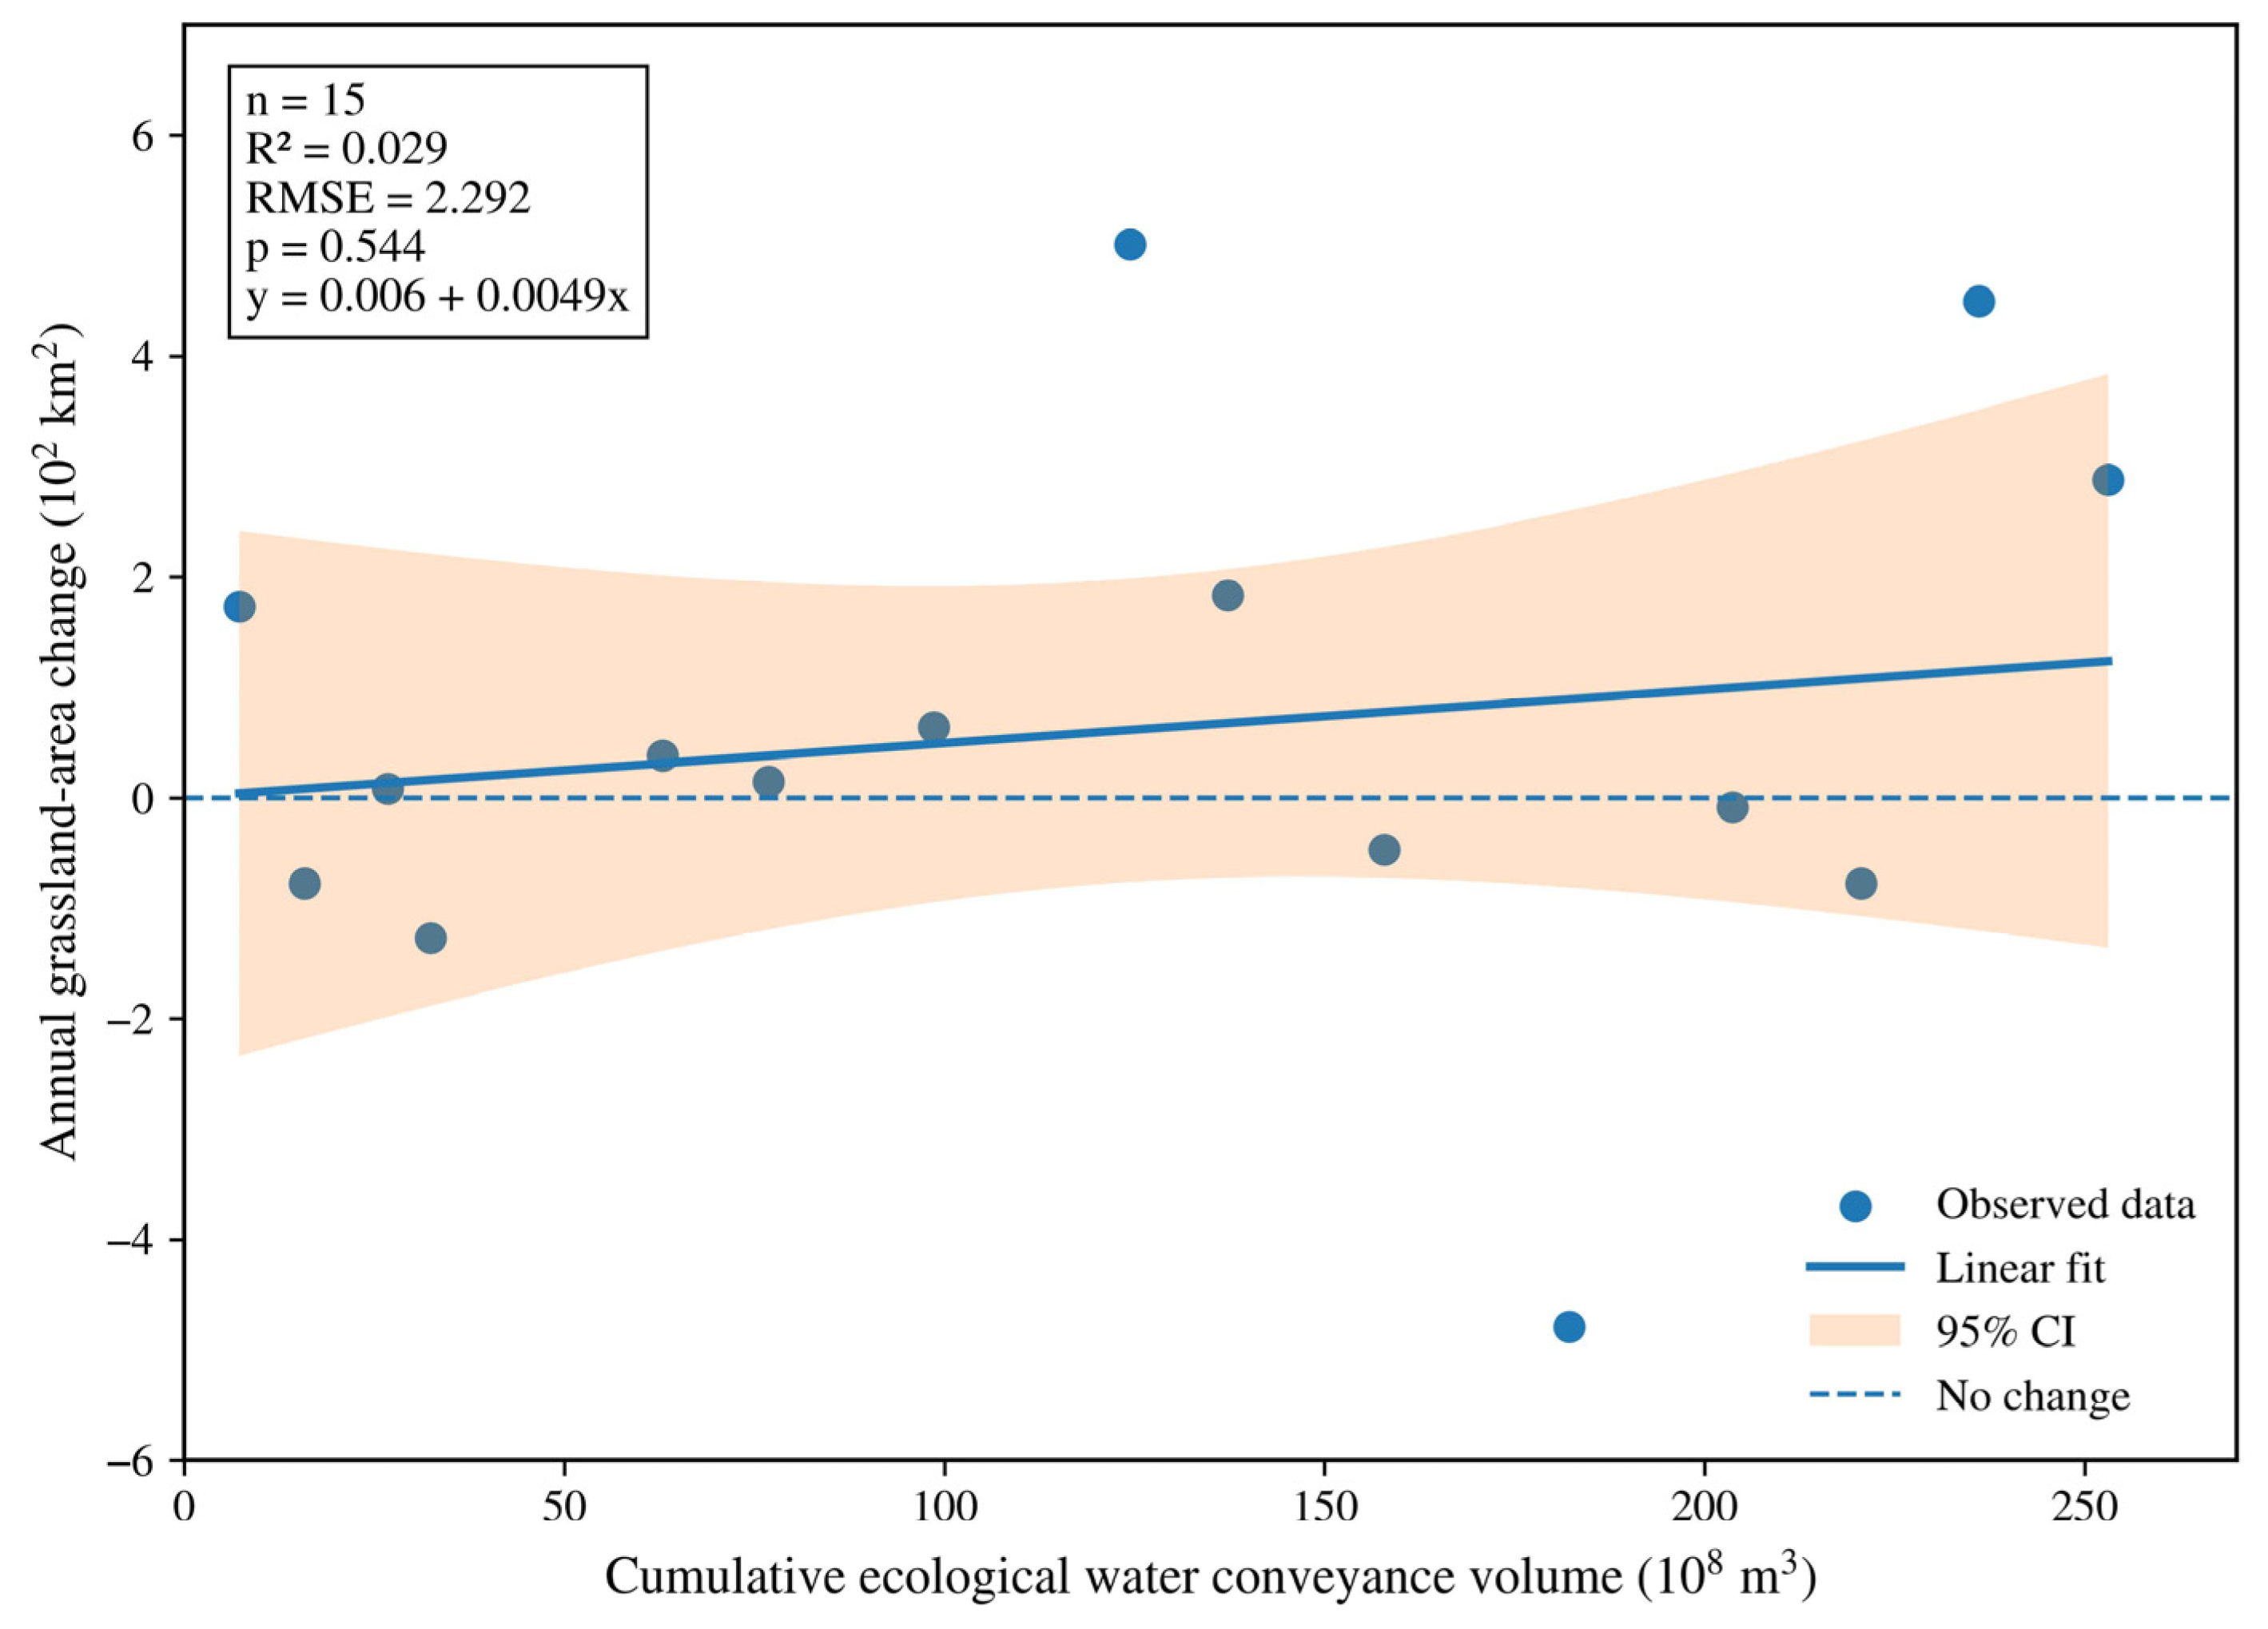
Annual grassland-area change showed a much weaker and statistically insignificant relationship with CEWCV (Figure 6), with R2 = 0.029, RMSE = 2.292, p = 0.544, and the fitted equation y = 0.006 + 0.0049x. Therefore, interannual grassland-area fluctuations cannot be explained by CEWCV alone. These fluctuations were likely influenced by additional factors such as groundwater response, channel transmission loss, antecedent moisture conditions, vegetation type, salinity, and distance from the active river channel.
Figure 6.
Relationship between cumulative ecological water conveyance volume (CEWCV) and annual grassland-area change in the Hotan River desert reach during 2006–2020. Points represent annual observations, the solid line represents the fitted linear regression, the shaded band indicates the 95% confidence interval, and the dashed horizontal line indicates no change in grassland area.
3.5. Spatial Heterogeneity and Vulnerable Vegetation Zones
Spatial analysis indicated that vegetation conditions were generally better near the upper and lower parts of the desert reach and poorer in the middle reach. The vulnerable vegetation zone was located approximately 15–115 km downstream of the confluence. This pattern may reflect a combination of channel transmission loss, local groundwater depth, distance from the active river channel, soil texture, and vegetation type. NDVI was highest within the 0.25–0.75 km distance band from the riverbank, moderate within 0.75–2.00 km, and lowest beyond 2.00 km. These results confirm that distance bands and monitoring sections are important spatial units for interpreting vegetation heterogeneity along the desert river corridor.
4. Discussion
4.1. Comparison with Previous Studies
Previous studies in the lower Tarim River have shown that ecological water conveyance can promote riparian vegetation restoration and improve vegetation greenness after managed water delivery [8,9]. Similar cumulative ecohydrological responses have also been reported in arid inland river corridors, where vegetation recovery is influenced not only by the total amount of released water but also by antecedent hydrological conditions and cumulative engineering effects [14,15]. Consistent with these studies, our Landsat-based results showed an overall improvement in vegetation cover in the Hotan River desert reach from the early remote-sensing period to 2020. This agreement suggests that managed environmental flow releases can contribute to riparian vegetation recovery in extremely arid inland river corridors, especially when they help maintain near-channel soil moisture and shallow groundwater conditions.
Groundwater has been widely recognized as a key mediator of vegetation response to ecological water conveyance in arid inland basins [10]. Previous studies also indicated that vegetation response to ecological water delivery is mediated by groundwater recharge, channel transmission processes, and water-delivery efficiency rather than by release volume alone [12]. In the present study, the hydrological-response analysis was restricted to 2006–2020 because groundwater and flow observations were available only for this period. Within this observation window, the descriptive NDVI response curve and the positive relationship between CEWCV and grassland area indicate that vegetation improvement was associated with cumulative hydrological inputs. However, this relationship should be interpreted as an exploratory association rather than a strong causal or predictive relationship because of the limited annual sample size.
Compared with previous studies that mainly focused on the lower Tarim River or on basin-scale ecological water conveyance effects, this study provides a reach-scale analysis for the Hotan River desert reach, a seasonal river crossing the Taklimakan Desert [8,9]. The results highlight a spatially heterogeneous response pattern, with a relatively vulnerable vegetation zone approximately 15–115 km downstream of the river confluence. This spatial heterogeneity is consistent with previous findings that vegetation response in arid river corridors depends on hydrological connectivity, groundwater accessibility, and local environmental conditions [10,15]. In addition, the revised statistical analysis uses linear regression as the baseline model and treats nonlinear response points as descriptive reference ranges because of the limited sample size. Therefore, the contribution of this study lies not in proposing ecological water conveyance as a new concept, but in providing a cautious reach-scale synthesis that links long-term Landsat vegetation mapping with monitored environmental flow releases and groundwater observations in the Hotan River desert reach.
4.2. Ecohydrological Interpretation of Environmental Flow Releases
Figure 5 shows that grassland area increased significantly with CEWCV, but the moderate R2 indicates that CEWCV alone explained only part of the spatial and temporal vegetation variation. Figure 6 further shows that annual grassland-area change was not significantly related to CEWCV. This contrast suggests that cumulative water delivery contributed to long-term vegetation improvement, whereas interannual vegetation-area fluctuations were jointly regulated by groundwater response, channel transmission loss, antecedent moisture, soil salinity, vegetation type, and distance from the active river channel.
Environmental flow releases can benefit desert riparian vegetation by increasing near-channel soil moisture, recharging shallow groundwater, and maintaining suitable conditions for drought-tolerant species. However, the response is not instantaneous or spatially uniform. In the Hotan River desert reach, vegetation conditions were better near the upper and terminal parts of the corridor, whereas the 15–115 km zone downstream of the confluence appeared more vulnerable. Such spatial heterogeneity is consistent with the idea that river restoration outcomes depend on hydrological connectivity, local geomorphology, groundwater accessibility, and plant community composition [18,29,32].
The finding that NDVI correlates more strongly with river-section water consumption than with upstream inflow is hydrologically meaningful if water consumption reflects actual seepage, bank storage, and evapotranspiration within the target reach. However, this interpretation requires a transparent water-balance definition. If the reported release volume is measured upstream, then it may overestimate the water actually received by the desert vegetation corridor because transmission losses can be substantial in dry channels. Future scheduling should therefore consider not only total release volume but also release timing, pulse duration, channel losses, and groundwater response efficiency [12,28,33].
4.3. Statistical Limitations and Uncertainty
The main limitation of this study is the mismatch between the long remote-sensing record and the shorter hydrological monitoring record. A second limitation is the small sample size for annual hydrological-regression analysis. Therefore, linear regression was added as a baseline comparison, and the high-order polynomial was not used for the main inference. The updated results show that CEWCV was significantly associated with grassland area (R2 = 0.404, p = 0.011), whereas annual grassland-area change was not significantly explained by CEWCV alone (R2 = 0.029, p = 0.544). This contrast indicates that cumulative water delivery may support long-term vegetation-area improvement, but year-to-year vegetation changes are controlled by multiple hydrological and ecological factors.
The accumulated groundwater-depth change index should be interpreted as an empirical response indicator rather than as a physically cumulative groundwater-depth variable. The response-transition reference points shown in Figure 4 should be interpreted cautiously. Although RP1 and RP2 help describe the observed shape of the NDVI response curve, they were not estimated using formal breakpoint regression and were based on a short annual record. Therefore, they should not be treated as fixed ecological thresholds. Instead, they provide adaptive reference ranges for understanding when vegetation response may begin to strengthen or become less sensitive to additional groundwater-related improvement.
5. Conclusions
This study clarified the long-term vegetation dynamics in the desert section of the Hotan River and further examined their ecohydrological responses to environmental flow releases and groundwater variation. By distinguishing long-term NDVI-based vegetation changes from the shorter-term hydrological observation period, the results provide a more transparent understanding of how vegetation recovery has responded to managed water releases since 2006. Overall, the findings highlight the importance of groundwater regulation, river-section water consumption, and cumulative hydrological effects in sustaining riparian vegetation in extremely arid inland river basins. The main conclusions are as follows:
- (1)
- The revised study separates the temporal coverage of different data sources. Landsat-derived vegetation change is analyzed for 1985–2020, whereas environmental flow release, water consumption, and groundwater-response analyses are restricted to 2006–2020. This correction removes the unsupported claim of a full 40-year ecohydrological analysis.
- (2)
- Managed water delivery in the Hotan River desert reach should be described as environmental flow release or managed pulse flow. The manuscript now distinguishes among upstream release volume, delivered flow volume, and river-section water consumption or transmission loss, which improves comparability with international environmental-flow literature.
- (3)
- Vegetation cover improved overall from the early remote-sensing period to 2020, but the response was spatially heterogeneous. Vegetation conditions were better near the upper and terminal parts of the desert reach, while a vulnerable zone occurred approximately 15–115 km downstream of the confluence.
- (4)
- During 2006–2020, grassland area showed a positive linear relationship with cumulative ecological water conveyance volume, whereas annual grassland-area change was not significantly explained by CEWCV alone. This indicates that cumulative environmental flow release supported long-term vegetation improvement, but interannual vegetation-area fluctuations were mediated by groundwater response, channel losses, antecedent moisture, vegetation type, salinity, and distance from the active river channel.
- (5)
- The fitted NDVI response curve suggested two response-transition reference ranges at approximately 13 m and 58 m of the accumulated groundwater-depth change index. These values indicate possible changes in vegetation-response sensitivity, but they should be interpreted as descriptive reference points rather than fixed ecological thresholds because of the limited sample size.
Author Contributions
Conceptualization, B.C. and M.L.; methodology, B.C. and J.W.; software, M.L. and J.W.; validation B.C. and J.W.; formal analysis, B.C.; investigation, B.C. and M.L.; resources, B.C.; data curation, B.C. and M.L.; writing—original draft preparation, B.C. and M.L.; writing—review and editing, C.H.; visualization, B.C.; supervision, Z.L.; project administration, C.H.; funding acquisition, B.C. All authors have read and agreed to the published version of the manuscript.
Funding
This work was funded by Key Research and Development Project in the Autonomous Region: Key Technological Research on Flood Resource Utilization in Typical Basins in Xinjiang under Changing Environments (2023B02044–3); Basic Scientific Research Operating Fund for Non-profit Research Institutes of Xinjiang Uygur Autonomous Region: Research on Mechanism and Prediction of Typical Glacial Meltwater Runoff on the Northern Slope of Kunlun Mountains (KY2025102); Major Science and Technology Project of Xinjiang Autonomous Region: Technology Integration and Demonstration for High-Quality Development of Ecological Agriculture in Tailan River Irrigation District (Project No. 2023A02002–5).
Data Availability Statement
The data presented in this study are available on request from the corresponding author due to their continued use in other ongoing research projects.
Conflicts of Interest
The authors declare no conflicts of interest.
References
- DeNicola, E.; Aburizaiza, O.S.; Siddique, A.; Khwaja, H.; Carpenter, D.O. Climate change and water scarcity: The case of Saudi Arabia. Ann. Glob. Health 2015, 81, 342–353. [Google Scholar] [CrossRef] [Scilit] [PubMed]
- Liu, Y.; Chen, Y. Impact of population growth and land-use change on water resources and ecosystems of the arid Tarim River Basin in Western China. Int. J. Sustain. Dev. World. Ecol. 2006, 13, 295–305. [Google Scholar] [CrossRef] [Scilit]
- Zhang, D.; Sial, M.S.; Ahmad, N.; Filipe, A.J.; Thu, P.A.; Zia-Ud-Din, M.; Caleiro, A.B. Water scarcity and sustainability in an emerging economy: A management perspective for future. Sustainability 2020, 13, 144. [Google Scholar] [CrossRef] [Scilit]
- Li, T.; Singh, R.K.; Cui, L.; Xu, Z.; Pandey, R.; Liu, Y.; Wang, Y. Managing multiple stressors for sustainable livelihoods in dryland ecosystems: Insights and entry points for resource management. Land. Degrad. Dev. 2024, 35, 968–984. [Google Scholar]
- Cosgrove, W.J.; Loucks, D.P. Water management: Current and future challenges and research directions. Water Resour. Res. 2015, 51, 4823–4839. [Google Scholar] [CrossRef] [Scilit]
- Poff, N.L.; Brown, C.M.; Grantham, T.E.; Matthews, J.H.; Palmer, M.A.; Spence, C.M.; Baeza, A. Sustainable water management under future uncertainty with eco-engineering decision scaling. Nat. Clim. Change 2016, 6, 25–34. [Google Scholar]
- Link, P.M.; Scheffran, J.; Ide, T. Conflict and cooperation in the water-security nexus: A global comparative analysis of river basins under climate change. WIREs Water 2016, 3, 495–515. [Google Scholar] [CrossRef] [Scilit]
- Bao, A.; Huang, Y.; Ma, Y.; Guo, H.; Wang, Y. Assessing the effect of EWDP on vegetation restoration by remote sensing in the lower reaches of Tarim River. Ecol. Indic. 2017, 74, 261–275. [Google Scholar] [CrossRef] [Scilit]
- Sun, Z.; Chang, N.B.; Opp, C.; Hennig, T. Evaluation of ecological restoration through vegetation patterns in the lower Tarim River, China with MODIS NDVI data. Ecol. Inform. 2011, 6, 156–163. [Google Scholar] [CrossRef] [Scilit]
- Huang, F.; Chunyu, X.; Zhang, D.; Chen, X.; Ochoa, C.G. A framework to assess the impact of ecological water conveyance on groundwater-dependent terrestrial ecosystems in arid inland river basins. Sci. Total Environ. 2020, 709, 136155. [Google Scholar] [CrossRef] [Scilit] [PubMed]
- Guo, J.; Xu, H.; Zhang, G.; Yuan, K.; Ling, H. The Enhanced Management of Water Resources Improves Ecosystem Services in a Typical Arid Basin. Sustainability 2020, 12, 8802. [Google Scholar] [CrossRef] [Scilit]
- Liu, Q.; Dai, H.; Gui, D.; Hu, B.X.; Ye, M.; Wei, G.; Zhang, J. Evaluation and optimization of the water diversion system of ecohydrological restoration megaproject of Tarim River, China, through wavelet analysis and a neural network. J. Hydrol. 2022, 608, 127586. [Google Scholar] [CrossRef] [Scilit]
- Qian, K.; Ma, X.; Yan, W.; Li, J.; Xu, S.; Liu, Y.; Wang, Y. Trade-offs and synergies among ecosystem services in Inland River Basins under the influence of ecological water conveyance project: A case study on the Tarim River basin. Sci. Total Environ. 2024, 908, 168248. [Google Scholar] [CrossRef] [Scilit] [PubMed]
- Liao, S.; Xue, L.; Dong, Z.; Zhu, B.; Zhang, K.; Wei, Q.; Wei, G. Cumulative ecohydrological response to hydrological processes in arid basins. Ecol. Indic. 2020, 111, 106005. [Google Scholar] [CrossRef] [Scilit]
- Wang, J.; Xue, L.; Zhou, L.; Wei, L.; Hu, S.; Wu, H.; Li, X. Cumulative ecosystem response to Hydraulic Engineering Infrastructure Projects in an arid basin. Sci. Total Environ. 2023, 856, 159110. [Google Scholar] [CrossRef] [Scilit] [PubMed]
- Zhao, Y.; Zhang, W.; Li, C.; Ma, S.; Zhang, X.; Jiang, H. Disturbances Brought about by Human Activities in Relation to the Eco-Environment of the Main Stream of the Tarim River, 2000–2020. Land 2022, 11, 424. [Google Scholar] [CrossRef] [Scilit]
- Liu, F.; Zhang, H.; Qin, Y.; Dong, J.; Xu, E.; Yang, Y.; Xiao, X. Semi-natural areas of Tarim Basin in northwest China: Linkage to desertification. Sci. Total Environ. 2016, 573, 178–188. [Google Scholar] [CrossRef] [Scilit] [PubMed]
- Hou, Y.; Chen, Y.; Ding, J.; Li, Z.; Li, Y.; Sun, F. Ecological impacts of land use change in the arid Tarim River Basin of China. Remote Sens. 2022, 14, 1894. [Google Scholar] [CrossRef] [Scilit]
- Chuvieco, E. Fundamentals of Satellite Remote Sensing: An Environmental Approach; CRC Press: Boca Raton, FL, USA, 2020. [Google Scholar]
- Toth, C.; Jóźków, G. Remote sensing platforms and sensors: A survey. ISPRS J. Photogramm. Remote Sens. 2016, 115, 22–36. [Google Scholar] [CrossRef] [Scilit]
- Sheffield, J.; Wood, E.F.; Pan, M.; Beck, H.; Coccia, G.; Serrat-Capdevila, A.; Verbist, K. Satellite remote sensing for water resources management: Potential for supporting sustainable development in data-poor regions. Water Resour. Res. 2018, 54, 9724–9758. [Google Scholar] [CrossRef] [Scilit]
- Wang, K.; Franklin, S.E.; Guo, X.; Cattet, M. Remote sensing of ecology, biodiversity and conservation: A review from the perspective of remote sensing specialists. Sensors 2010, 10, 9647–9667. [Google Scholar] [CrossRef] [Scilit] [PubMed]
- Reif, M.K.; Theel, H.J. Remote sensing for restoration ecology: Application for restoring degraded, damaged, transformed, or destroyed ecosystems. Integr. Environ. Assess. Manag. 2017, 13, 614–630. [Google Scholar] [PubMed]
- Zhao, J.; Chen, X.; Bao, A.; Zhang, C.; Shi, W. A method for choice of optimum scale on land use monitoring in Tarim River Basin. J. Geogr. Sci. 2009, 19, 340–350. [Google Scholar] [CrossRef] [Scilit]
- Palmer, M.; Allan, J.D.; Meyer, J.; Bernhardt, E.S. River restoration in the twenty-first century: Data and experiential knowledge to inform future efforts. Restor. Ecol. 2007, 15, 472–481. [Google Scholar] [CrossRef] [Scilit]
- Gumiero, B.; Mant, J.; Hein, T.; Elso, J.; Boz, B. Linking the restoration of rivers and riparian zones/wetlands in Europe: Sharing knowledge through case studies. Ecol. Eng. 2013, 56, 36–50. [Google Scholar] [CrossRef] [Scilit]
- Wang, X.C.; Zhang, C.; Ma, X.; Luo, L. Water Cycle Management: A New Paradigm of Wastewater Reuse and Safety Control; Springer: Heidelberg, Germany, 2015. [Google Scholar]
- Namany, S.; Al-Ansari, T.; Govindan, R. Sustainable energy, water and food nexus systems: A focused review of decision-making tools for efficient resource management and governance. J. Clean. Prod. 2019, 225, 610–626. [Google Scholar] [CrossRef] [Scilit]
- Mondal, S.; Patel, P.P. Examining the utility of river restoration approaches for flood mitigation and channel stability enhancement: A recent review. Environ. Earth Sci. 2018, 77, 195. [Google Scholar] [CrossRef] [Scilit]
- Taherdoost, H. Data collection methods and tools for research; A step-by-step guide to choose data collection technique for academic and business research projects. Int. J. Acad. Res. Manag. 2021, 10, 10–38. [Google Scholar]
- Venticinque, E.; Forsberg, B.; Barthem, R.; Petry, P.; Hess, L.; Mercado, A.; Goulding, M. An explicit GIS-based river basin framework for aquatic ecosystem conservation in the Amazon. Earth Syst. Sci. 2016, 8, 651–661. [Google Scholar] [CrossRef] [Scilit]
- Grabowski, R.C.; Surian, N.; Gurnell, A.M. Characterizing geomorphological change to support sustainable river restoration and management. WIREs Water 2014, 1, 483–512. [Google Scholar] [CrossRef] [Scilit]
- Evans, R.G.; Sadler, E.J. Methods and technologies to improve efficiency of water use. Water Resour. Res. 2008, 44, W00E04. [Google Scholar] [CrossRef] [Scilit]

Disclaimer/Publisher’s Note: The statements, opinions and data contained in all publications are solely those of the individual author(s) and contributor(s) and not of MDPI and/or the editor(s). MDPI and/or the editor(s) disclaim responsibility for any injury to people or property resulting from any ideas, methods, instructions or products referred to in the content. |
© 2026 by the authors. Licensee MDPI, Basel, Switzerland. This article is an open access article distributed under the terms and conditions of the Creative Commons Attribution (CC BY) license.