


Abstract
Soil pH is a fundamental geochemical parameter with direct implications for environmental quality, but its spatial drivers in geologically complex mountain regions remain poorly understood. This study investigated surface soil pH across 452 sites in Pingquan City, a semi-arid, lithologically heterogeneous mountainous area of Hebei Province, China. The results show that the soil in Pingquan City is predominantly alkaline, with higher pH in southwestern and northeastern areas and lower pH in the northwest. Soil pH ranged from 4.62 to 9.98, with strong positive spatial autocorrelation. Comprehensive quality assessment indicated that the overall soil quality is moderately low. GeoDetector analysis identified average annual temperature, soil texture, elevation, and bedrock lithology as dominant structural drivers, with bi-factor enhancement interactions. GeoSHAP further uncovered two local effects: precipitation exerts a positive influence on pH in carbonate-rock-dominated areas, reversing the leaching–acidification pattern; and temperature functions as a proxy variable integrating co-varying topography, parent material, and texture rather than a direct thermal driver. The combined application of spatial autocorrelation, GeoDetector, and GeoSHAP provides an effective framework for identifying spatial phenomena, discriminating dominant drivers, and explaining local variations. These findings support regional soil quality assessment and land management, and provide a geochemical baseline for safeguarding groundwater resources in mountainous regions.
1. Introduction
Soil quality plays a critical role in maintaining the health of terrestrial ecosystems and is fundamental to ensuring agricultural productivity and food security. As a key chemical parameter in soil, pH greatly influences ion exchange, nutrient transformation and availability, and pollutant mobility in the soil [1,2,3,4]. Characterizing the spatial variability of soil pH and analyzing its influencing factors are essential for advancing our knowledge of ecosystem functioning and protecting ecological health. However, studies on the spatial variability of soil pH in semi-arid climate zones remain relatively limited.
The spatial variability of soil pH exhibits pronounced regional contrasts under different environmental conditions. At the global scale, a sharp transition from alkaline to acidic regimes occurs when mean annual precipitation exceeds potential evapotranspiration. In arid and semi-arid regions, soil pH typically ranges from 7 to 9. In humid regions, it generally falls below 7 [5]. In a semi-arid catchment in eastern Australia, soil pH declines systematically with increasing elevation [6]. In China, soil pH in the eastern coastal regions ranges from 4.5 to 8.5, with a distinct decreasing trend from north to south. In mountainous regions with more forests and drylands, soil pH is relatively low, while paddy soil pH in low hilly regions is relatively high [7,8]. In the black soil regions of Heilongjiang, the average pH is 6.42, indicating weak acidity, and soil acidification is mainly observed in meadow black soil and albic black soil regions [9]. Studies in Yunnan Province show that the pH of plateau tea garden soils ranges from 4.5 to 6.0, with lower values associated with forests and drylands [10]. A national survey of farmland soil pH from 1980 to 2018 reveals that soil acidification is more prone to occur in the humid farmland regions of southern China, while the risk of alkalization is higher in the arid northern regions [11]. The spatial variability of pH is shaped by the interaction of multiple factors, among which topography, parent material, and climatic conditions have been confirmed as dominant controls on pH spatial variation in various regions [6,12]. In hilly and mountainous areas, topographic factors, such as elevation, slope, and topographic wetness index, exert strong control on soil pH by regulating water flow, material transport, and local microclimate [13,14].
Pingquan City, Hebei Province, China, is located in a semi-arid, semi-humid monsoon climate zone, characterized by mountainous and hilly terrain with fragmented landforms. Its rivers belong to both the Luan River and Liao River basins, and the region features diverse lithology. The unique geological–climatic characteristics exert profound influences on soil properties, making this area an ideal setting for investigating the mechanisms that drive pH variation in mountainous soils. Current research on the physicochemical properties of soils in Pingquan City has mainly focused on nutrients and heavy metals [15,16], while studies on the spatial variability of soil pH and its driving factors based on large sample sizes are relatively scarce. Specifically, three key questions remain unanswered: (1) What is the spatial distribution pattern of soil pH across the complex terrain of Pingquan City? (2) What is the relative importance of environmental factors such as bedrock lithology, land use, vegetation cover, and soil texture in shaping pH variability? (3) Do interactive effects among these factors exceed their individual contributions?
To address these gaps, this study integrates multi-source data, including organic matter (OM) content, particle size distribution, bedrock lithology (BL), land use and land cover (LUCC), and vegetation cover (VC). While prior studies have demonstrated the value of individual geostatistical or machine-learning approaches in characterizing soil pH spatial patterns, most existing work relies on a single methodological framework, limiting the capacity to simultaneously capture the spatial structure and the underlying driving mechanisms of soil pH variation [17,18]. Semivariance analysis and Kriging interpolation effectively reveal the spatial autocorrelation structure of soil properties, yet they offer limited insight into the causal attribution of environmental drivers [19,20]. Conversely, the Geographical Detector (GeoDetector) method can quantify the explanatory power of individual factors and their interactions on spatial heterogeneity without assuming linear relationships, but it does not incorporate spatial autocorrelation information [21]. More recently, the Shapley Additive Explanations (SHAP) framework, derived from cooperative game theory, has been introduced into digital soil mapping to interpret complex machine-learning models at both global and local scales, enabling the identification of nonlinear and threshold effects of environmental covariates on soil properties [22,23]. However, the integrated application of these complementary methods—geostatistical interpolation, spatial heterogeneity detection, and game-theory-based model interpretation—remains rare in soil pH research, particularly in semi-arid mountainous regions with complex lithological and climatic settings.
Therefore, this study employs semivariance analysis, Kriging interpolation, GeoDetector, and GeoSHAP within a unified analytical framework to examine the spatial variation and distribution patterns of soil pH in Pingquan City from multiple perspectives. This integrated approach not only maps the spatial distribution of soil pH but also provides a quantitative, multi-perspective attribution of the dominant factors and their interactive effects. The findings will provide scientific support for refined land management and ecological restoration in mountainous areas, and they may also serve as a reference for soil pH studies in mid-latitude mountainous regions with similar geological backgrounds.
2. Materials and Methods
2.1. Study Area
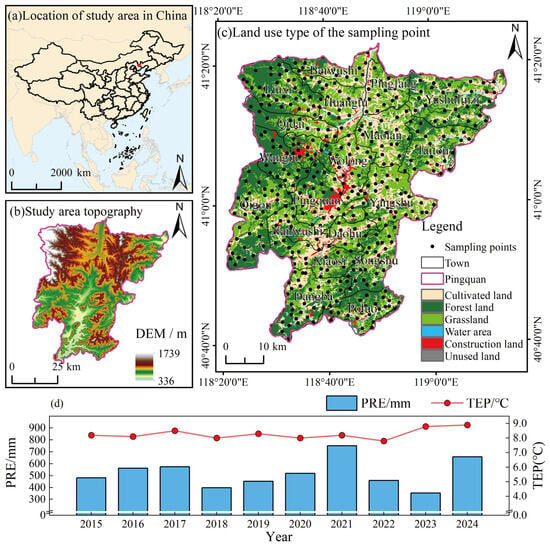
Pingquan City is located at the junction of Hebei, Tianjin and Beijing provinces and is an important ecological security barrier. Located in the northeastern part of Chengde City (Figure 1), its geographic coordinates range from 40°40′ to 41°24′ N and 118°21′ to 119°15′ E, covering a total area of 3294 km2. The city is predominantly mountainous and hilly, with the northwest consisting of middle mountains and the southeast dominated by low mountains and hills. The regional strata are mainly composed of Proterozoic and Paleozoic formations, and lithology includes carbonate rocks, limestone, gneiss, and granite, with carbonate rocks being the most widespread. The main soil types (ST) are brown soil, cinnamon soil, and paddy soil, with leached cinnamon soil and brown soil having the widest distribution. Detailed soil classification and WRB equivalents are provided in Table A1. Pingquan City has a semi-arid and semi-humid continental monsoon climate, with an average annual precipitation (PRE) of 502.7 mm that shows an increasing trend in recent years. Precipitation is unevenly distributed throughout the year, concentrated mainly in summer, especially from July to August. The average annual temperature (TEP) ranges from 7 to 9 °C, with significant daily and seasonal variations (Figure 1d). The city has relatively high overall vegetation coverage, dominated by forests followed by cultivated lands and grasslands, and it lies at the intersection of temperate deciduous broadleaf forests and coniferous–broadleaf mixed forests. The spatial distribution of sampling points across Pingquan City is shown in Figure 1, and the distribution of sampling points among different environmental factors is summarized in Table A2.
Figure 1.
Study area, sampling locations, interannual variation of precipitation and temperature: (d) Interannual variation of precipitation and temperature in Pingquan City.
Geomorphologically, the city lies within the Yanshan hilly region of northern Hebei, with its basic structural framework shaped by the Mesozoic Yanshan movement and subsequently modified by the Cenozoic Himalayan orogeny. Elevation ranges from 337 to 1722 m, decreasing northwest to southeast, with most northwestern areas exceeding 1000 m; slope gradients vary from 0° to 48°, with gentle terrain in the central valleys and steeper slopes in surrounding mountains. Bedrock lithology is diverse, broadly comprising sedimentary rocks (Quaternary loose deposits, Triassic–Cretaceous clastic rocks, and Sinian–Permian carbonate and siliciclastic sequences), igneous rocks (predominantly Jurassic–Cretaceous intermediate-acidic volcanic rocks and Precambrian intrusives), and metamorphic rocks (regional and contact types). Intermediate-acidic volcanic rocks are most extensively developed in the western and northwestern areas, while carbonate rocks dominate the south. Corresponding to this lithological and topographic diversity, soil properties show systematic spatial variation: leached cinnamon soils in middle and lower mountainous areas typically develop a thick humus layer under sustained leaching; fluvo-aquic soils on alluvial floodplains are loose-textured and support the majority of agricultural activities; and brown soils in the northwestern highlands are characterized by relatively high organic matter content.
2.2. Soil Sampling and Measurements
Sample collection and field investigations were carried out from July 2022 to August 2023, relying on the Ecological Restoration Support Survey in the Upper and Middle reaches of the Luan River Basin project. Sampling points were carefully selected based on the study area’s natural geographical conditions and regional geological background to ensure spatial uniformity, and efforts were made to avoid disturbed areas, such as field ridges and roads, with a total of 452 sampling points established across the city. The sample collection process strictly followed the Specification of Land Quality Geochemical Assessment (DZ/T0295-2016) [24]. Surface soil samples at a 0–20 cm depth were collected using an iron shovel and circular soil cutter, with 1 kg of soil taken at each point. Samples were placed in cotton bags, and stones, tree roots, and other debris were removed on-site for laboratory analysis. During collection, GPS coordinates of each sampling point were recorded, along with observations of soil thickness, color, and other characteristics.
The collected samples were sent to the Fourth Geological Brigade of the Hebei Geological and Mineral Exploration and Development Bureau for analysis. Soil pH was determined with a PHS-3C acidimeter (Shanghai INESA Scientific Instrument Co., Ltd., Shanghai, China) using a glass electrode in a 1:5 soil-to-water suspension, stirred for 1 min and equilibrated for 30 min. Readings were accepted when the drift stabilized to less than 0.02 units within 5 s. OM content was determined by an automatic soil organic matter analyzer, total nitrogen (N) was determined by a KDY-9820 Kjeldahl nitrogen analyzer (Beijing Ruibang Xingye Technology Co., Ltd., Beijing, China), total phosphorus (P) was determined using a UV-visible spectrophotometer (Shimadzu Corporation, Kyoto, Japan), total potassium (K) was determined by an iCAP 6300 inductively coupled plasma spectrometer (Thermo Fisher Scientific, Waltham, MA, USA), and particle size was determined by a Mastersizer 2000 (Malvern Panalytical, Malvern, UK) laser particle size analyzer. All analyses followed the methods specified in the Specification of Land Quality Geochemical Assessment (DZ/T 0295-2016), which is consistent with standard soil testing procedures [25].
2.3. Data Sources and Processing
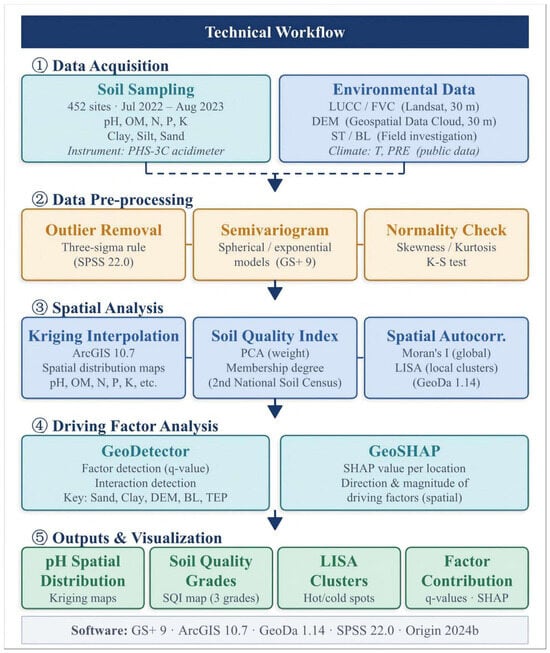
In addition to the measured indicators, we used multi-source data obtained through field surveys and public channels (Table 1). Outliers were removed from the sample data using the three-sigma rule, resulting in the removal of 28 samples (6.19% of the total 452). Of these, 15 were attributable to laboratory errors, while 13 reflected extreme natural soil variability [26], and semivariogram analysis was performed with GS+ 9 to identify the optimal model and parameters. Kriging interpolation was then applied in ArcGIS 10.7 to analyze spatial variability [17]. Principal component analysis was used to objectively determine indicator weights, and membership degrees were determined based on the nutrient grading standards of the Second National Soil Census of China and the actual conditions of Pingquan City to evaluate the soil quality across the entire city [27]. Soil pH, OM, N, P, K, clay, silt, and sand were selected to calculate the integrated soil quality index (IQI) using the weighted sum method [28], and soil quality was classified into three grades: high (IQI > 0.8), medium (0.6 ≤ IQI ≤ 0.8), and low (IQI < 0.6). One-way ANOVA was used to compare soil pH among groups of each environmental factor. Normality was checked by the Shapiro–Wilk test and variance homogeneity by Levene’s test. For total phosphorus and total potassium, which strongly violated normality (CV = 113 and 103%), the Kruskal–Wallis non-parametric test was applied instead. All tests used a significance level of p < 0.05. Spatial autocorrelation analysis was conducted using GeoDa 1.14. A grid was established in Pingquan City using ArcGIS 10.7, and the factor detection and interaction detection functions in GeoDetector were used to identify key factors influencing the spatial variation of soil pH. We used GeoSHAP to analyze whether the direction and intensity of the effects of driving factors are consistent across different locations. Descriptive statistical analysis of the data was performed with SPSS 22.0, and other maps and figures were created using Origin 2024b. The data analysis workflow is summarized in Figure 2.
Table 1.
Data sources and spatial resolution of environmental variables for Pingquan City.
Figure 2.
Data analysis workflow.
3. Results
3.1. Analysis of Variability and Variogram Structure of Soil Physicochemical Properties
The coefficient of variation reflects the degree of variation in physicochemical parameters. For soil parameters, a coefficient of variation <10% indicates weak variability, a range of 10–100% indicates moderate variability, and a value ≥100% indicates strong variability [29]. Soils in Pingquan City are predominantly alkaline, accounting for 43% of the area, with an average pH of 7.32 and a range of 4.62–9.98. This is consistent with the region’s geology, which includes mostly neutral rocks, carbonate rocks, and lime-rich soils. The coefficient of variation for parameters ranges from 11% to 113%. P and K show the highest variability, followed by OM and N, with coefficients of variation of 113%, 103%, 67%, and 52% respectively. The coefficient of variation for pH is 11% (Table 2). Overall, except for P and K, which exhibit strong variability, the other parameters have coefficients of variation between 10% and 100%, indicating moderate variability with significant spatial variability.
Table 2.
Descriptive statistics of the soil parameters.
Spherical and exponential models were used to fit the semivariogram functions of the soil parameters, and the results show varying degrees of spatial dependence (Table 3). Spatial variability structure was quantitatively analyzed using parameters such as nugget (C0), sill (C), Q value [C/(C0 + C)], and range, where the Q value represents the spatial structure of each parameter and the range reflects the spatial extent of the parameter’s variability. When the Q value is >0.75, the variable is mainly influenced by structural factors; when it ranges from 0.25 to 0.75, the variable is affected by both structural and random factors; and when the Q value is <0.25, the variable is mainly influenced by random factors. If the Q value is close to 0 or the semivariogram function slope is near 0, the soil parameter shows no spatial correlation [30].
Table 3.
Semivariograms of the soil parameters.
Overall, the Q values for soil pH, OM, N, P, and K are all > 0.75, indicating a strong influence of structural factors. In contrast, the Q values for clay, silt, and sand range between 0.25 and 0.75, suggesting their spatial variability is the result of combined structural and random factors. Range calculations show the maximum spatial correlation distances for soil pH, OM, N, P, K, clay, silt, and sand in Pingquan City are 8.9, 6.1, 15.0, 3.1, 6.6, 166.2, 98.1, and 127.0 km respectively. The r2 values for P and K are relatively low, suggesting weaker spatial autocorrelation than other variables and likely reflecting the influence of localized agricultural practices such as fertilization. As a result, the Kriging maps for P and K are best interpreted as broad spatial trends rather than precise local predictions.
3.2. Spatial Distribution Characteristics of Soil Physicochemical Properties
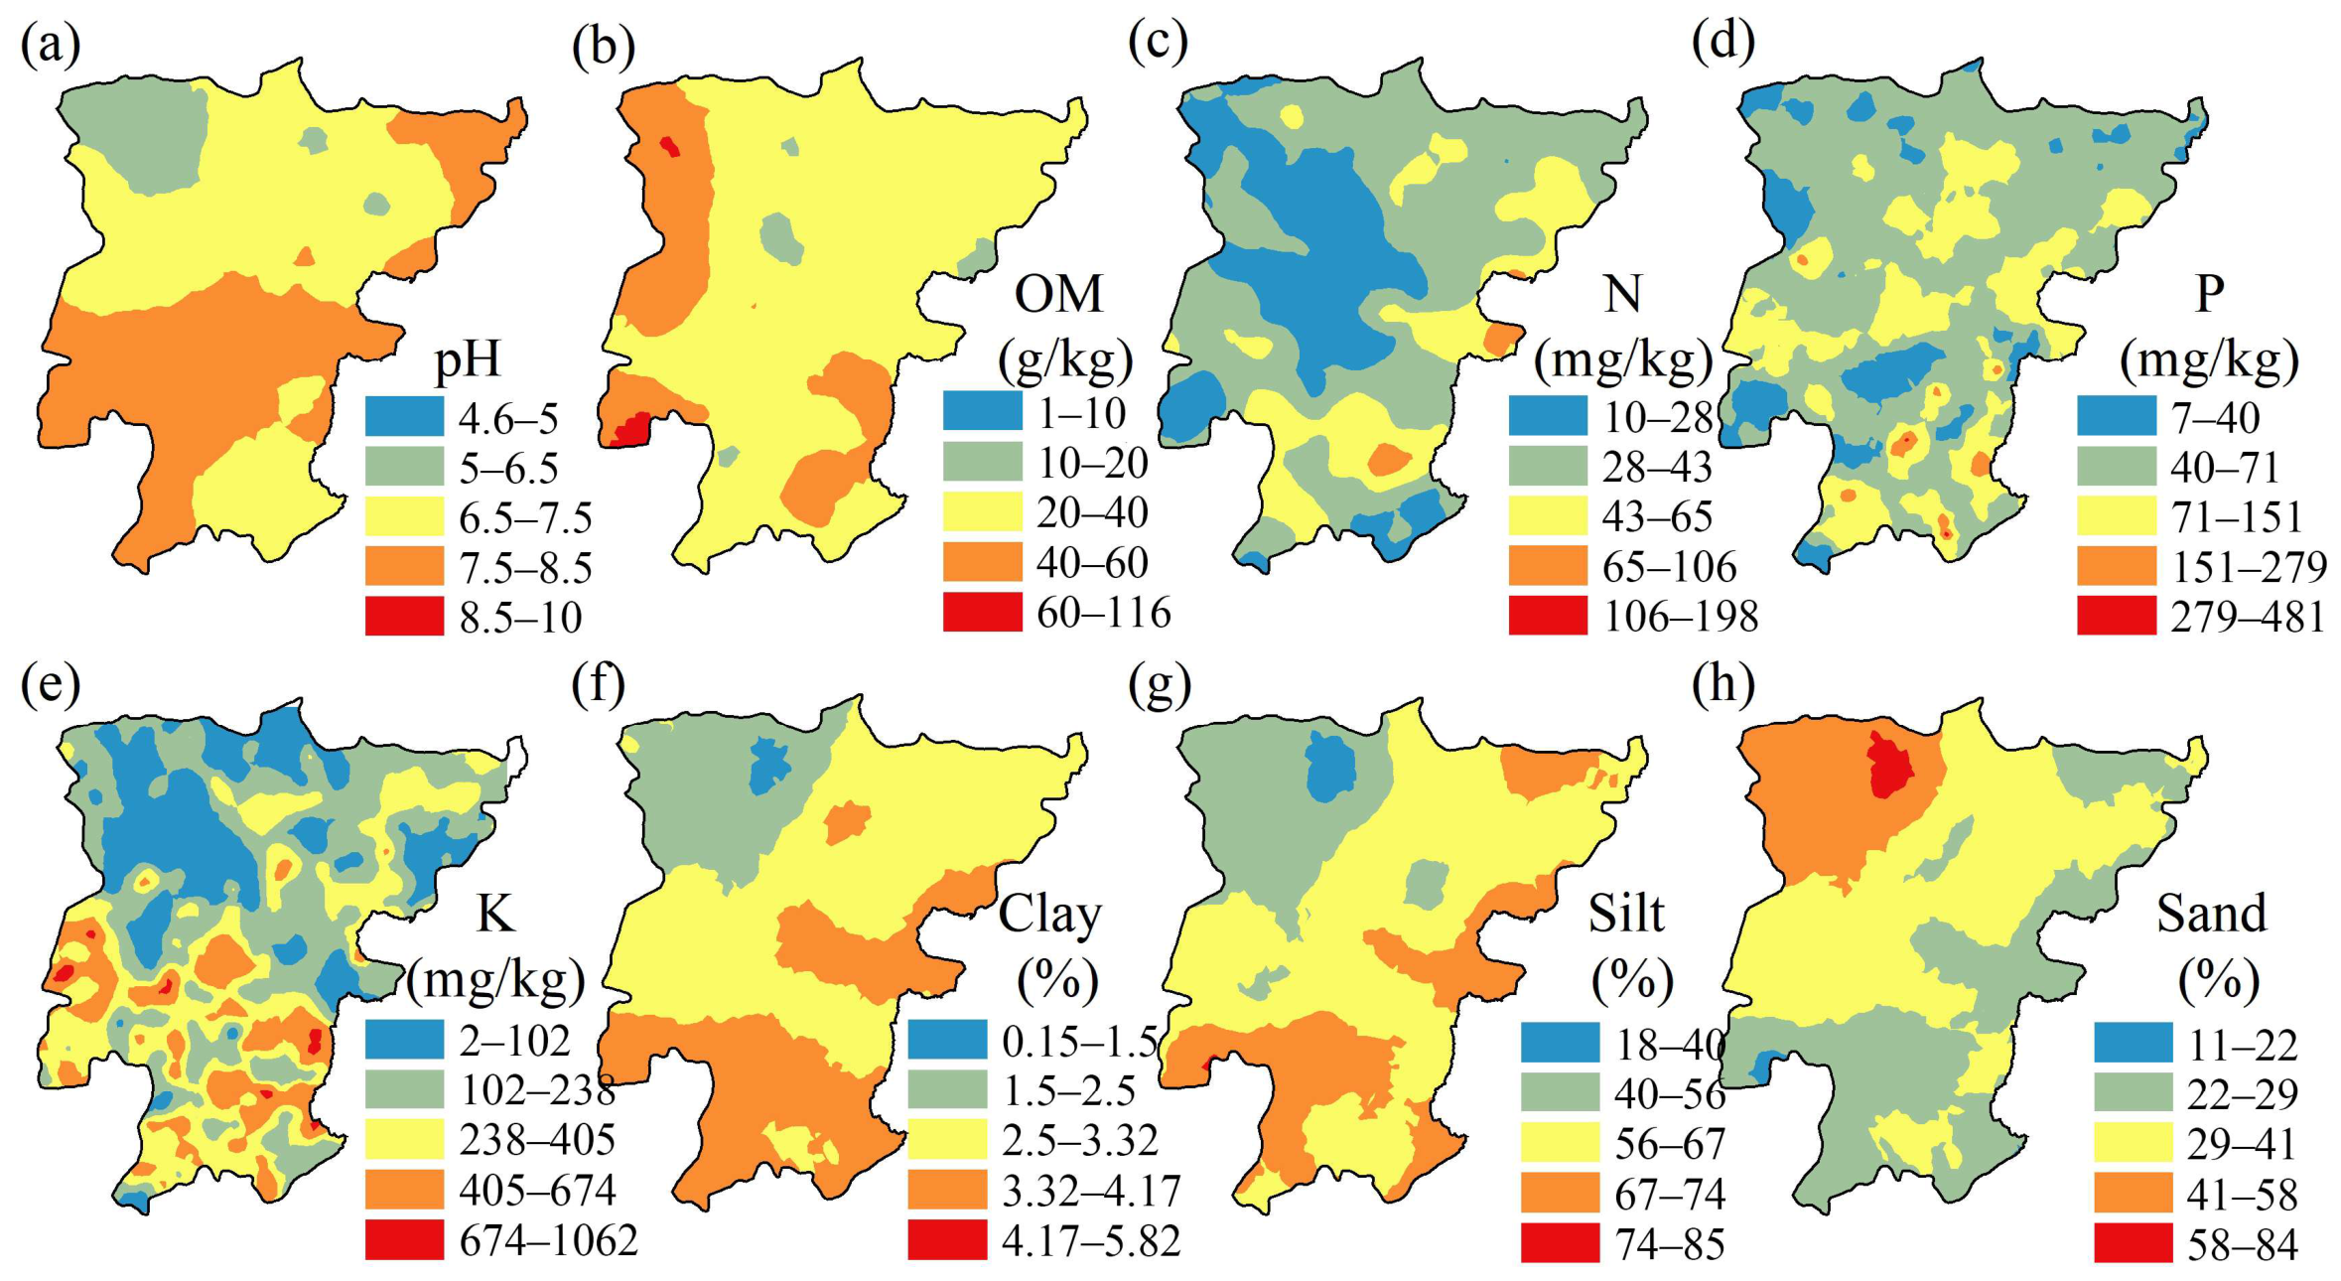
Kriging interpolation was used to obtain the spatial distribution and proportional characteristics of various soil physicochemical parameters in Pingquan City (Figure 3). Classification thresholds for each soil property were determined via the natural breaks method in ArcGIS 10.7 on normally distributed data and rounded to integer breakpoints for clarity. The results show that soils in northwestern Pingquan City are predominantly acidic, while the southern, northeastern, and most other areas have higher pH levels ranging from neutral to alkaline, with an overall decreasing trend from south to north. Alkaline and neutral soils account for 42% and 35% of the total area, respectively. The OM content in Pingquan soils is generally high, and according to the second national soil survey’s nutrient classification standard, most regions have a medium OM level. About 43% of the soil has an OM content of 20–40 g/kg, and higher OM content is found in the western and southeastern regions where approximately 26% of the soil has OM content exceeding 40 g/kg. Soil nutrient salts show a patch-like mosaic distribution, with the southern region having relatively high nutrient salt content and the central and northern areas having lower levels. The N content ranges from 28 to 43 mg/kg, P content from 40 to 71 mg/kg, and most soils have K content below 102 mg/kg. The soil texture in Pingquan shows a distinct step-like distribution, with the proportions of clay and silt gradually decreasing from southeast to northwest while the proportion of sand exhibits the opposite trend, reaching its highest value in the northwest. Overall, silt is the most abundant soil particle type across the entire region.
Figure 3.
Spatial distribution and characteristics of soil parameters in Pingquan City: (a) Spatial distribution of pH.; (b) Spatial distribution of organic matter; (c) Spatial distribution of N content; (d) Spatial distribution of P content; (e) Spatial distribution of K content; (f) Spatial distribution of clay content; (g) Spatial distribution of silt content; (h) Spatial distribution of sand content.
Cross-validation results indicate negligible systematic bias for all interpolated soil properties, with mean errors (ME) ranging from −0.95 to 10.63, confirming that ordinary Kriging produced unbiased spatial predictions across the study area (Table 4).
Table 4.
Cross-validation mean errors (ME) of Kriging-interpolated soil properties.
3.3. Comprehensive Soil Quality Assessment
Eight indicators related to crop growth, including soil pH, nutrients, and particle composition, were selected.
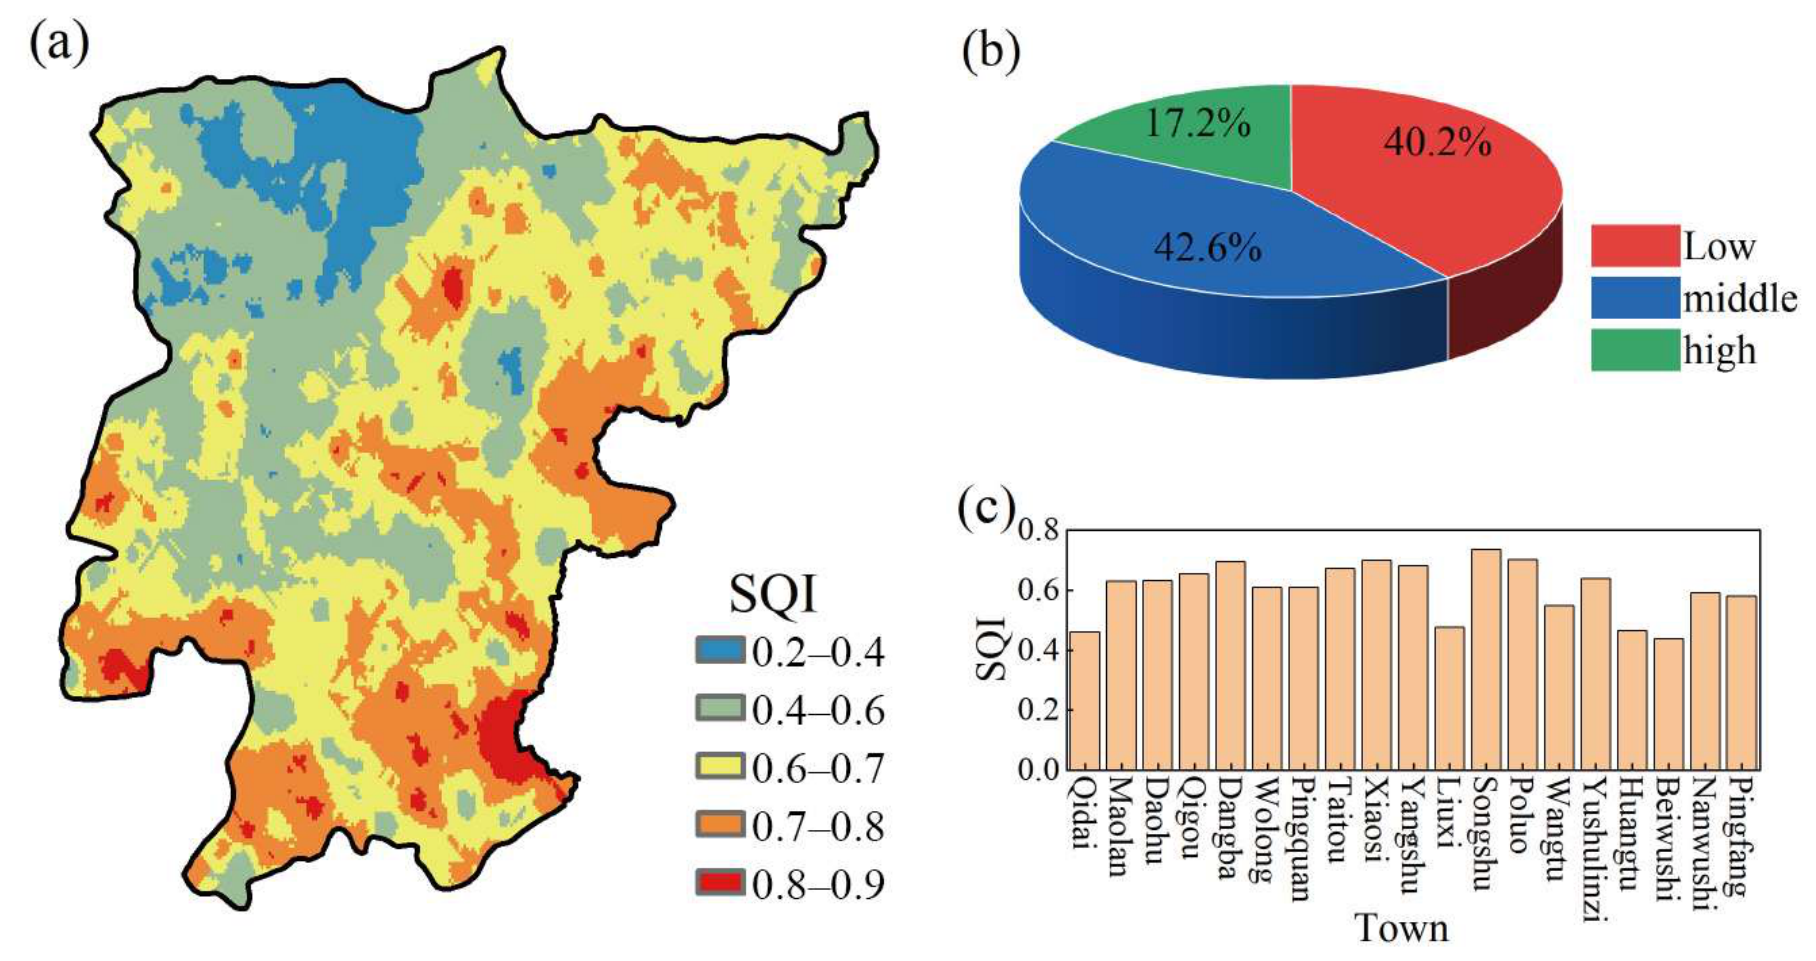
Principal Component Analysis (PCA) was used to objectively determine indicator weights (Table 5). The comprehensive index method was used for evaluation, dividing soil quality into three grades: high (SQI > 0.8), medium (0.6 ≤ SQI ≤ 0.8), and low (SQI < 0.6). A comprehensive soil quality assessment was conducted, and a classification map was drawn. The results show that the soil quality index ranges from 0.11 to 0.97, with an average of 0.61, indicating an overall moderately low level. Among the sample points, 42.6% were classified as medium-grade, 40.2% as low-grade, and only 17.2% as high-grade. Spatially (Figure 4), areas with high soil quality are mainly distributed in the southwestern and southeastern regions. These areas have higher clay and silt content, lower altitude, and widely distributed carbonate rocks. Low-value areas are concentrated in the northwestern medium mountain areas, which have high sand content, high altitude, and acidic soil. Soil quality is relatively better in Songshutai, Dangba, Poluoshu, and Xiaosigou Town in the south, while it is relatively poorer in Qijiadai Manchu, Liuxi Manchu, Huangtuliangzi, and Beiwushijiazi Town in the northwest. The PCA results show that OM, pH, K content, and particle composition are the dominant factors affecting soil quality. Some areas face issues such as insufficient nutrients, low fine particle fraction, and poor soil fertility and water retention capacity. Overall, soil quality in Pingquan City is strongly influenced by natural soil-forming factors such as topography, bedrock lithology, and soil texture, showing high consistency with the spatial pattern of soil pH. To achieve sustainable soil management, subsequent efforts should focus on enhancing OM fertilization and improving soil structure.
Table 5.
Principal component analysis results of evaluation index and its weight coefficient.
Figure 4.
Soil quality classification in Pingquan City: (a) Spatial distribution of SQI; (b) Proportion of soil quality grades in Pingquan City; (c) SQI values across different towns in Pingquan City.
3.4. Spatial Autocorrelation Analysis of Soil Physicochemical Properties
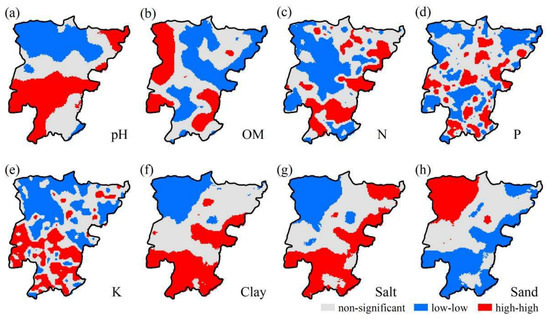
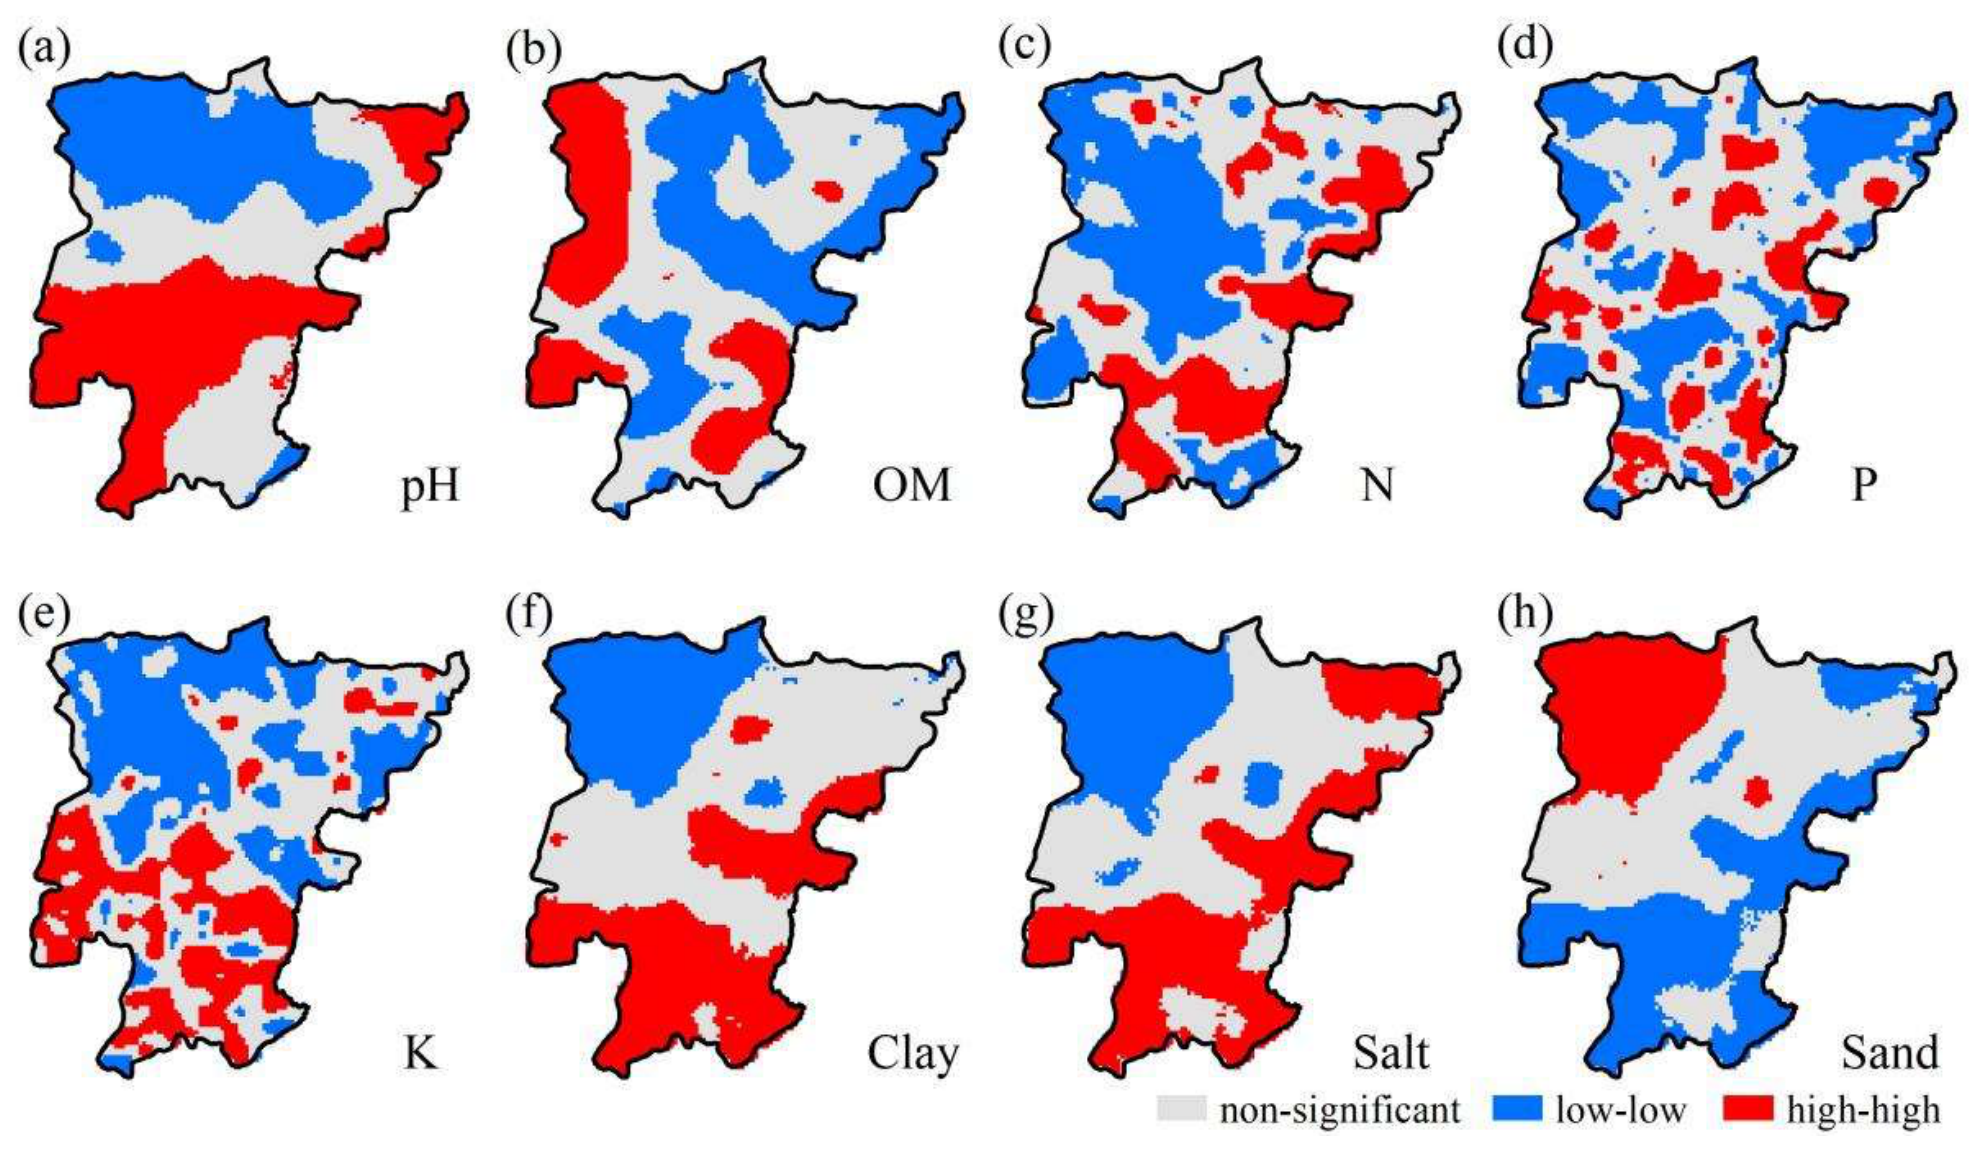
The global Moran’s I index was used to assess the spatial autocorrelation of various physicochemical parameters of soil, and local clustering patterns were identified to detect different types of spatial clustering or dispersion phenomena, including high-value, low-value clusters, high-low, and low-high anomalies (Figure 5) [31]. The results show that the Moran’s I indices for soil pH, OM, N, P, K, clay, silt, and sand are 0.997, 0.991, 0.975, 0.899, 0.950, 0.992, 0.995, and 0.995, respectively, all indicating strong positive spatial correlations. Each physicochemical parameter has numerous high–high and low–low clusters, meaning regions with higher or lower values are more likely to cluster together. The clustering patterns are summarized in Figure 5. For soil pH, high–high clusters concentrate in the southwest and low–low clusters in the northwest. For soil OM, high–high clusters appear in the western region and low–low clusters in the east and center. N, P, and K share a similar pattern: high–high clusters dominate the south and low–low clusters the north. Clay and silt show consistent clustering (high–high in the south, low–low in the northwest), while the spatial distribution of sand is opposite to that of clay and silt.
Figure 5.
Local spatial autocorrelation distribution of soil parameters in Pingquan City: (a) Local spatial autocorrelation distribution of pH.; (b) Local spatial autocorrelation distribution of organic matter; (c) Local spatial autocorrelation distribution of N content; (d) Local spatial autocorrelation distribution of P content; (e) Local spatial autocorrelation distribution of K content; (f) Local spatial autocorrelation distribution of clay content; (g) Local spatial autocorrelation distribution of silt content; (h) Local spatial autocorrelation distribution of sand content.
3.5. Spatial Distribution Characteristics of Environmental Elements in Pingquan City
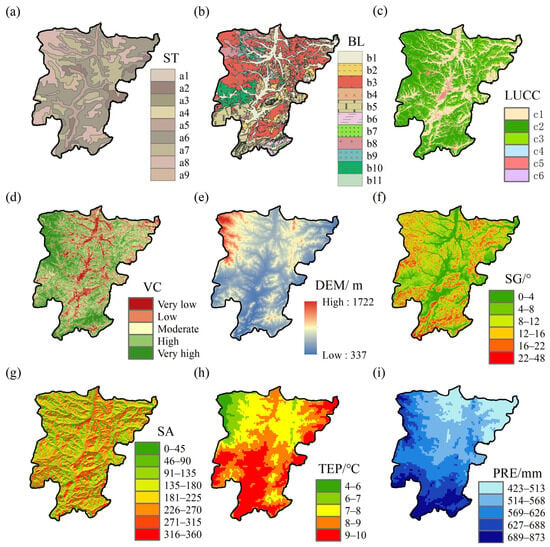
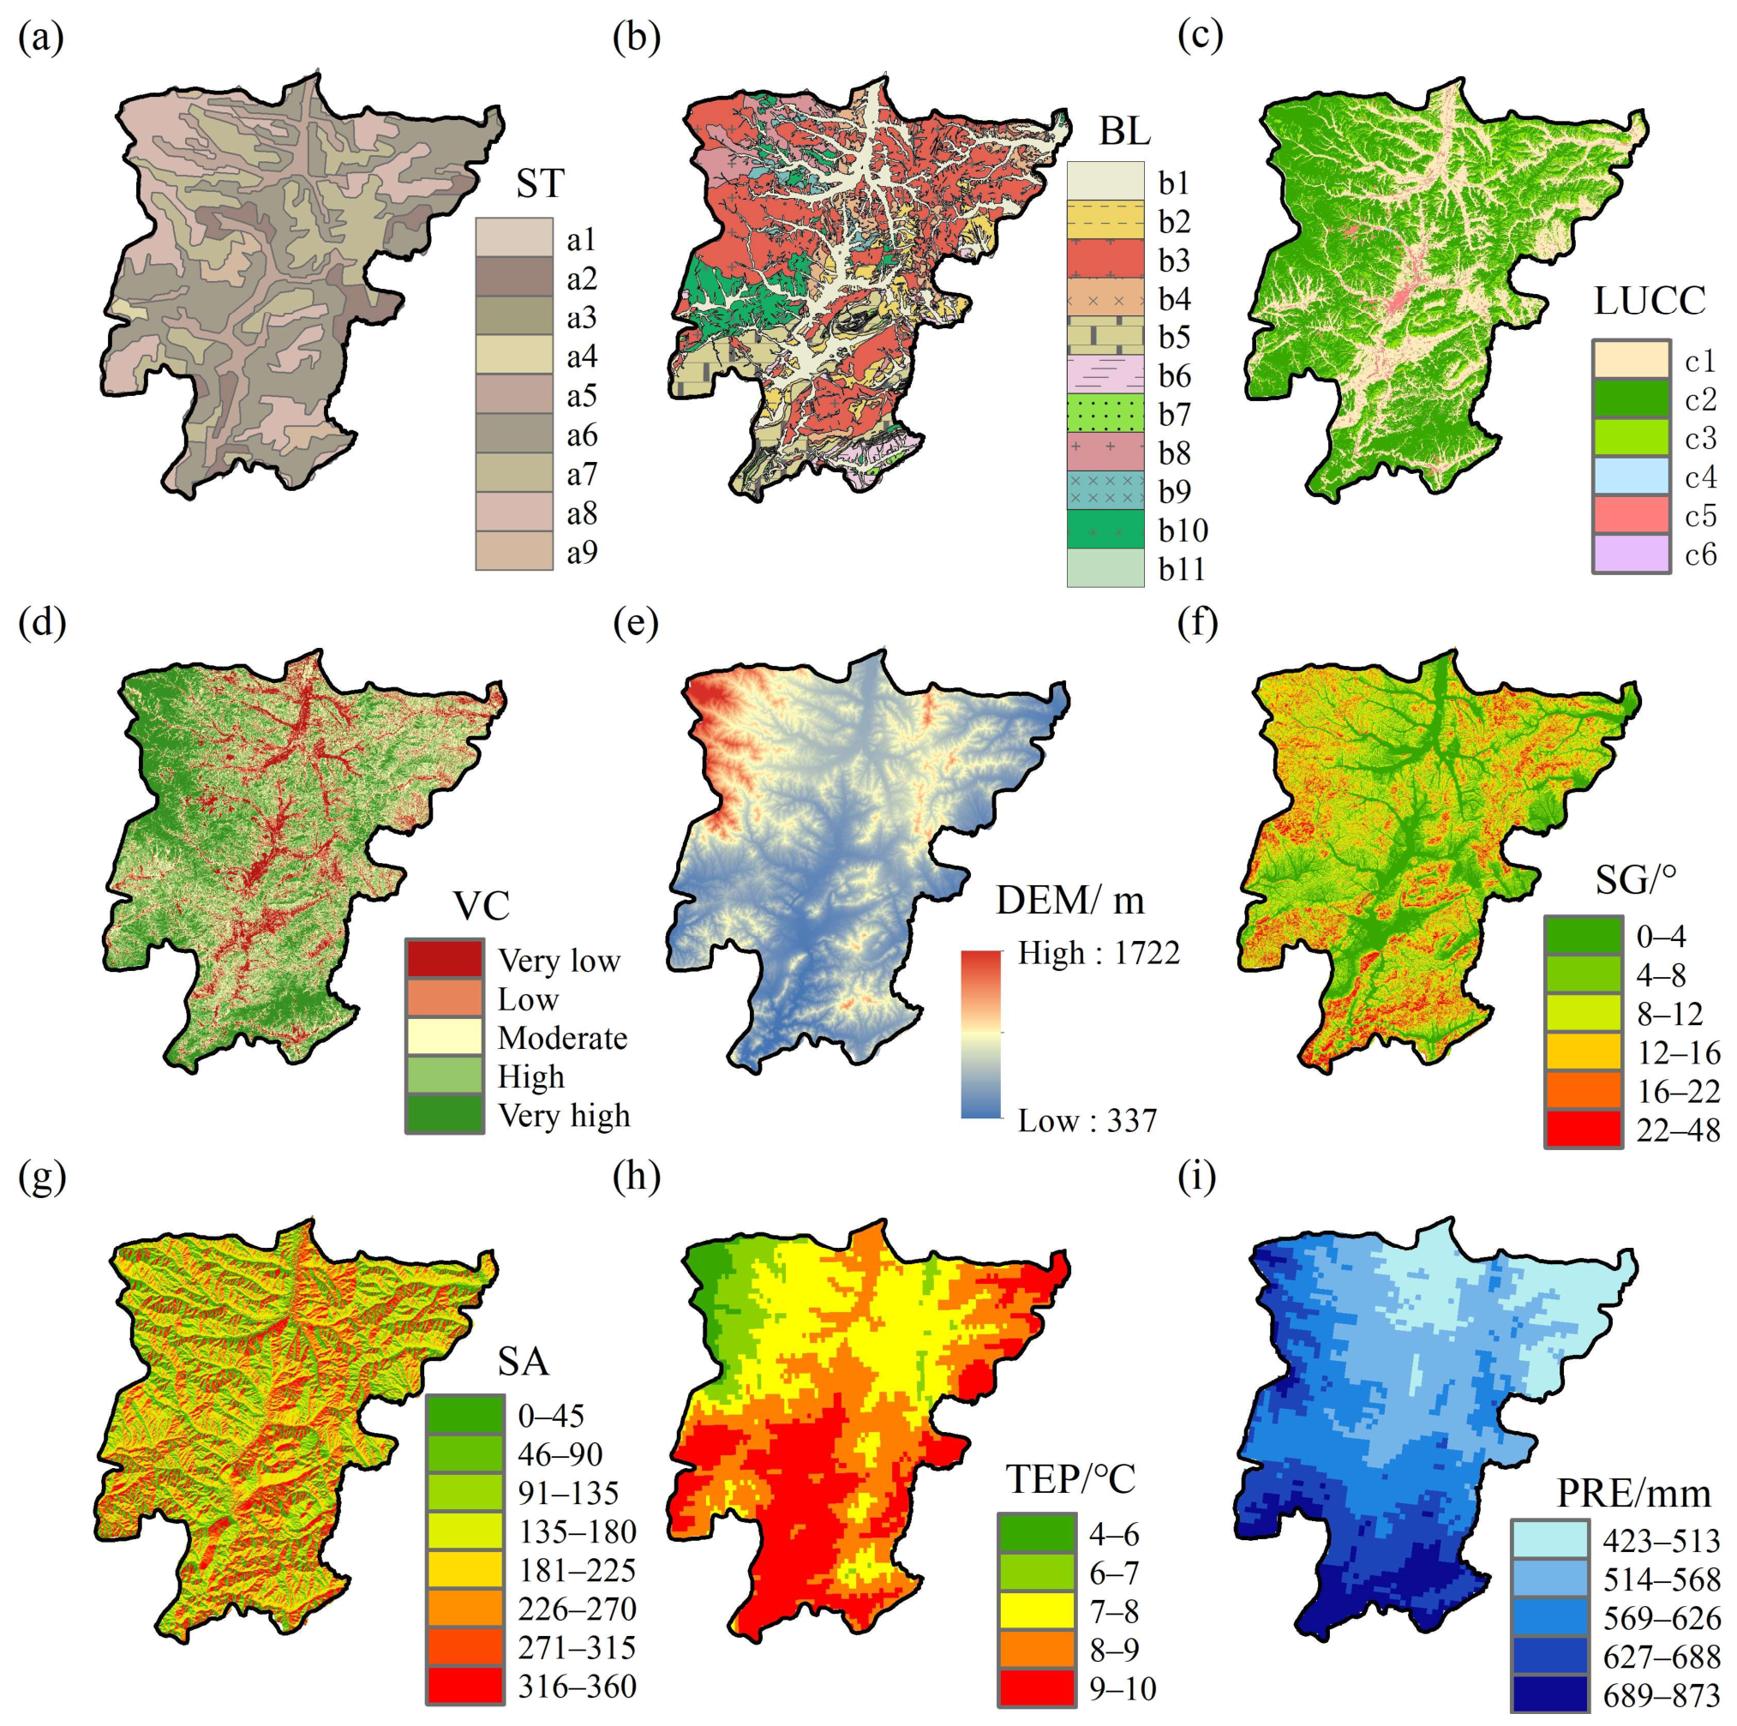
A distribution map of environmental factors was created through field surveys and public data queries (Figure 6). The spatial patterns and their quantitative links to subsequent pH analyses are summarized below.
Figure 6.
Spatial distribution of other environmental factors in Pingquan City: (a) Spatial distribution of soil type: a1—calcaric skeletal soil, a2—cambic cinnamon soil, a3—cinnamon soil, a4—aquic cinnamon soil, a5—fluvo-aquic soil, a6—leached cinnamon soil, a7—cambic brown soil, a8—brown soil, a9—neutral skeletal soil; (b) Spatial distribution of bedrock lithology: b1—quaternary continental deposits, b2—continental clastic rocks, b3—intermediate-felsic volcanic rocks, b4—volcaniclastic rocks, b5—marine carbonate rocks, b6—sandy clastic rocks, b7—muddy clastic rocks, b8—intermediate-felsic intrusive rocks, b9—mafic intrusive rocks, b10—regional metamorphic rocks, b11—contact metamorphic rocks; (c) Spatial distribution of land use and land cover: c1—cropland, c2—forest land, c3—grassland, c4—water, c5—built-up land, c6—bare land; (d) Spatial distribution of vegetation cover; (e) Spatial distribution of elevation; (f) Spatial distribution of slope gradient; (g) Spatial distribution of slope aspect; (h) Spatial distribution of average annual temperature; (i) Spatial distribution of average annual precipitation.
The dominant ST are fluvo-aquic soil, leached cinnamon soil, and brown soil. Fluvo-aquic soils concentrate along alluvial floodplains in the central valley. Leached cinnamon soils dominate middle and lower mountainous areas. Brown soils are restricted to the northwest highlands. ST has moderate explanatory power for pH spatial variation (Section 3.7). Among these types, cinnamon and leached cinnamon soils are alkaline, while brown soils have lower mean pH (Section 3.6).
BL falls into three categories: sedimentary rocks (carbonate and clastic, dominant in the south), igneous rocks (intermediate-acidic volcanic, dominant in the west and northwest), and metamorphic rocks (scattered across the region). BL exerts significant control on pH. Soils on carbonate rocks have the highest mean pH, whereas those on igneous rocks are considerably lower (Section 3.6).
Forest and grassland dominate hilly areas. Cultivated land extends north to south through the central lowlands. VC is classified as extremely low (24.8%), low (33.3%), medium (27.3%), high (11.8%), and extremely high (2.9%). Its independent explanatory power for pH is weak (Section 3.7).
DEM ranges from 337 to 1722 m, decreasing northwest to southeast. Slope gradient (SG) varies from 0° to 48°. Elevation is a dominant pH driver (Section 3.7). Mean pH declines from 7.77 below 500 m to 6.51 above 1000 m (Section 3.6). This altitudinal gradient integrates declining temperature, increasing sand content, and intensified leaching.
TEP decreases from southeast to northwest, mirroring the elevation pattern. TEP is the strongest single driver of pH spatial heterogeneity. PRE is higher in the northwest and south and lower in the central region. PRE alone explains little variation, but its interaction with TEP produces strong nonlinear enhancement (Section 3.7). In carbonate-dominated areas of the south, lithological buffering counteracts precipitation-induced acidification. In the northwest highlands, low temperatures and coarse-textured, base-poor parent materials amplify it. The spatial covariation of climate, topography, and lithology thus forms the structural basis for the pH differentiation quantified in Section 3.6 and Section 3.7.
3.6. Environmental Factors Affecting pH Spatial Variation
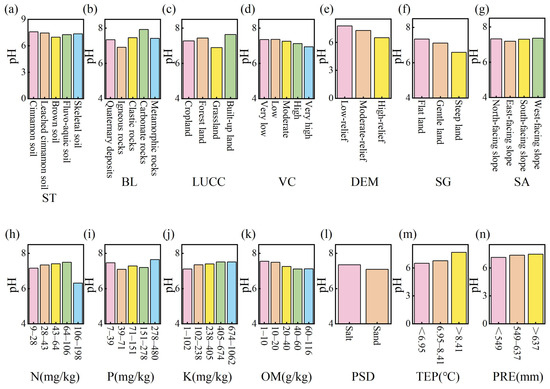
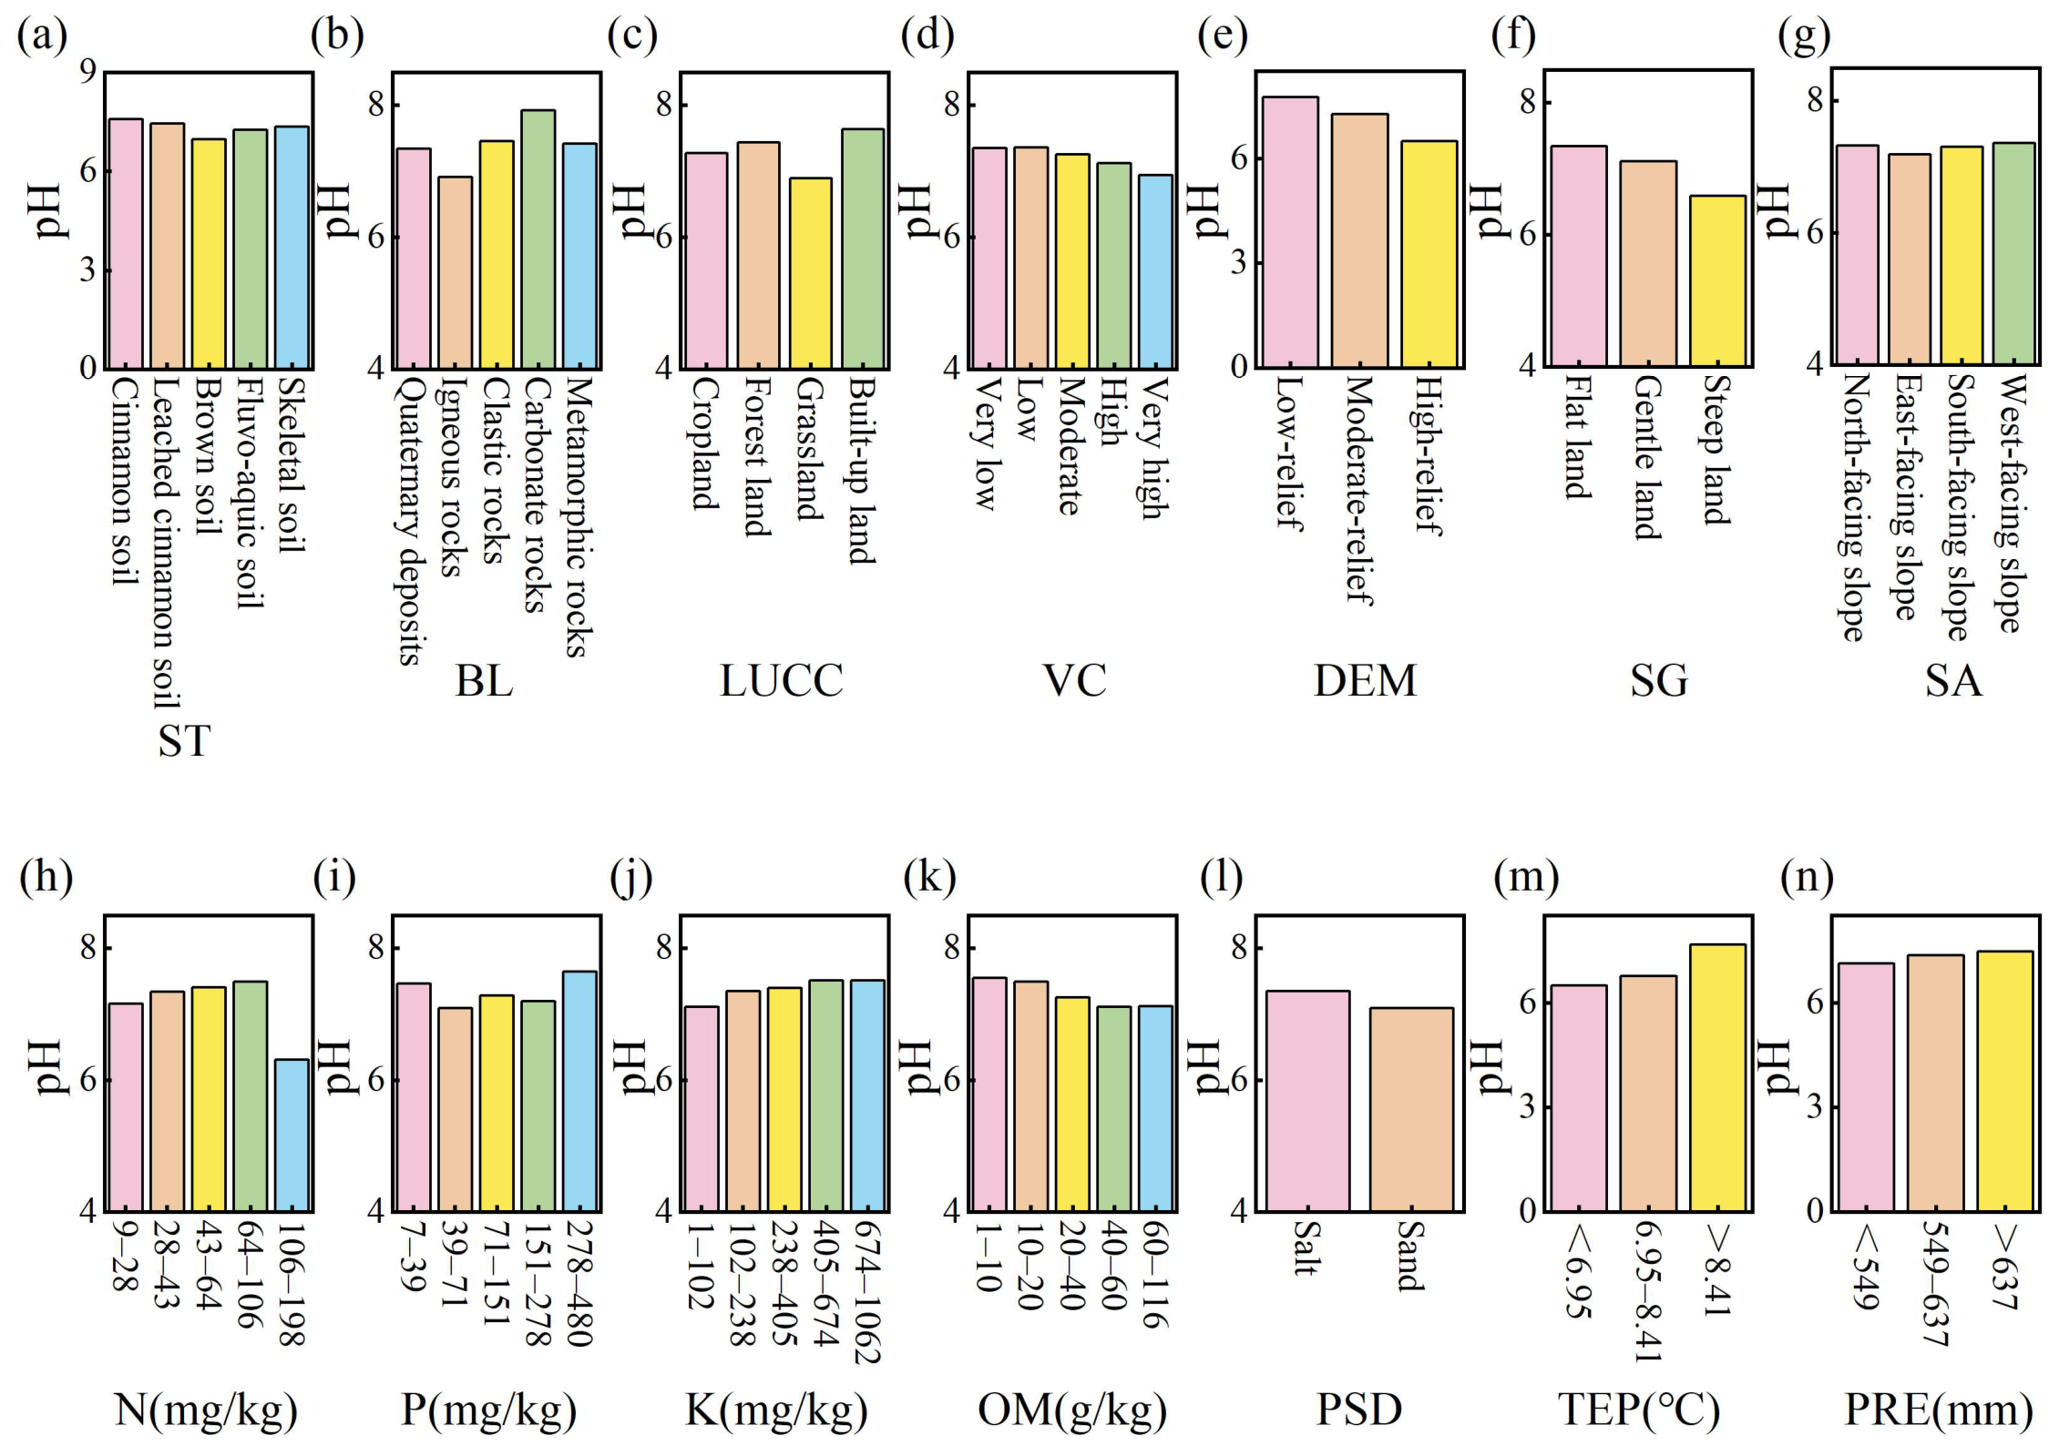
Soil pH differed significantly among most environmental factor groups (p < 0.05). Group means are shown in Figure 7.
Figure 7.
Changes in soil pH mean value under different influencing factors: (a) Mean value of soil pH across different soil types; (b) Mean value of soil pH across different bedrock lithology; (c) Mean value of soil pH across different land use and land cover; (d) Mean value of soil pH across different vegetation cover; (e) Mean value of soil pH across different elevation; (f) Mean value of soil pH across different slope gradient; (g) Mean value of soil pH across different slope aspect; (h) Mean value of soil pH across different N content; (i) Mean value of soil pH across different P content; (j) Mean value of soil pH across different K content; (k) Mean value of soil pH across different organic matter; (l) Mean value of soil pH across different soil texture; (m) Mean value of soil pH across different average annual temperature; (n) Mean value of soil pH across different average annual precipitation.
BL and ST produce the largest pH contrasts. Soils developed from carbonate rocks have the highest mean pH (7.93). Soils on igneous rocks are considerably lower (6.92). This lithological control also shapes the ST pattern: cinnamon and leached cinnamon soils are alkaline, while brown soils in the northwest are more acidic.
Elevation produces a clear vertical gradient. Mean pH is 7.77 below 500 m and 6.51 above 1000 m. This decline integrates lower temperatures, coarser textures, and intensified leaching at higher altitudes. Temperature mirrors this pattern, with pH generally rising with TEP along the northwest–southeast zonation described in Section 3.5.
Soil texture shows a monotonic effect. pH rises with silt and clay content and falls with sand content. Among chemical properties, K is positively associated with pH and OM is negatively associated. N and P display non-monotonic patterns: pH peaks at intermediate P levels and declines when N exceeds 106 mg/kg.
LUCC, VC, PRE, and slope aspect (SA) produce modest effects on pH means. Construction land has the highest mean pH among land use types, followed by forest land, cultivated land, and grassland. Precipitation shows a slight positive association with pH, reflecting carbonate buffering in the southern study area rather than a direct precipitation–acidification relationship.
3.7. Analysis of Driving Factors Based on GeoDetector
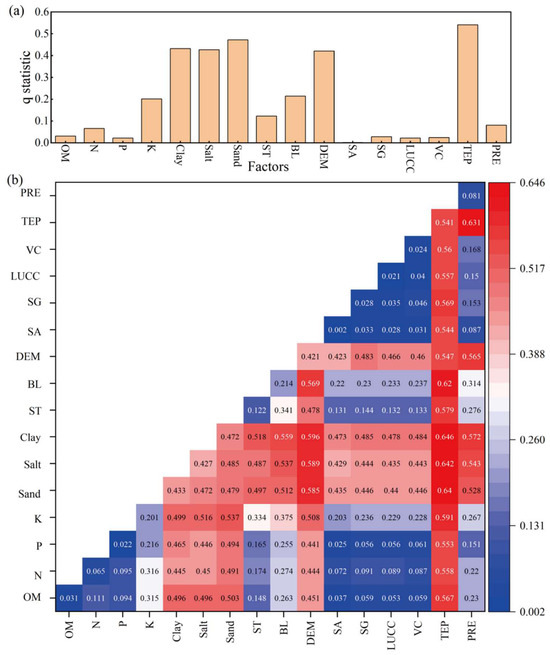
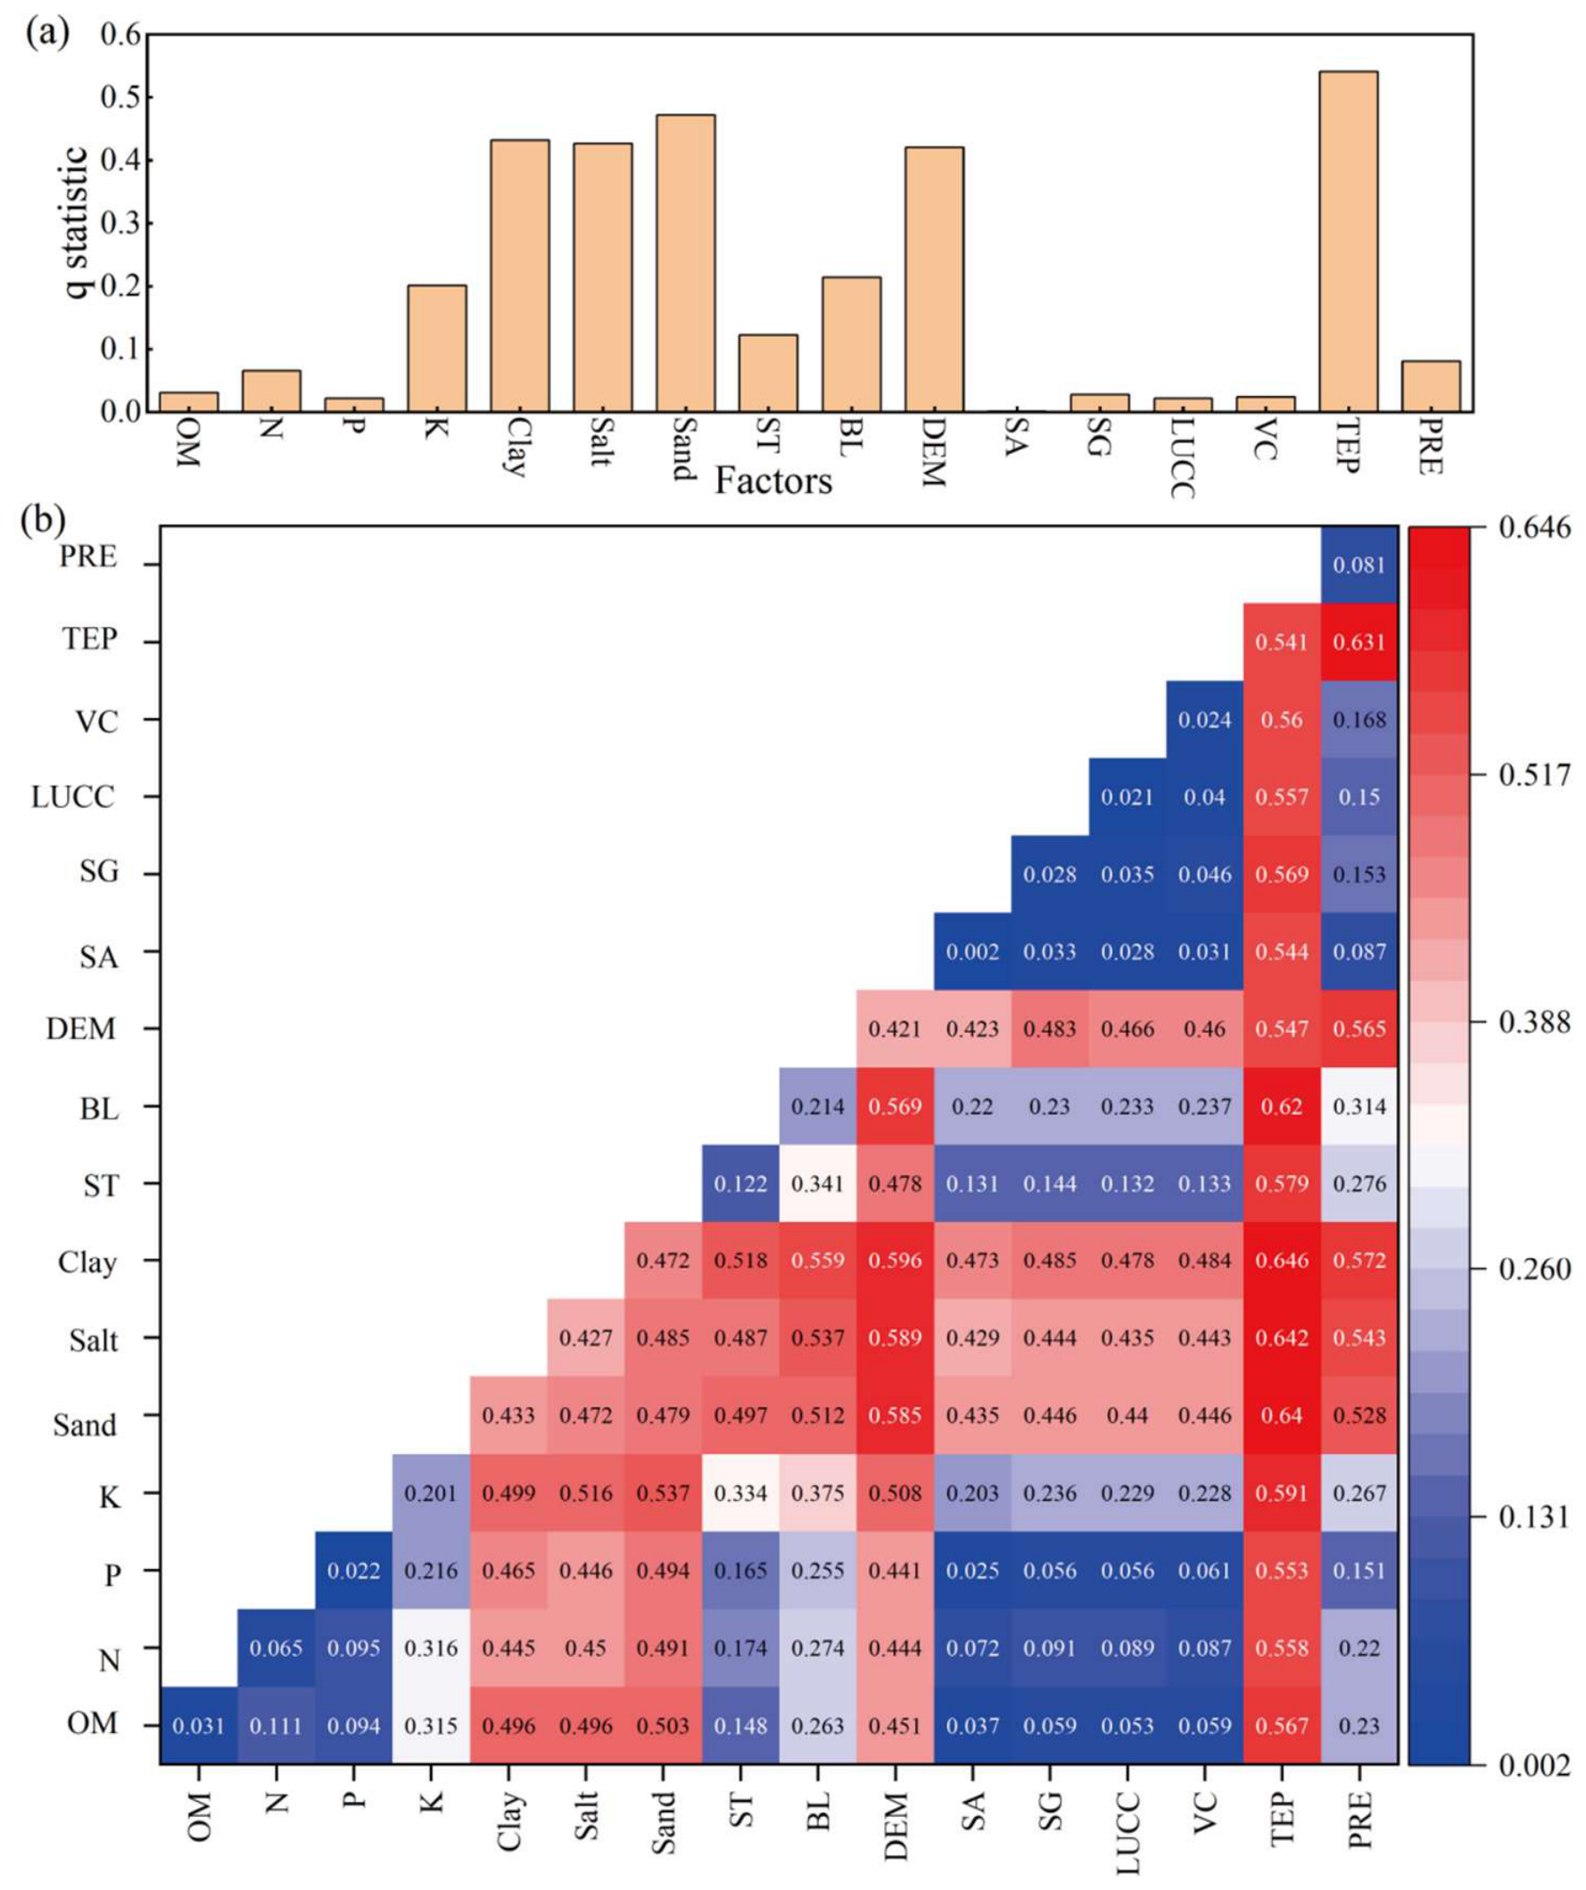
The GeoDetector was used to analyze the influence of different environmental factors on soil pH distribution (Figure 8). A larger q-value indicates stronger spatial explanatory power [32]. The factor detection results rank the explanatory power of each factor from large to small as follows: TEP (0.541), sand content (0.472), clay content (0.433), silt content (0.427), elevation (0.421), lithology (0.214), K content (0.201), soil type (0.122), average annual precipitation (0.081), N content (0.065), OM (0.031), slope (0.028), vegetation coverage (0.024), P content (0.022), land use (0.021), and aspect (0.002). TEP is thus the strongest driver of pH spatial differentiation. The q-values for soil particle size and elevation are also high, indicating strong influence from natural soil-forming factors. Sand, clay, and silt content all exceed q of 0.42, confirming that soil texture differences are key to pH spatial differentiation. Elevation significantly affects soil pH by controlling heat, moisture, and material transport. Lithology and K content have moderate explanatory power, reflecting the regulatory role of parent material properties and soil base status. Land use, vegetation coverage, aspect, and slope have relatively low explanatory power, influencing local differences more than the overall distribution pattern.
Figure 8.
(a) Factor detector and (b) interaction detector.
The spatial distribution of soil pH results from the combined effects of multiple environmental elements. Interaction detection (Figure 8) shows that any two-factor interaction has higher explanatory power than the corresponding single factor, mainly showing bi-factor enhancement and nonlinear enhancement. The synergy between TEP and other factors is most prominent. Interaction q-values of TEP with sand, silt, and clay all exceed 0.6. Temperature also interacts strongly with lithology, elevation, K content, and soil type. Elevation and lithology also show high interaction q-values with particle content. The interaction q-value of average annual precipitation and average annual temperature is 0.631, exceeding the sum of their individual explanatory powers and showing nonlinear enhancement. Precipitation interactions with elevation and particle composition are above 0.5. These interactions indicate that precipitation affects leaching and deposition across different topographic settings, jointly influencing pH distribution with soil texture. Although precipitation is not the strongest controlling factor, its combined effect with temperature, topography, and particle composition significantly enhances the spatial differentiation of soil pH.
3.8. Analysis of Spatial Heterogeneity Based on GeoSHAP
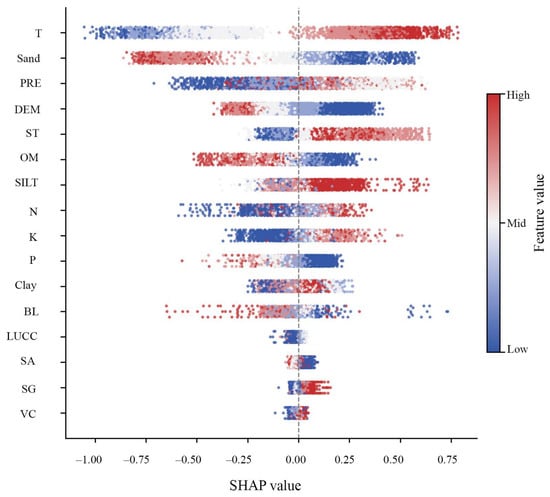
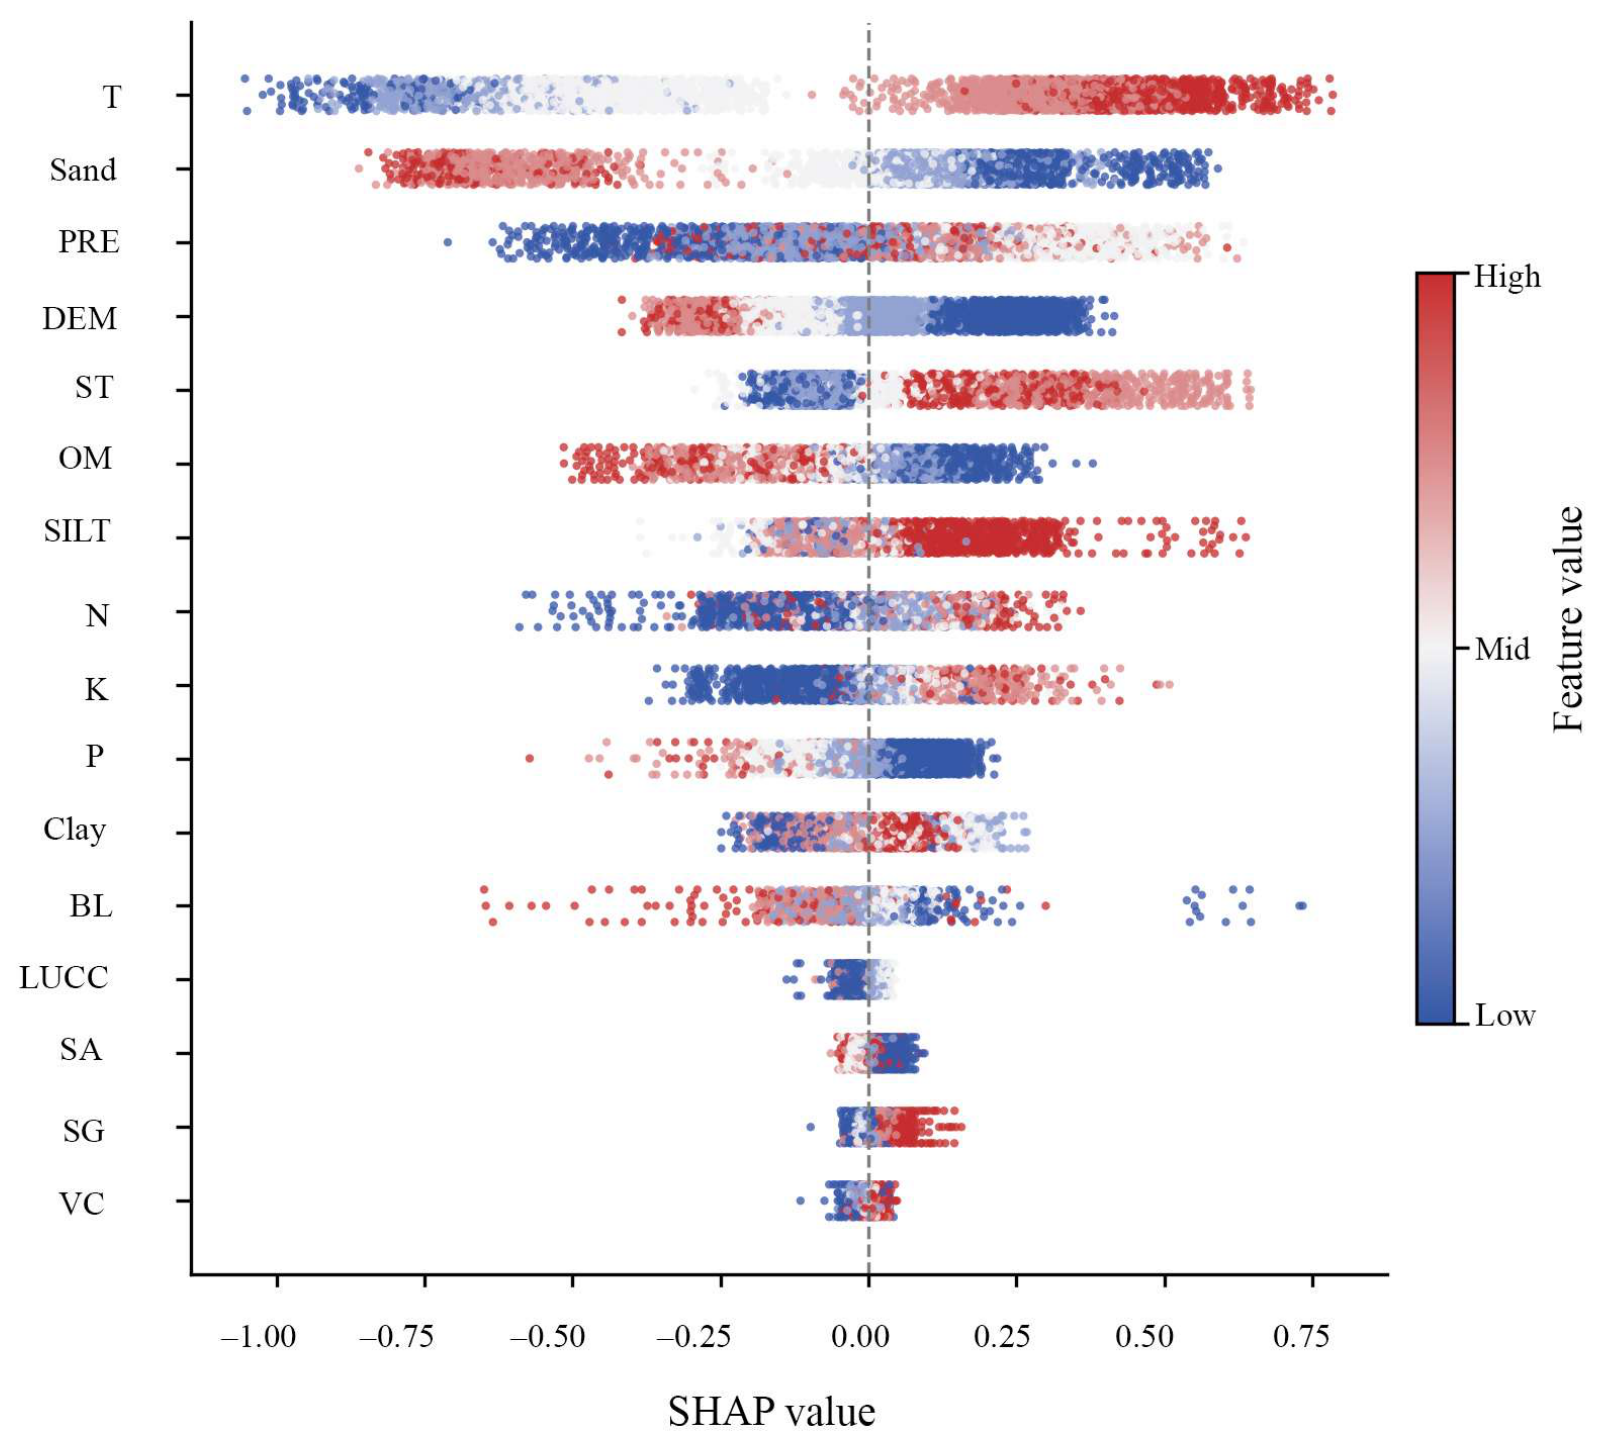
Based on identifying the dominant driving factors of soil pH spatial heterogeneity using GeoDetector, further analysis was conducted using GeoSHAP (Figure 9). The results show that different influencing factors not only have different contributions to soil pH, but the direction and intensity of the effect of the same factor also vary across spatial locations. The factors with the highest contributions were average annual temperature, sand content, average annual precipitation, elevation, slope, and OM content.
Figure 9.
SHAP beeswarm plot.
The area of positive contribution of temperature is wide, making it the primary positive factor affecting pH spatial differentiation. As temperature increases, the SHAP value generally increases. The promoting effect of medium-high temperature zones on pH increase is significantly enhanced, while in low-temperature areas, its contribution is significantly weakened or even detrimental to pH increase. Precipitation shows the opposite effect. In high-precipitation areas, it mostly shows a negative contribution, indicating that increased precipitation enhances leaching, promoting the loss of base ions, thus lowering soil pH. In low-precipitation areas, its negative effect is significantly weakened. This is consistent with the spatial differentiation characteristics of low pH in the northwest and higher pH in the southwest and northeast of Pingquan City.
The influence of sand content on soil pH better reflects the spatial non-uniformity caused by local soil texture differences. The contribution of sand content generally shows a positive enhancement trend as it increases, and is mainly concentrated in specific areas, indicating that the effect of sand on pH is jointly constrained by local topography, water transport conditions, and other factors. Elevation, slope, and OM also show obvious spatial position differences. Areas with steeper slopes often show negative contributions, indicating that enhanced slope erosion and material transport make the soil more prone to leaching. High-value areas of organic matter also often show negative contributions, suggesting that in some areas, it mainly causes acidification through the production of organic acids during mineralization. Thus, the same factor can either promote or inhibit pH increase in different spatial locations, and its influence mechanism exhibits significant regional dependence.
4. Discussion
4.1. Spatial Variation Characteristics of Soil pH in Pingquan City
Globally, soil pH generally exhibits a pattern of acidic soils in humid tropical regions and alkaline soils in arid and semi-arid regions. In China, soil pH displays a spatial distribution pattern with the Yangtze River serving as a boundary, where regions to the south tend to have acidic soils, while those to the north generally have alkaline soils [7]. Two soil surveys conducted between 1986–1990 and 2006–2010 found that the average pH values of dryland soils in Hebei Province were 8.15 and 7.82, respectively [33]. Pingquan City, located in the semi-arid mountainous area of northern North China, has a surface soil pH range of 4.62 to 9.98 with an average of 7.32, which conforms to the geographical distribution pattern of soil pH. A recent national-scale assessment found that cropland soil acidification in China has largely stabilized since approximately 2013, although regional heterogeneity remains pronounced, with dryland soils showing persistent stagnation compared with paddy soils [34]. The moderate mean pH of Pingquan places it at the transitional margin between the northern alkaline zone and more acidic mountainous environments.
Soil pH in Pingquan City exhibits moderate spatial variability. The Q-value derived from the semivariogram model indicates that spatial variability is primarily controlled by local topography, geomorphology, and bedrock lithology. This finding is consistent with research conducted in other regions, such as Anshun City in Guizhou Province, Anhui Province, and the Jinsha River Basin, where studies have shown that soil pH is more significantly influenced by structural factors like parent material, soil type, topography, and land use patterns [35,36,37]. Both semivariogram and Moran’s index analyses reveal strong spatial autocorrelation in the soil pH of Pingquan. Local spatial autocorrelation analysis further identifies significant clustering patterns: high–high clusters are mainly located in the southwest, while low–low clusters are predominantly found in the northwest. This spatial distribution demonstrates that soil pH in Pingquan City exhibits distinct zoning characteristics controlled by structural factors. These findings may also be applicable to other transitional climate regions worldwide with similar climatic conditions, diverse geological structures, and pronounced topographic relief.
4.2. Relationship Between pH and Environmental Factors and the Dominant Mechanism
The spatial distribution of soil pH in Pingquan City is influenced by multiple environmental factors. According to the GeoDetector analysis, particle size, elevation, bedrock lithology, and temperature are the primary driving factors. Each factor operates through distinct pathways discussed below.
Clay and silt content are positively correlated with cation exchange capacity and nutrient buffering capacity. Soils with higher clay content have a larger specific surface area and stronger colloidal cation adsorption capacity that can retain more basic cations, thus maintaining a higher pH [12]. In contrast, sandy soils are more porous, and precipitation leaching can wash away basic cations from the root zone, resulting in relatively lower pH. The proportion of clay and silt decreases from southeast to northwest while the proportion of sand increases, corresponding to the spatial pH gradient. Studies at the national scale have similarly identified soil texture as a critical determinant of pH buffering capacity, with fine-textured soils showing greater resistance to acidification than coarse-textured soils [34].
Complex topographical conditions shape the spatial distribution of soil pH by influencing water and heat conditions, as well as material migration. DEM and slope affect soil water leaching and erosion: at hilltops, rapid runoff and thinner soil layers lead to greater leaching, while at footslopes and valleys, water accumulation and thicker soil layers allow basic cation accumulation, resulting in relatively higher pH. A study in the hilly regions of southwestern China found a positive correlation between soil pH and DEM under low human disturbance [38]. However, in Pingquan City, the correlation between soil pH and DEM is negative (r = −0.567), because higher elevations in the northwest coincide with lower temperatures, coarser textures, and acidic bedrock. Recent work on altitudinal soil gradients confirms that the direction of the elevation–pH relationship depends on the co-varying factors within each specific landscape, rather than following a universal pattern [39].
Parent material is the material basis for soil formation. Soil pH directly inherits the characteristics of the parent material. Carbonate rocks release calcium and magnesium ions during weathering, leading to a neutral to alkaline soil environment. Weathering products derived from acidic bedrocks, such as granite and gneiss, cannot provide sufficient alkaline buffering and are more susceptible to acidification [40,41]. This pattern is reflected in research on cultivated soil pH in southwestern Hubei Province, where pH values of soils from different parent materials rank from highest to lowest as: carbonate rocks, purple rocks, river and lake sediments, red sandstone, sandstone, Quaternary clay, crystalline rocks, and mudstones [42]. In Pingquan City, carbonate rocks in the southwest produce soils with a pH of approximately 7.93, while acidic igneous rocks in the northwest yield soils with a lower pH of approximately 6.74. National-scale analyses have confirmed that parent material exerts a first-order control on soil pH spatial patterns at regional to continental scales [34].
A notable finding of this study is the positive correlation between precipitation and soil pH, which appears inconsistent with the general expectation that increased precipitation enhances leaching and soil acidification. However, in semi-arid mountainous areas with widespread carbonate rocks, the buffering effect of parent material can systematically reverse this relationship. Soil inorganic carbon reserves, which are substantial in arid and semi-arid regions, provide considerable acid-neutralizing capacity that can counteract precipitation-driven acidification [43]. Moderate precipitation also favors parent material weathering and ion redistribution at footslopes and cultivated areas. This finding provides a meaningful reference for spatial analysis of soil pH in similar regions where carbonate rocks are extensively distributed.
TEP showed the highest explanatory power in the analysis (q = 0.541). The central and southern parts of Pingquan City have relatively higher temperatures. These areas correspond to lower elevations, thicker soil layers, higher fine particle content, and wider distribution of carbonate rocks, which are more conducive to parent material weathering and base cation accumulation. In contrast, the low-temperature area in the northwest often co-occurs with high elevation, steep slopes, and coarse-grained soil, resulting in lower soil pH. A study in the hilly area of Chongqing City found that temperature, precipitation, and parent material have very important effects on different soil layers [13]. Similarly, a study in Lanxi City using the SHAP model found that elevation and temperature play important roles together in influencing soil pH spatial differentiation [44]. Recent machine-learning-based digital soil mapping has further demonstrated that climate variables, particularly temperature, often serve as the strongest predictors of soil pH at large spatial scales, although their high explanatory power may reflect the spatial covariation of multiple environmental gradients rather than a direct causal effect [9]. The temperature effect observed in Pingquan City is therefore not a direct thermal control on pH. Rather, temperature acts as a regional proxy that co-varies with topography, parent material, and soil development conditions. In complex terrain regions with strong spatial covariation among factors, the high explanatory power of a single factor may actually reflect the synergistic effect of multiple structural factors. Interaction detection and GeoSHAP analysis can help disentangle this covariance.
4.3. Combined Analysis Using GeoDetector and GeoSHAP
The results of analyzing the influencing factors of soil pH spatial heterogeneity using GeoDetector and GeoSHAP are generally consistent but show some differences in the contribution levels. These differences arise from the distinct analytical principles of each method.
The GeoDetector method primarily studies the global explanatory power of influencing factors on the overall spatial differentiation pattern of pH. An influencing factor can yield a relatively high q-value as long as it can effectively distinguish high-value and low-value areas at the regional scale, even if its direction of effect is not locally consistent. The GeoSHAP method, however, pays more attention to the contribution of a specific factor at each spatial location and whether this positive or negative effect changes with spatial location. Therefore, factors like average annual precipitation, slope, and organic matter, which do not have the highest global explanatory power in GeoDetector, show obvious local contribution differences in the GeoSHAP results.
The complementary nature of these two approaches has been increasingly recognized in recent environmental studies. A comprehensive framework integrating GeoDetector, CatBoost, and SHAP was recently developed to identify interactive effects of spatial drivers in soil heavy metal pollution [45]. This framework demonstrated that GeoDetector excels at identifying categorical and stratified effects, whereas SHAP-based methods capture continuous nonlinear relationships and local variations that GeoDetector may overlook. The current study extends this multi-method logic to soil pH analysis, confirming that the combined use of GeoDetector and GeoSHAP provides a more complete picture of spatial driving mechanisms than either method alone.
Using the GeoSHAP method, the influence of average annual precipitation is found to be very strong, although its single-factor q-value in GeoDetector is low. This difference arises because GeoDetector requires discretization of continuous variables, and its results are sensitive to the discretization method. GeoDetector is better at identifying factors with clear zonation. GeoSHAP, relying on the model’s ability to learn nonlinear relationships and complex interactions between variables, is more effective at identifying factors that exhibit nonlinear responses locally. An optimized multivariate-stratification geographical detector model has recently been proposed to address the discretization sensitivity limitation of the original GeoDetector [46], suggesting that future applications could benefit from such methodological refinements. GeoSHAP analysis further reveals that precipitation effects do not occur uniformly in space. Even in areas with the same high average annual precipitation, the acidification effect is weakened in areas with widespread carbonate rocks due to the buffering capacity of the parent material, while it more readily shows a negative contribution in high-altitude, coarse-grained soil areas.
Based on the above research, the joint application of spatial autocorrelation analysis, GeoDetector, and GeoSHAP constructs a replicable analytical framework. Spatial autocorrelation analysis addresses whether significant spatial clustering of soil pH exists. GeoDetector identifies which factors dominate this spatial differentiation. GeoSHAP answers how the direction and intensity of the same factor’s contribution vary across different locations. In mountainous and hilly regions with complex natural conditions, this multi-method framework provides a scientific basis for soil quality assessment, agricultural zoning, and targeted ecological restoration. This framework is not limited to soil pH studies and can be transferred to the analysis of other soil properties with spatial heterogeneity, such as soil organic matter and heavy metals. In mountainous and hilly regions worldwide characterized by complex lithology and pronounced climatic transitional features, this methodological framework offers a viable technical pathway for spatial attribution studies of soil properties.
5. Conclusions
Surface soil in Pingquan City is predominantly alkaline, with a mean pH of 7.32 and a range of 4.62 to 9.98. Higher pH values occur in the southwest and northeast, while lower values are found in the northwest. Soil pH exhibits moderate spatial variability and strong spatial autocorrelation, controlled primarily by structural factors. GeoDetector analysis identifies average annual temperature, soil texture, elevation, and bedrock lithology as the dominant drivers, with bi-factor and nonlinear enhancement prevailing among factor interactions. GeoSHAP further reveals that the direction and intensity of these effects vary across locations. Most notably, precipitation exerts a locally positive driving effect in carbonate-rock-dominated areas, where parent material buffering offsets the expected leaching–acidification pattern. Temperature has the highest global q-value of 0.541, yet functions principally as a composite proxy for co-varying topography, lithology, and texture rather than as a direct thermal driver. The integrated framework combining spatial autocorrelation analysis, GeoDetector, and GeoSHAP offers a reliable attribution pathway for soil property spatial heterogeneity in geologically complex mountainous regions, and is transferable to other soil properties such as organic matter and heavy metals.
Author Contributions
Conceptualization, J.L., Y.W. and X.L.; methodology, Y.W. and H.A.; software, Y.W. and H.A.; validation, Y.W.; formal analysis, Y.W. and J.Z.; investigation, Y.W., J.S., B.L., and W.L.; resources, J.S.; data curation, Y.W. and J.S.; writing, Y.W.; visualization, Y.W., B.L. and W.L.; supervision, J.S.; project administration, J.L. and X.L.; funding acquisition, S.H. All authors have read and agreed to the published version of the manuscript.
Funding
This research was funded by the China Geological Survey Project (DD20220954), the National Groundwater Monitoring Network Operation and Maintenance (Langfang Center, China) (DD20251300106), the China Geological Survey Project (DD202605102003), the Science and Technology Innovation Foundation of Comprehensive Survey & Command Center for Natural Resources (KC20240003), the Yanzhao Shanshui Science and Innovation Fund of Langfang Integrated Natural Resources Survey Center, the China Geological Survey (YZSSJJ202401-001), and the Open Funding Project of the Key Laboratory of Groundwater Sciences and Engineering, Ministry of Natural Resources (SK202301-4).
Data Availability Statement
The datasets presented in this article are not readily available because restrictions apply to the datasets. Specifically, the soil data are raw field survey data that belong to a project of the China Geological Survey and cannot be publicly shared. The DEM data can be accessed and downloaded from https://www.gscloud.cn. Requests to access the restricted soil datasets should be directed to Yinuo Wang, Assistant Engineer, at 17716539831@163.com.
Conflicts of Interest
The authors declare no conflicts of interest.
Appendix A
Appendix A.1
Soil types in the study area were identified following the Chinese Soil Taxonomy (CST, 3rd edition, 2022) [47], with World Reference Base (WRB, 2015) [48] equivalents provided in Table A1.
Table A1.
Main soil types and characteristics in Pingquan City.
Appendix A.2
The number and proportion of sampling points among soil types, lithology classes, land use types, and elevation zones are summarized in Table A2.
Table A2.
Distribution of sampling points by soil type, lithology, land use, and elevation.
References
- Minasny, B.; McBratney, A. Digital Soil Mapping: A Brief History and Some Lessons. Geoderma 2016, 264, 301–311. [Google Scholar] [CrossRef] [Scilit]
- Bünemann, E.K.; Bongiorno, G.; Bai, Z.; Creamer, R.E.; De Deyn, G.; De Goede, R.; Fleskens, L.; Geissen, V.; Kuyper, T.W.; Mäder, P.; et al. Soil Quality—A Critical Review. Soil Biol. Biochem. 2018, 120, 105–125. [Google Scholar] [CrossRef] [Scilit]
- Tang, Q.; Chang, L.; Wang, Q.; Miao, C.; Zhang, Q.; Zheng, L.; Zhou, Z.; Ji, Q.; Chen, L.; Zhang, H. Distribution and Accumulation of Cadmium in Soil under Wheat-Cultivation System and Human Health Risk Assessment in Coal Mining Area of China. Ecotoxicol. Environ. Saf. 2023, 253, 114688. [Google Scholar] [CrossRef] [Scilit] [PubMed]
- Yuan, Y.; Zhu, Y.; Zhao, Y.; Wang, M.; Qu, Z.; Lv, D.; Liu, Y.; Song, Y.; Wang, T.; Li, C.; et al. Soil pH and Nutrient Stoichiometry as Key Drivers of Phosphorus Availability in Crop Rotation Systems. Agronomy 2025, 15, 1023. [Google Scholar] [CrossRef] [Scilit]
- Slessarev, E.W.; Lin, Y.; Bingham, N.L.; Johnson, J.E.; Dai, Y.; Schimel, J.P.; Chadwick, O.A. Water Balance Creates a Threshold in Soil pH at the Global Scale. Nature 2016, 540, 567–569. [Google Scholar] [CrossRef] [Scilit] [PubMed]
- Hancock, G.R.; Senanayake, I.P. A Catchment Scale Assessment of Soil pH Variability: Relationship with Geomorphology and Climate. Soil Adv. 2026, 5, 100118. [Google Scholar] [CrossRef] [Scilit]
- Chen, S.; Liang, Z.; Webster, R.; Zhang, G.; Zhou, Y.; Teng, H.; Hu, B.; Arrouays, D.; Shi, Z. A High-Resolution Map of Soil pH in China Made by Hybrid Modelling of Sparse Soil Data and Environmental Covariates and Its Implications for Pollution. Sci. Total Environ. 2019, 655, 273–283. [Google Scholar] [CrossRef] [Scilit] [PubMed]
- Shen, Y.; Zhang, Z.; Xue, Y. Study on the New Dynamics and Driving Factors of Soil pH in the Red Soil, Hilly Region of South China. Environ. Monit. Assess. 2021, 193, 304. [Google Scholar] [CrossRef] [Scilit] [PubMed]
- Huang, P.; Huang, Q.; Wang, J.; Shi, Y. Predicting Surface Soil pH Spatial Distribution Based on Three Machine Learning Methods: A Case Study of Heilongjiang Province. Environ. Monit. Assess. 2025, 197, 367. [Google Scholar] [CrossRef] [Scilit] [PubMed]
- Jiachun, Z.; Zhang, Z.; Huang, X. Spatial Heterogeneity of pH and Heavy Metal Cd in the Soils of Tea Gardens in the Plateau Mountain Regions, PR China. Environ. Monit. Assess. 2021, 193, 646. [Google Scholar] [CrossRef] [Scilit] [PubMed]
- Guo, J.H.; Liu, X.J.; Zhang, Y.; Shen, J.L.; Han, W.X.; Zhang, W.F.; Christie, P.; Goulding, K.W.T.; Vitousek, P.M.; Zhang, F.S. Significant Acidification in Major Chinese Croplands. Science 2010, 327, 1008–1010. [Google Scholar] [CrossRef] [Scilit] [PubMed]
- Liu, H.; Yu, B.; Sun, Z.; He, P.; Dong, Y.; Yang, H. Spatial Variability and Driving Factors of Soil pH in the Desert Grasslands of Northern Xinjiang. Environ. Res. 2025, 276, 121489. [Google Scholar] [CrossRef] [Scilit] [PubMed]
- Zhang, Y.-Y.; Wu, W.; Liu, H. Factors Affecting Variations of Soil pH in Different Horizons in Hilly Regions. PLoS ONE 2019, 14, e0218563. [Google Scholar] [CrossRef] [Scilit] [PubMed]
- Seibert, J.; Stendahl, J.; Sørensen, R. Topographical Influences on Soil Properties in Boreal Forests. Geoderma 2007, 141, 139–148. [Google Scholar] [CrossRef] [Scilit]
- Shi, J.T.; Liu, J.J.; Zhang, J.C.; Wang, J.Y.L.; Jiang, Y.G.; Wang, M.; Li, H.F.; Yang, W.H.; Yan, X.J. Analysis of soil heavy metal influencing factors and sources in typical small watersheds in shallow mountainous area. Geophys. Geochem. Explor. 2024, 48, 834–846. [Google Scholar]
- Shi, J.; Gao, G.; Liu, J.; Jiang, Y.; Li, B.; Hao, X.; Zhang, J.; Li, Z.; Sun, H. Ecological Vulnerability Assessment and Driving Force Analysis of Small Watersheds in Hilly Regions Using Sensitivity-Resilience-Pressure Modeling. J. Groundw. Sci. Eng. 2025, 13, 209–224. [Google Scholar] [CrossRef] [Scilit]
- Goovaerts, P. Geostatistics for Natural Resources Evaluation; Oxford University Press: Oxford, UK, 1997. [Google Scholar]
- McBratney, A.B.; Mendonça Santos, M.L.; Minasny, B. On Digital Soil Mapping. Geoderma 2003, 117, 3–52. [Google Scholar] [CrossRef] [Scilit]
- Oliver, M.A.; Webster, R. Kriging: A Method of Interpolation for Geographical Information Systems. Int. J. Geogr. Inf. Syst. 1990, 4, 313–332. [Google Scholar] [CrossRef] [Scilit]
- Webster, R.; Oliver, M.A. Geostatistics for Environmental Scientists; John Wiley & Sons: Hoboken, NJ, USA, 2007. [Google Scholar]
- Wang, J.; Li, X.; Christakos, G.; Liao, Y.; Zhang, T.; Gu, X.; Zheng, X. Geographical Detectors-Based Health Risk Assessment and Its Application in the Neural Tube Defects Study of the Heshun Region, China. Int. J. Geogr. Inf. Sci. 2010, 24, 107–127. [Google Scholar] [CrossRef] [Scilit]
- Padarian, J.; McBratney, A.B.; Minasny, B. Game Theory Interpretation of Digital Soil Mapping Convolutional Neural Networks. Soil 2020, 6, 389–397. [Google Scholar] [CrossRef] [Scilit]
- Wadoux, A.M.J.-C.; Molnar, C. Beyond Prediction: Methods for Interpreting Complex Models of Soil Variation. Geoderma 2022, 422, 115953. [Google Scholar] [CrossRef] [Scilit]
- DZ/T 0295-2016; Specification of Land Quality Geochemical Assessment. Standards Press of China: Beijing, China, 2016.
- Sparks, D.L.; Page, A.L.; Helmke, P.A. Methods of Soil Analysis: Part 3 Chemical Methods; John Wiley & Sons: Hoboken, NJ, USA, 1996. [Google Scholar]
- Lehmann, R. 3σ-Rule for Outlier Detection from the Viewpoint of Geodetic Adjustment. J. Surv. Eng. 2013, 139, 157–165. [Google Scholar] [CrossRef] [Scilit]
- Andrews, S.S.; Karlen, D.L.; Mitchell, J.P. A Comparison of Soil Quality Indexing Methods for Vegetable Production Systems in Northern California. Agric. Ecosyst. Environ. 2002, 90, 25–45. [Google Scholar] [CrossRef] [Scilit]
- Doran, J.W.; Coleman, D.C.; Bezdicek, D.F.; Stewart, B.A. Defining Soil Quality for a Sustainable Environment; Soil Science Society of America and American Society of Agronomy: Madison, WI, USA, 1994. [Google Scholar]
- Gao, F.-J.; Ma, Q.-L.; Han, W.-W.; Shan, P.-M.; Zhou, J.; Zhang, S.-L.; Zhang, Z.-M.; Wang, H.-Y. Hongyan Spatial variability and distribution pattern of soil organic matter in a mollisol watershed of China. Environ. Sci. 2016, 37, 1915–1922. [Google Scholar] [CrossRef]
- Zhou, Z.; Sun, O.J.; Luo, Z.; Jin, H.; Chen, Q.; Han, X. Variation in Small-Scale Spatial Heterogeneity of Soil Properties and Vegetation with Different Land Use in Semiarid Grassland Ecosystem. Plant Soil 2008, 310, 103–112. [Google Scholar] [CrossRef] [Scilit]
- Anselin, L. Local Indicators of Spatial Association—LISA. Geogr. Anal. 1995, 27, 93–115. [Google Scholar] [CrossRef] [Scilit]
- Wang, J.-F.; Zhang, T.-L.; Fu, B.-J. A Measure of Spatial Stratified Heterogeneity. Ecol. Indic. 2016, 67, 250–256. [Google Scholar] [CrossRef] [Scilit]
- Sun, Y.; Guo, G.; Shi, H.; Liu, M.; Keith, A.; Li, H.; Jones, K.C. Decadal Shifts in Soil pH and Organic Matter Differ between Land Uses in Contrasting Regions in China. Sci. Total Environ. 2020, 740, 139904. [Google Scholar] [CrossRef] [Scilit] [PubMed]
- Zhang, W.; Wei, C.; Li, J.; Zhou, Q.; Ma, J.; Li, Y.; He, Y.; Zou, Y.; Luo, Y.; Yao, Y. Stabilization of Acidification in China’s Cropland Soils. Nat. Geosci. 2025, 18, 1125–1132. [Google Scholar] [CrossRef] [Scilit]
- Li, C.; Chang, X.; Peng, W.; Hu, X.; Li, Y.; Li, W. Spatial Variation Characteristics and Influencing Factors of Woodland Soil pH in the Jinsha River Basin. Chin. J. Soil Sci. 2024, 55, 1524–1533. [Google Scholar] [CrossRef]
- Chen, Q.; Lu, X.; Tu, C. Spatial variation and influencing factors of soil pH in Anshun City. Environ. Sci. 2022, 43, 2124–2132. [Google Scholar] [CrossRef] [Scilit] [PubMed]
- Lin, Y.; Ma, K.; Zhou, H.; Liu, W.; Fang, F.; Zhi, J. Spatial variation and driving factors of soil pH in cultivated land of Anhui Province based on geomorphic unit. Acta Sci. Circumstantiae 2023, 43, 318–330. [Google Scholar] [CrossRef]
- Zhang, X.; Xiang, D.-Q.; Yang, C.; Wu, W.; Liu, H.-B. The Spatial Variability of Temporal Changes in Soil pH Affected by Topography and Fertilization. CATENA 2022, 218, 106586. [Google Scholar] [CrossRef] [Scilit]
- Sun, J.; Li, H.; JianJi, G.; He, Y.; Xu, L.; Zhang, L.; Guan, Q.; Ye, Y.; Xu, C.; Wang, H. Influence of Altitudinal Zones on Soil Nutrient Dynamics and Fertility Constraints in Agricultural Terrains of Yunnan, China. Sci. Rep. 2025, 15, 43452. [Google Scholar] [CrossRef] [Scilit] [PubMed]
- Xiao, D.; Tang, Y.; Zhang, W.; Hu, P.; Wang, K. Lithology and Niche Habitat Have Significant Effect on Arbuscular Mycorrhizal Fungal Abundance and Their Interspecific Interactions. Sci. Total Environ. 2024, 919, 170774. [Google Scholar] [CrossRef] [Scilit] [PubMed]
- Alegro, A.; Šegota, V.; Rimac, A.; Papp, B. Diversity, Ecology and Phytogeography of Bryophytes across Temperate Forest Communities—Insight from Mt. Papuk (Croatia, SE Europe). Plants 2023, 12, 3346. [Google Scholar] [CrossRef] [Scilit] [PubMed]
- Kong, D.; Zhang, H.; He, X.; Ren, W.; Hu, Q.; Xiao, S.; Wu, X. Influencing factors of farmland soil pH in southwest Hubei based on PLSPM Model. Soils 2021, 53, 809–816. [Google Scholar] [CrossRef]
- Shi, P.; Guan, X.; Xiao, J.; Li, Z.; Gómez, J.A. Mechanisms of Soil Inorganic Carbon Migration and CO2 Exchange in Arid and Semi-Arid Regions. Eur. J. Soil Sci. 2025, 76, e70241. [Google Scholar] [CrossRef] [Scilit]
- Huang, H.; Liu, Y.; Liu, Y.; Tong, Z.; Ren, Z.; Xie, Y. Digital Mapping of Soil pH and Driving Factor Analysis Based on Environmental Variable Screening. Sustainability 2025, 17, 3173. [Google Scholar] [CrossRef] [Scilit]
- Duan, D.; Wang, P.; Rao, X.; Zhong, J.; Xiao, M.; Huang, F.; Xiao, R. Identifying Interactive Effects of Spatial Drivers in Soil Heavy Metal Pollutants Using Interpretable Machine Learning Models. Sci. Total Environ. 2024, 934, 173284. [Google Scholar] [CrossRef] [Scilit] [PubMed]
- Guo, Y.; Wu, Z.; Zheng, Z.; Li, X. An Optimal Multivariate-Stratification Geographical Detector Model for Revealing the Impact of Multi-Factor Combinations on the Dependent Variable. GISci. Remote Sens. 2024, 61, 2422941. [Google Scholar] [CrossRef] [Scilit]
- Chinese Soil Taxonomy; University of Science and Technology of China Press: Hefei, China, 2022.
- FAO. International Soil Classification System for Naming Soils and Creating Legends for Soil Maps; World Soil Resources Reports No. 106; FAO: Rome, Italy, 2015. [Google Scholar]

Disclaimer/Publisher’s Note: The statements, opinions and data contained in all publications are solely those of the individual author(s) and contributor(s) and not of MDPI and/or the editor(s). MDPI and/or the editor(s) disclaim responsibility for any injury to people or property resulting from any ideas, methods, instructions or products referred to in the content. |
© 2026 by the authors. Licensee MDPI, Basel, Switzerland. This article is an open access article distributed under the terms and conditions of the Creative Commons Attribution (CC BY) license.