


Abstract
Groundwater is an important resource for domestic, agricultural, and ecological use in the Surat Thani basin, southern Thailand, where increasing demand from agriculture, urbanization, and tourism is placing pressure on aquifer systems. This study investigates groundwater recharge and basin-scale flow dynamics using integrated numerical groundwater modeling, stable isotope analysis, and hydrochemical interpretation. A three-layer MODFLOW model representing floodplain (Qfd), terrace (Qt), and semi-consolidated aquifers was calibrated for 2018–2024 using PEST with pilot-point parameterization. Despite there being only four observation wells, the model achieved excellent agreement between simulated and observed heads (weighted RMSE = 0.0707 m). Simulated groundwater generally flows from western uplands toward the central floodplain and eastern coastal plain, with the Tapee River acting mainly as a gaining stream. Recharge rates range from 1.2 to 77.3 mm/yr (mean 23.7 mm/yr), representing only 1–4% of annual precipitation, while evapotranspiration is the dominant form of water loss. Stable isotope signatures (δ2H, δ18O) indicate recharge from direct monsoonal rainfall with minimal evaporation. Hydrochemical facies evolve from Ca–HCO3 recharge waters to mixed facies along downgradient flow paths, reflecting increasing residence time and water–rock interaction. The results identify western and northern upland areas as key recharge zones requiring long-term protection and sustainable groundwater management.
1. Introduction
Groundwater is a vital water resource for domestic consumption, agriculture, aquaculture, and industrial development throughout tropical Southeast Asia. In southern Thailand, groundwater dependency has intensified due to expanding agricultural production, population growth, and economic development [1]. Understanding groundwater recharge processes and flow dynamics is essential for sustainable resource management, particularly in regions experiencing rapid land-use change and increasing water demand.
Surat Thani Province, the largest province in southern Thailand, exemplifies these challenges. The province is well known for its extensive rubber and oil palm plantations, coconut farms, and fruit orchards, particularly durian production, as well as inland and coastal aquaculture operations, all of which require substantial water resources throughout the year [2]. The intensification of cash crop farming has contributed to higher water demand, especially in rural communities, while urbanization around Surat Thani City and along the Tapee River corridor has expanded significantly. The spatial structure of the city continues to evolve with growing economic diversity and tourism-related activities [3]. National urbanization trends indicate that built-up areas in southern Thailand, including Surat Thani, increased substantially between 2000 and 2020 [1], further amplifying extraction pressures on local aquifers. The Department of Groundwater Resources has identified Surat Thani as one of the provinces where groundwater demand continues to rise, with current usage estimated at 30.6 Mm3/yr [4], leading to concerns about potential over-extraction, declining groundwater levels, and risks of seawater intrusion in coastal aquifers.
Numerical groundwater flow modeling has become a standard tool for quantifying aquifer behavior, water budgets, and the response of groundwater systems to abstraction and climatic stress [5,6]. The finite-difference code Modular Finite-Difference Groundwater Flow Model (MODFLOW), coupled with parameter-estimation software such as PEST, allows spatially distributed hydraulic and recharge parameters to be inferred even in data-scarce settings through pilot-point regularization [7,8,9]. In northern Thailand, such approaches have been applied successfully to the intermontane Chiang Mai–Lamphun basin, where comparatively dense piezometer networks supported detailed calibration [10,11]; comparable basin-scale modeling for southern Thailand, however, remains scarce. In parallel, environmental stable isotopes of hydrogen (δ2H) and oxygen (δ18O) have been widely used to identify recharge sources, quantify evaporative enrichment, and trace surface water–groundwater interaction [12,13,14,15,16], while major-ion hydrochemistry and Piper-type facies analysis reveal water–rock interaction and flow-path evolution [17,18]. Recharge in humid tropical basins is strongly modulated by high evapotranspiration and intense, seasonal monsoonal rainfall, making basin-specific quantification essential [19,20]. Globally, groundwater systems are increasingly recognized as vulnerable to combined abstraction and climatic pressures [21,22], underscoring the need for integrated, multi-tracer assessments in rapidly developing regions.
Despite these mounting pressures, research on groundwater potential and extraction impacts in the Surat Thani basin, particularly within the Tapee River basin, has been limited [23]. Previous hydrogeological investigations have focused primarily on aquifer characterization and well inventory, but comprehensive basin-scale assessments integrating numerical modeling, water budget analysis, and geochemical tracers remain lacking. This knowledge gap hinders effective groundwater management and planning in a region where water resources are increasingly stressed by competing demands and climatic variability.
The novelty of this study lies in providing the first integrated, basin-scale assessment of the Surat Thani (Tapee River) basin that combines a calibrated three-dimensional MODFLOW–PEST flow model, a complete basin water budget, and independent geochemical validation using stable isotopes and hydrochemical facies. In contrast to earlier work that relied on either aquifer inventories or isotope data alone, the present study demonstrates that robust recharge and flow characterization is achievable in a data-limited tropical basin by reconciling three independent lines of evidence, thereby providing a transferable framework for similar ungauged or sparsely monitored basins in Southeast Asia.
This study addresses this gap through three integrated components: (1) the characterization of the aquifer system and its hydraulic behavior using a calibrated three-dimensional numerical groundwater flow model; (2) the quantification of recharge and basin-wide water budget components, incorporating climate data and flow-boundary interactions; and (3) the interpretation of groundwater recharge sources and flow-path evolution using stable isotopes (δ2H, δ18O) and hydrochemical facies analysis. The specific objectives of this study are as follows:
- To develop and calibrate a three-dimensional MODFLOW groundwater flow model for the Surat Thani basin using available monitoring data from 2018 to 2024, supplemented by PEST parameter estimation to optimize model performance despite limited observation well coverage;
- To quantify the basin-scale water budget and identify major inflow and outflow components controlling groundwater dynamics;
- To characterize groundwater recharge processes and sources using stable isotope (δ2H, δ18O) and major-ion chemistry to distinguish meteoric recharge from surface water interaction and to trace flow-path evolution; and
- To assess the sustainability of current groundwater use and identify critical recharge zones requiring protection for long-term water security.
In contrast to previous studies in northern Thailand that utilized extensive groundwater monitoring networks, for example, 48 piezometers in the Chiang Mai–Lamphun basin [10,11], the Surat Thani basin is characterized by a much sparser network of observation wells. Groundwater head data for this study were available from only four monitoring with continuous records during 2018–2024 [24]. To address these constraints, the dataset was supplemented with hydrogeological parameters from pumping tests, rainfall and evaporation records, baseflow estimates from hydrograph separation, and stable isotope data. The PEST program [7,8] was employed in conjunction with MODFLOW to optimize parameter estimation through pilot-point techniques and reduce calibration uncertainty, thereby enabling a more robust assessment of recharge dynamics and groundwater flow behavior despite data limitations.
Stable isotopes of hydrogen (δ2H) and oxygen (δ18O) are widely used tracers for identifying recharge sources, distinguishing between surface water and groundwater contributions, and characterizing hydrological processes [12,13]. Despite increasing pressure on groundwater resources in the Surat Thani basin, isotopic studies have been limited. This study incorporates stable isotope analysis and hydrochemical facies interpretation to clarify surface water–groundwater interactions, validate model conceptualization, and improve understanding of basin hydrogeology.
The combined modeling, isotopic, and hydrochemical approaches provide a basin-scale understanding of groundwater dynamics, recharge mechanisms, and the sustainability of current groundwater use. These findings establish a scientific foundation for delineating recharge-protection areas, guiding land-use planning in upland zones, and supporting long-term sustainable groundwater resource management under changing climatic and socioeconomic conditions. Issues of groundwater quality, such as coastal salinity risks or localized contamination, are acknowledged for context but remain outside the scope of the present analysis, which focuses on recharge processes and flow dynamics.
2. Study Area and Hydrogeological Setting
2.1. Study Area
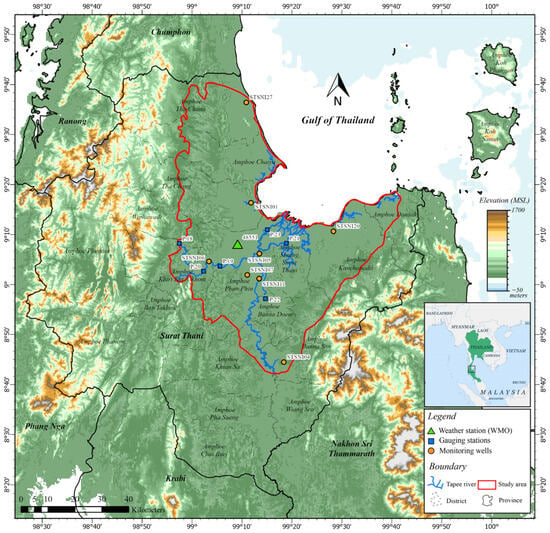
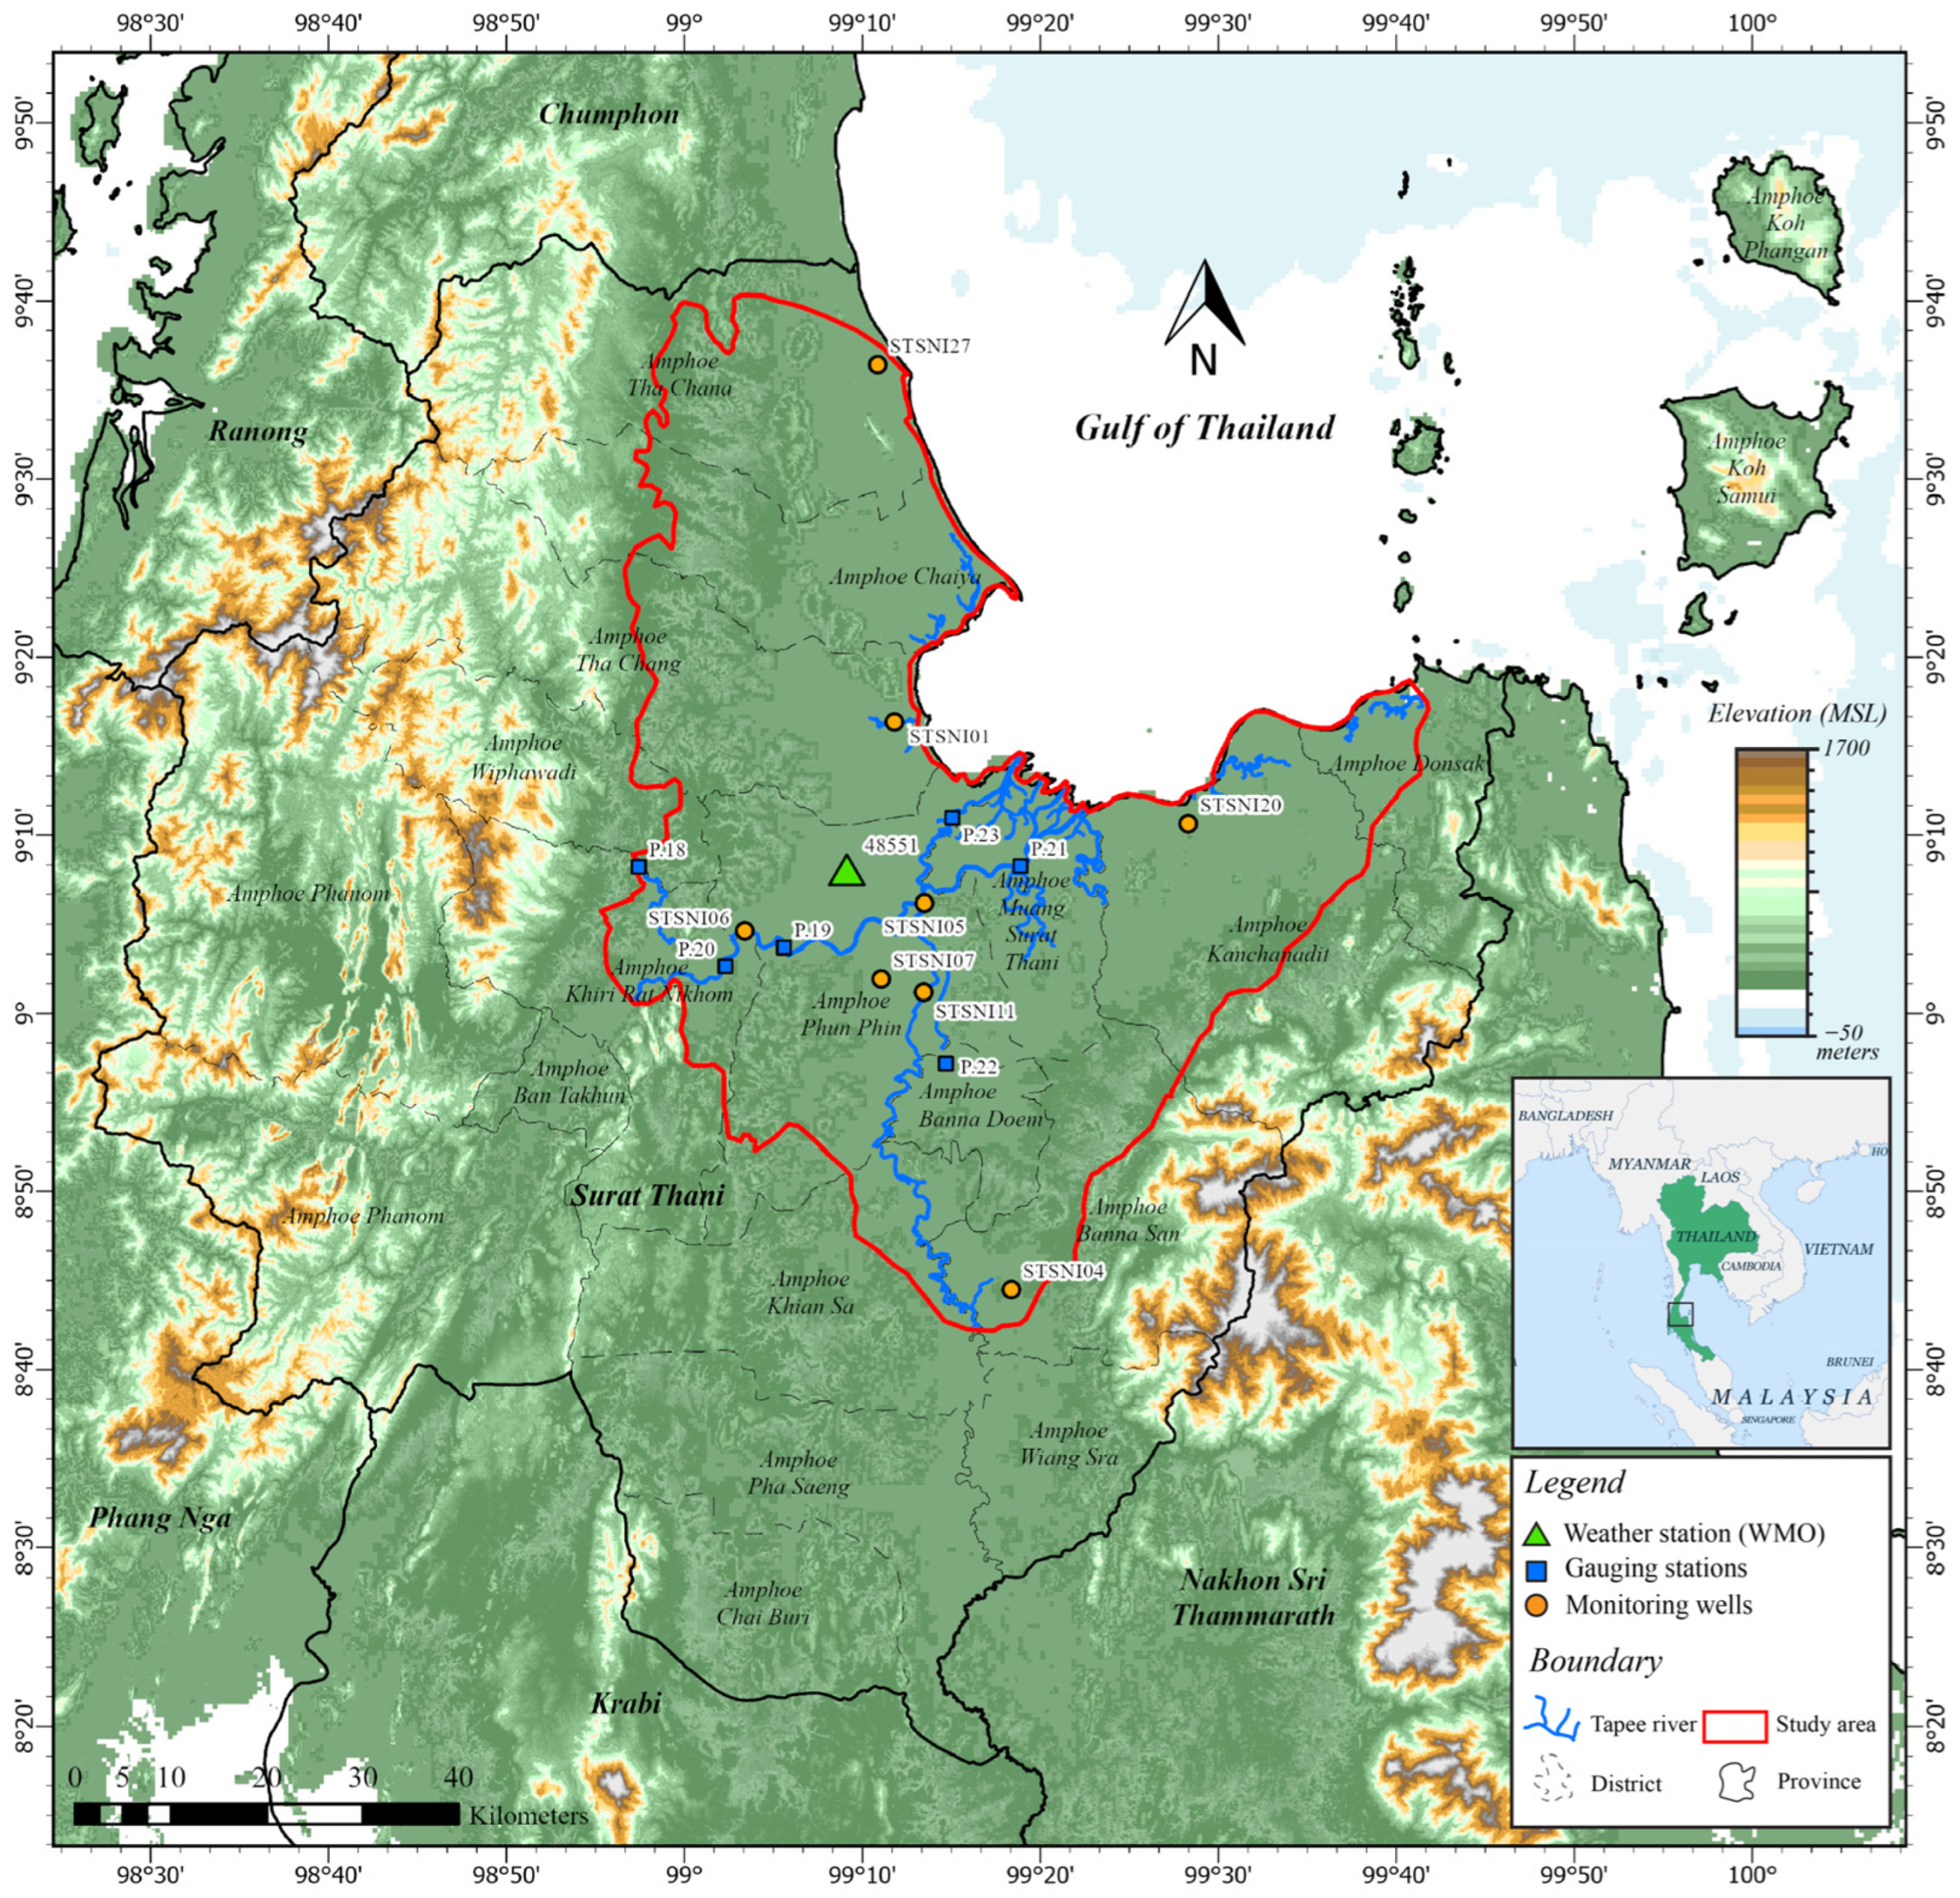
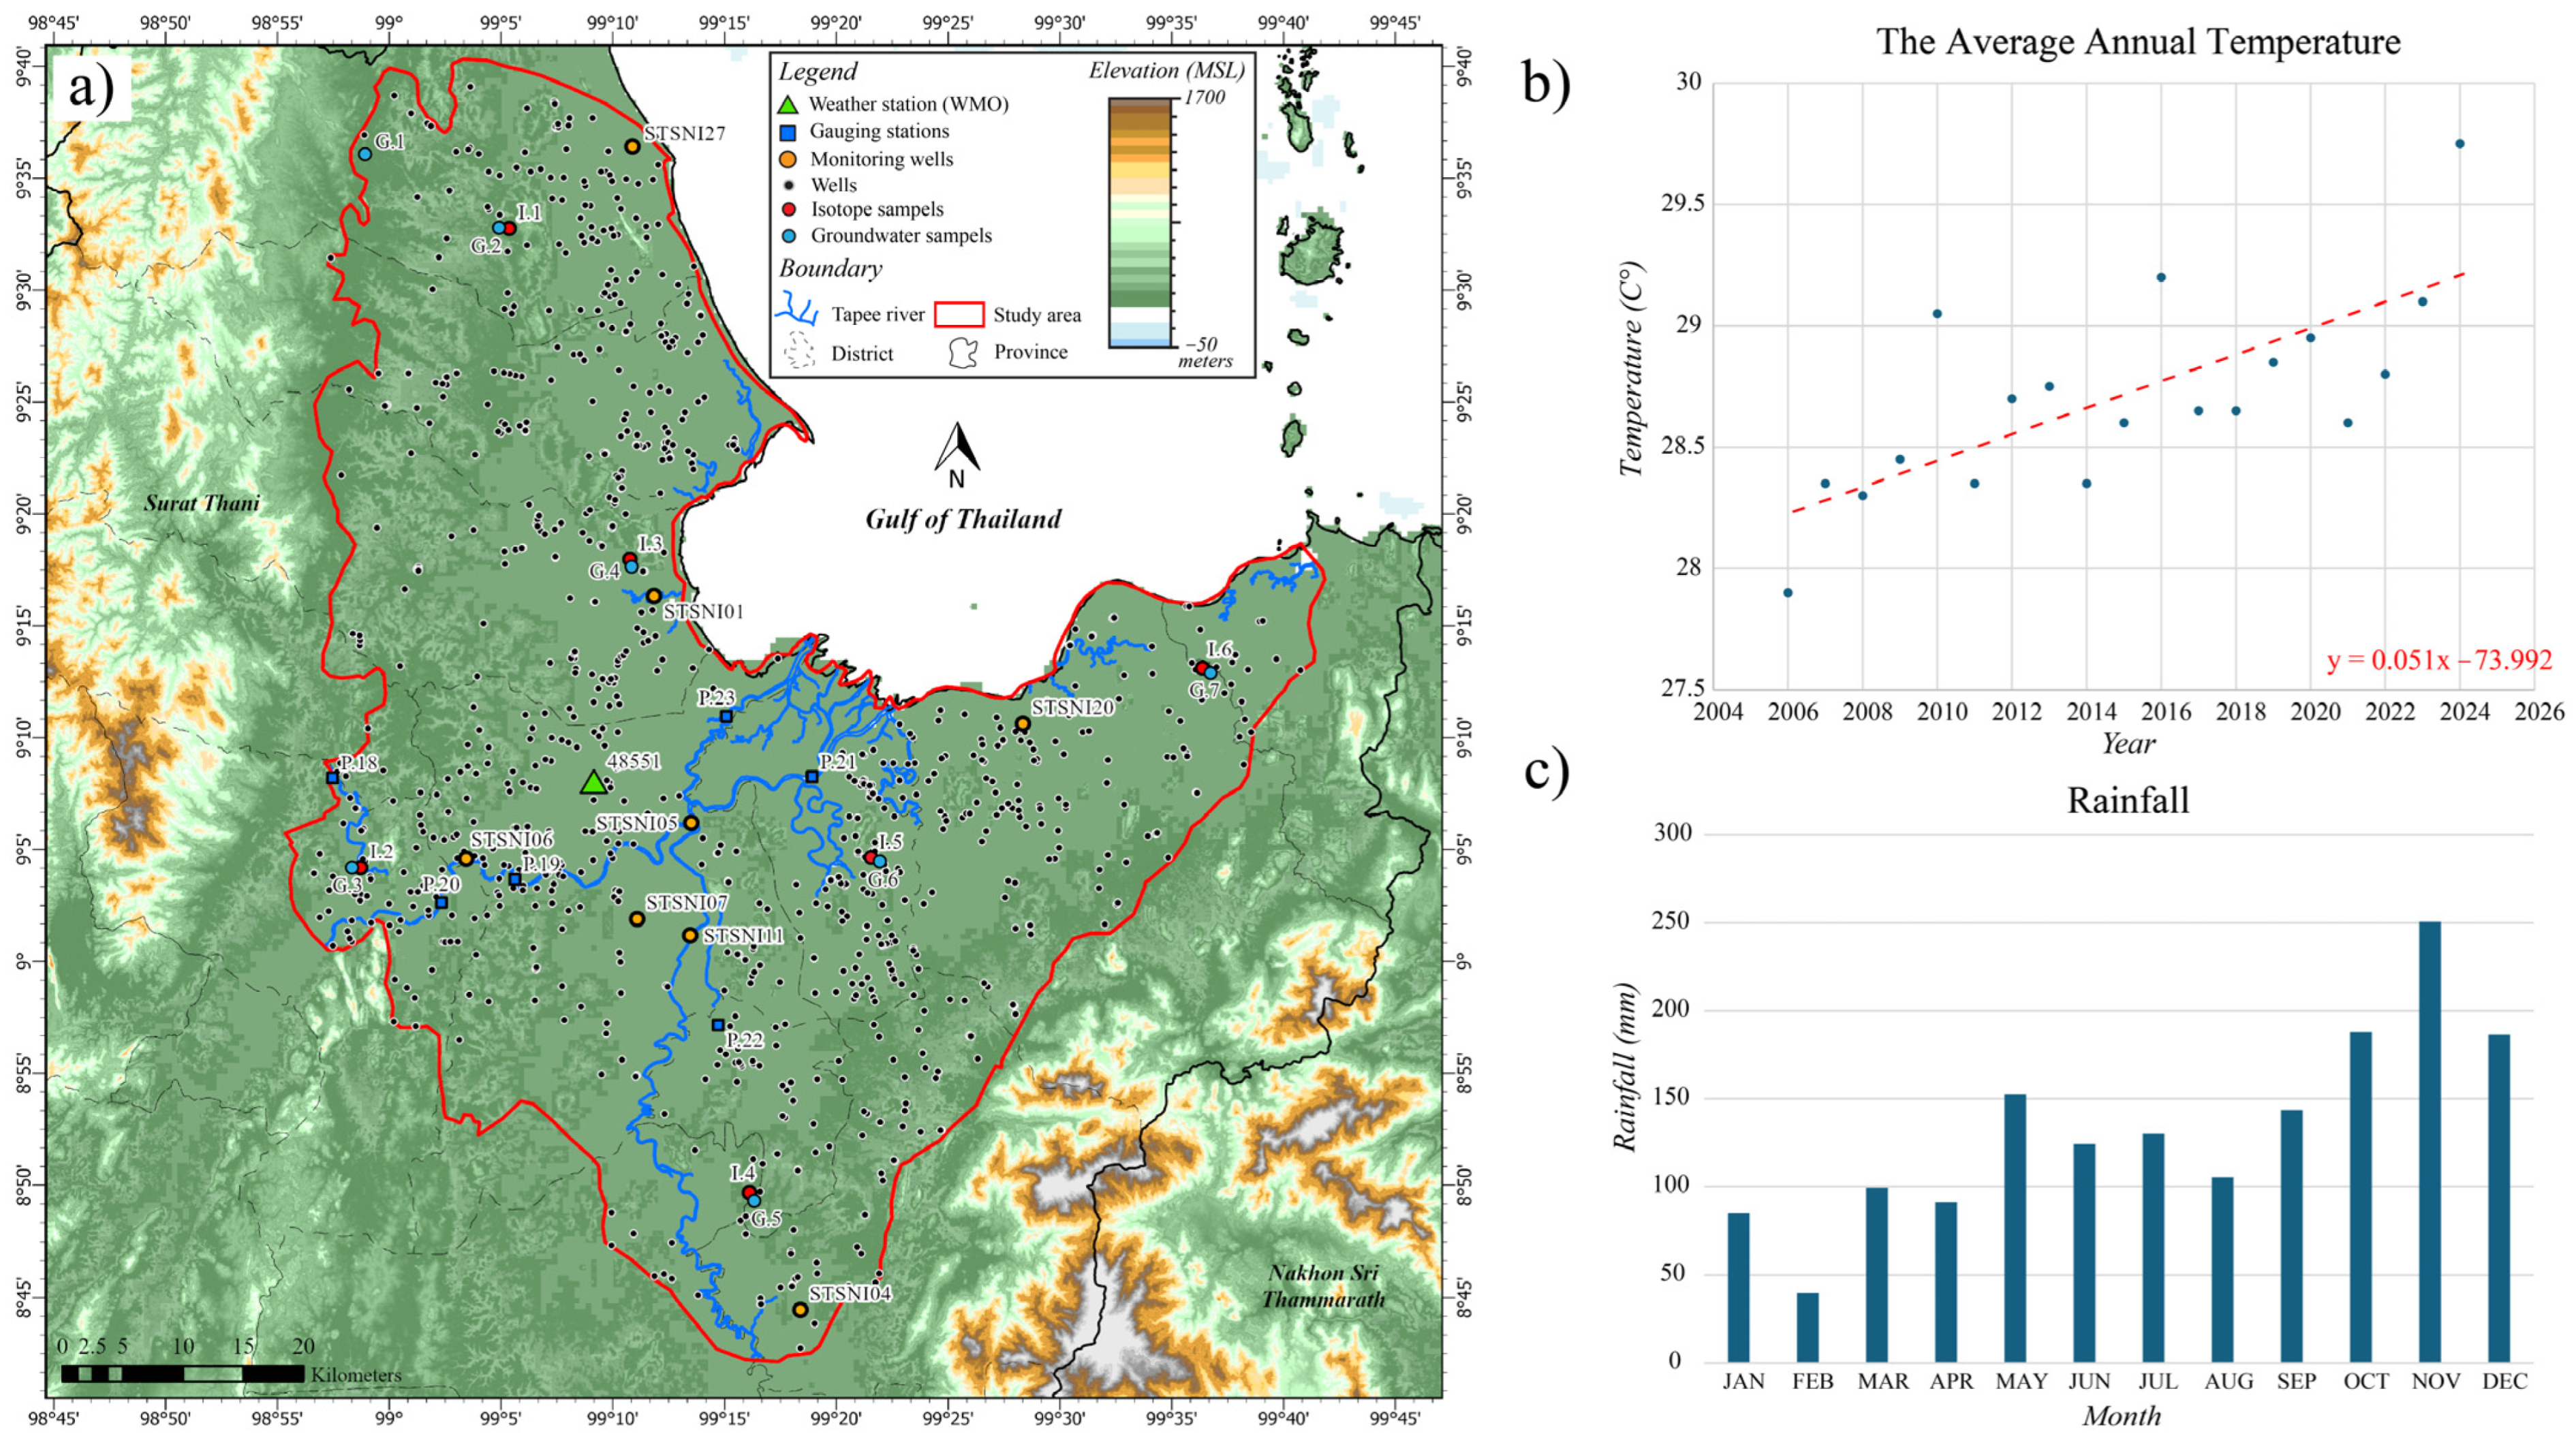
The Surat Thani basin is located in southern Thailand within the Tapee River watershed, which drains into the Gulf of Thailand (Figure 1). The basin is characterized by a lowland alluvial plain bordered by hill ranges to the west and north, with elevations ranging from sea level along the coast to over 1000 m in the upland margins. The Tapee River and its tributaries form the main surface drainage system, flowing generally eastward through the central basin before discharging into the Gulf of Thailand. The study area encompasses the Tapee River basin, which covers approximately 13,450 km2 and lies approximately between latitudes 8°42′ and 9°40′ N and longitudes 98°55′ and 99°40′ E, with Surat Thani City located at about 9°08′ N, 99°19′ E.
Figure 1.
The digital elevation map of the Surat Thani basin.
2.2. Geological Setting
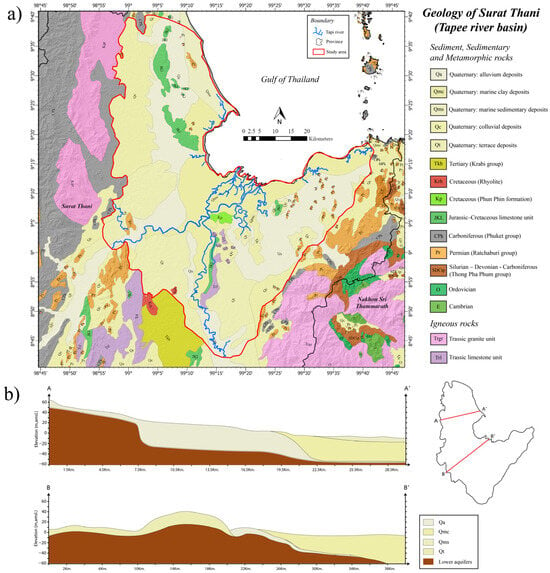
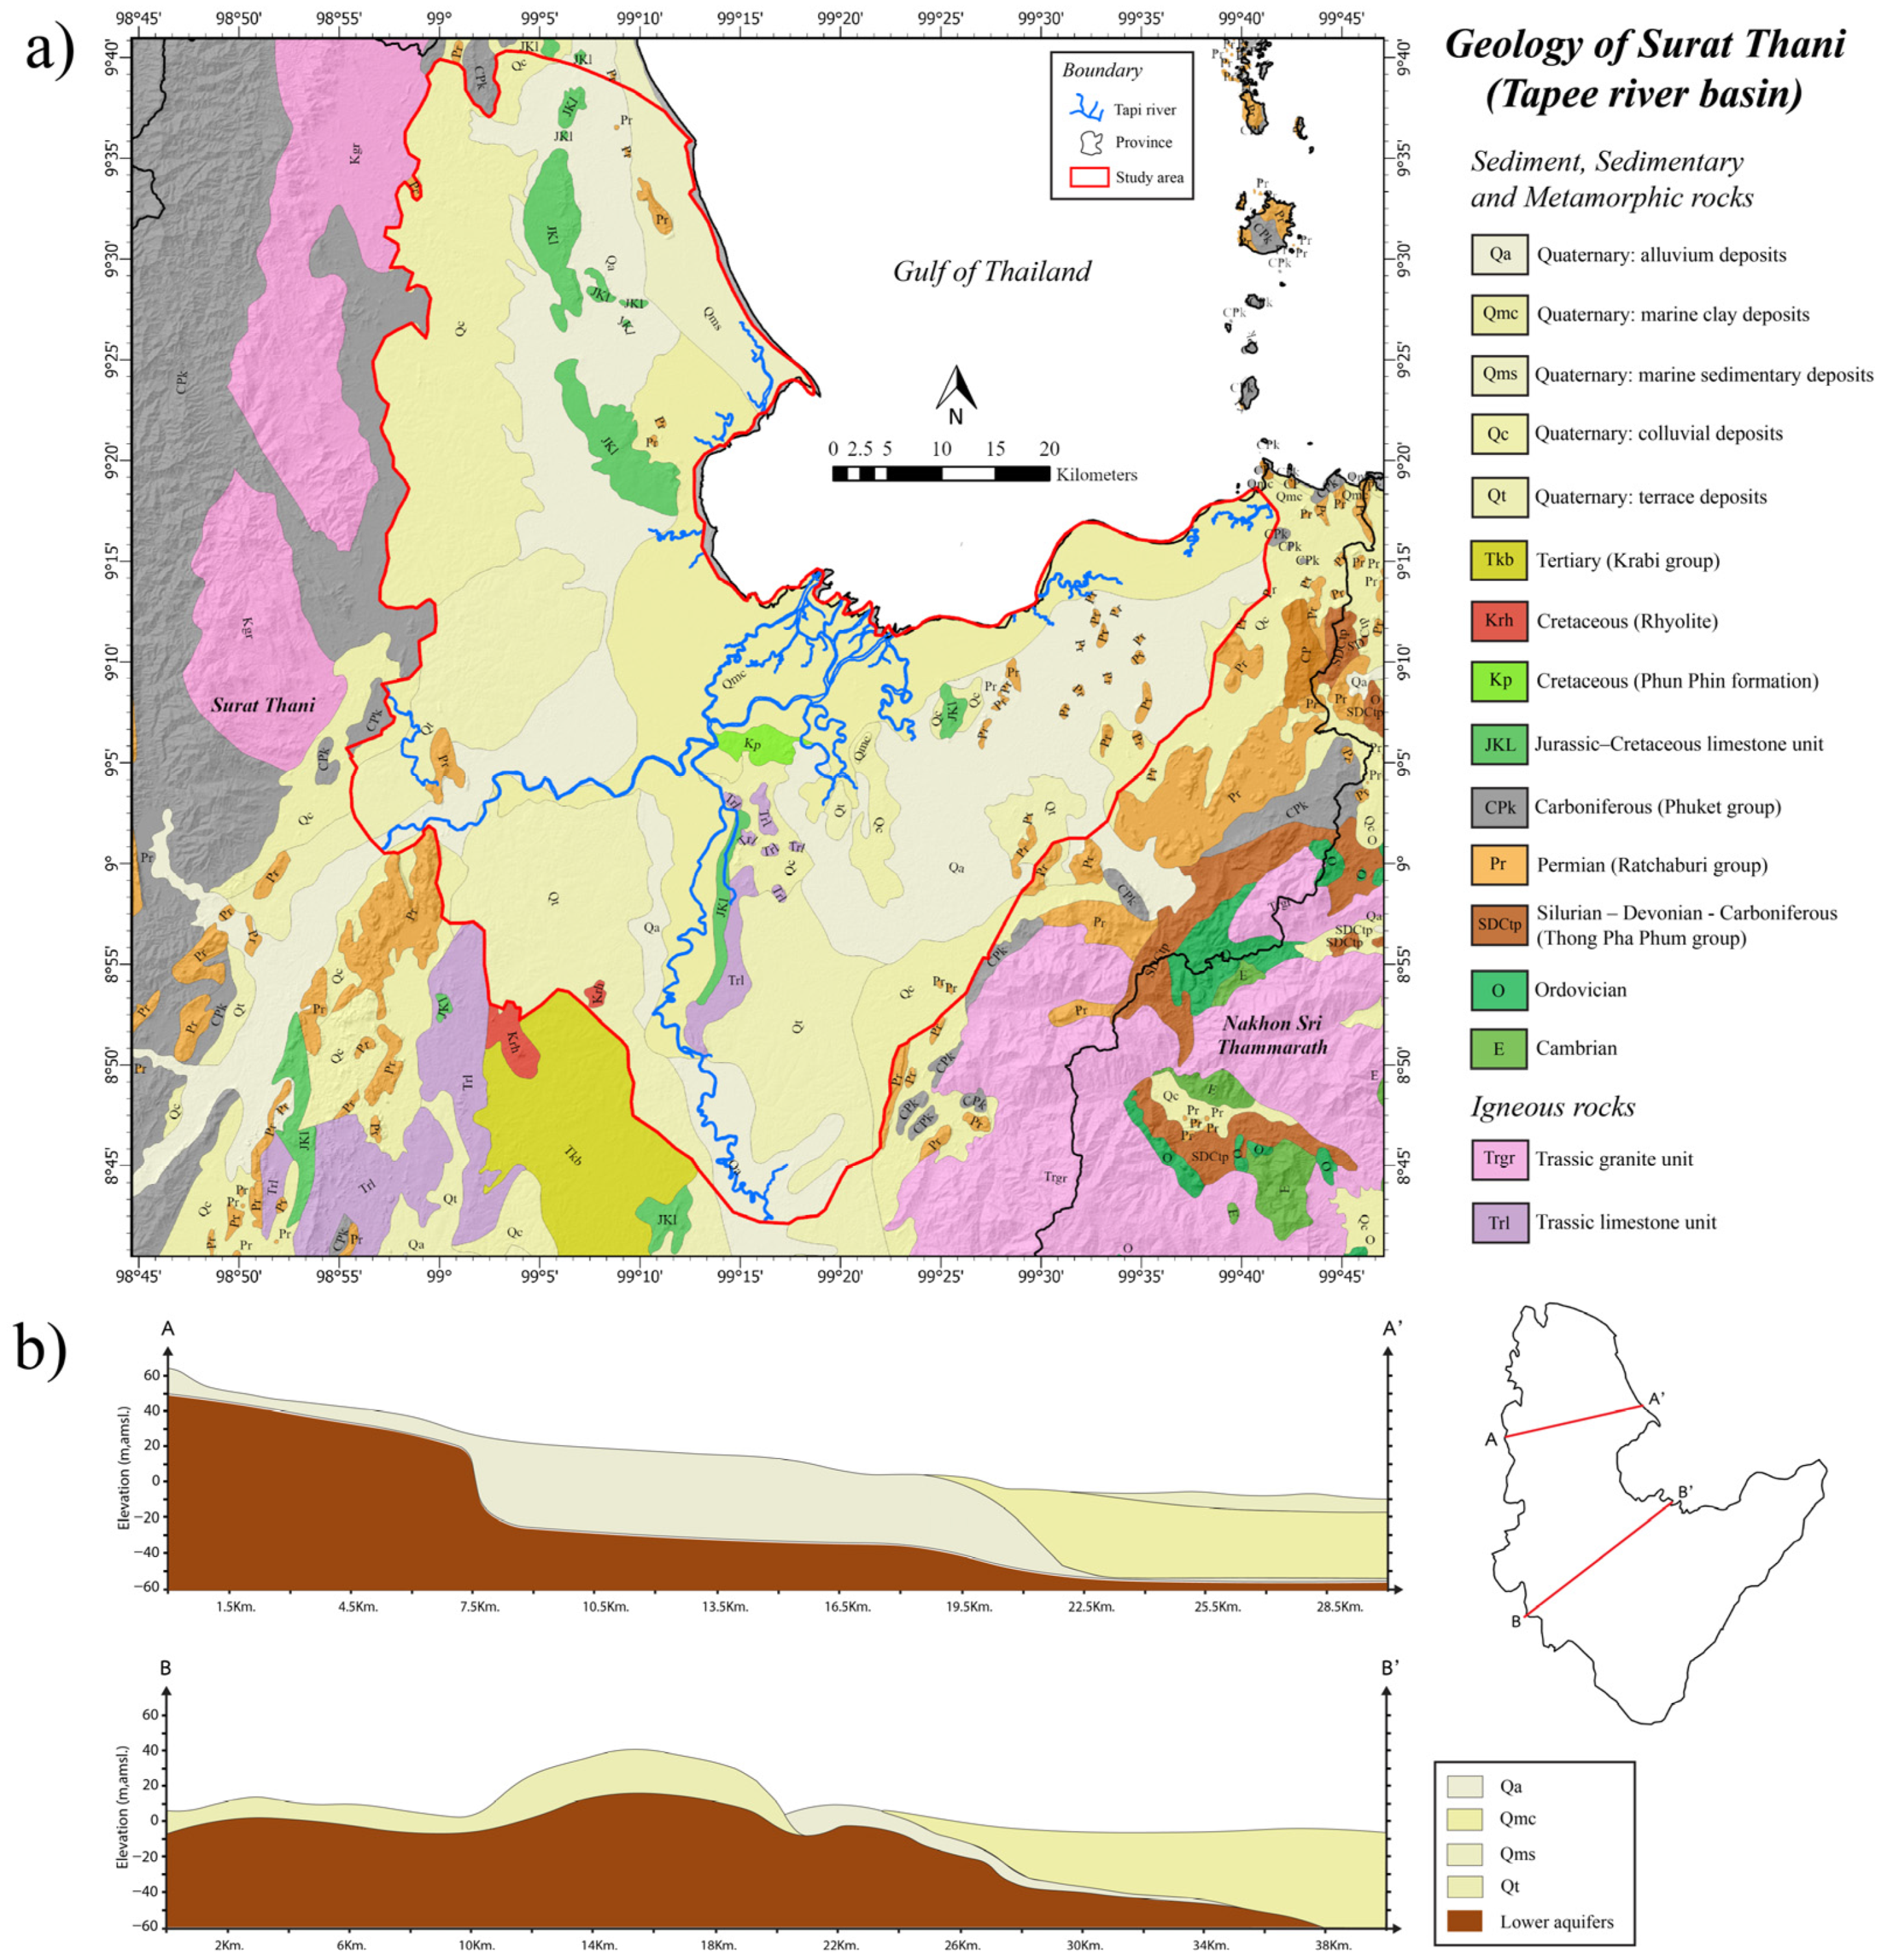
The regional geology reflects a lowland basin setting underlain by Quaternary alluvial and terrace deposits that overlie semi-consolidated sediments and weathered bedrock (Figure 2a). The bedrock consists primarily of Paleozoic to Mesozoic metamorphic and sedimentary rocks, including Carboniferous Phuket Group limestones, Permian to Triassic clastics, and Cretaceous sediments [25]. These bedrock units form the structural base of the aquifer system but are not significant water-bearing zones in the basin interior.
Figure 2.
(a) Hydrogeologic units of the Surat Thani (Tapee River) basin (modified from [25]), overlain by model grids used in groundwater flow modeling. (b) Hydrogeologic cross-sections of the unconsolidated aquifers (Q’s) along lines A–A′ and B–B′. Note that lower units are grouped into the semi-consolidated aquifer.
Structurally, the Surat Thani basin is a fault-influenced Cenozoic depression developed on a deformed Paleozoic–Mesozoic basement and infilled by Tertiary to Quaternary sediments [25]. The pre-Cenozoic basement comprises Carboniferous Phuket Group metasediments and limestones, Permian Ratburi Group limestones, Permo-Triassic clastic and volcanic rocks, and Cretaceous granitic and sedimentary units, which crop out in the surrounding hill ranges to the west, north, and east and form the low-permeability boundaries of the basin. Within the basin, these consolidated rocks are unconformably overlain by Tertiary semi-consolidated sediments and by Quaternary colluvial, terrace, and floodplain deposits that host the principal aquifers. The distribution of these units (Figure 2a) controls the geometry and lateral continuity of the aquifer system, while the surrounding crystalline and carbonate highlands act as recharge-generating catchments and lateral-flow boundaries. The geological framework therefore exerts a first-order control on groundwater occurrence, recharge, and the hydrochemical evolution discussed in the following sections.
2.3. Hydrogeology
The aquifer system can be grouped into three principal hydrostratigraphic units based on lithologic logs and cross-sectional analysis (Figure 2b). The floodplain deposits (Qfd) form a shallow aquifer 0 to 50 m thick, with an unconfined upper zone averaging approximately 30 m in thickness in eastern and low-lying areas. Near the coast, unconsolidated sediments approximately 20 m thick overlie semi-confined layers that extend to approximately 50 m depth. In the central basin, the Qfd aquifer occurs at approximately 40 m depth beneath clay cover, creating semi-confined to confined conditions. Overlying the floodplain deposits, the terrace unit (Qt) ranges from 20 to 100 m in thickness and consists of both shallow unconfined and deeper confined sub-aquifers. Beneath these deposits, semi-consolidated sediments and weathered bedrock form confined aquifers 80 to 200 m thick, representing the deepest exploited groundwater resources in the basin.
The three hydrostratigraphic units are not fully isolated but are partially hydraulically connected through discontinuous clay aquitards and laterally variable confining layers. The hydrogeological cross-sections along lines A–A′ and B–B′ (Figure 2b) show that the unconfined-to-semiconfined floodplain unit (Qfd) and the underlying terrace unit (Qt) are in places separated by clay lenses of limited lateral extent, permitting vertical leakage where these lenses pinch out, whereas toward the basin center thicker clay cover produces semi-confined to confined conditions. The deeper semi-consolidated unit is hydraulically connected to the overlying Quaternary aquifers mainly along the basin margins and through weathered and fractured zones. This partial vertical connectivity was represented in the numerical model through a vertical anisotropy ratio and inter-layer leakance rather than as fully independent aquifers. Representative hydraulic conductivity (K) and storage (S) values for each unit, compiled from Department of Groundwater Resources pumping tests and previous investigations [23,24], are summarized in Table 1 and were used as initial inputs and calibration constraints for the flow model.
Table 1.
Hydraulic conductivities and storage coefficients of grouped hydrostratigraphic units in the Surat Thani basin (compiled from [23]).
The Qfd and Qt aquifers are the most heavily exploited groundwater resources in the Surat Thani basin, particularly in agricultural zones along the Tapee River (Figure 3a). Pumping test results compiled by the Department of Groundwater Resources indicate well yields ranging from less than 2 to over 20 m3/h, reflecting considerable heterogeneity within the aquifer system [24]. Hydraulic conductivity values compiled from previous hydrogeological investigations range from 0.01 to 15 m/d for Qfd, 0.02 to 25 m/d for Qt, and 0.10 to 10 m/d for semi-consolidated sediments [23]. Groundwater quality is generally good, with total dissolved solids typically below 250 mg/L in the interior basin. Elevated salinity is observed mainly in coastal aquifers where seawater influence occurs [26].
Figure 3.
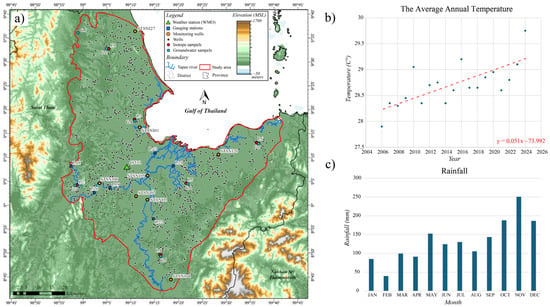
Sampling locations and climatic characteristics of the Surat Thani basin. (a) Spatial distribution of isotope samples, groundwater-quality samples, monitoring wells, and gauging stations and weather station overlaid on the basin DEM. (b) Trend of annual mean temperature (2006–2024), showing steady warming. (c) The 30th years average monthly rainfall pattern, highlighting peak monsoonal precipitation used to support recharge estimation.
2.4. Climate and Meteorological Conditions
The climate of the Surat Thani basin is classified as tropical monsoon (Köppen classification Am), characterized by high humidity, elevated temperatures, and distinct wet and dry seasons. Temperature data from the Surat Thani meteorological station over the past 18 years (2006–2024) reveal a warming trend, reflecting regional climate change impacts. Annual average temperatures increased from approximately 27.6 °C in 2006 to 29.3 °C in 2024, representing a rise of approximately 1.7 °C over the study period, with an average rate of increase of approximately 0.09 °C per year (Figure 3b). This trend aligns with global patterns of rising temperatures and emphasizes the vulnerability of groundwater-dependent basins in tropical regions where changes in temperature directly affect evapotranspiration rates and recharge potential.
Rainfall data obtained from the Surat Thani meteorological station (WMO–48551) indicate strong seasonal patterns controlled by the Southwest and Northeast monsoons (TMD, 2025). The 30–year average annual precipitation is approximately 1876 mm/yr. The highest precipitation occurs during the monsoon season from June to November, with peak monthly rainfall in October (250.7 mm) and November (186.5 mm). In contrast, the dry season from December to May experiences minimal rainfall, particularly in February (33.8 mm) and March (90.0 mm) (Figure 3c). This pronounced seasonality strongly influences groundwater recharge patterns, with the majority of infiltration occurring during the wet season.
Evapotranspiration (ET) represents a major component of the water balance in the humid tropical environment of the Surat Thani basin. Based on meteorological data, the average annual potential ET is approximately 1280 mm/yr. Monthly ET varies inversely with rainfall patterns, reaching maximum values in March (approximately 142 mm) during the hot dry season when temperatures are highest and humidity is lowest. Minimum ET occurs in October (approximately 74 mm), corresponding to cooler temperatures and higher humidity during peak monsoon conditions. The high ET rates relative to recharge emphasize the importance of seasonal rainfall for maintaining groundwater levels and sustaining baseflow to rivers during dry periods.
2.5. Groundwater Recharge Estimation
Groundwater recharge represents the primary input to the groundwater balance of the Surat Thani basin and is strongly influenced by rainfall patterns, land-use characteristics, soil properties, and topography. Previous estimates by the Department of Groundwater Resources have been based primarily on empirical methods using rainfall percentages, but basin-specific recharge rates remain poorly constrained.
For this study, preliminary recharge estimates were developed using rainfall data from the Thai Meteorological Department [27] for the period 2000–2024. Land use data were classified into agricultural and urban/built-up areas, with recharge assigned as a percentage of precipitation for each category. Based on land-use characteristics, slope conditions, and soil infiltration capacity, recharge coefficients were estimated to range from 5% to 15% of annual precipitation. These preliminary estimates suggest groundwater recharge varies from approximately 94 to 281 mm/yr across the basin, depending on local conditions. However, these estimates require validation through calibrated modeling and independent verification using environmental tracers.
The spatial distribution of recharge is expected to be highly variable, with higher rates in permeable terrace deposits and upland areas where runoff is limited and infiltration capacity is high. Lower recharge rates are expected in the floodplain areas where fine-grained sediments, clay layers, and shallow water tables limit infiltration. Urban areas may experience reduced recharge due to impervious surfaces, while agricultural areas with irrigation may receive enhanced recharge during the dry season.
2.6. Stable Isotopes as Tracers of Groundwater Recharge
Surface water and groundwater are interconnected components of the hydrologic system, and understanding their interaction is essential for effective water resource management. Stable isotopes of hydrogen (δ2H) and oxygen (δ18O) have been widely used as natural tracers for identifying recharge sources, distinguishing between surface water and groundwater contributions, and characterizing hydrological processes such as evaporation, mixing, and residence time [12,13].
The isotopic composition of precipitation reflects temperature, altitude, and moisture source effects, creating characteristic relationships between δ2H and δ18O known as meteoric water lines. Groundwater recharged directly from precipitation typically plots along or near these meteoric water lines, while water affected by evaporation before infiltration shows enrichment in heavier isotopes and deviates from the meteoric water line. By comparing groundwater isotopic signatures with those of precipitation and surface water, recharge sources and flow paths can be identified.
In tropical monsoon climates such as southern Thailand, seasonal variations in rainfall amount and isotopic composition can influence the isotopic signature of recharge. Intense monsoonal rainfall typically has more depleted (more negative) isotopic values compared to lighter rainfall events. Rapid infiltration during high-intensity rainfall events minimizes evaporative enrichment, resulting in groundwater that closely reflects the isotopic composition of precipitation.
Despite the utility of stable isotopes for recharge assessment and the increasing pressure on groundwater resources in the Surat Thani basin, isotopic studies in this region have been limited. This study incorporates stable isotope analysis of groundwater, surface water, and precipitation to: (1) identify the primary sources of groundwater recharge; (2) distinguish between direct precipitation recharge and surface water infiltration; (3) assess the degree of evaporative enrichment prior to recharge; and (4) characterize flow-path evolution and water–rock interaction along regional flow paths. These isotopic data, combined with hydrochemical facies analysis, provide independent validation of the conceptual groundwater flow model and enhance understanding of recharge processes at the basin scale.
3. Material and Methods
3.1. Stable Isotope and Hydrochemical Sampling and Analysis
Groundwater, rainwater, and surface water samples were collected during the wet season (October to December 2024) to analyze the isotopic composition of δ2H and δ18O in the Surat Thani basin. A total of 11 groundwater samples were obtained from wells with depths ranging from 30–169 m below ground surface (bgs), and 4 surface water samples were collected from the Tapee River and its tributaries (Figure 3a). The stable isotope analyses of water samples (δ2H and δ18O) were conducted at the Research and Development Center for Nuclear Technology, Thailand Institute of Nuclear Technology (Public Organization). Measurements were performed using a laser spectroscopic analyzer for liquid water, which provides high-precision determination of isotope ratios.
3.2. Conceptual Model Setup
The conceptual groundwater flow model of the Surat Thani basin was developed from hydrogeological surveys, borehole lithologic logs, and technical reports of the Department of Groundwater Resources. The aquifer system consists mainly of unconsolidated to semi-consolidated alluvial and terrace deposits overlying semi-consolidated sediments and weathered bedrock, which were grouped into three principal hydrostratigraphic units. The Qfd form a shallow aquifer, 0–50 m thick. The upper part is mostly unconfined (~30 m) in eastern and low-lying areas, while toward the coast unconsolidated sediments (~20 m) overlie semi-confined layers that extend to ~50 m. In the central basin, the aquifer occurs at ~40 m depth beneath clay cover. Overlying Qfd, the Qt are 20–100 m thick and include shallow unconfined and deeper confined sub-aquifers. Beneath these, semi-consolidated sediments and weathered bedrock form deeper confined aquifers 80–200 m thick.
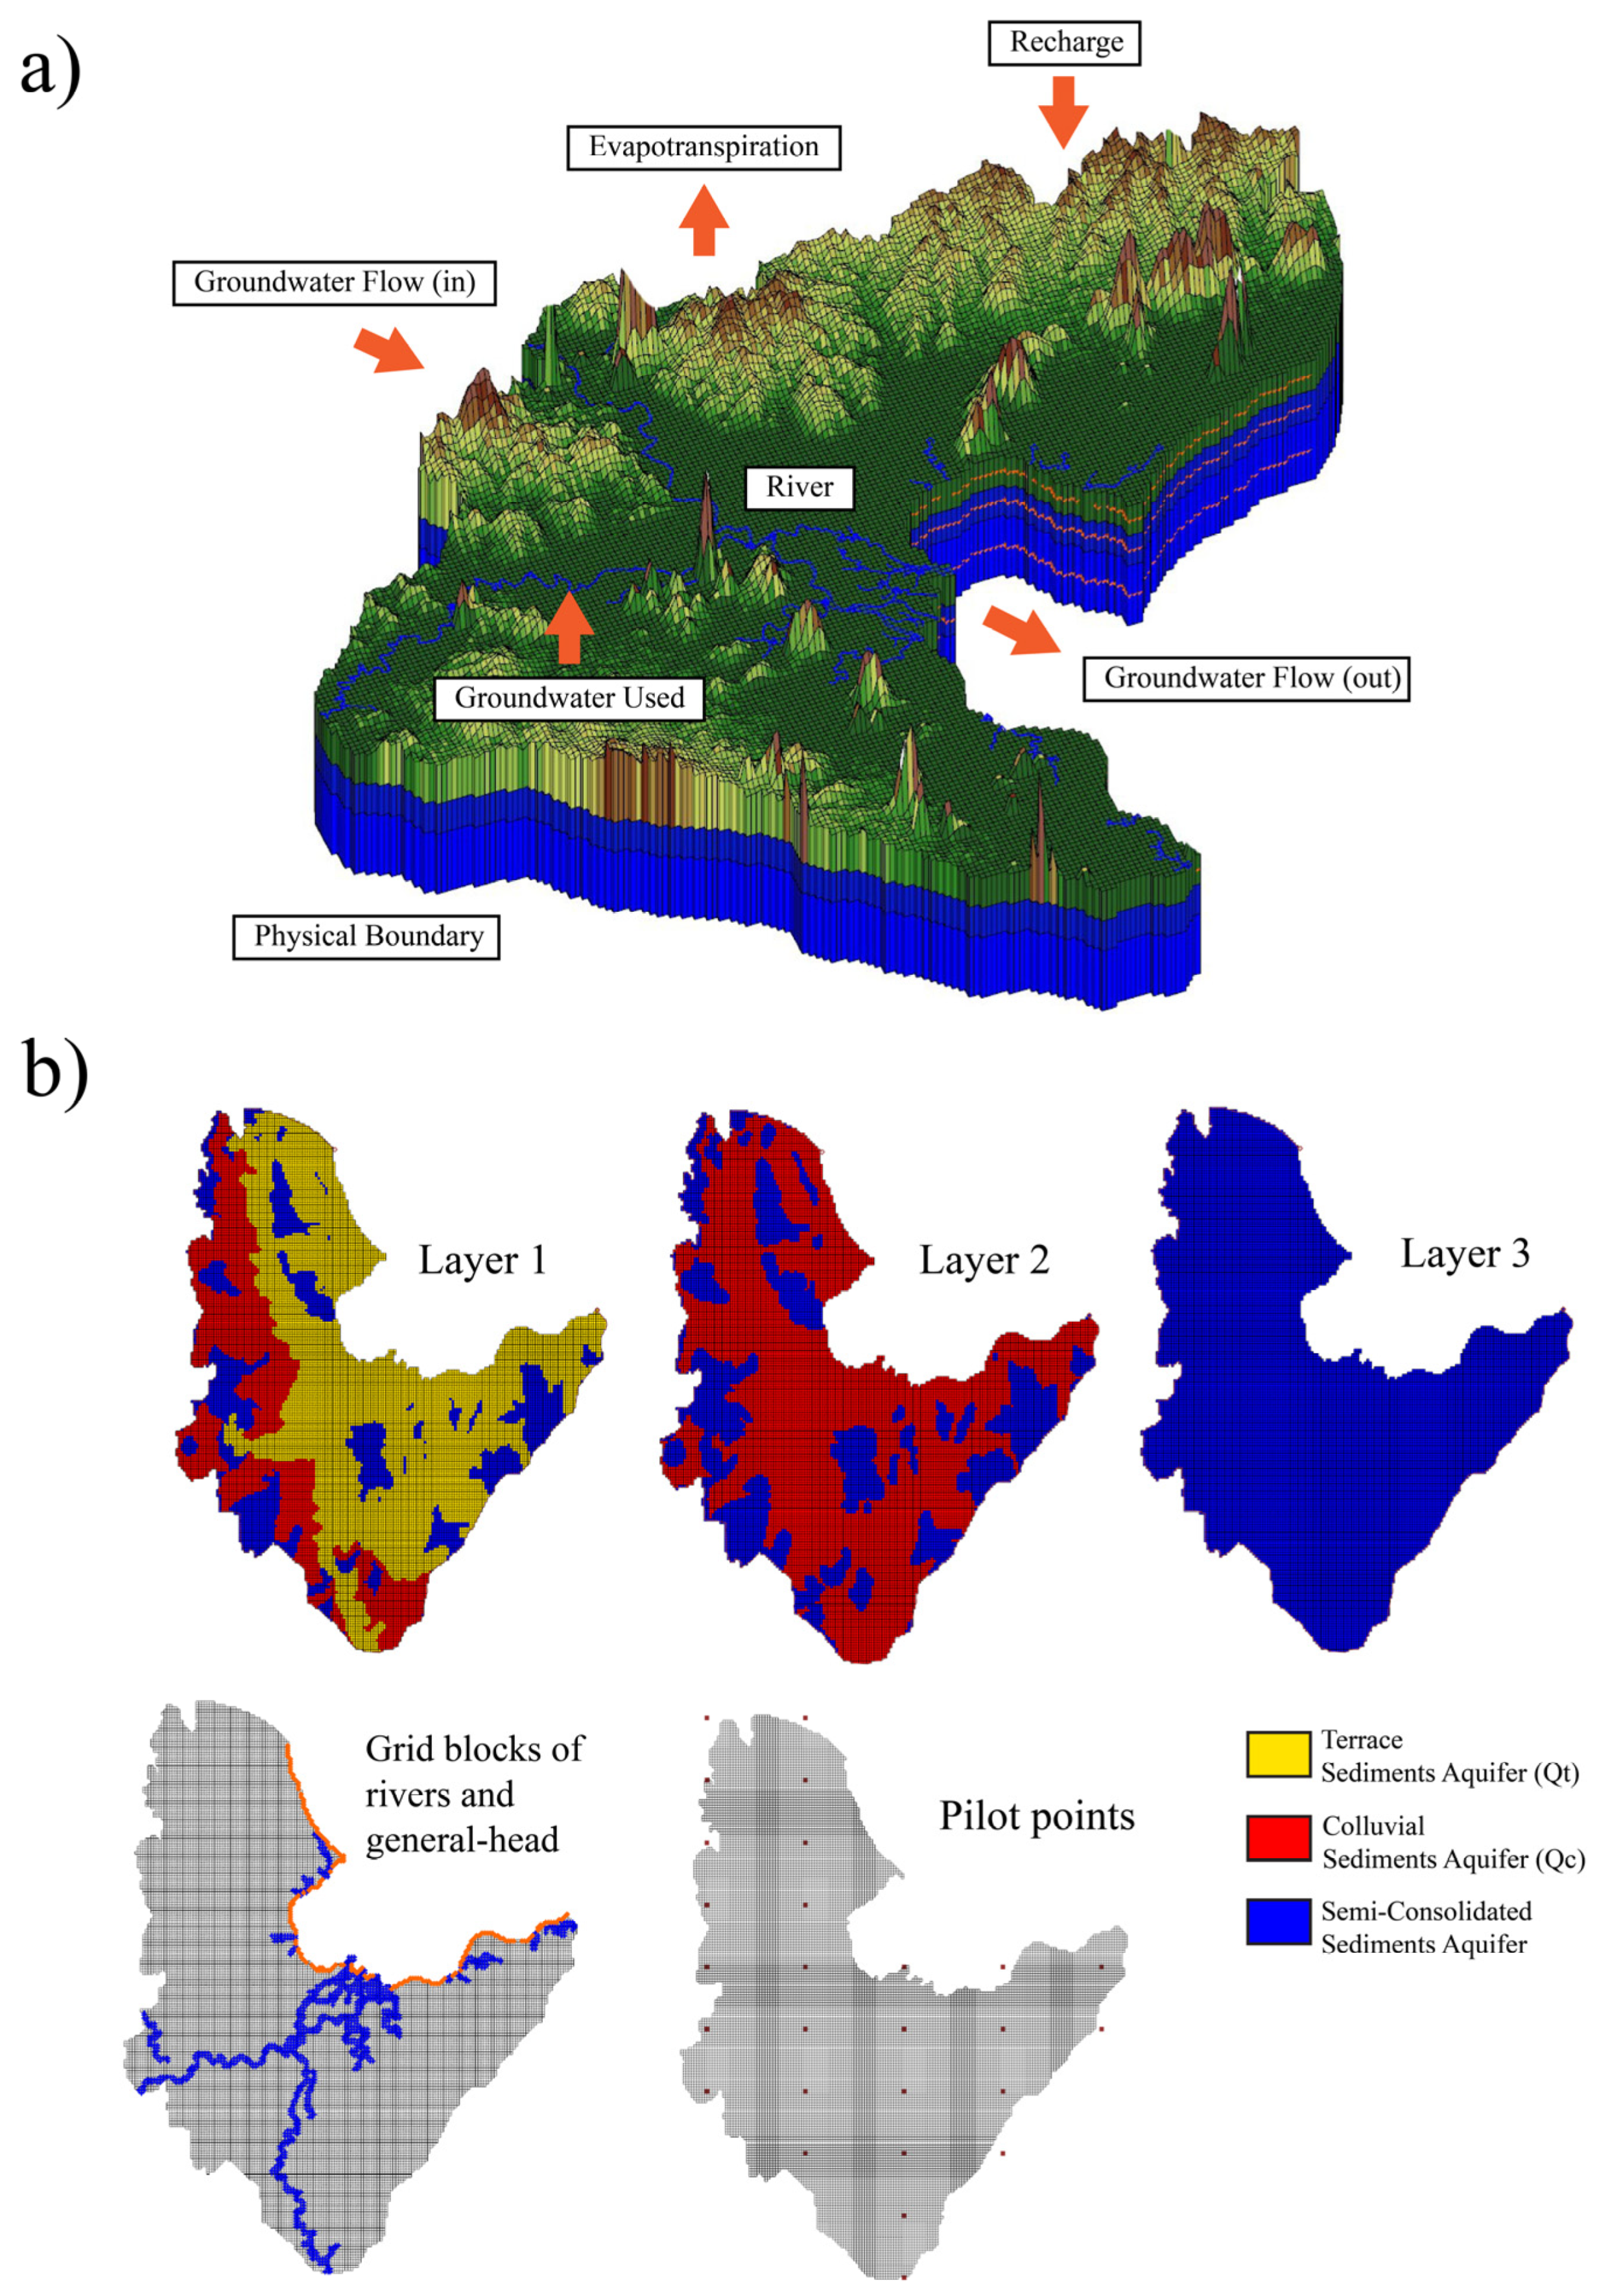
Figure 4 illustrates the conceptual model of the Surat Thani basin, where groundwater in all aquifer units generally flows from the western and northern uplands toward the central floodplain and eventually discharges into the Tapee River and the eastern coastal plain. Recharge primarily occurs in the terrace and upland deposits, while discharge zones are concentrated along the river network and the coastal boundary. To represent these conditions, the model domain was cropped to match the basin extent shown in Figure 1. The eastern boundary along the Gulf of Thailand was assigned as a general-head boundary (GHB) in MODFLOW [5] with a reference head of 0 m, corresponding to mean sea level (MSL), to simulate the hydraulic connection with the sea and the potential influence of seawater intrusion. The northern and southern margins of the basin were similarly defined as GHB conditions to allow for lateral inflow and outflow across the model boundaries.
Figure 4.
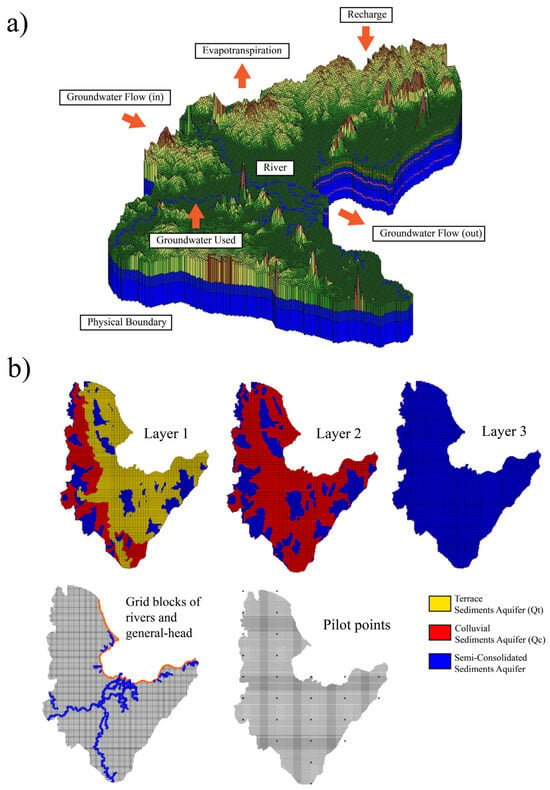
Conceptual hydrogeologic model of the Surat Thani basin. (a) Three-dimensional conceptual model showing major hydrologic components used in MODFLOW, including recharge, evapotranspiration, river interaction, groundwater abstraction, and lateral inflow/outflow across basin boundaries. The eastern boundary is represented as a general-head boundary (GHB) connected to the Gulf of Thailand. (b) Model material distribution for Layers 1–3 (Qt, Qc, and semi-consolidated aquifer), together with grid cells assigned to rivers/GHB and the spatial layout of pilot points used in PEST calibration.
The hydraulic properties of the aquifers were compiled from previous hydrogeological investigations conducted by the Department of Groundwater Resources [23]. These datasets provide representative values of hydraulic conductivity (K) and storativity (S) for the main hydrostratigraphic units identified in the basin. The values of K and S summarized in Table 1 will be used as initial inputs in the finite-difference grid of MODFLOW simulations. At specific locations where field data are lacking, the parameters will be treated as estimated pilot points subject to calibration with PEST, while values reported in previous studies will be preserved as reference ranges to constrain model uncertainty.
3.3. Hydraulic Head and River Discharge Data
Transient hydraulic head data used for initial conditions and model calibration were obtained from groundwater monitoring wells maintained by the Department of Groundwater Resources [4] and selected good quality data well in the Surat Thani basin from 4 in 9 monitoring wells [24]. Hydraulic head observations covering the period 2018–2024 were used as calibration targets, while the remaining dataset was reserved for model validation to assess model applicability. Baseflow data, also used as flow observations in model calibration, was estimated using baseflow separation analyses of hydrograph data, recording from the Royal Irrigation Department, obtained from gauging stations of the Tapee River located at P.18, P.19, P.20, P.21, P.22, and P.23 [28]. The combination of hydraulic head and river discharge observations provided essential calibration constraints, improving model reliability and reducing parameter uncertainty.
3.4. Groundwater Wells
Active groundwater wells in the Surat Thani basin are mainly used for domestic supply agriculture with additional demands from industrial and tourism-related activities (approximately 1700 wells). The locations of these wells, obtained from the Department of Groundwater Resources (Pasutara database) [4], are displayed in Figure 3a. For example, in 2025, the number of pumping wells screened in unconsolidated aquifers was reported as 924 wells, with a total annual extraction of approximately 30.6 Mm3/yr.
3.5. Groundwater Flow Model Setup
The conceptual model was converted into a 3D finite difference numerical model (MODFLOW), interface software namely Groundwater Modeling Software or GMS® program version 10.5 (Aquaveo, Provo, UT, USA), which had 225 columns, 179 rows, and 3 layers of variable thickness, with a grid size of 0.5 × 0.5 km2. Figure 4a shows a top view of the finite difference grids (with aquifer materials of the model). The model has three materials; Qfd: floodplain unconsolidated sediment aquifer unit; Qt: terrace unconsolidated sediment aquifer unit; and semi-consolidated sediments and weathered bedrock form confined aquifers (Figure 4b). MODFLOW packages used in the simulation included Layer-property flow (LPF), recharge (RCH), Evapotranspiration (EVT), River (RIV), Multi-node well (MNW), and General-head boundary (GHB) packages. Steady-state and transient groundwater flow equations that MODFLOW program approximates the hydraulic head (h) derived from Darcy’s law and the continuity equation, as implemented in MODFLOW [5,6].
Temporal discretization consisted of 1 steady-state (SS) stress period (1 day) and 22 transient (TR) stress periods spanning the simulation period from 1 January 2015 to 2 July 2025, with a total simulation time of 3835 days. Each stress period represented approximately six months (181–185 days) and was subdivided into five equal timesteps. Table 2 shows the initial parameters used in the model’s initial run before calibration.
Table 2.
Initial parameter values for the conceptual model.
The River (RIV) package was used to simulate river–aquifer interaction in the Surat Thani basin. River segments were generated from a digitized river network shapefile, with measured stages and widths at gauging stations interpolated into the finite-difference grid. Riverbed conductance and coastal GHB conductance were adjusted during model calibration. Groundwater abstraction was represented using the Multi-Node Well (MNW) package to account for wells with multiple screens or those tapping more than one aquifer unit. Return flow from production wells (e.g., irrigation returns) was not represented as a separate source term; net abstraction values reported by the Department of Groundwater Resources were applied through the MNW package, and any unaccounted return flow is implicitly absorbed into the calibrated distributed recharge field. This simplification is acknowledged as a limitation of the present model.
3.6. Model Calibration
Model calibration was carried out using the PEST software [29], which employs a pilot-point technique to capture aquifer heterogeneity and spatial variability in recharge and evapotranspiration. Pilot points were distributed across the model domain and their parameter values interpolated to all active cells. Field-based estimates of hydraulic conductivity were fixed at known locations, while the remaining pilot points were adjusted during calibration. PEST iteratively updated parameter values to minimize the difference between simulated and observed heads and flows. Model performance was evaluated following standard practice [30] using the root mean squared error (RMSE) and the normalized RMSE (NRMSE) between simulated and observed heads. Calibration was deemed acceptable when RMSE was less than 10% of observed heads, consistent with widely used criteria in groundwater modeling studies. The 10% threshold follows established calibration criteria for regional groundwater models [9,30]. PEST minimized a weighted least-squares objective function (Φ), defined as the weighted sum of squared residuals between simulated and observed heads and river baseflows; the final objective-function value was 75.419 [7,8]. The steady-state stress period represents long-term average (pre-2015) hydrologic conditions of the basin, using mean annual recharge and average observed heads to establish the initial hydraulic equilibrium, before the transient calibration spanning 2018–2024. Although only four observation wells with continuous 2018–2024 records were available as head targets, calibration was further constrained by baseflow observations at six Tapee River gauging stations (P.18–P.23) and cross-validated against the stable-isotope and hydrochemical data, providing multiple independent, spatially distributed constraints. Model fit was additionally evaluated using the General Performance Index (GPI) and the Hanna–Heinold (HH) statistic, the latter being preferable to RMSE when residuals are not normally distributed; both indices were computed following Mehdinejadiani (2025) [31].
4. Results
4.1. Steady-State and Transient Model Calibration
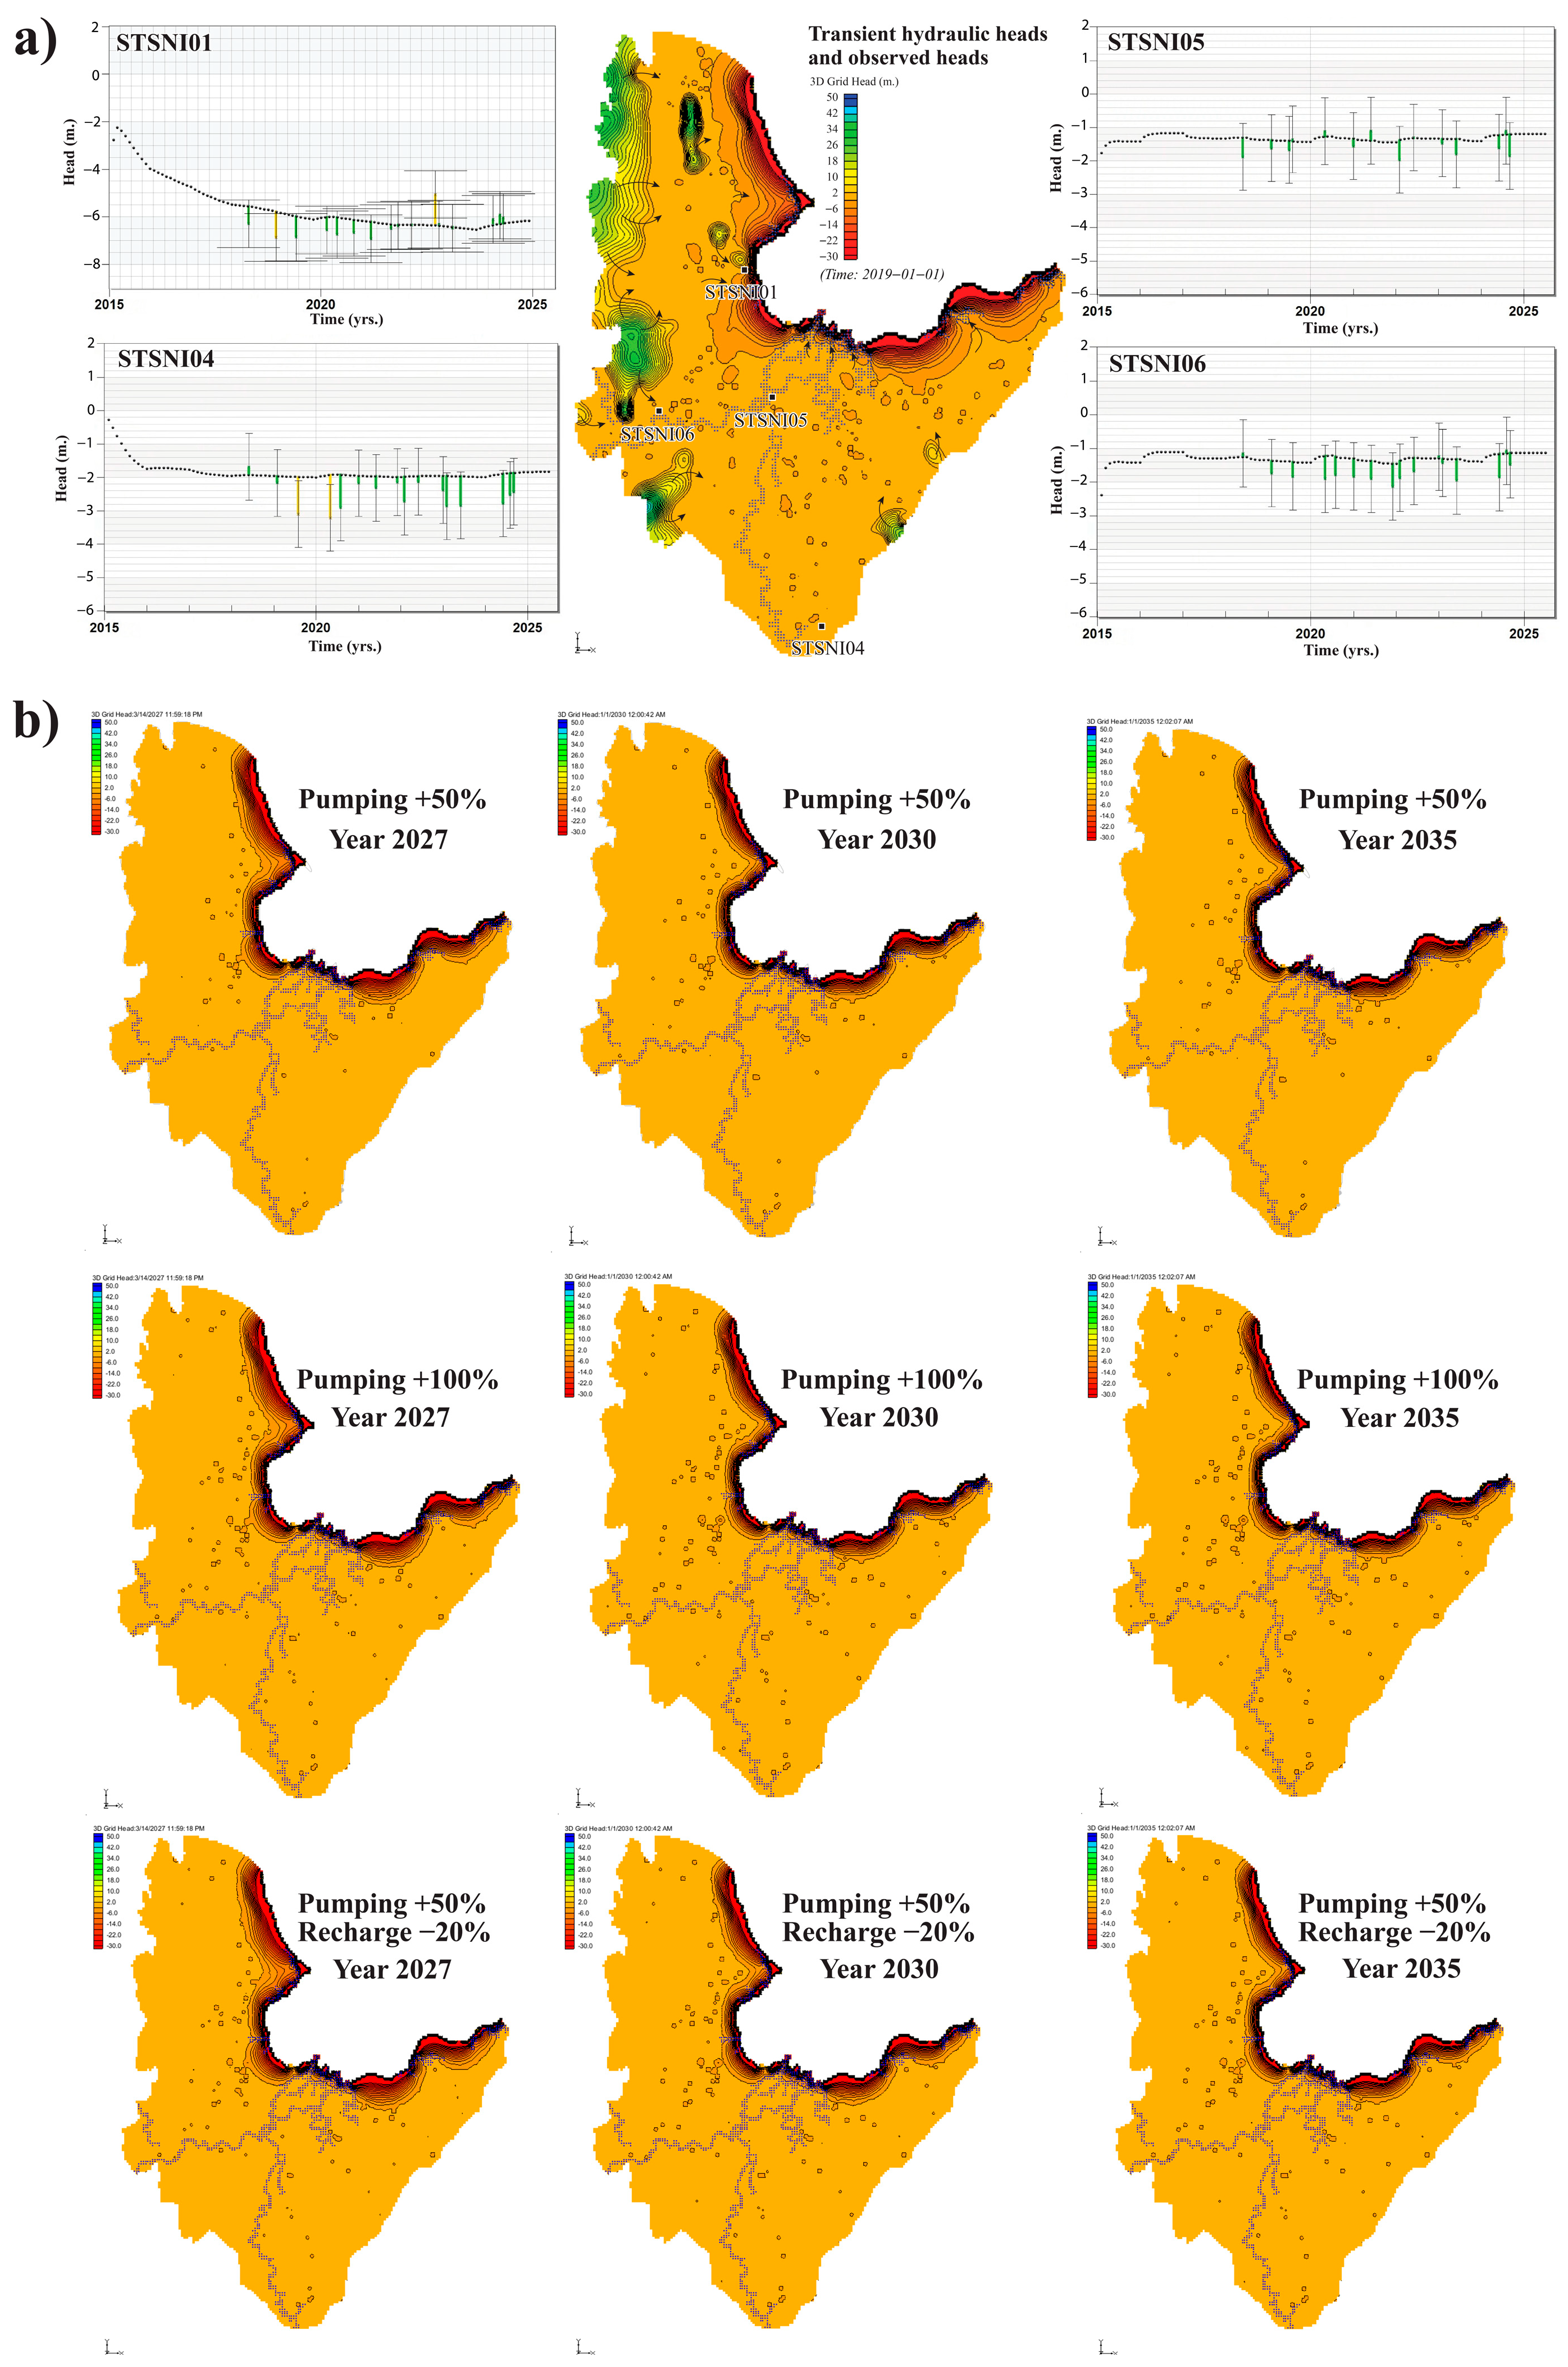
The model was calibrated using PEST [29] to match simulated groundwater heads with observations across the Surat Thani basin. A steady-state simulation was used to establish the initial hydraulic equilibrium, followed by transient calibration for the period 2018–2024. Despite the limited number of monitoring wells, the model reproduced both spatial head gradients and seasonal fluctuations with high accuracy. The final objective function (Phi) was 75.419, and the weighted RMSE was 0.0707 m, indicating excellent agreement between observed and simulated groundwater heads (Table 3). Residuals ranged from –2.521 to +2.537 m with a near-zero mean, suggesting minimal systematic deviations. The calibrated head distribution indicates groundwater flowing from the western uplands toward the central floodplain and the eastern coastal plain, consistent with regional topographic gradients (Figure 5a). Zones of high to moderate recharge rates are located in the northern, western, and parts of eastern areas of the basin. These areas should be reserved for recharge protection areas. The model was therefore considered sufficiently reliable for subsequent analysis of basin-wide groundwater behavior. In addition to the weighted RMSE (0.0707 m) and NRMSE, the General Performance Index (GPI) and the Hanna–Heinold (HH) statistic were evaluated to confirm model fit independently of the normality assumption inherent in RMSE; the corresponding values (GPI = 0.3181–0.4061; HH = 0.0851–0.3262) are reported in Table 4 [31].
Table 3.
Final parameter values for the conceptual model.
Figure 5.
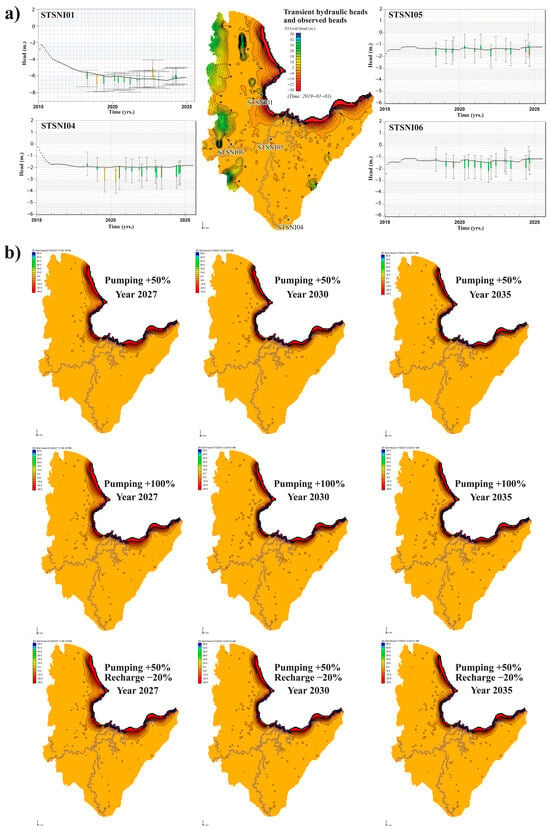
Simulated groundwater heads and future groundwater-stress scenarios for the Surat Thani basin. (a) Spatial distribution of calibrated transient groundwater heads and comparison between simulated and observed groundwater levels at four monitoring wells (STSNI01, STSNI04, STSNI05, and STSNI06) during 2018–2024. The map shows the calibrated hydraulic-head distribution and groundwater-flow directions, while the time-series plots compare simulated and observed groundwater levels. Green and yellow bars represent observed groundwater-head targets displayed by GMS. (b) Predicted groundwater-level distributions under future stress scenarios for 2027, 2030, and 2035. The scenarios include a 50% increase in groundwater pumping, a 100% increase in groundwater pumping, and a combined condition with a 50% increase in pumping and a 20% reduction in recharge. The future maps were generated using the calibrated transient MODFLOW model, with calibrated hydraulic parameters, boundary conditions, river interaction, and evapotranspiration kept unchanged.
Table 4.
Calibration-performance statistics by monitoring wells.
Calibrated hydraulic parameters Table 3 remained within reasonable ranges compared with previous hydrogeologic assessments. Parameters without direct field measurements—riverbed conductance and GHB conductance—were estimated by PEST and produced physically consistent boundary and river interactions. Sensitivity analysis showed hydraulic conductivity as the most influential parameter, followed by recharge, evapotranspiration, and riverbed conductance, consistent with heterogeneous alluvial–terrace aquifer systems.
4.2. Water Budget Results
The calibrated model was used to quantify the major inflow and outflow components of the Surat Thani groundwater system. Total inflow 34.13 × 10⁶ m3/d and total outflow 34.13 × 10⁶ m3/d were nearly identical, producing an exceptionally small mass-balance discrepancy of –1.0 × 10⁻⁶%, confirming numerical stability and internal consistency of the model.
Groundwater inflow was dominated by constant-head boundaries, contributing 119.27 × 10⁶ m3/d, followed by aquifer storage 33.48 × 10⁶ m3/d and gains from river leakage 0.53 × 10⁶ m3/d. Minor inflow from general-head boundaries was also observed. Recharge was negligible at the daily scale, reflecting the use of a distributed recharge field calibrated through the pilot-point framework rather than a lumped areal input.
Outflow from the system was primarily controlled by evapotranspiration, which accounted for 7.85 × 10⁶ m3/d, consistent with humid tropical climatic conditions and extensive low-lying wetlands across the basin. Storage release contributed 24.35 × 10⁶ m3/d, while groundwater pumping represented a relatively small component of total outflow (0.053 × 10⁶ m3/d, equivalent to approximately 19.45 Mm3/yr). Additional losses occurred through river leakage (28,906 m3/d) and flow through general-head boundaries 18,424 m3/d. The water budget indicates that the Surat Thani basin functions as a boundary-driven system with predominantly gaining streams, strong evapotranspiration losses, and moderate groundwater abstraction relative to natural fluxes. These characteristics reflect both the hydrogeologic framework and the climatic conditions of the region. Comparing stresses, current groundwater abstraction (≈19.45 Mm3/yr via the MNW package, broadly consistent with the ≈30.6 Mm3/yr reported by the DGR) is small relative to the basin-scale fluxes: it corresponds to only a few percent of the calibrated recharge and is more than an order of magnitude smaller than evapotranspiration losses (≈978 mm/yr; 7.85 × 10⁶ m3/d). This indicates that, at the basin scale, abstraction currently exerts limited net stress on aquifer storage, although localized high-density pumping may still induce drawdown. A precise per-aquifer recharge-to-abstraction ratio should be derived from the model’s zonal budget output in future work.
4.3. Spatial Distribution of Simulated Hydraulic Heads
The simulated spatial distribution of transient groundwater heads provides a clear representation of the regional flow system within the Surat Thani basin (Figure 5). Elevated groundwater heads are observed along the western and northwestern uplands, reflecting primary recharge zones where precipitation infiltrates through permeable terrace and colluvial deposits. Groundwater flows consistently eastward and southeastward toward the central floodplain and the coastal plain, following the natural topographic gradient and hydraulic connectivity of the aquifer system. Lower heads near the Tapee River and the eastern coastline indicate major discharge areas, where groundwater drains into surface-water channels and ultimately toward the Gulf of Thailand.
Time–series comparisons between observed and simulated groundwater levels for four monitoring wells (STSNI01, STSNI04, STSNI05, STSNI06) show that the model reproduces both long-term trends and seasonal variations effectively (Figure 5a). The simulations closely follow observed fluctuations from 2018 to 2025, with residuals remaining within acceptable limits for a regional-scale model. Monitoring wells located in the western sector (STSNI05 and STSNI06) exhibit stable water levels and excellent agreement with simulation results, whereas wells in the northeast and south areas (STSNI01 and STSNI04) show slightly larger deviations, likely due to localized lithologic contrasts and the dynamic nature of the coastal groundwater regime. Overall, the spatial and temporal patterns of simulated heads align well with field data, demonstrating the reliability of the calibrated model in representing the hydrodynamics of the Surat Thani basin.
4.4. Future Groundwater-Stress Scenarios
Future groundwater-stress scenarios were simulated using the calibrated transient MODFLOW model to evaluate the response of the aquifer system to increased groundwater demand and reduced recharge. The calibrated hydraulic parameters, storage properties, river conductance, evapotranspiration, and boundary conditions were kept unchanged. Three scenarios were tested for 2027, 2030, and 2035: (1) a 50% increase in groundwater pumping, (2) a 100% increase in groundwater pumping, and (3) a combined scenario with a 50% increase in pumping and a 20% reduction in recharge. These scenarios were designed as stress-test simulations rather than deterministic forecasts.
The simulated groundwater-level maps (Figure 5b) show that the regional hydraulic pattern remains generally stable under all tested scenarios. Groundwater levels in the western part of the basin show little visible change, indicating that this area is less sensitive to the imposed pumping stresses under the tested conditions. In contrast, the central floodplain and eastern lowland–coastal areas show relatively clearer hydraulic gradients and remain the main zones where groundwater-level changes are expected to occur. The similarity among the 2027, 2030, and 2035 maps suggests that, at the basin scale, the aquifer system is moderately buffered by boundary conditions, river interaction, and distributed abstraction.
Although no major basin-wide groundwater-level decline is predicted in these stress-test simulations, the results highlight the need for careful management in areas with intensive groundwater use and near the coastal boundary. The combined pumping-increase and recharge-reduction scenario represents the most conservative condition and indicates that future groundwater stress may become more important if increased abstraction coincides with reduced recharge. These results support the need for continued groundwater-level monitoring and protection of recharge-sensitive areas.
4.5. Implications of Stable Isotopes and Hydrochemical Signatures for Groundwater Recharge
Stable isotopes of δ2H and δ18O, together with major-ion chemistry, were used to evaluate groundwater recharge processes and identify potential recharge sources within the Surat Thani basin. Groundwater and isotope sampling locations are distributed across upland, mid-basin, and coastal zones (Figure 6), enabling characterization of recharge heterogeneity across distinct hydrostratigraphic units (Qc, Qt, Qmc, and Qms).
Figure 6.
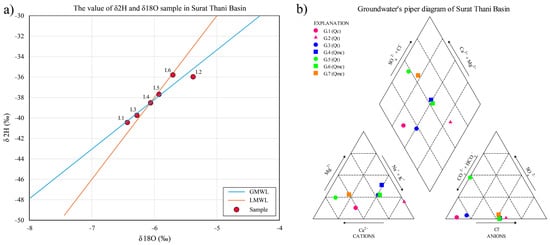
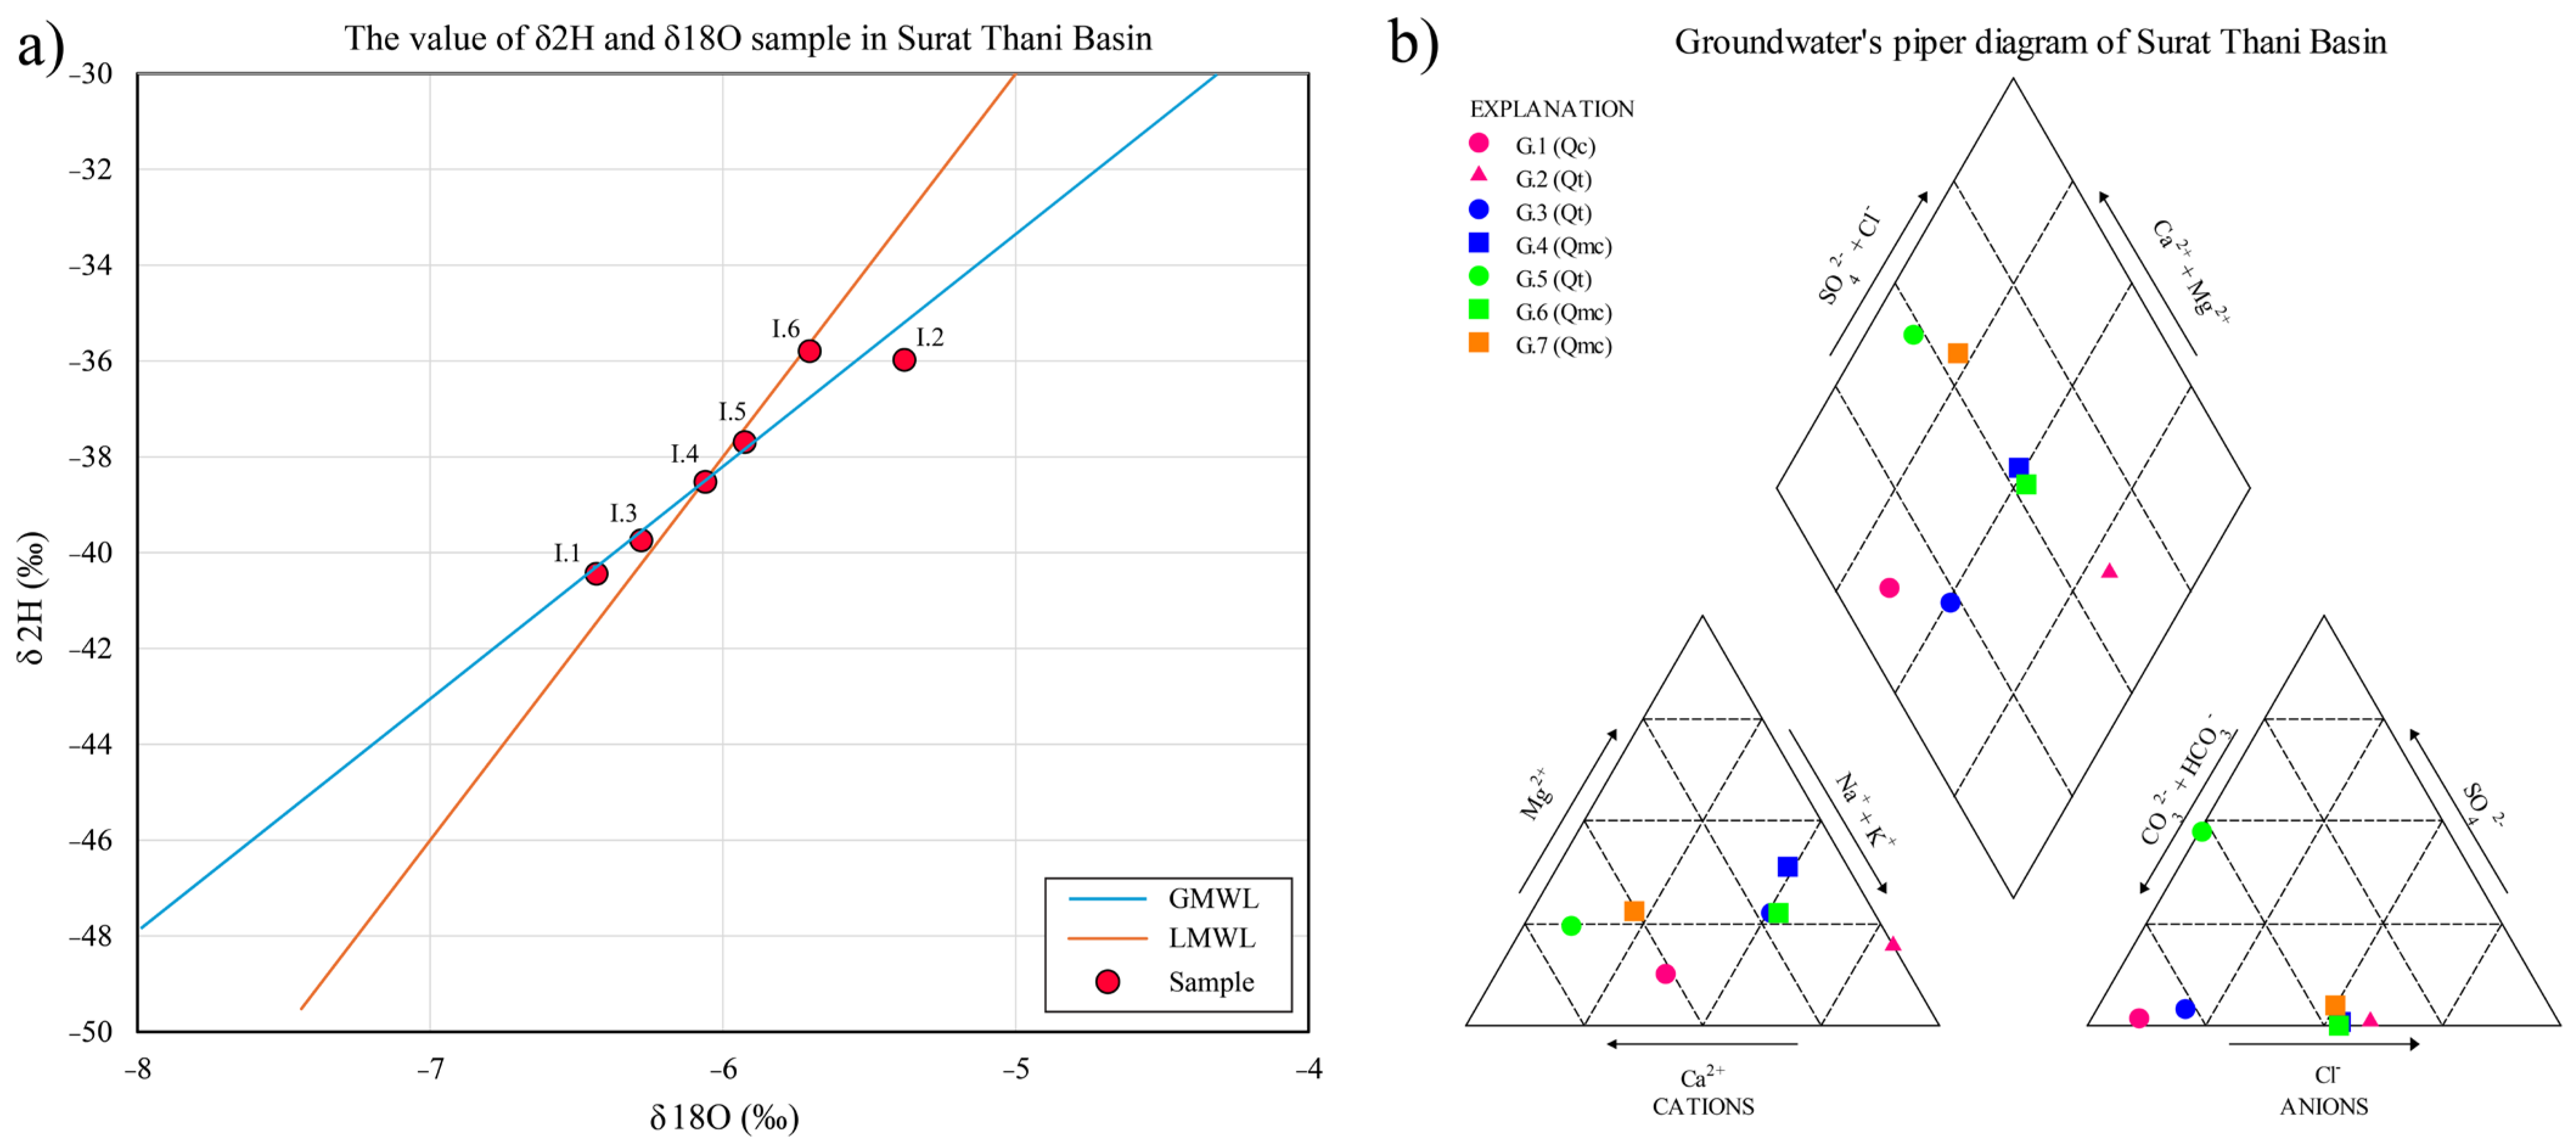
Stable isotope signatures and hydrochemical facies. (a) δ2H–δ18O plot of groundwater samples compared with the GMWL and LMWL, indicating recharge primarily from meteoric precipitation with minimal evaporative effects. (b) Piper diagram showing groundwater facies dominated by Ca–HCO3 and Ca–Mg–HCO3 types, with mixed facies reflecting progressive mineralization along deeper flow paths.
The δ2H–δ18O relationship for groundwater samples (Figure 6a) shows that the Local Meteoric Water Line (LMWL) deviates from the Global Meteoric Water Line (GMWL), indicating that the precipitation itself was affected by evaporative fractionation during rainfall. Most groundwater samples plot close to the LMWL within a narrow isotopic range (δ2H ≈ −40.46‰ to −35.77‰; δ18O ≈ −6.44‰ to −5.70‰), indicating that recharge is dominated by direct infiltration of meteoric precipitation. Four samples (1.3, 1.4, 1.5 and 1.6) plot on or very close to the LMWL, indicating recharge through direct infiltration of rainfall, whereas two samples (1.1 and 1.2) deviate slightly from the LMWL in different directions; in particular, sample 1.1 reflects additional evaporative fractionation prior to infiltration. Stable isotope and hydrochemical results for all 14 samples are summarized in Table 5. The overall limited evaporative enrichment is consistent with rapid infiltration during high-intensity monsoonal rainfall in the humid tropical climate of southern Thailand.
Table 5.
Stable isotope composition of groundwater and surface-water samples in the Tapee basin.
Hydrochemical facies from the Piper diagram (Figure 6b) reveal two dominant water types: (1) Ca–HCO3 and Ca–Mg–HCO3 waters typical of recently recharged groundwater in alluvial and terrace deposits, and (2) mixed-type waters (Ca–Na–HCO3 and Ca–Mg–Cl) reflecting longer flow paths or interaction with semi-consolidated sediments of the Qmc and Qms units. Samples located in upland recharge zones (e.g., G.1, G.2, G.3) fall within the fresh Ca–HCO3 facies, while samples in mid- and lower-basin areas (e.g., G.5, G.6, G.7) exhibit moderate mineralization, suggesting increasing residence time and water–rock interaction along the west-to-east groundwater flow path.
5. Discussion and Implication
5.1. Integration of Multiple Lines of Evidence for Recharge Assessment
The convergence of numerical modeling, stable isotope geochemistry, and hydrochemical analysis provides robust evidence for the dominant recharge mechanisms operating in the Surat Thani basin. All three independent approaches point to a system controlled primarily by direct infiltration of monsoonal precipitation rather than surface water interaction or inter-basin groundwater transfer.
The isotopic evidence is particularly compelling. Groundwater samples plotting close to both the Global Meteoric Water Line (GMWL) and Local Meteoric Water Line (LMWL) with minimal evaporative enrichment indicate that infiltration occurs rapidly during high-intensity rainfall events, characteristic of tropical monsoon systems. This interpretation is consistent with the dominance of Ca–HCO3 and Ca–Mg–HCO3 water types in upland recharge zones, which are diagnostic of recently infiltrated meteoric water with limited water–rock interaction time. The progression toward mixed hydrochemical facies (Ca–Na–HCO3 and Ca–Mg–Cl) along the west-to-east flow path reflects increasing residence time and enhanced mineral dissolution in deeper, semi-consolidated aquifer units, a pattern fully consistent with the simulated flow field. As noted above, the offset of the LMWL from the GMWL reflects evaporative fractionation of precipitation prior to recharge rather than evaporation of groundwater, and the clustering of most samples along the LMWL confirms direct meteoric recharge.
The hydrochemical evolution is consistent with the geological framework of the basin: fresh Ca–HCO3 waters dominate upland recharge zones underlain by Quaternary terrace deposits and weathered crystalline and carbonate rocks, whereas the down-gradient progression to mixed Ca–Na–HCO3 and Ca–Mg–Cl facies reflects longer residence times and water–rock interaction within the semi-consolidated sediments and, near the coast, limited mixing with higher-salinity water. Linking hydrochemical facies to the lithology of the host formations, as demonstrated by Guleria and Mehdinejadiani (2025) [32], reinforces the interpretation that geology exerts a primary control on groundwater quality along the west-to-east flow path.
Critically, the calibrated groundwater model reproduces this conceptual framework quantitatively. The spatial distribution of simulated hydraulic heads shows strong gradients from western uplands toward the central floodplain and coastal plain, matching both the topographic gradient and the geochemical evolution pathway. The excellent model fit (weighted RMSE = 0.0707 m) despite limited monitoring data suggests that the fundamental hydrogeologic controls are well captured. The pilot-point parameterization enabled by PEST allowed spatial heterogeneity in hydraulic properties and recharge to be represented even with sparse calibration targets, though this approach introduces parameter non-uniqueness that must be acknowledged.
An important finding is the mismatch between climatic water availability and actual recharge. Although annual precipitation averages 1876 mm/yr, calibrated recharge rates range from only 1.2 to 77.3 mm/yr (geometric mean 23.7 mm/yr), representing approximately 1–4% of precipitation. This low recharge efficiency reflects the combined effects of high evapotranspiration (averaging 1280 mm/yr), substantial surface runoff during intense rainfall, and limited infiltration capacity in clay-rich floodplain deposits. The calibrated ET flux (978 mm/yr mean) represents the largest single loss term in the water budget, exceeding groundwater recharge by more than an order of magnitude. This finding underscores the vulnerability of groundwater resources in humid tropical settings where high atmospheric demand severely limits recharge despite abundant precipitation.
5.2. Comparison with Regional Aquifer Systems and Implications of Basin-Scale Flow Controls
The hydrogeologic behavior of the Surat Thani basin differs markedly from that of heavily exploited intermontane basins in northern Thailand, particularly the Chiang Mai–Lamphun basin studied by [10,11]. In Chiang Mai, intensive groundwater abstraction (~300 Mm3/yr) has created significant drawdown cones and altered natural flow patterns, making pumping stress the dominant control on hydraulic gradients. In contrast, the Surat Thani basin currently experiences relatively modest abstraction (~19.45 Mm3/yr or 0.053 × 10⁶ m3/d), approximately 15 times lower than Chiang Mai despite similar basin areas. Consequently, natural hydraulic gradients controlled by topography, recharge distribution, and boundary conditions remain the primary drivers of groundwater flow in Surat Thani.
This distinction has important implications. The Surat Thani system retains its natural recharge-dominated character, with the Tapee River and tributaries functioning primarily as gaining streams that receive groundwater discharge. The water budget analysis confirms this interpretation: river leakage shows net gains to surface water (inflow 0.53 × 10⁶ m3/d; outflow 28,906 m3/d), consistent with regional groundwater discharge supporting baseflow. This behavior contrasts with stressed basins where rivers become losing streams near pumping centers.
However, the apparently favorable water balance must be interpreted cautiously. The boundary flux estimates, particularly the large constant-head inflow (119.27 × 10⁶ m3/d), warrant careful consideration. This term represents lateral subsurface inflow from adjacent upland watersheds and likely includes numerical artifacts from the boundary condition specification. The magnitude suggests that refining boundary conditions, perhaps through extension of the model domain or use of time-variant specified-flux boundaries, would improve physical realism. Nevertheless, the overall water balance demonstrates internal consistency (mass balance error <10−6%), indicating numerical stability even if individual flux components remain uncertain.
The vulnerability of the system becomes apparent when considering the hydrogeologic framework. Unlike thick, highly productive alluvial aquifers in major river basins, the Surat Thani aquifers are relatively thin (typically <100 m) with moderate hydraulic conductivity (calibrated geometric means 0.45–0.51 m/d). The heterogeneous lithology, interbedded sands, silts, and clays, creates complex vertical connectivity. These characteristics suggest limited buffering capacity against future stress. Although current pumping appears sustainable at the basin scale, localized over-extraction could rapidly deplete storage in confined units or induce vertical leakage of poor-quality water from shallower zones.
5.3. Uncertainties, Limitations, and Model Reliability
Several sources of uncertainty affect the interpretation of modeling results and require explicit discussion. The most significant limitation is the sparse monitoring network, only four observation wells provided calibration targets across the entire basin. While PEST optimization and pilot-point parameterization enable parameter estimation with limited data, this approach introduces parameter non-uniqueness. Multiple parameter combinations can produce similar model fits, particularly for poorly constrained variables such as riverbed conductance and boundary fluxes. We emphasize that the four head-calibration wells span the western, north-eastern, and southern sectors of the basin and were complemented by river-baseflow targets at six gauging stations; nevertheless, additional observation wells—particularly in the basin center and coastal zone—would reduce parameter non-uniqueness, and their installation is a key recommendation of this study.
The temporal discretization using six-month stress periods represents a compromise between computational efficiency and resolution of seasonal dynamics. This relatively coarse timestep may not fully capture rapid water-table responses to individual storm events or short-term pumping fluctuations. However, for assessing long-term trends and basin-scale recharge, this temporal resolution is appropriate. Finer temporal discretization would require more frequent head observations, which are not available for this basin.
Spatial variability in recharge remains poorly constrained. The preliminary estimates (5–15% of precipitation) are based on land-use classifications and literature values rather than site-specific measurements. The calibrated recharge field produced by PEST optimization improved model fit but reflects parameter adjustment to match head observations rather than independent validation. The stable isotope data provides qualitative confirmation of meteoric recharge but does not quantify recharge rates directly. Future work incorporating chloride mass balance, water table fluctuation analysis, or lysimeter measurements would strengthen recharge estimates.
The hydrochemical dataset, while valuable for conceptual model validation, is limited to a single sampling event during the wet season. Seasonal variations in water chemistry and isotopic composition, particularly between wet and dry seasons, remain uncharacterized. Multi-season sampling would better constrain the relative importance of wet-season versus dry-season recharge and improve understanding of surface water–groundwater interaction dynamics. Although the hydrochemical and isotopic dataset comprises 11 groundwater and 4 surface-water samples from a single wet-season campaign, the sampling points were deliberately distributed across upland recharge, mid-basin, and coastal-discharge zones and across the main hydrostratigraphic units, so that they capture the principal segments of the regional flow path. The dataset is used here as an independent, qualitative line of evidence to corroborate the flow model rather than as a stand-alone geochemical characterization; expanded, multi-season sampling is recommended as future work.
Predictive scenarios of future aquifer stress (e.g., increased abstraction and climate-change-driven recharge reduction) were not simulated in the present study, which focuses on characterizing current recharge and flow dynamics. The calibrated steady-state and transient heads (Figure 5) nonetheless provide the baseline required for such forecasting. Future work will apply the calibrated model to run management scenarios—stepwise increases in pumping and TMD/IPCC-based recharge perturbations—and to generate groundwater-level maps for both the calibration period and projected future stress periods. These predictive simulations and the associated future-phase head maps are identified here as the priority next step and are beyond the scope of this paper.
Despite these limitations, several lines of evidence support model reliability. The excellent agreement between simulated and observed heads (RMSE = 0.0707 m) across multiple monitoring locations and a six-year transient period demonstrates that the model captures fundamental system behavior. The consistency between modeled flow directions, isotopic signatures, and hydrochemical evolution provides independent validation of the conceptual model. The sensitivity analysis showing hydraulic conductivity as the dominant control, followed by recharge and evapotranspiration, aligns with expectations for heterogeneous alluvial systems in tropical settings.
5.4. Implications for Groundwater Management and Recharge Protection
The integrated findings provide a scientific foundation for sustainable groundwater management in the Surat Thani basin, with specific implications for resource protection, land use planning, and monitoring strategies.
- Delineation of recharge protection zones: The western and northern upland areas, characterized by permeable terrace deposits (Qt), elevated topography, and limited clay cover, function as the primary recharge zones for the basin. The modeling results show highest recharge rates (up to 77.3 mm/yr) in these areas, while isotopic signatures confirm rapid infiltration with minimal evaporative enrichment. These zones should be designated as high-priority protection areas where land-use changes that reduce infiltration capacity, such as urbanization, road construction, or conversion to impervious surfaces, should be restricted or carefully managed. The Department of Groundwater Resources should consider establishing formal recharge protection zones in these areas, similar to wellhead protection programs used internationally.
- Land use planning recommendation: Agricultural expansion in the Surat Thani basin, particularly intensive durian and oil palm cultivation [2], should be guided by hydrogeologic suitability. Development should be directed toward the central and eastern floodplain areas where thick clay layers provide natural protection against contamination of deeper aquifers. Conversely, upland terrace areas that serve critical recharge functions should prioritize land uses compatible with infiltration, such as forest conservation, agroforestry, or low-intensity agriculture with minimal agrochemical inputs. The spatial planning framework developed by [3] for Surat Thani City expansion should explicitly incorporate recharge protection objectives.
- Sustainable extraction limits: Although current groundwater use (~30.6 Mm3/yr) appears sustainable relative to natural recharge and boundary inflows, the limited thickness and moderate productivity of the aquifer system provide little buffering capacity against future increases in demand. The water budget analysis suggests that pumping could potentially increase by 2–3 times before approaching stress conditions, but this assumes spatially distributed extraction. Localized high-density pumping, particularly in coastal zones or areas underlain by thin aquifer sections, could rapidly induce adverse impacts such as excessive drawdown, depletion of baseflow to streams, or seawater intrusion.
- We recommend that the Department of Groundwater Resources establish extraction limits of no more than 50% of estimated recharge in critical recharge zones, with higher sustainable yields (70–80% of recharge) permissible in discharge areas where groundwater naturally flows toward rivers or the coast. Specific attention should focus on coastal districts where the risk of seawater intrusion is highest. Although water quality issues remain outside the scope of this study, the general-head boundary condition specified at the Gulf of Thailand interface demonstrates that hydraulic connection exists. Intensive pumping in coastal areas could reverse gradients and induce seawater intrusion, as observed in other coastal aquifers in southern Thailand.
- Monitoring and adaptive management: The current monitoring network of four observation wells is grossly inadequate for basin-scale management. We recommend expansion to a minimum of 15–20 monitoring wells distributed across key hydrogeologic settings: upland recharge zones, mid-basin transition zones, coastal discharge areas, and locations near intensive pumping. Wells should be screened in multiple aquifer units (Qfd, Qt, and semi-consolidated layers) to characterize vertical head gradients and potential for inter-aquifer leakage. Continuous water-level recorders should be installed to capture seasonal variations and rapid responses to recharge events or pumping.
- In addition to hydraulic monitoring, regular hydrochemical and isotopic sampling (at minimum annually, ideally seasonally) would provide early warning of changing recharge patterns, surface water interaction, or seawater intrusion. Chloride concentrations, electrical conductivity, and stable isotope ratios should be tracked as sentinel indicators. The calibrated groundwater model should be updated regularly (every 3–5 years) as new monitoring data become available, and used to evaluate alternative management scenarios and land-use planning options.
- Climate adaptation considerations: The observed warming trend (1.7 °C increase from 2006 to 2024) documented in Figure 3b has direct implications for groundwater sustainability. Rising temperatures increase potential evapotranspiration, reducing the efficiency of rainfall conversion to recharge. Although precipitation patterns have not shown clear trends in the historical record, climate projections for Southeast Asia suggest increasing rainfall intensity but potentially longer dry-season duration. These changes could reduce total recharge despite stable or even increased annual precipitation. The groundwater model provides a tool for evaluating climate scenarios and assessing vulnerability to potential future conditions.
- The integration of numerical modeling, stable isotope analysis, and hydrochemical characterization employed in this study provides a replicable framework for groundwater assessment in data-limited tropical basins. Similar approaches could be applied to other regions in southern Thailand and throughout Southeast Asia where groundwater resources face increasing pressure from development but lack comprehensive hydrogeologic characterization. The findings emphasize the critical importance of protecting recharge areas and implementing proactive monitoring before groundwater systems transition from their natural state to stressed conditions where remediation becomes difficult and costly.
6. Conclusions
This study provides the first integrated assessment of groundwater recharge and basin-scale flow dynamics in the Surat Thani (Tapee River) basin, combining a calibrated three-dimensional MODFLOW–PEST model, a complete water budget, and stable-isotope and hydrochemical analysis. Despite a sparse monitoring network of only four observation wells, the calibrated model reproduced observed heads well (weighted RMSE = 0.0707 m; Φ = 75.419).
Four main findings emerge. (i) Recharge occurs predominantly through direct infiltration of monsoonal precipitation, with stable-isotope signatures plotting along the meteoric water lines and fresh Ca–HCO3 facies in upland zones. (ii) Recharge efficiency is low (≈1–4% of the 1876 mm/yr rainfall; 1.2–77.3 mm/yr), with evapotranspiration (≈978 mm/yr) as the dominant loss. (iii) The basin retains a natural, recharge-dominated regime with the Tapee River acting mainly as a gaining stream, and current abstraction (≈19–31 Mm3/yr) remains modest relative to natural fluxes. (iv) Hydrochemical facies evolve from Ca–HCO3 to mixed Ca–Na–HCO3 and Ca–Mg–Cl along down-gradient flow paths, reflecting increasing residence time and water–rock interaction. These results identify the western and northern uplands as critical recharge zones requiring protection and highlight the need for an expanded monitoring network and predictive scenario modeling to safeguard groundwater under growing demand and a warming climate.
7. Recommendations
Based on the integrated numerical modeling, stable isotope, and hydrochemical results, the western and northern upland areas of the Surat Thani basin should be formally delineated as priority groundwater-recharge protection zones. Land-use planning in these areas should maintain natural infiltration by limiting uncontrolled urban expansion, extensive impervious surfaces, and activities that may introduce contaminants into the aquifer system. Forest conservation, agroforestry, and low-intensity agriculture with careful management of fertilizers and pesticides should be encouraged. Proposed developments and high-capacity groundwater wells within these recharge-sensitive areas should be subject to hydrogeological assessment before approval.
Groundwater abstraction should be managed adaptively at the sub-basin or local scale rather than solely on the basis of basin-wide water availability. Although the model indicates that the regional groundwater-flow pattern remains relatively stable under the tested pumping and recharge-reduction scenarios, the central floodplain and eastern coastal areas are comparatively more sensitive to future stress. Therefore, groundwater extraction should be closely controlled in areas with concentrated pumping, thin aquifer units, or proximity to the coastal boundary. Well registration, abstraction metering, and periodic review of pumping permits should be strengthened, while groundwater levels, river baseflow, electrical conductivity, chloride concentrations, and other salinity indicators should be used as early-warning parameters for excessive drawdown, streamflow depletion, and seawater intrusion.
The groundwater-monitoring network should also be expanded beyond the four observation wells currently available for model calibration. Priority should be given to installing additional monitoring wells in the basin center, major agricultural pumping areas, and the eastern coastal zone. Nested wells completed at different depths would improve understanding of vertical hydraulic connectivity between the floodplain, terrace, and deeper semi-consolidated aquifers. Automated water-level recorders and more frequent measurements are recommended to capture short-term responses to monsoonal rainfall, drought periods, and seasonal pumping.
Further investigations should include repeated wet- and dry-season sampling of groundwater, rainfall, and surface water for stable isotopes and hydrochemical parameters. Independent recharge-estimation methods, such as chloride mass balance, water-table fluctuation analysis, soil-moisture monitoring, or lysimeter measurements, would help validate the spatially distributed recharge values obtained from model calibration. Future model development should refine the representation of lateral boundary inflows, irrigation return flow, river–aquifer exchange, and aquifer-specific water budgets. Model uncertainty should also be quantified before establishing numerical extraction limits. Updated simulations incorporating climate projections, land-use change, and spatially concentrated pumping would provide a stronger basis for long-term groundwater allocation and drought-preparedness planning in the Surat Thani basin.
Author Contributions
Conceptualization, S.M. and P.P. (Passakorn Pananont); field samplings, data acquisition and data curation, data analysis, and data presentation, S.M.; data interpretation, S.M., P.P. (Passakorn Pananont), S.S. (Schradh Saenton), P.J., P.T., S.S. (Somruedee Sakkaravej) and C.R.; model formulation, execution and calibration, S.M., S.S. (Schradh Saenton) and P.P. (Pee Poatprommanee); funding acquisition and supervision, L.T. and P.P. (Passakorn Pananont); writing—original draft preparation, S.M.; writing—review and editing, S.S. (Schradh Saenton) and P.P. (Passakorn Pananont). All authors have read and agreed to the published version of the manuscript.
Funding
This research work was partially supported by Kasetsart University Research and Development Institute, KURDI for supporting this research through the project “An application of stable isotope of water–rainfall and groundwater impact to flood and drought assessment” (Contract No. FF(KU) 44.68).
Data Availability Statement
Restrictions apply to the availability of these data. Data were obtained from the Department of Groundwater Resources (DGR), the Royal Irrigation Department (RID), and the Thai Meteorological Department (TMD), Thailand, and are available from the authors with the permission from these third parties.
Acknowledgments
The authors gratefully acknowledge the Department of Groundwater Resources (DGR), the Royal Irrigation Department (RID), and the Thai Meteorological Department (TMD), Thailand, for providing groundwater, hydrological, and meteorological datasets used in this study. Chiang Mai University is also acknowledged for partial financial support of S. Saenton and P. Poatprommanee. The authors would like to thank Prinya Putthapiban, Mahidol University Kanchanaburi Campus, for his valuable advice and constructive suggestions on the geological and hydrogeological context of the Surat Thani Basin during the manuscript revision.
Conflicts of Interest
The authors declare no conflicts of interest. The funders had no role in the design of the study; in the collection, analyses, or interpretation of data; in the writing of the manuscript; or in the decision to publish the results.
References
- Bhandari, R.; Xue, W.; Virdis, S.G.P.; Winijkul, E.; Nguyen, T.P.L.; Joshi, S. Monitoring and Assessing Urbanization Progress in Thailand between 2000 and 2020 Using SDG Indicator 11.3.1. Sustainability 2023, 15, 9794. [Google Scholar] [CrossRef] [Scilit]
- Lilavanichakul, A.; Pathak, T.B. Thai farmers’ perceptions on climate change: Evidence on durian farms in Surat Thani province. Clim. Serv. 2024, 34, 100475. [Google Scholar] [CrossRef] [Scilit]
- Srivanit, M.; Kongphunphin, C.; Rinchumphu, D. Exploring the Association of Spatial Capital and Economic Diversity in the Tourist City of Surat Thani, Thailand. ISPRS Int. J. Geo-Inf. 2022, 11, 507. [Google Scholar] [CrossRef] [Scilit]
- Department of Groundwater Resources (DGR). National Groundwater Well Database (Pasutara XML). Available online: http://app.dgr.go.th/newpasutara/xml/ (accessed on 1 September 2025). (In Thai)
- Harbaugh, A.W. MODFLOW-2005: The U.S. Geological Survey Modular Groundwater Model: The Ground-Water Flow Process; Techniques and Methods 6-A16; U.S. Department of the Interior: Reston, VA, USA, 2005.
- McDonald, M.G.; Harbaugh, A.W. A Modular Three-Dimensional Finite-Difference Groundwater Flow Model; Techniques of Water-Resources Investigations 06-A1; U.S. Geological Survey: Reston, VA, USA, 1988.
- Doherty, J. PEST, Model-Independent Parameter Estimation—User Manual, 5th ed.; Watermark Numerical Computing: Brisbane, Australia, 2004; 336p. Available online: https://www.nrc.gov/docs/ML0923/ML092360221.pdf (accessed on 1 September 2025).
- Doherty, J.; Hunt, R.J. Approaches to Highly Parameterized Inversion: A Guide to Using PEST for Groundwater-Model Calibration; Scientific Investigations Report 2010-5169; U.S. Geological Survey: Reston, VA, USA, 2010.
- Hill, M.C.; Tiedeman, C.R. Effective Groundwater Model Calibration: With Analysis of Data, Sensitivities, Predictions, and Uncertainty; John Wiley & Sons: Hoboken, NJ, USA, 2005. [Google Scholar]
- Afridi, M.Z.; Santha, N.; Taweelarp, S.; Ploymaklam, N.; Khebchareon, M.; Qamar, M.S.; Saenton, S. Groundwater Recharge Assessment and Recharge Zonation of the Intermontane Groundwater Basin, Chiang Mai, Thailand, Using a Groundwater Flow Model and Stable Isotopes. Sustainability 2025, 17, 5560. [Google Scholar] [CrossRef] [Scilit]
- Taweelarp, S.; Khebchareon, M.; Saenton, S. Evaluation of Groundwater Potential and Safe Yield of Heterogeneous Unconsolidated Aquifers in Chiang Mai Basin, Northern Thailand. Water 2021, 13, 558. [Google Scholar] [CrossRef] [Scilit]
- Gat, J.R. Comments on the Stable Isotope Method in Regional Groundwater Investigations. Water Resour. Res. 1971, 7, 980–993. [Google Scholar] [CrossRef] [Scilit]
- Praamsma, T.; Novakowski, K.; Kyser, K.; Hall, K. Using stable isotopes and hydraulic head data to investigate groundwater recharge and discharge in a fractured rock aquifer. J. Hydrol. 2009, 366, 35–45. [Google Scholar] [CrossRef] [Scilit]
- Masoud, M.H.; Schneider, M.; El Osta, M.M. Recharge flux to the Nubian Sandstone aquifer and its impact on the present development in southwest Egypt. J. Afr. Earth Sci. 2013, 85, 115–124. [Google Scholar] [CrossRef] [Scilit]
- El Osta, M. Maximizing the management of groundwater resources in the Paris–Abu Bayan reclaimed area, Western Desert, Egypt. Arab. J. Geosci. 2018, 11, 642. [Google Scholar] [CrossRef] [Scilit]
- Masoud, M.; Basahi, J.; Alqarawy, A.; Schneider, M.; Osta, M.E.; Niyazi, B.; Karthikeyan, B. Assessment of groundwater renewability of the coastal aquifer in southwest Saudi Arabia based on environmental isotopes and hydrochemical analytical approaches. J. Afr. Earth Sci. 2026, 240, 106164. [Google Scholar] [CrossRef] [Scilit]
- Piper, A.M. A Graphic Procedure in the Geochemical Interpretation of Water-Analyses. Eos Trans. Am. Geophys. Union 1944, 25, 914–928. [Google Scholar]
- Gibbs, R.J. Mechanisms Controlling World Water Chemistry. Science 1970, 170, 1088–1090. [Google Scholar] [CrossRef] [Scilit] [PubMed]
- Scanlon, B.R.; Healy, R.W.; Cook, P.G. Choosing Appropriate Techniques for Quantifying Groundwater Recharge. Hydrogeol. J. 2002, 10, 18–39. [Google Scholar] [CrossRef] [Scilit]
- Healy, R.W. Estimating Groundwater Recharge; Cambridge University Press: Cambridge, UK, 2010. [Google Scholar]
- Freeze, R.A.; Cherry, J.A. Groundwater; Prentice-Hall: Englewood Cliffs, NJ, USA, 1979; 604p. [Google Scholar]
- Taylor, R.G.; Scanlon, B.; Döll, P.; Rodell, M.; van Beek, R.; Wada, Y.; Longuevergne, L.; Leblanc, M.; Famiglietti, J.S.; Edmunds, M.; et al. Ground Water and Climate Change. Nat. Clim. Change 2013, 3, 322–329. [Google Scholar]
- Tatong, T.; Margane, A.; Kunthasup, P.; Chaprasert, S. Hydrogeology of the Surat Thani Greater City Area; Environmental Geology for Regional Planning: Technical Report No. 30, BMZ-No. 93.2080.5; Thai-German Technical Cooperation Project Environmental Geology for Regional Planning: Bangkok, Thailand, 2001. [Google Scholar]
- Department of Groundwater Resources (DGR). Thailand Groundwater Monitoring System (TGMS). Available online: http://tgms.dgr.go.th/ (accessed on 1 September 2025). (In Thai)
- Ridd, M.R.; Barber, A.J.; Crow, M.J. The Geology of Thailand; Geological Society: London, UK, 2011. [Google Scholar]
- Department of Groundwater Resources (DGR). Groundwater Potential Map of Surat Thani Province. Available online: https://datum.dgr.go.th/mapgroundwater/popup.php?province_code=84 (accessed on 1 September 2025). (In Thai)
- Thai Meteorological Department (TMD). Meteorological Data and Statistics of Surat Thani Station (WMO: 48551). Available online: https://data-service.tmd.go.th/ (accessed on 2 July 2025). (In Thai)
- Royal Irrigation Department (RID). Telemetry Station Information, Royal Irrigation Department. Available online: https://telerid.rid.go.th/ (accessed on 1 September 2025). (In Thai)
- Dahlstrom, D.J. Calibration and Uncertainty Analysis for Complex Environmental Models. Groundwater 2015, 53, 673–674. [Google Scholar] [CrossRef] [Scilit]
- Anderson, M.P.; Woessner, W.W.; Hunt, R.J. Applied Groundwater Modeling: Simulation of Flow and Advective Transport, 2nd ed.; Academic Press: Cambridge, UK, 2015; pp. 535–564. [Google Scholar]
- Mehdinejadiani, B. A novel inverse model insensitive to initial guesses for estimating parameters of continuous time random walk-truncated power law model. J. Hydrol. 2025, 657, 133206. [Google Scholar] [CrossRef] [Scilit]
- Guleria, A.; Mehdinejadiani, B. Groundwater quality evaluation and human health risk assessment of nitrate using deterministic and probabilistic approaches in Qorveh-Dehgolan region, Kurdistan province, Iran. Int. J. Environ. Health Res. 2025. Online ahead of print. [Google Scholar] [CrossRef] [Scilit] [PubMed]

Disclaimer/Publisher’s Note: The statements, opinions and data contained in all publications are solely those of the individual author(s) and contributor(s) and not of MDPI and/or the editor(s). MDPI and/or the editor(s) disclaim responsibility for any injury to people or property resulting from any ideas, methods, instructions or products referred to in the content. |
© 2026 by the authors. Licensee MDPI, Basel, Switzerland. This article is an open access article distributed under the terms and conditions of the Creative Commons Attribution (CC BY) license.