


Abstract
The beneficial utilization of small and medium floods requires a clear flood-control safety boundary before floodwater can be moderately stored and regulated as a water resource. For the Three Gorges Reservoir, a large river-type reservoir with long-distance backwater effects and tributary blocking, this boundary cannot be determined solely from the dam-front water level. This study developed a one-dimensional unsteady hydrodynamic model with dynamic roughness calibration to investigate the risk-constrained flood-season operating water level of the Three Gorges Reservoir. Typical flood events and the 20-year return period design flood were used to examine the responses of the maximum dam-front flood-regulation water level, excess flood volume, longitudinal water levels, and exceedance risk at key reservoir-area sections under different initial regulation water levels and release-discharge conditions. The results show that the Changshou reach is the main control section for high-water-level inundation risk under the study scenarios. When the initial regulation water level is at or below 155 m, the dam-front flood-regulation water level, the peak water level at Changshou, and the exceedance duration generally vary only slightly. When the initial regulation water level exceeds 155 m, these risk indicators increase markedly, indicating a reduced flood-control safety margin. Perturbation analysis further shows that the dam-front flood-regulation indicators are relatively insensitive to small roughness and dam-front boundary perturbations, whereas the Changshou water level and exceedance duration are more sensitive to roughness and flood-volume perturbations. Therefore, 155 m should be interpreted as a conservative operational reference boundary under the current design-flood framework, existing operation rules, and the assumption of no forecast-based pre-release, rather than as an absolute safety threshold. Increasing release discharge can reduce high-water-level risk in the reservoir area under preset release limits, but its practical application must remain conditional on downstream flood-control constraints and real-time flood-conveyance capacity. The results provide a hydrodynamic basis for risk-constrained flood-season operation of large river-type reservoirs.
1. Introduction
The Three Gorges Project is a key regulating project in the Yangtze River Basin. In addition to its primary role in flood control, it also serves multiple functions, including hydropower generation, navigation, water supply, and ecological replenishment. Maintaining a persistently low operating water level during the flood season helps reserve flood-control storage capacity, but it also substantially constrains power generation efficiency and the reservoir’s capacity to supplement water supply in the later period. This issue is particularly pronounced in dry years, when the failure to effectively utilize small and medium floods may reduce the overall benefits of water resources management. In this study, the “beneficial utilization of small and medium floods” refers to the regulation of flood events that do not reach the defense level of large or extreme floods and that have a certain degree of forecastability and controllability. Under the premise of not lowering the reservoir flood-control safety standards or increasing unacceptable flood risks in the reservoir area and downstream reaches, part of the floodwater can be converted into usable water resources for hydropower generation, navigation, water supply, ecological water replenishment, or end-of-flood-season storage by moderately raising the flood-season operating water level, optimizing the outflow process, and making use of the reservoir storage capacity. As transitions between floods and droughts become increasingly frequent under a changing climate, the traditional strategy of keeping the reservoir at a low level throughout the flood season in anticipation of incoming floods is no longer sufficient to simultaneously meet the needs of flood-control safety and resource utilization. Against the backdrop of intensifying extreme rainfall, accelerating flood–drought alternation, and growing demands for both basin-scale flood control and integrated water resources utilization, how to further exploit the operational potential of the Three Gorges Reservoir during the flood season while ensuring flood-control safety has become an important issue that warrants renewed investigation.
At present, considerable uncertainty still exists in flood discharge prediction and design flood estimation. Şen et al. [1] predicted current and future flood discharges in data-scarce basins and analyzed changes in flood discharge under different future periods using a GIS-based hydrological modeling approach. They reported that peak discharge is highly sensitive to changes in precipitation. Their study indicates that, under the combined effects of climate change and hydrological data uncertainty, the response of medium-frequency flood processes may become more complex. Therefore, reservoir operating water-level decisions should not rely solely on a single deterministic flood scenario, but should be supported by robustness analyses under different hydrological conditions and model assumptions. For the Three Gorges Reservoir, the key issue in the beneficial utilization of small and medium floods is not only whether the flood-season operating water level can be raised, but also whether the increased operating water level can still satisfy flood-control safety constraints under different flood compositions, operational boundaries, and model-parameter conditions.
In recent years, studies on the operation management and comprehensive benefits of the Three Gorges Project in the new stage have further indicated that the operation mode of the Three Gorges Reservoir has gradually shifted from static control under a single flood-control constraint to refined dynamic operation that accounts for multiple objectives, including flood control, hydropower generation, navigation, water supply, ecology, and sediment management. Guo et al. [2] pointed out that, with the completion and operation of reservoir groups in the upper Yangtze River, changes in inflow and sediment conditions, and the increasing demand for efficient water-resource utilization and ecological protection, the original 175–155–145 m operation scheme can no longer fully meet the requirements of the new stage. They proposed an adjusted operation strategy in which the water level of the Three Gorges Reservoir during the main flood season could be dynamically controlled within the range of 155–160 m, with early impoundment at the end of the flood season. From the perspective of ensuring the “ten major safety aspects” of the Three Gorges Project, Li [3] emphasized the need to further improve the joint operation mechanism of water projects in the Yangtze River Basin with the Three Gorges Project as the core, continuously enhance its comprehensive benefits in flood control, hydropower generation, navigation, water supply, and ecological regulation, and promote the construction of a digital-twin Three Gorges system and the improvement of rainfall, runoff, and flood monitoring and forecasting systems. These studies and management requirements indicate that the optimization of the flood-season operating water level of the Three Gorges Reservoir is no longer a simple issue of water-level adjustment, but a comprehensive operation problem involving flood-control safety, resource utilization, ecological protection, and engineering safety.
Research on dynamic control of the flood-limited water level provides an important theoretical basis for addressing this issue. Existing studies generally agree that the flood-limited water level is not a single fixed control value, but rather an operational parameter that can be adjusted dynamically under the combined constraints of forecast accuracy, operational capability, risk tolerance, and multiple water-use objectives [1,2,3,4,5,6,7,8,9,10,11,12,13,14,15,16,17,18]. Previous work has mainly focused on theories and methods for dynamic control, identification of control domains, risk–benefit analysis of raising the flood-limited water level, and optimization of operating water levels under staged, zoned, and joint operation scenarios in cascade reservoir systems [1,6,9,12,13,14,15,16,17,18]. Wang et al. [19] further discussed this issue from the perspective of flood-season division. They pointed out that, after the completion and operation of upstream reservoirs such as Lianghekou, Wudongde, and Baihetan, the inflow, sediment regime, and hydrological conditions of the Three Gorges Reservoir have changed markedly, and the current operation mode needs to be adapted to these new requirements. Their study suggested that the flood season of the Three Gorges Reservoir should be further divided into the pre-flood drawdown period, the plum-rain main flood season, the transition period, and the autumn-rain impoundment period in West China. They also recommended dynamic control of the operating water level based on 1–5-day flood forecasting processes. These studies indicate that, given the availability of flood forecasting, pre-release operations, and joint reservoir scheduling, there is potential to optimize flood-season operating water levels. However, for a mega-reservoir such as the Three Gorges Reservoir, which plays a pivotal role in basin-wide flood control, whether adjustments to the operating water level can improve water-resource utilization while maintaining flood-control safety in both the reservoir area and downstream reaches still needs to be evaluated in light of specific engineering conditions and flood-regulation responses [13,14,15,16,17,18,19,20,21].
Considerable research has examined how the operation of the Three Gorges Project affects flood-control conditions at both the basin and downstream scales. This body of work has generated substantial understanding, focusing mainly on topics such as the estimation of design floods during the operational period, the application conditions of flood-season control water levels, flood encounter patterns, the effects of joint operation of cascade reservoirs, and hydrological responses in the middle and lower reaches of the Yangtze River [20,21,22,23,24,25,26,27,28,29,30]. Chen et al. [31] systematically reviewed the research and practice of flood-control operation of the Three Gorges Project. They pointed out that the flood-control operation scheme of the Three Gorges Reservoir has undergone a gradual process of improvement, from the preliminary design stage and optimized operation schemes to the cascade operation regulations for the normal operation period and their 2019 revised version. In the 2019 operation regulations, the flood-control storage capacity of the Three Gorges Reservoir was further divided into different zones for flood-control compensation at Chenglingji and in the Jingjiang reach. Meanwhile, with the successive completion and operation of upstream controlling reservoir groups, the influence of joint operation between the Three Gorges Reservoir and upstream reservoirs on the basin-scale flood-control pattern has become increasingly prominent. Based on daily discharge series of the mainstream and tributaries in the middle and lower reaches of the Yangtze River from 2003 to 2022, Zhang et al. [32] analyzed the spatial sources of mainstream floods in the middle and lower Yangtze River after the construction of the Three Gorges Dam. They indicated that mainstream floods in the middle and lower reaches are jointly affected by tributary inflows, lake contributions, and intervening catchment runoff, and that flood sources show clear spatial combination characteristics. Existing studies indicate that operational analyses of the Three Gorges Reservoir should not be limited to controlling the flood peak in front of the dam, but should also account for flood volume over the event duration, the hydrograph characteristics of typical flood events, and the reshaping of inflow processes by upstream cascade regulation [22,23,29]. Meanwhile, the flood-season control water level of the Three Gorges Reservoir and its applicable operating conditions are jointly influenced by multiple factors, including flood magnitude, flood encounter scenarios, the flood-peak reduction capacity of upstream reservoirs, and downstream channel flood-control constraints [20,21,24,25,26,27,28]. In addition, the effects of Three Gorges operation can propagate across a broader spatial scale through water exchange between Dongting Lake and the Yangtze River, changes in water-level processes in the middle reaches, and variations in channel conveyance conditions [27,28,29,30]. Although these studies have highlighted the close linkage between the operating regime of the Three Gorges Reservoir and basin-wide flood-control conditions, there is still a lack of systematic, targeted analysis of how the operational boundaries of flood-season water levels, under the objective of utilizing small and medium floods as water resources, may further affect flood-control safety in both the reservoir area and downstream reaches through the flood-regulation process.
In terms of high-precision simulation and operational assessment for river-type reservoir areas, existing studies have increasingly recognized that the Three Gorges Reservoir differs fundamentally from conventional lake-type reservoirs. It is characterized by long-distance backwater effects, tributary flow blocking, uneven longitudinal distribution of storage capacity, and significant influences from uncontrolled interval inflows. As a result, operational assessment cannot rely solely on single-point control at the dam site or simplified storage–water level relationships, but instead requires more refined hydrodynamic modeling approaches [21,30,31,32,33,34,35,36]. Previous studies have commonly employed one-dimensional or quasi-two-dimensional models to simulate unsteady-flow processes in the mainstream and tributaries, while improving model accuracy through cross-section refinement, river-network coupling, parameter calibration, and dynamic roughness correction [33,34,35,36]. Meanwhile, sediment transport and river-channel evolution are also important factors affecting the optimization of the operating water level of the Three Gorges Reservoir. Hu et al. [37] pointed out that sediment deposition in the Three Gorges Reservoir and channel erosion downstream of the dam are long-term processes. The operation of small and medium floods not only affects sediment flushing and the long-term effective storage capacity of the reservoir, but also influences vegetation development on downstream floodplains and flood-conveyance capacity. Their study also indicated that a dam-front water level of approximately 150 m is an important critical level for controlling the loss of flood-control storage capacity. When the dam-front water level rises to 155 m, the proportion of sediment deposition within the flood-control storage zone begins to increase. These findings indicate that adjustment of the operating water level of the Three Gorges Reservoir involves not only dam-front flood-routing safety and water-level responses in the reservoir area, but also sediment deposition, downstream channel erosion, downstream flood-conveyance capacity, and the maintenance of long-term effective storage capacity. Therefore, accurate calculation of longitudinal water-level processes and local high-water-level responses is a prerequisite for discussing the operating water-level boundary and its flood-control safety effects. However, from the perspective of utilizing small and medium floods as water resources, further efforts are still needed to strengthen the identification of key control sections, to clarify the quantitative relationship between dam-front operating conditions and water levels in critical reaches of the reservoir area, and to define the corresponding operational boundaries [20,21,33,36].
Although previous studies have provided an important basis for flood-season operation and dynamic control of the flood-limited water level of the Three Gorges Reservoir, several limitations remain from the perspective of the beneficial utilization of small and medium floods. First, existing studies have mostly focused on the theory of dynamic control of the flood-limited water level, the control domain of the flood-limited water level, the trade-off between flood-control risk and utilization benefits, or the optimal joint operation of cascade reservoirs. However, for large river-type reservoirs such as the Three Gorges Reservoir, systematic analysis is still lacking on how to determine the flood-season operating water-level boundary for the beneficial utilization of small and medium floods under the conditions of long-distance backwater effects, tributary backwater influence, and non-uniform variations in the reservoir water-surface profile. Second, existing studies on the operational effects of the Three Gorges Reservoir have mainly emphasized the maximum dam-front water level, flood-peak attenuation, or downstream flood-control regulation. However, it remains unclear which river reach should be selected as the unified key control section for inundation-risk control within the reservoir area. Third, although one-dimensional or quasi-two-dimensional hydrodynamic models have been widely used to simulate water-level processes in the Three Gorges Reservoir area, previous studies have not sufficiently established the quantitative relationship among the dam-front water level, reservoir inflow, and the water level at the key control section. Nor has this relationship been further transformed into an operating water-level boundary for the beneficial utilization of small and medium floods. Therefore, under the premise of ensuring controllable inundation risk in the reservoir area, whether the flood-season operating water level of the Three Gorges Reservoir can be moderately raised, to what extent it can be raised, and which key sections and risk indicators should be used as constraints remain issues that require further investigation.
Based on this, this study focuses on the beneficial utilization of small and medium floods. A one-dimensional unsteady hydrodynamic model of the Three Gorges Reservoir area was developed and optimized using a dynamic roughness calibration method. By combining typical flood processes with 20-year design floods, this study systematically analyzes the maximum flood-routing water level of the Three Gorges Reservoir, excess flood volume, and longitudinal water-level response characteristics under different initial operating water levels and outflow discharge conditions. Here, the initial operating water level refers to the dam-front water level at the beginning of flood-routing calculation for a design flood or a typical flood. The maximum flood-routing water level refers to the maximum dam-front water level reached during flood routing under a given initial operating water level, inflow flood process, and outflow rule. The excess flood volume refers to the cumulative outflow volume corresponding to the portion of outflow discharge exceeding the control discharge of 55,000 m3/s. The main objectives of this study are to identify the key control section in the reservoir area, reveal the mechanisms by which changes in flood-season operating water level and outflow discharge affect flood-control safety in the reservoir area, and further examine the robustness of the operating boundary through parameter and scenario perturbation analyses. The results provide a basis for optimizing the flood-season operation of the Three Gorges Reservoir and for studying the operation of similar large river-type reservoirs.
2. Materials and Methods
2.1. Study Area Overview
The Three Gorges Reservoir is located in the transitional reach from the upper to the middle Yangtze River and is a typical large river-type reservoir. Its reservoir area is characterized by a long backwater reach along the main stem, a large longitudinal river scale, and substantial hydraulic influences from major tributaries such as the Jialing River and the Wu River. As a result, hydraulic conditions vary markedly along the reservoir, giving rise to typical features such as long-distance backwater effects, tributary blocking, and spatially heterogeneous responses. Unlike lake-type reservoirs, the operational safety of the Three Gorges Reservoir during the flood season depends not only on the maximum flood-regulation water level in front of the dam, but also on local high water levels along the reservoir and the corresponding flood-inundation control limits. Therefore, when investigating flood-season operating water levels under the objective of utilizing small and medium floods as water resources, it is necessary to jointly consider the flood-regulation process at the dam site and the water-level risks in key reaches of the reservoir area.
According to flood-control management requirements in the reservoir area, different river reaches are constrained by specific control elevations, such as the land acquisition line (the control water-level line used in the inundation impact assessment of the reservoir area to determine the scope of land acquisition) and the resettlement relocation line (the control water-level line used in the inundation impact assessment of the reservoir area to determine the scope of resident relocation and resettlement impacts). As the water level in front of the dam rises and reservoir inflow increases, water levels along the reservoir do not change synchronously or with uniform magnitude. Instead, they exhibit pronounced spatial variability under the combined effects of topographic conditions, tributary inflows, and backwater propagation. In this context, identifying the key reach that first approaches its control limit under the utilization of small and medium floods, and establishing the critical relationship among the dam-front water level, reservoir inflow, and the water level at the key hydrological station, are prerequisites for determining the operational boundaries during the flood season. The study area and the key control stations considered in this paper are shown in Figure 1.
Figure 1.
Study area and key control stations.
To more intuitively illustrate the relationships among reservoir operation, mainstream backwater formation, and tributary confluence response in the Three Gorges Reservoir area, a conceptual schematic diagram (Figure 2) has been added in this study. Under dam-operation conditions, the hydrodynamic regime of the mainstream from the dam front to the upstream reservoir area can be conceptually divided into the perennial backwater zone, the transition zone, and the fluctuating backwater zone. The perennial backwater zone is located near the dam front, where the water-level process is mainly controlled by the downstream boundary at the dam front. This zone is characterized by a relatively small water-surface slope and exhibits pronounced reservoir-type hydraulic characteristics. The fluctuating backwater zone is located farther upstream, where the water-level process is jointly affected by the upstream flood process, the backwater effect from the dam front, and tributary confluence, thus showing marked temporal variability and spatial heterogeneity. The transition zone lies between these two zones and exhibits both river-type and reservoir-type hydrodynamic characteristics.
Figure 2.
Schematic diagram of the upstream and downstream regions of the reservoir.
Tributary confluences are among the areas where the coupling between backwater effects and local flood responses is most pronounced. When the mainstream water level is high, backwater effects can weaken the ability of tributary floods to discharge into the mainstream and may lead to local water-level impoundment near the tributary confluence. When tributary floods coincide with high mainstream water levels, this interaction can further raise the water levels at the confluence and in adjacent river reaches. Therefore, the high-water-level risk at key sections in the reservoir area is not controlled solely by the dam-front water level, but is jointly determined by dam operation, mainstream flood propagation, tributary confluence, and backwater effects.
2.2. Development of the One-Dimensional Hydrodynamic Model
2.2.1. Governing Equations of the Hydrodynamic Model
Given that the Three Gorges Reservoir is a typical river-type reservoir and that interactions between the main stem and tributaries are pronounced, a one-dimensional unsteady hydrodynamic model was employed in this study to simulate flood routing within the reservoir area. The governing equations for an individual channel are based on the Saint-Venant equations, including the continuity equation and the momentum equation:
where i denotes the cross-section index; A is the flow area; Q is the discharge at the cross-section; Z is the water level; qL is the lateral inflow per unit channel length; t is time; x is the longitudinal coordinate; g is the gravitational acceleration; and K is the conveyance modulus. The above equations represent the conservation of mass and momentum in the channel, respectively, and can be used to describe the propagation, deformation, and backwater rise of flood waves in the river channel.
The model domain extends along the mainstream from Zhutuo to the Three Gorges Dam site, with a total length of 756.9 km, the simplified schematic is shown in Figure 3. The topographic data used in the model were obtained from the measured cross-sectional data of the Three Gorges Reservoir area in 2020, which are the most recent available topographic data. More than 400 cross-sections were included, with cross-section spacing ranging from 1 to 3 km. The model comprehensively considers the segmented storage capacity of the Yangtze River mainstream, as well as the storage capacities of major tributaries, including the Jialing River, Yulin River, Longxi River, Wujiang River, Quxi River, Long River, Xiaojiang River, Tangxi River, Modao Stream, Meixi River, Daning River, Yandu River, Qinggang River, and Xiangxi River. The entire reservoir area was divided into 19 sub-reaches, as shown in the corresponding figure. Discharge boundary conditions were specified at the mainstream inlet, the Wujiang River, and the Jialing River. The Qijiang River was represented by an independent lateral inflow boundary, while the inflows from the remaining tributaries were collectively assigned to a lateral inflow boundary located 100 km upstream of the dam. The one-dimensional hydrodynamic model was established based on the Saint-Venant equations. An explicit finite-volume scheme was adopted, in which the fluxes at cell interfaces were calculated using the Roe approximate Riemann solver. The numerical stability of the scheme is constrained by the Courant–Friedrichs–Lewy condition:
Figure 3.
Schematic diagram of the model domain and boundary conditions.
Although a more conservative Courant number limit of 0.5 is commonly recommended for numerical stability, the Courant number in the practical simulations was controlled below 0.9 according to the stability setting of the model. CASIER was implicitly coupled with the river channel through a state transition matrix.
2.2.2. Generalization of the Mainstream–Tributary River Network
According to the river-type characteristics of the Three Gorges Reservoir, the model generalizes the reservoir reach of the Yangtze River main stem together with major tributaries, including the Jialing River and the Wu River, into a one-dimensional river-network system. Computational cross-sections were arranged along the main stem from the reservoir tail to the dam site, with particular emphasis on representative stations such as Cuntan, Changshou, Qingxichang, Zhongxian, Wanxian, Fengjie, Wushan, Badong, and Zigui, so as to improve the simulation of longitudinal water-level variations and localized high-water-level processes. The tributaries were incorporated into the river network according to their confluence locations and topographic influences, allowing the model to capture the effects of tributary backwater and flood encounters on water levels in the main channel. This river-network generalization balances simulation accuracy and computational efficiency, and is capable of meeting the analytical requirements for longitudinal backwater processes and key control sections in studies on the utilization of small and medium floods as water resources.
2.2.3. Boundary Conditions
The upstream boundary of the model was specified using discharge hydrographs at the control stations, while the downstream boundary was defined as either a water-level boundary in front of the dam or an outflow-control boundary, depending on the specific simulation objective. For lateral inflows within the reservoir area, major tributaries were incorporated explicitly, whereas the remaining interval inflows were represented as lateral inflow terms in the continuity equation. The initial condition was defined by the longitudinal water-level profile in the reservoir at the start of the simulation, together with the corresponding discharge boundaries to determine the initial water-surface profile and flow state. By consistently specifying the upstream boundary, downstream boundary, and initial conditions, the model can simultaneously account for the combined effects of upstream inflow, tributary confluences, and dam-front control conditions on water-level variations within the reservoir area.
2.2.4. Numerical Solution Method
To improve the stability of unsteady-flow computation in long river reaches with multiple cross-sections, the Saint-Venant equations were discretized in this study using the Preissmann four-point implicit scheme. This method applies weighted finite differences over two adjacent spatial sections and two successive time levels, using a forward-averaged difference for the temporal derivatives and a weighted-averaged difference for the spatial derivatives. It is well suited to the numerical solution of unsteady flow in the Three Gorges Reservoir, where long-distance backwater effects, multiple tributary inflows, and high-water-level conditions must be simultaneously represented.
For an arbitrary variable f, its finite-difference form can be expressed as
where j denotes the time-level index; Δt and Δx are the time step and spatial step, respectively; and θ is the weighting coefficient, with 0 ≤ θ ≤ 1. When θ is assigned an appropriate value, the scheme can achieve a good balance between numerical stability and computational accuracy. Substituting Equations (4) and (5) into the continuity and momentum equations yields a system of algebraic difference equations for the unknown discharge and water level at the two ends of each river reach.
Substituting the above finite-difference expressions into the continuity and momentum equations yields a set of algebraic equations for the water level and discharge at adjacent cross-sections in each river reach at the next time step. To solve the model for the dendritic river-network structure of the Three Gorges Reservoir area, a procedure of “reach-by-reach recursion, node coupling, and network-wide back substitution” was adopted. First, for each individual channel, variables were eliminated successively from the downstream end, so that the internal unknowns within a reach could be recursively expressed as functions of the water level at the connecting section. Next, the common water level at the confluence nodes of the main stem and tributaries were determined using the recursive relationships derived at the downstream ends of the connected channels. Finally, back substitution was performed in the upstream direction along each channel to obtain the discharge and water-level hydrographs at any cross section throughout the entire river network. This approach ensures consistency in the overall solution of the river-network system while maintaining both numerical stability and computational efficiency.
It should be noted that the Three Gorges Reservoir is a typical river-type reservoir, in which longitudinal water-level variations are highly sensitive to channel resistance parameters. This sensitivity is particularly pronounced in the variable backwater zone, where errors in flood-wave propagation speed and peak arrival time can directly affect the identification of key control sections. Therefore, after establishing the basic numerical solution framework, this study further introduced a dynamic roughness calibration method to correct the resistance parameters in the variable backwater zone, thereby improving model accuracy under scenarios involving the utilization of small and medium floods as water resources.
2.3. Dynamic Roughness Calibration Method
2.3.1. Calibration Principle Based on Peak-Timing Phase Difference
Channel roughness plays a key role in the accurate simulation of water level and discharge. For large river-type reservoirs such as the Three Gorges Reservoir, roughness calibration faces three main challenges. First, roughness varies continuously with changing water levels, while in large-scale river-network models even small adjustments may affect the overall simulation. Second, in the lacustrine zone near the dam, water-level fluctuations are controlled mainly by the dam-front water level, so roughness has only a limited effect on the timing of water-level propagation. Third, observed water levels are often disturbed by waves, wind, and other factors, and traditional calibration methods based on minimizing the sum of squared water-level errors may fail to converge when sensitivity is weak, especially when different roughness values produce similar fitting errors.
To address these issues, this study adopted a dynamic roughness calibration method based on peak-timing differences. The core idea is to capture the phase shift of the water-level hydrograph. By establishing the direct physical relationship between flood-wave travel time and channel resistance, the roughness value is inferred from the difference between observed and simulated peak arrival times. This method can effectively reduce the influence of observational disturbances, while improving computational efficiency and calibration stability. It is particularly suitable for reservoir reaches with high dam-front water levels, extensive lacustrine zones, and pronounced water-level fluctuations.
2.3.2. Calibration Procedure
The overall calibration procedure includes data preparation, reach division, calibration sequence design, parameter constraint setting, selection of calibration periods and scenarios, and reach-by-reach calibration based on minimizing peak-timing errors.
First, observed inflow and outflow discharges, water levels at multiple stations, and channel cross-section data were collected to establish the unsteady hydrodynamic model. Using water-level stations as nodes, the river-type reservoir was divided into roughness zones according to channel width and curvature. When stations were too closely spaced, reaches with similar hydraulic characteristics were merged; when stations were too sparse, the reaches were reasonably subdivided, and each reach was assigned an initial roughness value with physical meaning.
For the calibration sequence, riverine reaches were calibrated first from upstream to downstream, followed by lacustrine reaches from the dam toward the upstream direction. Reaches excluded from roughness calibration could also be specified when needed.
The roughness constraints were set as follows: for natural channels, roughness generally ranges from 0.025 to 0.070. Considering additional head losses caused by abrupt cross-sectional changes and flow-direction variations, the allowable range was extended to 0.020–0.100, with a minimum calibration step of 0.0025.
According to the study objective, a calibration period was selected, and the observed inflow, outflow, and dam-front water level during that period were used as model boundary conditions. Calibration scenarios were then defined based on the computing environment. In a multi-core environment, parallel scenarios were arranged according to the number of CPU cores; in a single-core environment, the bisection method was applied. Roughness values were adjusted upward and downward from a selected median value within the allowable range using the prescribed step size, and the number of scenarios was set according to available computational resources.
For each target reach, the unsteady hydrodynamic model was used to simulate water-level hydrographs under different roughness scenarios, and the simulated and observed peak timings were compared through phase-difference analysis. The optimal roughness value was determined by minimizing the sum of squared peak-timing errors. If the optimal value fell at the scenario boundary without reaching the parameter limit, the scenarios were adjusted and recalculated until the calibrated value no longer lay at the upper or lower boundary, or until the roughness limit was reached.
After one reach was calibrated, the same procedure was applied sequentially to the remaining reaches according to the predefined order. This process was repeated iteratively until the roughness values in all reaches became stable, or the differences between two consecutive calibration rounds fell within the preset error tolerance, thereby completing the dynamic roughness calibration.
2.4. Model Verification
2.4.1. Performance of the Dynamic Roughness Calibration
To evaluate the performance of the dynamic roughness calibration method, historical hydrological observations from July 2016 and September 2021 were used to simulate the hydrodynamic processes in the Three Gorges Reservoir. In the simulation, the river discharge time series was specified as the upstream inflow boundary, and the water-level time series was used as the downstream boundary. Using the proposed dynamic roughness calibration method, roughness values were calibrated for 19 key cross-sections in the reservoir area. The results of roughness calibration are presented in Table 1.
Table 1.
Manning’s roughness coefficients n at key cross-sections of the hydrodynamic model for the Three Gorges Reservoir area under different operating conditions.
The hydrodynamic characteristics of the Three Gorges Reservoir show clear spatial heterogeneity. The upstream reaches are closer to natural river channels, while the downstream reaches behave more like lacustrine waters; in both areas, hydraulic conditions are relatively stable and roughness varies only slightly. In contrast, the middle variable backwater zone is jointly affected by upstream inflow processes and dam-front water-level fluctuations, resulting in more complex hydraulic conditions and more pronounced temporal variation in roughness. Therefore, a dynamic roughness calibration strategy was adopted in this study to improve the simulation accuracy of water-level processes in the variable backwater zone. For the July 2016 case, a uniform initial roughness of 0.05 was used as the starting value for reach-by-reach calibration in the one-dimensional hydrodynamic model of the Three Gorges Reservoir.
Taking Wanxian Station as an example, before roughness calibration, the maximum water-level error at Wanxian Station reached 1.4 m under the July 2016 flood condition, as shown in Figure 4. After dynamic roughness calibration, the simulated water-level process agreed much better with the observed process, and the calculation error was markedly reduced. For the September 2021 flood event, after dynamic calibration based on the roughness values obtained from the July 2016 flood, the simulation accuracy was substantially improved, with the mean absolute error reduced to within 0.1 m, as shown in Figure 5. These results indicate that the proposed method can effectively improve the accuracy of water-level simulation at key stations in the fluctuating backwater region.
Figure 4.
Simulated and observed water levels at Wanxian Station before and after roughness calibration in July 2016.
Figure 5.
Simulated and observed water levels at Wanxian Station before and after roughness calibration in September 2021.
2.4.2. Overall Validation of the Hydrodynamic Model for the Three Gorges Reservoir
Using the independently developed hydrodynamic model for the Three Gorges Reservoir, flood-season simulations were conducted for 2014 and 2016. The simulated water-level hydrographs at representative stations along the main stem in the reservoir area are shown in Figure 6. The results indicate that the mean water-level simulation error was generally within 0.1 m, with the maximum mean error remaining below 0.3 m, demonstrating a high overall modeling accuracy.
Figure 6.
Comparison between simulated and observed values. (a) 1 September 2014 to 6 October 2014; (b) 1 July 2016 to 5 August 2016.
2.4.3. Uncertainty Analysis of Residuals from Multi-Event Flood Validation
To further evaluate the simulation stability of the one-dimensional hydrodynamic model under different flood processes and hydraulic conditions in the reservoir area, and to quantitatively characterize the uncertainty of the simulated water levels, this study conducted a residual uncertainty analysis based on observed and simulated water-level series from multiple flood events.
Hourly water-level data from several representative flood events were used in this analysis, covering different periods including 2014, 2016, 2017, 2019, 2020, 2021, and 2024. The stations included in the statistical analysis were representative water-level stations in the reservoir area, including Cuntan, Changshou, Beigong, Qingxichang, Baishatuo, Zhongxian, Shibaozhai, Wanxian, Yunyang, Fengjie, Wushan, Badong, and Zigui. Since the dam-front water level is usually used as the downstream boundary condition of the model, its simulated value is highly correlated with the observed value. Including the dam-front water level in the overall error statistics may therefore underestimate the simulation uncertainty at internal sections of the reservoir area. Therefore, this section mainly focuses on the uncertainty analysis of internal stations in the reservoir area.
The residual is defined as
where e is the water-level simulation residual, Zsim is the simulated water level, and Zobs is the observed water level. When (e > 0), the simulated water level is higher than the observed value; when (e < 0), the simulated water level is lower than the observed value.
The related indicators are calculated as follows:
where N is the number of valid samples, and ei is the water-level simulation residual at the i-time step.
Table 2 presents the uncertainty statistics of water-level residuals at internal stations in the reservoir area. As shown in the table, the mean error of the internal reservoir stations is −0.042 m, indicating that the model has a slight tendency to underestimate water levels overall. The mean absolute error is 0.173 m, and the root mean square error is 0.340 m, indicating that the model achieves good simulation accuracy for water-level processes in the reservoir area.
Table 2.
Statistical results of water-level residual uncertainty at internal stations in the reservoir area.
2.5. Design Floods and Scenario Settings
2.5.1. Selection of Typical Flood Years
A key step in studying the operational design floods and flood-season operating water levels of the Three Gorges Reservoir is to characterize the composition of typical floods upstream of the dam and then carry out flood-routing simulations. The selection of typical flood years depends on flood source, hydrograph characteristics, reservoir regulation behavior, and downstream flood-control requirements. Because flood-peak shape strongly affects routing results, representative flood events should be classified and analyzed to fully capture the impacts of different flood types on reservoir operation.
According to flood source and composition, floods upstream of the Three Gorges Dam can generally be grouped into three types: (1) floods mainly originating from the controlled basin upstream of Cuntan; (2) floods with relatively small inflow from upstream of Cuntan but a large contribution from the reach between Cuntan and Yichang; and (3) floods mainly generated within the reach from Cuntan to Yichang. In terms of hydrograph shape, they can be divided into two categories: single-peak floods, which are characterized by high peaks, short duration, concentrated flood volume, and relatively sharp hydrographs; and broad floods, which usually show double-peak or multi-peak patterns, with large peak discharge and flood volume, short intervals between peaks, and a tendency for continuous rise. Floods with different source compositions and hydrograph shapes can have markedly different effects on reservoir routing and operating water levels and should therefore be considered together in design flood analysis.
Considering flood composition, peak shape, and representativeness, seven typical years: 1954, 1966, 1981, 1982, 1998, 2012, and 2020, were selected as representative design flood years. The selection of the seven typical years was based on a comprehensive consideration of flood-source composition, mainstream–tributary encounter relationships, contributions from intervening catchment inflows, flood-peak hydrograph shapes, and historical representativeness. Flood inflow to the Three Gorges Reservoir is not generated from a single source, but consists of inflows from the upper Yangtze River mainstream, the Jialing River, the Wujiang River, and the intervening catchment between Cuntan and Yichang. Floods from different sources differ in peak arrival time, flood-volume proportion, and encounter relationship, which can substantially affect the flood-routing process of the Three Gorges Reservoir and the water-level response in the reservoir area. Therefore, the selection of typical years should consider not only flood-peak magnitude, but also flood composition and hydrograph shape.
The years 1954 and 1998 represent typical major flood events jointly affected by mainstream and tributary inflows, characterized by broad flood hydrographs and large flood volumes. The years 1966 and 1981 represent flood types dominated by mainstream inflow, in which the mainstream contribution plays a leading role in determining the flood peak and flood volume at the Yichang control section. The year 1982 represents a flood type with a large contribution from intervening catchment inflow, and can be used to analyze the influence of floods generated between Cuntan and Yichang on reservoir water levels and the flood-routing process. The year 2012 represents a flood process with a relatively pronounced encounter between the mainstream flood and tributary floods such as those from the Wujiang River. The year 2020 represents a recent observed major flood process jointly affected by mainstream inflow, tributary inflow, and intervening catchment inflow.
By selecting these typical years, the study can more comprehensively cover different hydrological scenarios of Three Gorges Reservoir inflow floods, including mainstream-dominated floods, tributary-contribution floods, intervening-catchment-dominated floods, and mainstream–tributary encounter floods.
The flood characteristics at Yichang are listed in Table 3. In general, major floods at Yichang were mainly caused by one of the following conditions: large mainstream inflow coinciding with tributary floods, large tributary inflow coinciding with mainstream floods, large interval inflow, or simultaneous large inflows from both the mainstream and tributaries. As a result, the hydrographs of typical major floods were mostly broad in shape. Based on historical observations, the proportions of different inflow components in each typical year were further quantified, as shown in Table 4.
Table 3.
Classification of typical flood years at Yichang Station.
Table 4.
Flood composition of the typical years.
2.5.2. Design Flood Calculation Method
In this study, the design flood results listed in Table 5 were adopted as the control standard, and the design flood hydrographs for each typical year were derived using the same-frequency scaling method. During scaling, the hydrographs were adjusted in segments using peak discharge and flood volumes over different durations as control indices, so that the scaled peak discharge and flood volumes for each period matched the corresponding design values.
Table 5.
Statistical parameters and design values of peak discharge and cumulative flood volume.
After the typical flood processes were determined, the same-frequency scaling method was adopted in this study to construct 20-year design flood processes. The basic idea of same-frequency scaling is to preserve the temporal structure, peak arrival relationships, mainstream–tributary encounter relationships, and flood-source composition of typical historical flood processes, while segmentally scaling the flood volumes from different sources and over different durations. In this way, the synthesized design flood process can satisfy the control indicators of flood peak and flood volume under the corresponding design frequency.
Specifically, the observed flood process of each typical year was first used as the basic hydrograph, including the hydrographs at control stations on the upper Yangtze River mainstream, major tributary control stations, and intervening catchment inflows. This study mainly considers the components from Zhutuo, Beibei, Wulong, and the intervening inflow between Cuntan and Yichang. Among them, Zhutuo and Beibei reflect the inflow processes from the upper Yangtze River mainstream and the Jialing River, respectively; Wulong mainly represents the inflow process from the Wujiang River; and the intervening inflow represents the uncontrolled runoff contribution from the Cuntan–Yichang interval. Then, based on the statistical results of design floods at Cuntan and Yichang stations, the flood peak discharge and flood volumes over key durations, such as 1 d, 7 d, 15 d, and 30 d, were selected as control indicators, and each component hydrograph was scaled segment by segment.
For the mainstream control components, the scaling factors for the Zhutuo and Beibei hydrographs were mainly determined according to the design flood peak and flood-volume control values at Cuntan Station under the corresponding frequency, so as to ensure that the scaled mainstream inflow is consistent with the design frequency at the Cuntan control section. For the Wulong hydrograph and the intervening inflow process, scaling and coordination were performed according to the design flood-volume requirements at Yichang Station over the corresponding durations, so that the synthesized flood process at the Yichang control section satisfies the overall peak–volume constraints of a 20-year design flood. For single-peak floods, two-stage control or control using a few key durations can be adopted. For broad-peaked, double-peaked, or multi-peaked floods, a multi-stage control approach is used to ensure that the flood volumes during different concentration periods meet the corresponding design flood-volume requirements.
In the specific processing procedure, the scaling factors mainly act on the discharge magnitude of the corresponding component hydrographs, without changing their temporal sequence or peak arrival times. Therefore, the original rising and falling processes, peak shape characteristics, and mainstream–tributary encounter relationships of the typical floods are largely preserved. The synthesized inflow processes were then input into the one-dimensional unsteady hydrodynamic model to calculate indicators such as the maximum flood-routing water level in front of the dam, the water level at Changshou Station, and the exceedance duration under different operation scenarios. The advantage of this method is that it can satisfy the peak–volume control requirements of the design frequency while preserving, as far as possible, the hydrological structure and engineering representativeness of the typical floods.
Based on this, the observed flood hydrographs of the typical years were input into the one-dimensional hydrodynamic model of the Three Gorges Reservoir, and the model was further improved using the dynamic roughness calibration technique. The same-frequency scaling method was then applied to derive the 20-year return period design flood hydrographs with Yichang Station as the control point. The resulting design flood hydrographs for all typical years are shown in Figure 7.
Figure 7.
Typical hydrographs of the 20-year return period (5%) design flood. (a) 1954 typical year; (b) 1966 typical year; (c) 1981 typical year; (d) 1982 typical year; (e) 1998 typical year; (f) 2012 typical year; (g) 2020 typical year.
2.5.3. Operating Scenario Design and Operation Rules
To analyze the effects of different operation rules on flood-control safety under the beneficial utilization of small and medium floods, three operating scenarios were designed based on the current operation rules, as shown in Table 6. To clearly describe the outflow-control logic under different scenarios, H(t) denotes the dam-front water level at time t, Qin(t) denotes the reservoir inflow discharge, Qout(t) denotes the reservoir outflow discharge, and Qd denotes the maximum controlled outflow discharge in the medium- to high-water-level interval. In this study, Qd was set within the range of 50,000–55,000 m3/s, with an interval of 1000 m3/s, to analyze the responses of the maximum flood-routing water level in front of the dam, the water level at Changshou Station, the exceedance duration, and the excess flood volume under different discharge-capacity conditions.
Table 6.
Release-discharge rules under the three operating scenarios.
In each scenario, when the rule is described as “discharge according to inflow subject to an upper limit,” it can be expressed as Qout(t) = min[Qin(t), Qlimit], where Qlimit is the maximum allowable outflow discharge in the corresponding water-level interval. When Qin(t) < Qlimit, the outflow discharge is equal to the inflow discharge. When Qin(t) > Qlimit, the outflow discharge is constrained by Qlimit. This expression prevents “discharge according to inflow” from being misinterpreted as unconstrained discharge.
In Scenario 1, when 145 m ≤ H(t) < 155 m, Qout(t) is fixed at 30,000 m3/s. When 155 m ≤ H(t) < 171 m, Qout(t) is determined according to the inflow discharge and constrained by Qd, namely Qout(t) = min[Qin(t), Qd]. When 171 m ≤ H(t) < 175 m, Qout(t) is determined according to the inflow discharge, but does not exceed 78,000 m3/s. When H(t) ≥ 175 m, Qout(t) is determined according to the inflow discharge, but does not exceed 106,700 m3/s.
In Scenario 2, when 145 m ≤ H(t) < 165 m, Qout(t) is fixed at 30,000 m3/s. When 165 m ≤ H(t) < 171 m, Qout(t) is determined according to the inflow discharge and constrained by Qd, namely Qout(t) = min[Qin(t), Qd]. When H(t) ≥ 171 m, Qout(t) is determined according to the inflow discharge, but does not exceed 78,000 m3/s.
In Scenario 3, when 145 m ≤ H(t) < 165 m, Qout(t) is fixed at 30,000 m3/s. When 165 m ≤ H(t) < 175 m, Qout(t) is determined according to the inflow discharge and constrained by Qd, namely Qout(t) = min[Qin(t), Qd]. When H(t) ≥ 175 m, Qout(t) is determined according to the inflow discharge, but does not exceed 78,000 m3/s.
The main differences among the three scenarios lie in the settings of the low-discharge operation interval and the medium-discharge control interval. In Scenario 1, the reservoir enters the Qd-controlled interval once the water level reaches 155 m, representing a relatively conservative scheme for the beneficial utilization of small and medium floods. In Scenario 2, the low-discharge interval with a fixed outflow of 30,000 m3/s is extended to 165 m, and the 78,000 m3/s control is applied when the water level exceeds 171 m. In Scenario 3, the low-discharge interval is also extended to 165 m, but the Qd-controlled interval is further extended to 175 m. Therefore, Scenarios 2 and 3 represent stronger tendencies toward the beneficial utilization of small and medium floods, but they may also increase the high-water-level risk in the reservoir area and the inundation risk in the Changshou reach.
2.6. Uncertainty Analysis Methods and Scenario Design
To evaluate the responses of the model results and the 155 m operating water-level boundary to uncertainties in key parameters and input conditions, this study further adopted a deterministic perturbation-envelope method for sensitivity and uncertainty analysis. Four sources of uncertainty were considered, including roughness parameters, initial operating water level, maximum outflow discharge, and design flood volume, which represent model-parameter uncertainty, downstream boundary-condition uncertainty, operation-control parameter uncertainty, and hydrological-input uncertainty, respectively.
For the uncertainty analysis of roughness parameters, the calibrated roughness values were taken as the baseline, and two perturbation scenarios of ±5% were uniformly applied to all roughness zones, while other hydrological boundaries and operation rules remained unchanged. For the uncertainty analysis of the dam-front water-level boundary, perturbations in the dam-front water level within the range of 154–155 m were selected to examine the influence of small boundary-condition variations near 155 m on the results. For the uncertainty analysis of maximum outflow discharge, 55,000 m3/s was taken as the reference value, and the maximum outflow discharge was set to 52,250 m3/s and 57,750 m3/s, corresponding to −5% and +5% perturbations, respectively. For the uncertainty analysis of design flood volume, under unchanged initial operating water level and operation rules, the flood volume of the 5.0% frequency design flood based on the 2020 typical year was adjusted to three scenarios: −5%, baseline, and +5%.
For any output indicator Y, if only high- and low-perturbation scenarios were set, the difference between the high-perturbation result and the low-perturbation result was used to represent the variation range of the indicator, and half of the absolute difference was used to represent the uncertainty half-width. For the ±5% flood-volume analysis, the results under the flood-volume −5%, baseline, and flood-volume +5% scenarios were denoted as Y0, Y1, and Y2, respectively. The envelope width caused by flood-volume perturbation was expressed as |Y2 − Y0|, and the uncertainty half-width was expressed as |Y2 − Y0|/2. The evaluation indicators included the maximum flood-routing water level in front of the dam, maximum outflow discharge, flood diversion volume, maximum water level at Changshou, the Cuntan discharge and dam-front water level corresponding to the maximum water level at Changshou, and the durations for which the water level at Changshou Station exceeded the land acquisition line and the resettlement line.
3. Results
3.1. Identification of Key Control Stations for Flood-Inundation Risk in the Reservoir Area
Operation of the Three Gorges Reservoir significantly alters the water-surface profile within the reservoir area. The extent of backwater influence, the longitudinal water-level gradient, and flood-wave propagation characteristics all vary markedly under different operating stages. For precise control of flood-inundation risk, the selection of control sections should not rely solely on the earliest local response, but should also consider their ability to consistently represent changes in the reservoir water-surface profile under different operating stages, control objectives, and hydrological conditions. Because water-level responses in the reservoir-tail reaches are jointly affected by channel slope, cross-sectional geometry, mainstream–tributary interactions, and reservoir storage regulation, they show clear spatial and temporal variability. It is therefore necessary to identify key control sections from both hydrodynamic and engineering perspectives.
From a hydrodynamic perspective, the Changshou reach lies in a critical zone near the reservoir tail where backwater effects are pronounced and water-level responses are concentrated. It is highly sensitive to elevated dam-front water levels, inflow variations, and longitudinal backwater propagation. This reach can reflect both the upstream transmission of backwater rise under high dam-front water levels and the main features of water-level fluctuations caused by the combined effects of flood inflow and reservoir operation. Compared with sections that only show local short-term sensitivity, the Changshou reach provides a more integrated representation of overall water-surface evolution, peak water-level formation, and the accumulation of inundation risk, making it more suitable as an operational control section.
Under the constraint of the land acquisition line, the response of the reservoir water-surface profile to operation mode and inflow composition shows clear stage dependence, and the most sensitive local section may vary over time. Therefore, identifying the key control section solely by the first section to reach the control line in a given stage is insufficient for whole-process risk control. Located in a zone of strong high-water-level response near the reservoir tail, the Changshou reach can better capture the overall evolution of risk as the water surface approaches the control threshold. When the water level at this reach approaches or exceeds the control line, it usually indicates that the reservoir-tail area has entered a risk state requiring focused management. In other words, the Changshou reach reflects not only local water-level change, but also the overall inundation risk of the reservoir-tail reach under the land acquisition line constraint, giving it strong engineering relevance and representativeness.
Under the constraint of the resettlement relocation line, the control objective corresponds to a higher level of inundation risk and thus places stricter requirements on the control section. The key section should not only identify the occurrence of exceedance risk, but also sensitively reflect its rate of development, magnitude, and duration. Because the Changshou reach is strongly affected by both backwater and flood processes, it responds more directly to risk growth under high-water-level conditions and can effectively represent the formation and evolution of high-level inundation risk. Therefore, under the resettlement relocation line constraint, the Changshou reach is also technically suitable as the key control section.
In summary, although the sensitivity of control sections in the reservoir-tail reach may vary with operating stage and control objective, the Changshou reach shows stronger overall representativeness in terms of hydrodynamic response, risk characterization, and operational consistency. It can effectively reflect the evolution of inundation risk under the dual constraints of the land acquisition line and the resettlement relocation line. Therefore, the Changshou reach is identified in this study as the key control section for flood-inundation risk management in the Three Gorges Reservoir area.
3.2. Critical Condition Analysis for the Changshou Reach
Using the one-dimensional hydrodynamic model of the Three Gorges Reservoir, the water level in front of the dam was varied from 145 to 178 m at 1 m intervals, and the inflow discharge from 10,000 to 100,000 m3/s at 1000 m3/s intervals. The water level at Changshou was calculated for all combinations of dam-front water level and inflow discharge, and a contour map showing the response of Changshou water level to these two variables was obtained, as shown in Figure 8. Based on this, the 175.7 m and 178.0 m contours were extracted to derive the interpolated threshold lines corresponding to the land acquisition line and the resettlement relocation line at Changshou Station.
Figure 8.
Relationship of water level at Changshou with inflow discharge and dam-front water level.
Figure 9 further shows the warning inflow discharge corresponding to the two control lines, namely 178.0 m for the resettlement line and 175.7 m for the land acquisition line, under different dam-front water levels. These threshold curves can clearly distinguish all historical exceedance and non-exceedance events. The resulting boundary represents a conservative upper limit of inflow discharge: when a given water level–discharge point lies within the region enclosed by the boundary and the coordinate axes, water-level exceedance will not occur; otherwise, there is a risk of inundation in the reservoir area.
Figure 9.
Warning discharge thresholds for the Changshou reach under different dam-front water levels.
As shown in Figure 9, under current conditions, if the land acquisition line is taken as the limiting criterion, the maximum discharge that can safely pass through the Changshou reach is about 65,000 m3/s; under a 20-year return period flood at Cuntan, the dam-front water level should not exceed 152.5 m. If the resettlement relocation line is used as the limiting criterion, the maximum safe discharge through the Changshou reach increases to about 72,000 m3/s; under the same flood condition, the dam-front water level should not exceed 161 m. In addition, a higher dam-front water level leads to a stronger response of water level at Changshou to dam-front water-level fluctuations. For example, when the dam-front water level is 165 m, a 1 m fluctuation in dam-front water level causes a change of about 1500 m3/s in the discharge limit defined by the land acquisition line at Changshou. When the dam-front water level rises to 174.5 m, a 1 m fluctuation causes the corresponding discharge limit to change by about 6300 m3/s for the land acquisition line and about 4000 m3/s for the resettlement relocation line. These results indicate that the land acquisition line in the Changshou reach may become one of the key constraints on the utilization of flood resources and therefore deserves particular attention in actual reservoir operation.
3.3. Impacts of Small- and Medium-Flood Utilization on Flood-Control Safety in the Reservoir Area
3.3.1. Effect of the Initial Regulation Water Level
To identify how the initial regulation water level affects flood-control risk, this study examined the flood-routing results of Scenarios 1, 2, and 3 under maximum release-capacity control, with a focus on the 20-year return period (5%) design flood. The results are shown in Figure 10.
Figure 10.
Variation in the maximum flood-regulation water level with the initial regulation water level under different scenarios. (a) Scenario 1; (b) Scenario 2; (c) Scenario 3.
As shown in Figure 10, under the 20-year design flood, the response of the maximum flood-regulation water level to the initial regulation water level exhibits a clear nonlinear, segmented pattern. Within the lower range of initial regulation water levels, the maximum flood-regulation water level changes only slightly. Once the initial regulation water level exceeds a certain threshold, however, its influence becomes much more pronounced. This indicates that the effect of the initial regulation water level on flood-routing results is not simply cumulative and linear, but is jointly governed by the available flood-control storage, the characteristics of the flood hydrograph, and the maximum release capacity. When the initial regulation water level is low, the reservoir still retains sufficient storage for flood regulation, allowing additional inflow to be absorbed through flood detention and peak reduction; as a result, the maximum water level in front of the dam remains relatively stable. As the initial regulation water level rises, the remaining flood-control storage gradually decreases, the capacity for flood detention weakens, and the maximum water level becomes increasingly sensitive to further increases in the initial regulation water level.
More specifically, the maximum flood-regulation water level remains nearly stable when the initial regulation water level is relatively low, but increases noticeably once the initial regulation water level exceeds 155 m. This suggests that, for Scenario 1, 155 m is a critical threshold. Below this level, the reservoir still has sufficient regulating capacity, and increasing the initial regulation water level has only a limited effect on the maximum flood-regulation water level. Above this level, however, flood-control storage is further compressed, and the maximum flood-regulation water level becomes much more sensitive to changes in the initial regulation water level.
Although the exact response differs somewhat between Scenarios 2 and 3, the overall pattern is consistent with that of Scenario 1: the effect is limited below 155 m and becomes increasingly significant above 155 m. This indicates that 155 m is not only the turning point for changes in the maximum flood-regulation water level in Scenario 1, but can also serve as a common reference level for identifying risk changes associated with the initial regulation water level under different scenarios. In other words, when the initial regulation water level is controlled at 155 m or below, the reservoir still retains relatively strong flood-regulation capacity under the 20-year design flood, and the maximum flood-regulation water level remains generally stable. Once it exceeds 155 m, however, the continued loss of flood-control storage makes a rise in the maximum flood-regulation water level much more likely, thereby reducing the margin of flood-control safety.
Therefore, based on the flood-routing results for the 20-year design flood, 155 m can be identified as the critical threshold at which the initial regulation water level begins to significantly affect the maximum flood-regulation water level. This suggests that any increase in the flood-season operating water level should be kept within a reasonable range. When the initial regulation water level is below or close to 155 m, the maximum flood-regulation water level generally does not increase markedly. However, once it exceeds 155 m, the maximum water level in front of the dam may rise substantially, leading to higher flood-control risk. The underlying reason is that, below 155 m, the reservoir still retains sufficient effective flood-control storage to absorb flood peaks through detention and routing. Once the initial regulation water level rises above 155 m, the remaining storage is rapidly reduced, and the amplifying effect of further water-level increase on the maximum dam-front water level becomes dominant. Therefore, when balancing flood-control safety and flood-resource utilization, it is reasonable to take 155 m as an important reference value for optimizing the initial regulation water level. This also provides a basis for adjusting flood-season operating rules.
Compared with the maximum flood-regulation water level in front of the dam, changes in water level at the Changshou reach more directly reflect the effect of a higher initial regulation water level on flood risk within the reservoir area. Figure 11 shows the variation in peak water level at Changshou with initial regulation water level for different typical years under different scenarios. Under Scenario 1, when the initial regulation water level is below 155 m, the peak water level at Changshou remains generally stable for all typical years, and the exceedance duration changes little. Once the initial regulation water level exceeds 155 m, both the peak water level and the exceedance duration at Changshou increase significantly. This indicates that, as the initial regulation water level rises, the backwater effect in the reservoir becomes stronger, and flood risk is transmitted from the dam area further into the reservoir.
Figure 11.
Variation in peak water level at Changshou with the initial regulation water level for different typical years under different scenarios. (a) Scenario 1; (b) Scenario 2; (c) Scenario 3.
More specifically, in 2012, the water level at Changshou remained below the land acquisition line when the initial regulation water level was below 161 m. In 1966 and 1998, the resettlement relocation line began to be exceeded when the initial regulation water level reached 159 m and 163 m, respectively. In contrast, for 1981, 1982, and 2020, the resettlement relocation line was exceeded under all tested initial regulation water levels. These results indicate that the response of the Changshou reach to changes in the initial regulation water level differs markedly among flood events. For flood processes with relatively lower risk, a higher initial regulation water level mainly leads to a gradual increase in both water level and exceedance duration at Changshou. For floods already close to or above the control line, however, the Changshou reach remains in a high-risk state throughout and is more sensitive to further increases in the initial regulation water level.
Under Scenarios 2 and 3, the peak water level at Changshou exceeds the resettlement relocation line in all typical years. This indicates that if 145–165 m is maintained as a fixed low-release operating range for an extended period, it may improve the utilization of small and medium floods and increase storage by the end of the flood season, but it will also raise water-level risk within the reservoir area and significantly increase flood-control pressure in the Changshou reach. This is mainly reflected in a stronger backwater effect, longer exceedance duration, and a reduced flood-control safety margin along the reservoir banks. These results show that raising the flood-season operating water level can improve storage benefits, but at the same time intensifies high-water-level responses within the reservoir area, indicating a clear trade-off between the two.
The durations for which the peak water level at Changshou exceeded the land acquisition line and the resettlement relocation line were further calculated, as shown in Figure 12. Because the peak water level at Changshou under Scenarios 2 and 3 already exceeds the resettlement relocation line, the analysis of inundation duration was carried out only for Scenario 1.
Figure 12.
Variation in inundation duration above the land acquisition line and the resettlement relocation line at Changshou under Scenario 1 with changing initial regulation water level: (a) inundation duration above the land acquisition line; (b) inundation duration above the resettlement relocation line (under maximum release capacity).
The results show that the exceedance duration in the Changshou reach responds differently to the initial regulation water level under different control lines. For the land acquisition line, in 1954, 1981, 1982, 1998, and 2020, the duration above the line remained almost unchanged when the initial regulation water level was below 155 m, indicating that the Changshou reach was generally insensitive to changes in the initial regulation water level within this range. In 1966, when the initial regulation water level was below 155 m, the duration above the land acquisition line increased slowly with increasing initial regulation water level; once it exceeded 155 m, the increase became much more rapid. In 2012, exceedance of the land acquisition line occurred only when the initial regulation water level reached 163 m and 165 m, with durations of 15 h and 30 h, respectively.
For the resettlement relocation line, no exceedance occurred in 1954 or 2012 under any tested initial regulation water level. In 1966, no exceedance was observed when the initial regulation water level was below 161 m; once it exceeded 161 m, however, the exceedance duration increased rapidly. In 1998, exceedance occurred only when the initial regulation water level reached 165 m, with a duration of 42 h. By contrast, in 1981, 1982, and 2020, the resettlement relocation line was exceeded under all tested initial regulation water levels. In these cases, when the initial regulation water level was below 155 m, the exceedance duration changed little overall; once it exceeded 155 m, the duration increased to varying degrees.
Overall, the durations above both the land acquisition line and the resettlement relocation line in the Changshou reach show a clear threshold response to the initial regulation water level. In most cases, when the initial regulation water level is below 155 m, the exceedance duration changes only slightly. Once it exceeds 155 m, however, the duration generally increases, with particularly sharp growth in some years. This indicates that raising the initial regulation water level affects not only the peak water level, but also the duration of high-water conditions. For flood-inundation risk management in the reservoir area, prolonged duration is as important as higher peak levels. Therefore, the identification of operational boundaries should not be based solely on the maximum water level.
3.3.2. Effect of Release Discharge
Under different operating rules, the maximum flood-regulation water levels for each typical year under different release discharges and initial regulation water levels are shown in Figure 13. Since the results for Scenario 3 fully cover those for Scenario 2, only Scenarios 1 and 3 are presented for the maximum flood-regulation water level analysis. In addition, because Scenario 3 produces no excess flood volume, the analysis of excess flood volume focuses on Scenarios 1 and 2.
Figure 13.
Maximum flood-regulation water levels of the typical years under different release discharges and initial regulation water levels: (a) Scenario 1, Qd = 50,000 m3/s; (b) Scenario 1, Qd = 55,000 m3/s; (c) Scenario 3, Qd = 50,000 m3/s; (d) Scenario 3, Qd = 55,000 m3/s.
Overall, under both Scenario 1 and Scenario 3, the maximum flood-regulation water level decreases as release discharge increases for all typical years. This indicates that, under a given flood hydrograph and initial condition, increasing the release capacity enhances flood release, reduces the reservoir’s detention pressure on the flood peak, and thus effectively lowers the maximum water level in front of the dam. In essence, increasing release discharge means “releasing instead of storing,” which directly weakens the accumulation of the flood peak within the reservoir. As a result, the maximum flood-regulation water level shows an overall downward trend.
Under Scenario 1, this pattern is particularly clear, although the response to changes in the initial regulation water level still differs among typical years. In 1954, 1981, 1982, 1998, 2012, and 2020, the maximum flood-regulation water level remains nearly stable under different release discharges when the initial regulation water level is below 155 m. Once it exceeds 155 m, however, the maximum flood-regulation water level increases markedly with further increases in the initial regulation water level. This again indicates that 155 m is a critical threshold under Scenario 1. Below this level, the reservoir retains sufficient flood-regulation storage, so the maximum water level in front of the dam changes little even under different release discharges. Once the initial regulation water level exceeds 155 m, the available flood-control storage is further reduced, and the sensitivity of the maximum flood-regulation water level to the initial regulation water level increases rapidly. In 1966, the response is more gradual: the maximum flood-regulation water level rises continuously with increasing initial regulation water level, but the rate of increase is small below 155 m and becomes much greater above 155 m. This suggests that, for this type of flood event, the influence of the initial regulation water level does not appear abruptly, but strengthens significantly near 155 m, further confirming that 155 m is an important threshold for identifying risk changes.
Under Scenario 3, the maximum flood-regulation water level in all typical years also decreases as release discharge increases, indicating that the lowering effect of higher release discharge on the maximum dam-front water level remains robust regardless of changes in operating boundaries. However, compared with Scenario 1, the maximum flood-regulation water level in Scenario 3 becomes less sensitive to the initial regulation water level in some typical years. Specifically, in 1954, 1982, 1998, 2012, and 2020, the maximum flood-regulation water level is almost unaffected by changes in the initial regulation water level, suggesting that under these conditions it is controlled mainly by the flood hydrograph itself and the release capacity, rather than by the initial regulation water level. In 1966, the maximum flood-regulation water level still increases with the initial regulation water level. In 1981, it rises with the initial regulation water level when the latter is below 159 m, and then becomes nearly stable above this level. Although the detailed response varies among typical years, the overall pattern is consistent: increasing release discharge always helps reduce the maximum flood-regulation water level.
In summary, the response of the maximum flood-regulation water level to release discharge is clear: the larger the release discharge, the lower the maximum flood-regulation water level. This indicates that appropriately increasing release discharge during flood-season operation is an effective way to lower the dam-front high water level and reduce flood-regulation pressure. However, these operational benefits must be balanced against backwater effects within the reservoir area and downstream flood-control constraints.
Figure 14 further shows how excess flood volume responds to release discharge and initial regulation water level under different operating rules. Overall, the excess flood volume generally decreases as release discharge increases. This indicates that increasing release discharge not only lowers the maximum water level in front of the dam, but also helps reduce the flood volume exceeding the control standard, thereby lowering risk exposure during flood regulation.
Figure 14.
Excess flood volumes of the typical years under different release discharges and initial regulation water levels: (a) Scenario 1, Qd = 50,000 m3/s; (b) Scenario 1, Qd = 55,000 m3/s; (c) Scenario 2, Qd = 50,000 m3/s; (d) Scenario 2, Qd = 55,000 m3/s.
Under Scenario 1, the overall risk is low for most typical years. No excess flood volume occurs in 1954, 1981, 1982, 1998, or 2012, indicating that these flood events can still be effectively controlled under the existing flood-regulation capacity. In 1966 and 2020, excess flood volume appears only when the initial regulation water level is relatively high (above 159 m) and the release discharge is low, and it decreases as release discharge increases. This suggests that, under such unfavorable conditions, increasing release discharge can effectively relieve flood-regulation pressure. 1998 shows a special case: excess flood volume of 0.39 billion m3 occurs only when the release discharge is 50,000 m3/s and the initial regulation water level is 165 m. This indicates that when a high initial regulation water level coincides with a low release discharge, even a flood event with otherwise low risk may produce local excess storage.
Under Scenario 2, the pattern of excess flood volume is more evident. No excess flood volume occurs in 2012, indicating that its flood process still does not reach the risk boundary under this scenario. In 1954, 1998, and 2020, excess flood volume decreases with increasing release discharge and is essentially unaffected by the initial regulation water level, suggesting that it is controlled mainly by release capacity. In contrast, in 1966, 1981, and 1982, excess flood volume not only decreases with increasing release discharge, but also increases as the initial regulation water level rises, indicating that both factors jointly determine its magnitude in these years. Although 1982 shows the same increasing trend with initial regulation water level, the increase is relatively small, suggesting that it is less sensitive to the initial regulation water level than 1966 and 1981.
In summary, increasing release discharge reduces flood-control risk in two main ways: it lowers the maximum flood-regulation water level and decreases the excess flood volume. Compared with the initial regulation water level, release discharge has a more direct and consistent effect on improving flood-routing performance. From an engineering perspective, raising the initial regulation water level reduces the available flood-control storage, whereas appropriately increasing release discharge helps relieve flood-regulation pressure. The two therefore act as a trade-off in reservoir operation. To balance flood-control safety with the utilization of small and medium floods as water resources, it is not sufficient to rely solely on a higher initial regulation water level to increase storage; reasonable increases in release discharge must also be considered to avoid simultaneous increases in both the maximum dam-front water level and excess flood volume.
Furthermore, Figure 15 shows the peak water levels at Changshou for different typical years under different release discharges and operating rules. Overall, the peak water level at Changshou decreases as release discharge increases, indicating that higher release discharge can effectively weaken the backwater effect in the reservoir area and thus reduce the high-water-level risk in the Changshou reach. This pattern is generally consistent across different scenarios and typical years, suggesting that release discharge is a key control factor affecting water-level variations in the Changshou reach.
Figure 15.
Peak water levels at Changshou for the typical years under different release discharges and initial regulation water levels: (a) Scenario 1, Qd = 50,000 m3/s; (b) Scenario 1, Qd = 54,000 m3/s; (c) Scenario 2, Qd = 50,000 m3/s; (d) Scenario 2, Qd = 54,000 m3/s; (e) Scenario 3, Qd = 50,000 m3/s; (f) Scenario 3, Qd = 54,000 m3/s.
Under Scenario 1, the peak water level at Changshou decreases markedly with increasing release discharge in 1954, 1966, and 1998, indicating a relatively high sensitivity of the Changshou reach to release discharge during these flood events. In contrast, the change is much smaller in 1981, 1982, 2012, and 2020, suggesting that although increasing release discharge still has some mitigating effect, its influence on the peak water level at Changshou is limited in these cases.
Under Scenarios 2 and 3, the peak water levels at Changshou are generally similar. Only in 1954, 1966, and 2020, under relatively low release discharge, is the peak water level in Scenario 2 slightly lower than that in Scenario 3. Combined with the previous analysis of the maximum flood-regulation water level in front of the dam, this indicates that the water level in the Changshou reach is affected not only directly by release discharge, but also to some extent by the flood-regulation process at the dam site. Even so, the overall pattern remains consistent: under both scenarios, the peak water level at Changshou decreases as release discharge increases for all typical years. This shows that, regardless of the operating rule, increasing release discharge consistently helps reduce high-water-level risk in the Changshou reach.
Overall, increasing release discharge helps lower the peak water level at Changshou by enhancing flood-release capacity and weakening both reservoir impoundment and backwater effects, thereby reducing high water levels in key reaches of the reservoir area. From an engineering perspective, this suggests that, during flood-season operation, a reasonable increase in release discharge can not only relieve flood-regulation pressure in front of the dam, but also help control water-level risk within the reservoir area.
Because the peak water level at Changshou exceeds the resettlement relocation line under both Scenarios 2 and 3, the inundation duration at Changshou was evaluated only for Scenario 1, as shown in Figure 16. The results indicate that both the duration above the land acquisition line and the duration above the resettlement relocation line decrease as release discharge increases. This suggests that increasing release discharge not only lowers the peak water level at Changshou, but also shortens the duration of high water levels, thereby reducing inundation risk in the reservoir area to some extent.
Figure 16.
Exceedance duration at Changshou under different release discharges and initial regulation water levels (Scenario 1): (a) duration above the land acquisition line, Qd = 50,000 m3/s; (b) duration above the land acquisition line, Qd = 55,000 m3/s; (c) duration above the resettlement relocation line Qd = 50,000 m3/s; (d) duration above the resettlement relocation line Qd = 55,000 m3/s.
For the duration above the land acquisition line, 1954, 1981, 1982, 1998, and 2020 show a similar pattern: when the initial regulation water level is below 155 m, the exceedance duration remains nearly unchanged; once it exceeds 155 m, the duration increases with further increases in the initial regulation water level. 1966 is more sensitive: when the initial regulation water level is below 155 m, the duration above the land acquisition line increases slowly; once it exceeds 155 m, the increase becomes much more rapid. In 2012, the duration above the land acquisition line begins to increase only when the initial regulation water level exceeds 163 m, indicating a relatively delayed response of the Changshou reach to changes in the initial regulation water level in that year.
For the duration above the resettlement relocation line, 1954, 1966, and 1998 show that the critical initial regulation water level for exceedance increases gradually with release discharge, indicating that larger release discharges help delay or avoid the transition of the Changshou reach into a higher inundation-risk state. In 1981, 1982, and 2020, the duration above the resettlement relocation line remains nearly unchanged when the initial regulation water level is below 155 m, but increases once it exceeds 155 m. In 2012, the resettlement relocation line is not exceeded under any combination of release discharge and initial regulation water level, indicating a relatively low overall risk level in the Changshou reach during this flood event.
Overall, the effects of the initial regulation water level on the peak water level at Changshou and its exceedance duration are not uniform and can be grouped into three response types. The first is a weak-response type, in which changes in the initial regulation water level have little effect in most cases. This usually occurs for flood events with relatively low peaks, short duration, or gradual inflow variation. Under such conditions, flood evolution is mainly controlled by the inflow process, while the reservoir still retains some regulating capacity. As a result, the additional influence of the initial regulation water level on both the dam-front high water level and reservoir backwater is limited, and the changes in peak water level and exceedance duration at Changshou remain small. The second is a threshold-response type, in which the effect becomes much more pronounced once the initial regulation water level exceeds 155 m. This indicates that, above 155 m, the remaining flood-control storage is further reduced, making it easier for high dam-front water levels to propagate into the reservoir area. Consequently, both the backwater rise and the exceedance duration at Changshou increase, suggesting that 155 m can be regarded as an important threshold at which the influence of the initial regulation water level shifts from weak to strong. The third is a persistent-sensitivity type, in which some influence exists under all tested initial regulation water levels. This typically occurs for flood events that are already close to or above the control line, often characterized by high flood peaks, large flood volumes, long duration, or strong mainstream–tributary coincidence. Under such conditions, the Changshou reach remains under a persistently strong backwater effect, and thus stays highly sensitive to changes in the initial regulation water level even when that level is relatively low. These results indicate that the strength of the initial regulation water level effect is essentially determined by the relative dominance of three factors: the inflow process, the remaining flood-control storage, and the backwater effect within the reservoir area.
3.4. Parameter Uncertainty Analysis Results
3.4.1. Effects of Roughness Parameter Perturbations on Model Results
The effects of the ±5% roughness perturbations are shown in Table 7. As can be seen from the table, the dam-front flood-routing indicators are generally insensitive to changes in roughness. In Scenario 2, the maximum flood-routing water level in front of the dam is 171.000 m in both the high-roughness and low-roughness groups, showing no change. In Scenarios 3 and 1, the differences in the maximum flood-routing water level in front of the dam are both only 0.007 m, corresponding to an uncertainty half-width of ±0.0035 m.
Table 7.
Changes in relevant hydrological indicators under ±5% roughness perturbations.
In contrast, the maximum water level and exceedance duration at Changshou are more sensitive to roughness perturbations. When the roughness increases from n − 5% to n + 5%, the maximum water level at Changshou increases by 0.471 m in both Scenarios 2 and 3, corresponding to an uncertainty half-width of ±0.236 m. In Scenario 1, the maximum water level at Changshou increases by 0.635 m, corresponding to an uncertainty half-width of ±0.318 m. The duration exceeding the land acquisition line at Changshou Station increases by 6–28 h, while the duration exceeding the resettlement line increases by 6–34 h.
These results indicate that roughness uncertainty mainly affects the local water-level response and high-water-level duration in the fluctuating backwater region of the Three Gorges Reservoir area, rather than the maximum flood-routing water level in front of the dam. The greater sensitivity of the Changshou reach to roughness perturbations further supports its rationality as the key control section for inundation risk in the reservoir area.
3.4.2. Effects of Dam-Front Water-Level Boundary Perturbations on Model Results
The effects of dam-front water-level variations within the range of 154.5–155.5 m on the model results are shown in Table 8. Small variations in the dam-front boundary condition near 155 m have only a limited influence on the key results. Under the three scenarios, the variation in the maximum flood-routing water level in front of the dam ranges from 0 to 0.044 m. Specifically, no change occurs in Scenario 2, the increase is only 0.001 m in Scenario 3, and the increase is 0.044 m in Scenario 1.
Table 8.
Changes in relevant hydrological indicators under ±0.5 m dam-front water-level perturbations.
The maximum water level at Changshou is also insensitive to small perturbations in the dam-front water level. In Scenarios 2 and 3, the maximum water level at Changshou increases by only 0.001 m, while in Scenario 1 it increases by 0.014 m. Under all three scenarios, the durations for which the water level at Changshou Station exceeds the land acquisition line and the resettlement line remain unchanged.
This indicates that, under the 5.0% frequency design flood based on the 2020 typical year and a maximum outflow discharge of 55,000 m3/s, small perturbations in the dam-front water level near 155 m do not change the main risk judgment.
3.4.3. Effects of Maximum Outflow Discharge Perturbations on Model Results
The effects of ±5% variations in the maximum outflow discharge on the model results are shown in Table 9. Discharge capacity is an important operation-control factor affecting both the dam-front flood-routing water level and the water level at Changshou. When the maximum outflow discharge increases from 52,250 m3/s to 57,750 m3/s, the maximum flood-routing water level in front of the dam in Scenario 2 remains unchanged at 171.000 m. In Scenario 3, the maximum flood-routing water level in front of the dam decreases from 175.000 m to 171.741 m, with a reduction of 3.259 m. In Scenario 1, it decreases from 168.066 m to 163.611 m, with a reduction of 4.455 m.
Table 9.
Changes in relevant hydrological indicators under ±5% perturbations of the maximum release.
The maximum water level at Changshou also decreases as the maximum outflow discharge increases. In Scenarios 2 and 3, the maximum water level at Changshou decreases from 183.449 m to 182.613 m, with a reduction of 0.836 m. In Scenario 1, it decreases from 180.015 m to 179.530 m, with a reduction of 0.485 m. The exceedance duration at Changshou is also markedly shortened, with the reduction reaching up to 145 h in some scenarios.
These results indicate that the 155 m operating water-level boundary cannot be interpreted independently of discharge capacity. When discharge capacity decreases, the same initial operating water level of 155 m may correspond to a higher high-water-level risk in the reservoir area. Conversely, when downstream conditions allow an appropriate increase in discharge capacity, both the dam-front flood-routing pressure and the inundation risk in the Changshou reach can be considerably reduced.
3.4.4. Effects of Flood-Peak Perturbations on Model Results
The ±5% perturbation analysis of the flood peak, represented by the 1-day peak discharge, indicates that hydrological-input uncertainty is a major source affecting the water level and exceedance duration at Changshou, as shown in Table 10. In Scenario 2, the maximum flood-routing water level in front of the dam remains 171.000 m under the flood-peak −5%, baseline, and flood-peak +5% scenarios, indicating that the maximum dam-front water level in this scenario is controlled by the operation rules or water-level zoning. In Scenario 3, the maximum flood-routing water level in front of the dam increases from 173.086 m to 173.508 m and 174.363 m, with an envelope width of 1.277 m. In Scenario 1, it increases from 165.032 m to 165.574 m and 166.535 m, with an envelope width of 1.503 m.
Table 10.
Changes in relevant hydrological indicators under ±5% perturbations of the flood peak.
The maximum water level at Changshou shows a more pronounced response to flood-peak perturbations. In Scenarios 2 and 3, the maximum water level at Changshou increases from 182.415 m under the flood-peak −5% scenario to 182.900 m under the baseline scenario, and further to 184.063 m under the flood-peak +5% scenario, with an envelope width of 1.648 m. In Scenario 1, the maximum water level at Changshou increases from 179.049 m to 179.670 m and 181.049 m, with an envelope width of 2.000 m.
Flood-peak perturbations also have a marked effect on exceedance duration. In particular, in Scenario 3, the duration exceeding the resettlement line increases from 133 h under the flood-peak −5% scenario to 188 h under the baseline scenario, and further to 216 h under the flood-peak +5% scenario, with an envelope width of 83 h. This indicates that flood-peak uncertainty affects not only the peak water level, but also the exposure duration to high water levels.
4. Discussion
4.1. Mechanism Underlying the Identification of the Changshou Reach as the Key Control Section
The identification of the Changshou reach as the unified key control section is not based on a single statistical result, but rather on the combined effects of channel topography, the spatial configuration of control lines, and tributary inflow. First, from a topographic perspective, a pronounced constricted section exists near Baishatuo, making the Zhongxian–Qingxichang reach prone to local backwater under high-water conditions. This provides the geometric basis for the non-uniform rise of the water surface at Changshou and its adjacent reaches. Second, in terms of control-line geometry, the elevation difference between the land acquisition line and the resettlement relocation line at Changshou Station is only about 2.2 m, whereas the corresponding difference at Shantuo Station reaches 4.2 m. This means that, once the water surface rises above the land acquisition line, it is more likely to approach the resettlement relocation line first at Changshou, making this section more sensitive to higher-level risk. Third, from a hydrodynamic perspective, the Wu River joins the Yangtze main stem near Qingxichang, which is closer to Changshou than to Shantuo. As a result, the attenuation distance of the tributary backwater effect is shorter, and Changshou is therefore more sensitive to local water-level rise when mainstream and tributary floods coincide or when tributary inflow is large.
Taken together, these three factors explain why “Shantuo and Baishatuo reach the land acquisition line earlier” and “Changshou is more sensitive under the resettlement relocation line constraint” are not contradictory. The former shows that some local stations in different reaches may indeed be the first to approach the control line. The latter indicates that, when the focus shifts from local exceedance to overall flood-risk control in the reservoir area, Changshou Station better captures the most unfavorable and management-relevant water-level response. For reservoir operation, what is truly needed is not the locally earliest station to exceed the line in each individual flood event, but a key control section that can stably represent multiple types of risk and support unified management. Overall, Changshou Station meets this requirement well.
Because Changshou Station is identified in this study as the key control section for inundation risk in the reservoir area, the water-level residuals at Changshou Station were further analyzed separately. The results are shown in Table 11. The mean error, mean absolute error, and root mean square error are −0.051 m, 0.198 m, and 0.326 m, respectively. The 5th and 95th percentiles of the residuals are −0.578 m and 0.385 m, respectively, corresponding to a 90% empirical uncertainty interval of [−0.578, 0.385] m. These results indicate that the simulated water levels at Changshou Station generally have relatively high accuracy.
Table 11.
Statistical results of water-level residual uncertainty at Changshou Station.
According to the residual definition, e = Zsim − Zobs, the observed water level can be expressed as Zobs = Zsim − e. Therefore, based on the 90% empirical uncertainty interval of the residuals at Changshou Station, when a given simulated water level Zsim is obtained, the actual water level can be approximately expressed as [Zsim − 0.385, Zsim + 0.578] m. This means that, in the control-line judgment at Changshou Station, if the simulated water level is close to the control line, relying only on a single deterministic simulation value is insufficient. An upper-side uncertainty margin of approximately 0.6 m should be considered.
For the land acquisition line of 175.7 m at Changshou Station, if the simulated water level does not exceed 175.122 m, the upper bound of the actual water level remains below the land acquisition line within the 90% empirical uncertainty range. If the simulated water level reaches or exceeds 176.085 m, the actual water level is likely to exceed the land acquisition line even when the lower bound of the error interval is considered. Therefore, 175.122–176.085 m can be regarded as the uncertainty transition zone for exceedance judgment near the land acquisition line.
For the resettlement line of 178.0 m at Changshou Station, the 90% robust non-exceedance simulated water level is 177.422 m, and the simulated water level at which exceedance can be generally determined is 178.385 m. Therefore, 177.422–178.385 m can be regarded as the uncertainty transition zone near the resettlement line.
4.2. Mechanism Analysis of the 155 m Initial Operating Water-Level Scheme
4.2.1. Flood-Control Role of the 155 m Initial Operating Water Level Under the Beneficial Utilization of Small and Medium Floods
The 155 m threshold is supported by multiple lines of evidence. The results show that when the initial regulation water level is kept at or below 155 m, the maximum flood-regulation water level, the peak water level at Changshou, and its exceedance duration all change only slightly, indicating that the reservoir still retains some regulation flexibility and the overall system response remains relatively stable. Once the initial regulation water level exceeds 155 m, however, these indicators generally begin to increase markedly, suggesting that as the effective flood-control storage is further reduced, the risk of high water levels both in front of the dam and within the reservoir area enters a stage of more rapid growth. Therefore, 155 m is not an empirical value, but a critical threshold consistently identified by multiple risk indicators under the 20-year return period flood condition.
It should be emphasized that 155 m does not mean conditions are absolutely safe below it and absolutely unsafe above it. Rather, it represents an important threshold at which system risk shifts from gradual to rapid growth. Below this level, the reservoir still retains a certain margin of flood-control safety as well as some room for water-resource utilization. Above it, the maximum flood-regulation water level, the water level in the Changshou reach, and the corresponding exceedance duration are more likely to increase simultaneously, leading to a clear rise in overall system risk. In this sense, 155 m is better regarded as a preferred control boundary for optimizing flood-season operation, rather than a rigid upper limit.
From an operational perspective, the practical value of 155 m lies in providing a clear basis for scheduling decisions. Under the 20-year return period flood condition, if inflow forecasts are uncertain, or if key sections such as Changshou are already close to their control thresholds, the dam-front operating water level should preferably be kept at or below 155 m in order to preserve the necessary flood-regulation capacity. Only when inflow conditions are relatively clear and operating conditions are favorable should cautious adjustment above this level be considered, and only after adequate assessment. This further demonstrates that using 155 m as an important reference boundary for optimizing flood-season operating water levels under the 20-year return period flood condition has a clear physical basis and practical engineering significance.
4.2.2. Uncertainty in the 155 m Operating Water-Level Boundary
The newly added sensitivity and uncertainty analyses indicate that 155 m should not be interpreted as a precise and absolute safety threshold. Instead, it should be understood as a relatively conservative operational reference boundary obtained under the current model structure, calibrated parameters, design flood assumptions, dam-front boundary conditions, and outflow rules.
Among the tested uncertainty sources, local perturbations in the dam-front water level have the smallest influence on the key indicators. The maximum flood-routing water level in front of the dam changes by 0–0.044 m, the maximum water level at Changshou changes by 0.001–0.014 m, and the exceedance duration remains unchanged. The ±5% roughness perturbation has a more pronounced influence on the local water level and high-water-level duration in the Changshou reach. The maximum water level at Changshou varies by 0.471–0.635 m, and the exceedance duration varies by 6–34 h. The ±5% flood-volume perturbation has the strongest influence on the maximum water level and exceedance duration at Changshou. The envelope width of the maximum water level at Changshou reaches 1.648–2.000 m, and the maximum envelope width of the exceedance duration reaches 83 h. The ±5% perturbation in maximum outflow discharge shows a clear risk-mitigation effect. Increasing the maximum outflow discharge can reduce the maximum water level at Changshou by 0.485–0.836 m and shorten the exceedance duration by 8–145 h.
These results indicate that the qualitative significance of 155 m as a relatively conservative operational reference boundary remains valid. However, the actual risk level under this boundary depends on incoming flood volume, roughness parameters, and available discharge capacity. In practical operation, decisions should not be made mechanically based only on the single water level of 155 m. Instead, dynamic verification should be conducted by jointly considering real-time inflow forecasts, the dam-front water level, discharge capacity, and the water-level response at Changshou Station. When the water level at Changshou Station approaches the land acquisition line or the resettlement line, an additional safety margin should be reserved, and the operation scheme should be adjusted in a timely manner according to rolling forecasts and water-level responses.
4.3. Implications for Optimizing Flood-Season Operating Rules to Ensure Flood-Control Safety in the Reservoir Area
The results of this study provide at least three implications for optimizing flood-season operating rules for the Three Gorges Reservoir. First, the operational boundary should shift from single dam-front water-level control to joint control of dam-front water level, inflow, and water level at the key control station. For the utilization of small and medium floods as water resources, the dam-front water level alone cannot fully represent flood risk within the reservoir area; dynamic assessment must also incorporate inflow magnitude and the warning discharge threshold at Changshou Station. Second, 155 m can be regarded as a preferred flood-season operating water-level threshold for small- and medium-flood utilization at the current stage. Under the relatively conservative assumption that forecast-based pre-release is not considered, this threshold maintains consistency with the current operating rules while avoiding a marked increase in flood-control risk in most typical years. Third, optimization of release discharge should be coordinated with reassessment of downstream flood-conveyance capacity. In the future, if combined with updated evaluations of the Jingjiang reach flood-conveyance capacity and more accurate 3–7 day forecast-based pre-release techniques, there may still be room for more refined optimization of flood-season operation of the Three Gorges Reservoir.
It should be noted that the recommendations of this study are based on conservative engineering judgment. Because forecast-based pre-release was not explicitly considered in the scenarios, the identified 155 m threshold is closer to a static conservative upper boundary. If forecast information, rolling pre-release, and joint operation of upstream cascade reservoirs are incorporated into future analyses, the actual operational space may expand. However, any such expansion must be based on simultaneous evaluation of dynamic warning conditions at key control stations and downstream discharge capacity, and should not be simply interpreted as allowing generally higher operating water levels.
5. Conclusions
This study investigated flood-season operating water levels of the Three Gorges Reservoir for the utilization of small and medium floods as water resources under emerging conditions. Based on a one-dimensional hydrodynamic model with dynamic roughness calibration, and using both typical flood events and the 20-year return period (5% frequency) design flood, the study systematically analyzed the key control section in the reservoir area, the critical conditions at the Changshou reach, and the flood-risk responses under different initial regulation water levels and release discharges. The results indicate that, under controllable flood-inundation risk, the Three Gorges Reservoir still has some room for utilizing small and medium floods as water resources during the flood season. The main conclusions are as follows:
- (1)
- The Changshou reach is the key control section for flood-inundation risk management in the Three Gorges Reservoir area. The identification results show that, under the constraint of the land acquisition line, different stations such as Baishatuo, Shantuo, or Changshou may serve as representative control points at different stages. Under the resettlement relocation line constraint, however, Changshou Station is the first to reach the control limit and can simultaneously represent both flood-season and end-of-impoundment high-water-risk scenarios. The critical relationship established among dam-front water level, inflow discharge, and water level at Changshou further confirms that the Changshou reach is not only the unified key control section for flood-inundation risk in the reservoir area, but also the core constraint section for defining the operational boundary of small- and medium-flood utilization.
- (2)
- Under the 20-year return period design flood and the conservative assumption of no forecast-based pre-release, an initial regulation water level of approximately 155 m can be regarded as a conservative operational reference boundary for the risk-constrained utilization of small and medium floods. When the initial regulation water level is at or below 155 m, the maximum dam-front flood-regulation water level, the peak water level at Changshou, and the corresponding exceedance duration generally remain relatively stable in most typical flood years. Once the initial regulation water level exceeds 155 m, the remaining flood-control storage is further compressed, and the dam-front water level, Changshou water level, exceedance duration, and excess flood volume tend to increase markedly, indicating a reduced flood-control safety margin. The added perturbation analysis further shows that this boundary is relatively stable under small dam-front water-level and roughness perturbations, but the Changshou water level and exceedance duration are more sensitive to roughness and flood-volume uncertainties. Therefore, 155 m should not be interpreted as an absolute safety threshold, but rather as a conservative operating reference boundary under the current design-flood framework, existing operating rules, model assumptions, and tested uncertainty ranges.
- (3)
- A moderate increase in release discharge is beneficial to flood-control safety. The results show that, as release discharge increases, the maximum flood-regulation water level decreases, excess flood volume is reduced, and both the high water level and the durations above the land acquisition line and resettlement relocation line in the Changshou reach become shorter. This suggests that a reasonable increase in release discharge can simultaneously relieve flood-regulation pressure in front of the dam and reduce backwater risk within the reservoir area, making it an important operational measure for improving flood-control safety. However, its role mainly lies in mitigating risk within the existing operating boundary and cannot replace source control through proper limitation of the initial regulation water level.
Author Contributions
Conceptualization, Y.Z.; methodology, Y.Z. formal analysis, Y.Z.; data curation, Y.Z.; investigation, Y.Z., D.J., H.Z. and G.J.; writing—original draft preparation, Y.Z. and D.J.; visualization, H.Z. and G.J.; supervision, Y.Z. All authors have read and agreed to the published version of the manuscript.
Funding
This research was funded by the China Three Gorges Corporation Scientific Research Project (WWKY-2021-0439).
Data Availability Statement
The hydrological observation data, river cross-sectional data, and reservoir operation data used in this study were obtained from the relevant hydrological and engineering operation authorities. Due to confidentiality restrictions on engineering operation and management information, the authors are not authorized to publicly release the complete raw datasets. Therefore, the original datasets are neither publicly available nor directly accessible in this study. However, processed data supporting the findings are available from the corresponding author upon reasonable request and with the permission of the data providers.
Conflicts of Interest
Authors Yanwei Zhai, Dingguo Jiang, Hanqing Zhao and Guoliang Ji were employed by the China Three Gorges Corporation. The authors declare that the research was conducted in the absence of any commercial or financial relationships that could be construed as a potential conflict of interest.
References
- Şen, O.; Kahya, E.; İpek, A.F. Prediction of present and future flood discharges in catchments with sparse data coverage. Nat. Hazards 2026, 122, 358. [Google Scholar] [CrossRef] [Scilit]
- Guo, S.; Xie, Y.; Zhong, S. Research on the operation scheme of Three Gorges Reservoir for new-period and new-demand. J. Hydraul. Eng. 2024, 55, 379–388. (In Chinese) [Google Scholar]
- Li, G. Keeping in mind the mission of a great national project and ensuring the ten major safeties of the Three Gorges Project. China Water Resour. 2024, 22, 1–3. (In Chinese) [Google Scholar]
- Wang, B.D.; Zhou, H.C.; Zhang, G.H. Research progress on dynamic control methods of flood-limited water level for reservoirs. S. N. Water Transf. Water Sci. Technol. 2007, 5, 43–46. (In Chinese) [Google Scholar]
- Yeh, W.W.G. Reservoir management and operations models: A state-of-the-art review. Water Resour. Res. 1985, 21, 1797–1818. [Google Scholar] [CrossRef] [Scilit]
- Zhou, H.C.; Wang, B.D.; Wang, G.L. Dynamic Control Methods of Flood-Limited Water Level for Reservoirs; Dalian University of Technology Press: Dalian, China, 2006. (In Chinese) [Google Scholar]
- Simonovic, S.P. Reservoir systems analysis: Closing gap between theory and practice. J. Water Resour. Plan. Manag. 1992, 118, 262–280. [Google Scholar] [CrossRef] [Scilit]
- Wurbs, R.A. Reservoir-system simulation and optimization models. J. Water Resour. Plan. Manag. 1993, 119, 455–472. [Google Scholar] [CrossRef] [Scilit]
- Ren, M.L.; He, X.Y.; Ding, L.Q.; Yang, F.; Li, H.; Zhang, H.B. Review of research progress on methods for determining the dynamic control domain of flood-limited water level for reservoirs. Water Power 2016, 42, 61–65. (In Chinese) [Google Scholar]
- Labadie, J.W. Optimal operation of multireservoir systems: State-of-the-art review. J. Water Resour. Plan. Manag. 2004, 130, 93–111. [Google Scholar] [CrossRef] [Scilit]
- Loucks, D.P.; Van Beek, E. Water Resource Systems Planning and Management: An Introduction to Methods, Models, and Applications; Springer: Berlin/Heidelberg, Germany, 2017. [Google Scholar]
- Feng, P.; Han, S. Flood-control risk analysis of raising the flood-limited water level of reservoirs. J. Tianjin Univ. 2007, 40, 525–529. (In Chinese) [Google Scholar]
- Li, X.; Guo, S.; Liu, P.; Chen, G. Dynamic control of flood limited water level for reservoir operation by considering inflow uncertainty. J. Hydrol. 2010, 391, 124–132. [Google Scholar] [CrossRef] [Scilit]
- Zhou, Y.; Guo, S. Risk analysis for flood control operation of seasonal flood-limited water level incorporating inflow forecasting error. Hydrol. Sci. J. 2014, 59, 1006–1019. [Google Scholar] [CrossRef] [Scilit]
- Ding, W.; Zhang, C.; Peng, Y.; Zeng, R.; Zhou, H.; Cai, X. An analytical framework for flood water conservation considering forecast uncertainty and acceptable risk. Water Resour. Res. 2015, 51, 4702–4726. [Google Scholar] [CrossRef] [Scilit]
- Zhang, J.; Min, Y.; Feng, B.; Duan, W. Research and application of key technologies for dynamic control of reservoir water level in flood season. Water 2021, 13, 3576. [Google Scholar] [CrossRef] [Scilit]
- Liu, G.; Qin, H.; Shen, Q.; Tian, R.; Liu, Y. Multi-objective optimal scheduling model of dynamic control of flood limit water level for cascade reservoirs. Water 2019, 11, 1836. [Google Scholar] [CrossRef] [Scilit]
- Li, Y.; Li, Y.; Feng, K.; Tian, K.; Huang, T. Dynamic control of flood limited water levels for parallel reservoirs by considering forecast period uncertainty. Sustainability 2023, 15, 16765. [Google Scholar] [CrossRef] [Scilit]
- Wang, X.; Guo, S.; Wang, M.; Wang, X.; Liang, Z.; Li, N. Flood seasonal division and dynamic control of water level for Three Gorges Reservoir. China Rural Water Hydropower 2026, 3, 1–6. (In Chinese) [Google Scholar]
- Wang, J.; Guo, S.L. Flood-season control water level and operating conditions of the Three Gorges Reservoir. Adv. Water Sci. 2020, 31, 473–480. (In Chinese) [Google Scholar]
- Li, X.N.; Fu, Q.P.; Zhang, S.; He, X.C.; Zhou, M.; Ding, Y. Study on flood-season operating water-level schemes for the Three Gorges Reservoir. Yangtze River 2022, 53, 21–26. (In Chinese) [Google Scholar]
- Guo, S.L.; Xiong, L.H.; Xiong, F.; Yin, J.B. Theory and methods for design floods during the operational period of cascade reservoirs. Adv. Water Sci. 2020, 31, 734–745. (In Chinese) [Google Scholar]
- Guo, S.L.; Liu, Z.J.; Xiong, L.H. Progress and evaluation of design flood calculation methods. J. Hydraul. Eng. 2016, 47, 302–314. (In Chinese) [Google Scholar]
- Li, Y.H.; Xia, Q.Q.; Wang, Y.Q.; Zhang, H.R.; Lan, H.G.; Meng, H.C.; Yang, Y. Study on staged flood-limited water levels of the Three Gorges Reservoir considering the regulation effects of the Xiluodu–Xiangjiaba cascade. Resour. Environ. Yangtze Basin 2022, 31, 1514–1522. (In Chinese) [Google Scholar]
- Yu, Y.C.; Li, W.Q.; Liu, Z.; Yang, Z.; You, F.H. Study on flood-season staging and the rationality of flood-limited water levels for cascade reservoirs in the lower Jinsha River. J. Yangtze River Sci. Res. Inst. 2020, 37, 39–44. (In Chinese) [Google Scholar]
- Chu, M.H.; Li, R.B.; Yan, Y.L. Practice and reflections on optimal operation of the Three Gorges Reservoir. China Water Resour. 2023, 22, 22–26. (In Chinese) [Google Scholar]
- Li, N.; Guo, S.L.; Wang, J.; Xiong, F. Analysis of coincidence patterns between Meiyu in the middle and lower Yangtze River and inflow floods to the Three Gorges Reservoir. Yangtze River 2022, 53, 44–49. (In Chinese) [Google Scholar]
- Qin, Z.W.; Dai, M.L.; Chen, L.G.; Chen, X. Characteristics and causes of staged floods during the flood season in the Three Gorges Reservoir. Yangtze River 2018, 49, 1–6. (In Chinese) [Google Scholar]
- Dai, M.; Wang, J.; Zhang, M.; Chen, X. Impact of the Three Gorges Project operation on the water exchange between Dongting Lake and the Yangtze River. Int. J. Sediment Res. 2017, 32, 506–514. [Google Scholar] [CrossRef] [Scilit]
- Hu, Y.; Li, D.; Deng, J.; Yue, Y.; Zhou, J.; Chai, Y.; Li, Y. Mechanisms controlling water-level variations in the Middle Yangtze River following the operation of the Three Gorges Dam. Water Resour. Res. 2022, 58, e2022WR032338. [Google Scholar] [CrossRef] [Scilit]
- Chen, G.; Zhang, J.; Zou, Q. Studies on flood control operation of the Three Gorges Project and its functions. China Water Resour. 2024, 22, 41–47. (In Chinese) [Google Scholar]
- Zhang, H.; Hu, C.; Gao, Y.; Wang, D.; Ren, S.; Li, L.; Guan, J. Spatial source analysis of flood in the middle and lower reaches of the Yangtze River after the Three Gorges Dam construction. J. Hydroelectr. Eng. 2026; Epub ahead of printing. (In Chinese)
- Ferreira, D.M.; Fernandes, C.V.S.; Kaviski, E.; Bleninger, T. Calibration of river hydrodynamic models: Analysis from the dynamic component in roughness coefficients. J. Hydrol. 2021, 598, 126136. [Google Scholar] [CrossRef] [Scilit]
- Bürgler, M.; Vetsch, D.F.; Boes, R.M.; Vanzo, D. Systematic comparison of 1D and 2D hydrodynamic models for the assessment of hydropeaking alterations. River Res. Appl. 2023, 39, 460–477. [Google Scholar] [CrossRef] [Scilit]
- Wei, S.Z. Flood-control and disaster-reduction strategy for the Yangtze River in the new era. Yangtze River 2017, 48, 1–7. (In Chinese) [Google Scholar]
- Changjiang Water Resources Commission. Hydrological Studies of the Three Gorges Project; Hubei Science and Technology Press: Wuhan, China, 1997. (In Chinese)
- Hu, C.; Fang, C.; Shi, H. Recent progress in sediment research of the Three Gorges Project. China Water Resour. 2023, 19, 10–16. (In Chinese) [Google Scholar]
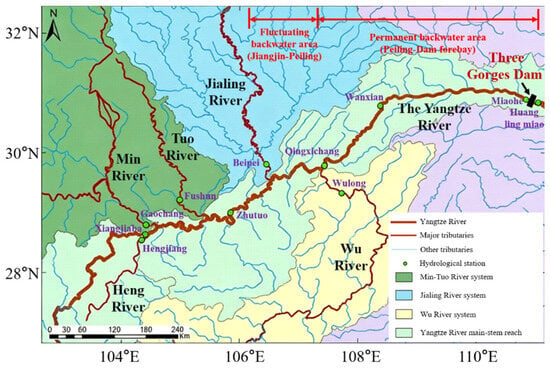
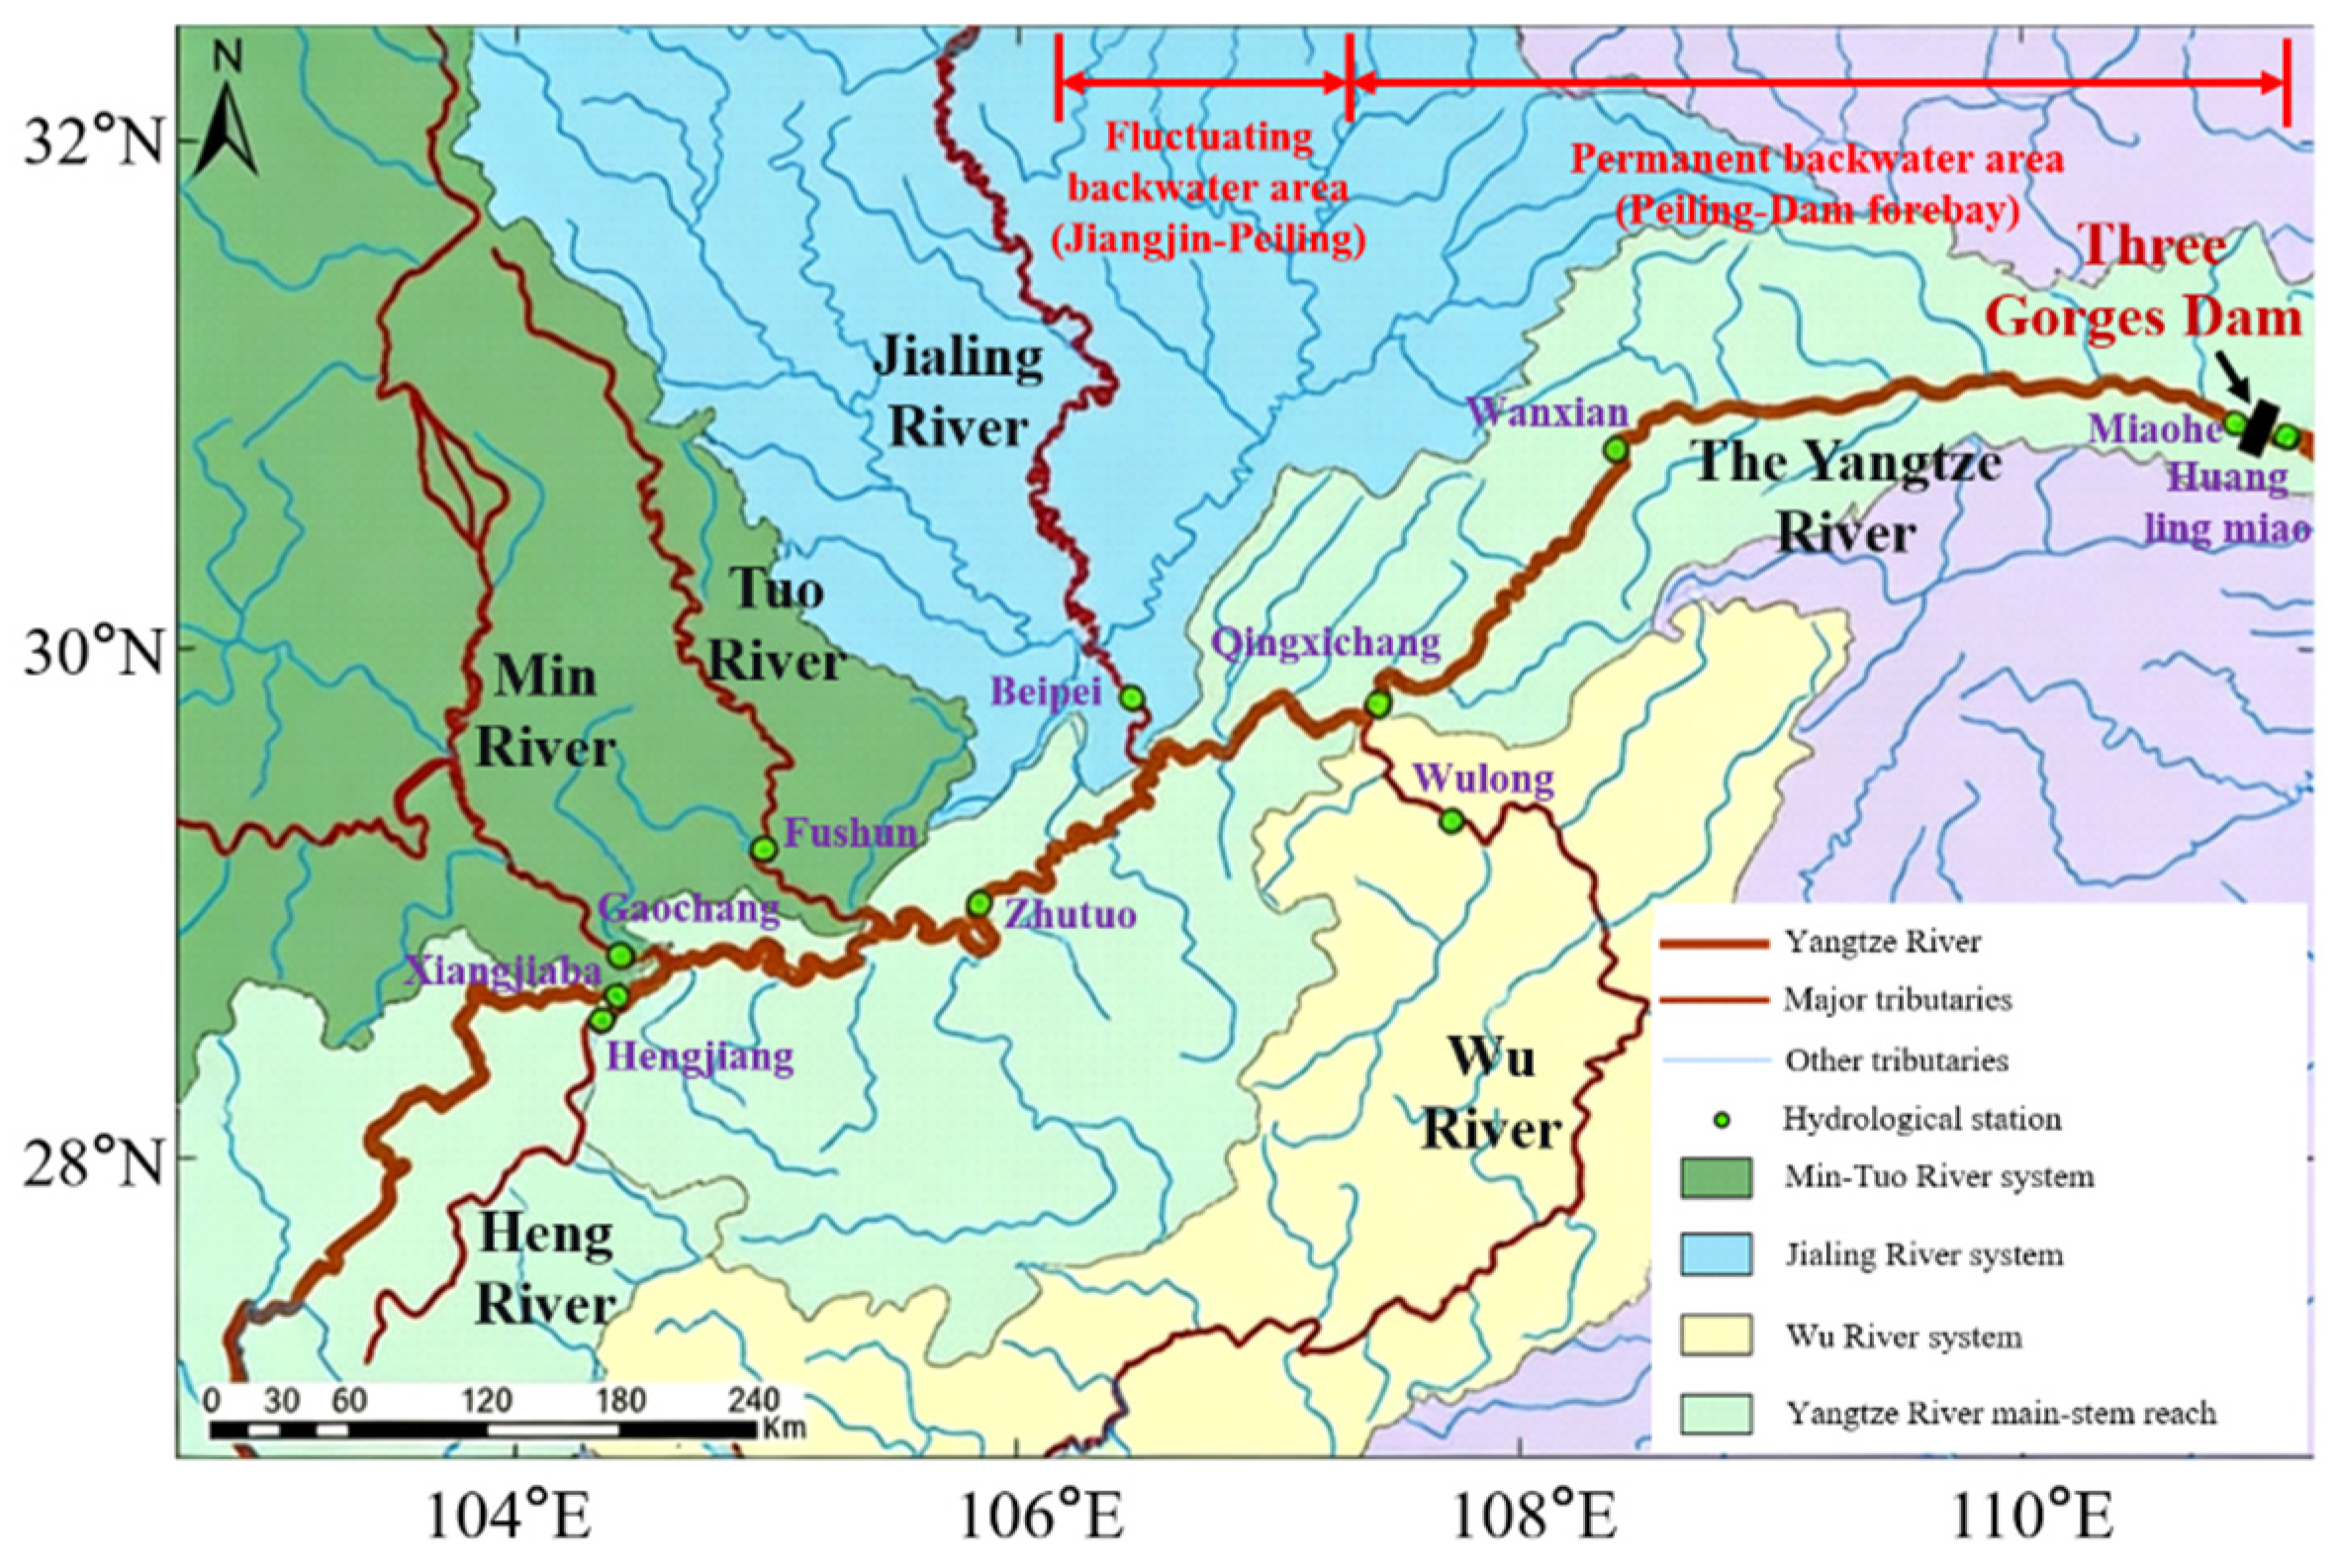
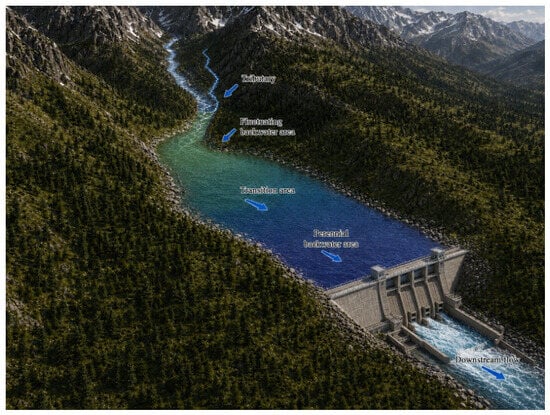
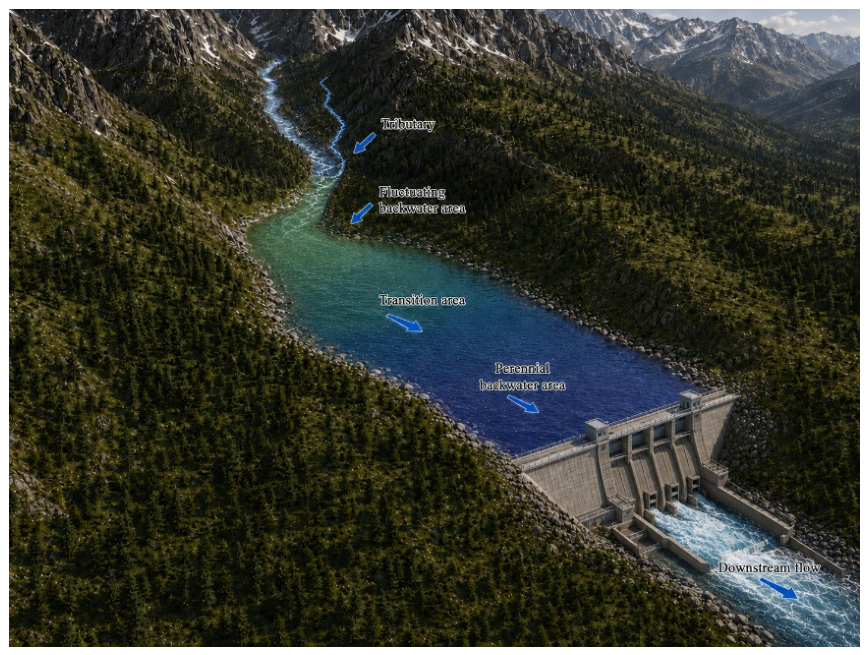
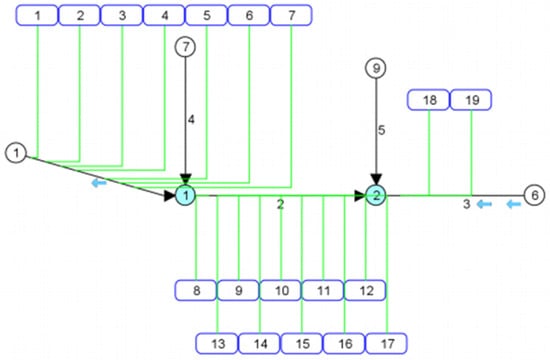
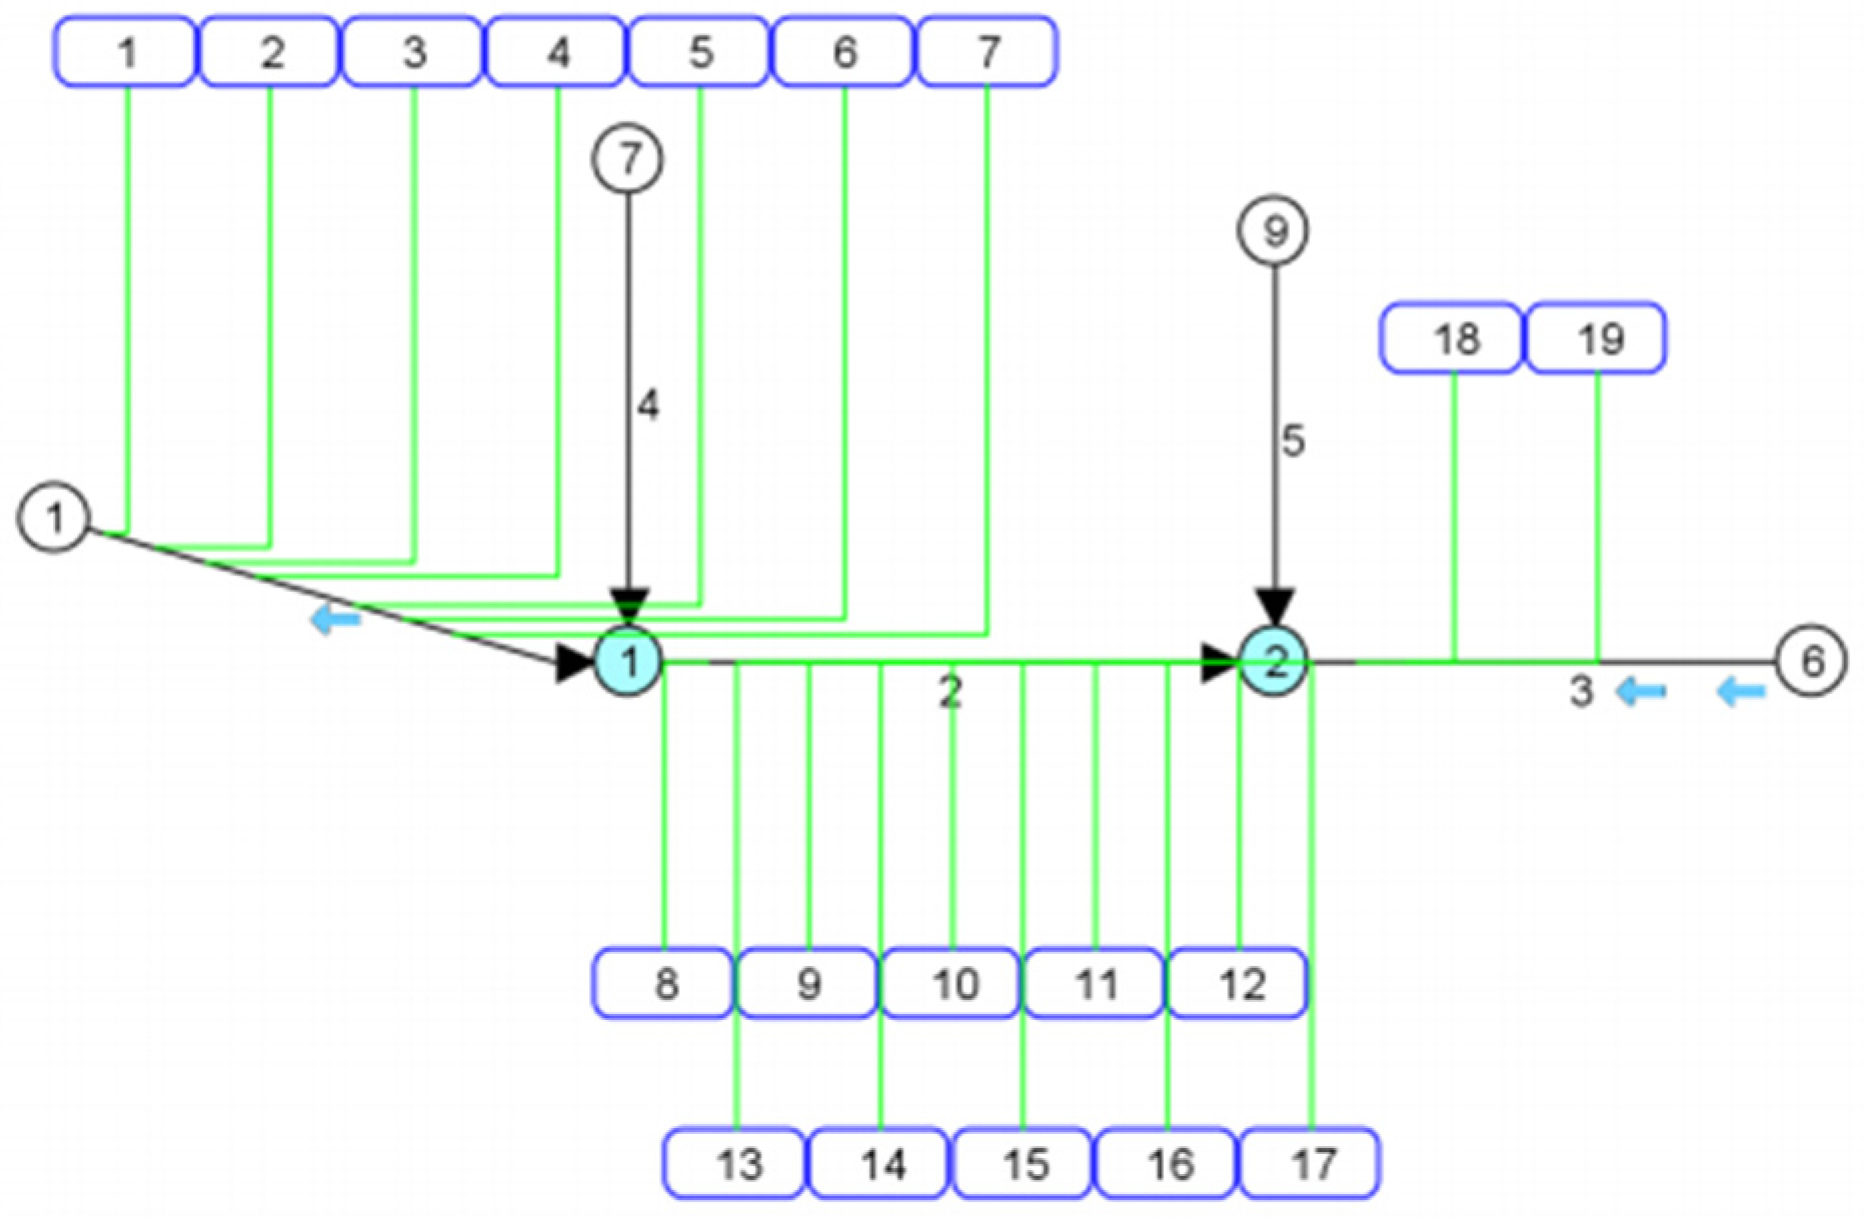
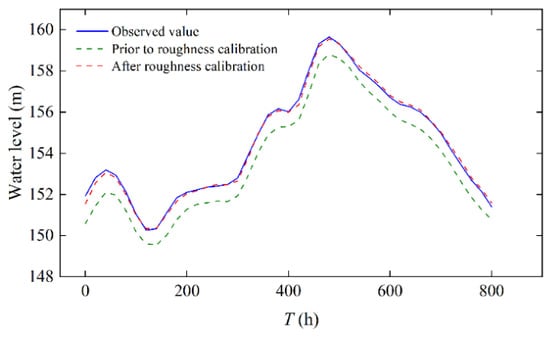
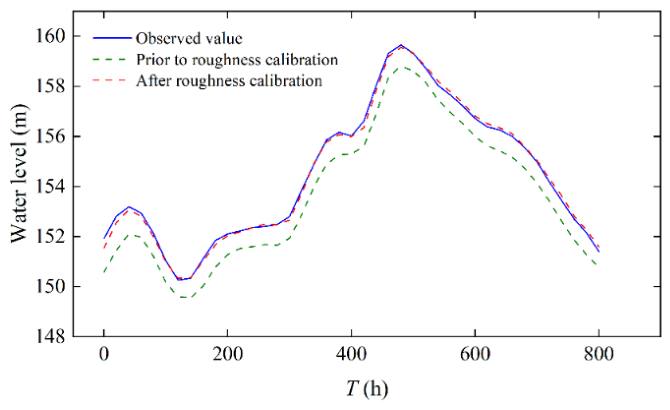
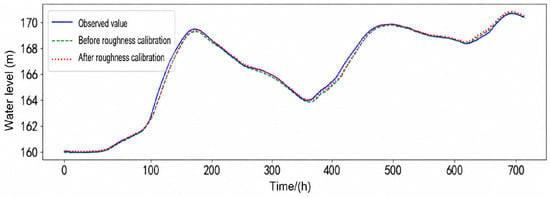
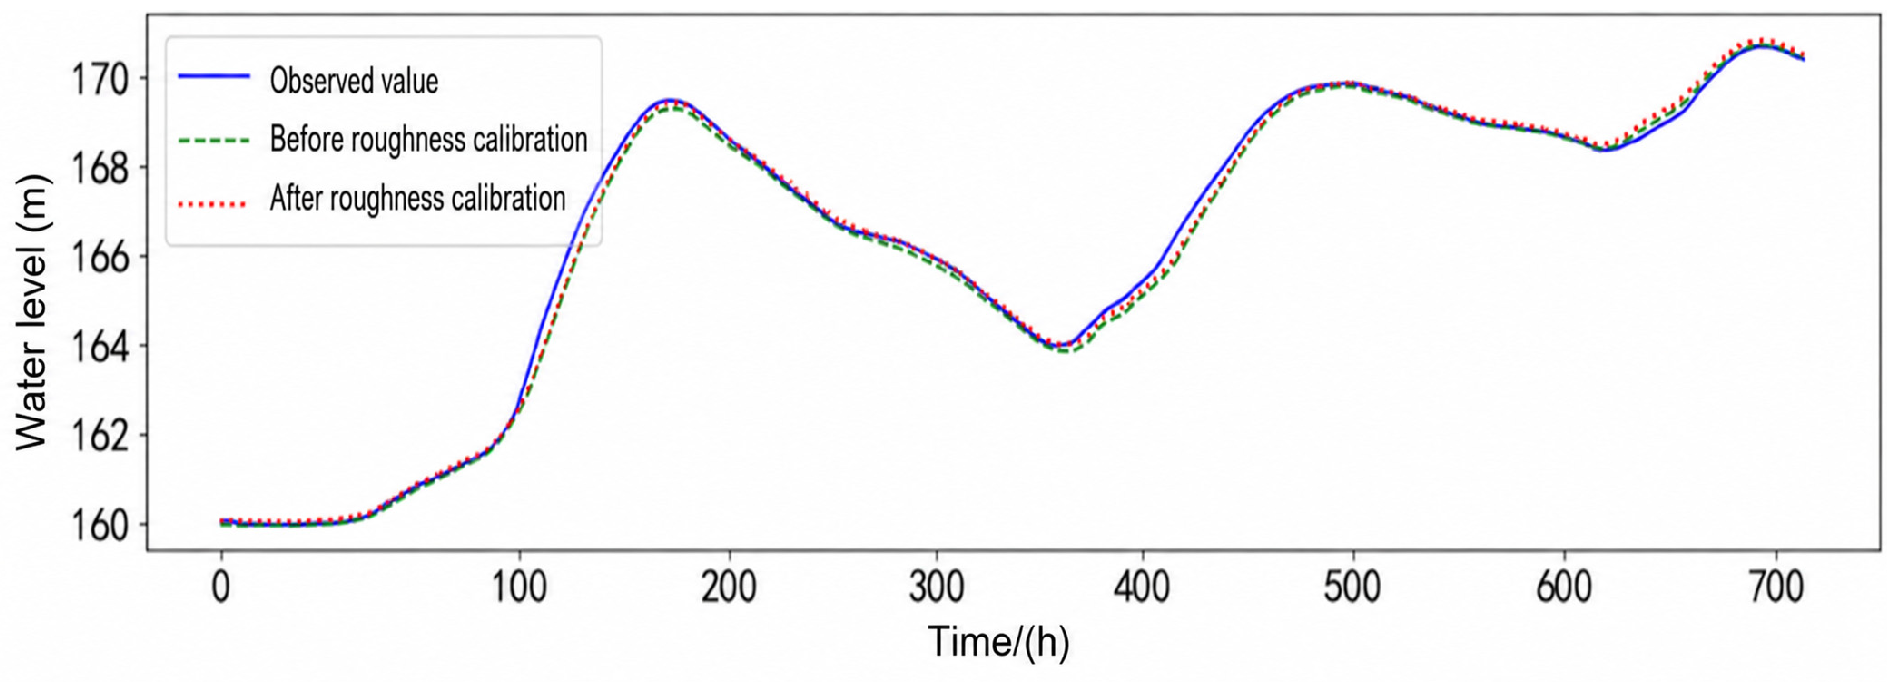
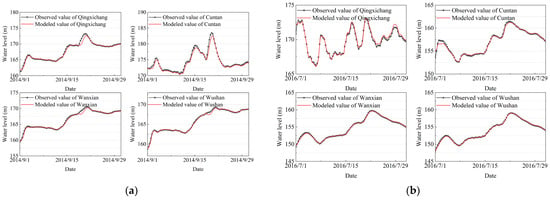
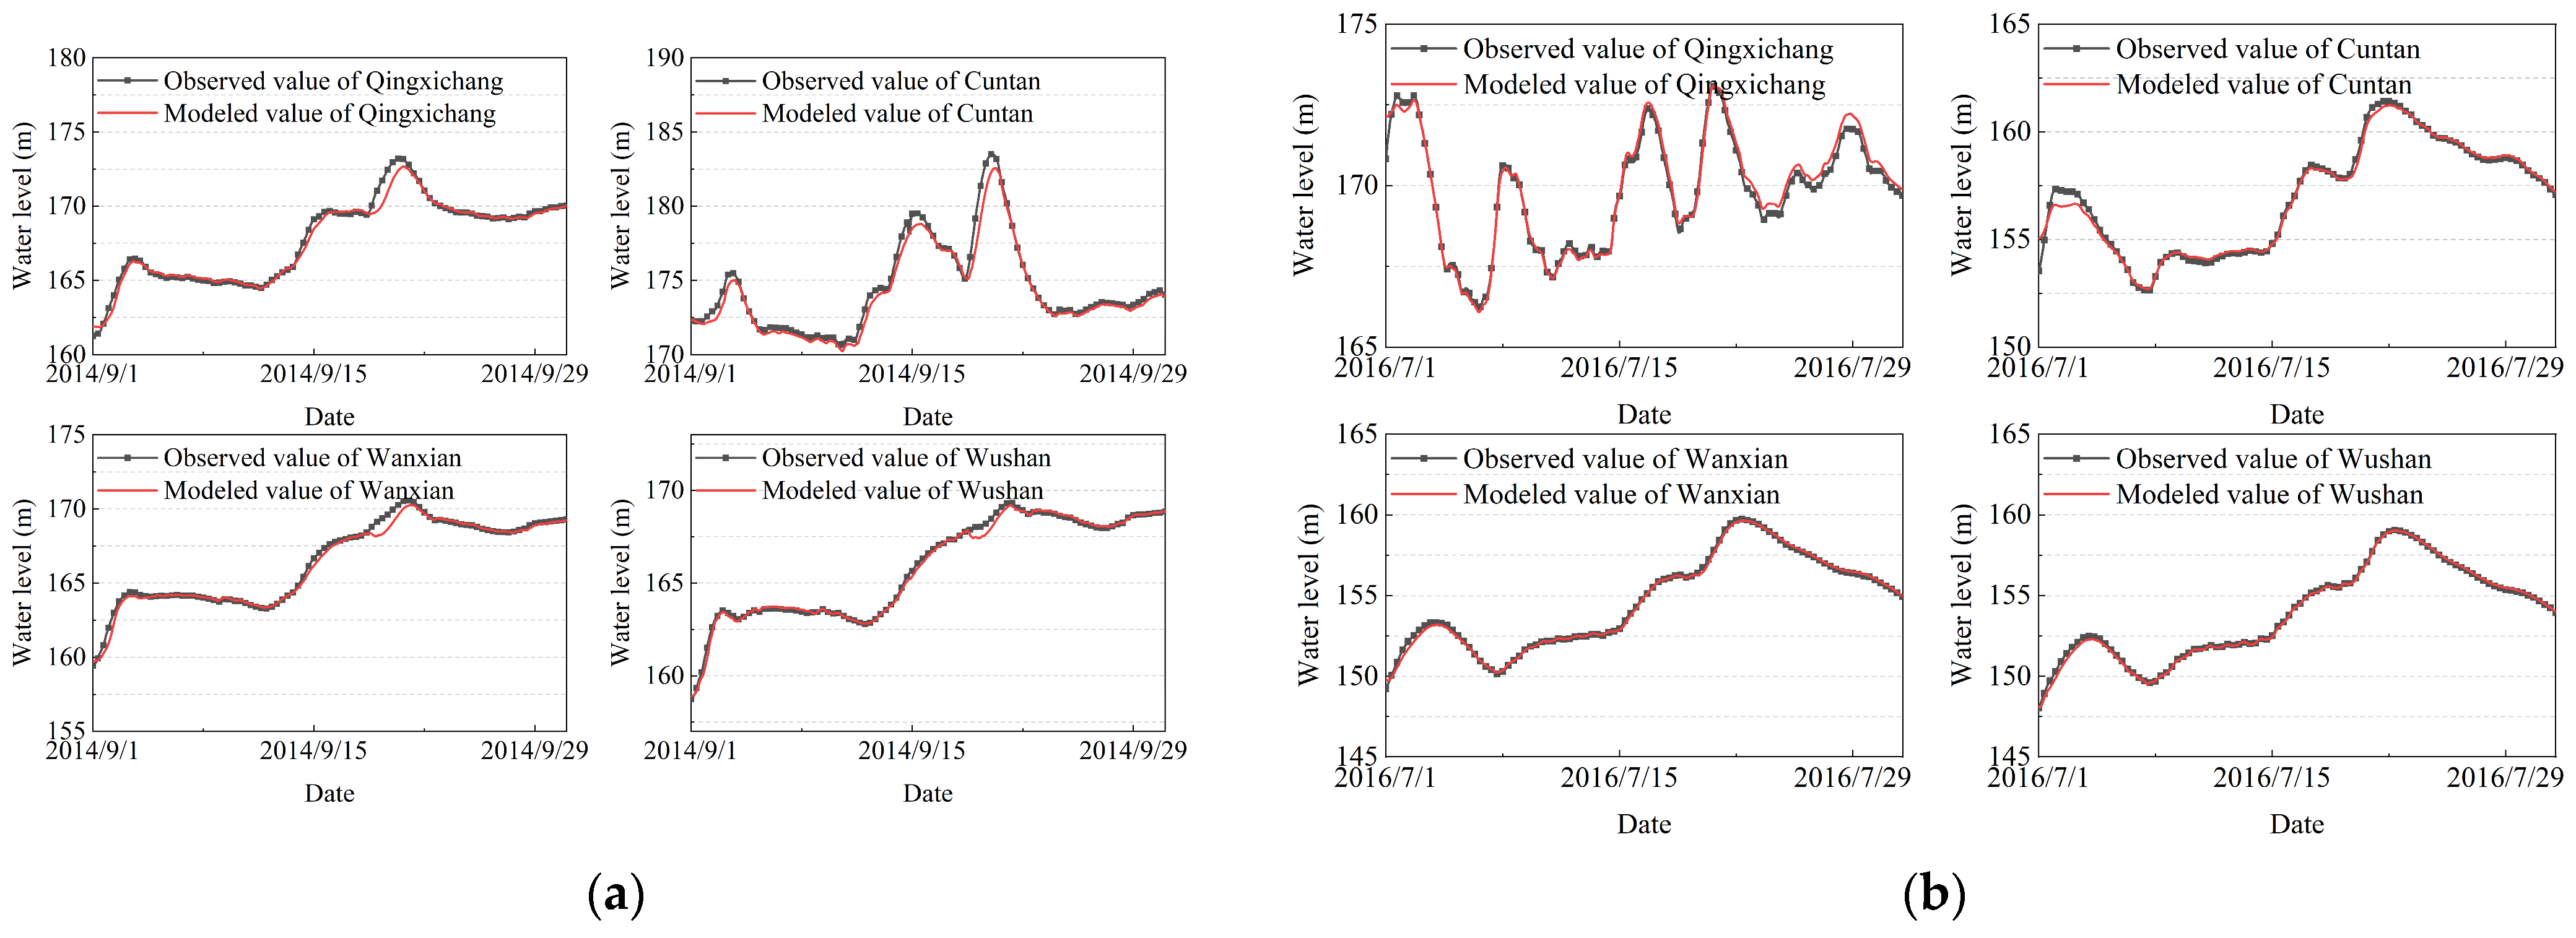
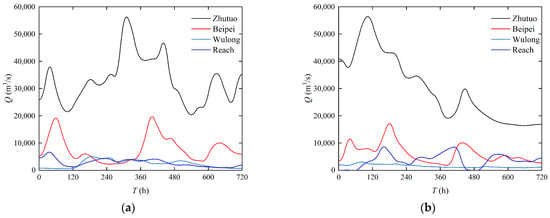
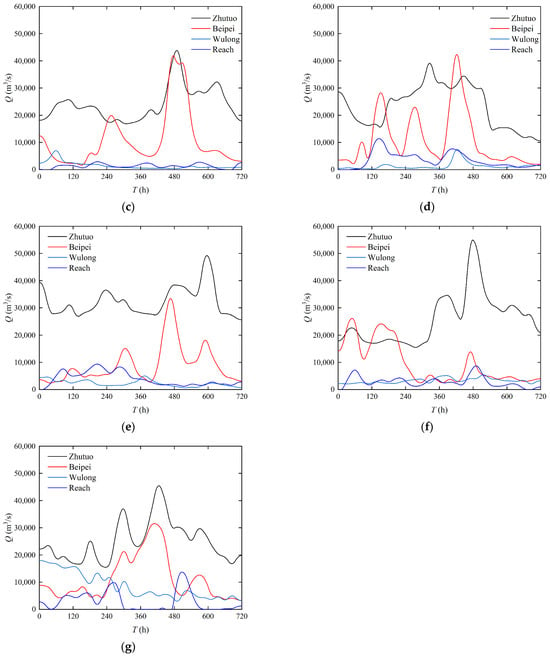
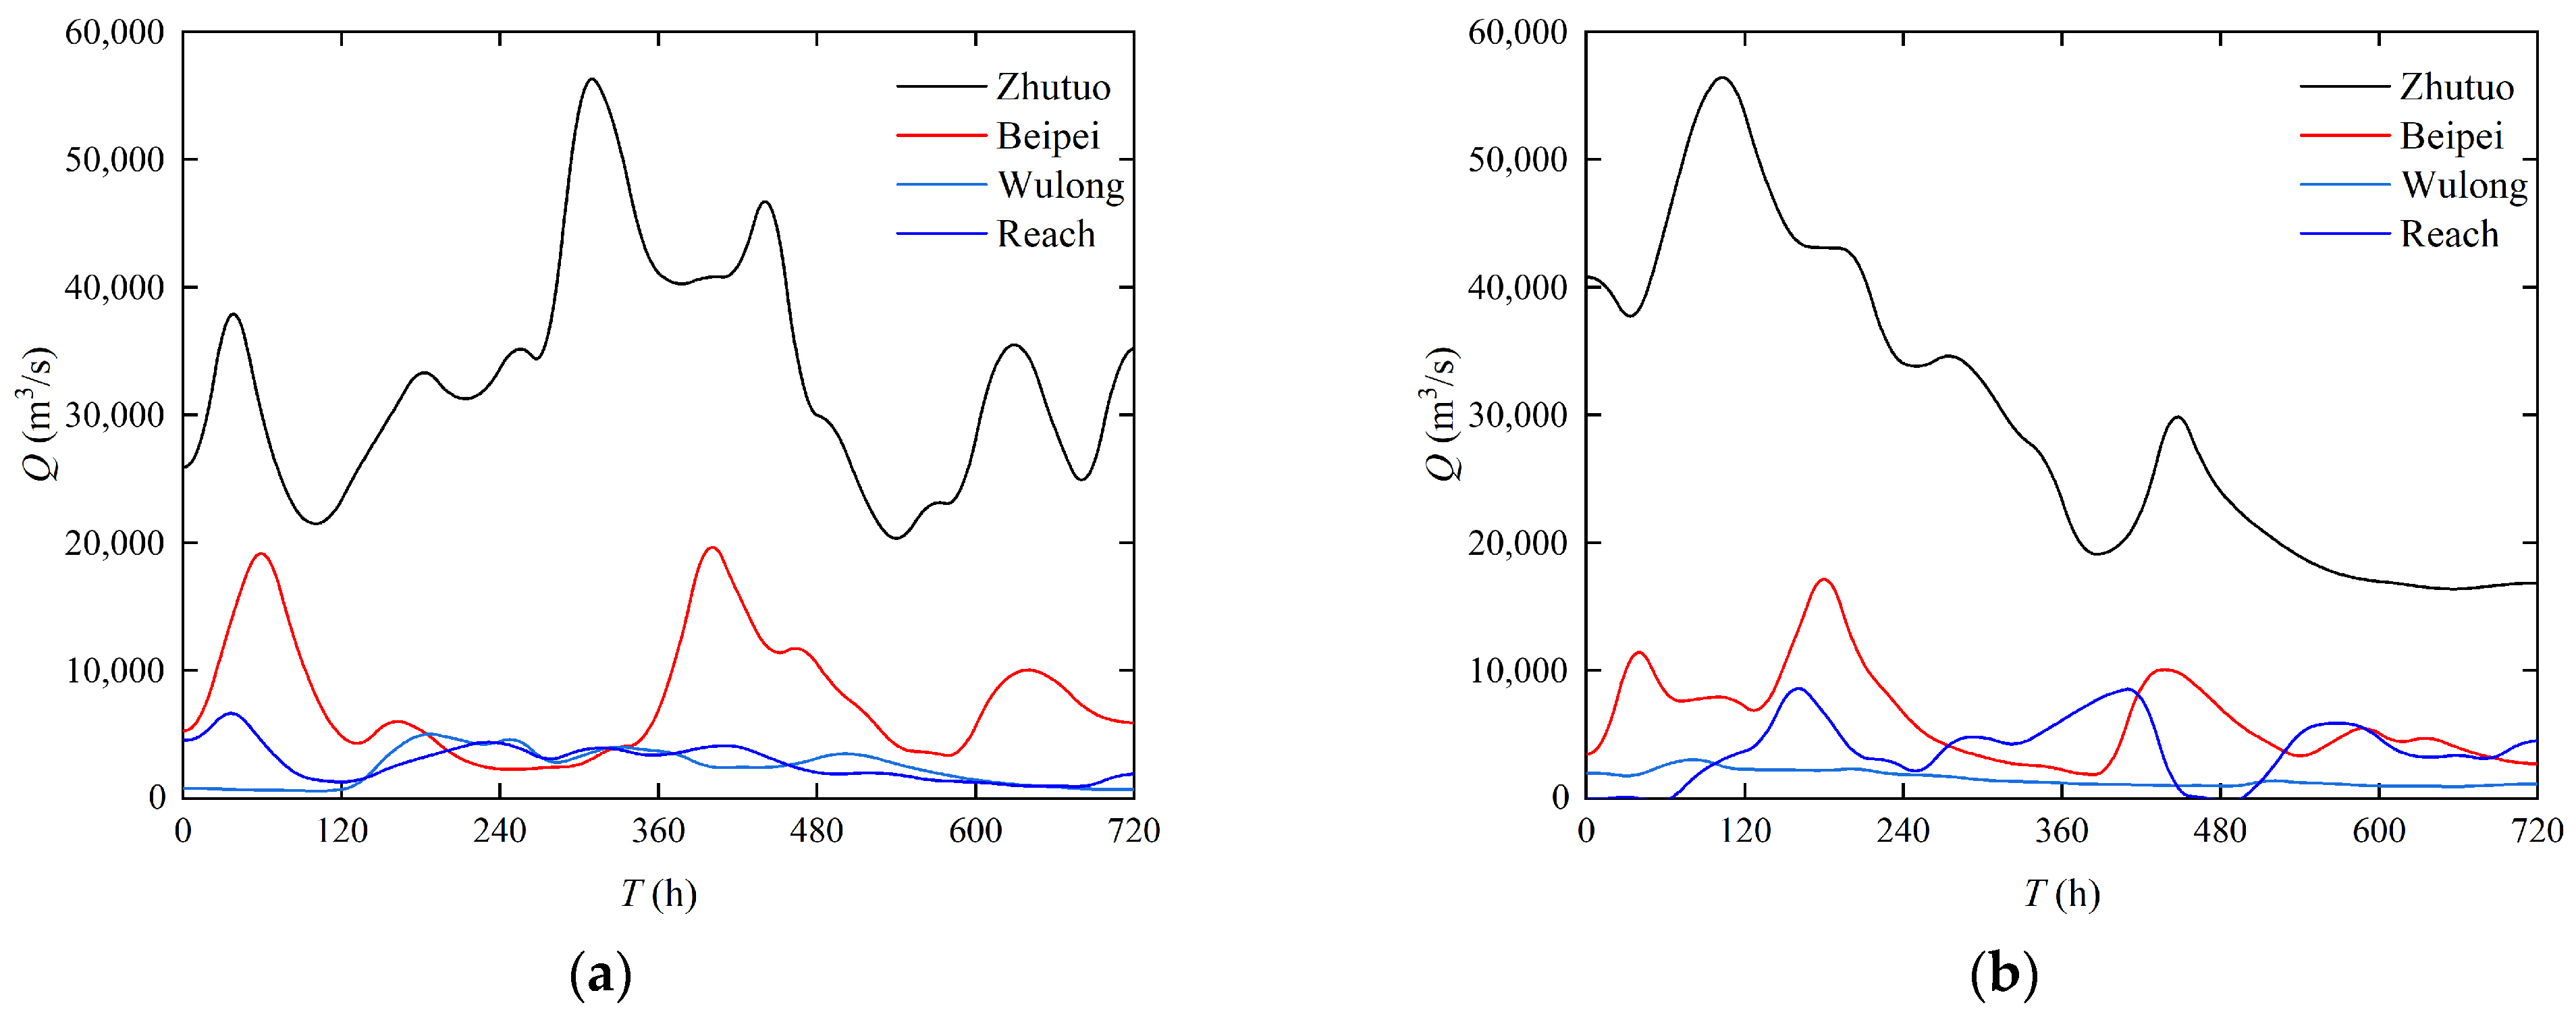
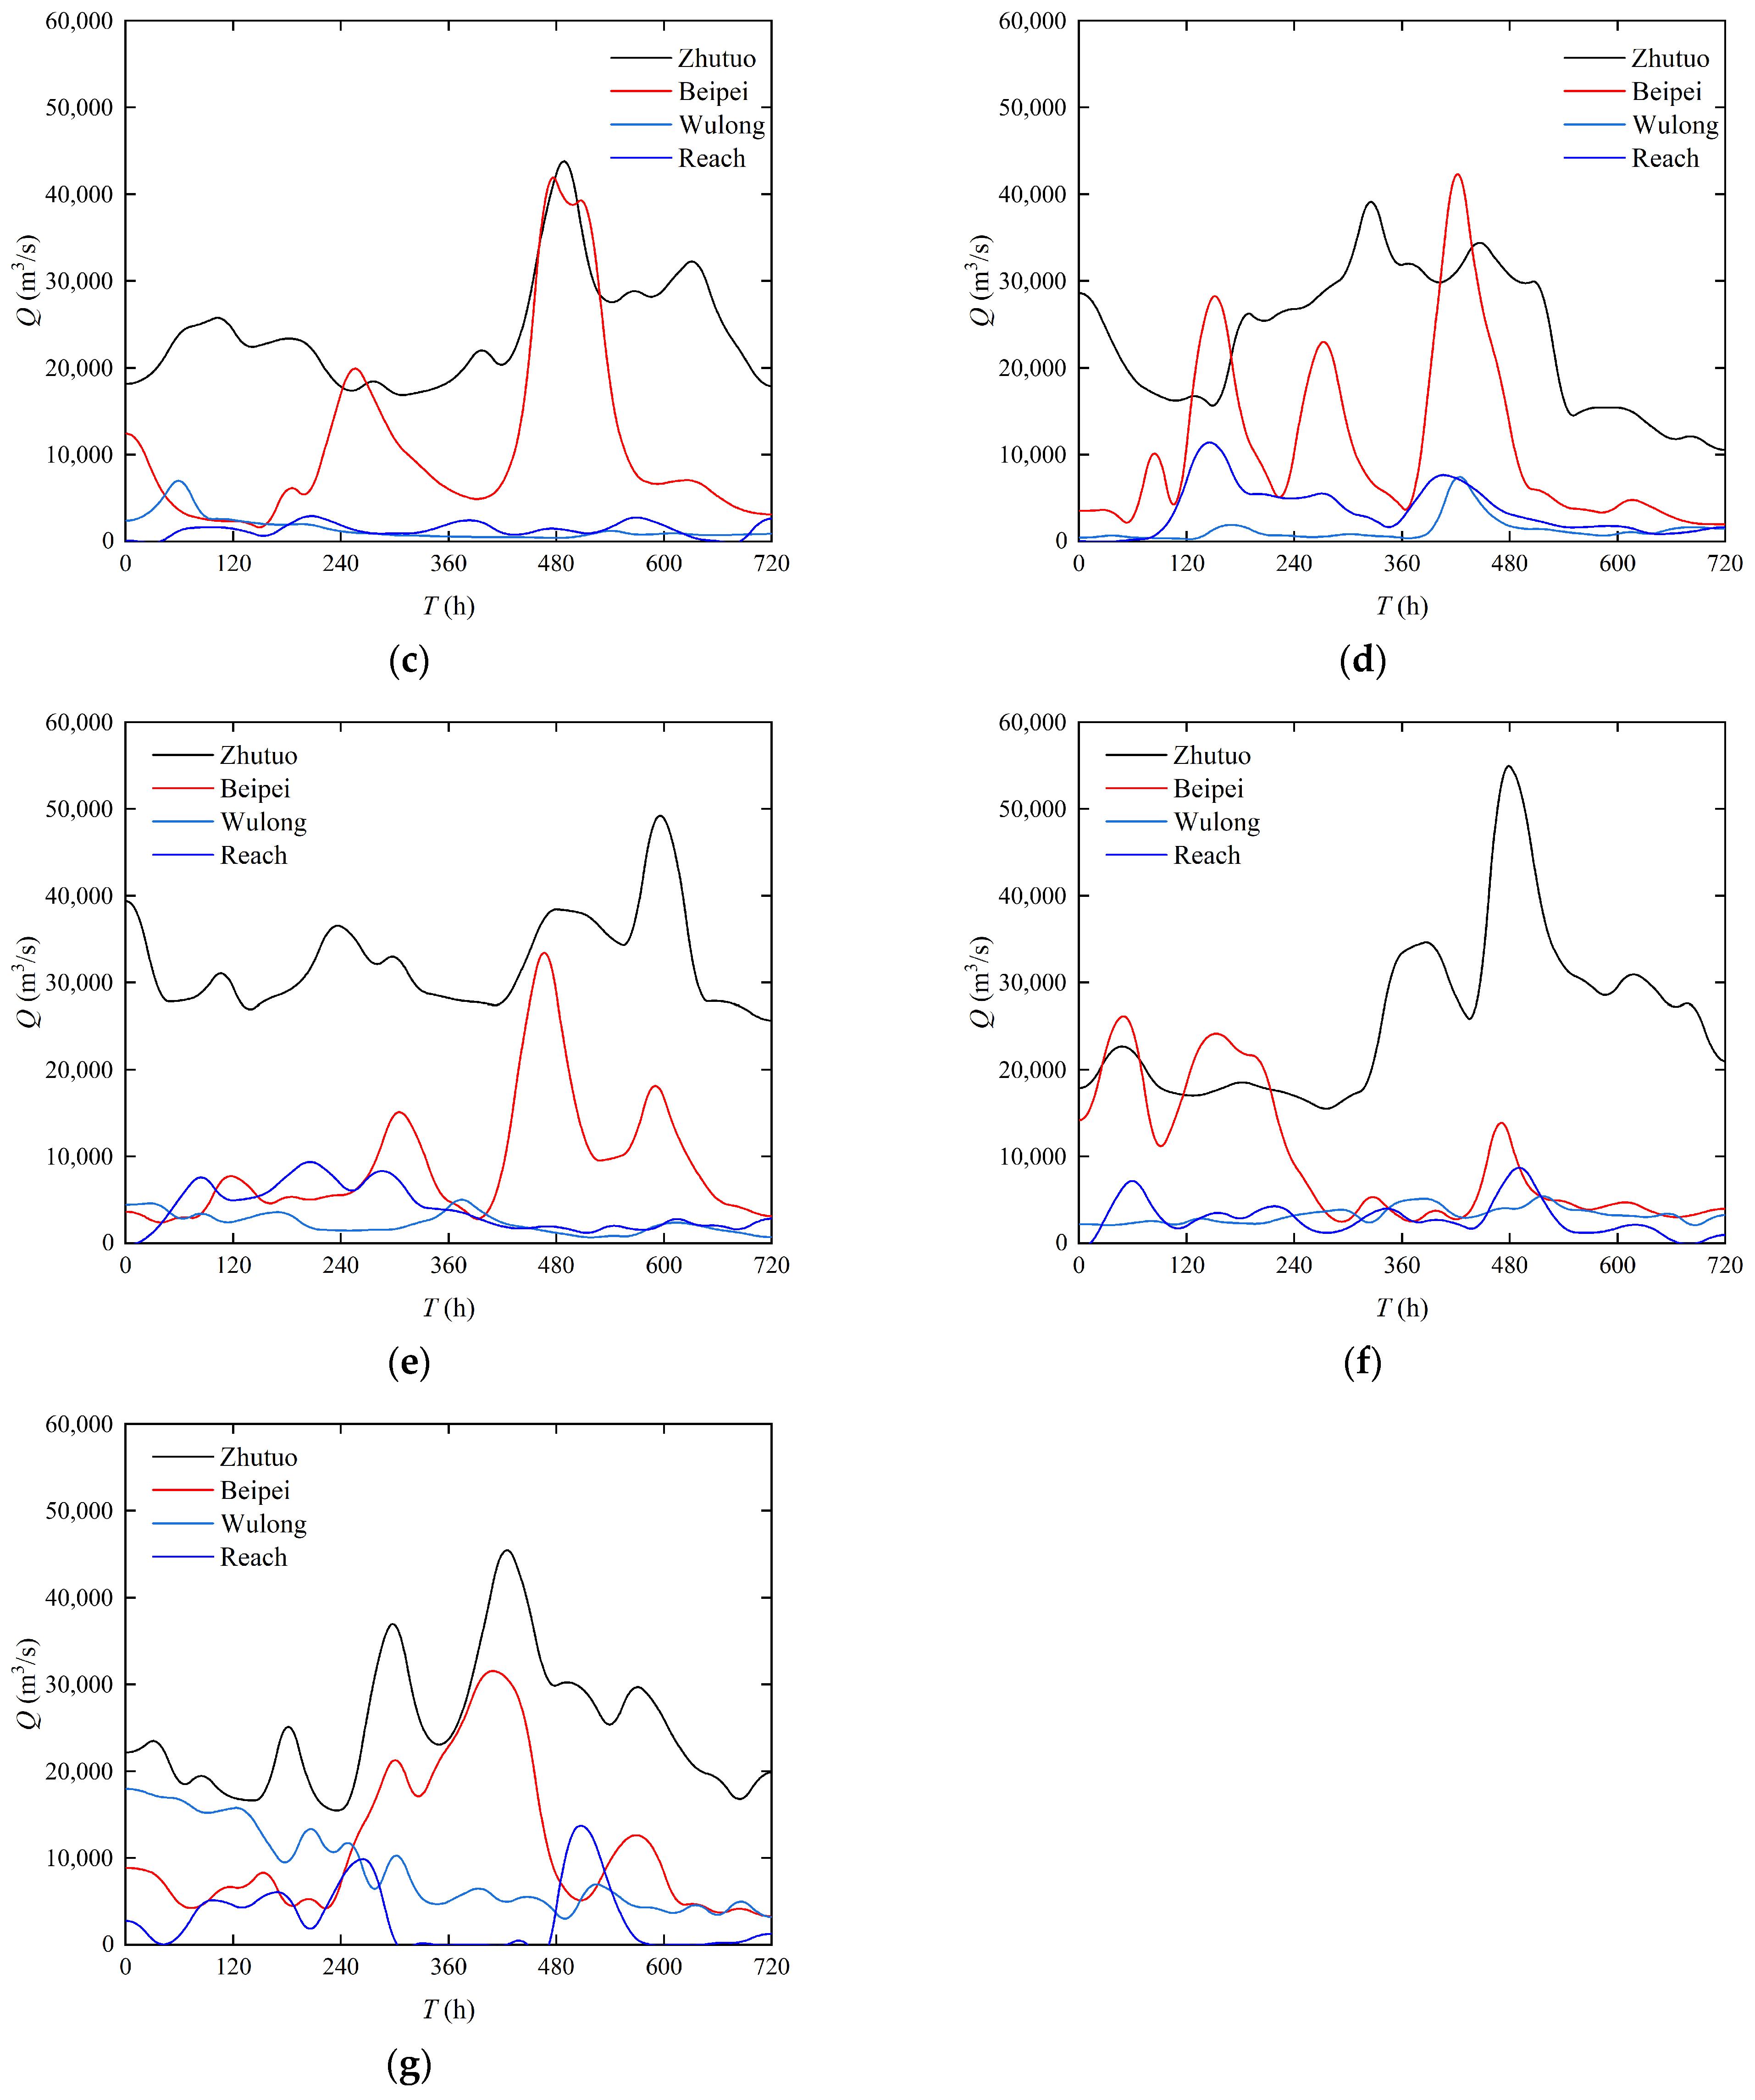
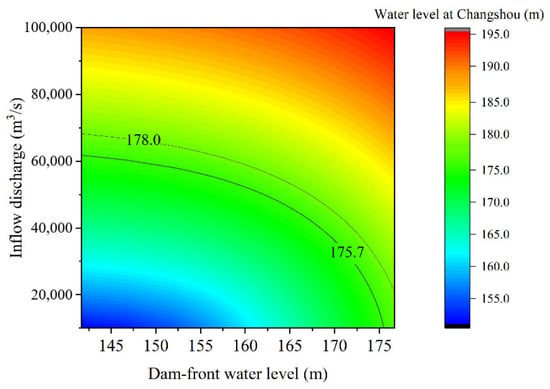
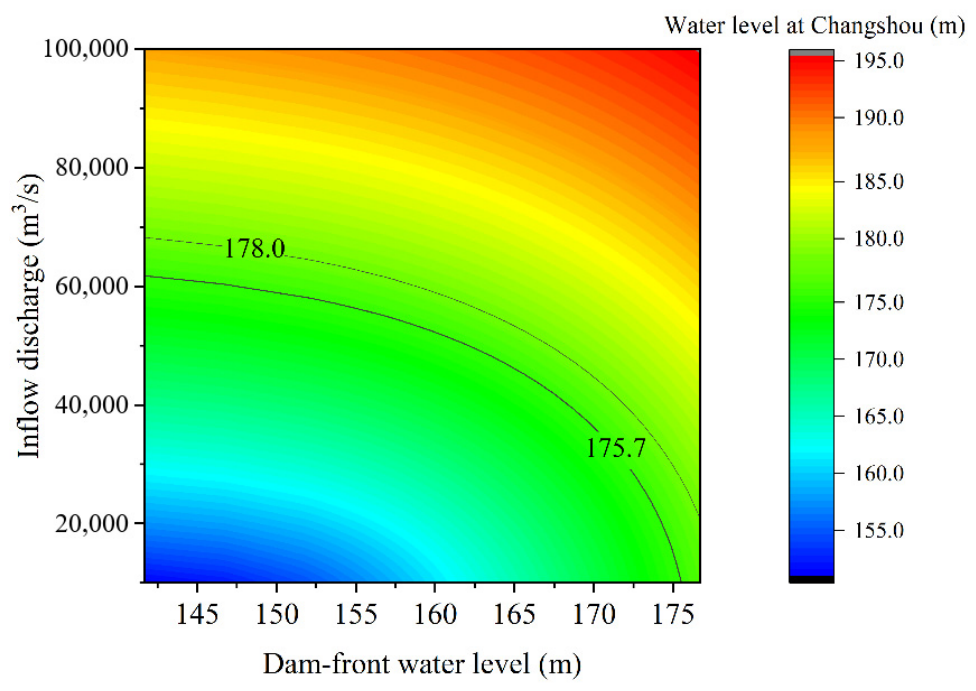
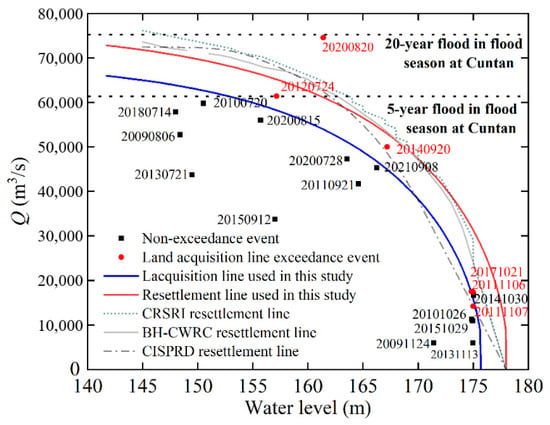
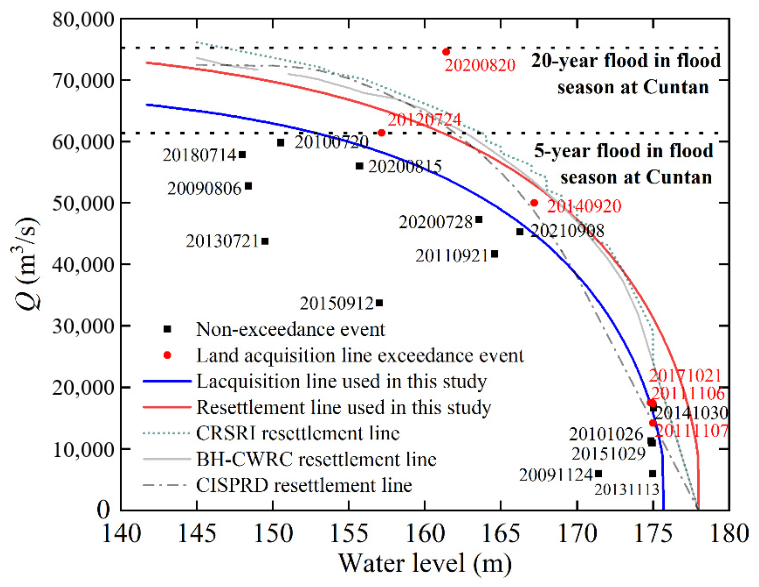
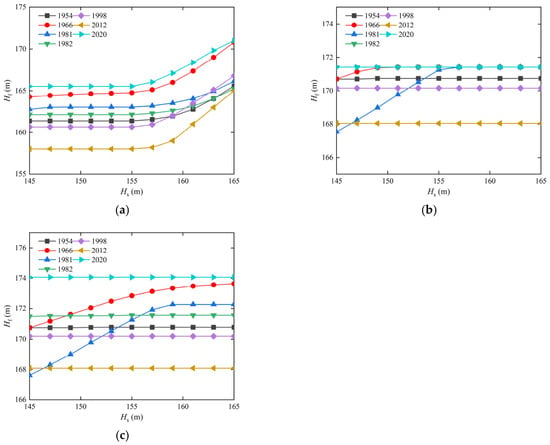
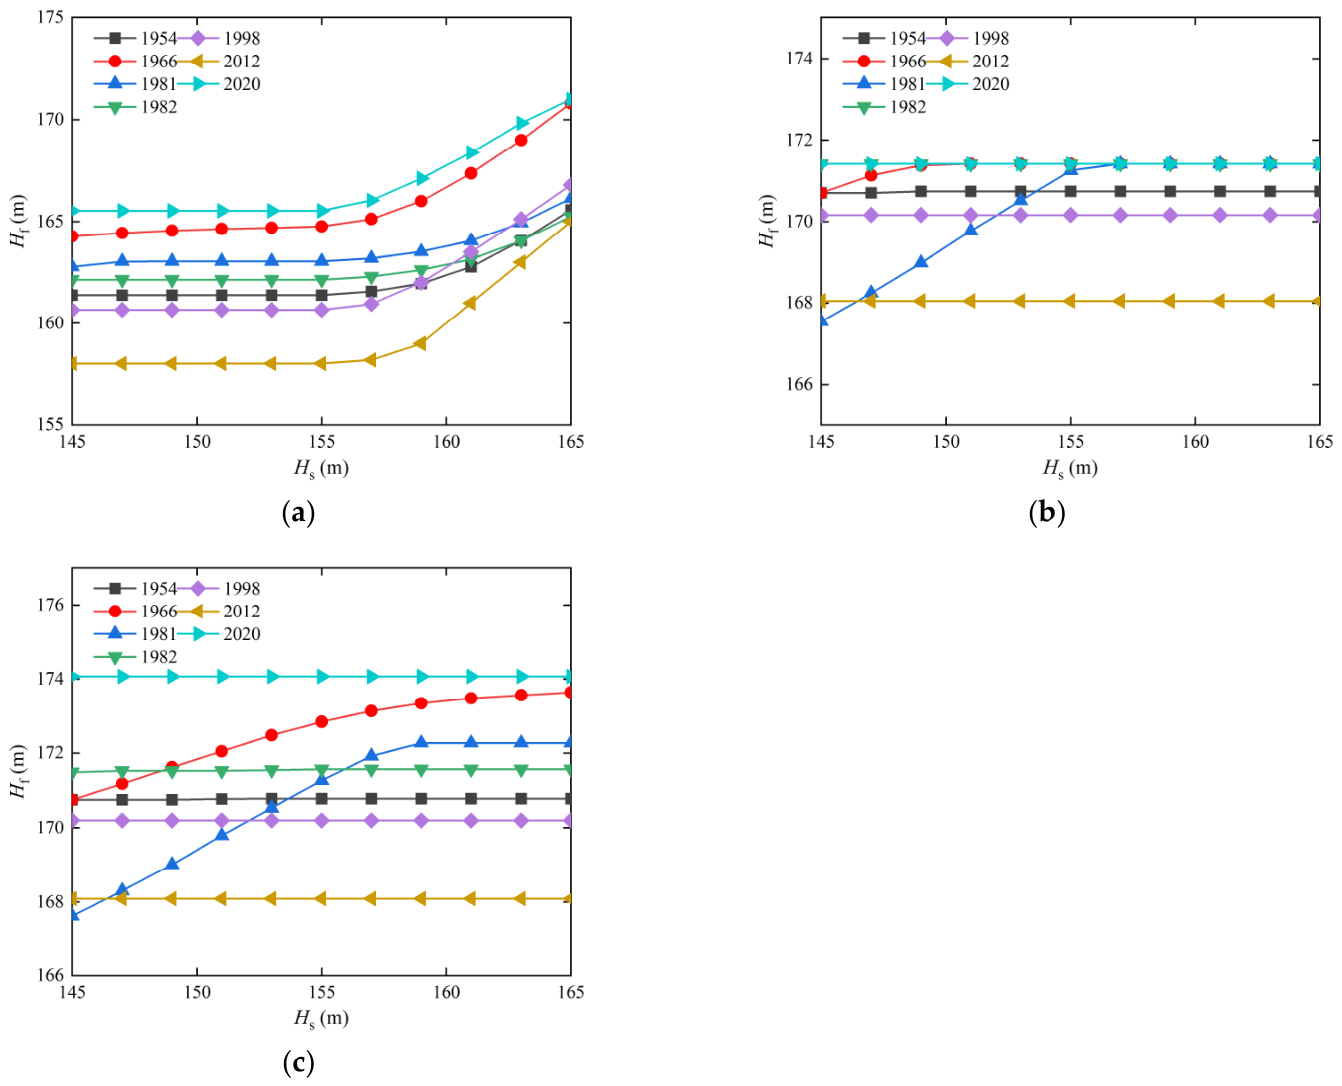
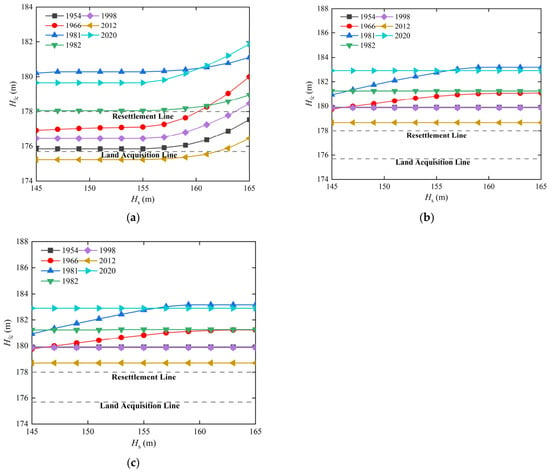
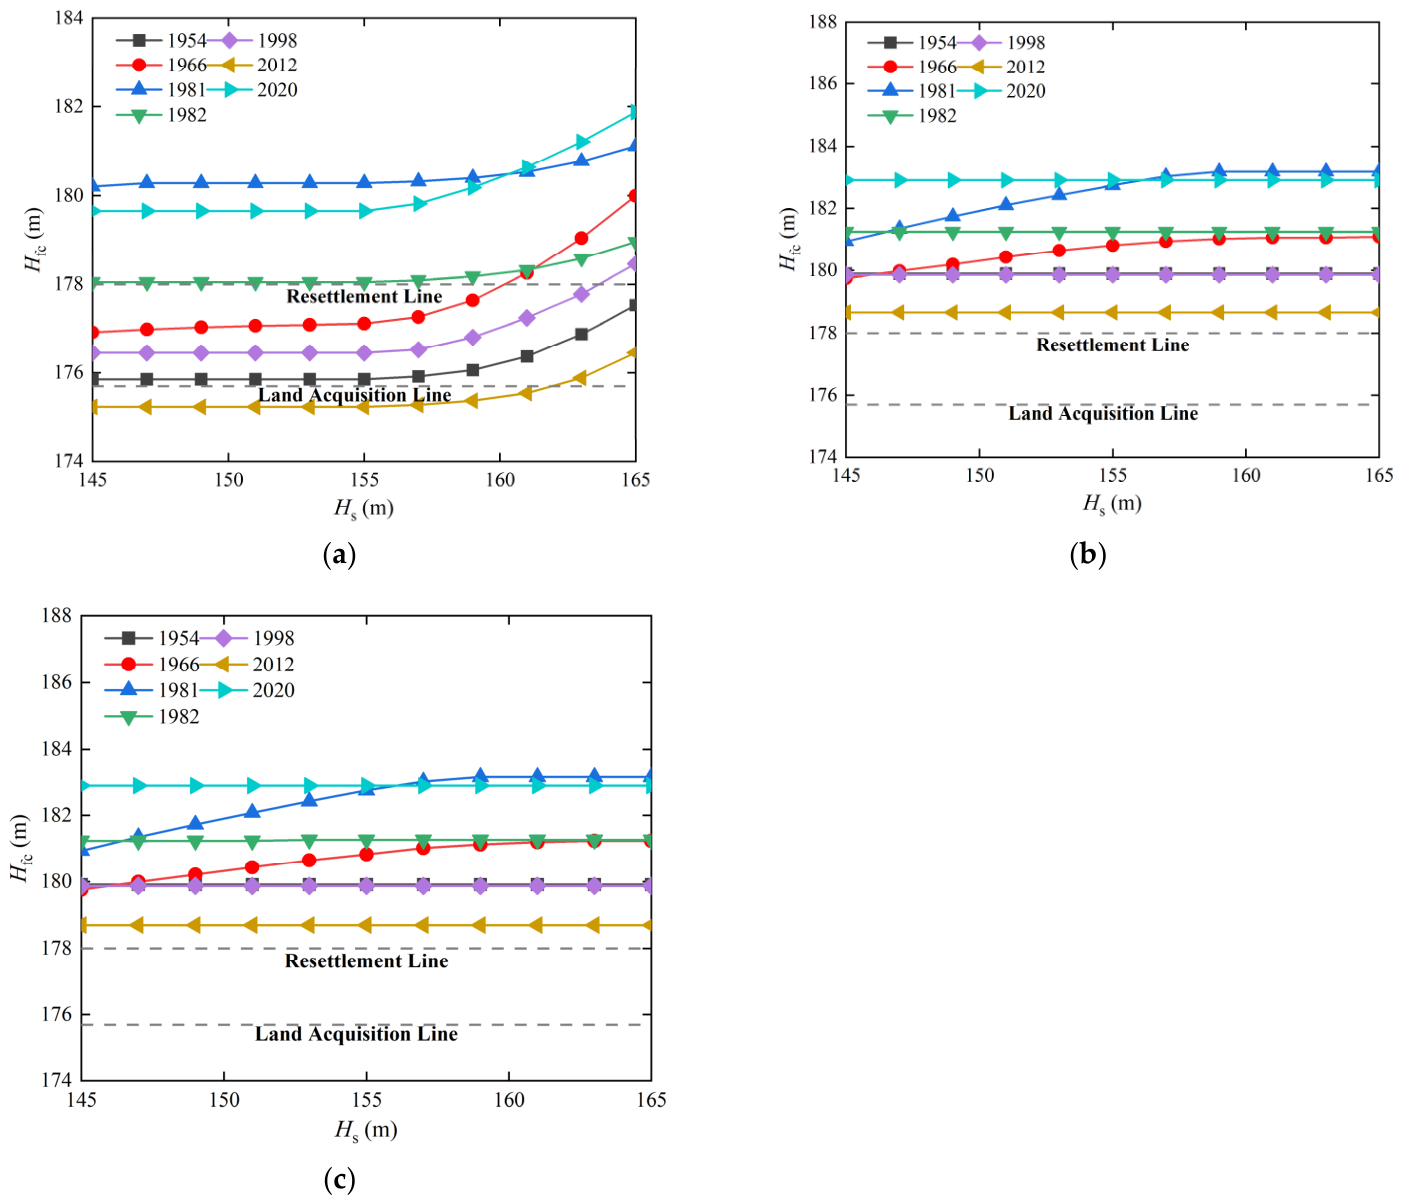
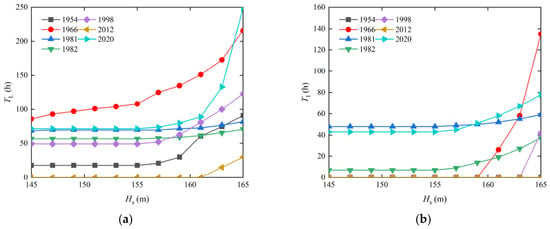
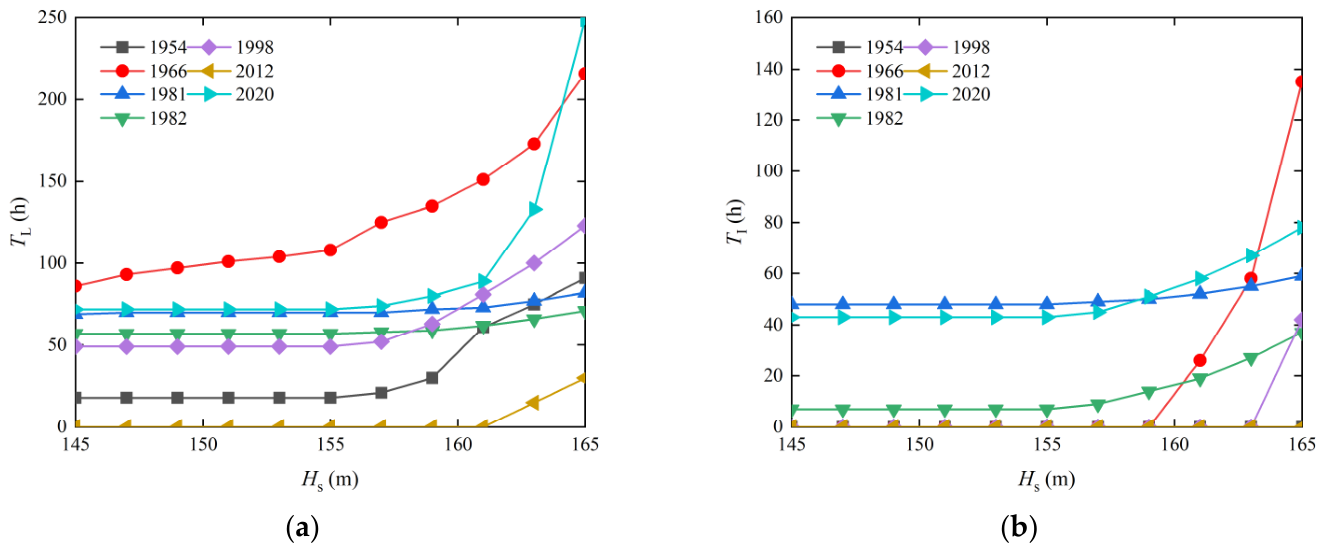
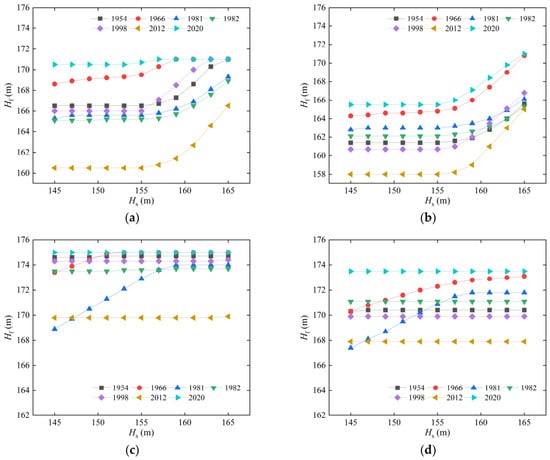
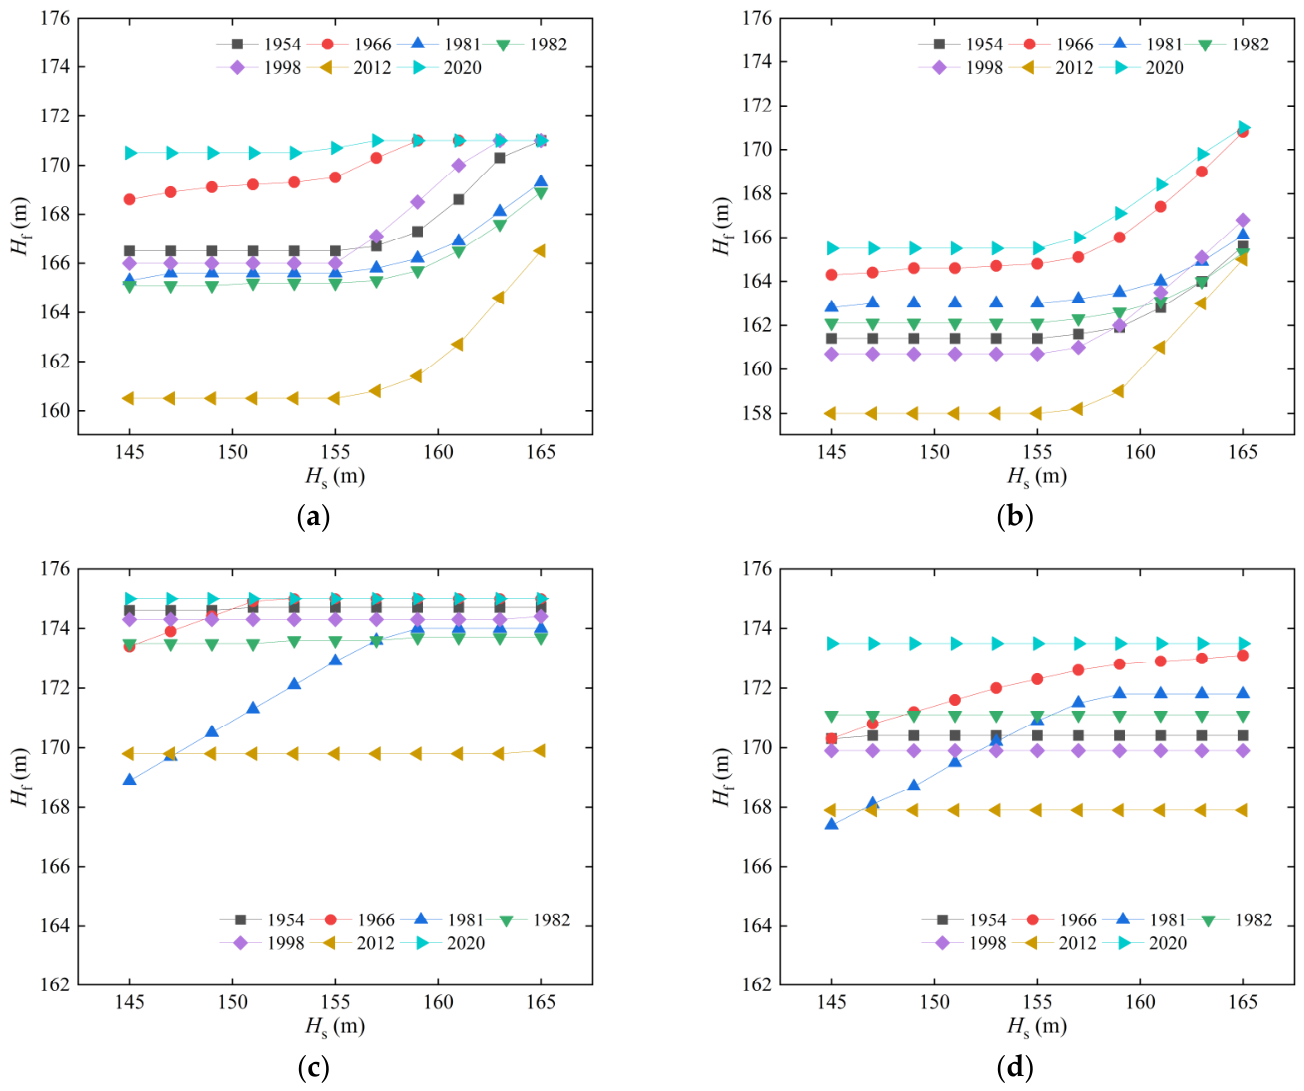
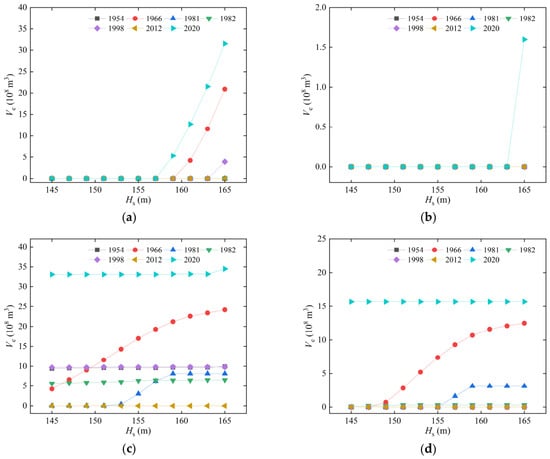
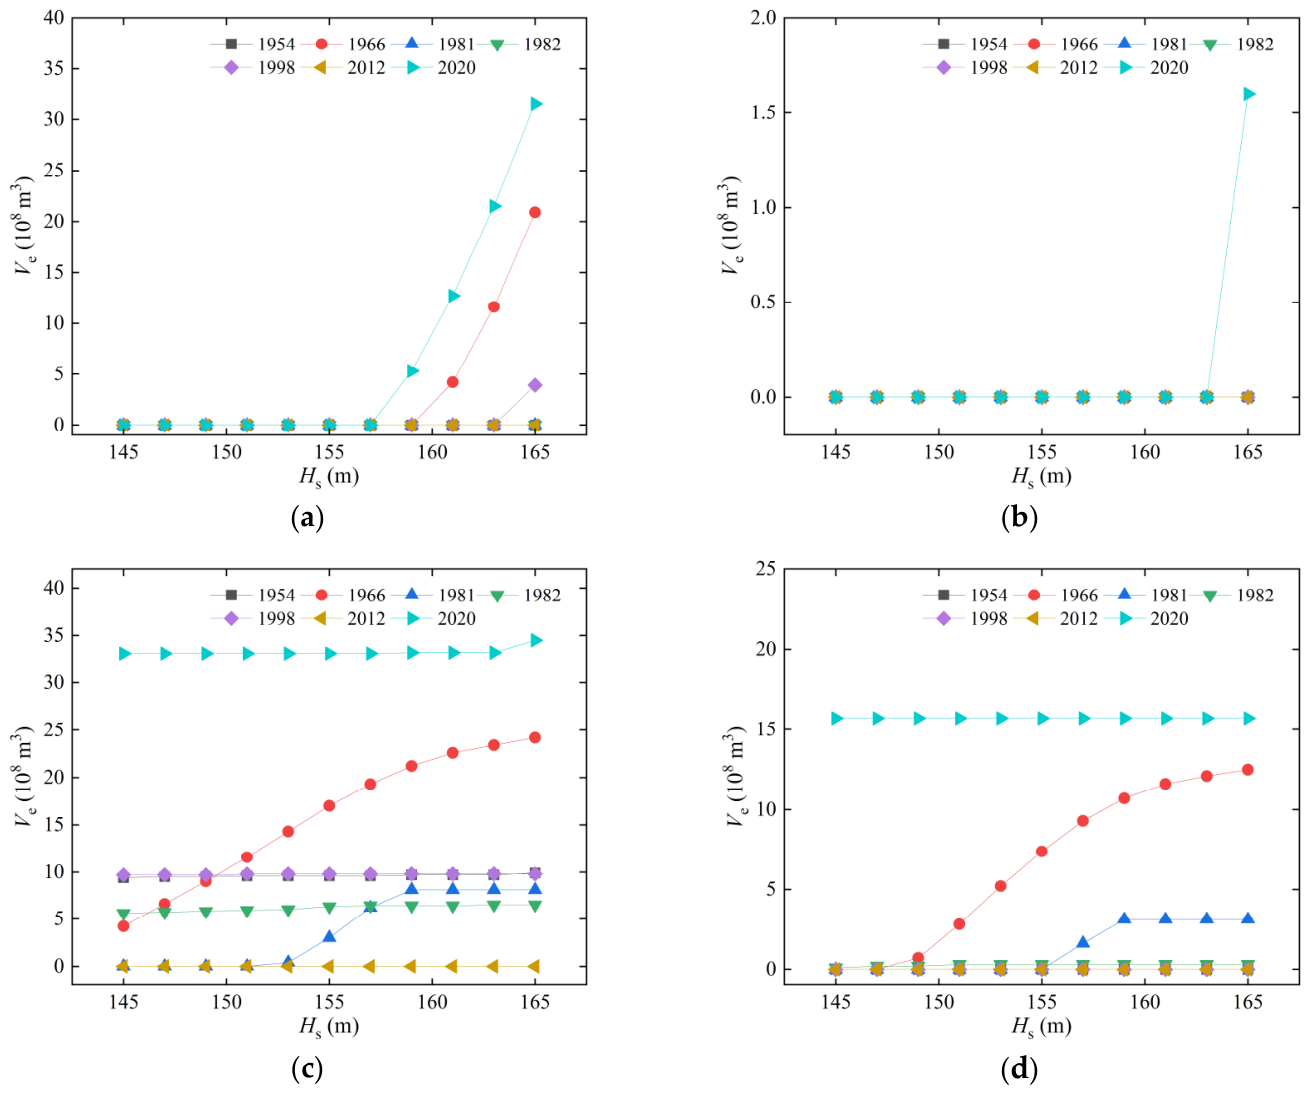
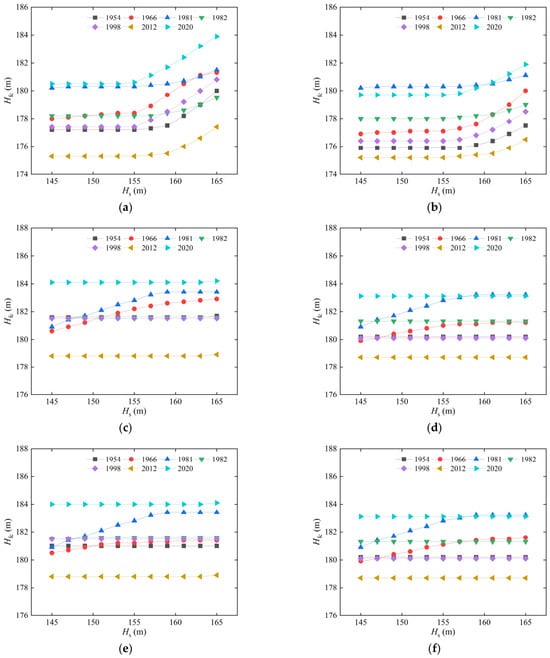
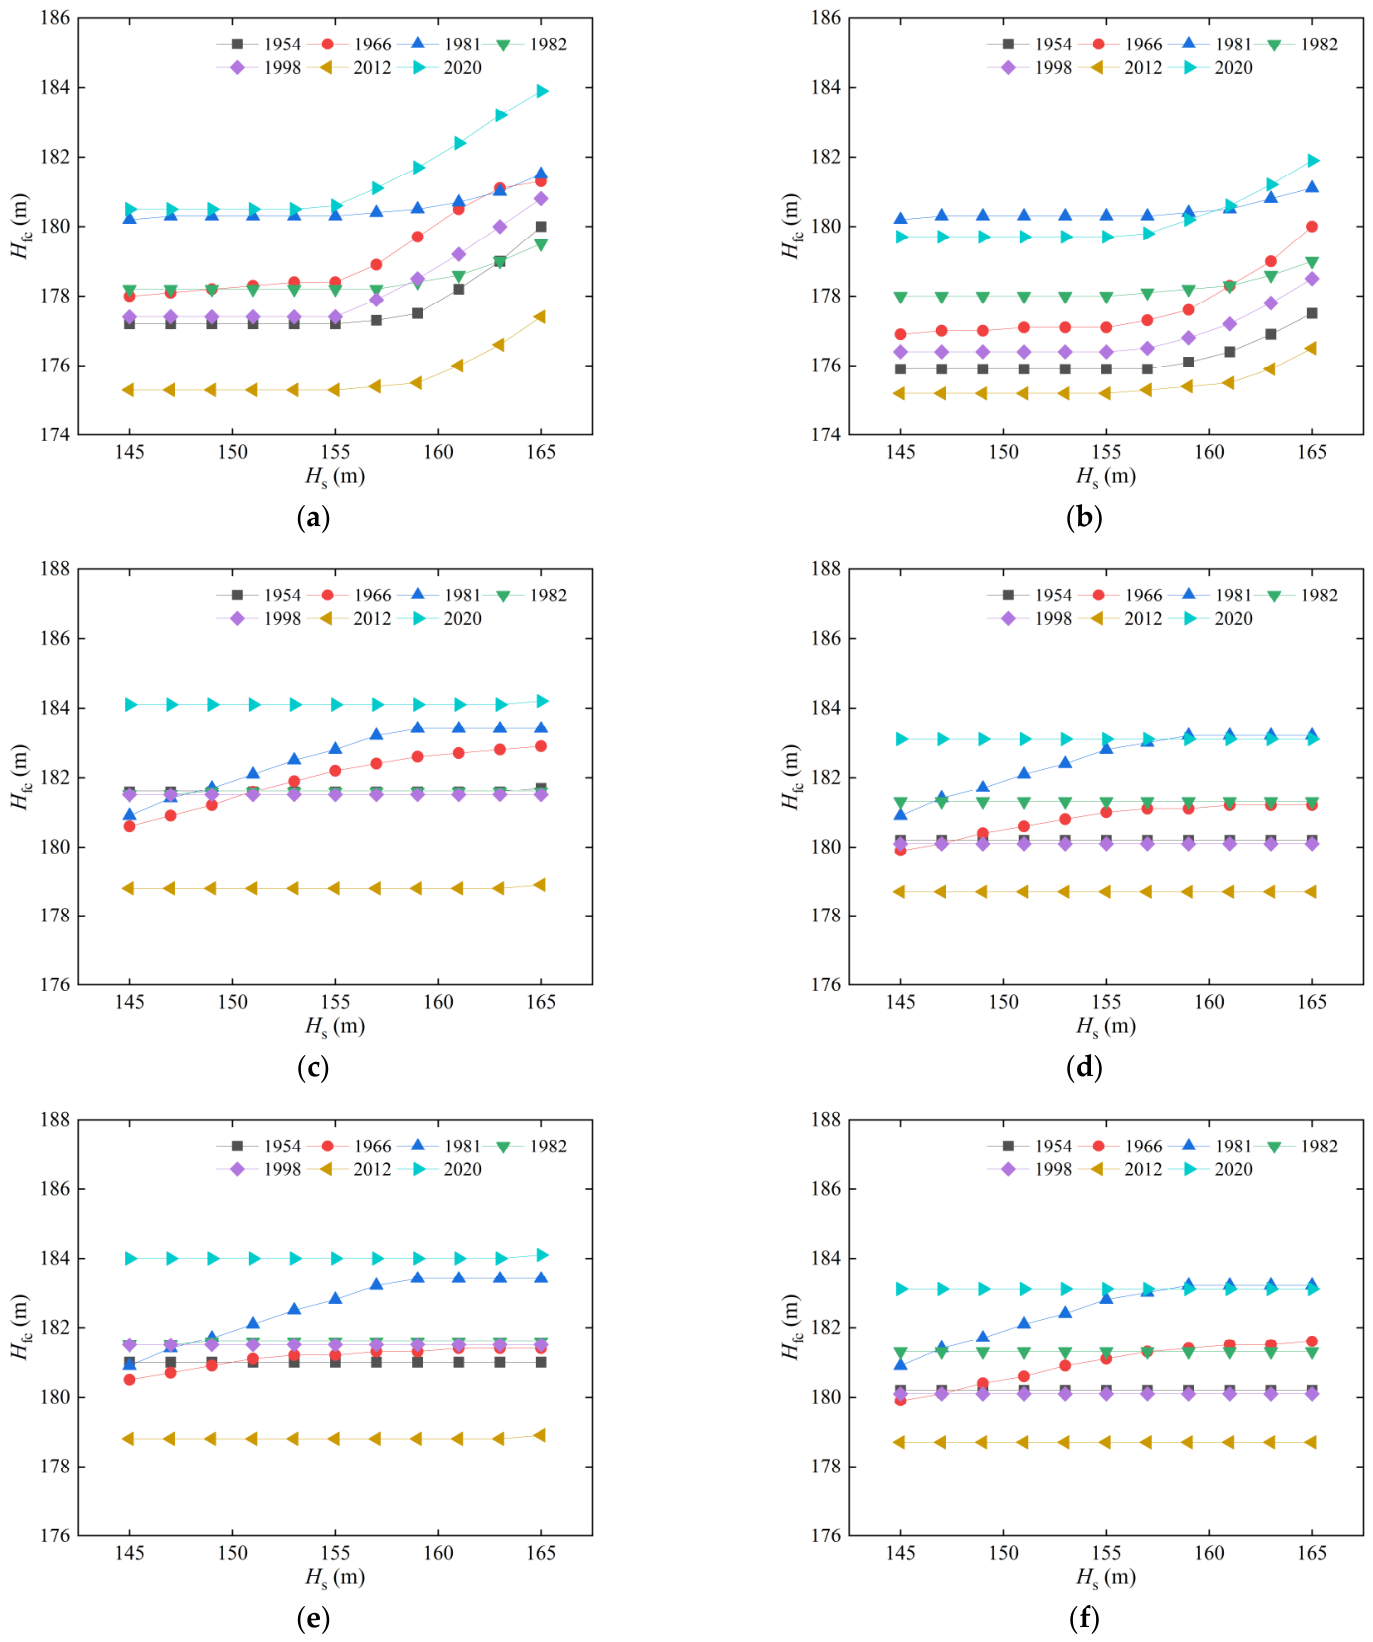
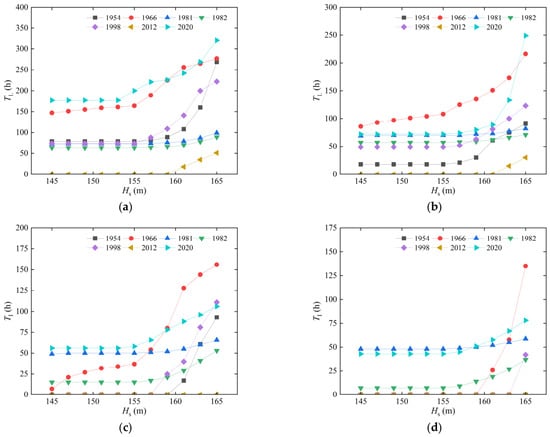
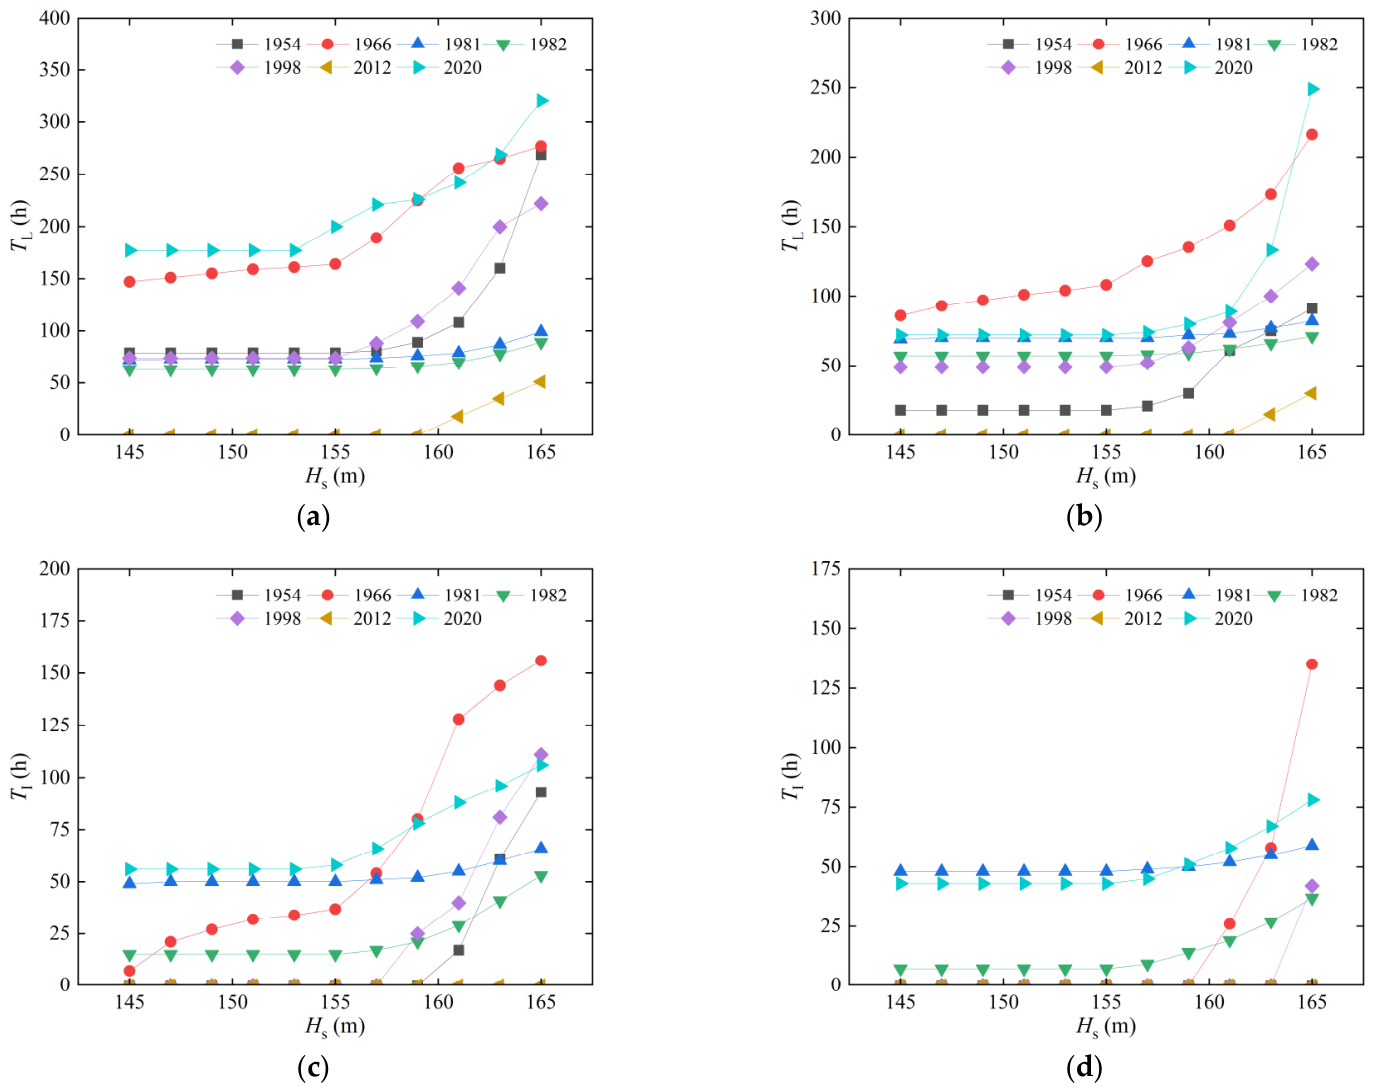

Disclaimer/Publisher’s Note: The statements, opinions and data contained in all publications are solely those of the individual author(s) and contributor(s) and not of MDPI and/or the editor(s). MDPI and/or the editor(s) disclaim responsibility for any injury to people or property resulting from any ideas, methods, instructions or products referred to in the content. |
© 2026 by the authors. Licensee MDPI, Basel, Switzerland. This article is an open access article distributed under the terms and conditions of the Creative Commons Attribution (CC BY) license.