


Abstract
Drought is a major global hazard, yet critical knowledge gaps persist regarding how the El Niño–Southern Oscillation (ENSO) modulates it in topographically complex equatorial regions. This study characterizes ENSO’s spatiotemporal influence on drought across Ecuador’s four principal Köppen–Geiger climate zones: Amazon, Andean highlands, temperate, and arid coastal. Using meteorological data (1985–2015), we computed the Standardized Precipitation Evapotranspiration Index (SPEI) across multiple timescales. Ten ENSO indices were evaluated using Wavelet Coherence analysis to identify non-stationary, scale-dependent correlations and phase dynamics. Results show that tropical, temperate, and Andean (polar tundra) climates exhibit prolonged climatic memory, with significant ENSO correlations across 1- to 24-month SPEI scales. Conversely, arid regions display shorter memory, with correlations dissipating at longer timescales due to limited moisture storage. Phase analysis reveals two high-coherence intervals (1995–2000 and 2007–2013) at the 3-year return period, in which ENSO indices led drought by 9–18 months, underscoring their predictive potential. At 6- and 11-year periods, ENSO signals generally lag SPEI, indicating prolonged drought retention. The Trans-Niño Index and Southern Oscillation Index proved particularly sensitive for the Amazon–Andes transition. These findings establish a robust framework for improving drought monitoring and climate adaptation in vulnerable equatorial regions.
1. Introduction
Drought, recognized as a significant global natural hazard, affects 55 billion people worldwide each year, and its impacts are expected to increase [1]. This increase is especially concerning given drought conditions that can lead to a range of adverse effects, including, but not limited to, agricultural losses, water resource shortages, and ecological damage [2,3,4]. In particular, meteorological droughts, characterized by prolonged precipitation deficits, have increased in both frequency and intensity over the past few decades [5].
Large-scale climate patterns frequently modulate dry events, most notably the El Niño–Southern Oscillation (ENSO), a coupled ocean–atmosphere phenomenon recognized as the main driver of interannual climate variability [6,7]. ENSO, characterized by changes in the sea surface temperature (SST), redistributes tropical precipitation through teleconnections that shift global circulation patterns. As a result, tropical regions exhibit heightened sensitivity to changes in precipitation [8,9]. Allan and Soden [10] demonstrated that warm SST anomalies (El Niño) enhance precipitation in certain areas, while Oliveira-Júnior [11] found that cooler SST anomalies (La Niña) increase drought events in other regions. While global ENSO–drought relationships are well documented [12,13,14,15,16,17,18], the regional manifestations across South America require more granular attention due to the continent’s significant climate variability and high vulnerability to extreme hydro-climatic events [19,20,21,22].
The vulnerability of South America to climate variability arises from the intricate interactions between ENSO-driven teleconnections and the continent’s distinct geographical configuration, characterized by a heterogeneous mosaic of ecosystems and climate regimes. In this region, a wide variety of Köppen climate classifications, ranging from the arid Atacama Desert to the humid Amazon rainforest, each exhibits a distinct response to ENSO-driven precipitation changes [23,24]. Correia Filho et al. [25] found that annual precipitation anomalies in the Brazilian Cerrado, a tropical savannah zone, were significantly modulated by ENSO, with La Niña (El Niño) phases contributing to a surplus (deficit). On the other hand, a large part of the Amazon basin, predominantly tropical rainforest and tropical savannah, has experienced increasingly severe drought conditions attributed to ENSO events [26,27,28,29]. These dry events have become more severe in recent years, culminating in unprecedented drought conditions in 2023, which set a new record drought intensity linked to ENSO variability [30,31,32]. Characterizing these responses requires moving beyond traditional linear analytical frameworks, as the relationship between ENSO and regional drought patterns is often non-stationary and spatially inconsistent [33,34,35,36,37,38,39].
In South America, hydroclimatic variability is profoundly influenced by the ENSO, a dominant mode of interannual climate variability characterized by anomalous SST patterns in the central and eastern tropical Pacific [34,36,37,40]. Extensive research has documented the teleconnections between ENSO and precipitation anomalies across the continent [16,34,41,42,43,44,45], including analyses of specific extreme El Niño events [26,28,46].
Recent advancements suggest that non-linear methods and the adoption of the Köppen–Geiger climate classification system are essential for capturing the full dynamics of drought sensitivity [16,35,47]. In Colombia, for example, time–frequency analyses have identified specific frequency bands that account for most of the variance in precipitation [47,48]. Despite these methodological advancements, a significant knowledge gap persists regarding the precise timing and scale-dependent influence of ENSO on precipitation, particularly in topographically complex regions such as the Andes and the Amazon.
In Ecuador, while previous research has explored drought at the basin scale or within specific Andean regions, a comprehensive national analysis is still lacking [49,50,51,52,53]. Specifically, there is a lack of research integrating diverse Köppen–Geiger climate classifications with a multi-index ENSO assessment using non-linear time–frequency coherence.
This study aims to address this gap through two primary objectives: (1) to characterize the spatiotemporal patterns of meteorological drought across all Köppen–Geiger climate zones in Ecuador, and (2) to quantify the time–frequency relationships between multiple ENSO indices and drought conditions within each distinct climate zone. We employed the Standardized Precipitation Evapotranspiration Index (SPEI) from 1985 to 2015 to capture droughts and Wavelet Coherence, a non-linear method, to analyze and identify scale-dependent, non-stationary correlations between drought and ENSO drivers. Our findings provide novel insights into the regional manifestations of ENSO-forced drought, with direct implications for improving water resource management and climate adaptation strategies in a topographically complex and highly vulnerable region.
2. Materials and Methods
2.1. Study Area
The study area encompasses continental Ecuador, which covers 262,826 km2. The Andes mountain range traverses the country from north to south, dividing it into three distinct natural regions: the Coastal area, the Highlands (Sierra, comprising the eastern and western Andean cordilleras), and the Amazon region. Air temperature remains relatively constant from month to month across the country, but varies considerably with altitude. The mean annual temperature ranges from 0 °C at the summit of the Andean mountains to over 26 °C in the coastal and Amazonian lowlands. In the Highlands, at elevations between 1500 and 3000 m above sea level (m.a.s.l.), the mean temperature ranges from 8 °C to 20 °C, while at higher elevations, the páramo climate averages approximately 10 °C. In the Coast and Amazon regions, the mean annual temperature hovers around 24 °C, with extremes exceeding 38 °C [54]. On the other hand, complex climatic patterns and high precipitation variability are driven by its diverse topography, the influence of the Intertropical Convergence Zone (ITCZ), and variations in sea surface temperatures [55].
2.2. Data Series
Precipitation and temperature data were obtained from the Information System for Climate Projections and Risk, Climate Change Adaptation Measures, and Vulnerability Indicators (SPRACC) by the Ministry of Environment, Water, and Ecological Transition of Ecuador (MAATE), available at https://spracc.ambiente.gob.ec/geovisor-web-s-pracc/frontend (accessed in May 2026). The dataset covers the period from 1985 to 2015, with a spatial resolution of approximately 0.09° and a daily temporal resolution.
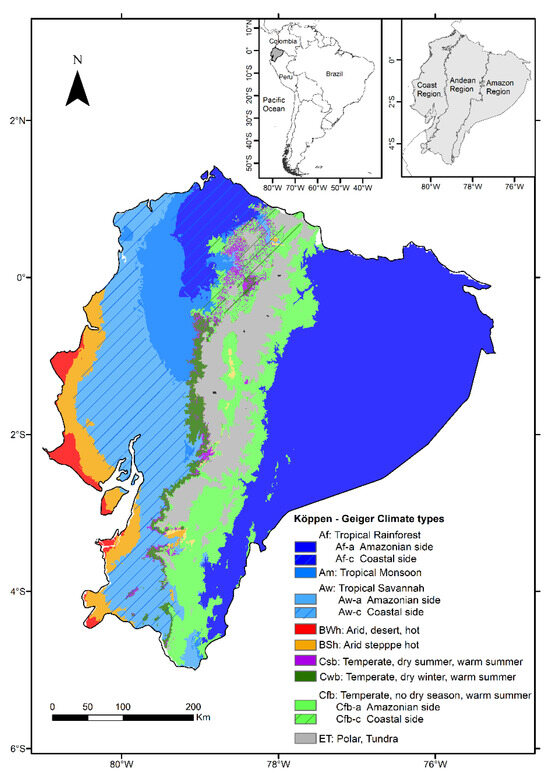
To move beyond the general classification of Ecuador into three natural regions—Coast, Andes, and Amazon—each with distinct drought responses, we applied the Köppen–Geiger climate classification. While broad geographic classifications often mask significant internal variability, the Köppen–Geiger system provides the physical specificity needed to identify sub-regional climatic nuances that govern drought response. For instance, the Coastal region is not a single homogeneous unit; it encompasses both arid climates (BSh, BWh) and tropical savannah (Aw-c), each exhibiting distinct climatic sensitivities and water storage capacities. The Köppen–Geiger system categorizes climates based on temperature and precipitation thresholds into main classes and 30 sub-types, each identified by a two- or three-letter code [56]. Within Ecuador, this framework identifies 12 climate sub-types. To further refine the spatial analysis, we distinguished sub-types by geographic location, specifying whether a given classification was located on the coastal side (denoted by the suffix ‘-c’) or the Amazonian side (denoted by the suffix ‘-a’) of the study area. This approach facilitates a detailed exploration of drought sensitivity across specific climates, critically including the diverse tropical zones that dominate the country’s territory, thereby extending methodological frameworks validated in other regions [16,57]. Figure 1 shows the distribution of climates in Ecuador.
Figure 1.
Köppen–Geiger climate distribution in Ecuador.
To comprehensively analyze ENSO dynamics across different climate types, this study used monthly oceanic and atmospheric indices associated with the Pacific Ocean. The selected indices include the SST-based, such as Niño 1 + 2, Niño 3, Niño 3.4, Niño 4, Oceanic Niño Index (ONI), and Trans-Niño Index (TNI); the atmospheric Southern Oscillation Index (SOI); the Multivariate ENSO Index (MEI) and the Bivariate ENSO Timeseries (BEST), which incorporate both oceanic and atmospheric variables; and the ENSO Precipitation Index (ESPI), which uses Tropical Pacific rainfall data. These ten indices and their respective data sources are detailed in Table 1.
Table 1.
ENSO indices.
2.3. Standardized Precipitation Index
The Standardized Precipitation Evapotranspiration Index (SPEI) quantifies the effect of rising temperatures on drought by incorporating their influence on both precipitation and potential evapotranspiration (PET) [58]. A key feature of the SPEI is its multiscalar nature, which allows it to be linked to different drought phases [58,59]. PET, a core component of SPEI, can be calculated using several methods, with the choice depending on the available data. The Penman–Monteith method, considered the most physically comprehensive, requires solar radiation, relative humidity, and wind speed [60,61]. The Thornthwaite method relies solely on latitude and mean daily temperature [62], while the Hargreaves method uses latitude and daily minimum and maximum temperatures [63,64]. Although studies indicate that the choice of PET method may not significantly alter the identification of drought stages, it can influence the perceived intensity of drought conditions [18,65]. Given our data availability, which included precipitation and daily minimum and maximum temperatures, and in alignment with the temporal drought analysis recommended by Lee [66], we selected the Hargreaves method to calculate PET. The SPEI was then computed for six cumulative time scales: short-term (1 and 3 months), medium-term (6 and 9 months), and long-term (12 and 24 months). This multiscalar approach enabled a robust spatiotemporal analysis of drought evolution across Ecuador during 1985–2015. The SPEI value for a given month (n) at a given timescale is derived from the cumulative climatic water balance (precipitation—PET) for the current month and the preceding n − 1 months, yielding our six drought indicators (SPEI-1 through SPEI-24). Positive SPEI values indicate wetter-than-average conditions, and negative values indicate drier-than-average conditions [67]. The specific wet/dry categories based on SPEI thresholds are detailed in Table 2 [68].
Table 2.
Classification of dry and wet conditions using the SPEI.
2.4. Wavelet Coherence
The relationships between the SPEI and ENSO indices were assessed using the Wavelet Coherence (WC) method. Unlike the Fourier transform, which decomposes a signal solely into its frequency components, wavelet analysis uses mathematical functions (wavelets) to analyze a time series at multiple resolutions in both time and frequency. Wavelets are particularly powerful for identifying non-stationary characteristics in a signal, leading to their widespread application in climate science to investigate the periodicity of drought variability [69,70,71]. Wavelet coherence (WC) uses the Continuous Wavelet Transform (CWT) to reveal how the similarity between signals evolves simultaneously in both time and frequency. WC is fundamentally a measure of the similarity of the progression of phases between oscillations. CWT is defined as the convolution of a time series with a scaled and translated mother wavelet. The Morlet wavelet is the most common choice in geophysical and hydrological studies because it provides an optimal balance between time and frequency localization [68,72,73].
While a Continuous Wavelet Transform (CWT) provides a robust time–frequency analysis of a single time series, Wavelet Coherence (WC) extends this concept by quantifying the cross-correlation between two time series (x and y) in the time–frequency domain [74]. Thus, WC was selected as the appropriate method for identifying localized, time- and frequency-dependent correlations between ENSO indices and drought conditions (SPEI). Wavelet coherence (Equation 1) is defined as:
where represents the cross-wavelet power spectrum, y are the cross-wavelet transforms for both signals: (ENSO), (SPEI), on a scale (related to a specific frequency). This measures how the two signals interact at different frequencies and time intervals. is the time-series smoothing operator. is the magnitude of the WC, a value between 0 and 1; values closer to 1 indicate higher correlation, while values closer to 0 indicate lower correlation between the two time series [72]. The WC plot shows statistical significance at the 95% confidence level, delineated by white contour lines. Arrows depict the phase relationship between the time series: leftward arrows indicate a negative correlation/anti-phase, rightward arrows indicate a positive correlation/in-phase. The boundary effects at the beginning and end of the time series are addressed by introducing a cone of influence (COI), within which results should be interpreted with caution. The magnitude of the WC is quantified using the color scale in the sidebar [75]. A full explanation of WC is provided by Rösch and Schmidbauer [75] and Torrence and Compo [74]. All statistical analyses, including SPEI computation and Wavelet Coherence, were performed in R (v.4.4.2) using the SPEI (v.1.8.1) and WaveletComp (v.1.1) packages.
3. Results
Prior to analyzing the spatiotemporal dynamics of drought, we established a climatological baseline for each of the twelve identified Köppen–Geiger zones for the 1985–2015 period. Table 3 summarizes these climatic characteristics, detailing the corresponding natural region and elevation ranges [76]. The results demonstrate substantial climatic heterogeneity across Ecuador; for instance, annual precipitation ranges from a minimum of 186.09 mm in arid coastal zones (BWh) to a maximum of 4672.81 mm in the Amazonian rainforest (Af-a). A key distinction of the Köppen–Geiger system is the identification of sub-regional variability within natural regions: although the Tropical Savannah (Aw-c) is located within the Coastal region, it exhibits distinct climatological parameters compared to the arid desert (BWh) and steppe (BSh) sub-types. While BWh is restricted with a maximum annual precipitation of 540.69 mm, the Aw-c zone receives significantly higher rainfall, reaching 2491.96 mm.
Table 3.
Climatological characteristics of the twelve Köppen–Geiger climate zones in Ecuador (1985–2015).
In Ecuador, all climatic zones experienced dry events; however, correlations between ENSO indices and drought events were most pronounced across multiple SPEI timescales, particularly in tropical, temperate, and polar (Andean) climate types.
According to [36], we identified three return periods: 2–4 years, 4–8 years, and 8–16 years. Within these intervals, the most significant correlations occurred at approximately 3–4, 5–6, and 10–11 years, hereafter referred to as the 3-, 6-, and 11-year return periods, respectively. The results highlighted here prioritize those with the greatest average significance (≥0.9).
3.1. Dry Events by Climate Type
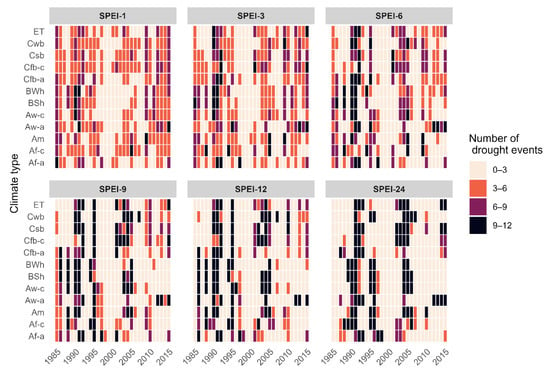
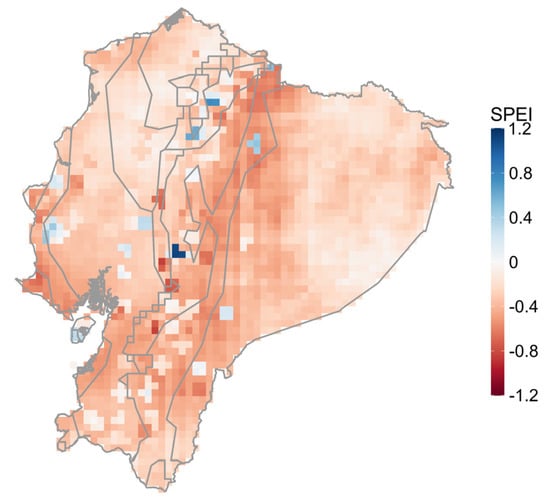
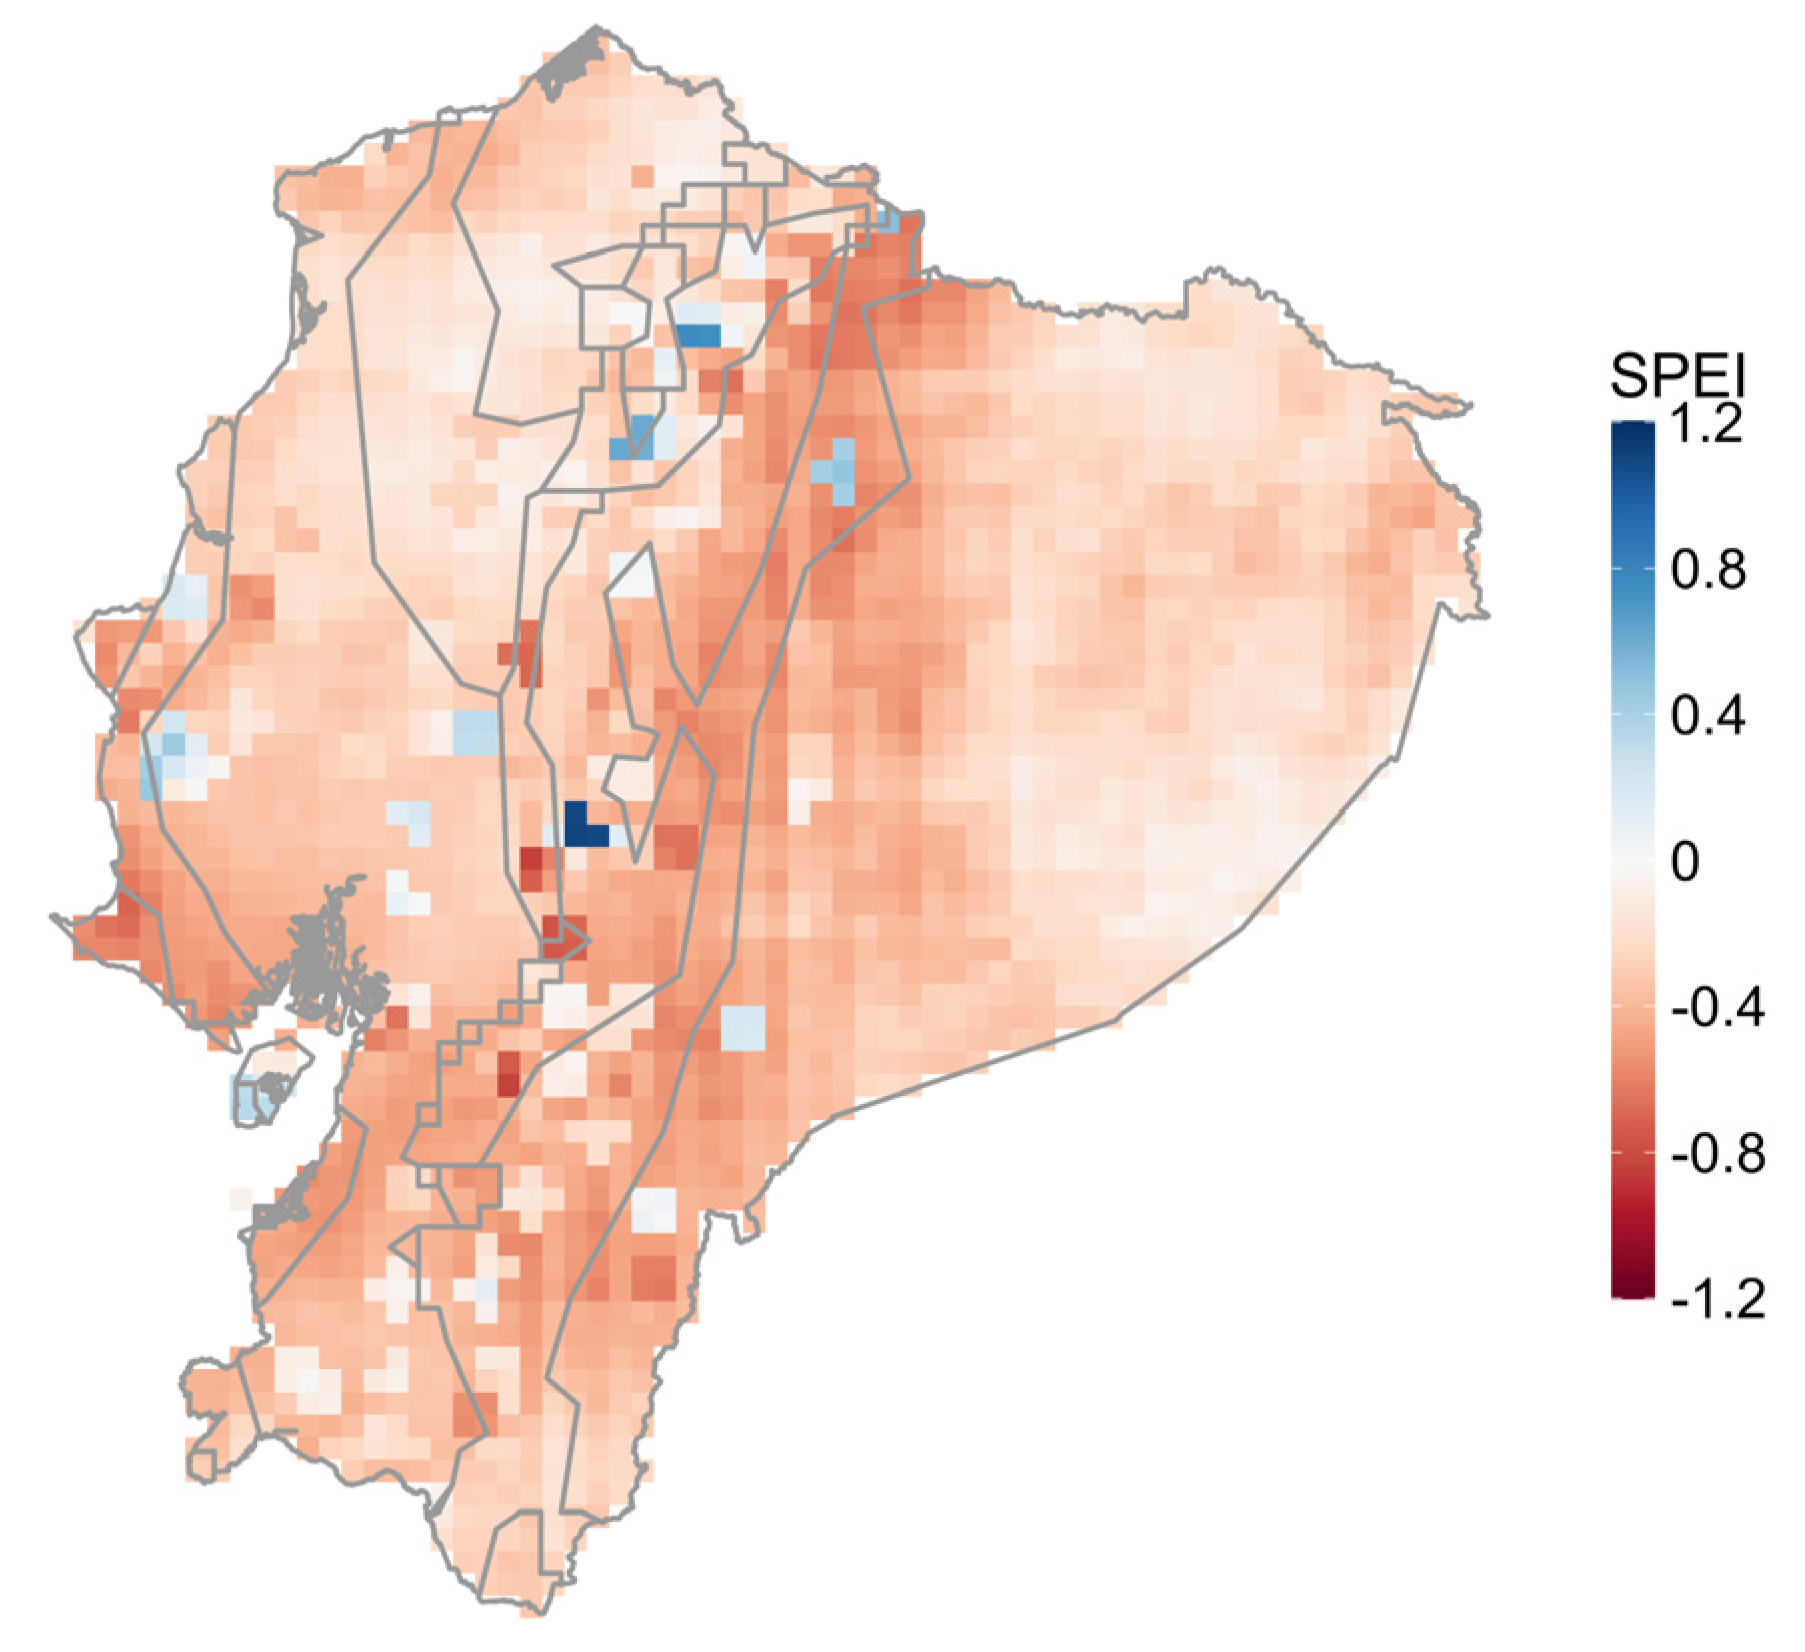
The most frequent drought events occurred during the periods 1990–1995, 2000–2005, and 2010–2015 (Figure 2). Drought incidence varied substantially across climate zones and SPEI timescales. The Tropical Savannah climate on the Amazon side (Aw-a) exhibited the most significant drought prevalence across most timescales. However, at the 12-month timescale (SPEI-12), the Tropical Savannah climate on the coast side (Aw-c) was the most severely affected. Conversely, the tropical rainforest climate (Af-a) exhibited the most outstanding resilience, with the fewest drought events across all timescales, particularly at the short- and long-term scales. Figure 3 shows the mean distribution of SPEI-3 during 1990–1995.
Figure 2.
Number of drought events by climate type across SPEI timescales.
Figure 3.
SPEI-3 during 1995–2000 in Ecuador on Köppen–Geiger climate types.
3.2. Temporal Evolution of ENSO-SPEI Correlation
To quantify the influence of ENSO on regional drought, we analyzed correlations between ENSO indices and SPEI over 1 to 24 months. The strength and significance of these correlations across SPEI timescales served as a measure of the hydroclimatic system’s memory of remote ENSO forcing within each climate type.
Our results show a clear contrast in the persistence of ENSO teleconnections across climates. In tropical (Af-a sub-type), temperate (type C), and Andean (ET sub-type) climates, statistically significant correlations with ENSO indices were observed across all SPEI scales, from short-term (1–3 months) to long-term (12–24 months), indicating a prolonged hydroclimatic memory. In contrast, across arid climates (type B), significant ENSO-SPEI correlations extended to medium-term timescales (6–9 months) and disappeared at longer timescales (except for TNI and BWh), suggesting a shorter system memory, likely due to their proximity to the Pacific Ocean’s sharp state fluctuations.
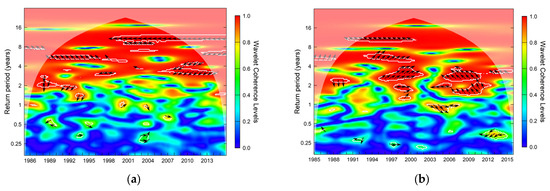
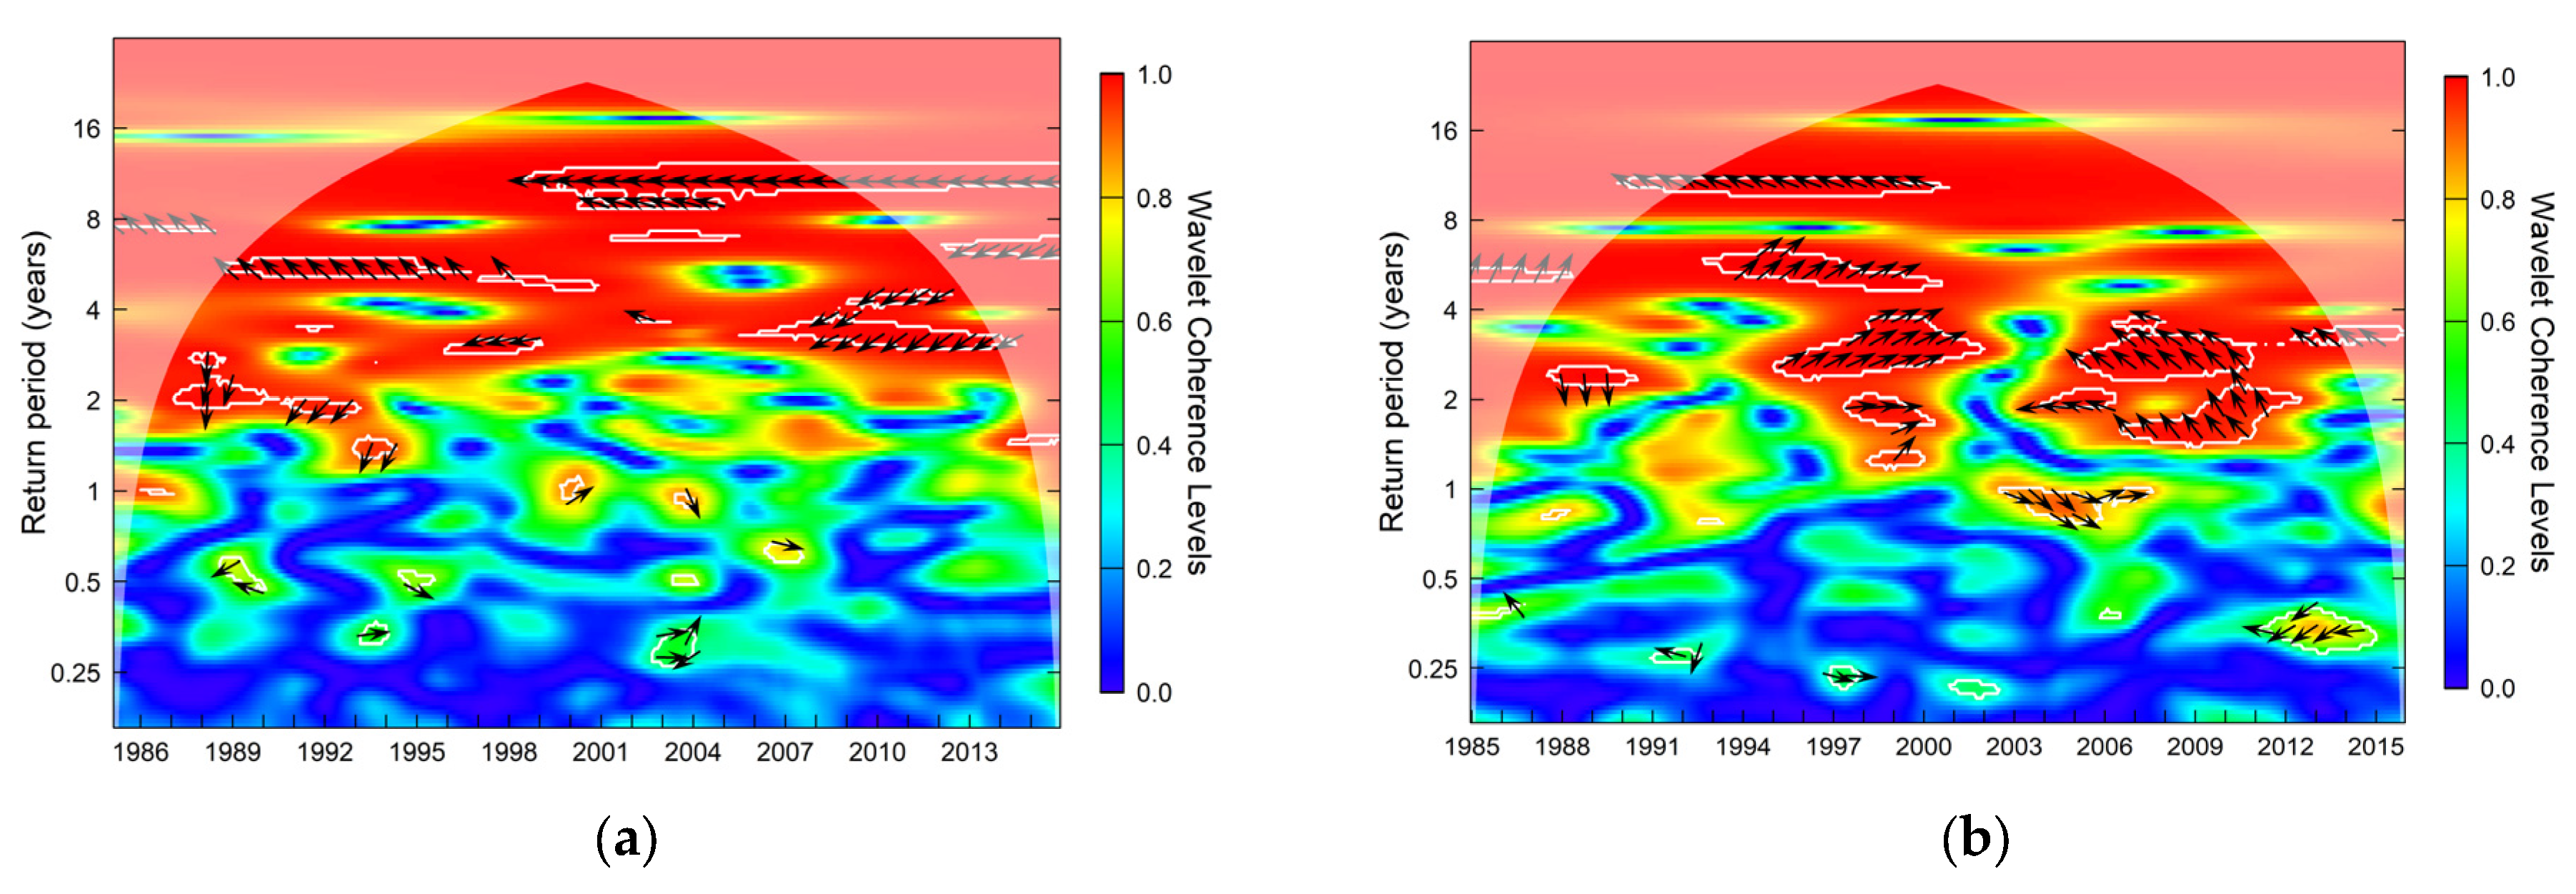
In tropical climates, the stability and scale of ENSO–SPEI correlations varied markedly across sub-types. The most robust teleconnections were observed in the tropical Af-a climate (Amazonian region), where all ENSO indices correlated significantly across all three return periods, with the sole exception of Niño 1 + 2 at the 11-year period. At the 11-year return period, Niño 3, Niño 3.4 (Figure 4a), Niño 4, ONI, and TNI showed correlations with SPEI across medium- to long-term scales (SPEI-3 to SPEI-24), while ESPI correlated from SPEI-6 to SPEI-24. Correlations at the 6-year return period included all SPEI timescales (SPEI-1 to SPEI-24). Conversely, during the 3-year return period, ENSO–SPEI correlations were mostly limited to medium-term scales; however, Niño 3.4, ONI, MEI, and TNI extended to SPEI-12, which represented the maximum correlated timescale for this return period. SOI also correlated with SPEI across all three return periods: from short- to long-term SPEI scales at the 11-year return period, and from short- to medium-term scales at the 6- and 3-year return periods. In the tropical savannah climate (Aw), correlation patterns exhibited strong spatial differentiation. Within the Aw-a subtype (Amazonian side) at the 11-year return period, significant correlations were identified at long-term SPEI scales for ONI and ESPI. In contrast, Niño 1 + 2 maintained positive correlations from short- to long-term scales. Conversely, in the Aw-c subtype (coastal side), a distinct group of indices—ONI, MEI, Niño 4, Niño 3.4, and BEST—showed significant correlations primarily at short-term SPEI scales. Consequently, the predominant drought-related timescales were climate-specific: medium and long-term scales in Aw-a, versus short-term scales in Aw-c. TNI exhibited a unique teleconnective behavior throughout the tropics. In the Af-c subtype at the 11-year return period, it correlated only at short-term SPEI scales. Its influence expanded in the Am and Aw-c subtypes at the same return period, correlating from SPEI-1 to SPEI-6. This pattern was similar in the Am subtype at the 6-year return period, where correlations spanned SPEI-1 to SPEI-24, but contracted to a maximum of SPEI-6 at the 3-year return period.
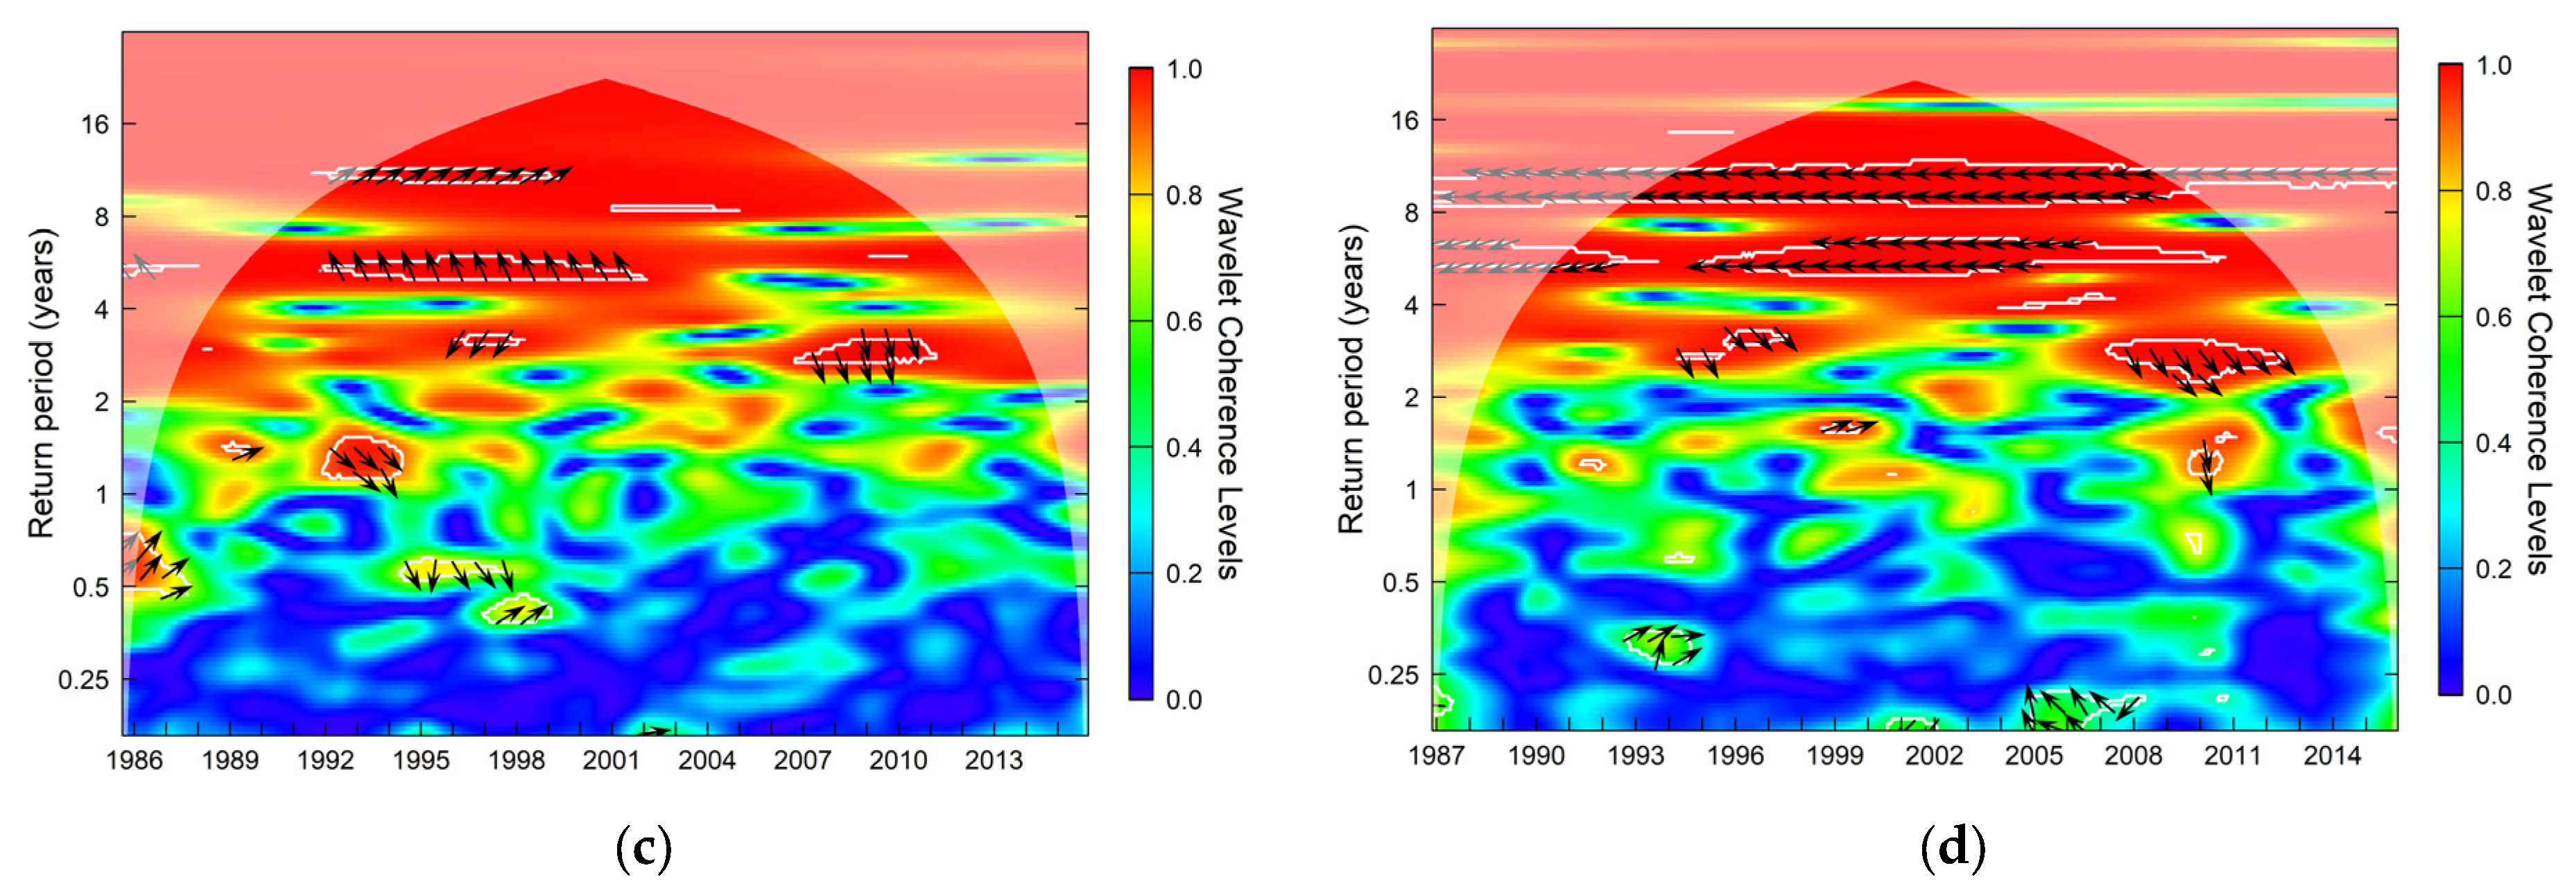
Figure 4.
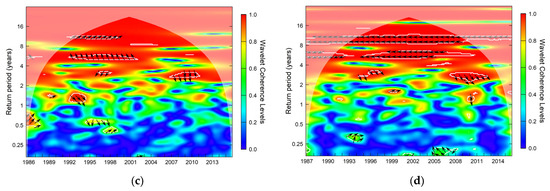
Wavelet coherence between: (a) Niño 3.4—SPEI-3 on Af-a; (b) MEI—SPEI-1 on BSh; (c) Niño 1 + 2—SPEI-9 on Cfb-c; (d) ONI—SPEI-24 on ET.
In arid climates (BSh, BWh), significant ENSO–SPEI correlations were primarily observed at short timescales (SPEI-1 and SPEI-3). Except for Niño 4 and TNI, all ENSO indices maintained positive and negative correlations with the SPEI at the 3-year return period across varying durations. Furthermore, BEST, Niño 3.4, ONI, and MEI (Figure 4b) showed significant correlations at the 11-year return period, while SOI and TNI exhibited significant correlations across all three return periods analyzed. Notably, at the 11-year return period, correlations extended to the medium-term SPEI scale (SPEI-6 to SPEI-9) in the BWh climate zone, with TNI as the sole index showing a relationship that persisted into the long-term scale (SPEI-12).
In temperate climates, ENSO-SPEI correlation patterns showed general similarities, though the temporal persistence of these relationships varied among sub-types. In the consistently humid Amazonian and temperate areas (Cfb-a, Cfb-c), ENSO indices (such as Niño 4, ESPI, TNI, BEST, and SOI) showed correlations with all SPEI timescales at both 11-year and 6-year return periods. Notably, Niño 1 + 2 also correlated with all SPEI timescales in these climate sub-types at the 6-year return period. At the 3-year return period, significant correlations extended for Niño 3, Niño 3.4, MEI, ONI, BEST, and SOI (the latter two exclusively in Cfb-c). During the same 3-year return period, Niño 1 + 2 exhibited a more complex pattern: negative correlations at short-term SPEI scales across all four temperate sub-types (Cfb-a, Cfb-c (Figure 4c), Csb, Cwb), while positive correlations developed in Cfb-a, Cfb-c, and Csb, extending to medium-term SPEI scales in Cfb-c and Csb. The dry-summer temperate climate, Csb, exhibited a correlation structure largely similar to that of the Cfb climate. However, it notably featured a strong impact of ESPI on SPEI-1 and Niño 4’s influence on scales up to SPEI-6—both at the 3-year return period—as well as a developed relationship between SOI and SPEI at the 11-year and 3-year return periods. In contrast, the dry-winter temperate climate (Cwb) showed a more restricted pattern. Here, ENSO-SPEI correlations occurred solely at the 11-year return period across all SPEI timescales (with ESPI correlations beginning only at medium-term scales). Furthermore, TNI exhibited a unique feature in the Cwb climate that correlated significantly with all SPEI timescales across all three return periods, unlike the other ENSO indices.
In the polar tundra climate (Andean ET), the correlations exhibited marked stability for a key set of ENSO indices—BEST, Niño 3, Niño 3.4, Niño 4, MEI, ONI, and SOI—which remained significant across all SPEI timescales and the three return periods. In contrast, the influence of other indices was more temporally constrained: ESPI and TNI showed correlations exclusively at the 11- and 6-year return periods, while Niño 1 + 2 was significant at the 6- and 3-year return periods. A particular correlation was observed among Niño 3, Niño 3.4, MEI, ONI (Figure 4d), and SPEI-24, which consistently showed a positive relationship with drought events; only Niño 1 + 2 extended this pattern from SPEI-6 to SPEI-12.
3.3. Leading or Lagging ENSO Signal on Drought
3.3.1. The 11-Year Return Period
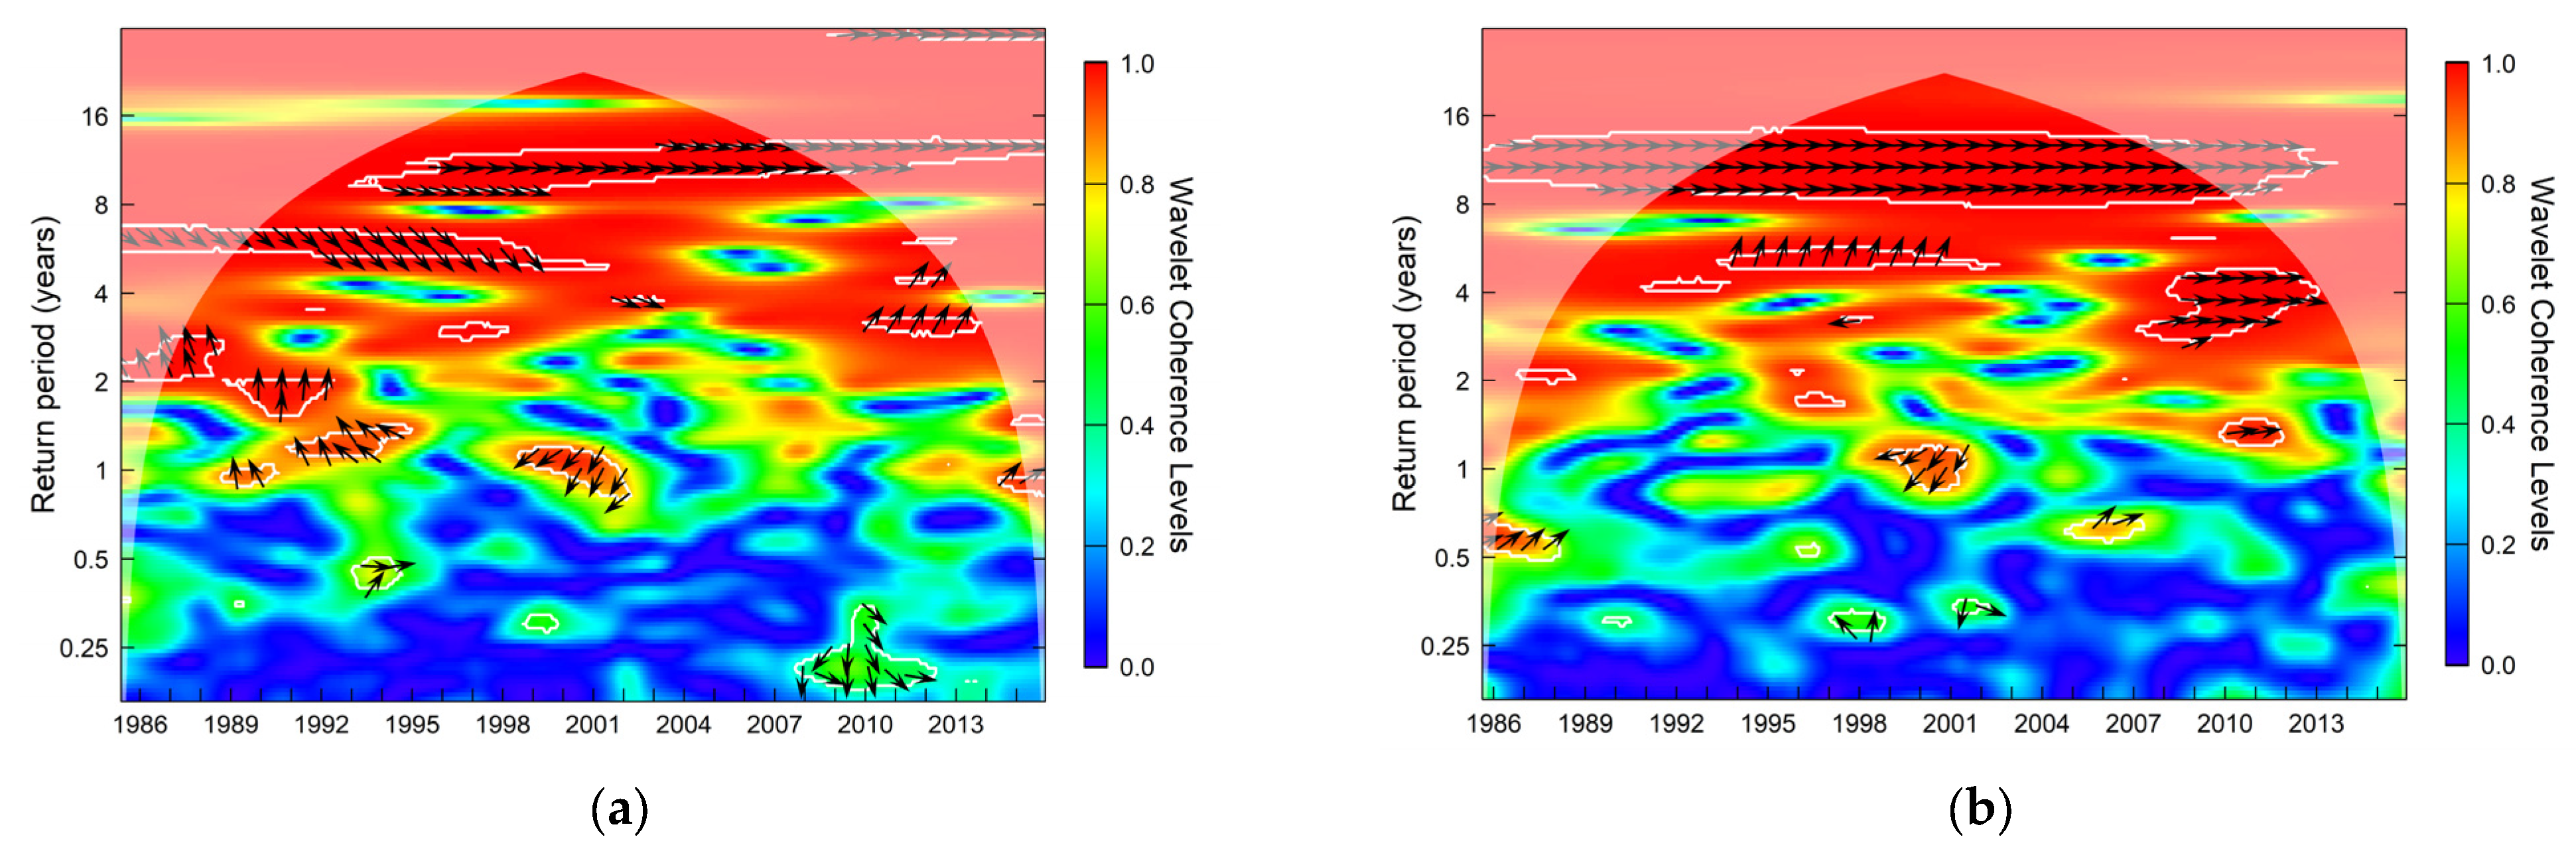
A consistent ENSO phase lag of approximately 60 months was observed across all climate subtypes. The lag of ENSO indices spanned 1995–2008 in the tropical Af-a (Figure 5a), temperate (Cfb, Csb, Cwb), and Andean (ET) climates, while in the Aw-a and coastal-proximate climates (Af-c, Am, Aw-c, BSh, BWh), the duration of significant correlation was shorter, confined to 1993–2000. Particularly in the Af-a climate, ENSO and SPEI signals were almost completely out of phase (negatively correlated). ENSO indices (BEST, ESPI, Niño 3, Niño 3.4, Niño 4, MEI, ONI) lagged SPEI by roughly half the period length; this pattern reversed only at the SPEI-24 timescale, where ENSO began to lead. In contrast, the SOI and TNI indices remained in phase with SPEI (positive correlation) but exhibited different behavior. In the Af-a climate, the SOI and SPEI signals were nearly completely in phase, but SOI started to lead SPEI-24 by nearly 9 months. In the same Af-a climate, TNI leads SPEI by 6–18 months.
Figure 5.
Wavelet coherence between: (a) SOI—SPEI-6 on Af-a; (b) TNI—SPEI-9 on Cfb-a.
3.3.2. The 6-Year Return Period
Significant correlations for this period were concentrated between 1990 and 2000. The phase relationship showed ENSO lagging SPEI, with the lag time increasing with longer SPEI scales: starting at 18 months for short-term scales and progressively extending to 33 months for long-term scales. This ENSO lag pattern was observed across all ENSO indices in the Af-a, Cfb-a, Cfb-c, and Csb climates (except Niño 1 + 2 and SOI, which showed no correlation), and in ET climates. SOI and TNI again exhibited shorter lag times. For SOI in Af-a, Cfb-a, Cfb-c, and ET climates, the lag relative to SPEI decreased from 12 months at short SPEI scales to just 2 months at long scales. A distinct pattern emerged in arid climates (BSh, BWh), where a significant correlation was observed only for 1997–2000. Here, SOI led SPEI by approximately 23 months, marking its sole negative correlation in this return period. TNI lagged SPEI by up to 6 months in coastal-proximate climates (Am, Aw-c, BSh, BWh) during 1993–1997, whereas in the Cwb climate, it remained nearly in phase, with a minimal TNI lead at longer SPEI scales. Notably, TNI also led SPEI across all its scales (lead times of 6 to 15 months) in Amazonian-proximate tropical climates (Af-a, Aw-a), temperate climates Cfb-a (Figure 5b), Cfb-c, Csb, and the Andean climate (ET).
3.3.3. The 3-Year Return Period
The 3-year return period revealed a complex phase relationship, with fluctuations in both positive and negative wavelet coherence centered around 1995–2000 and 2007–2013, respectively. The behavior of specific ENSO indices and the nature of phase shifts varied within these two intervals (1995–2000 and 2007–2013) and across different climate regions. In arid climates (BSh, BWh), the phase relationship alternated between the two intervals. From 1995 to 2000, the central-eastern and central Pacific ENSO indices (e.g., BEST, ESPI, Niño 3.4, MEI, and ONI) showed positive coherence with short-term SPEI scales, leading drought-event onset by 2 to 6 months. However, from 2007 to 2013, these same ENSO indices lagged SPEI by 12 to 18 months, indicating negative coherence. Niño 1 + 2 (Figure 4c) and Niño 3 were unique in leading both positive- and negative-correlation phases. TNI consistently lagged behind SPEI in both periods, except during 2007–2013 in the BWh climate. Consistent with the early SOI-SPEI relationships, correlations from 1995 to 2000 were negative, with SOI leading, whereas correlations from 2007 to 2013 were positive, with SOI lagging. In these arid regions, the phase shift between TNI and SOI decreased from approximately 12 months to 2 months.
In tropical, temperate, and Andean climates (Af-a, Cfb-a, Cfb-c, Csb, ET), the 1995–2000 period was reduced, and the 2007–2013 period emerged as the primary timeframe of significant coherence. During this span, the ENSO signals from key Pacific indices commonly led SPEI, although initial opposing phases were sometimes observed. The lead time was scale-dependent, decreasing from approximately 18 months at short-term SPEI scales to about 9 months at long-term scales. As in the other return periods, the SOI-SPEI relationships were opposite in sign to those described for the central Pacific indices, with a maximum lead of about 9 months, particularly noticeable in the Amazonian Af-a climate. The TNI signal led by ~2 months on medium- and long-term SPEI scales in Af-a and Cwb, while in Af-a, Aw-c, and Cwb, TNI lagged by the same amount on short-term SPEI scales.
4. Discussion
4.1. Physical Mechanisms and Teleconnections
This study contributes substantially to advancing knowledge by quantifying the persistent, multiscale nature of these drought events and their relationship with ENSO. We demonstrate that droughts were not merely present but a significant feature across all analyzed return periods (3, 6, and 11 years), with the strongest and most stable correlations observed in the Af-a climate type of the Amazon basin. This finding supports the proposal by Gutiérrez-Cárdenas [47], who determined that the relationship between ENSO and precipitation in the Amazon is non-linear and spatiotemporally variable.
Our results align with preceding studies indicating that Pacific Ocean warming, as characterized by ENSO, drives precipitation deficits in Andean and Amazonian regions [34,35,37,40,47,53,77,78,79,80,81]. The physical explanation for these results lies in the fact that warm (cold) ENSO phases—characteristic of El Niño (La Niña) events—strongly promote decreases (increases) in precipitation corresponding to drought (humid) conditions in Northern South America [35,40].
Positive SST anomalies translate into terrestrial drought via the Walker circulation. El Niño enhances convection in the central Pacific, which promotes large-scale zonal disturbances that lead to increased subsidence over equatorial South America and the Amazon, physically suppressing convection and promoting droughts [34,82]. Therefore, our results converge to confirm a consistent physical mechanism: inside the continent, positive SST anomalies in the central-eastern Pacific during El Niño suppress regional precipitation and increase drought, whereas La Niña conditions favor enhanced precipitation and reduced drought, as captured by the SPEI. Furthermore, our results reveal a broader influence than previously reported: warming across the ONI, MEI, Niño 3, and Niño 1 + 2 indices was robustly detected not only in the Andes but also in temperate and tropical climate types, underscoring the wide-ranging influence of Pacific variability on continental drought regimes. The manifestation of these relationships across the full range of SPEI timescales—from short-term (SPEI-1, SPEI-3) to long-term (SPEI-12, SPEI-24) droughts—highlights their effects on both immediate precipitation availability and long-term hydrological balance. Numerous studies have demonstrated this [47,83,84,85], a fact underscored by recent research into the record-breaking drought events of 2023 and 2024 [26,86].
On the other hand, especially in the Andean climate (ET), our findings not only contrast with previous studies but also extend the work of Perry et al. [87], who found that negative Pacific anomalies produced dry conditions in the Peruvian high Andes, whereas positive anomalies brought wetter conditions, a similar pattern to that observed in the ET climate type at the 3-year return period. Furthermore, evidence of droughts correlated with negative ENSO indices such as Niño 1 + 2 anomalies in coastal temperate climates, as indicated by Vuille et al. [50], may be attributed to the proximity of these regions to the Pacific and the orientation of their slopes, which are exposed to oceanic air masses. These exceptional cases may be explained not only by ENSO’s correlations with precipitation and temperature but also by other complex atmospheric mechanisms [88,89,90].
The significant positive correlations between SOI and SPEI are rooted in the well-established role of SOI as an atmospheric indicator of ENSO. A negative (positive) SOI indicates a weakened (stronger) Walker circulation. In this context, a negative SOI is associated with warm-phase (El Niño) positive SST anomalies, whereas a positive SOI denotes a stronger pressure gradient and enhanced zonal circulation, which is dynamically linked to cold-phase SST anomalies (La Niña) in the eastern equatorial Pacific [41]. Consequently, the observed relationship, in which negative SOI values correlate with negative SPEI (drought), aligns with documented climatic teleconnections, primarily in the Af-a (Amazonian) and ET (Andean) climate zones, and even coincides with the signal lead time [91]. This pattern—where El Niño conditions lead to significant atmospheric divergence and reduced precipitation in the Andean region—is consistently reported in the literature [47,48,55]. Additionally, the unique behavior of TNI suggests that the SST gradient between the western and eastern Pacific is a more sensitive precursor to drought in the Amazon–Andean transition than single-region indices [47]. Similarly, our study is consistent with previous studies in the southern Ecuadorian Andes [45,92].
4.2. Climatic Memory and Regional Heterogeneity
Our results confirm that the influence of ENSO on drought dynamics in Ecuador is highly heterogeneous and varies significantly by climate type, an expected pattern also observed across South America [31,41]. A key interpretation of our findings concerns the concept of prolonged climatic memory, which refers to a hydrological system’s capacity to retain the effects of past climatic anomalies, particularly those driven by ENSO, over extended periods [93]. This memory results in delayed or sustained responses in evapotranspiration and other terrestrial water variables, as well as in the complexity of atmospheric processes in the Andes–Amazon transition zone [26,31], where statistically significant correlations are observed across all SPEI scales. In tropical (Af-a), temperate, and Andean climates, significant correlations at 11- and 6-year return periods are observed across all SPEI scales, and ENSO lags SPEI by 18 to 33 months, suggesting that these regions retain the climatic signal for longer periods. This observation is particularly interesting when compared to continental-scale studies that report average lags of 2 months for SST-based indices [41]. Conversely, in Amazonian-proximate and Andean climates, TNI emerged as a superior precursor, leading SPEI by shorter intervals and suggesting that the SST gradient between the western and eastern Pacific is a more sensitive predictor of drought in the Amazon–Andean transition than single-region indices [47].
In contrast, arid climates (BSh, BWh) exhibit a significantly shorter memory. This is likely because, due to their proximity to the Pacific Ocean, these regions are affected more directly and rapidly by ENSO variability than by other teleconnections [41]. Furthermore, the shorter memory could be due to limited water storage, unlike the Amazon, which has high rates of evapotranspiration. This reality could lead to the conclusion that arid regions lack the physical capacity to retain the effects of past climatic anomalies [31,93].
4.3. Predictive Utility and Future Forecasts
The dry events recorded between 1995–2000 and 2007–2013 align with findings in the Andes and Amazon [28,40,47]. These associated climatic teleconnections persisted across the two 5-year intervals separated by approximately 7 years on all SPEI timescales. This observed frequency is consistent with subsequent severe dry events effectively documented between 2020 and 2025, notably the record-breaking 2023–2024 drought, which has significantly impacted western Amazonia and the Andean Altiplano [26,30,31,32,40]. Furthermore, the fact that ENSO indices generally lead across all SPEI timescales, decreasing from 18 to 9 months during the 3-year return period, reinforces the utility of ENSO as a predictive tool for drought monitoring. This lead time is consistent with findings in Colombia [48] and phase synchronization studies in Northern South America [35].
5. Conclusions
The climates of Ecuador comprise a heterogeneous mosaic of twelve Köppen–Geiger subtypes, providing a superior framework for drought analysis compared to traditional natural regions (Coast, Highlands, and Amazonia). While broad geographic classifications often mask internal variability, the Köppen–Geiger system provides the specificity needed to identify sub-regional climatic details that rule drought response. The Köppen–Geiger system, grounded in observed temperature and precipitation data, also enables us to quantify how the Andes complex topography acts as a primary modulator of ENSO-driven drought teleconnections. This study concludes that the regional response to ENSO is not uniform across natural zones but is dictated by the specific climatic memory of each climate zone.
The Wavelet Coherence (WC) method proved essential in identifying that the Amazonian (Af-a), temperate (Cfb-a, Cfb-c, Csb, Cwb), and Andean polar tundra (ET) climates exhibit a prolonged memory, with significant correlations spanning from short-term (1-month) to long-term (24-month) SPEI scales. This prolonged memory reflects the capacity of these hydrological systems to retain the effects of past ENSO anomalies over extended periods, resulting in delayed responses in terrestrial water variables. In contrast, arid climates (BSh, BWh) and coastal-proximate zones (Aw-c) exhibit short memory, in which correlations typically disappear at longer timescales due to hydrologic features and their proximity to the Pacific Ocean’s sharp state fluctuations.
A critical discovery of this research is the non-stationary nature of signal lag and lead times. During the 3-year return period (notably between 2007 and 2013), ENSO indices lead the drought signal by 18 months, decreasing to 9 months across the short- to long-term SPEI scales, providing a robust window for early warning systems. Conversely, for the 11- and 6-year return periods, the ENSO signal tends to lag behind the SPEI by approximately 60 months and between 18 and 33 months, respectively. This suggests that these climatic systems—particularly in the Amazon–Andean transition zone—retain drought signals for considerably longer periods than the influence exerted by remote Pacific forcing.
Furthermore, the Trans-Niño Index (TNI) emerged as a superior precursor for the Amazonian side, leading SPEI by up to 18 months at an 11-year return period and 2 months at a 3-year return period, highlighting that the SST gradient is a more sensitive predictor for this region. These findings underscore the necessity of moving beyond linear models toward multiscale, climate-specific monitoring. We conclude that integrating high-resolution Köppen–Geiger classifications with time–frequency analysis provides the granular detail needed for proactive water resource management and climate adaptation in topographically complex and vulnerable equatorial regions.
Our findings support the complex and multifaceted impact of ENSO on Ecuador’s climate. However, the scope of this study was defined by meteorological data available for analysis, which spanned the 1985–2015 period. Consequently, this knowledge could be significantly improved by extending the data series beyond this window and by encompassing a larger continental area. The current window excludes extreme events such as those in 1982–1983 and 2023–2024, while the 2015–2016 event falls near the end of the series, limiting the reliability of the assessment due to edge effects and the cone of influence in the Wavelet Coherence analysis. A longer time series would refine our understanding of non-linear interactions with modulating factors such as Andean topography and distance to the Pacific coast.
Although this study focuses on natural variability, the use of the SPEI allows us to identify how rising temperatures increase potential evapotranspiration (PET) and, consequently, modulate drought dynamics. Our findings suggest that rising temperatures may be intensifying the water deficits observed in these climate zones, consistent with recent global trends in which warming is increasingly exacerbating the severity and duration of El Niño-Southern Oscillation (ENSO)-driven drought events. Further research integrating more extensive observational records and regional climate models is needed to reduce uncertainties in drought onset prediction. Such advancements are vital for developing more precise early warning systems and enhancing the long-term climatic resilience of vulnerable equatorial communities, leveraging the multiscale lead times identified in this study, such as the 18-month window for the Amazon–Andes transition, as a baseline for operational drought risk management and seasonal crop planning.
Author Contributions
Conceptualization, J.P., A.S. and A.A.; methodology, J.P. and A.A.; software, J.P. and A.V.-P.; validation, A.S., R.J.B. and A.A.; formal analysis, J.P. and A.V.-P.; investigation, J.P. and A.A.; resources, J.P., A.S., R.J.B. and A.A.; data curation, J.P. and A.V.-P.; writing—original draft preparation, J.P.; writing—review and editing, J.P., A.S., A.A. and R.J.B.; visualization, J.P.; supervision, A.S., A.A. and R.J.B. All authors have read and agreed to the published version of the manuscript.
Funding
This manuscript was derived from the project “El Niño y las Sequías en el Ecuador: un análisis futuro de sus conexiones ante el Cambio Climático” funded by the Vicerrectorado de Investigación e Innovación de la Universidad de Cuenca, Cuenca, Ecuador.
Data Availability Statement
The original contributions presented in this study are included in the article. Further inquiries can be directed to the corresponding author.
Acknowledgments
We thank the National Institute of Meteorology and Hydrology (INAMHI) and the Ministry of Environment, Water, and Ecological Transition (MAATE) for providing the climate data used in this work. Many thanks to the University of Azuay through its Vicerrectorado de Investigaciones and Instituto de Estudios de Régimen Seccional del Ecuador (IERSE) via the project “Frecuencia y duración de la sequía en zonas climáticas del Ecuador y su relación con factores climáticos de gran escala. Fase I y II”.
Conflicts of Interest
The authors declare no conflicts of interest.
Abbreviations
The following abbreviations are used in this manuscript:
| SST | Sea Surface Temperature |
| ENSO | El Niño–Southern Oscillation |
| ONI | Oceanic Niño Index |
| SOI | Southern Oscillation Index |
| MEI | Multivariate ENSO |
| ESPI | ENSO Precipitation Index |
| TNI | Trans-Niño Index |
| BEST | Bivariate ENSO Timeseries |
| SPEI | Standardized Precipitation–Evapotranspiration Index |
| SPRACC | Information System for Climate Projections and Risk, Climate Change Adaptation Measures, and Vulnerability Indicators |
| MAATE | Ministry of Environment, Water, and Ecological Transition of Ecuador |
| INAMHI | National Institute of Meteorology and Hydrology |
| PET | Potential Evapotranspiration |
| WC | Wavelet Coherence |
| Af-a | Tropical Rainforest, Amazonian side |
| Af-c | Tropical Rainforest, Coastal side |
| Am | Tropical Monsoon |
| Aw-a | Tropical Savannah, Amazonian side |
| Aw-c | Tropical Savannah, Coastal side |
| BWh | Arid, desert, hot |
| BSh | Arid, steppe, hot |
| Csb | Temperate, dry summer, warm summer |
| Cwb | Temperate, dry winter, warm summer |
| Cfb-a | Temperate, no dry season, warm summer, Amazonian side |
| Cfb-c | Temperate, no dry season, warm summer, Coastal side |
| ET | Polar, Tundra |
References
- WHO Drought Overview. Available online: https://www.who.int/health-topics/drought# (accessed on 18 September 2025).
- Van Loon, A.F.; Stahl, K.; Di Baldassarre, G.; Clark, J.; Rangecroft, S.; Wanders, N.; Gleeson, T.; Van Dijk, A.I.J.M.; Tallaksen, L.M.; Hannaford, J.; et al. Drought in a Human-Modified World: Reframing Drought Definitions, Understanding, and Analysis Approaches. Hydrol. Earth Syst. Sci. 2016, 20, 3631–3650. [Google Scholar] [CrossRef] [Scilit]
- Hao, Y.; Hao, Z.; Feng, S.; Zhang, X.; Hao, F. Response of Vegetation to El Niño-Southern Oscillation (ENSO) via Compound Dry and Hot Events in Southern Africa. Glob. Planet. Change 2020, 195, 103358. [Google Scholar] [CrossRef] [Scilit]
- Javed, T.; Yao, N.; Chen, X.; Suon, S.; Li, Y. Drought Evolution Indicated by Meteorological and Remote-Sensing Drought Indices under Different Land Cover Types in China. Environ. Sci. Pollut. Res. 2020, 27, 4258–4274. [Google Scholar] [CrossRef] [Scilit] [PubMed]
- Spinoni, J.; Barbosa, P.; Bucchignani, E.; Cassano, J.; Cavazos, T.; Christensen, J.H.; Christensen, O.B.; Coppola, E.; Evans, J.; Geyer, B.; et al. Future Global Meteorological Drought Hot Spots: A Study Based on CORDEX Data. J. Clim. 2020, 33, 3635–3661. [Google Scholar] [CrossRef] [Scilit]
- He, B.; Wang, H.L.; Wang, Q.F.; Di, Z.H. A Quantitative Assessment of the Relationship between Precipitation Deficits and Air Temperature Variations. J. Geophys. Res. Atmos. 2015, 120, 5951–5961. [Google Scholar] [CrossRef] [Scilit]
- Wang, C.; Deser, C.; Yu, J.Y.; DiNezio, P.; Clement, A. El Niño and Southern Oscillation (ENSO): A Review. In Coral Reefs of the Eastern Tropical Pacific; Springer: Dordrecht, The Netherlands, 2017; Volume 8, pp. 85–106. [Google Scholar]
- Kenyon, J.; Hegerl, G.C. Influence of Modes of Climate Variability on Global Precipitation Extremes. J. Clim. 2010, 23, 6248–6262. [Google Scholar] [CrossRef] [Scilit]
- Power, S.B.; Delage, F.P.D. El Niño-Southern Oscillation and Associated Climatic Conditions around the World during the Latter Half of the Twenty-First Century. J. Clim. 2018, 31, 6189–6207. [Google Scholar] [CrossRef] [Scilit]
- Allan, R.P.; Soden, B.J. Atmospheric Warming and the Amplification of Precipitation Extremes. Science 2008, 321, 1481–1484. [Google Scholar] [CrossRef] [Scilit]
- Oliveira-Júnior, J.F.; Gois, G.; Terassi, P.M.; Silva Junior, C.A.; Blanco, C.J.C.; Sobral, B.S.; Gasparini, K.A.C. Drought Severity Based on the SPI Index and Its Relation to the ENSO and PDO Climatic Variability Modes in the Regions North and Northwest of the State of Rio de Janeiro—Brazil. Atmos. Res. 2018, 212, 91–105. [Google Scholar] [CrossRef] [Scilit]
- Imfeld, N.; Barreto Schuler, C.; Correa Marrou, K.M.; Jacques-Coper, M.; Sedlmeier, K.; Gubler, S.; Huerta, A.; Brönnimann, S. Summertime Precipitation Deficits in the Southern Peruvian Highlands since 1964. Int. J. Climatol. 2019, 39, 4497–4513. [Google Scholar] [CrossRef] [Scilit]
- Bendix, J.; Trachte, K.; Palacios, E.; Rollenbeck, R.; Göttlicher, D.; Nauss, T.; Bendix, A. El Niño Meets La Niña-Anomalous Rainfall Patterns in the “Traditional” El Niño Region of Southern Ecuador. Erdkunde 2011, 65, 151–167. [Google Scholar] [CrossRef] [Scilit]
- Lin, Q.; Wu, Z.; Singh, V.P.; Sadeghi, S.H.R.; He, H.; Lu, G. Correlation between Hydrological Drought, Climatic Factors, Reservoir Operation, and Vegetation Cover in the Xijiang Basin, South China. J. Hydrol. 2017, 549, 512–524. [Google Scholar] [CrossRef] [Scilit]
- Zolotokrylin, A.N.; Titkova, T.B.; Brito-Castillo, L. Wet and Dry Patterns Associated with ENSO Events in the Sonoran Desert from, 2000–2015. J. Arid Environ. 2016, 134, 21–32. [Google Scholar] [CrossRef] [Scilit]
- Meseguer-Ruiz, O.; Serrano-Notivoli, R.; Aránguiz-Acuña, A.; Fuentealba, M.; Nuñez-Hidalgo, I.; Sarricolea, P.; Garreaud, R. Comparing SPI and SPEI to Detect Different Precipitation and Temperature Regimes in Chile throughout the Last Four Decades. Atmos. Res. 2024, 297, 107085. [Google Scholar] [CrossRef] [Scilit]
- Hao, Z.; Singh, V.P. Drought Characterization from a Multivariate Perspective: A Review. J. Hydrol. 2015, 527, 668–678. [Google Scholar] [CrossRef] [Scilit]
- Chen, H.; Sun, J. Characterizing Present and Future Drought Changes over Eastern China. Int. J. Climatol. 2017, 37, 138–156. [Google Scholar] [CrossRef] [Scilit]
- Magrin, G.O.; Marengo, J.A.; Boulanger, J.-P.; Buckeridge, M.S.; Castellanos, E.; Poveda, G.; Al, E. Central and South America. In Climate Change 2014: Impacts, Adaptation, and Vulnerability. Part B: Regional Aspects. Contribution of Working Group II to the Fifth Assessment Report of the Intergovernmental Panel on Climate Change; Barros, V.R., Field, C.B., Dokken, D.J., Mastrandrea, M.D., Mach, K.J., Bilir, T.E., Al, E., Eds.; Cambridge University Press: Cambridge, UK, 2014; pp. 1499–1566. [Google Scholar]
- Pabón-Caicedo, J.D.; Arias, P.A.; Carril, A.F.; Espinoza, J.C.; Borrel, L.F.; Goubanova, K.; Lavado-Casimiro, W.; Masiokas, M.; Solman, S.; Villalba, R. Observed and Projected Hydroclimate Changes in the Andes. Front. Earth Sci. 2020, 8, 61. [Google Scholar] [CrossRef] [Scilit]
- Pierrestegui, M.J.; Lovino, M.A.; Müller, G.V.; Müller, O. V Multi-Hazard Assessment of Extreme Hydrometeorological Events in Southeastern South America. Earth Syst. Environ. 2025, 9, 357–373. [Google Scholar] [CrossRef] [Scilit]
- Morales, M.S.; Cook, E.R.; Barichivich, J.; Christie, D.A.; Villalba, R.; Lequesne, C.; Srur, A.M.; Ferrero, M.E.; González-Reyes, Á.; Couvreux, F.; et al. Six Hundred Years of South American Tree Rings Reveal an Increase in Severe Hydroclimatic Events since Mid-20th Century. Proc. Natl. Acad. Sci. USA 2020, 117, 16816–16823. [Google Scholar] [CrossRef] [Scilit]
- Foley, J.A.; Botta, A.; Coe, M.T.; Costa, M.H. El Niño-Southern Oscillation and the Climate, Ecosystems and Rivers of Amazonia. Glob. Biogeochem. Cycles 2002, 16, 79-1–79-20. [Google Scholar] [CrossRef] [Scilit]
- Ortega, C.; Vargas, G.; Rojas, M.; Rutllant, J.A.; Muñoz, P.; Lange, C.B.; Pantoja, S.; Dezileau, L.; Ortlieb, L. Extreme ENSO-Driven Torrential Rainfalls at the Southern Edge of the Atacama Desert during the Late Holocene and Their Projection into the 21th Century. Glob. Planet. Change 2019, 175, 226–237. [Google Scholar] [CrossRef] [Scilit]
- Correia Filho, W.L.F.; de Oliveira-Júnior, J.F.; da Silva Junior, C.A.; Santiago, D.d.B. Influence of the El Niño–Southern Oscillation and the Sypnotic Systems on the Rainfall Variability over the Brazilian Cerrado via Climate Hazard Group InfraRed Precipitation with Station Data. Int. J. Climatol. 2022, 42, 3308–3322. [Google Scholar] [CrossRef] [Scilit]
- Gutierrez-Villarreal, R.A.; Espinoza, J.C.; Lavado-Casimiro, W.; Junquas, C.; Molina-Carpio, J.; Condom, T.; Marengo, J.A. The 2022-23 Drought in the South American Altiplano: ENSO Effects on Moisture Flux in the Western Amazon during the Pre-Wet Season. Weather Clim. Extrem. 2024, 45, 100710. [Google Scholar] [CrossRef] [Scilit]
- Jimenez, J.C.; Libonati, R.; Peres, L.F. Droughts Over Amazonia in 2005, 2010, and 2015: A Cloud Cover Perspective. Front. Earth Sci. 2018, 6, 227. [Google Scholar] [CrossRef] [Scilit]
- Jiménez-Muñoz, J.C.; Mattar, C.; Barichivich, J.; Santamaría-Artigas, A.; Takahashi, K.; Malhi, Y.; Sobrino, J.A.; Schrier, G. Van Der Record-Breaking Warming and Extreme Drought in the Amazon Rainforest during the Course of El Niño 2015-2016. Sci. Rep. 2016, 6, 33130. [Google Scholar] [CrossRef] [Scilit]
- Martínez-Castro, D.; Takahashi, K.; Espinoza, J.C.; Vichot-Llano, A.; Andrade, M.O.; Silva, F.Y. Extreme Droughts in the Peruvian Amazon Region (2000–2024). Water 2025, 17, 1744. [Google Scholar] [CrossRef] [Scilit]
- Espinoza, J.C.; Jimenez, J.C.; Marengo, J.A.; Schongart, J.; Ronchail, J.; Lavado-Casimiro, W.; Ribeiro, J.V.M. The New Record of Drought and Warmth in the Amazon in 2023 Related to Regional and Global Climatic Features. Sci. Rep. 2024, 14, 8107. [Google Scholar] [CrossRef] [Scilit] [PubMed]
- Marengo, J.A.; Cunha, A.P.; Espinoza, J.-C.; Fu, R.; Schöngart, J.; Jimenez, J.C.; Costa, M.C.; Ribeiro, J.M.; Wongchuig, S.; Zhao, S. The Drought of Amazonia in 2023–2024. Am. J. Clim. Change 2024, 13, 567–597. [Google Scholar] [CrossRef]
- Jiang, N.; Zhu, C.; Hu, Z.Z.; McPhaden, M.J.; Chen, D.; Liu, B.; Ma, S.; Yan, Y.; Zhou, T.; Qian, W.; et al. Enhanced Risk of Record-Breaking Regional Temperatures during the 2023–24 El Niño. Sci. Rep. 2024, 14, 2521. [Google Scholar] [CrossRef] [Scilit] [PubMed]
- Ruiz-Vásquez, M.; Arias, P.A.; Martínez, J.A. Enso Influence on Water Vapor Transport and Thermodynamics over Northwestern South America. Theor. Appl. Climatol. 2024, 155, 3771–3789. [Google Scholar] [CrossRef] [Scilit]
- Cai, W.; McPhaden, M.J.; Grimm, A.M.; Rodrigues, R.R.; Taschetto, A.S.; Garreaud, R.D.; Dewitte, B.; Poveda, G.; Ham, Y.G.; Santoso, A.; et al. Climate Impacts of the El Niño–Southern Oscillation on South America. Nat. Rev. Earth Environ. 2020, 1, 215–231. [Google Scholar] [CrossRef] [Scilit]
- Salas, H.D.; Builes-Jaramillo, A.; Boers, N.; Poveda, G.; Mesa, Ó.J.; Kurths, J. Precipitation over Northern South America and the Far-Eastern Pacific during ENSO: Phase Synchronization at Inter-Annual Time Scales. Int. J. Climatol. 2024, 44, 2106–2123. [Google Scholar] [CrossRef] [Scilit]
- Bourrel, L.; Rau, P.; Dewitte, B.; Labat, D.; Lavado, W.; Coutaud, A.; Vera, A.; Alvarado, A.; Ordoñez, J. Low-Frequency Modulation and Trend of the Relationship between ENSO and Precipitation along the Northern to Centre Peruvian Pacific Coast. Hydrol. Process. 2015, 29, 1252–1266. [Google Scholar] [CrossRef] [Scilit]
- Oñate-Valdivieso, F.; Uchuari, V.; Oñate-Paladines, A. Large-Scale Climate Variability Patterns and Drought: A Case of Study in South-America. Water Resour. Manag. 2020, 34, 2061–2079. [Google Scholar] [CrossRef] [Scilit]
- Arias, P.A.; Garreaud, R.; Poveda, G.; Espinoza, J.C.; Molina-Carpio, J.; Masiokas, M.; Viale, M.; Scaff, L.; van Oevelen, P.J. Hydroclimate of the Andes Part II: Hydroclimate Variability and Sub-Continental Patterns. Front. Earth Sci. 2021, 8, 505467. [Google Scholar] [CrossRef] [Scilit]
- Muñoz, E.; Poveda, G.; Arbeláez, M.P.; Vélez, I. Spatiotemporal Dynamics of Dengue in Colombia in Relation to the Combined Effects of Local Climate and ENSO. Acta Trop. 2021, 224, 106136. [Google Scholar] [CrossRef] [Scilit]
- Poveda, G.; Espinoza, J.C.; Zuluaga, M.D.; Solman, S.A.; Garreaud, R.; van Oevelen, P.J. High Impact Weather Events in the Andes. Front. Earth Sci. 2020, 8, 162. [Google Scholar] [CrossRef] [Scilit]
- Zhang, C.; Huang, G.; Yan, D.; Wang, H.; Zeng, G.; Wang, S.; Li, Y. Analysis of South American Climate and Teleconnection Indices. J. Contam. Hydrol. 2022, 244, 103915. [Google Scholar] [CrossRef] [Scilit]
- Mohammadi, B.; Vaheddoost, B.; Danandeh Mehr, A. A Spatiotemporal Teleconnection Study between Peruvian Precipitation and Oceanic Oscillations. Quat. Int. 2020, 565, 1–11. [Google Scholar] [CrossRef] [Scilit]
- Sobral, B.S.; de Oliveira-Júnior, J.F.; de Gois, G.; Pereira-Júnior, E.R.; Terassi, P.M.dB.; Muniz-Júnior, J.G.R.; Lyra, G.B.; Zeri, M. Drought Characterization for the State of Rio de Janeiro Based on the Annual SPI Index: Trends, Statistical Tests and Its Relation with ENSO. Atmos. Res. 2019, 220, 141–154. [Google Scholar] [CrossRef] [Scilit]
- Rossel, F.; Cadier, E. El Niño and Prediction of Anomalous Monthly Rainfalls in Ecuador. Hydrol. Process. 2009, 23, 3253–3260. [Google Scholar] [CrossRef] [Scilit]
- Campozano, L.; Trachte, K.; Célleri, R.; Samaniego, E.; Bendix, J.; Albuja, C.; Mejia, J.F. Climatology and Teleconnections of Mesoscale Convective Systems in an Andean Basin in Southern Ecuador: The Case of the Paute Basin. Adv. Meteorol. 2018, 2018, 4259191. [Google Scholar] [CrossRef] [Scilit]
- Dewitte, B.; Takahashi, K. Extreme El Niño Events; Elsevier Inc.: Amsterdam, The Netherlands, 2018; ISBN 9780128092484. [Google Scholar]
- Gutiérrez-Cárdenas, G.S.; Díaz, D.C.; Villegas-Bolaños, N.L. Similar Teleconnection Patterns of ENSO-NAO and ENSO-Precipitation in Colombia: Linear and Non-Linear Relationships. Environ. Sci. Pollut. Res. 2025, 32, 3277–3296. [Google Scholar] [CrossRef] [Scilit] [PubMed]
- Díaz, D.; Villegas, N. Wavelet Coherence between ENSO Indices and Two Precipitation Database for the Andes Region of Colombia. Atmósfera 2022, 35, 237–271. [Google Scholar] [CrossRef] [Scilit]
- Campozano, L.; Ballari, D.; Montenegro, M.; Avilés, A. Future Meteorological Droughts in Ecuador: Decreasing Trends and Associated Spatio-Temporal Features Derived From CMIP5 Models. Front. Earth Sci. 2020, 8, 17. [Google Scholar] [CrossRef] [Scilit]
- Vuille, M.; Bradley, R.S.; Keimig, F. Climate Variability in the Andes of Ecuador and Its Relation to Tropical Pacific and Atlantic Sea Surface Temperature Anomalies. J. Clim. 2000, 13, 2520–2535. [Google Scholar] [CrossRef] [Scilit]
- Zhiña, D.; Montenegro, M.; Montalván, L.; Mendoza, D.; Contreras, J.; Campozano, L.; Avilés, A. Climate Change Influences of Temporal and Spatial Drought Variation in the Andean High Mountain Basin. Atmosphere 2019, 10, 558. [Google Scholar] [CrossRef] [Scilit]
- Zambrano Mera, Y.E.; Rivadeneira Vera, J.F.; Pérez-Martín, M.Á. Linking El Niño Southern Oscillation for Early Drought Detection in Tropical Climates: The Ecuadorian Coast. Sci. Total Environ. 2018, 643, 193–207. [Google Scholar] [CrossRef] [Scilit]
- Vicente-Serrano, S.M.; Aguilar, E.; Martínez, R.; Martín-Hernández, N.; Azorin-Molina, C.; Sanchez-Lorenzo, A.; El Kenawy, A.; Tomás-Burguera, M.; Moran-Tejeda, E.; López-Moreno, J.I.; et al. The Complex Influence of ENSO on Droughts in Ecuador. Clim. Dyn. 2017, 48, 405–427. [Google Scholar] [CrossRef] [Scilit]
- Pourrut, P.; Rovere, O.; Romo, I.; Villacrés, H. Clima Del Ecuador. In El Agua en El Ecuador Clima, Precipitaciones, Escorrentía; Colegio de Geógrafos del Ecuador: Quito, Ecuador, 1995; pp. 13–26. [Google Scholar]
- Morán-Tejeda, E.; Bazo, J.; López-Moreno, J.I.; Aguilar, E.; Azorín-Molina, C.; Sanchez-Lorenzo, A.; Martínez, R.; Nieto, J.J.; Mejía, R.; Martín-Hernández, N.; et al. Climate Trends and Variability in Ecuador (1966–2011). Int. J. Climatol. 2016, 36, 3839–3855. [Google Scholar] [CrossRef] [Scilit]
- Beck, H.E.; Zimmermann, N.E.; McVicar, T.R.; Vergopolan, N.; Berg, A.; Wood, E.F. Present and Future Köppen-Geiger Climate Classification Maps at 1-Km Resolution. Sci. Data 2018, 5, 180214. [Google Scholar] [CrossRef] [Scilit]
- Meseguer-Ruiz, O.; Serrano-Notivoli, R.; Núñez-Hidalgo, I.; Sarricolea, P. General Dry Trends According to the Standardized Precipitation Evapotranspiration Index in Mainland Chile. Front. Earth Sci. 2024, 12, 1355443. [Google Scholar] [CrossRef] [Scilit]
- Vicente-Serrano, S.M.; Beguería, S.; López-Moreno, J.I. A Multiscalar Drought Index Sensitive to Global Warming: The Standardized Precipitation Evapotranspiration Index. J. Clim. 2010, 23, 1696–1718. [Google Scholar] [CrossRef] [Scilit]
- Gupta, V.; Jain, M.K. Investigation of Multi-Model Spatiotemporal Mesoscale Drought Projections over India under Climate Change Scenario. J. Hydrol. 2018, 567, 489–509. [Google Scholar] [CrossRef] [Scilit]
- Feng, S.; Trnka, M.; Hayes, M.; Zhang, Y. Why Do Different Drought Indices Show Distinct Future Drought Risk Outcomes in the U.S. Great Plains? J. Clim. 2017, 30, 265–278. [Google Scholar] [CrossRef] [Scilit]
- Zhang, Y.; Yu, Z.; Niu, H. Standardized Precipitation Evapotranspiration Index Is Highly Correlated with Total Water Storage over China under Future Climate Scenarios. Atmos. Environ. 2018, 194, 123–133. [Google Scholar] [CrossRef] [Scilit]
- Bae, S.; Lee, S.H.; Yoo, S.H.; Kim, T. Analysis of Drought Intensity and Trends Using the Modified SPEI in South Korea from 1981 to 2010. Water 2018, 10, 327. [Google Scholar] [CrossRef] [Scilit]
- Spinoni, J.; Vogt, J.V.; Naumann, G.; Barbosa, P.; Dosio, A. Will Drought Events Become More Frequent and Severe in Europe? Int. J. Climatol. 2018, 38, 1718–1736. [Google Scholar] [CrossRef] [Scilit]
- Ogunrinde, A.T.; Olasehinde, D.A.; Olotu, Y. Assessing the Sensitivity of Standardized Precipitation Evapotranspiration Index to Three Potential Evapotranspiration Models in Nigeria. Sci. Afr. 2020, 8, e00431. [Google Scholar] [CrossRef] [Scilit]
- Aadhar, S.; Mishra, V. Increased Drought Risk in South Asia under Warming Climate: Implications of Uncertainty in Potential Evapotranspiration Estimates. J. Hydrometeorol. 2020, 21, 2979–2996. [Google Scholar] [CrossRef] [Scilit]
- Lee, S.; Moriasi, D.N.; Danandeh Mehr, A.; Mirchi, A. Sensitivity of Standardized Precipitation and Evapotranspiration Index (SPEI) to the Choice of SPEI Probability Distribution and Evapotranspiration Method. J. Hydrol. Reg. Stud. 2024, 53, 101761. [Google Scholar] [CrossRef] [Scilit]
- Shi, X.; Qin, T.; Yan, D.; Sun, R.; Cao, S.; Jing, L.; Wang, Y.; Gong, B. Analysis of the Changes in the Water Yield Coefficient over the Past 50 Years in the Huang-Huai-Hai River Basin, China. Adv. Meteorol. 2018, 2018, 6302853. [Google Scholar] [CrossRef] [Scilit]
- Jin, X.; Qiang, H.; Zhao, L.; Jiang, S.; Cui, N.; Cao, Y.; Feng, Y. SPEI-Based Analysis of Spatio-Temporal Variation Characteristics for Annual and Seasonal Drought in the Zoige Wetland, Southwest China from 1961 to 2016. Theor. Appl. Climatol. 2020, 139, 711–725. [Google Scholar] [CrossRef] [Scilit]
- Zhang, L.; Yang, X.; Ren, L.; Sheffield, J.; Zhang, L.; Yuan, S.; Zhang, M. Dynamic Multi-Dimensional Identification of Yunnan Droughts and Its Seasonal Scale Linkages to the El Niño-Southern Oscillation. J. Hydrol. Reg. Stud. 2022, 42, 101128. [Google Scholar] [CrossRef] [Scilit]
- Gu, X.; Li, Y.; Jamshidi, S.; Gu, L.; Sun, H. Assessing the Driving Process of Meteorological and Agricultural Drought in the Yellow River Basin. J. Hydrol. Reg. Stud. 2025, 61, 102704. [Google Scholar] [CrossRef] [Scilit]
- Youssefi, F.; Khorrami, B.; Ali, S.; Soltani, S.S.; Zoej, M.J.V.; Li, J.; Ghaderpour, E. Open Data Analysis of Terrestrial Water Storage and Water Availability in the Middle East: Spatiotemporal Trends, Hydroclimatic Drivers, and Socio-Ecological Implications. Ecol. Inform. 2026, 93, 103571. [Google Scholar] [CrossRef] [Scilit]
- Grinsted, A.; Moore, J.C.; Jevrejeva, S. Application of the Cross Wavelet Transform and Wavelet Coherence to Geophysical Time Series. Nonlinear Process. Geophys. 2004, 11, 561–566. [Google Scholar] [CrossRef] [Scilit]
- Barnes, S.J.K.; Bjerkan, J.; Clemson, P.T.; Newman, J.; Stefanovska, A. Phase Coherence—A Time-Localized Approach to Studying Interactions. Chaos 2024, 34, 073155. [Google Scholar] [CrossRef] [Scilit]
- Torrence, C.; Compo, G.P. A Practical Guide to Wavelet Analysis. Bull. Am. Meteorol. Soc. 1998, 79, 61–78. [Google Scholar] [CrossRef] [Scilit]
- Rösch, A.; Schmidbauer, H. WaveletComp 1.1: A Guided Tour Through the R Package; FOM University of Applied Sciences: Munich, Germany, 2018. [Google Scholar]
- NASA JPL. NASA Shuttle Radar Topography Mission Global 1 Arc Second V003|NASA Earthdata. Available online: https://www.earthdata.nasa.gov/data/catalog/lpcloud-srtmgl1-003 (accessed on 1 June 2026).
- Lavado-Casimiro, W.; Espinoza, J.C. Impactos de El Niño y La Niña En Las Lluvias Del Perú (1965–2007). Rev. Bras. Meteorol. 2014, 29, 171–182. [Google Scholar] [CrossRef] [Scilit]
- Thielen, D.R.; Ramoni-Perazzi, P.; Zamora-Ledezma, E.; Puche, M.L.; Marquez, M.; Quintero, J.I.; Rojas, W.; Quintero, A.; Bianchi, G.; Soto-Werschitz, I.A.; et al. Effect of Extreme El Niño Events on the Precipitation of Ecuador. Nat. Hazards Earth Syst. Sci. 2023, 23, 1507–1527. [Google Scholar] [CrossRef] [Scilit]
- Ilbay-Yupa, M.; Lavado-Casimiro, W.; Rau, P.; Zubieta, R.; Castillón, F. Updating Regionalization of Precipitation in Ecuador. Theor. Appl. Climatol. 2021, 143, 1513–1528. [Google Scholar] [CrossRef] [Scilit]
- Pacheco, J.; Solera, A.; Avilés, A.; Tonón, M.D. Influence of ENSO on Droughts and Vegetation in a High Mountain Equatorial Climate Basin. Atmosphere 2022, 13, 2123. [Google Scholar] [CrossRef] [Scilit]
- Nieves, A.; Contreras, J.; Pacheco, J.; Urgilés, J.; García, F.; Avilés, A. Assessment of Drought Time-Frequency Relationships with Local Atmospheric-Land Conditions and Large-Scale Climatic Factors in a Tropical Andean Basin. Remote Sens. Appl. Soc. Environ. 2022, 26, 100760. [Google Scholar] [CrossRef] [Scilit]
- Builes-Jaramillo, A.; Valencia, J.; Salas, D. The Influence of the El Niño-Southern Oscillation Phase Transitions over the Northern South America Hydroclimate. Atmos. Res. 2023, 290, 106786. [Google Scholar] [CrossRef] [Scilit]
- Santos de Lima, L.; Silva, F.E.O.e.; Dorio Anastácio, P.R.; Kolanski, M.M.dP.; Pires Pereira, A.C.; Menezes, M.S.R.; Cunha, E.L.T.P.; Macedo, M.N. Severe Droughts Reduce River Navigability and Isolate Communities in the Brazilian Amazon. Commun. Earth Environ. 2024, 5, 370. [Google Scholar] [CrossRef] [Scilit]
- Petry, I.; Fan, F.M.; Wood, A.W. Observed Streamflow Data Shows El Niño–Southern Oscillation Increases Likelihood of Extreme Events in South America. Commun. Earth Environ. 2025, 6, 2–11. [Google Scholar] [CrossRef] [Scilit]
- Pérez, C.F.; Alonso Vicario, S.; van Cauwenbergh, N.; Garcia, M.; Werner, M. Disentangling the Socio-Natural Dynamics of Drought and Water Scarcity in Colombia’s Tropical Andes. J. Hydrol. Reg. Stud. 2024, 56, 102068. [Google Scholar] [CrossRef] [Scilit]
- Souza, C.M.; Marengo, J.; Ferreira, B.; Ribeiro, J.; Schirmbeck, L.W.; Schirmbeck, J.; Hirye, M.; Cunha, A.; Wiederhecker, H.C.; Latuf, M.O. Amazon Severe Drought in 2023 Triggered Surface Water Loss. Environ. Res. Clim. 2024, 3, 041002. [Google Scholar] [CrossRef] [Scilit]
- Perry, L.B.; Seimon, A.; Kelly, G.M. Precipitation Delivery in the Tropical High Andes of Southern Peru: New Findings and Paleoclimatic Implications. Int. J. Climatol. 2014, 34, 197–215. [Google Scholar] [CrossRef] [Scilit]
- Segura, H.; Espinoza, J.C.; Junquas, C.; Takahashi, K. Evidencing Decadal and Interdecadal Hydroclimatic Variability over the Central Andes. Environ. Res. Lett. 2016, 11, 094016. [Google Scholar] [CrossRef] [Scilit]
- Segura, H.; Espinoza, J.C.; Junquas, C.; Lebel, T.; Vuille, M.; Garreaud, R. Recent Changes in the Precipitation-Driving Processes over the Southern Tropical Andes/Western Amazon. Clim. Dyn. 2020, 54, 2613–2631. [Google Scholar] [CrossRef] [Scilit]
- Sulca, J.; Takahashi, K. Forecasting Austral Summer Precipitation along the Western Coast of South America (WCSA). Environ. Res. Commun. 2025, 7, 101005. [Google Scholar] [CrossRef] [Scilit]
- Pérez, D.D.L.; Pontón, A.H.; Vega, R.A.; Marimón-Bolívar, W. Regional Synchronization Patterns between Climate Indices and Colombian Hydroclimatic Variables. Hydrol. Sci. J. 2026, 71, 1283–1302. [Google Scholar] [CrossRef] [Scilit]
- Mendoza, D.E.; Samaniego, E.P.; Mora, D.E.; Espinoza, M.J.; Campozano, L. V Finding Teleconnections from Decomposed Rainfall Signals Using Dynamic Harmonic Regressions: A Tropical Andean Case Study. Clim. Dyn. 2018, 52, 4643–4670. [Google Scholar] [CrossRef] [Scilit]
- De la Cruz, G.; Collado-Tello, R.; Chávarri-Velarde, E.; Lavado-Casimiro, W.; Espinoza, J.-C. Long-Term Basin Trends Confirm a Record 2022–2024 Hydrological Drought and Water-Storage Losses in Western Amazonia. J. Hydrol. Reg. Stud. 2025, 62, 102951. [Google Scholar] [CrossRef] [Scilit]

Disclaimer/Publisher’s Note: The statements, opinions and data contained in all publications are solely those of the individual author(s) and contributor(s) and not of MDPI and/or the editor(s). MDPI and/or the editor(s) disclaim responsibility for any injury to people or property resulting from any ideas, methods, instructions or products referred to in the content. |
© 2026 by the authors. Licensee MDPI, Basel, Switzerland. This article is an open access article distributed under the terms and conditions of the Creative Commons Attribution (CC BY) license.